Cities with the Highest Percentage of Families with Income Above $100,000 in Utah
RELATED REPORTS & OPTIONS
Family Income | $100k+
Utah
Compare Cities
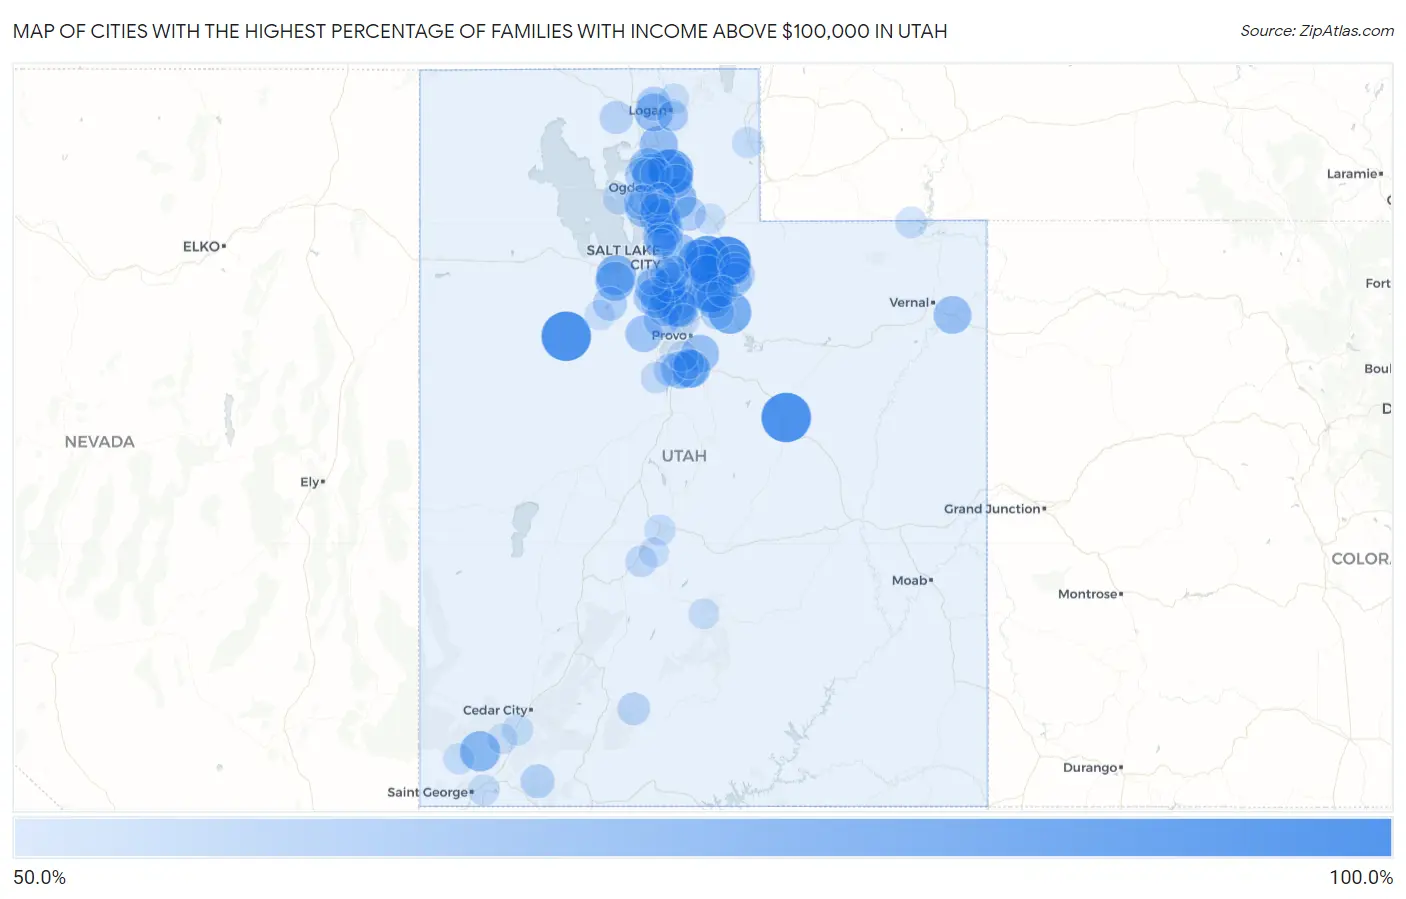
Map of Cities with the Highest Percentage of Families with Income Above $100,000 in Utah
0.0%
100.0%
Cities with the Highest Percentage of Families with Income Above $100,000 in Utah
| City | Families with Income > $100k | vs State | vs National | |
| 1. | Dugway | 100.0% | 50.0%(+50.0)#1 | 46.1%(+53.9)#5 |
| 2. | Kenilworth | 100.0% | 50.0%(+50.0)#2 | 46.1%(+53.9)#182 |
| 3. | Peoa | 100.0% | 50.0%(+50.0)#3 | 46.1%(+53.9)#199 |
| 4. | Silver Summit | 90.6% | 50.0%(+40.6)#4 | 46.1%(+44.5)#555 |
| 5. | Interlaken | 88.3% | 50.0%(+38.3)#5 | 46.1%(+42.2)#679 |
| 6. | Wolf Creek | 86.0% | 50.0%(+36.0)#6 | 46.1%(+39.9)#817 |
| 7. | Independence | 82.8% | 50.0%(+32.8)#7 | 46.1%(+36.7)#1,094 |
| 8. | Hobble Creek | 82.3% | 50.0%(+32.3)#8 | 46.1%(+36.2)#1,137 |
| 9. | East Basin | 79.1% | 50.0%(+29.1)#9 | 46.1%(+33.0)#1,498 |
| 10. | Summit Park | 78.9% | 50.0%(+28.9)#10 | 46.1%(+32.8)#1,520 |
| 11. | Highland | 78.0% | 50.0%(+28.0)#11 | 46.1%(+31.9)#1,631 |
| 12. | Mountain Green | 77.4% | 50.0%(+27.4)#12 | 46.1%(+31.3)#1,718 |
| 13. | Pine Valley | 76.7% | 50.0%(+26.7)#13 | 46.1%(+30.6)#1,817 |
| 14. | Stansbury Park | 76.1% | 50.0%(+26.1)#14 | 46.1%(+30.0)#1,902 |
| 15. | Midway | 74.6% | 50.0%(+24.6)#15 | 46.1%(+28.5)#2,141 |
| 16. | Erda | 74.2% | 50.0%(+24.2)#16 | 46.1%(+28.1)#2,196 |
| 17. | Snyderville | 73.2% | 50.0%(+23.2)#17 | 46.1%(+27.1)#2,342 |
| 18. | Alpine | 72.8% | 50.0%(+22.8)#18 | 46.1%(+26.7)#2,401 |
| 19. | Eden | 72.8% | 50.0%(+22.8)#19 | 46.1%(+26.7)#2,413 |
| 20. | Liberty | 72.6% | 50.0%(+22.6)#20 | 46.1%(+26.5)#2,457 |
| 21. | Mantua | 72.3% | 50.0%(+22.3)#21 | 46.1%(+26.2)#2,500 |
| 22. | Elk Ridge | 71.8% | 50.0%(+21.8)#22 | 46.1%(+25.7)#2,581 |
| 23. | Mendon | 71.4% | 50.0%(+21.4)#23 | 46.1%(+25.3)#2,663 |
| 24. | Mapleton | 71.2% | 50.0%(+21.2)#24 | 46.1%(+25.1)#2,686 |
| 25. | Granite | 71.2% | 50.0%(+21.2)#25 | 46.1%(+25.1)#2,694 |
| 26. | Woodland Hills | 71.0% | 50.0%(+21.0)#26 | 46.1%(+24.9)#2,724 |
| 27. | Jensen | 70.9% | 50.0%(+20.9)#27 | 46.1%(+24.8)#2,735 |
| 28. | Kaysville | 70.6% | 50.0%(+20.6)#28 | 46.1%(+24.5)#2,778 |
| 29. | South Jordan | 70.5% | 50.0%(+20.5)#29 | 46.1%(+24.4)#2,799 |
| 30. | Emigration Canyon | 69.8% | 50.0%(+19.8)#30 | 46.1%(+23.7)#2,921 |
| 31. | Spring Lake | 69.7% | 50.0%(+19.7)#31 | 46.1%(+23.6)#2,942 |
| 32. | Farmington | 69.6% | 50.0%(+19.6)#32 | 46.1%(+23.5)#2,946 |
| 33. | Pleasant View | 69.3% | 50.0%(+19.3)#33 | 46.1%(+23.2)#2,995 |
| 34. | Draper | 69.2% | 50.0%(+19.2)#34 | 46.1%(+23.1)#3,006 |
| 35. | Park City | 69.2% | 50.0%(+19.2)#35 | 46.1%(+23.1)#3,011 |
| 36. | Cedar Hills | 68.9% | 50.0%(+18.9)#36 | 46.1%(+22.8)#3,062 |
| 37. | Syracuse | 68.1% | 50.0%(+18.1)#37 | 46.1%(+22.0)#3,228 |
| 38. | Fairfield | 68.1% | 50.0%(+18.1)#38 | 46.1%(+22.0)#3,240 |
| 39. | South Willard | 68.0% | 50.0%(+18.0)#39 | 46.1%(+21.9)#3,252 |
| 40. | Charleston | 68.0% | 50.0%(+18.0)#40 | 46.1%(+21.9)#3,257 |
| 41. | West Bountiful | 67.9% | 50.0%(+17.9)#41 | 46.1%(+21.8)#3,269 |
| 42. | Centerville | 66.3% | 50.0%(+16.3)#42 | 46.1%(+20.2)#3,557 |
| 43. | South Weber | 66.2% | 50.0%(+16.2)#43 | 46.1%(+20.1)#3,571 |
| 44. | Herriman | 65.2% | 50.0%(+15.2)#44 | 46.1%(+19.1)#3,789 |
| 45. | Saratoga Springs | 65.1% | 50.0%(+15.1)#45 | 46.1%(+19.0)#3,812 |
| 46. | Lehi | 64.9% | 50.0%(+14.9)#46 | 46.1%(+18.8)#3,854 |
| 47. | Fruit Heights | 64.8% | 50.0%(+14.8)#47 | 46.1%(+18.7)#3,877 |
| 48. | West Point | 64.1% | 50.0%(+14.1)#48 | 46.1%(+18.0)#4,025 |
| 49. | Cottonwood Heights | 64.0% | 50.0%(+14.0)#49 | 46.1%(+17.9)#4,043 |
| 50. | Plain City | 63.8% | 50.0%(+13.8)#50 | 46.1%(+17.7)#4,085 |
| 51. | Samak | 63.6% | 50.0%(+13.6)#51 | 46.1%(+17.5)#4,141 |
| 52. | Woods Cross | 62.7% | 50.0%(+12.7)#52 | 46.1%(+16.6)#4,323 |
| 53. | Bluffdale | 62.6% | 50.0%(+12.6)#53 | 46.1%(+16.5)#4,348 |
| 54. | Morgan | 62.5% | 50.0%(+12.5)#54 | 46.1%(+16.4)#4,375 |
| 55. | Peter | 62.4% | 50.0%(+12.4)#55 | 46.1%(+16.3)#4,412 |
| 56. | Sandy | 62.2% | 50.0%(+12.2)#56 | 46.1%(+16.1)#4,442 |
| 57. | Stockton | 61.9% | 50.0%(+11.9)#57 | 46.1%(+15.8)#4,518 |
| 58. | Holladay | 61.8% | 50.0%(+11.8)#58 | 46.1%(+15.7)#4,524 |
| 59. | Springdale | 61.6% | 50.0%(+11.6)#59 | 46.1%(+15.5)#4,575 |
| 60. | Brighton | 61.6% | 50.0%(+11.6)#60 | 46.1%(+15.5)#4,577 |
| 61. | Wallsburg | 61.6% | 50.0%(+11.6)#61 | 46.1%(+15.5)#4,578 |
| 62. | Francis | 61.5% | 50.0%(+11.5)#62 | 46.1%(+15.4)#4,606 |
| 63. | Riverton | 61.3% | 50.0%(+11.3)#63 | 46.1%(+15.2)#4,644 |
| 64. | Farr West | 61.1% | 50.0%(+11.1)#64 | 46.1%(+15.0)#4,701 |
| 65. | Huntsville | 60.3% | 50.0%(+10.3)#65 | 46.1%(+14.2)#4,886 |
| 66. | Thatcher | 60.1% | 50.0%(+10.1)#66 | 46.1%(+14.0)#4,918 |
| 67. | Oakley | 59.8% | 50.0%(+9.80)#67 | 46.1%(+13.7)#5,039 |
| 68. | Genola | 58.9% | 50.0%(+8.90)#68 | 46.1%(+12.8)#5,249 |
| 69. | Bryce Canyon City | 58.8% | 50.0%(+8.80)#69 | 46.1%(+12.7)#5,281 |
| 70. | Marion | 57.9% | 50.0%(+7.90)#70 | 46.1%(+11.8)#5,495 |
| 71. | North Ogden | 56.8% | 50.0%(+6.80)#71 | 46.1%(+10.7)#5,761 |
| 72. | Lindon | 56.4% | 50.0%(+6.40)#72 | 46.1%(+10.3)#5,865 |
| 73. | Hooper | 56.4% | 50.0%(+6.40)#73 | 46.1%(+10.3)#5,866 |
| 74. | Central Valley | 56.4% | 50.0%(+6.40)#74 | 46.1%(+10.3)#5,875 |
| 75. | Uintah | 56.3% | 50.0%(+6.30)#75 | 46.1%(+10.2)#5,901 |
| 76. | Elberta | 56.3% | 50.0%(+6.30)#76 | 46.1%(+10.2)#5,913 |
| 77. | Millcreek | 55.9% | 50.0%(+5.90)#77 | 46.1%(+9.80)#6,012 |
| 78. | Bountiful | 55.9% | 50.0%(+5.90)#78 | 46.1%(+9.80)#6,013 |
| 79. | Manila | 55.9% | 50.0%(+5.90)#79 | 46.1%(+9.80)#6,033 |
| 80. | Washington | 55.8% | 50.0%(+5.80)#80 | 46.1%(+9.70)#6,045 |
| 81. | Providence | 55.6% | 50.0%(+5.60)#81 | 46.1%(+9.50)#6,098 |
| 82. | Kanarraville | 55.4% | 50.0%(+5.40)#82 | 46.1%(+9.30)#6,186 |
| 83. | Veyo | 55.3% | 50.0%(+5.30)#83 | 46.1%(+9.20)#6,206 |
| 84. | Aurora | 55.1% | 50.0%(+5.10)#84 | 46.1%(+9.00)#6,257 |
| 85. | Woodruff | 55.0% | 50.0%(+5.00)#85 | 46.1%(+8.90)#6,286 |
| 86. | Clinton | 54.9% | 50.0%(+4.90)#86 | 46.1%(+8.80)#6,295 |
| 87. | Heber | 54.7% | 50.0%(+4.70)#87 | 46.1%(+8.60)#6,352 |
| 88. | Benjamin | 54.4% | 50.0%(+4.40)#88 | 46.1%(+8.30)#6,468 |
| 89. | Layton | 54.3% | 50.0%(+4.30)#89 | 46.1%(+8.20)#6,477 |
| 90. | Salem | 54.3% | 50.0%(+4.30)#90 | 46.1%(+8.20)#6,485 |
| 91. | West Jordan | 54.2% | 50.0%(+4.20)#91 | 46.1%(+8.10)#6,514 |
| 92. | Hyde Park | 54.2% | 50.0%(+4.20)#92 | 46.1%(+8.10)#6,523 |
| 93. | Henefer | 54.1% | 50.0%(+4.10)#93 | 46.1%(+8.00)#6,562 |
| 94. | Rush Valley | 54.1% | 50.0%(+4.10)#94 | 46.1%(+8.00)#6,565 |
| 95. | Bicknell | 54.1% | 50.0%(+4.10)#95 | 46.1%(+8.00)#6,566 |
| 96. | Murray | 54.0% | 50.0%(+4.00)#96 | 46.1%(+7.90)#6,572 |
| 97. | Glenwood | 53.4% | 50.0%(+3.40)#97 | 46.1%(+7.30)#6,774 |
| 98. | New Harmony | 53.4% | 50.0%(+3.40)#98 | 46.1%(+7.30)#6,775 |
| 99. | Millville | 53.2% | 50.0%(+3.20)#99 | 46.1%(+7.10)#6,831 |
| 100. | North Salt Lake | 52.7% | 50.0%(+2.70)#100 | 46.1%(+6.60)#6,974 |
Common Questions
What are the Top 10 Cities with the Highest Percentage of Families with Income Above $100,000 in Utah?
Top 10 Cities with the Highest Percentage of Families with Income Above $100,000 in Utah are:
#1
100.0%
#2
100.0%
#3
100.0%
#4
90.6%
#5
88.3%
#6
86.0%
#7
82.8%
#8
78.9%
#9
78.0%
#10
77.4%
What city has the Highest Percentage of Families with Income Above $100,000 in Utah?
Dugway has the Highest Percentage of Families with Income Above $100,000 in Utah with 100.0%.
What is the Percentage of Families with Income Above $100,000 in the State of Utah?
Percentage of Families with Income Above $100,000 in Utah is 50.0%.
What is the Percentage of Families with Income Above $100,000 in the United States?
Percentage of Families with Income Above $100,000 in the United States is 46.1%.