Cities with the Highest Percentage of Families with Income Above $100,000 in Nevada
RELATED REPORTS & OPTIONS
Family Income | $100k+
Nevada
Compare Cities
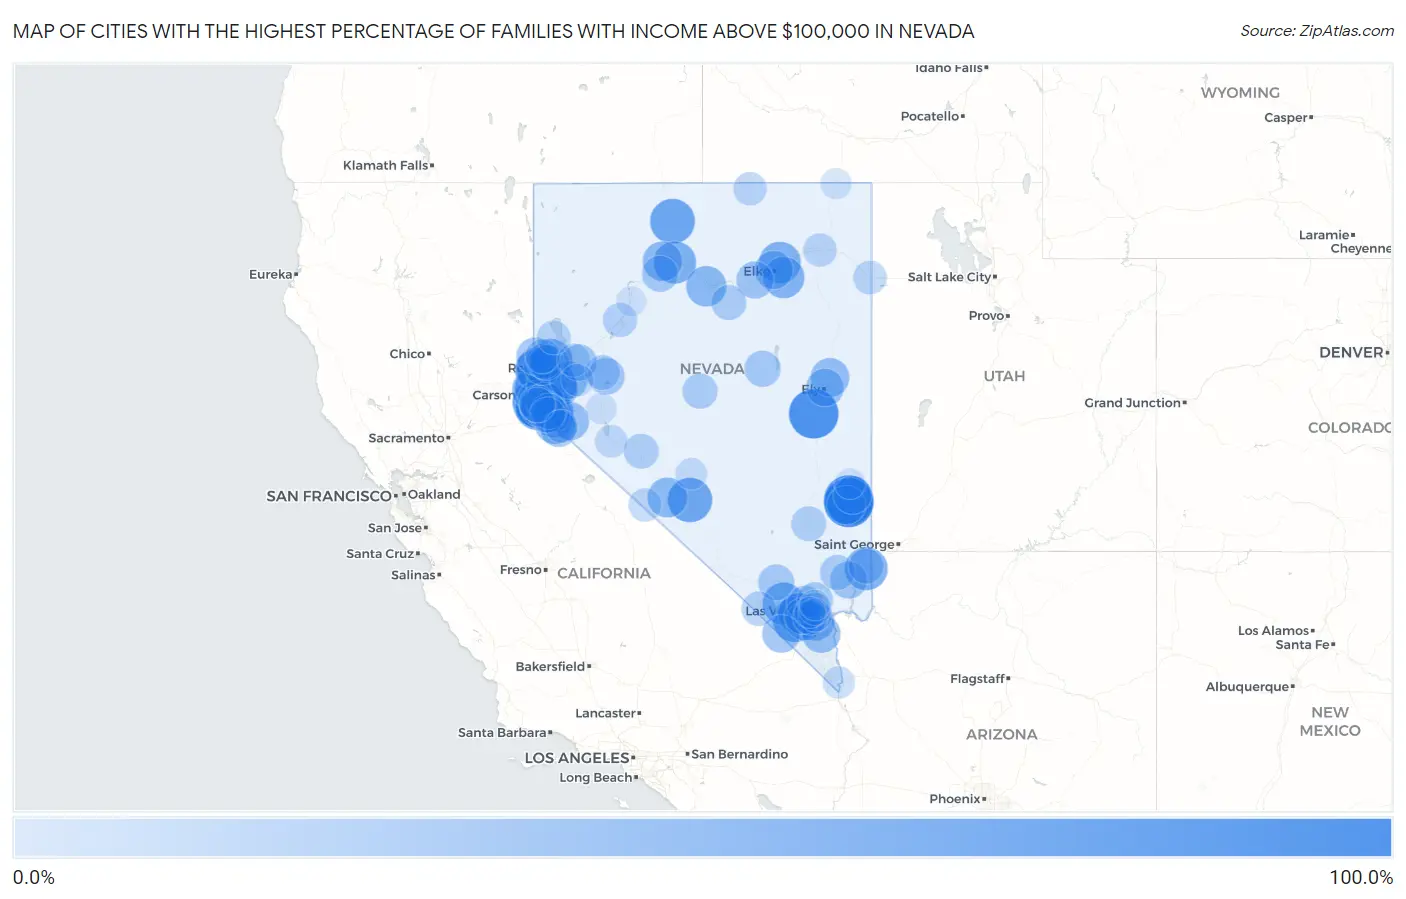
Map of Cities with the Highest Percentage of Families with Income Above $100,000 in Nevada
0.0%
100.0%
Cities with the Highest Percentage of Families with Income Above $100,000 in Nevada
| City | Families with Income > $100k | vs State | vs National | |
| 1. | Preston | 100.0% | 41.4%(+58.6)#1 | 46.1%(+53.9)#81 |
| 2. | Bennett Springs | 100.0% | 41.4%(+58.6)#2 | 46.1%(+53.9)#204 |
| 3. | Logan Creek | 100.0% | 41.4%(+58.6)#3 | 46.1%(+53.9)#333 |
| 4. | Beaverdam | 100.0% | 41.4%(+58.6)#4 | 46.1%(+53.9)#369 |
| 5. | Virginia City | 81.3% | 41.4%(+39.9)#5 | 46.1%(+35.2)#1,259 |
| 6. | Round Hill Village | 79.4% | 41.4%(+38.0)#6 | 46.1%(+33.3)#1,453 |
| 7. | Paradise Valley | 78.3% | 41.4%(+36.9)#7 | 46.1%(+32.2)#1,602 |
| 8. | Goldfield | 77.1% | 41.4%(+35.7)#8 | 46.1%(+31.0)#1,762 |
| 9. | Blue Diamond | 76.6% | 41.4%(+35.2)#9 | 46.1%(+30.5)#1,837 |
| 10. | Zephyr Cove | 73.2% | 41.4%(+31.8)#10 | 46.1%(+27.1)#2,347 |
| 11. | Crystal Bay | 70.2% | 41.4%(+28.8)#11 | 46.1%(+24.1)#2,858 |
| 12. | Genoa | 70.1% | 41.4%(+28.7)#12 | 46.1%(+24.0)#2,869 |
| 13. | Incline Village | 70.0% | 41.4%(+28.6)#13 | 46.1%(+23.9)#2,881 |
| 14. | Bunkerville | 69.4% | 41.4%(+28.0)#14 | 46.1%(+23.3)#2,984 |
| 15. | Mogul | 68.0% | 41.4%(+26.6)#15 | 46.1%(+21.9)#3,254 |
| 16. | Mount Charleston | 67.4% | 41.4%(+26.0)#16 | 46.1%(+21.3)#3,361 |
| 17. | Golconda | 67.2% | 41.4%(+25.8)#17 | 46.1%(+21.1)#3,390 |
| 18. | Spanish Springs | 66.8% | 41.4%(+25.4)#18 | 46.1%(+20.7)#3,432 |
| 19. | Summerlin South | 63.6% | 41.4%(+22.2)#19 | 46.1%(+17.5)#4,119 |
| 20. | Osino | 63.5% | 41.4%(+22.1)#20 | 46.1%(+17.4)#4,153 |
| 21. | Spring Creek | 62.9% | 41.4%(+21.5)#21 | 46.1%(+16.8)#4,277 |
| 22. | East Valley | 60.0% | 41.4%(+18.6)#22 | 46.1%(+13.9)#4,950 |
| 23. | Johnson Lane | 58.7% | 41.4%(+17.3)#23 | 46.1%(+12.6)#5,298 |
| 24. | Double Spring | 57.9% | 41.4%(+16.5)#24 | 46.1%(+11.8)#5,498 |
| 25. | Battle Mountain | 57.4% | 41.4%(+16.0)#25 | 46.1%(+11.3)#5,609 |
| 26. | Verdi | 56.8% | 41.4%(+15.4)#26 | 46.1%(+10.7)#5,770 |
| 27. | Carter Springs | 56.3% | 41.4%(+14.9)#27 | 46.1%(+10.2)#5,909 |
| 28. | Silver Peak | 56.1% | 41.4%(+14.7)#28 | 46.1%(+10.0)#5,975 |
| 29. | Fish Springs | 55.8% | 41.4%(+14.4)#29 | 46.1%(+9.70)#6,066 |
| 30. | Winnemucca | 54.4% | 41.4%(+13.0)#30 | 46.1%(+8.30)#6,452 |
| 31. | Glenbrook | 52.7% | 41.4%(+11.3)#31 | 46.1%(+6.60)#6,999 |
| 32. | Washoe Valley | 52.4% | 41.4%(+11.0)#32 | 46.1%(+6.30)#7,062 |
| 33. | Minden | 52.3% | 41.4%(+10.9)#33 | 46.1%(+6.20)#7,098 |
| 34. | Caliente | 50.8% | 41.4%(+9.40)#34 | 46.1%(+4.70)#7,552 |
| 35. | Mcgill | 50.6% | 41.4%(+9.20)#35 | 46.1%(+4.50)#7,614 |
| 36. | Henderson | 50.5% | 41.4%(+9.10)#36 | 46.1%(+4.40)#7,621 |
| 37. | Kingsbury | 50.3% | 41.4%(+8.90)#37 | 46.1%(+4.20)#7,705 |
| 38. | Enterprise | 49.1% | 41.4%(+7.70)#38 | 46.1%(+3.00)#8,151 |
| 39. | Elko | 49.1% | 41.4%(+7.70)#39 | 46.1%(+3.00)#8,154 |
| 40. | Boulder City | 49.1% | 41.4%(+7.70)#40 | 46.1%(+3.00)#8,157 |
| 41. | Smith Valley | 48.6% | 41.4%(+7.20)#41 | 46.1%(+2.50)#8,317 |
| 42. | Panaca | 47.7% | 41.4%(+6.30)#42 | 46.1%(+1.60)#8,624 |
| 43. | Sparks | 47.6% | 41.4%(+6.20)#43 | 46.1%(+1.50)#8,643 |
| 44. | Dayton | 47.5% | 41.4%(+6.10)#44 | 46.1%(+1.40)#8,683 |
| 45. | Sandy Valley | 46.6% | 41.4%(+5.20)#45 | 46.1%(+0.500)#9,036 |
| 46. | Ely | 46.4% | 41.4%(+5.00)#46 | 46.1%(+0.300)#9,105 |
| 47. | Indian Hills | 45.9% | 41.4%(+4.50)#47 | 46.1%(-0.200)#9,288 |
| 48. | Reno | 45.8% | 41.4%(+4.40)#48 | 46.1%(-0.300)#9,316 |
| 49. | Stagecoach | 45.8% | 41.4%(+4.40)#49 | 46.1%(-0.300)#9,337 |
| 50. | Cold Springs | 44.3% | 41.4%(+2.90)#50 | 46.1%(-1.80)#9,955 |
| 51. | Moapa Valley | 43.8% | 41.4%(+2.40)#51 | 46.1%(-2.30)#10,147 |
| 52. | Carlin | 43.7% | 41.4%(+2.30)#52 | 46.1%(-2.40)#10,196 |
| 53. | Ruhenstroth | 42.9% | 41.4%(+1.50)#53 | 46.1%(-3.20)#10,519 |
| 54. | Fallon Station | 41.8% | 41.4%(+0.400)#54 | 46.1%(-4.30)#10,969 |
| 55. | Lakeridge | 41.5% | 41.4%(+0.100)#55 | 46.1%(-4.60)#11,117 |
| 56. | Topaz Lake | 41.0% | 41.4%(-0.400)#56 | 46.1%(-5.10)#11,375 |
| 57. | Fernley | 40.4% | 41.4%(-1.00)#57 | 46.1%(-5.70)#11,638 |
| 58. | Eureka | 39.4% | 41.4%(-2.00)#58 | 46.1%(-6.70)#12,169 |
| 59. | Grass Valley | 39.3% | 41.4%(-2.10)#59 | 46.1%(-6.80)#12,199 |
| 60. | Carson | 39.2% | 41.4%(-2.20)#60 | 46.1%(-6.90)#12,214 |
| 61. | Las Vegas | 39.1% | 41.4%(-2.30)#61 | 46.1%(-7.00)#12,255 |
| 62. | Indian Springs | 38.7% | 41.4%(-2.70)#62 | 46.1%(-7.40)#12,493 |
| 63. | Spring Valley | 38.0% | 41.4%(-3.40)#63 | 46.1%(-8.10)#12,811 |
| 64. | North Las Vegas | 36.9% | 41.4%(-4.50)#64 | 46.1%(-9.20)#13,390 |
| 65. | Gardnerville | 36.9% | 41.4%(-4.50)#65 | 46.1%(-9.20)#13,399 |
| 66. | Gardnerville Ranchos | 35.5% | 41.4%(-5.90)#66 | 46.1%(-10.6)#14,144 |
| 67. | Golden Valley | 35.4% | 41.4%(-6.00)#67 | 46.1%(-10.7)#14,211 |
| 68. | Skyland | 35.0% | 41.4%(-6.40)#68 | 46.1%(-11.1)#14,419 |
| 69. | Moapa Town | 34.9% | 41.4%(-6.50)#69 | 46.1%(-11.2)#14,469 |
| 70. | Sun Valley | 34.3% | 41.4%(-7.10)#70 | 46.1%(-11.8)#14,761 |
| 71. | Crescent Valley | 34.2% | 41.4%(-7.20)#71 | 46.1%(-11.9)#14,839 |
| 72. | Kingston | 34.0% | 41.4%(-7.40)#72 | 46.1%(-12.1)#14,959 |
| 73. | Mesquite | 33.8% | 41.4%(-7.60)#73 | 46.1%(-12.3)#15,019 |
| 74. | Alamo | 33.4% | 41.4%(-8.00)#74 | 46.1%(-12.7)#15,251 |
| 75. | Mina | 33.3% | 41.4%(-8.10)#75 | 46.1%(-12.8)#15,382 |
| 76. | Fallon | 33.2% | 41.4%(-8.20)#76 | 46.1%(-12.9)#15,467 |
| 77. | Pahrump | 31.8% | 41.4%(-9.60)#77 | 46.1%(-14.3)#16,194 |
| 78. | Paradise | 31.3% | 41.4%(-10.1)#78 | 46.1%(-14.8)#16,474 |
| 79. | Lemmon Valley | 31.1% | 41.4%(-10.3)#79 | 46.1%(-15.0)#16,632 |
| 80. | Lovelock | 30.6% | 41.4%(-10.8)#80 | 46.1%(-15.5)#16,940 |
| 81. | Sutcliffe | 29.2% | 41.4%(-12.2)#81 | 46.1%(-16.9)#17,814 |
| 82. | Amargosa Valley | 29.1% | 41.4%(-12.3)#82 | 46.1%(-17.0)#17,858 |
| 83. | West Wendover | 28.0% | 41.4%(-13.4)#83 | 46.1%(-18.1)#18,495 |
| 84. | Wells | 26.9% | 41.4%(-14.5)#84 | 46.1%(-19.2)#19,144 |
| 85. | Owyhee | 26.8% | 41.4%(-14.6)#85 | 46.1%(-19.3)#19,209 |
| 86. | Whitney | 26.3% | 41.4%(-15.1)#86 | 46.1%(-19.8)#19,467 |
| 87. | Dyer | 26.3% | 41.4%(-15.1)#87 | 46.1%(-19.8)#19,517 |
| 88. | Wadsworth | 26.0% | 41.4%(-15.4)#88 | 46.1%(-20.1)#19,662 |
| 89. | Topaz Ranch Estates | 25.8% | 41.4%(-15.6)#89 | 46.1%(-20.3)#19,768 |
| 90. | Hawthorne | 23.1% | 41.4%(-18.3)#90 | 46.1%(-23.0)#21,292 |
| 91. | Silver Springs | 23.0% | 41.4%(-18.4)#91 | 46.1%(-23.1)#21,362 |
| 92. | Sunrise Manor | 22.7% | 41.4%(-18.7)#92 | 46.1%(-23.4)#21,515 |
| 93. | Laughlin | 21.7% | 41.4%(-19.7)#93 | 46.1%(-24.4)#22,125 |
| 94. | Tonopah | 19.6% | 41.4%(-21.8)#94 | 46.1%(-26.5)#23,289 |
| 95. | Jackpot | 16.5% | 41.4%(-24.9)#95 | 46.1%(-29.6)#24,843 |
| 96. | Winchester | 16.3% | 41.4%(-25.1)#96 | 46.1%(-29.8)#24,891 |
| 97. | Schurz | 16.1% | 41.4%(-25.3)#97 | 46.1%(-30.0)#25,009 |
| 98. | Nellis Afb | 14.1% | 41.4%(-27.3)#98 | 46.1%(-32.0)#25,888 |
| 99. | Pioche | 13.8% | 41.4%(-27.6)#99 | 46.1%(-32.3)#26,026 |
| 100. | Humboldt River Ranch | 12.9% | 41.4%(-28.5)#100 | 46.1%(-33.2)#26,409 |
1
2Common Questions
What are the Top 10 Cities with the Highest Percentage of Families with Income Above $100,000 in Nevada?
Top 10 Cities with the Highest Percentage of Families with Income Above $100,000 in Nevada are:
#1
100.0%
#2
100.0%
#3
100.0%
#4
100.0%
#5
81.3%
#6
79.4%
#7
78.3%
#8
77.1%
#9
76.6%
#10
73.2%
What city has the Highest Percentage of Families with Income Above $100,000 in Nevada?
Preston has the Highest Percentage of Families with Income Above $100,000 in Nevada with 100.0%.
What is the Percentage of Families with Income Above $100,000 in the State of Nevada?
Percentage of Families with Income Above $100,000 in Nevada is 41.4%.
What is the Percentage of Families with Income Above $100,000 in the United States?
Percentage of Families with Income Above $100,000 in the United States is 46.1%.