Cities with the Highest Percentage of Families with Income Above $100,000 in Kentucky
RELATED REPORTS & OPTIONS
Family Income | $100k+
Kentucky
Compare Cities
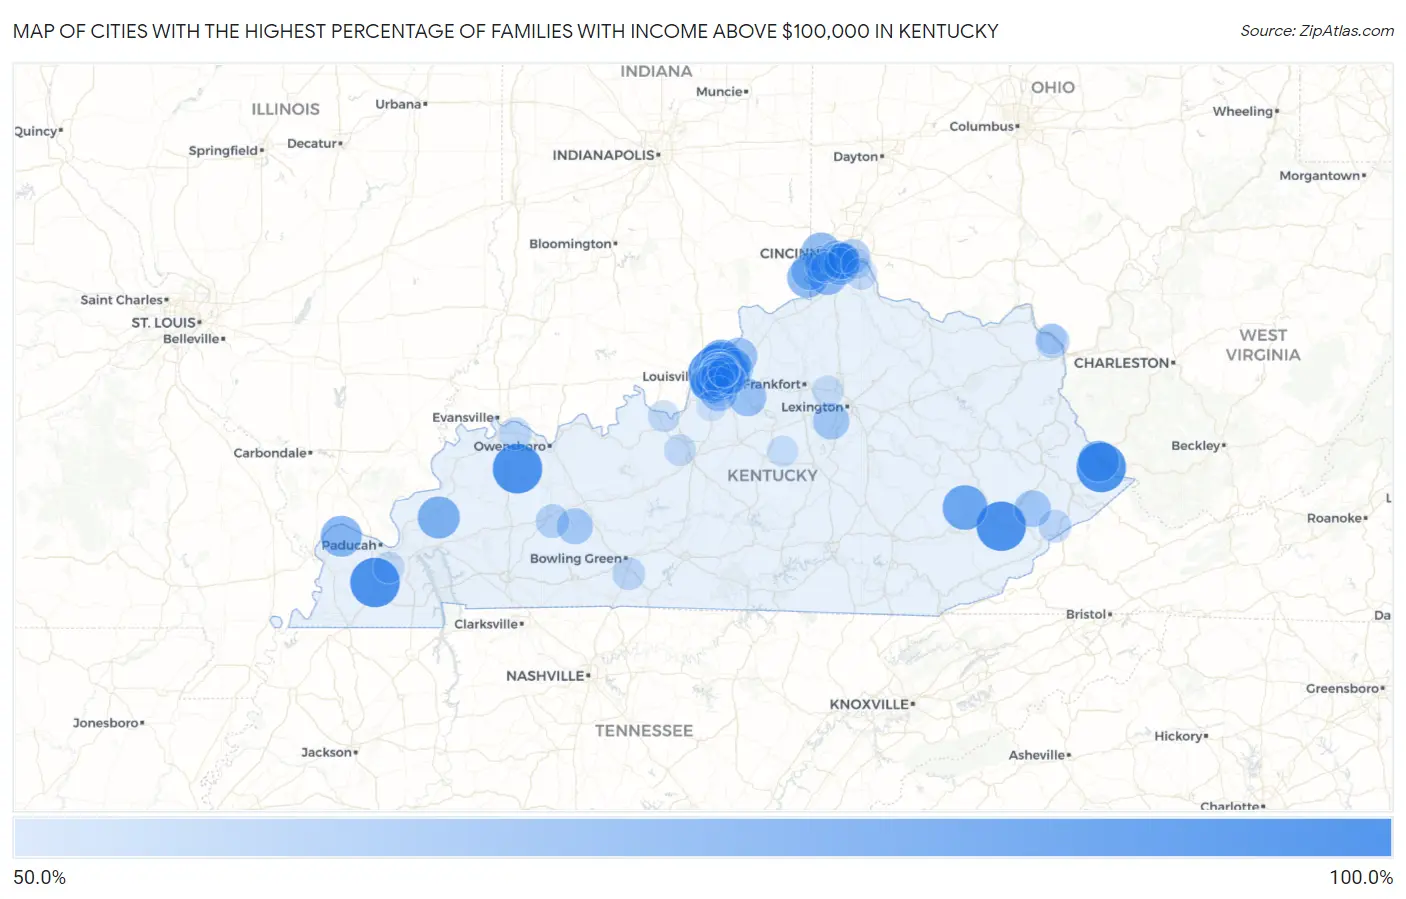
Map of Cities with the Highest Percentage of Families with Income Above $100,000 in Kentucky
0.0%
100.0%
Cities with the Highest Percentage of Families with Income Above $100,000 in Kentucky
| City | Families with Income > $100k | vs State | vs National | |
| 1. | Belfry | 100.0% | 36.1%(+63.9)#1 | 46.1%(+53.9)#65 |
| 2. | Beech Grove | 100.0% | 36.1%(+63.9)#2 | 46.1%(+53.9)#85 |
| 3. | Jeff | 100.0% | 36.1%(+63.9)#3 | 46.1%(+53.9)#95 |
| 4. | Hickory | 100.0% | 36.1%(+63.9)#4 | 46.1%(+53.9)#150 |
| 5. | Mockingbird Valley | 97.9% | 36.1%(+61.8)#5 | 46.1%(+51.8)#427 |
| 6. | Glenview Manor | 96.6% | 36.1%(+60.5)#6 | 46.1%(+50.5)#437 |
| 7. | Glenview | 93.6% | 36.1%(+57.5)#7 | 46.1%(+47.5)#483 |
| 8. | Riverwood | 90.6% | 36.1%(+54.5)#8 | 46.1%(+44.5)#556 |
| 9. | Spring Valley | 88.4% | 36.1%(+52.3)#9 | 46.1%(+42.3)#668 |
| 10. | Buckhorn | 88.2% | 36.1%(+52.1)#10 | 46.1%(+42.1)#685 |
| 11. | Manor Creek | 88.0% | 36.1%(+51.9)#11 | 46.1%(+41.9)#693 |
| 12. | Rolling Fields | 86.2% | 36.1%(+50.1)#12 | 46.1%(+40.1)#802 |
| 13. | Maryhill Estates | 86.2% | 36.1%(+50.1)#13 | 46.1%(+40.1)#803 |
| 14. | Strathmoor Manor | 85.3% | 36.1%(+49.2)#14 | 46.1%(+39.2)#872 |
| 15. | Norbourne Estates | 84.7% | 36.1%(+48.6)#15 | 46.1%(+38.6)#924 |
| 16. | Prospect | 83.9% | 36.1%(+47.8)#16 | 46.1%(+37.8)#981 |
| 17. | Bellewood | 83.6% | 36.1%(+47.5)#17 | 46.1%(+37.5)#1,009 |
| 18. | Northfield | 82.6% | 36.1%(+46.5)#18 | 46.1%(+36.5)#1,104 |
| 19. | Crayne | 82.0% | 36.1%(+45.9)#19 | 46.1%(+35.9)#1,177 |
| 20. | Indian Hills | 81.4% | 36.1%(+45.3)#20 | 46.1%(+35.3)#1,241 |
| 21. | Anchorage | 81.2% | 36.1%(+45.1)#21 | 46.1%(+35.1)#1,273 |
| 22. | Hurstbourne | 80.8% | 36.1%(+44.7)#22 | 46.1%(+34.7)#1,307 |
| 23. | Kingsley | 79.6% | 36.1%(+43.5)#23 | 46.1%(+33.5)#1,427 |
| 24. | South Williamson | 79.6% | 36.1%(+43.5)#24 | 46.1%(+33.5)#1,428 |
| 25. | Bandana | 79.4% | 36.1%(+43.3)#25 | 46.1%(+33.3)#1,456 |
| 26. | River Bluff | 79.3% | 36.1%(+43.2)#26 | 46.1%(+33.2)#1,474 |
| 27. | Rabbit Hash | 78.4% | 36.1%(+42.3)#27 | 46.1%(+32.3)#1,593 |
| 28. | Norwood | 77.3% | 36.1%(+41.2)#28 | 46.1%(+31.2)#1,742 |
| 29. | Union | 76.9% | 36.1%(+40.8)#29 | 46.1%(+30.8)#1,783 |
| 30. | Francisville | 76.6% | 36.1%(+40.5)#30 | 46.1%(+30.5)#1,822 |
| 31. | Glenview Hills | 76.5% | 36.1%(+40.4)#31 | 46.1%(+30.4)#1,849 |
| 32. | Bancroft | 75.0% | 36.1%(+38.9)#32 | 46.1%(+28.9)#2,060 |
| 33. | Lakeside Park | 74.7% | 36.1%(+38.6)#33 | 46.1%(+28.6)#2,129 |
| 34. | Knottsville | 74.0% | 36.1%(+37.9)#34 | 46.1%(+27.9)#2,236 |
| 35. | Yelvington | 73.8% | 36.1%(+37.7)#35 | 46.1%(+27.7)#2,261 |
| 36. | Murray Hill | 73.3% | 36.1%(+37.2)#36 | 46.1%(+27.2)#2,331 |
| 37. | Richlawn | 72.9% | 36.1%(+36.8)#37 | 46.1%(+26.8)#2,393 |
| 38. | Creekside | 72.5% | 36.1%(+36.4)#38 | 46.1%(+26.4)#2,472 |
| 39. | Beechwood Village | 72.2% | 36.1%(+36.1)#39 | 46.1%(+26.1)#2,515 |
| 40. | Belleview | 71.8% | 36.1%(+35.7)#40 | 46.1%(+25.7)#2,595 |
| 41. | Elk Creek | 71.6% | 36.1%(+35.5)#41 | 46.1%(+25.5)#2,623 |
| 42. | Edgewood | 71.5% | 36.1%(+35.4)#42 | 46.1%(+25.4)#2,640 |
| 43. | Druid Hills | 71.4% | 36.1%(+35.3)#43 | 46.1%(+25.3)#2,667 |
| 44. | Spring Mill | 70.9% | 36.1%(+34.8)#44 | 46.1%(+24.8)#2,736 |
| 45. | Crossgate | 70.9% | 36.1%(+34.8)#45 | 46.1%(+24.8)#2,739 |
| 46. | Brownsboro Farm | 70.6% | 36.1%(+34.5)#46 | 46.1%(+24.5)#2,794 |
| 47. | Thornhill | 70.4% | 36.1%(+34.3)#47 | 46.1%(+24.3)#2,830 |
| 48. | Wellington | 70.0% | 36.1%(+33.9)#48 | 46.1%(+23.9)#2,890 |
| 49. | Buckner | 69.8% | 36.1%(+33.7)#49 | 46.1%(+23.7)#2,918 |
| 50. | Pippa Passes | 69.2% | 36.1%(+33.1)#50 | 46.1%(+23.1)#3,021 |
| 51. | Old Brownsboro Place | 68.8% | 36.1%(+32.7)#51 | 46.1%(+22.7)#3,093 |
| 52. | Villa Hills | 68.6% | 36.1%(+32.5)#52 | 46.1%(+22.5)#3,122 |
| 53. | Pewee Valley | 68.6% | 36.1%(+32.5)#53 | 46.1%(+22.5)#3,129 |
| 54. | Bellemeade | 68.4% | 36.1%(+32.3)#54 | 46.1%(+22.3)#3,177 |
| 55. | Keene | 68.4% | 36.1%(+32.3)#55 | 46.1%(+22.3)#3,182 |
| 56. | Fort Mitchell | 68.0% | 36.1%(+31.9)#56 | 46.1%(+21.9)#3,245 |
| 57. | Green Spring | 67.9% | 36.1%(+31.8)#57 | 46.1%(+21.8)#3,275 |
| 58. | Rochester | 67.4% | 36.1%(+31.3)#58 | 46.1%(+21.3)#3,365 |
| 59. | Fort Wright | 66.6% | 36.1%(+30.5)#59 | 46.1%(+20.5)#3,503 |
| 60. | Fort Thomas | 64.4% | 36.1%(+28.3)#60 | 46.1%(+18.3)#3,957 |
| 61. | Crestwood | 64.4% | 36.1%(+28.3)#61 | 46.1%(+18.3)#3,961 |
| 62. | Cambridge | 63.6% | 36.1%(+27.5)#62 | 46.1%(+17.5)#4,140 |
| 63. | Sycamore | 63.0% | 36.1%(+26.9)#63 | 46.1%(+16.9)#4,272 |
| 64. | Bellefonte | 62.9% | 36.1%(+26.8)#64 | 46.1%(+16.8)#4,293 |
| 65. | Hills And Dales | 62.8% | 36.1%(+26.7)#65 | 46.1%(+16.7)#4,319 |
| 66. | Douglass Hills | 62.7% | 36.1%(+26.6)#66 | 46.1%(+16.6)#4,329 |
| 67. | Barbourmeade | 62.3% | 36.1%(+26.2)#67 | 46.1%(+16.2)#4,432 |
| 68. | Goose Creek | 62.2% | 36.1%(+26.1)#68 | 46.1%(+16.1)#4,461 |
| 69. | Strathmoor Village | 62.1% | 36.1%(+26.0)#69 | 46.1%(+16.0)#4,474 |
| 70. | Cleaton | 62.1% | 36.1%(+26.0)#70 | 46.1%(+16.0)#4,478 |
| 71. | Audubon Park | 61.9% | 36.1%(+25.8)#71 | 46.1%(+15.8)#4,516 |
| 72. | Seneca Gardens | 61.8% | 36.1%(+25.7)#72 | 46.1%(+15.7)#4,536 |
| 73. | Broeck Pointe | 61.5% | 36.1%(+25.4)#73 | 46.1%(+15.4)#4,613 |
| 74. | Sorgho | 61.4% | 36.1%(+25.3)#74 | 46.1%(+15.3)#4,627 |
| 75. | Windy Hills | 61.4% | 36.1%(+25.3)#75 | 46.1%(+15.3)#4,628 |
| 76. | Parkway Village | 61.1% | 36.1%(+25.0)#76 | 46.1%(+15.0)#4,706 |
| 77. | Brownsboro Village | 60.8% | 36.1%(+24.7)#77 | 46.1%(+14.7)#4,777 |
| 78. | Burlington | 60.6% | 36.1%(+24.5)#78 | 46.1%(+14.5)#4,811 |
| 79. | St Matthews | 60.2% | 36.1%(+24.1)#79 | 46.1%(+14.1)#4,893 |
| 80. | Mcroberts | 60.1% | 36.1%(+24.0)#80 | 46.1%(+14.0)#4,922 |
| 81. | Plano | 59.9% | 36.1%(+23.8)#81 | 46.1%(+13.8)#5,024 |
| 82. | Spottsville | 59.5% | 36.1%(+23.4)#82 | 46.1%(+13.4)#5,112 |
| 83. | Crestview Hills | 58.9% | 36.1%(+22.8)#83 | 46.1%(+12.8)#5,246 |
| 84. | Doe Valley | 57.9% | 36.1%(+21.8)#84 | 46.1%(+11.8)#5,492 |
| 85. | Alexandria | 57.7% | 36.1%(+21.6)#85 | 46.1%(+11.6)#5,534 |
| 86. | Rineyville | 57.6% | 36.1%(+21.5)#86 | 46.1%(+11.5)#5,569 |
| 87. | Symsonia | 57.5% | 36.1%(+21.4)#87 | 46.1%(+11.4)#5,601 |
| 88. | Langdon Place | 57.2% | 36.1%(+21.1)#88 | 46.1%(+11.1)#5,664 |
| 89. | Midway | 57.1% | 36.1%(+21.0)#89 | 46.1%(+11.0)#5,688 |
| 90. | Oakbrook | 56.0% | 36.1%(+19.9)#90 | 46.1%(+9.90)#5,982 |
| 91. | Mackville | 56.0% | 36.1%(+19.9)#91 | 46.1%(+9.90)#6,001 |
| 92. | Park Hills | 55.9% | 36.1%(+19.8)#92 | 46.1%(+9.80)#6,027 |
| 93. | Russell | 55.8% | 36.1%(+19.7)#93 | 46.1%(+9.70)#6,054 |
| 94. | Crestview | 55.4% | 36.1%(+19.3)#94 | 46.1%(+9.30)#6,185 |
| 95. | Houston Acres | 55.2% | 36.1%(+19.1)#95 | 46.1%(+9.10)#6,231 |
| 96. | Stanley | 55.1% | 36.1%(+19.0)#96 | 46.1%(+9.00)#6,261 |
| 97. | Hollow Creek | 54.9% | 36.1%(+18.8)#97 | 46.1%(+8.80)#6,315 |
| 98. | Middletown | 54.5% | 36.1%(+18.4)#98 | 46.1%(+8.40)#6,411 |
| 99. | Westwood | 54.3% | 36.1%(+18.2)#99 | 46.1%(+8.20)#6,509 |
| 100. | Fox Chase | 53.9% | 36.1%(+17.8)#100 | 46.1%(+7.80)#6,630 |
Common Questions
What are the Top 10 Cities with the Highest Percentage of Families with Income Above $100,000 in Kentucky?
Top 10 Cities with the Highest Percentage of Families with Income Above $100,000 in Kentucky are:
#1
100.0%
#2
100.0%
#3
100.0%
#4
100.0%
#5
97.9%
#6
96.6%
#7
93.6%
#8
90.6%
#9
88.4%
#10
88.2%
What city has the Highest Percentage of Families with Income Above $100,000 in Kentucky?
Belfry has the Highest Percentage of Families with Income Above $100,000 in Kentucky with 100.0%.
What is the Percentage of Families with Income Above $100,000 in the State of Kentucky?
Percentage of Families with Income Above $100,000 in Kentucky is 36.1%.
What is the Percentage of Families with Income Above $100,000 in the United States?
Percentage of Families with Income Above $100,000 in the United States is 46.1%.