Cities with the Highest Percentage of Families with Income Above $100,000 in South Carolina
RELATED REPORTS & OPTIONS
Family Income | $100k+
South Carolina
Compare Cities
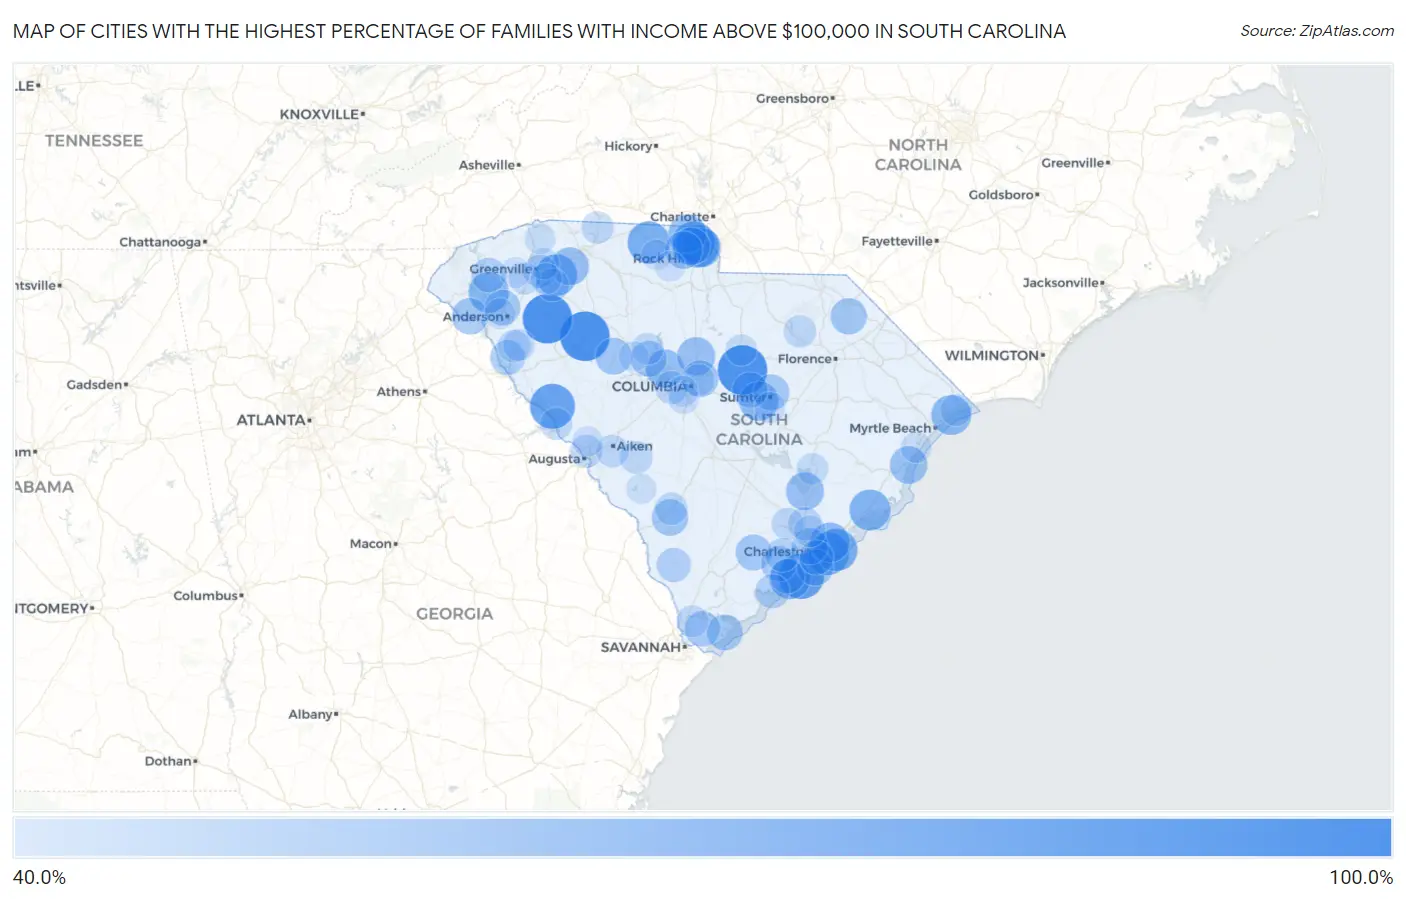
Map of Cities with the Highest Percentage of Families with Income Above $100,000 in South Carolina
0.0%
100.0%
Cities with the Highest Percentage of Families with Income Above $100,000 in South Carolina
| City | Families with Income > $100k | vs State | vs National | |
| 1. | Mountville | 100.0% | 38.5%(+61.5)#1 | 46.1%(+53.9)#126 |
| 2. | Boykin | 100.0% | 38.5%(+61.5)#2 | 46.1%(+53.9)#156 |
| 3. | Princeton | 100.0% | 38.5%(+61.5)#3 | 46.1%(+53.9)#217 |
| 4. | Kiawah Island | 87.8% | 38.5%(+49.3)#4 | 46.1%(+41.7)#705 |
| 5. | Plum Branch | 85.7% | 38.5%(+47.2)#5 | 46.1%(+39.6)#840 |
| 6. | Daufuskie Island | 83.3% | 38.5%(+44.8)#6 | 46.1%(+37.2)#1,041 |
| 7. | Baxter | 81.8% | 38.5%(+43.3)#7 | 46.1%(+35.7)#1,191 |
| 8. | Pimlico | 81.3% | 38.5%(+42.8)#8 | 46.1%(+35.2)#1,257 |
| 9. | Riverview | 78.7% | 38.5%(+40.2)#9 | 46.1%(+32.6)#1,549 |
| 10. | Sullivan S Island | 78.5% | 38.5%(+40.0)#10 | 46.1%(+32.4)#1,582 |
| 11. | Tega Cay | 77.8% | 38.5%(+39.3)#11 | 46.1%(+31.7)#1,665 |
| 12. | Isle Of Palms | 77.8% | 38.5%(+39.3)#12 | 46.1%(+31.7)#1,668 |
| 13. | Smyrna | 77.8% | 38.5%(+39.3)#13 | 46.1%(+31.7)#1,679 |
| 14. | Five Forks | 75.3% | 38.5%(+36.8)#14 | 46.1%(+29.2)#2,015 |
| 15. | Debordieu Colony | 74.9% | 38.5%(+36.4)#15 | 46.1%(+28.8)#2,105 |
| 16. | Mcclellanville | 73.4% | 38.5%(+34.9)#16 | 46.1%(+27.3)#2,317 |
| 17. | Danwood | 72.9% | 38.5%(+34.4)#17 | 46.1%(+26.8)#2,392 |
| 18. | Seabrook Island | 72.4% | 38.5%(+33.9)#18 | 46.1%(+26.3)#2,488 |
| 19. | Clemson | 71.4% | 38.5%(+32.9)#19 | 46.1%(+25.3)#2,657 |
| 20. | Briarcliffe Acres | 70.3% | 38.5%(+31.8)#20 | 46.1%(+24.2)#2,845 |
| 21. | Mount Pleasant | 69.4% | 38.5%(+30.9)#21 | 46.1%(+23.3)#2,970 |
| 22. | Cane Savannah | 68.4% | 38.5%(+29.9)#22 | 46.1%(+22.3)#3,174 |
| 23. | Fort Mill | 68.3% | 38.5%(+29.8)#23 | 46.1%(+22.2)#3,190 |
| 24. | Keowee Key | 66.8% | 38.5%(+28.3)#24 | 46.1%(+20.7)#3,440 |
| 25. | Lake Wylie | 65.3% | 38.5%(+26.8)#25 | 46.1%(+19.2)#3,768 |
| 26. | Lake Murray Of Richland | 65.0% | 38.5%(+26.5)#26 | 46.1%(+18.9)#3,839 |
| 27. | Blythewood | 64.8% | 38.5%(+26.3)#27 | 46.1%(+18.7)#3,879 |
| 28. | The Cliffs Valley | 64.5% | 38.5%(+26.0)#28 | 46.1%(+18.4)#3,946 |
| 29. | Reidville | 64.2% | 38.5%(+25.7)#29 | 46.1%(+18.1)#4,013 |
| 30. | Pinopolis | 64.0% | 38.5%(+25.5)#30 | 46.1%(+17.9)#4,056 |
| 31. | India Hook | 63.4% | 38.5%(+24.9)#31 | 46.1%(+17.3)#4,169 |
| 32. | Pawleys Island | 63.1% | 38.5%(+24.6)#32 | 46.1%(+17.0)#4,250 |
| 33. | Newport | 62.7% | 38.5%(+24.2)#33 | 46.1%(+16.6)#4,331 |
| 34. | Arcadia Lakes | 60.5% | 38.5%(+22.0)#34 | 46.1%(+14.4)#4,843 |
| 35. | Silverstreet | 60.5% | 38.5%(+22.0)#35 | 46.1%(+14.4)#4,849 |
| 36. | Sycamore | 60.0% | 38.5%(+21.5)#36 | 46.1%(+13.9)#4,973 |
| 37. | Folly Beach | 59.5% | 38.5%(+21.0)#37 | 46.1%(+13.4)#5,107 |
| 38. | Fair Play | 59.5% | 38.5%(+21.0)#38 | 46.1%(+13.4)#5,109 |
| 39. | Blenheim | 59.1% | 38.5%(+20.6)#39 | 46.1%(+13.0)#5,219 |
| 40. | Fripp Island | 58.9% | 38.5%(+20.4)#40 | 46.1%(+12.8)#5,258 |
| 41. | Charleston | 58.8% | 38.5%(+20.3)#41 | 46.1%(+12.7)#5,266 |
| 42. | Mulberry | 58.8% | 38.5%(+20.3)#42 | 46.1%(+12.7)#5,282 |
| 43. | Jacksonboro | 58.6% | 38.5%(+20.1)#43 | 46.1%(+12.5)#5,333 |
| 44. | Little Mountain | 58.1% | 38.5%(+19.6)#44 | 46.1%(+12.0)#5,447 |
| 45. | Hilton Head Island | 57.7% | 38.5%(+19.2)#45 | 46.1%(+11.6)#5,530 |
| 46. | Northlake | 57.5% | 38.5%(+19.0)#46 | 46.1%(+11.4)#5,590 |
| 47. | Stateburg | 57.2% | 38.5%(+18.7)#47 | 46.1%(+11.1)#5,660 |
| 48. | Bluffton | 56.6% | 38.5%(+18.1)#48 | 46.1%(+10.5)#5,818 |
| 49. | Meggett | 56.2% | 38.5%(+17.7)#49 | 46.1%(+10.1)#5,943 |
| 50. | Lowndesville | 54.6% | 38.5%(+16.1)#50 | 46.1%(+8.50)#6,397 |
| 51. | Six Mile | 54.0% | 38.5%(+15.5)#51 | 46.1%(+7.90)#6,593 |
| 52. | Rockville | 54.0% | 38.5%(+15.5)#52 | 46.1%(+7.90)#6,601 |
| 53. | James Island | 53.7% | 38.5%(+15.2)#53 | 46.1%(+7.60)#6,672 |
| 54. | Furman | 53.1% | 38.5%(+14.6)#54 | 46.1%(+7.00)#6,867 |
| 55. | Edisto Beach | 52.7% | 38.5%(+14.2)#55 | 46.1%(+6.60)#6,996 |
| 56. | Dacusville | 51.8% | 38.5%(+13.3)#56 | 46.1%(+5.70)#7,261 |
| 57. | Hollywood | 51.4% | 38.5%(+12.9)#57 | 46.1%(+5.30)#7,344 |
| 58. | Litchfield Beach | 51.0% | 38.5%(+12.5)#58 | 46.1%(+4.90)#7,483 |
| 59. | Goose Creek | 49.6% | 38.5%(+11.1)#59 | 46.1%(+3.50)#8,010 |
| 60. | Greenville | 49.5% | 38.5%(+11.0)#60 | 46.1%(+3.40)#8,040 |
| 61. | Dunbar | 48.8% | 38.5%(+10.3)#61 | 46.1%(+2.70)#8,261 |
| 62. | Simpsonville | 48.7% | 38.5%(+10.2)#62 | 46.1%(+2.60)#8,278 |
| 63. | Lexington | 48.5% | 38.5%(+10.00)#63 | 46.1%(+2.40)#8,337 |
| 64. | North Augusta | 48.4% | 38.5%(+9.90)#64 | 46.1%(+2.30)#8,375 |
| 65. | Windsor | 48.1% | 38.5%(+9.60)#65 | 46.1%(+2.00)#8,496 |
| 66. | North Hartsville | 47.7% | 38.5%(+9.20)#66 | 46.1%(+1.60)#8,616 |
| 67. | Ulmer | 47.6% | 38.5%(+9.10)#67 | 46.1%(+1.50)#8,676 |
| 68. | Aiken | 47.5% | 38.5%(+9.00)#68 | 46.1%(+1.40)#8,681 |
| 69. | Lake Secession | 47.5% | 38.5%(+9.00)#69 | 46.1%(+1.40)#8,694 |
| 70. | Chesnee | 47.1% | 38.5%(+8.60)#70 | 46.1%(+1.00)#8,844 |
| 71. | Modoc | 47.0% | 38.5%(+8.50)#71 | 46.1%(+0.900)#8,885 |
| 72. | Summerville | 46.5% | 38.5%(+8.00)#72 | 46.1%(+0.400)#9,052 |
| 73. | Dale | 46.4% | 38.5%(+7.90)#73 | 46.1%(+0.300)#9,114 |
| 74. | Pomaria | 46.2% | 38.5%(+7.70)#74 | 46.1%(+0.100)#9,210 |
| 75. | Hardeeville | 45.7% | 38.5%(+7.20)#75 | 46.1%(-0.400)#9,378 |
| 76. | Hanahan | 45.6% | 38.5%(+7.10)#76 | 46.1%(-0.500)#9,415 |
| 77. | Powdersville | 45.6% | 38.5%(+7.10)#77 | 46.1%(-0.500)#9,421 |
| 78. | North Myrtle Beach | 45.5% | 38.5%(+7.00)#78 | 46.1%(-0.600)#9,453 |
| 79. | Antreville | 45.5% | 38.5%(+7.00)#79 | 46.1%(-0.600)#9,493 |
| 80. | Forest Acres | 45.3% | 38.5%(+6.80)#80 | 46.1%(-0.800)#9,542 |
| 81. | Buford | 45.3% | 38.5%(+6.80)#81 | 46.1%(-0.800)#9,566 |
| 82. | Russellville | 45.0% | 38.5%(+6.50)#82 | 46.1%(-1.10)#9,710 |
| 83. | Camden | 44.4% | 38.5%(+5.90)#83 | 46.1%(-1.70)#9,898 |
| 84. | Wade Hampton | 44.3% | 38.5%(+5.80)#84 | 46.1%(-1.80)#9,951 |
| 85. | Mauldin | 44.0% | 38.5%(+5.50)#85 | 46.1%(-2.10)#10,061 |
| 86. | Grover | 43.7% | 38.5%(+5.20)#86 | 46.1%(-2.40)#10,214 |
| 87. | Floydale | 43.5% | 38.5%(+5.00)#87 | 46.1%(-2.60)#10,300 |
| 88. | Springdale | 43.3% | 38.5%(+4.80)#88 | 46.1%(-2.80)#10,357 |
| 89. | Lakewood | 43.2% | 38.5%(+4.70)#89 | 46.1%(-2.90)#10,401 |
| 90. | Murrells Inlet | 43.1% | 38.5%(+4.60)#90 | 46.1%(-3.00)#10,437 |
| 91. | Centerville | 42.8% | 38.5%(+4.30)#91 | 46.1%(-3.30)#10,564 |
| 92. | La France | 42.8% | 38.5%(+4.30)#92 | 46.1%(-3.30)#10,582 |
| 93. | Tigerville | 42.3% | 38.5%(+3.80)#93 | 46.1%(-3.80)#10,769 |
| 94. | Pine Ridge | 42.1% | 38.5%(+3.60)#94 | 46.1%(-4.00)#10,842 |
| 95. | Easley | 42.0% | 38.5%(+3.50)#95 | 46.1%(-4.10)#10,872 |
| 96. | Sharon | 42.0% | 38.5%(+3.50)#96 | 46.1%(-4.10)#10,904 |
| 97. | Murphys Estates | 41.7% | 38.5%(+3.20)#97 | 46.1%(-4.40)#11,004 |
| 98. | Mcconnells | 41.6% | 38.5%(+3.10)#98 | 46.1%(-4.50)#11,082 |
| 99. | Snelling | 41.3% | 38.5%(+2.80)#99 | 46.1%(-4.80)#11,208 |
| 100. | Prosperity | 40.8% | 38.5%(+2.30)#100 | 46.1%(-5.30)#11,461 |
Common Questions
What are the Top 10 Cities with the Highest Percentage of Families with Income Above $100,000 in South Carolina?
Top 10 Cities with the Highest Percentage of Families with Income Above $100,000 in South Carolina are:
#1
100.0%
#2
100.0%
#3
100.0%
#4
87.8%
#5
85.7%
#6
78.7%
#7
78.5%
#8
77.8%
#9
77.8%
#10
77.8%
What city has the Highest Percentage of Families with Income Above $100,000 in South Carolina?
Mountville has the Highest Percentage of Families with Income Above $100,000 in South Carolina with 100.0%.
What is the Percentage of Families with Income Above $100,000 in the State of South Carolina?
Percentage of Families with Income Above $100,000 in South Carolina is 38.5%.
What is the Percentage of Families with Income Above $100,000 in the United States?
Percentage of Families with Income Above $100,000 in the United States is 46.1%.