Cities with the Highest Percentage of Families with Income Above $100,000 in Ohio
RELATED REPORTS & OPTIONS
Family Income | $100k+
Ohio
Compare Cities
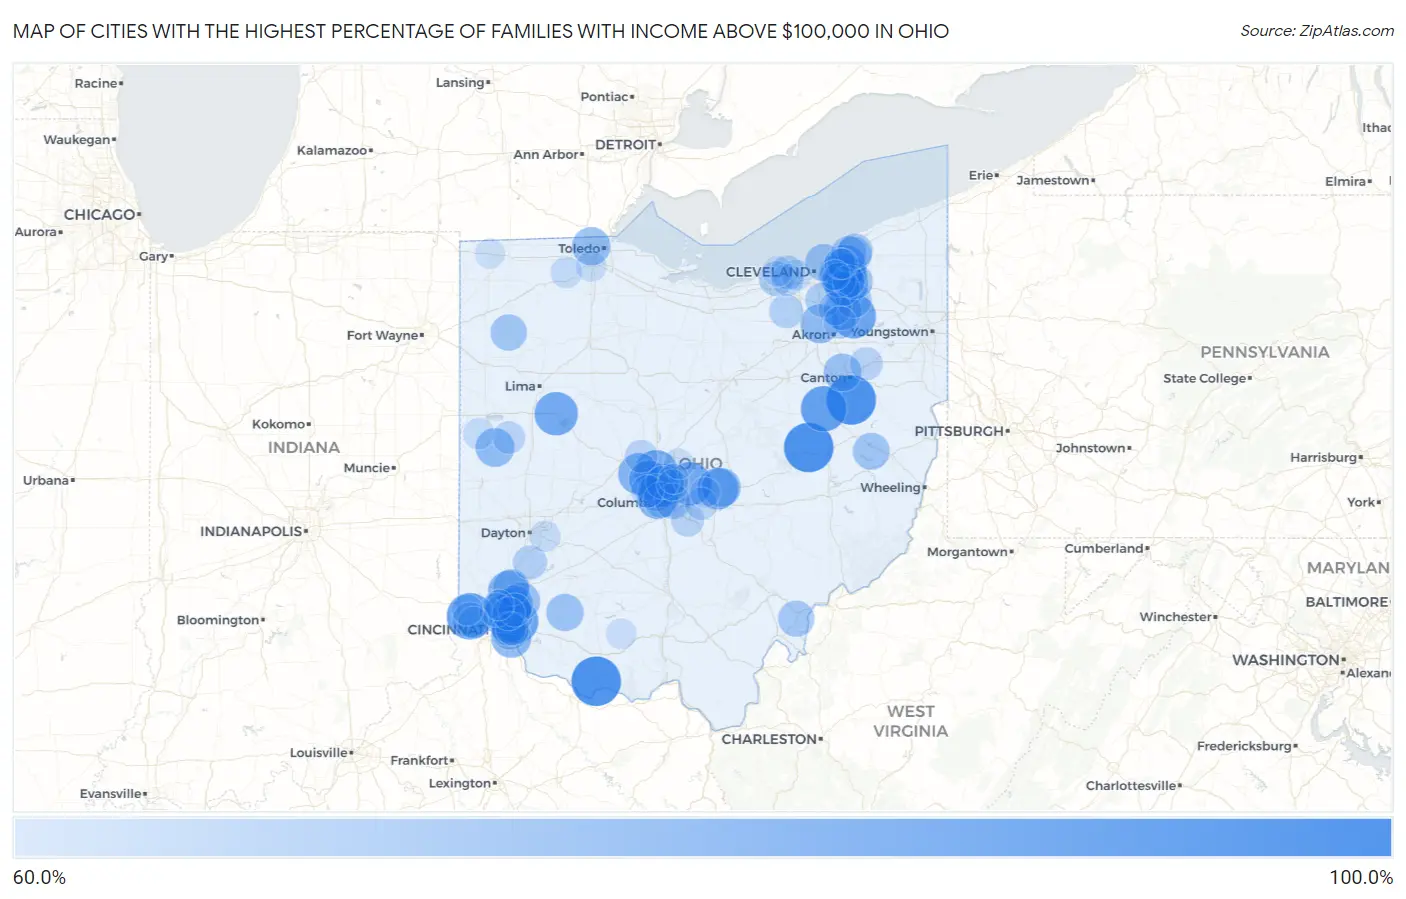
Map of Cities with the Highest Percentage of Families with Income Above $100,000 in Ohio
0.0%
100.0%
Cities with the Highest Percentage of Families with Income Above $100,000 in Ohio
| City | Families with Income > $100k | vs State | vs National | |
| 1. | Bentonville | 100.0% | 42.3%(+57.7)#1 | 46.1%(+53.9)#88 |
| 2. | New Haven Cdp Hamilton County | 100.0% | 42.3%(+57.7)#2 | 46.1%(+53.9)#149 |
| 3. | Fresno | 100.0% | 42.3%(+57.7)#3 | 46.1%(+53.9)#277 |
| 4. | Sandyville | 100.0% | 42.3%(+57.7)#4 | 46.1%(+53.9)#296 |
| 5. | Grandview | 94.4% | 42.3%(+52.1)#5 | 46.1%(+48.3)#463 |
| 6. | Dundee | 93.2% | 42.3%(+50.9)#6 | 46.1%(+47.1)#492 |
| 7. | Sugar Bush Knolls | 91.1% | 42.3%(+48.8)#7 | 46.1%(+45.0)#540 |
| 8. | Terrace Park | 90.8% | 42.3%(+48.5)#8 | 46.1%(+44.7)#549 |
| 9. | Bentleyville | 89.5% | 42.3%(+47.2)#9 | 46.1%(+43.4)#608 |
| 10. | New Hampshire | 89.3% | 42.3%(+47.0)#10 | 46.1%(+43.2)#620 |
| 11. | New Albany | 89.2% | 42.3%(+46.9)#11 | 46.1%(+43.1)#622 |
| 12. | Riverlea | 88.7% | 42.3%(+46.4)#12 | 46.1%(+42.6)#652 |
| 13. | Powell | 87.9% | 42.3%(+45.6)#13 | 46.1%(+41.8)#696 |
| 14. | Pepper Pike | 87.8% | 42.3%(+45.5)#14 | 46.1%(+41.7)#704 |
| 15. | Gates Mills | 87.4% | 42.3%(+45.1)#15 | 46.1%(+41.3)#725 |
| 16. | Granville South | 85.7% | 42.3%(+43.4)#16 | 46.1%(+39.6)#832 |
| 17. | Hunting Valley | 85.7% | 42.3%(+43.4)#17 | 46.1%(+39.6)#833 |
| 18. | New California | 85.4% | 42.3%(+43.1)#18 | 46.1%(+39.3)#861 |
| 19. | Wetherington | 85.3% | 42.3%(+43.0)#19 | 46.1%(+39.2)#870 |
| 20. | Madeira | 84.4% | 42.3%(+42.1)#20 | 46.1%(+38.3)#943 |
| 21. | Marble Cliff | 84.4% | 42.3%(+42.1)#21 | 46.1%(+38.3)#948 |
| 22. | Coldstream | 83.8% | 42.3%(+41.5)#22 | 46.1%(+37.7)#990 |
| 23. | Mariemont | 83.5% | 42.3%(+41.2)#23 | 46.1%(+37.4)#1,016 |
| 24. | Moreland Hills | 83.1% | 42.3%(+40.8)#24 | 46.1%(+37.0)#1,062 |
| 25. | Dublin | 82.7% | 42.3%(+40.4)#25 | 46.1%(+36.6)#1,095 |
| 26. | Bloomingville | 82.1% | 42.3%(+39.8)#26 | 46.1%(+36.0)#1,166 |
| 27. | Granville | 81.7% | 42.3%(+39.4)#27 | 46.1%(+35.6)#1,202 |
| 28. | Montrose Ghent | 81.6% | 42.3%(+39.3)#28 | 46.1%(+35.5)#1,215 |
| 29. | Concorde Hills | 81.5% | 42.3%(+39.2)#29 | 46.1%(+35.4)#1,228 |
| 30. | Montgomery | 81.4% | 42.3%(+39.1)#30 | 46.1%(+35.3)#1,236 |
| 31. | Yorkshire | 81.3% | 42.3%(+39.0)#31 | 46.1%(+35.2)#1,264 |
| 32. | Ottawa Hills | 80.5% | 42.3%(+38.2)#32 | 46.1%(+34.4)#1,330 |
| 33. | The Village Of Indian Hill | 80.3% | 42.3%(+38.0)#33 | 46.1%(+34.2)#1,350 |
| 34. | Evendale | 80.1% | 42.3%(+37.8)#34 | 46.1%(+34.0)#1,367 |
| 35. | Hudson | 79.7% | 42.3%(+37.4)#35 | 46.1%(+33.6)#1,407 |
| 36. | Loveland Park | 79.5% | 42.3%(+37.2)#36 | 46.1%(+33.4)#1,438 |
| 37. | Hills And Dales | 79.5% | 42.3%(+37.2)#37 | 46.1%(+33.4)#1,443 |
| 38. | Amberley | 79.3% | 42.3%(+37.0)#38 | 46.1%(+33.2)#1,469 |
| 39. | Bratenahl | 78.6% | 42.3%(+36.3)#39 | 46.1%(+32.5)#1,568 |
| 40. | St Martin | 78.6% | 42.3%(+36.3)#40 | 46.1%(+32.5)#1,572 |
| 41. | Maria Stein | 78.5% | 42.3%(+36.2)#41 | 46.1%(+32.4)#1,585 |
| 42. | Upper Arlington | 78.4% | 42.3%(+36.1)#42 | 46.1%(+32.3)#1,587 |
| 43. | Sixteen Mile Stand | 77.9% | 42.3%(+35.6)#43 | 46.1%(+31.8)#1,652 |
| 44. | Sherwood | 77.8% | 42.3%(+35.5)#44 | 46.1%(+31.7)#1,669 |
| 45. | Deersville | 77.8% | 42.3%(+35.5)#45 | 46.1%(+31.7)#1,677 |
| 46. | Four Bridges | 77.3% | 42.3%(+35.0)#46 | 46.1%(+31.2)#1,734 |
| 47. | Oakwood | 77.0% | 42.3%(+34.7)#47 | 46.1%(+30.9)#1,767 |
| 48. | Tuppers Plains | 76.7% | 42.3%(+34.4)#48 | 46.1%(+30.6)#1,816 |
| 49. | Kirtland | 76.6% | 42.3%(+34.3)#49 | 46.1%(+30.5)#1,824 |
| 50. | Jacksontown | 76.5% | 42.3%(+34.2)#50 | 46.1%(+30.4)#1,851 |
| 51. | Aurora | 76.1% | 42.3%(+33.8)#51 | 46.1%(+30.0)#1,898 |
| 52. | South Russell | 76.1% | 42.3%(+33.8)#52 | 46.1%(+30.0)#1,909 |
| 53. | Grandview Heights | 75.9% | 42.3%(+33.6)#53 | 46.1%(+29.8)#1,934 |
| 54. | Bexley | 75.6% | 42.3%(+33.3)#54 | 46.1%(+29.5)#1,974 |
| 55. | Waite Hill | 75.6% | 42.3%(+33.3)#55 | 46.1%(+29.5)#1,981 |
| 56. | Kirtland Hills | 75.2% | 42.3%(+32.9)#56 | 46.1%(+29.1)#2,043 |
| 57. | Miami Heights | 75.1% | 42.3%(+32.8)#57 | 46.1%(+29.0)#2,051 |
| 58. | Solon | 74.2% | 42.3%(+31.9)#58 | 46.1%(+28.1)#2,193 |
| 59. | Avon | 74.1% | 42.3%(+31.8)#59 | 46.1%(+28.0)#2,210 |
| 60. | Brecksville | 73.7% | 42.3%(+31.4)#60 | 46.1%(+27.6)#2,267 |
| 61. | Ridgewood | 73.7% | 42.3%(+31.4)#61 | 46.1%(+27.6)#2,274 |
| 62. | Orange | 73.4% | 42.3%(+31.1)#62 | 46.1%(+27.3)#2,311 |
| 63. | Bay Village | 73.0% | 42.3%(+30.7)#63 | 46.1%(+26.9)#2,365 |
| 64. | Turpin Hills | 73.0% | 42.3%(+30.7)#64 | 46.1%(+26.9)#2,370 |
| 65. | Five Points | 72.9% | 42.3%(+30.6)#65 | 46.1%(+26.8)#2,387 |
| 66. | Wyoming | 72.8% | 42.3%(+30.5)#66 | 46.1%(+26.7)#2,402 |
| 67. | Valley City | 72.7% | 42.3%(+30.4)#67 | 46.1%(+26.6)#2,430 |
| 68. | Dry Run | 72.2% | 42.3%(+29.9)#68 | 46.1%(+26.1)#2,513 |
| 69. | Canal Winchester | 71.5% | 42.3%(+29.2)#69 | 46.1%(+25.4)#2,638 |
| 70. | Remington | 71.5% | 42.3%(+29.2)#70 | 46.1%(+25.4)#2,648 |
| 71. | Worthington | 71.4% | 42.3%(+29.1)#71 | 46.1%(+25.3)#2,659 |
| 72. | Harrisburg | 71.4% | 42.3%(+29.1)#72 | 46.1%(+25.3)#2,668 |
| 73. | Kenwood | 71.3% | 42.3%(+29.0)#73 | 46.1%(+25.2)#2,675 |
| 74. | Boston Heights | 71.3% | 42.3%(+29.0)#74 | 46.1%(+25.2)#2,683 |
| 75. | Ostrander | 70.9% | 42.3%(+28.6)#75 | 46.1%(+24.8)#2,733 |
| 76. | Hilliard | 70.7% | 42.3%(+28.4)#76 | 46.1%(+24.6)#2,759 |
| 77. | Minster | 70.7% | 42.3%(+28.4)#77 | 46.1%(+24.6)#2,768 |
| 78. | Silver Lake | 70.3% | 42.3%(+28.0)#78 | 46.1%(+24.2)#2,838 |
| 79. | Etna | 70.3% | 42.3%(+28.0)#79 | 46.1%(+24.2)#2,841 |
| 80. | Chagrin Falls | 70.2% | 42.3%(+27.9)#80 | 46.1%(+24.1)#2,850 |
| 81. | Westlake | 69.7% | 42.3%(+27.4)#81 | 46.1%(+23.6)#2,930 |
| 82. | Bass Lake | 69.5% | 42.3%(+27.2)#82 | 46.1%(+23.4)#2,968 |
| 83. | Neapolis | 68.9% | 42.3%(+26.6)#83 | 46.1%(+22.8)#3,073 |
| 84. | Mack | 68.8% | 42.3%(+26.5)#84 | 46.1%(+22.7)#3,084 |
| 85. | St Henry | 68.4% | 42.3%(+26.1)#85 | 46.1%(+22.3)#3,170 |
| 86. | Minerva Park | 68.1% | 42.3%(+25.8)#86 | 46.1%(+22.0)#3,235 |
| 87. | Blue Jay | 68.1% | 42.3%(+25.8)#87 | 46.1%(+22.0)#3,236 |
| 88. | Beavercreek | 67.8% | 42.3%(+25.5)#88 | 46.1%(+21.7)#3,279 |
| 89. | Highland Heights | 67.8% | 42.3%(+25.5)#89 | 46.1%(+21.7)#3,287 |
| 90. | Rocky River | 67.6% | 42.3%(+25.3)#90 | 46.1%(+21.5)#3,312 |
| 91. | Perrysburg | 67.4% | 42.3%(+25.1)#91 | 46.1%(+21.3)#3,347 |
| 92. | Galena | 67.3% | 42.3%(+25.0)#92 | 46.1%(+21.2)#3,372 |
| 93. | Sinking Spring | 67.2% | 42.3%(+24.9)#93 | 46.1%(+21.1)#3,387 |
| 94. | Mayfield | 67.1% | 42.3%(+24.8)#94 | 46.1%(+21.0)#3,395 |
| 95. | Avon Lake | 67.0% | 42.3%(+24.7)#95 | 46.1%(+20.9)#3,405 |
| 96. | Glendale | 67.0% | 42.3%(+24.7)#96 | 46.1%(+20.9)#3,412 |
| 97. | Beechwood Trails | 66.8% | 42.3%(+24.5)#97 | 46.1%(+20.7)#3,441 |
| 98. | Holiday City | 66.6% | 42.3%(+24.3)#98 | 46.1%(+20.5)#3,522 |
| 99. | Westerville | 66.5% | 42.3%(+24.2)#99 | 46.1%(+20.4)#3,525 |
| 100. | Beachwood | 66.4% | 42.3%(+24.1)#100 | 46.1%(+20.3)#3,547 |
Common Questions
What are the Top 10 Cities with the Highest Percentage of Families with Income Above $100,000 in Ohio?
Top 10 Cities with the Highest Percentage of Families with Income Above $100,000 in Ohio are:
#1
100.0%
#2
100.0%
#3
100.0%
#4
94.4%
#5
93.2%
#6
91.1%
#7
90.8%
#8
89.5%
#9
89.3%
#10
89.2%
What city has the Highest Percentage of Families with Income Above $100,000 in Ohio?
Bentonville has the Highest Percentage of Families with Income Above $100,000 in Ohio with 100.0%.
What is the Percentage of Families with Income Above $100,000 in the State of Ohio?
Percentage of Families with Income Above $100,000 in Ohio is 42.3%.
What is the Percentage of Families with Income Above $100,000 in the United States?
Percentage of Families with Income Above $100,000 in the United States is 46.1%.