Cities with the Highest Percentage of Families with Income Above $100,000 in New Mexico
RELATED REPORTS & OPTIONS
Family Income | $100k+
New Mexico
Compare Cities
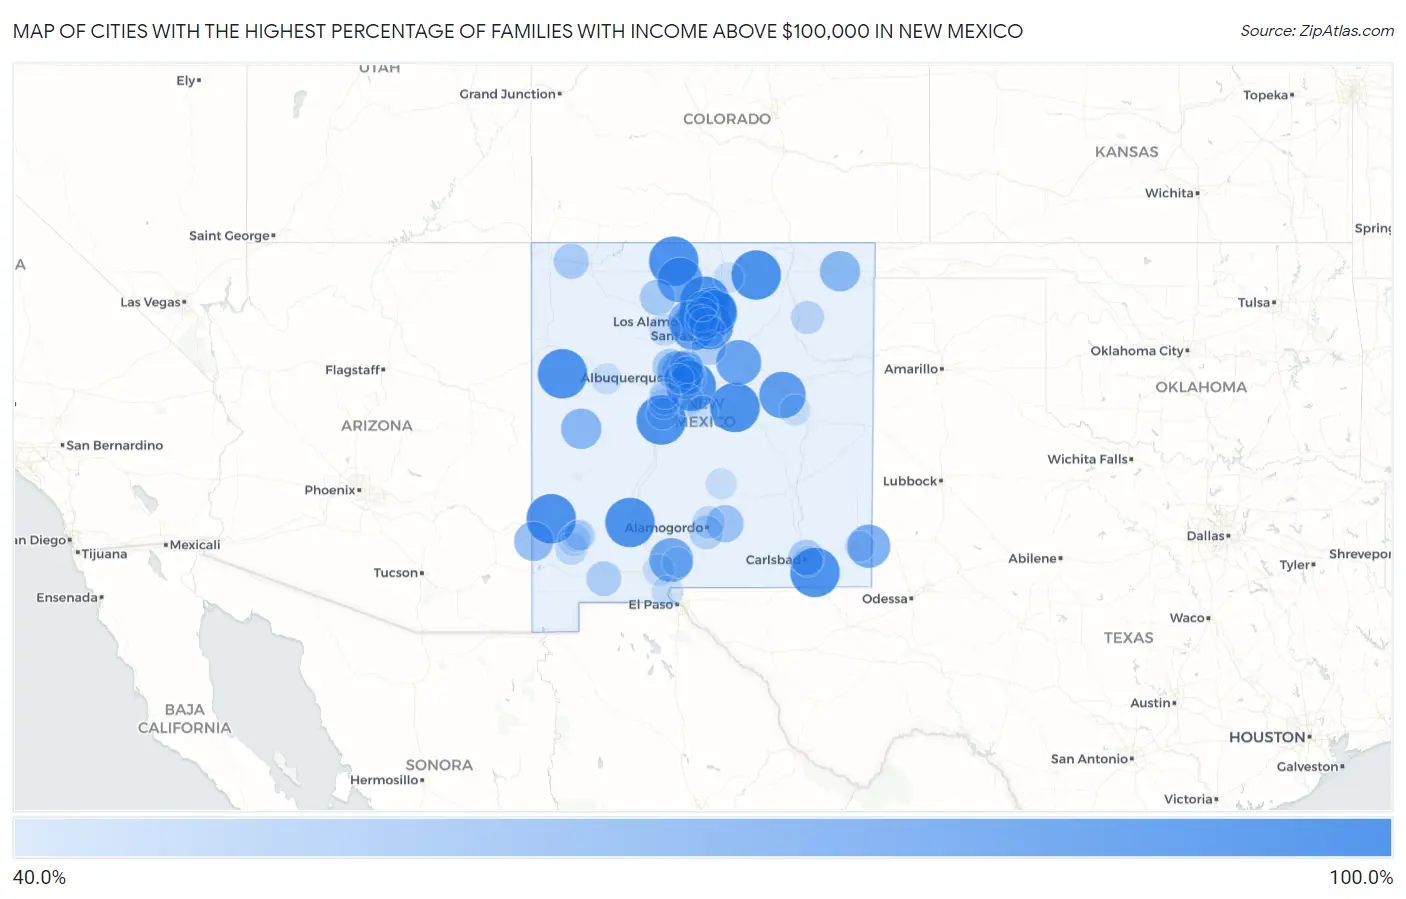
Map of Cities with the Highest Percentage of Families with Income Above $100,000 in New Mexico
0.0%
100.0%
Cities with the Highest Percentage of Families with Income Above $100,000 in New Mexico
| City | Families with Income > $100k | vs State | vs National | |
| 1. | Canova | 100.0% | 34.7%(+65.3)#1 | 46.1%(+53.9)#19 |
| 2. | Cuartelez | 100.0% | 34.7%(+65.3)#2 | 46.1%(+53.9)#28 |
| 3. | Ramah | 100.0% | 34.7%(+65.3)#3 | 46.1%(+53.9)#33 |
| 4. | Ensenada | 100.0% | 34.7%(+65.3)#4 | 46.1%(+53.9)#47 |
| 5. | Malaga | 100.0% | 34.7%(+65.3)#5 | 46.1%(+53.9)#91 |
| 6. | Cordova | 100.0% | 34.7%(+65.3)#6 | 46.1%(+53.9)#92 |
| 7. | Ute Park | 100.0% | 34.7%(+65.3)#7 | 46.1%(+53.9)#164 |
| 8. | Las Nutrias | 100.0% | 34.7%(+65.3)#8 | 46.1%(+53.9)#190 |
| 9. | Caballo | 100.0% | 34.7%(+65.3)#9 | 46.1%(+53.9)#227 |
| 10. | El Morro Valley | 100.0% | 34.7%(+65.3)#10 | 46.1%(+53.9)#241 |
| 11. | Manzano Springs | 100.0% | 34.7%(+65.3)#11 | 46.1%(+53.9)#271 |
| 12. | Punta De Agua | 100.0% | 34.7%(+65.3)#12 | 46.1%(+53.9)#278 |
| 13. | Buckhorn | 100.0% | 34.7%(+65.3)#13 | 46.1%(+53.9)#311 |
| 14. | Encino | 100.0% | 34.7%(+65.3)#14 | 46.1%(+53.9)#313 |
| 15. | Seton | 100.0% | 34.7%(+65.3)#15 | 46.1%(+53.9)#327 |
| 16. | Deer Canyon | 100.0% | 34.7%(+65.3)#16 | 46.1%(+53.9)#347 |
| 17. | Puerto De Luna | 91.8% | 34.7%(+57.1)#17 | 46.1%(+45.7)#516 |
| 18. | Chupadero | 91.8% | 34.7%(+57.1)#18 | 46.1%(+45.7)#517 |
| 19. | White Rock | 89.3% | 34.7%(+54.6)#19 | 46.1%(+43.2)#617 |
| 20. | Canjilon | 88.0% | 34.7%(+53.3)#20 | 46.1%(+41.9)#694 |
| 21. | Sena | 87.5% | 34.7%(+52.8)#21 | 46.1%(+41.4)#719 |
| 22. | Bluewater | 86.6% | 34.7%(+51.9)#22 | 46.1%(+40.5)#777 |
| 23. | Organ | 84.6% | 34.7%(+49.9)#23 | 46.1%(+38.5)#935 |
| 24. | Paa-Ko | 84.5% | 34.7%(+49.8)#24 | 46.1%(+38.4)#938 |
| 25. | Rio Chiquito | 82.9% | 34.7%(+48.2)#25 | 46.1%(+36.8)#1,081 |
| 26. | Nadine | 82.4% | 34.7%(+47.7)#26 | 46.1%(+36.3)#1,122 |
| 27. | Conejo | 82.0% | 34.7%(+47.3)#27 | 46.1%(+35.9)#1,176 |
| 28. | Fort Wingate | 81.6% | 34.7%(+46.9)#28 | 46.1%(+35.5)#1,218 |
| 29. | Truchas | 81.4% | 34.7%(+46.7)#29 | 46.1%(+35.3)#1,243 |
| 30. | Sandia Park | 80.2% | 34.7%(+45.5)#30 | 46.1%(+34.1)#1,364 |
| 31. | Las Campanas | 78.6% | 34.7%(+43.9)#31 | 46.1%(+32.5)#1,567 |
| 32. | Los Alamos | 77.2% | 34.7%(+42.5)#32 | 46.1%(+31.1)#1,748 |
| 33. | Mount Taylor | 75.5% | 34.7%(+40.8)#33 | 46.1%(+29.4)#1,997 |
| 34. | Pie Town | 75.0% | 34.7%(+40.3)#34 | 46.1%(+28.9)#2,069 |
| 35. | Grenville | 75.0% | 34.7%(+40.3)#35 | 46.1%(+28.9)#2,081 |
| 36. | Sandia Heights | 74.9% | 34.7%(+40.2)#36 | 46.1%(+28.8)#2,097 |
| 37. | Tano Road | 74.9% | 34.7%(+40.2)#37 | 46.1%(+28.8)#2,101 |
| 38. | Little Walnut | 74.5% | 34.7%(+39.8)#38 | 46.1%(+28.4)#2,163 |
| 39. | Santa Fe Foothills | 72.8% | 34.7%(+38.1)#39 | 46.1%(+26.7)#2,414 |
| 40. | Virden | 72.2% | 34.7%(+37.5)#40 | 46.1%(+26.1)#2,519 |
| 41. | Picacho Hills | 70.6% | 34.7%(+35.9)#41 | 46.1%(+24.5)#2,786 |
| 42. | Cedar Crest | 70.1% | 34.7%(+35.4)#42 | 46.1%(+24.0)#2,870 |
| 43. | Twin Forks | 66.7% | 34.7%(+32.0)#43 | 46.1%(+20.6)#3,461 |
| 44. | Hyde Park | 66.1% | 34.7%(+31.4)#44 | 46.1%(+20.0)#3,602 |
| 45. | Canada De Los Alamos | 65.4% | 34.7%(+30.7)#45 | 46.1%(+19.3)#3,761 |
| 46. | Golden Acres | 63.8% | 34.7%(+29.1)#46 | 46.1%(+17.7)#4,096 |
| 47. | Tres Arroyos | 63.5% | 34.7%(+28.8)#47 | 46.1%(+17.4)#4,151 |
| 48. | Gallina | 62.3% | 34.7%(+27.6)#48 | 46.1%(+16.2)#4,439 |
| 49. | La Huerta | 62.0% | 34.7%(+27.3)#49 | 46.1%(+15.9)#4,495 |
| 50. | Catalpa Canyon | 61.5% | 34.7%(+26.8)#50 | 46.1%(+15.4)#4,615 |
| 51. | Kirtland | 61.3% | 34.7%(+26.6)#51 | 46.1%(+15.2)#4,670 |
| 52. | Corrales | 60.1% | 34.7%(+25.4)#52 | 46.1%(+14.0)#4,912 |
| 53. | Sunshine | 60.0% | 34.7%(+25.3)#53 | 46.1%(+13.9)#4,956 |
| 54. | Eldorado At Santa Fe | 59.9% | 34.7%(+25.2)#54 | 46.1%(+13.8)#5,009 |
| 55. | Sombrillo | 59.0% | 34.7%(+24.3)#55 | 46.1%(+12.9)#5,236 |
| 56. | Sedillo | 58.9% | 34.7%(+24.2)#56 | 46.1%(+12.8)#5,259 |
| 57. | Edith Enclave | 58.9% | 34.7%(+24.2)#57 | 46.1%(+12.8)#5,263 |
| 58. | La Tierra | 58.5% | 34.7%(+23.8)#58 | 46.1%(+12.4)#5,361 |
| 59. | Placitas Cdp Sandoval County | 58.2% | 34.7%(+23.5)#59 | 46.1%(+12.1)#5,419 |
| 60. | Cedro | 57.0% | 34.7%(+22.3)#60 | 46.1%(+10.9)#5,737 |
| 61. | Boles Acres | 56.9% | 34.7%(+22.2)#61 | 46.1%(+10.8)#5,745 |
| 62. | La Madera | 56.1% | 34.7%(+21.4)#62 | 46.1%(+10.0)#5,973 |
| 63. | Roy | 55.6% | 34.7%(+20.9)#63 | 46.1%(+9.50)#6,119 |
| 64. | Jaconita | 54.9% | 34.7%(+20.2)#64 | 46.1%(+8.80)#6,318 |
| 65. | Fruitland | 54.9% | 34.7%(+20.2)#65 | 46.1%(+8.80)#6,319 |
| 66. | La Luz | 54.4% | 34.7%(+19.7)#66 | 46.1%(+8.30)#6,463 |
| 67. | Sandia Knolls | 54.2% | 34.7%(+19.5)#67 | 46.1%(+8.10)#6,533 |
| 68. | Timberlake | 53.9% | 34.7%(+19.2)#68 | 46.1%(+7.80)#6,631 |
| 69. | Tajique | 53.2% | 34.7%(+18.5)#69 | 46.1%(+7.10)#6,840 |
| 70. | El Cerro | 53.1% | 34.7%(+18.4)#70 | 46.1%(+7.00)#6,853 |
| 71. | White Signal | 53.1% | 34.7%(+18.4)#71 | 46.1%(+7.00)#6,873 |
| 72. | Canon | 52.9% | 34.7%(+18.2)#72 | 46.1%(+6.80)#6,938 |
| 73. | Cuyamungue Grant | 52.8% | 34.7%(+18.1)#73 | 46.1%(+6.70)#6,965 |
| 74. | Tyrone | 52.5% | 34.7%(+17.8)#74 | 46.1%(+6.40)#7,042 |
| 75. | Jemez Springs | 52.5% | 34.7%(+17.8)#75 | 46.1%(+6.40)#7,045 |
| 76. | Casa Colorada | 52.1% | 34.7%(+17.4)#76 | 46.1%(+6.00)#7,179 |
| 77. | Mesilla | 51.4% | 34.7%(+16.7)#77 | 46.1%(+5.30)#7,349 |
| 78. | La Union | 51.1% | 34.7%(+16.4)#78 | 46.1%(+5.00)#7,462 |
| 79. | Canones | 51.1% | 34.7%(+16.4)#79 | 46.1%(+5.00)#7,474 |
| 80. | Rosedale | 51.0% | 34.7%(+16.3)#80 | 46.1%(+4.90)#7,499 |
| 81. | Willard | 50.6% | 34.7%(+15.9)#81 | 46.1%(+4.50)#7,618 |
| 82. | Barton | 50.2% | 34.7%(+15.5)#82 | 46.1%(+4.10)#7,739 |
| 83. | Rio Rancho Estates | 50.2% | 34.7%(+15.5)#83 | 46.1%(+4.10)#7,740 |
| 84. | Nogal | 50.0% | 34.7%(+15.3)#84 | 46.1%(+3.90)#7,851 |
| 85. | Lake Sumner | 50.0% | 34.7%(+15.3)#85 | 46.1%(+3.90)#7,864 |
| 86. | Anzac Village | 50.0% | 34.7%(+15.3)#86 | 46.1%(+3.90)#7,900 |
| 87. | Tesuque | 49.7% | 34.7%(+15.0)#87 | 46.1%(+3.60)#7,999 |
| 88. | Arenas Valley | 49.7% | 34.7%(+15.0)#88 | 46.1%(+3.60)#8,000 |
| 89. | Livingston Wheeler | 49.6% | 34.7%(+14.9)#89 | 46.1%(+3.50)#8,030 |
| 90. | White Sands | 49.4% | 34.7%(+14.7)#90 | 46.1%(+3.30)#8,083 |
| 91. | Cañoncito | 49.3% | 34.7%(+14.6)#91 | 46.1%(+3.20)#8,120 |
| 92. | Adelino | 49.1% | 34.7%(+14.4)#92 | 46.1%(+3.00)#8,171 |
| 93. | Monument | 49.1% | 34.7%(+14.4)#93 | 46.1%(+3.00)#8,176 |
| 94. | San Jose Cdp San Miguel County | 48.8% | 34.7%(+14.1)#94 | 46.1%(+2.70)#8,275 |
| 95. | Bosque Farms | 48.7% | 34.7%(+14.0)#95 | 46.1%(+2.60)#8,284 |
| 96. | Arroyo Seco | 48.6% | 34.7%(+13.9)#96 | 46.1%(+2.50)#8,316 |
| 97. | Sunlit Hills | 48.6% | 34.7%(+13.9)#97 | 46.1%(+2.50)#8,324 |
| 98. | Ojo Sarco | 48.1% | 34.7%(+13.4)#98 | 46.1%(+2.00)#8,497 |
| 99. | Carnuel | 48.0% | 34.7%(+13.3)#99 | 46.1%(+1.90)#8,526 |
| 100. | La Villita | 47.9% | 34.7%(+13.2)#100 | 46.1%(+1.80)#8,553 |
Common Questions
What are the Top 10 Cities with the Highest Percentage of Families with Income Above $100,000 in New Mexico?
Top 10 Cities with the Highest Percentage of Families with Income Above $100,000 in New Mexico are:
#1
100.0%
#2
100.0%
#3
100.0%
#4
100.0%
#5
100.0%
#6
100.0%
#7
100.0%
#8
100.0%
#9
100.0%
#10
100.0%
What city has the Highest Percentage of Families with Income Above $100,000 in New Mexico?
Canova has the Highest Percentage of Families with Income Above $100,000 in New Mexico with 100.0%.
What is the Percentage of Families with Income Above $100,000 in the State of New Mexico?
Percentage of Families with Income Above $100,000 in New Mexico is 34.7%.
What is the Percentage of Families with Income Above $100,000 in the United States?
Percentage of Families with Income Above $100,000 in the United States is 46.1%.