Cities with the Highest Percentage of Families with Income Above $100,000 in Pennsylvania
RELATED REPORTS & OPTIONS
Family Income | $100k+
Pennsylvania
Compare Cities
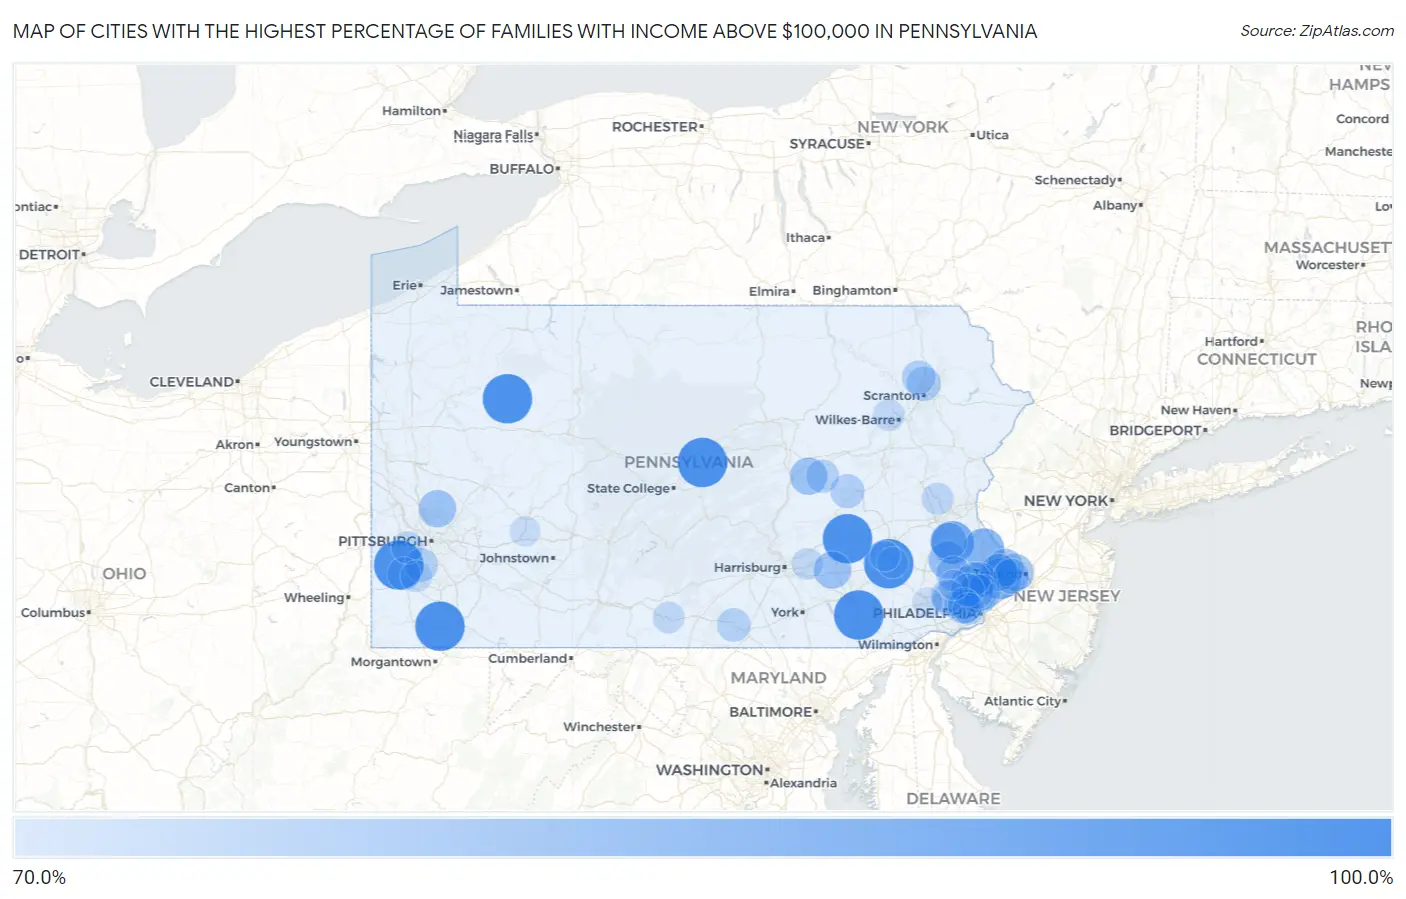
Map of Cities with the Highest Percentage of Families with Income Above $100,000 in Pennsylvania
0.0%
100.0%
Cities with the Highest Percentage of Families with Income Above $100,000 in Pennsylvania
| City | Families with Income > $100k | vs State | vs National | |
| 1. | Refton | 100.0% | 46.6%(+53.4)#1 | 46.1%(+53.9)#15 |
| 2. | Pennwyn | 100.0% | 46.6%(+53.4)#2 | 46.1%(+53.9)#24 |
| 3. | Roots | 100.0% | 46.6%(+53.4)#3 | 46.1%(+53.9)#80 |
| 4. | Hublersburg | 100.0% | 46.6%(+53.4)#4 | 46.1%(+53.9)#125 |
| 5. | Yarnell | 100.0% | 46.6%(+53.4)#5 | 46.1%(+53.9)#138 |
| 6. | Gray | 100.0% | 46.6%(+53.4)#6 | 46.1%(+53.9)#170 |
| 7. | Tylersburg | 100.0% | 46.6%(+53.4)#7 | 46.1%(+53.9)#179 |
| 8. | Frystown | 100.0% | 46.6%(+53.4)#8 | 46.1%(+53.9)#257 |
| 9. | Geeseytown | 100.0% | 46.6%(+53.4)#9 | 46.1%(+53.9)#259 |
| 10. | Culp | 100.0% | 46.6%(+53.4)#10 | 46.1%(+53.9)#267 |
| 11. | Olivia | 100.0% | 46.6%(+53.4)#11 | 46.1%(+53.9)#282 |
| 12. | Ronco | 100.0% | 46.6%(+53.4)#13 | 46.1%(+53.9)#300 |
| 13. | Westland | 100.0% | 46.6%(+53.4)#14 | 46.1%(+53.9)#303 |
| 14. | Seven Springs Borough | 100.0% | 46.6%(+53.4)#15 | 46.1%(+53.9)#305 |
| 15. | Klahr | 100.0% | 46.6%(+53.4)#16 | 46.1%(+53.9)#325 |
| 16. | Green Hills Borough | 100.0% | 46.6%(+53.4)#17 | 46.1%(+53.9)#412 |
| 17. | Villanova | 92.4% | 46.6%(+45.8)#18 | 46.1%(+46.3)#505 |
| 18. | Carlisle Barracks | 91.7% | 46.6%(+45.1)#19 | 46.1%(+45.6)#522 |
| 19. | Milford Square | 90.1% | 46.6%(+43.5)#20 | 46.1%(+44.0)#578 |
| 20. | Rosslyn Farms Borough | 89.9% | 46.6%(+43.3)#21 | 46.1%(+43.8)#594 |
| 21. | Chadds Ford | 89.2% | 46.6%(+42.6)#22 | 46.1%(+43.1)#623 |
| 22. | Thornburg Borough | 89.0% | 46.6%(+42.4)#23 | 46.1%(+42.9)#640 |
| 23. | Merion Station | 87.4% | 46.6%(+40.8)#24 | 46.1%(+41.3)#722 |
| 24. | Plumsteadville | 87.4% | 46.6%(+40.8)#25 | 46.1%(+41.3)#724 |
| 25. | Churchville | 87.3% | 46.6%(+40.7)#26 | 46.1%(+41.2)#726 |
| 26. | Shellytown | 87.0% | 46.6%(+40.4)#27 | 46.1%(+40.9)#751 |
| 27. | Rose Valley Borough | 86.6% | 46.6%(+40.0)#28 | 46.1%(+40.5)#776 |
| 28. | Dilworthtown | 86.3% | 46.6%(+39.7)#29 | 46.1%(+40.2)#797 |
| 29. | West Conshohocken Borough | 84.9% | 46.6%(+38.3)#30 | 46.1%(+38.8)#904 |
| 30. | Bradford Woods Borough | 84.7% | 46.6%(+38.1)#31 | 46.1%(+38.6)#922 |
| 31. | Larke | 84.2% | 46.6%(+37.6)#32 | 46.1%(+38.1)#960 |
| 32. | Fox Chapel Borough | 83.5% | 46.6%(+36.9)#33 | 46.1%(+37.4)#1,014 |
| 33. | New Morgan Borough | 83.4% | 46.6%(+36.8)#34 | 46.1%(+37.3)#1,030 |
| 34. | Woxall | 83.1% | 46.6%(+36.5)#35 | 46.1%(+37.0)#1,064 |
| 35. | Bear Creek Village Borough | 83.0% | 46.6%(+36.4)#36 | 46.1%(+36.9)#1,074 |
| 36. | Blue Bell | 82.8% | 46.6%(+36.2)#37 | 46.1%(+36.7)#1,087 |
| 37. | Ben Avon Heights Borough | 82.7% | 46.6%(+36.1)#38 | 46.1%(+36.6)#1,098 |
| 38. | Haverford College | 82.6% | 46.6%(+36.0)#39 | 46.1%(+36.5)#1,103 |
| 39. | Snydertown | 82.5% | 46.6%(+35.9)#40 | 46.1%(+36.4)#1,112 |
| 40. | Wyndmoor | 82.4% | 46.6%(+35.8)#41 | 46.1%(+36.3)#1,116 |
| 41. | Bakerstown | 82.4% | 46.6%(+35.8)#42 | 46.1%(+36.3)#1,118 |
| 42. | Woodside | 82.4% | 46.6%(+35.8)#43 | 46.1%(+36.3)#1,119 |
| 43. | Newtown Grant | 82.3% | 46.6%(+35.7)#44 | 46.1%(+36.2)#1,130 |
| 44. | Richboro | 82.2% | 46.6%(+35.6)#45 | 46.1%(+36.1)#1,141 |
| 45. | Mount Gretna Heights | 82.2% | 46.6%(+35.6)#46 | 46.1%(+36.1)#1,148 |
| 46. | Newtown Borough | 81.9% | 46.6%(+35.3)#47 | 46.1%(+35.8)#1,182 |
| 47. | Spinnerstown | 81.5% | 46.6%(+34.9)#48 | 46.1%(+35.4)#1,225 |
| 48. | Narberth Borough | 80.6% | 46.6%(+34.0)#49 | 46.1%(+34.5)#1,322 |
| 49. | Maple Glen | 80.4% | 46.6%(+33.8)#50 | 46.1%(+34.3)#1,341 |
| 50. | Edgeworth Borough | 80.4% | 46.6%(+33.8)#51 | 46.1%(+34.3)#1,345 |
| 51. | Swarthmore Borough | 80.2% | 46.6%(+33.6)#52 | 46.1%(+34.1)#1,356 |
| 52. | Wyncote | 80.2% | 46.6%(+33.6)#53 | 46.1%(+34.1)#1,360 |
| 53. | Langhorne Manor Borough | 79.7% | 46.6%(+33.1)#54 | 46.1%(+33.6)#1,414 |
| 54. | Devon | 79.5% | 46.6%(+32.9)#55 | 46.1%(+33.4)#1,437 |
| 55. | Skippack | 79.4% | 46.6%(+32.8)#56 | 46.1%(+33.3)#1,450 |
| 56. | St. Davids | 79.2% | 46.6%(+32.6)#57 | 46.1%(+33.1)#1,482 |
| 57. | Woodbourne | 79.2% | 46.6%(+32.6)#58 | 46.1%(+33.1)#1,483 |
| 58. | Elkins Park | 79.0% | 46.6%(+32.4)#59 | 46.1%(+32.9)#1,505 |
| 59. | Flourtown | 78.9% | 46.6%(+32.3)#60 | 46.1%(+32.8)#1,522 |
| 60. | Sewickley Heights Borough | 78.9% | 46.6%(+32.3)#61 | 46.1%(+32.8)#1,526 |
| 61. | Collegeville Borough | 78.5% | 46.6%(+31.9)#62 | 46.1%(+32.4)#1,580 |
| 62. | Jenkintown Borough | 78.4% | 46.6%(+31.8)#63 | 46.1%(+32.3)#1,588 |
| 63. | Frazer | 78.2% | 46.6%(+31.6)#64 | 46.1%(+32.1)#1,612 |
| 64. | Chinchilla | 78.1% | 46.6%(+31.5)#65 | 46.1%(+32.0)#1,624 |
| 65. | Franklin Park Borough | 77.9% | 46.6%(+31.3)#66 | 46.1%(+31.8)#1,649 |
| 66. | Swedeland | 77.8% | 46.6%(+31.2)#67 | 46.1%(+31.7)#1,671 |
| 67. | Fountain Springs | 77.8% | 46.6%(+31.2)#68 | 46.1%(+31.7)#1,673 |
| 68. | Waverly | 77.5% | 46.6%(+30.9)#69 | 46.1%(+31.4)#1,707 |
| 69. | Spring House | 77.3% | 46.6%(+30.7)#70 | 46.1%(+31.2)#1,733 |
| 70. | Mcknightstown | 77.1% | 46.6%(+30.5)#71 | 46.1%(+31.0)#1,761 |
| 71. | Ardmore | 77.0% | 46.6%(+30.4)#72 | 46.1%(+30.9)#1,766 |
| 72. | Chesterbrook | 76.9% | 46.6%(+30.3)#73 | 46.1%(+30.8)#1,784 |
| 73. | Mcmurray | 76.8% | 46.6%(+30.2)#74 | 46.1%(+30.7)#1,798 |
| 74. | Elysburg | 76.6% | 46.6%(+30.0)#75 | 46.1%(+30.5)#1,830 |
| 75. | Meadowlands | 76.5% | 46.6%(+29.9)#76 | 46.1%(+30.4)#1,853 |
| 76. | New Hope Borough | 76.3% | 46.6%(+29.7)#77 | 46.1%(+30.2)#1,877 |
| 77. | Plymouth Meeting | 76.2% | 46.6%(+29.6)#78 | 46.1%(+30.1)#1,892 |
| 78. | Sewickley Hills Borough | 76.0% | 46.6%(+29.4)#79 | 46.1%(+29.9)#1,924 |
| 79. | Pinecroft | 75.9% | 46.6%(+29.3)#80 | 46.1%(+29.8)#1,941 |
| 80. | New Britain Borough | 75.2% | 46.6%(+28.6)#81 | 46.1%(+29.1)#2,038 |
| 81. | Bell Acres Borough | 75.2% | 46.6%(+28.6)#82 | 46.1%(+29.1)#2,041 |
| 82. | Noblestown | 75.2% | 46.6%(+28.6)#83 | 46.1%(+29.1)#2,044 |
| 83. | Laurys Station | 74.9% | 46.6%(+28.3)#84 | 46.1%(+28.8)#2,104 |
| 84. | Bryn Mawr | 74.8% | 46.6%(+28.2)#85 | 46.1%(+28.7)#2,113 |
| 85. | Penn Wynne | 74.6% | 46.6%(+28.0)#86 | 46.1%(+28.5)#2,140 |
| 86. | Chase | 74.6% | 46.6%(+28.0)#87 | 46.1%(+28.5)#2,146 |
| 87. | Wylandville | 74.6% | 46.6%(+28.0)#88 | 46.1%(+28.5)#2,147 |
| 88. | Fort Loudon | 74.5% | 46.6%(+27.9)#89 | 46.1%(+28.4)#2,167 |
| 89. | Union Deposit | 74.3% | 46.6%(+27.7)#90 | 46.1%(+28.2)#2,190 |
| 90. | Grill | 73.7% | 46.6%(+27.1)#91 | 46.1%(+27.6)#2,273 |
| 91. | Casanova | 73.7% | 46.6%(+27.1)#92 | 46.1%(+27.6)#2,277 |
| 92. | Manor Borough | 73.5% | 46.6%(+26.9)#93 | 46.1%(+27.4)#2,291 |
| 93. | Malvern Borough | 73.4% | 46.6%(+26.8)#94 | 46.1%(+27.3)#2,312 |
| 94. | Seven Fields Borough | 72.9% | 46.6%(+26.3)#95 | 46.1%(+26.8)#2,385 |
| 95. | Graceton | 72.9% | 46.6%(+26.3)#96 | 46.1%(+26.8)#2,396 |
| 96. | Yardley Borough | 72.7% | 46.6%(+26.1)#97 | 46.1%(+26.6)#2,426 |
| 97. | Exton | 72.6% | 46.6%(+26.0)#98 | 46.1%(+26.5)#2,449 |
| 98. | Trooper | 72.6% | 46.6%(+26.0)#99 | 46.1%(+26.5)#2,451 |
| 99. | Whitfield | 72.3% | 46.6%(+25.7)#100 | 46.1%(+26.2)#2,492 |
| 100. | Mckinley | 72.1% | 46.6%(+25.5)#101 | 46.1%(+26.0)#2,530 |
Common Questions
What are the Top 10 Cities with the Highest Percentage of Families with Income Above $100,000 in Pennsylvania?
Top 10 Cities with the Highest Percentage of Families with Income Above $100,000 in Pennsylvania are:
#1
100.0%
#2
100.0%
#3
100.0%
#4
100.0%
#5
100.0%
#6
100.0%
#7
100.0%
#8
90.1%
#9
87.4%
#10
87.3%
What city has the Highest Percentage of Families with Income Above $100,000 in Pennsylvania?
Refton has the Highest Percentage of Families with Income Above $100,000 in Pennsylvania with 100.0%.
What is the Percentage of Families with Income Above $100,000 in the State of Pennsylvania?
Percentage of Families with Income Above $100,000 in Pennsylvania is 46.6%.
What is the Percentage of Families with Income Above $100,000 in the United States?
Percentage of Families with Income Above $100,000 in the United States is 46.1%.