Cities with the Highest Percentage of Families with Income Above $100,000 in New Hampshire
RELATED REPORTS & OPTIONS
Family Income | $100k+
New Hampshire
Compare Cities
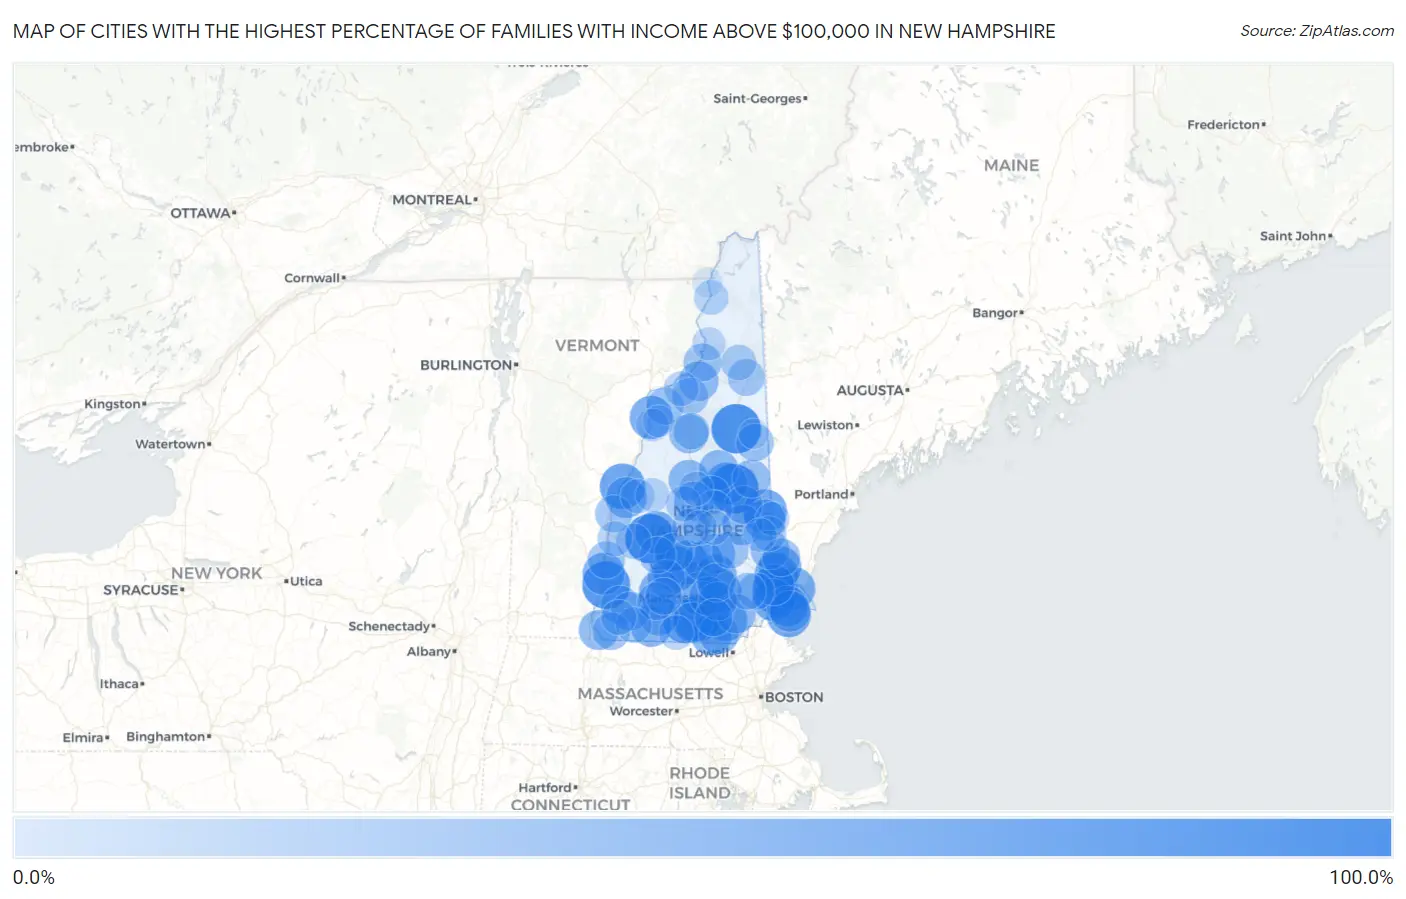
Map of Cities with the Highest Percentage of Families with Income Above $100,000 in New Hampshire
0.0%
100.0%
Cities with the Highest Percentage of Families with Income Above $100,000 in New Hampshire
| City | Families with Income > $100k | vs State | vs National | |
| 1. | Bartlett | 100.0% | 57.1%(+42.9)#1 | 46.1%(+53.9)#58 |
| 2. | New Boston | 100.0% | 57.1%(+42.9)#2 | 46.1%(+53.9)#73 |
| 3. | Melvin Village | 100.0% | 57.1%(+42.9)#3 | 46.1%(+53.9)#157 |
| 4. | Blodgett Landing | 100.0% | 57.1%(+42.9)#4 | 46.1%(+53.9)#167 |
| 5. | Walpole | 91.7% | 57.1%(+34.6)#5 | 46.1%(+45.6)#523 |
| 6. | Amherst | 81.9% | 57.1%(+24.8)#6 | 46.1%(+35.8)#1,185 |
| 7. | Newfields | 79.8% | 57.1%(+22.7)#7 | 46.1%(+33.7)#1,405 |
| 8. | Henniker | 79.6% | 57.1%(+22.5)#8 | 46.1%(+33.5)#1,426 |
| 9. | Hanover | 78.7% | 57.1%(+21.6)#9 | 46.1%(+32.6)#1,544 |
| 10. | Seabrook Beach | 72.9% | 57.1%(+15.8)#10 | 46.1%(+26.8)#2,390 |
| 11. | Sanbornville | 72.1% | 57.1%(+15.0)#11 | 46.1%(+26.0)#2,534 |
| 12. | Wilton | 71.8% | 57.1%(+14.7)#12 | 46.1%(+25.7)#2,589 |
| 13. | Contoocook | 70.8% | 57.1%(+13.7)#13 | 46.1%(+24.7)#2,752 |
| 14. | Goffstown | 69.5% | 57.1%(+12.4)#14 | 46.1%(+23.4)#2,964 |
| 15. | Durham | 69.0% | 57.1%(+11.9)#15 | 46.1%(+22.9)#3,044 |
| 16. | Woodsville | 67.3% | 57.1%(+10.2)#16 | 46.1%(+21.2)#3,371 |
| 17. | Portsmouth | 67.2% | 57.1%(+10.1)#17 | 46.1%(+21.1)#3,379 |
| 18. | South Hooksett | 66.5% | 57.1%(+9.40)#18 | 46.1%(+20.4)#3,533 |
| 19. | Dover | 66.2% | 57.1%(+9.10)#19 | 46.1%(+20.1)#3,568 |
| 20. | New London | 65.6% | 57.1%(+8.50)#20 | 46.1%(+19.5)#3,717 |
| 21. | Exeter | 65.3% | 57.1%(+8.20)#21 | 46.1%(+19.2)#3,771 |
| 22. | Londonderry | 63.6% | 57.1%(+6.50)#22 | 46.1%(+17.5)#4,125 |
| 23. | Suissevale | 63.0% | 57.1%(+5.90)#23 | 46.1%(+16.9)#4,267 |
| 24. | North Walpole | 62.8% | 57.1%(+5.70)#24 | 46.1%(+16.7)#4,317 |
| 25. | Antrim | 61.2% | 57.1%(+4.10)#25 | 46.1%(+15.1)#4,689 |
| 26. | Klondike Corner | 59.4% | 57.1%(+2.30)#26 | 46.1%(+13.3)#5,132 |
| 27. | Hampton | 58.1% | 57.1%(+1.000)#27 | 46.1%(+12.0)#5,432 |
| 28. | Union | 58.1% | 57.1%(+1.000)#28 | 46.1%(+12.0)#5,448 |
| 29. | Jaffrey | 57.3% | 57.1%(+0.200)#29 | 46.1%(+11.2)#5,632 |
| 30. | Hampton Beach | 56.8% | 57.1%(-0.300)#30 | 46.1%(+10.7)#5,769 |
| 31. | Newmarket | 56.7% | 57.1%(-0.400)#31 | 46.1%(+10.6)#5,789 |
| 32. | Suncook | 56.3% | 57.1%(-0.800)#32 | 46.1%(+10.2)#5,891 |
| 33. | Lebanon | 55.9% | 57.1%(-1.20)#33 | 46.1%(+9.80)#6,016 |
| 34. | Nashua | 55.6% | 57.1%(-1.50)#34 | 46.1%(+9.50)#6,094 |
| 35. | Alton | 54.3% | 57.1%(-2.80)#35 | 46.1%(+8.20)#6,512 |
| 36. | Plymouth | 53.6% | 57.1%(-3.50)#36 | 46.1%(+7.50)#6,706 |
| 37. | Milford | 53.3% | 57.1%(-3.80)#37 | 46.1%(+7.20)#6,786 |
| 38. | Hudson | 53.2% | 57.1%(-3.90)#38 | 46.1%(+7.10)#6,820 |
| 39. | Loudon | 52.2% | 57.1%(-4.90)#39 | 46.1%(+6.10)#7,138 |
| 40. | Hinsdale | 51.6% | 57.1%(-5.50)#40 | 46.1%(+5.50)#7,308 |
| 41. | Center Sandwich | 51.0% | 57.1%(-6.10)#41 | 46.1%(+4.90)#7,501 |
| 42. | Concord | 50.9% | 57.1%(-6.20)#42 | 46.1%(+4.80)#7,506 |
| 43. | Peterborough | 49.6% | 57.1%(-7.50)#43 | 46.1%(+3.50)#8,025 |
| 44. | Whitefield | 48.6% | 57.1%(-8.50)#44 | 46.1%(+2.50)#8,319 |
| 45. | Pinardville | 48.5% | 57.1%(-8.60)#45 | 46.1%(+2.40)#8,346 |
| 46. | Derry | 48.4% | 57.1%(-8.70)#46 | 46.1%(+2.30)#8,376 |
| 47. | New Hampton | 47.6% | 57.1%(-9.50)#47 | 46.1%(+1.50)#8,670 |
| 48. | North Woodstock | 46.5% | 57.1%(-10.6)#48 | 46.1%(+0.400)#9,085 |
| 49. | Rochester | 46.0% | 57.1%(-11.1)#49 | 46.1%(-0.100)#9,252 |
| 50. | Warner | 45.7% | 57.1%(-11.4)#50 | 46.1%(-0.400)#9,400 |
| 51. | Francestown | 45.2% | 57.1%(-11.9)#51 | 46.1%(-0.900)#9,624 |
| 52. | Keene | 44.8% | 57.1%(-12.3)#52 | 46.1%(-1.30)#9,763 |
| 53. | Marlborough | 44.8% | 57.1%(-12.3)#53 | 46.1%(-1.30)#9,786 |
| 54. | Manchester | 44.6% | 57.1%(-12.5)#54 | 46.1%(-1.50)#9,835 |
| 55. | Meredith | 43.9% | 57.1%(-13.2)#55 | 46.1%(-2.20)#10,111 |
| 56. | Hooksett | 43.8% | 57.1%(-13.3)#56 | 46.1%(-2.30)#10,149 |
| 57. | Hillsborough | 42.1% | 57.1%(-15.0)#57 | 46.1%(-4.00)#10,847 |
| 58. | Wolfeboro | 41.6% | 57.1%(-15.5)#58 | 46.1%(-4.50)#11,060 |
| 59. | Franklin | 41.4% | 57.1%(-15.7)#59 | 46.1%(-4.70)#11,124 |
| 60. | Lancaster | 41.4% | 57.1%(-15.7)#60 | 46.1%(-4.70)#11,136 |
| 61. | Center Ossipee | 41.4% | 57.1%(-15.7)#61 | 46.1%(-4.70)#11,146 |
| 62. | Somersworth | 41.1% | 57.1%(-16.0)#62 | 46.1%(-5.00)#11,278 |
| 63. | Hancock | 40.3% | 57.1%(-16.8)#63 | 46.1%(-5.80)#11,734 |
| 64. | East Merrimack | 40.2% | 57.1%(-16.9)#64 | 46.1%(-5.90)#11,746 |
| 65. | Conway | 40.0% | 57.1%(-17.1)#65 | 46.1%(-6.10)#11,820 |
| 66. | Winchester | 39.4% | 57.1%(-17.7)#66 | 46.1%(-6.70)#12,149 |
| 67. | Lisbon | 37.9% | 57.1%(-19.2)#67 | 46.1%(-8.20)#12,898 |
| 68. | Plainfield | 37.8% | 57.1%(-19.3)#68 | 46.1%(-8.30)#12,961 |
| 69. | Laconia | 37.6% | 57.1%(-19.5)#69 | 46.1%(-8.50)#13,014 |
| 70. | Charlestown | 37.4% | 57.1%(-19.7)#70 | 46.1%(-8.70)#13,181 |
| 71. | Bennington | 36.5% | 57.1%(-20.6)#71 | 46.1%(-9.60)#13,648 |
| 72. | Bethlehem | 36.4% | 57.1%(-20.7)#72 | 46.1%(-9.70)#13,677 |
| 73. | Pittsfield | 36.2% | 57.1%(-20.9)#73 | 46.1%(-9.90)#13,781 |
| 74. | Bradford | 36.0% | 57.1%(-21.1)#74 | 46.1%(-10.1)#13,907 |
| 75. | Gorham | 35.8% | 57.1%(-21.3)#75 | 46.1%(-10.3)#14,003 |
| 76. | Epping | 35.6% | 57.1%(-21.5)#76 | 46.1%(-10.5)#14,109 |
| 77. | Raymond | 35.2% | 57.1%(-21.9)#77 | 46.1%(-10.9)#14,298 |
| 78. | Lincoln | 32.8% | 57.1%(-24.3)#78 | 46.1%(-13.3)#15,656 |
| 79. | Troy | 30.0% | 57.1%(-27.1)#79 | 46.1%(-16.1)#17,304 |
| 80. | Newport | 29.0% | 57.1%(-28.1)#80 | 46.1%(-17.1)#17,899 |
| 81. | Berlin | 28.8% | 57.1%(-28.3)#81 | 46.1%(-17.3)#18,004 |
| 82. | Bristol | 28.4% | 57.1%(-28.7)#82 | 46.1%(-17.7)#18,291 |
| 83. | West Swanzey | 28.0% | 57.1%(-29.1)#83 | 46.1%(-18.1)#18,513 |
| 84. | Milton | 27.5% | 57.1%(-29.6)#84 | 46.1%(-18.6)#18,806 |
| 85. | Claremont | 26.0% | 57.1%(-31.1)#85 | 46.1%(-20.1)#19,629 |
| 86. | Littleton | 25.9% | 57.1%(-31.2)#86 | 46.1%(-20.2)#19,690 |
| 87. | Belmont | 24.9% | 57.1%(-32.2)#87 | 46.1%(-21.2)#20,341 |
| 88. | Tilton Northfield | 24.8% | 57.1%(-32.3)#88 | 46.1%(-21.3)#20,373 |
| 89. | Colebrook | 24.5% | 57.1%(-32.6)#89 | 46.1%(-21.6)#20,538 |
| 90. | Greenville | 24.4% | 57.1%(-32.7)#90 | 46.1%(-21.7)#20,593 |
| 91. | Ashland | 23.4% | 57.1%(-33.7)#91 | 46.1%(-22.7)#21,150 |
| 92. | Enfield | 22.2% | 57.1%(-34.9)#92 | 46.1%(-23.9)#21,818 |
| 93. | Canaan | 20.0% | 57.1%(-37.1)#93 | 46.1%(-26.1)#23,076 |
| 94. | Milton Mills | 20.0% | 57.1%(-37.1)#94 | 46.1%(-26.1)#23,093 |
| 95. | Farmington | 19.8% | 57.1%(-37.3)#95 | 46.1%(-26.3)#23,185 |
| 96. | Groveton | 17.1% | 57.1%(-40.0)#96 | 46.1%(-29.0)#24,535 |
| 97. | North Haverhill | 16.9% | 57.1%(-40.2)#97 | 46.1%(-29.2)#24,641 |
| 98. | Mountain Lakes | 10.8% | 57.1%(-46.3)#98 | 46.1%(-35.3)#27,120 |
| 99. | West Stewartstown | 3.1% | 57.1%(-54.0)#99 | 46.1%(-43.0)#28,891 |
| 100. | North Conway | 2.6% | 57.1%(-54.5)#100 | 46.1%(-43.5)#28,942 |
1
Common Questions
What are the Top 10 Cities with the Highest Percentage of Families with Income Above $100,000 in New Hampshire?
Top 10 Cities with the Highest Percentage of Families with Income Above $100,000 in New Hampshire are:
#1
100.0%
#2
100.0%
#3
100.0%
#4
91.7%
#5
81.9%
#6
79.8%
#7
79.6%
#8
78.7%
#9
72.9%
#10
72.1%
What city has the Highest Percentage of Families with Income Above $100,000 in New Hampshire?
Bartlett has the Highest Percentage of Families with Income Above $100,000 in New Hampshire with 100.0%.
What is the Percentage of Families with Income Above $100,000 in the State of New Hampshire?
Percentage of Families with Income Above $100,000 in New Hampshire is 57.1%.
What is the Percentage of Families with Income Above $100,000 in the United States?
Percentage of Families with Income Above $100,000 in the United States is 46.1%.