Cities with the Highest Percentage of Families with Income Above $100,000 in Missouri
RELATED REPORTS & OPTIONS
Family Income | $100k+
Missouri
Compare Cities
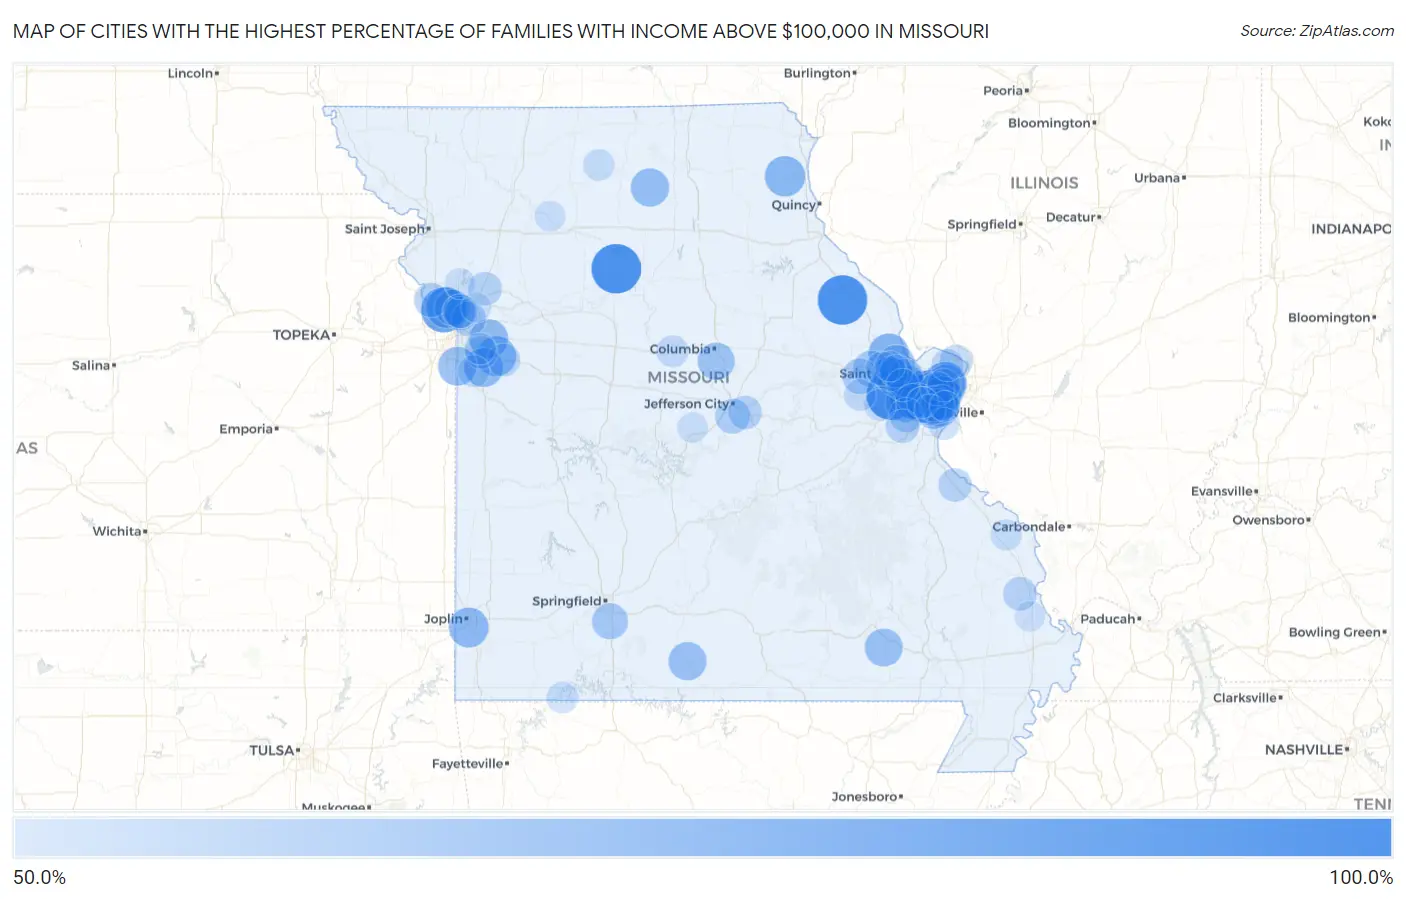
Map of Cities with the Highest Percentage of Families with Income Above $100,000 in Missouri
0.0%
100.0%
Cities with the Highest Percentage of Families with Income Above $100,000 in Missouri
| City | Families with Income > $100k | vs State | vs National | |
| 1. | Shawneetown | 100.0% | 40.8%(+59.2)#1 | 46.1%(+53.9)#98 |
| 2. | St Clement | 100.0% | 40.8%(+59.2)#2 | 46.1%(+53.9)#208 |
| 3. | Defiance | 100.0% | 40.8%(+59.2)#3 | 46.1%(+53.9)#212 |
| 4. | New Market | 100.0% | 40.8%(+59.2)#4 | 46.1%(+53.9)#235 |
| 5. | Buell | 100.0% | 40.8%(+59.2)#5 | 46.1%(+53.9)#349 |
| 6. | Triplett | 100.0% | 40.8%(+59.2)#6 | 46.1%(+53.9)#398 |
| 7. | Westwood | 93.9% | 40.8%(+53.1)#7 | 46.1%(+47.8)#473 |
| 8. | Clarkson Valley | 92.7% | 40.8%(+51.9)#8 | 46.1%(+46.6)#499 |
| 9. | Huntleigh | 92.2% | 40.8%(+51.4)#9 | 46.1%(+46.1)#510 |
| 10. | Country Life Acres | 90.9% | 40.8%(+50.1)#10 | 46.1%(+44.8)#545 |
| 11. | Parkville | 90.0% | 40.8%(+49.2)#11 | 46.1%(+43.9)#583 |
| 12. | Glendale | 89.0% | 40.8%(+48.2)#12 | 46.1%(+42.9)#638 |
| 13. | Warson Woods | 88.3% | 40.8%(+47.5)#13 | 46.1%(+42.2)#674 |
| 14. | Des Peres | 87.6% | 40.8%(+46.8)#14 | 46.1%(+41.5)#709 |
| 15. | Bellerive Acres | 86.3% | 40.8%(+45.5)#15 | 46.1%(+40.2)#798 |
| 16. | Frontenac | 85.1% | 40.8%(+44.3)#16 | 46.1%(+39.0)#887 |
| 17. | Ladue | 82.8% | 40.8%(+42.0)#17 | 46.1%(+36.7)#1,086 |
| 18. | Town And Country | 82.5% | 40.8%(+41.7)#18 | 46.1%(+36.4)#1,106 |
| 19. | Crystal Lake Park | 80.6% | 40.8%(+39.8)#19 | 46.1%(+34.5)#1,326 |
| 20. | Weatherby Lake | 79.9% | 40.8%(+39.1)#20 | 46.1%(+33.8)#1,392 |
| 21. | Chain Of Rocks | 79.7% | 40.8%(+38.9)#21 | 46.1%(+33.6)#1,418 |
| 22. | Monticello | 79.5% | 40.8%(+38.7)#22 | 46.1%(+33.4)#1,442 |
| 23. | Clayton | 79.1% | 40.8%(+38.3)#23 | 46.1%(+33.0)#1,493 |
| 24. | Lake Lotawana | 78.6% | 40.8%(+37.8)#24 | 46.1%(+32.5)#1,564 |
| 25. | Shoal Creek Estates | 78.2% | 40.8%(+37.4)#25 | 46.1%(+32.1)#1,615 |
| 26. | Lake Tapawingo | 76.5% | 40.8%(+35.7)#26 | 46.1%(+30.4)#1,846 |
| 27. | Lake Winnebago | 76.4% | 40.8%(+35.6)#27 | 46.1%(+30.3)#1,865 |
| 28. | Wildwood | 76.3% | 40.8%(+35.5)#28 | 46.1%(+30.2)#1,870 |
| 29. | Chesterfield | 76.2% | 40.8%(+35.4)#29 | 46.1%(+30.1)#1,886 |
| 30. | Loch Lloyd | 75.8% | 40.8%(+35.0)#30 | 46.1%(+29.7)#1,954 |
| 31. | Pasadena Hills | 75.4% | 40.8%(+34.6)#31 | 46.1%(+29.3)#2,009 |
| 32. | Dardenne Prairie | 75.3% | 40.8%(+34.5)#32 | 46.1%(+29.2)#2,016 |
| 33. | Denton | 75.0% | 40.8%(+34.2)#33 | 46.1%(+28.9)#2,076 |
| 34. | Winigan | 75.0% | 40.8%(+34.2)#34 | 46.1%(+28.9)#2,088 |
| 35. | Creve Coeur | 74.4% | 40.8%(+33.6)#35 | 46.1%(+28.3)#2,170 |
| 36. | Wasola | 74.4% | 40.8%(+33.6)#36 | 46.1%(+28.3)#2,176 |
| 37. | Grantwood Village | 74.3% | 40.8%(+33.5)#37 | 46.1%(+28.2)#2,187 |
| 38. | Weldon Spring | 73.9% | 40.8%(+33.1)#38 | 46.1%(+27.8)#2,241 |
| 39. | Hunter | 73.9% | 40.8%(+33.1)#39 | 46.1%(+27.8)#2,250 |
| 40. | Sunset Hills | 73.3% | 40.8%(+32.5)#40 | 46.1%(+27.2)#2,323 |
| 41. | Richmond Heights | 73.2% | 40.8%(+32.4)#41 | 46.1%(+27.1)#2,338 |
| 42. | St Paul | 72.9% | 40.8%(+32.1)#42 | 46.1%(+26.8)#2,383 |
| 43. | Cottleville | 72.6% | 40.8%(+31.8)#43 | 46.1%(+26.5)#2,450 |
| 44. | Summer Set | 72.6% | 40.8%(+31.8)#44 | 46.1%(+26.5)#2,458 |
| 45. | Pierpont | 72.0% | 40.8%(+31.2)#45 | 46.1%(+25.9)#2,561 |
| 46. | Ballwin | 70.4% | 40.8%(+29.6)#46 | 46.1%(+24.3)#2,812 |
| 47. | Foristell | 70.3% | 40.8%(+29.5)#47 | 46.1%(+24.2)#2,843 |
| 48. | Fremont Hills | 69.8% | 40.8%(+29.0)#48 | 46.1%(+23.7)#2,923 |
| 49. | Twin Oaks | 69.4% | 40.8%(+28.6)#49 | 46.1%(+23.3)#2,986 |
| 50. | Lake Waukomis | 69.2% | 40.8%(+28.4)#50 | 46.1%(+23.1)#3,018 |
| 51. | Webster Groves | 68.8% | 40.8%(+28.0)#51 | 46.1%(+22.7)#3,081 |
| 52. | Innsbrook | 68.8% | 40.8%(+28.0)#52 | 46.1%(+22.7)#3,091 |
| 53. | Oakwood | 68.5% | 40.8%(+27.7)#53 | 46.1%(+22.4)#3,160 |
| 54. | Oakland | 68.2% | 40.8%(+27.4)#54 | 46.1%(+22.1)#3,220 |
| 55. | Lake St Louis | 67.8% | 40.8%(+27.0)#55 | 46.1%(+21.7)#3,283 |
| 56. | Kirkwood | 67.6% | 40.8%(+26.8)#56 | 46.1%(+21.5)#3,309 |
| 57. | Ellisville | 67.3% | 40.8%(+26.5)#57 | 46.1%(+21.2)#3,368 |
| 58. | Wardsville | 67.2% | 40.8%(+26.4)#58 | 46.1%(+21.1)#3,384 |
| 59. | Shrewsbury | 67.1% | 40.8%(+26.3)#59 | 46.1%(+21.0)#3,394 |
| 60. | New Hamburg | 66.7% | 40.8%(+25.9)#60 | 46.1%(+20.6)#3,463 |
| 61. | Randolph | 66.7% | 40.8%(+25.9)#61 | 46.1%(+20.6)#3,488 |
| 62. | Crestwood | 66.6% | 40.8%(+25.8)#62 | 46.1%(+20.5)#3,498 |
| 63. | Eureka | 66.5% | 40.8%(+25.7)#63 | 46.1%(+20.4)#3,531 |
| 64. | Vibbard | 66.1% | 40.8%(+25.3)#64 | 46.1%(+20.0)#3,604 |
| 65. | Farley | 66.1% | 40.8%(+25.3)#65 | 46.1%(+20.0)#3,605 |
| 66. | Oakwood Park | 65.6% | 40.8%(+24.8)#66 | 46.1%(+19.5)#3,724 |
| 67. | Wentzville | 65.4% | 40.8%(+24.6)#67 | 46.1%(+19.3)#3,747 |
| 68. | Kearney | 64.7% | 40.8%(+23.9)#68 | 46.1%(+18.6)#3,893 |
| 69. | Taos | 64.7% | 40.8%(+23.9)#69 | 46.1%(+18.6)#3,899 |
| 70. | Dutchtown | 64.6% | 40.8%(+23.8)#70 | 46.1%(+18.5)#3,927 |
| 71. | Olivette | 64.5% | 40.8%(+23.7)#71 | 46.1%(+18.4)#3,935 |
| 72. | Labarque Creek | 64.4% | 40.8%(+23.6)#72 | 46.1%(+18.3)#3,967 |
| 73. | Bloomsdale | 64.0% | 40.8%(+23.2)#73 | 46.1%(+17.9)#4,057 |
| 74. | West Alton | 63.3% | 40.8%(+22.5)#74 | 46.1%(+17.2)#4,203 |
| 75. | Briarwood Estates | 63.3% | 40.8%(+22.5)#75 | 46.1%(+17.2)#4,207 |
| 76. | Lone Jack | 63.2% | 40.8%(+22.4)#76 | 46.1%(+17.1)#4,221 |
| 77. | Bel Nor | 62.8% | 40.8%(+22.0)#77 | 46.1%(+16.7)#4,316 |
| 78. | O Fallon | 62.4% | 40.8%(+21.6)#78 | 46.1%(+16.3)#4,390 |
| 79. | Lee S Summit | 62.3% | 40.8%(+21.5)#79 | 46.1%(+16.2)#4,413 |
| 80. | Weldon Spring Heights | 62.1% | 40.8%(+21.3)#80 | 46.1%(+16.0)#4,477 |
| 81. | Old Jamestown | 61.7% | 40.8%(+20.9)#81 | 46.1%(+15.6)#4,545 |
| 82. | Oakville | 61.0% | 40.8%(+20.2)#82 | 46.1%(+14.9)#4,720 |
| 83. | Raymore | 60.9% | 40.8%(+20.1)#83 | 46.1%(+14.8)#4,734 |
| 84. | Augusta | 60.8% | 40.8%(+20.0)#84 | 46.1%(+14.7)#4,780 |
| 85. | Marthasville | 60.7% | 40.8%(+19.9)#85 | 46.1%(+14.6)#4,800 |
| 86. | Windsor Place | 60.7% | 40.8%(+19.9)#86 | 46.1%(+14.6)#4,808 |
| 87. | Golden | 60.3% | 40.8%(+19.5)#87 | 46.1%(+14.2)#4,888 |
| 88. | Unity Village | 60.0% | 40.8%(+19.2)#88 | 46.1%(+13.9)#4,980 |
| 89. | Osgood | 60.0% | 40.8%(+19.2)#89 | 46.1%(+13.9)#4,989 |
| 90. | Oaks | 59.6% | 40.8%(+18.8)#90 | 46.1%(+13.5)#5,089 |
| 91. | Manchester | 59.4% | 40.8%(+18.6)#91 | 46.1%(+13.3)#5,119 |
| 92. | Longtown | 59.2% | 40.8%(+18.4)#92 | 46.1%(+13.1)#5,189 |
| 93. | Smithville | 58.7% | 40.8%(+17.9)#93 | 46.1%(+12.6)#5,297 |
| 94. | Fenton | 58.6% | 40.8%(+17.8)#94 | 46.1%(+12.5)#5,320 |
| 95. | Olean | 58.3% | 40.8%(+17.5)#95 | 46.1%(+12.2)#5,402 |
| 96. | Lock Springs | 58.3% | 40.8%(+17.5)#96 | 46.1%(+12.2)#5,403 |
| 97. | Wilbur Park | 57.9% | 40.8%(+17.1)#97 | 46.1%(+11.8)#5,497 |
| 98. | Benton | 57.8% | 40.8%(+17.0)#98 | 46.1%(+11.7)#5,520 |
| 99. | Josephville | 57.4% | 40.8%(+16.6)#99 | 46.1%(+11.3)#5,619 |
| 100. | Liberty | 57.2% | 40.8%(+16.4)#100 | 46.1%(+11.1)#5,651 |
Common Questions
What are the Top 10 Cities with the Highest Percentage of Families with Income Above $100,000 in Missouri?
Top 10 Cities with the Highest Percentage of Families with Income Above $100,000 in Missouri are:
#1
100.0%
#2
100.0%
#3
100.0%
#4
93.9%
#5
92.7%
#6
92.2%
#7
90.9%
#8
90.0%
#9
89.0%
#10
88.3%
What city has the Highest Percentage of Families with Income Above $100,000 in Missouri?
St Clement has the Highest Percentage of Families with Income Above $100,000 in Missouri with 100.0%.
What is the Percentage of Families with Income Above $100,000 in the State of Missouri?
Percentage of Families with Income Above $100,000 in Missouri is 40.8%.
What is the Percentage of Families with Income Above $100,000 in the United States?
Percentage of Families with Income Above $100,000 in the United States is 46.1%.