Cities with the Highest Percentage of Families with Income Above $100,000 in Georgia
RELATED REPORTS & OPTIONS
Family Income | $100k+
Georgia
Compare Cities
Map of Cities with the Highest Percentage of Families with Income Above $100,000 in Georgia
0.0%
100.0%
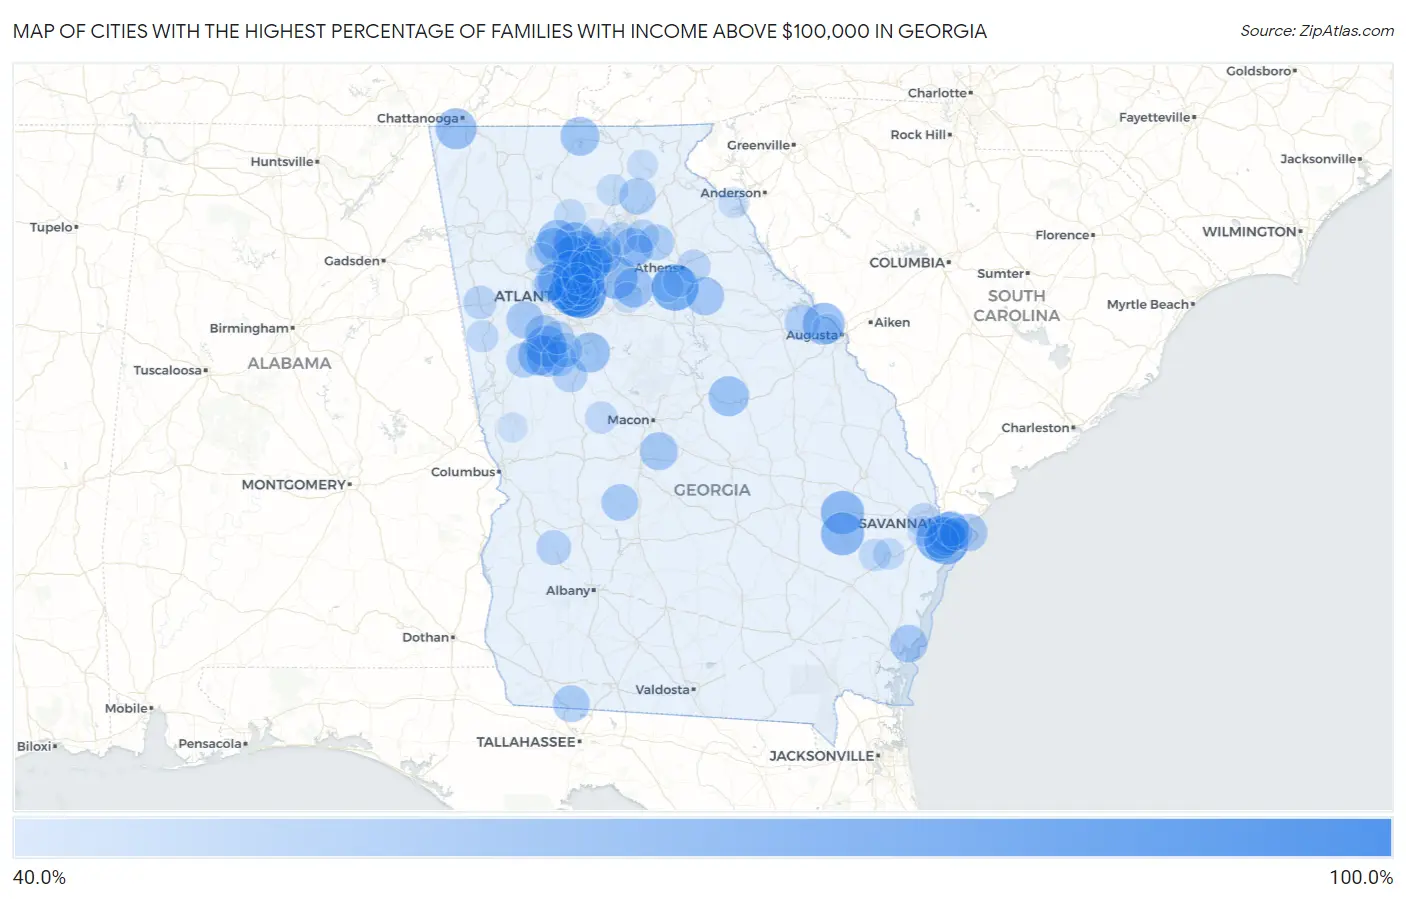
Cities with the Highest Percentage of Families with Income Above $100,000 in Georgia
| City | Families with Income > $100k | vs State | vs National | |
| 1. | Berry College | 100.0% | 42.7%(+57.3)#1 | 46.1%(+53.9)#12 |
| 2. | Hortense | 100.0% | 42.7%(+57.3)#2 | 46.1%(+53.9)#38 |
| 3. | Smarr | 100.0% | 42.7%(+57.3)#3 | 46.1%(+53.9)#50 |
| 4. | Cogdell | 100.0% | 42.7%(+57.3)#4 | 46.1%(+53.9)#348 |
| 5. | Mershon | 100.0% | 42.7%(+57.3)#5 | 46.1%(+53.9)#373 |
| 6. | Godfrey | 86.2% | 42.7%(+43.5)#6 | 46.1%(+40.1)#805 |
| 7. | Antioch | 86.1% | 42.7%(+43.4)#7 | 46.1%(+40.0)#814 |
| 8. | Avondale Estates | 85.1% | 42.7%(+42.4)#8 | 46.1%(+39.0)#888 |
| 9. | Druid Hills | 84.6% | 42.7%(+41.9)#9 | 46.1%(+38.5)#928 |
| 10. | Decatur | 80.0% | 42.7%(+37.3)#10 | 46.1%(+33.9)#1,370 |
| 11. | Bishop | 79.7% | 42.7%(+37.0)#11 | 46.1%(+33.6)#1,415 |
| 12. | Vernonburg | 76.5% | 42.7%(+33.8)#12 | 46.1%(+30.4)#1,854 |
| 13. | Skidaway Island | 74.5% | 42.7%(+31.8)#13 | 46.1%(+28.4)#2,158 |
| 14. | Johns Creek | 74.0% | 42.7%(+31.3)#14 | 46.1%(+27.9)#2,227 |
| 15. | North Decatur | 73.6% | 42.7%(+30.9)#15 | 46.1%(+27.5)#2,282 |
| 16. | Dixie | 73.5% | 42.7%(+30.8)#16 | 46.1%(+27.4)#2,299 |
| 17. | Dunwoody | 73.4% | 42.7%(+30.7)#17 | 46.1%(+27.3)#2,303 |
| 18. | Bellville | 72.9% | 42.7%(+30.2)#18 | 46.1%(+26.8)#2,395 |
| 19. | Alpharetta | 72.4% | 42.7%(+29.7)#19 | 46.1%(+26.3)#2,474 |
| 20. | Mendes | 72.4% | 42.7%(+29.7)#20 | 46.1%(+26.3)#2,489 |
| 21. | Grayson | 72.0% | 42.7%(+29.3)#21 | 46.1%(+25.9)#2,556 |
| 22. | Milton | 71.7% | 42.7%(+29.0)#22 | 46.1%(+25.6)#2,597 |
| 23. | Brookhaven | 71.3% | 42.7%(+28.6)#23 | 46.1%(+25.2)#2,674 |
| 24. | Evans | 70.3% | 42.7%(+27.6)#24 | 46.1%(+24.2)#2,832 |
| 25. | Senoia | 68.4% | 42.7%(+25.7)#25 | 46.1%(+22.3)#3,167 |
| 26. | Peachtree City | 68.3% | 42.7%(+25.6)#26 | 46.1%(+22.2)#3,189 |
| 27. | Dutch Island | 68.3% | 42.7%(+25.6)#27 | 46.1%(+22.2)#3,201 |
| 28. | Turin | 68.3% | 42.7%(+25.6)#28 | 46.1%(+22.2)#3,202 |
| 29. | Lookout Mountain | 68.0% | 42.7%(+25.3)#29 | 46.1%(+21.9)#3,250 |
| 30. | Roswell | 67.5% | 42.7%(+24.8)#30 | 46.1%(+21.4)#3,324 |
| 31. | Berkeley Lake | 67.4% | 42.7%(+24.7)#31 | 46.1%(+21.3)#3,355 |
| 32. | Holly Springs | 66.9% | 42.7%(+24.2)#32 | 46.1%(+20.8)#3,419 |
| 33. | Deepstep | 66.6% | 42.7%(+23.9)#33 | 46.1%(+20.5)#3,513 |
| 34. | Heron Bay | 66.2% | 42.7%(+23.5)#34 | 46.1%(+20.1)#3,576 |
| 35. | Between | 65.8% | 42.7%(+23.1)#35 | 46.1%(+19.7)#3,674 |
| 36. | Woodstock | 65.0% | 42.7%(+22.3)#36 | 46.1%(+18.9)#3,834 |
| 37. | Vinings | 64.4% | 42.7%(+21.7)#37 | 46.1%(+18.3)#3,958 |
| 38. | Mineral Bluff | 64.2% | 42.7%(+21.5)#38 | 46.1%(+18.1)#4,022 |
| 39. | Braselton | 64.1% | 42.7%(+21.4)#39 | 46.1%(+18.0)#4,024 |
| 40. | Isle Of Hope | 64.0% | 42.7%(+21.3)#40 | 46.1%(+17.9)#4,053 |
| 41. | Rock Spring | 63.9% | 42.7%(+21.2)#41 | 46.1%(+17.8)#4,072 |
| 42. | North Druid Hills | 63.6% | 42.7%(+20.9)#42 | 46.1%(+17.5)#4,123 |
| 43. | Maxeys | 63.2% | 42.7%(+20.5)#43 | 46.1%(+17.1)#4,226 |
| 44. | Sandy Springs | 62.9% | 42.7%(+20.2)#44 | 46.1%(+16.8)#4,276 |
| 45. | Cataula | 62.3% | 42.7%(+19.6)#45 | 46.1%(+16.2)#4,430 |
| 46. | Robins Afb | 62.3% | 42.7%(+19.6)#46 | 46.1%(+16.2)#4,431 |
| 47. | St Simons | 61.5% | 42.7%(+18.8)#47 | 46.1%(+15.4)#4,588 |
| 48. | Tyrone | 61.3% | 42.7%(+18.6)#48 | 46.1%(+15.2)#4,655 |
| 49. | Tybee Island | 61.2% | 42.7%(+18.5)#49 | 46.1%(+15.1)#4,683 |
| 50. | Chattahoochee Hills | 60.9% | 42.7%(+18.2)#50 | 46.1%(+14.8)#4,742 |
| 51. | Calvary | 60.0% | 42.7%(+17.3)#51 | 46.1%(+13.9)#4,978 |
| 52. | Dooling | 60.0% | 42.7%(+17.3)#52 | 46.1%(+13.9)#4,987 |
| 53. | Clermont | 59.6% | 42.7%(+16.9)#53 | 46.1%(+13.5)#5,084 |
| 54. | Bolingbroke | 59.4% | 42.7%(+16.7)#54 | 46.1%(+13.3)#5,136 |
| 55. | Suwanee | 58.6% | 42.7%(+15.9)#55 | 46.1%(+12.5)#5,312 |
| 56. | Jefferson | 58.5% | 42.7%(+15.8)#56 | 46.1%(+12.4)#5,343 |
| 57. | Smyrna | 58.0% | 42.7%(+15.3)#57 | 46.1%(+11.9)#5,453 |
| 58. | Whitemarsh Island | 57.7% | 42.7%(+15.0)#58 | 46.1%(+11.6)#5,535 |
| 59. | Montgomery | 57.5% | 42.7%(+14.8)#59 | 46.1%(+11.4)#5,589 |
| 60. | Appling | 57.4% | 42.7%(+14.7)#60 | 46.1%(+11.3)#5,620 |
| 61. | Brooks | 56.9% | 42.7%(+14.2)#61 | 46.1%(+10.8)#5,752 |
| 62. | Moreland | 56.6% | 42.7%(+13.9)#62 | 46.1%(+10.5)#5,838 |
| 63. | Williamson | 56.3% | 42.7%(+13.6)#63 | 46.1%(+10.2)#5,907 |
| 64. | Woolsey | 56.3% | 42.7%(+13.6)#64 | 46.1%(+10.2)#5,916 |
| 65. | Parrott | 56.3% | 42.7%(+13.6)#65 | 46.1%(+10.2)#5,918 |
| 66. | Gardi | 55.6% | 42.7%(+12.9)#66 | 46.1%(+9.50)#6,127 |
| 67. | Ellerslie | 55.1% | 42.7%(+12.4)#67 | 46.1%(+9.00)#6,256 |
| 68. | Pooler | 54.6% | 42.7%(+11.9)#68 | 46.1%(+8.50)#6,374 |
| 69. | Flowery Branch | 54.3% | 42.7%(+11.6)#69 | 46.1%(+8.20)#6,483 |
| 70. | Bremen | 54.0% | 42.7%(+11.3)#70 | 46.1%(+7.90)#6,577 |
| 71. | Talmo | 54.0% | 42.7%(+11.3)#71 | 46.1%(+7.90)#6,596 |
| 72. | Winterville | 53.8% | 42.7%(+11.1)#72 | 46.1%(+7.70)#6,652 |
| 73. | Fairfield Plantation | 53.5% | 42.7%(+10.8)#73 | 46.1%(+7.40)#6,728 |
| 74. | Duluth | 53.4% | 42.7%(+10.7)#74 | 46.1%(+7.30)#6,748 |
| 75. | Fayetteville | 53.4% | 42.7%(+10.7)#75 | 46.1%(+7.30)#6,750 |
| 76. | Wilmington Island | 52.4% | 42.7%(+9.70)#76 | 46.1%(+6.30)#7,053 |
| 77. | North High Shoals | 51.7% | 42.7%(+9.00)#77 | 46.1%(+5.60)#7,290 |
| 78. | Culloden | 51.7% | 42.7%(+9.00)#78 | 46.1%(+5.60)#7,294 |
| 79. | Tucker | 51.3% | 42.7%(+8.60)#79 | 46.1%(+5.20)#7,365 |
| 80. | Gumbranch | 51.3% | 42.7%(+8.60)#80 | 46.1%(+5.20)#7,392 |
| 81. | Roopville | 51.2% | 42.7%(+8.50)#81 | 46.1%(+5.10)#7,431 |
| 82. | Peachtree Corners | 51.1% | 42.7%(+8.40)#82 | 46.1%(+5.00)#7,438 |
| 83. | Ball Ground | 51.1% | 42.7%(+8.40)#83 | 46.1%(+5.00)#7,450 |
| 84. | Atlanta | 51.0% | 42.7%(+8.30)#84 | 46.1%(+4.90)#7,475 |
| 85. | Sugar Hill | 50.9% | 42.7%(+8.20)#85 | 46.1%(+4.80)#7,508 |
| 86. | Dahlonega | 50.7% | 42.7%(+8.00)#86 | 46.1%(+4.60)#7,569 |
| 87. | Watkinsville | 50.7% | 42.7%(+8.00)#87 | 46.1%(+4.60)#7,573 |
| 88. | Flemington | 50.4% | 42.7%(+7.70)#88 | 46.1%(+4.30)#7,675 |
| 89. | Chamblee | 50.3% | 42.7%(+7.60)#89 | 46.1%(+4.20)#7,690 |
| 90. | Mableton | 50.0% | 42.7%(+7.30)#90 | 46.1%(+3.90)#7,777 |
| 91. | Kennesaw | 50.0% | 42.7%(+7.30)#91 | 46.1%(+3.90)#7,778 |
| 92. | Reed Creek | 49.3% | 42.7%(+6.60)#92 | 46.1%(+3.20)#8,110 |
| 93. | Helen | 48.7% | 42.7%(+6.00)#93 | 46.1%(+2.60)#8,294 |
| 94. | Walnut Grove | 48.4% | 42.7%(+5.70)#94 | 46.1%(+2.30)#8,388 |
| 95. | Martinez | 48.1% | 42.7%(+5.40)#95 | 46.1%(+2.00)#8,473 |
| 96. | Henderson | 48.1% | 42.7%(+5.40)#96 | 46.1%(+2.00)#8,485 |
| 97. | Cumming | 48.0% | 42.7%(+5.30)#97 | 46.1%(+1.90)#8,511 |
| 98. | Hoschton | 48.0% | 42.7%(+5.30)#98 | 46.1%(+1.90)#8,517 |
| 99. | Hamilton | 47.6% | 42.7%(+4.90)#99 | 46.1%(+1.50)#8,662 |
| 100. | Scottdale | 47.2% | 42.7%(+4.50)#100 | 46.1%(+1.10)#8,777 |
Common Questions
What are the Top 10 Cities with the Highest Percentage of Families with Income Above $100,000 in Georgia?
Top 10 Cities with the Highest Percentage of Families with Income Above $100,000 in Georgia are:
#1
85.1%
#2
84.6%
#3
80.0%
#4
79.7%
#5
76.5%
#6
74.5%
#7
74.0%
#8
73.6%
#9
73.4%
#10
72.9%
What city has the Highest Percentage of Families with Income Above $100,000 in Georgia?
Avondale Estates has the Highest Percentage of Families with Income Above $100,000 in Georgia with 85.1%.
What is the Percentage of Families with Income Above $100,000 in the State of Georgia?
Percentage of Families with Income Above $100,000 in Georgia is 42.7%.
What is the Percentage of Families with Income Above $100,000 in the United States?
Percentage of Families with Income Above $100,000 in the United States is 46.1%.