Ahtanum, WA Map & Demographics
Ahtanum Map
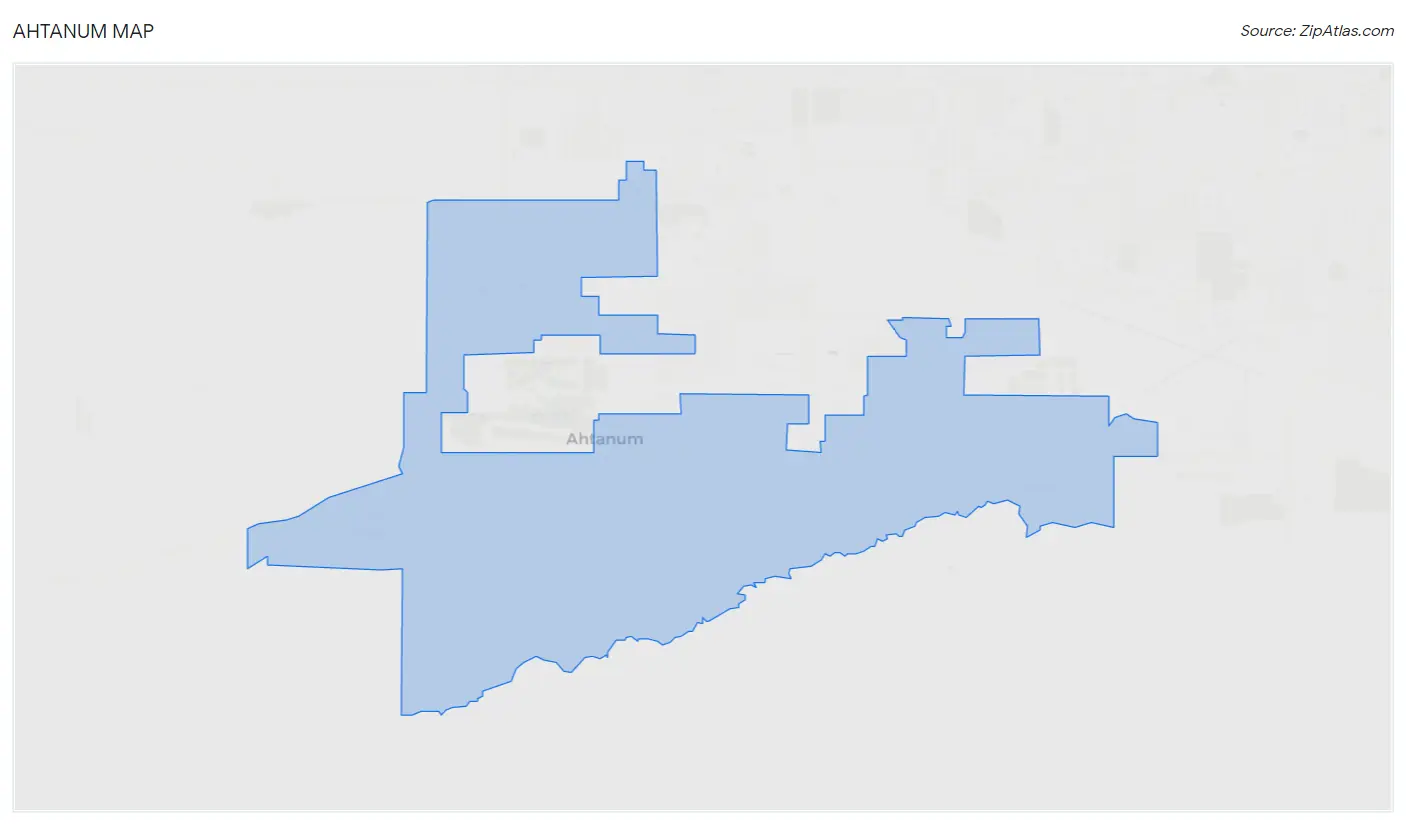
Ahtanum Overview
$34,515
PER CAPITA INCOME
$104,191
AVG FAMILY INCOME
$81,354
AVG HOUSEHOLD INCOME
13.0%
WAGE / INCOME GAP [ % ]
87.0¢/ $1
WAGE / INCOME GAP [ $ ]
0.36
INEQUALITY / GINI INDEX
3,353
TOTAL POPULATION
1,875
MALE POPULATION
1,478
FEMALE POPULATION
126.86
MALES / 100 FEMALES
78.83
FEMALES / 100 MALES
37.0
MEDIAN AGE
3.4
AVG FAMILY SIZE
2.9
AVG HOUSEHOLD SIZE
1,585
LABOR FORCE [ PEOPLE ]
60.9%
PERCENT IN LABOR FORCE
8.8%
UNEMPLOYMENT RATE
Income in Ahtanum
Income Overview in Ahtanum
Per Capita Income in Ahtanum is $34,515, while median incomes of families and households are $104,191 and $81,354 respectively.
| Characteristic | Number | Measure |
| Per Capita Income | 3,353 | $34,515 |
| Median Family Income | 863 | $104,191 |
| Mean Family Income | 863 | $111,557 |
| Median Household Income | 1,161 | $81,354 |
| Mean Household Income | 1,161 | $97,535 |
| Income Deficit | 863 | $0 |
| Wage / Income Gap (%) | 3,353 | 12.95% |
| Wage / Income Gap ($) | 3,353 | 87.05¢ per $1 |
| Gini / Inequality Index | 3,353 | 0.36 |
Earnings by Sex in Ahtanum
Average Earnings in Ahtanum are $49,125, $53,450 for men and $46,528 for women, a difference of 13.0%.
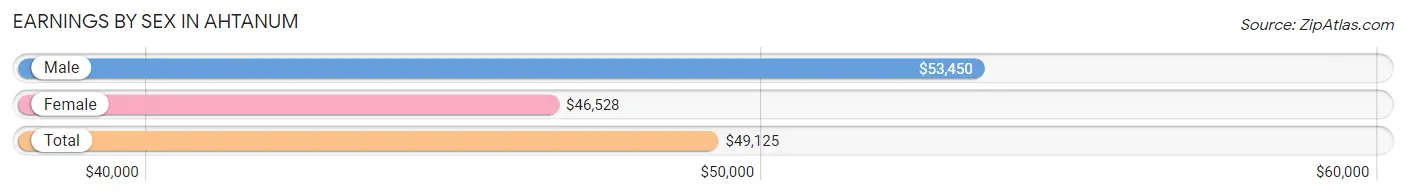
| Sex | Number | Average Earnings |
| Male | 995 (62.0%) | $53,450 |
| Female | 609 (38.0%) | $46,528 |
| Total | 1,604 (100.0%) | $49,125 |
Earnings by Sex by Income Bracket in Ahtanum
The most common earnings brackets in Ahtanum are $100,000+ for men (185 | 18.6%) and $75,000 to $99,999 for women (162 | 26.6%).
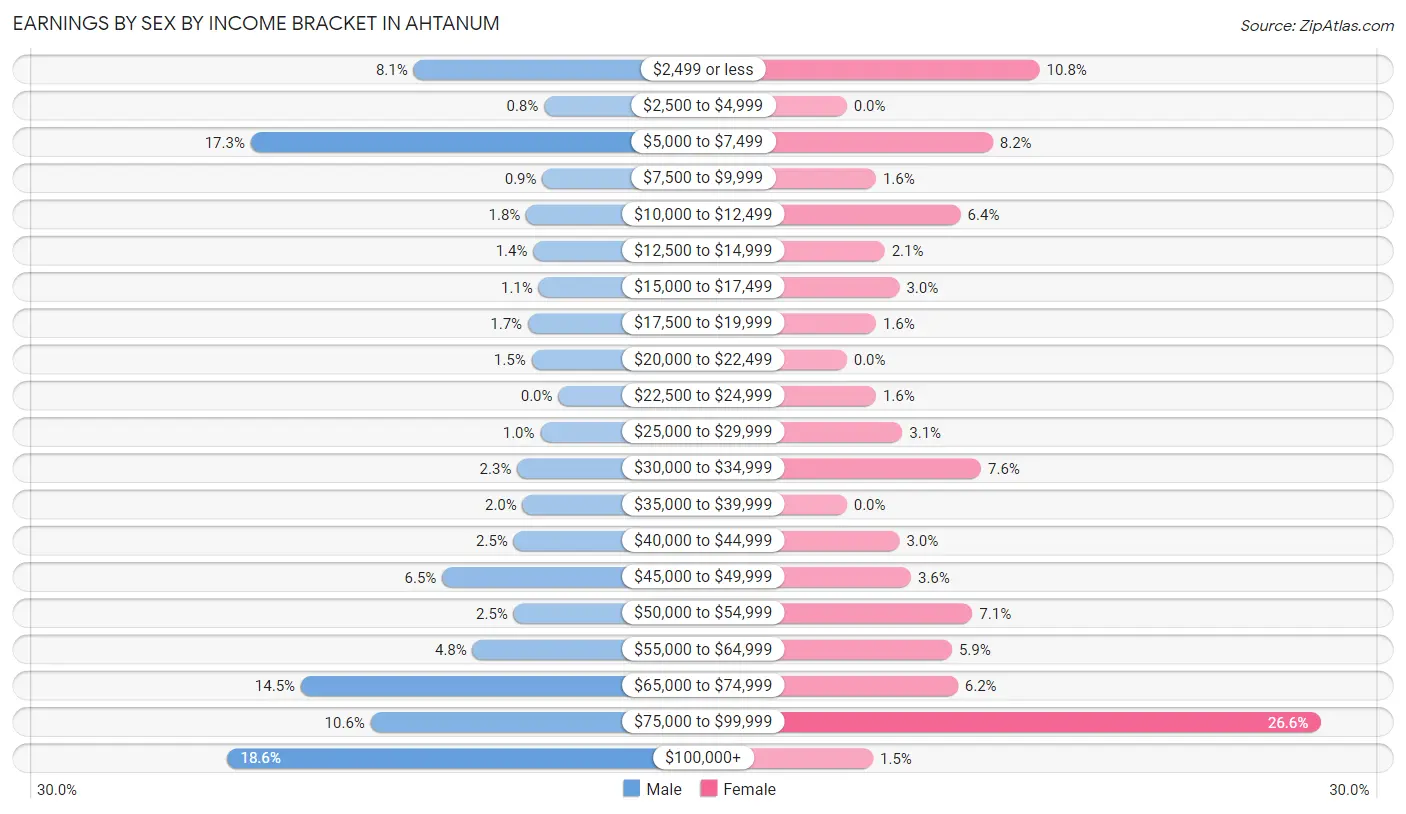
| Income | Male | Female |
| $2,499 or less | 81 (8.1%) | 66 (10.8%) |
| $2,500 to $4,999 | 8 (0.8%) | 0 (0.0%) |
| $5,000 to $7,499 | 172 (17.3%) | 50 (8.2%) |
| $7,500 to $9,999 | 9 (0.9%) | 10 (1.6%) |
| $10,000 to $12,499 | 18 (1.8%) | 39 (6.4%) |
| $12,500 to $14,999 | 14 (1.4%) | 13 (2.1%) |
| $15,000 to $17,499 | 11 (1.1%) | 18 (3.0%) |
| $17,500 to $19,999 | 17 (1.7%) | 10 (1.6%) |
| $20,000 to $22,499 | 15 (1.5%) | 0 (0.0%) |
| $22,500 to $24,999 | 0 (0.0%) | 10 (1.6%) |
| $25,000 to $29,999 | 10 (1.0%) | 19 (3.1%) |
| $30,000 to $34,999 | 23 (2.3%) | 46 (7.5%) |
| $35,000 to $39,999 | 20 (2.0%) | 0 (0.0%) |
| $40,000 to $44,999 | 25 (2.5%) | 18 (3.0%) |
| $45,000 to $49,999 | 65 (6.5%) | 22 (3.6%) |
| $50,000 to $54,999 | 25 (2.5%) | 43 (7.1%) |
| $55,000 to $64,999 | 48 (4.8%) | 36 (5.9%) |
| $65,000 to $74,999 | 144 (14.5%) | 38 (6.2%) |
| $75,000 to $99,999 | 105 (10.5%) | 162 (26.6%) |
| $100,000+ | 185 (18.6%) | 9 (1.5%) |
| Total | 995 (100.0%) | 609 (100.0%) |
Earnings by Sex by Educational Attainment in Ahtanum
Average earnings in Ahtanum are $70,242 for men and $54,099 for women, a difference of 23.0%. Men with an educational attainment of bachelor's degree enjoy the highest average annual earnings of $71,574, while those with high school diploma education earn the least with $58,750. Women with an educational attainment of bachelor's degree earn the most with the average annual earnings of $83,197, while those with high school diploma education have the smallest earnings of $42,639.
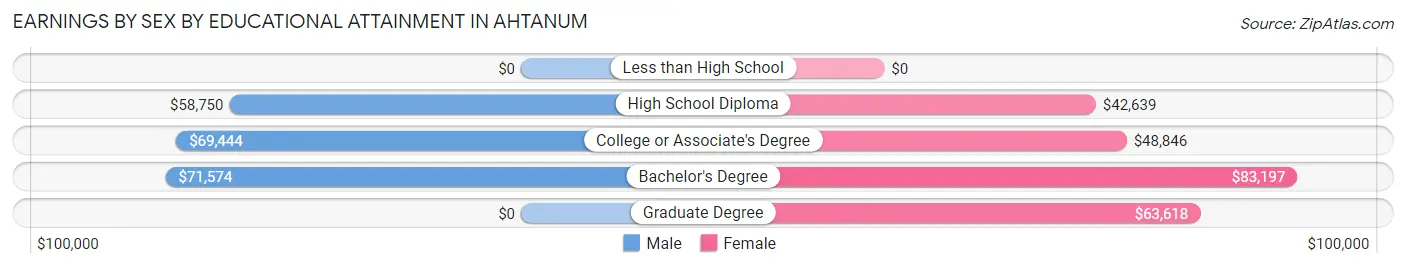
| Educational Attainment | Male Income | Female Income |
| Less than High School | - | - |
| High School Diploma | $58,750 | $42,639 |
| College or Associate's Degree | $69,444 | $48,846 |
| Bachelor's Degree | $71,574 | $83,197 |
| Graduate Degree | - | - |
| Total | $70,242 | $54,099 |
Family Income in Ahtanum
Family Income Brackets in Ahtanum
According to the Ahtanum family income data, there are 221 families falling into the $150,000 to $199,999 income range, which is the most common income bracket and makes up 25.6% of all families. Conversely, the $25,000 to $34,999 income bracket is the least frequent group with only 10 families (1.2%) belonging to this category.
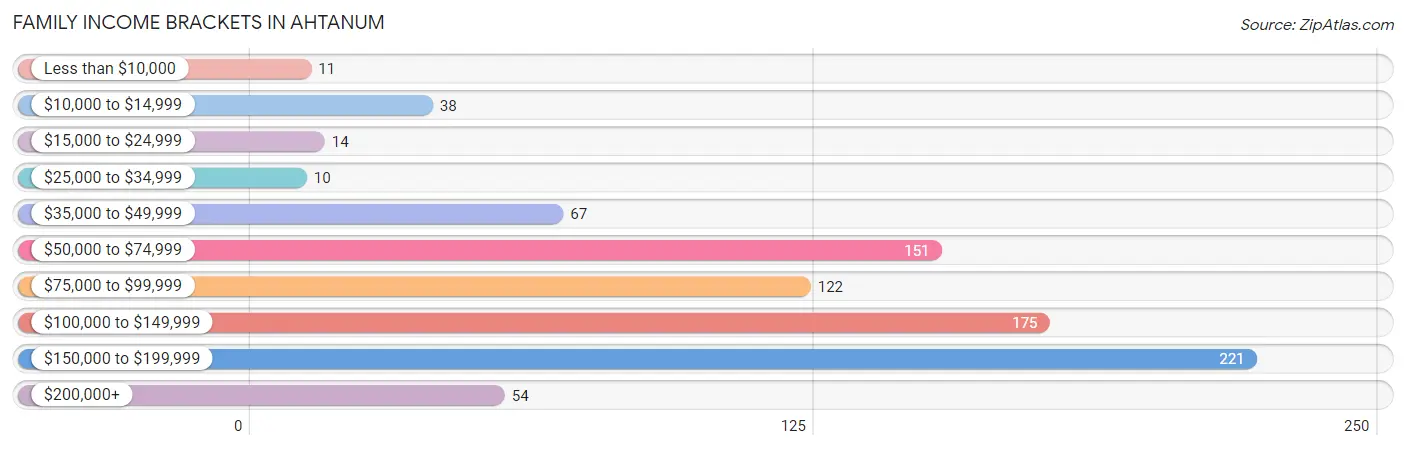
| Income Bracket | # Families | % Families |
| Less than $10,000 | 11 | 1.3% |
| $10,000 to $14,999 | 38 | 4.4% |
| $15,000 to $24,999 | 14 | 1.6% |
| $25,000 to $34,999 | 10 | 1.2% |
| $35,000 to $49,999 | 67 | 7.8% |
| $50,000 to $74,999 | 151 | 17.5% |
| $75,000 to $99,999 | 122 | 14.1% |
| $100,000 to $149,999 | 175 | 20.3% |
| $150,000 to $199,999 | 221 | 25.6% |
| $200,000+ | 54 | 6.3% |
Family Income by Famaliy Size in Ahtanum
2-person families (419 | 48.5%) account for the highest median family income in Ahtanum with $130,438 per family, while 2-person families (419 | 48.5%) have the highest median income of $65,219 per family member.
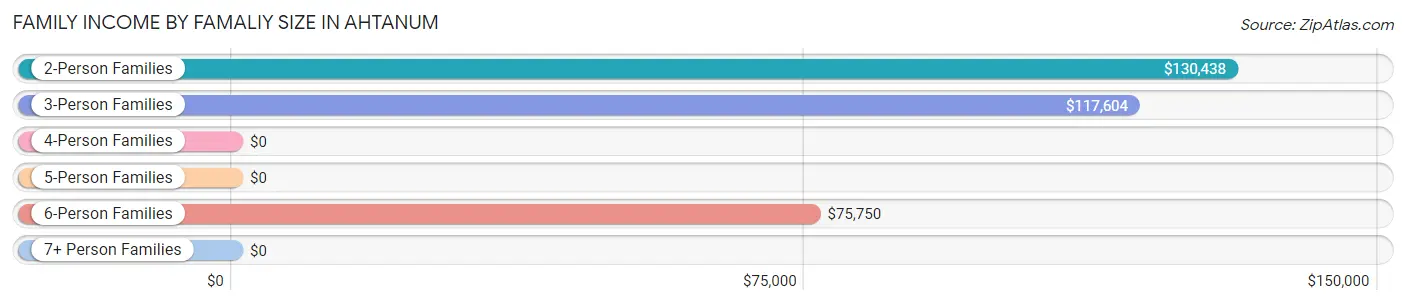
| Income Bracket | # Families | Median Income |
| 2-Person Families | 419 (48.5%) | $130,438 |
| 3-Person Families | 95 (11.0%) | $117,604 |
| 4-Person Families | 186 (21.5%) | $0 |
| 5-Person Families | 84 (9.7%) | $0 |
| 6-Person Families | 79 (9.1%) | $75,750 |
| 7+ Person Families | 0 (0.0%) | $0 |
| Total | 863 (100.0%) | $104,191 |
Family Income by Number of Earners in Ahtanum
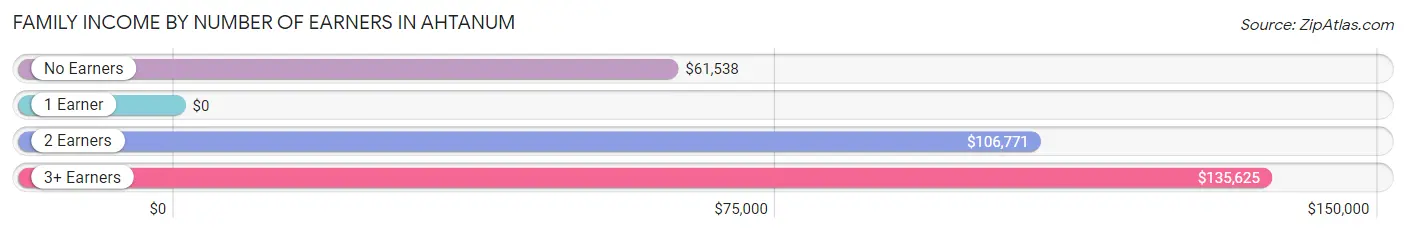
| Number of Earners | # Families | Median Income |
| No Earners | 162 (18.8%) | $61,538 |
| 1 Earner | 230 (26.7%) | $0 |
| 2 Earners | 343 (39.8%) | $106,771 |
| 3+ Earners | 128 (14.8%) | $135,625 |
| Total | 863 (100.0%) | $104,191 |
Household Income in Ahtanum
Household Income Brackets in Ahtanum
With 223 households falling in the category, the $100,000 to $149,999 income range is the most frequent in Ahtanum, accounting for 19.2% of all households. In contrast, only 19 households (1.6%) fall into the $25,000 to $34,999 income bracket, making it the least populous group.
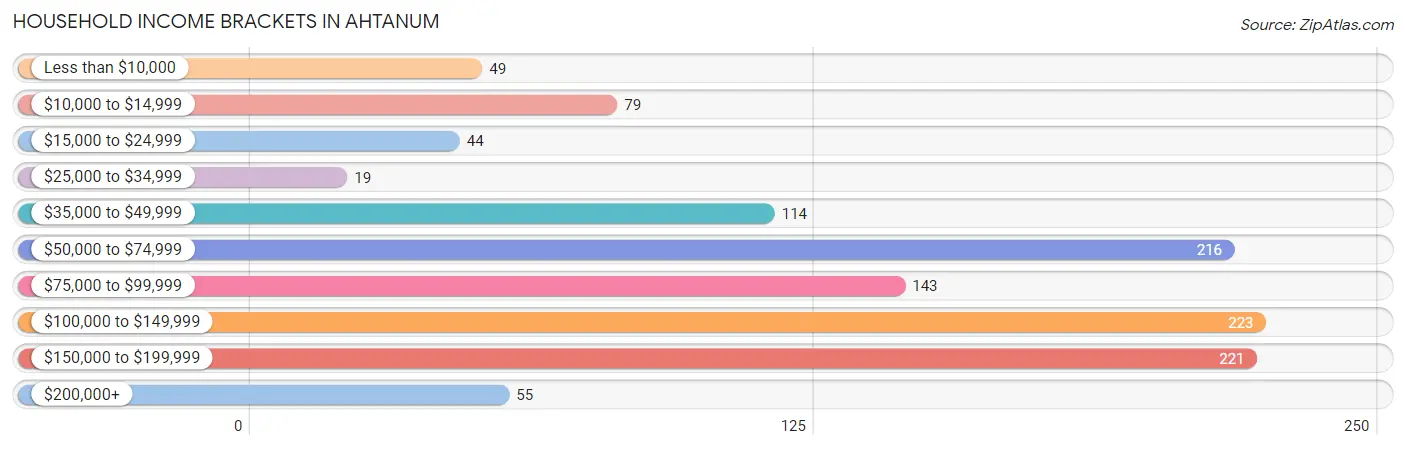
| Income Bracket | # Households | % Households |
| Less than $10,000 | 49 | 4.2% |
| $10,000 to $14,999 | 79 | 6.8% |
| $15,000 to $24,999 | 44 | 3.8% |
| $25,000 to $34,999 | 19 | 1.6% |
| $35,000 to $49,999 | 114 | 9.8% |
| $50,000 to $74,999 | 216 | 18.6% |
| $75,000 to $99,999 | 143 | 12.3% |
| $100,000 to $149,999 | 223 | 19.2% |
| $150,000 to $199,999 | 221 | 19.0% |
| $200,000+ | 55 | 4.7% |
Household Income by Householder Age in Ahtanum
The median household income in Ahtanum is $81,354, with the highest median household income of $118,542 found in the 45 to 64 years age bracket for the primary householder. A total of 552 households (47.5%) fall into this category. Meanwhile, the 15 to 24 years age bracket for the primary householder has the lowest median household income of $0, with 11 households (0.9%) in this group.
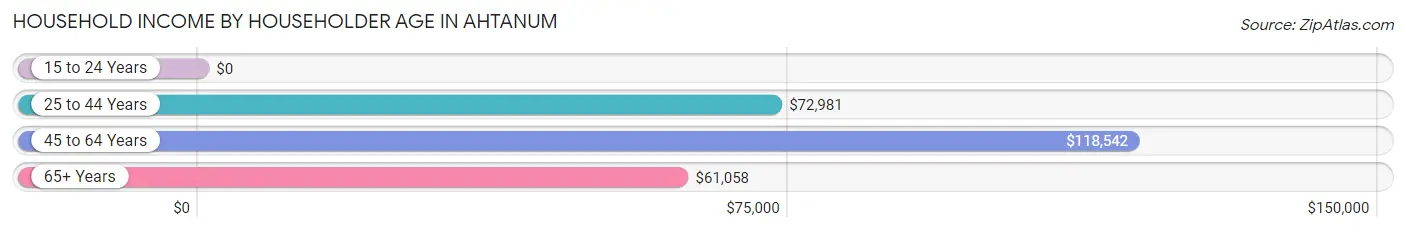
| Income Bracket | # Households | Median Income |
| 15 to 24 Years | 11 (0.9%) | $0 |
| 25 to 44 Years | 261 (22.5%) | $72,981 |
| 45 to 64 Years | 552 (47.5%) | $118,542 |
| 65+ Years | 337 (29.0%) | $61,058 |
| Total | 1,161 (100.0%) | $81,354 |
Poverty in Ahtanum
Income Below Poverty by Sex and Age in Ahtanum
With 9.8% poverty level for males and 11.6% for females among the residents of Ahtanum, under 5 year old males and 5 year old females are the most vulnerable to poverty, with 46 males (33.1%) and 16 females (55.2%) in their respective age groups living below the poverty level.
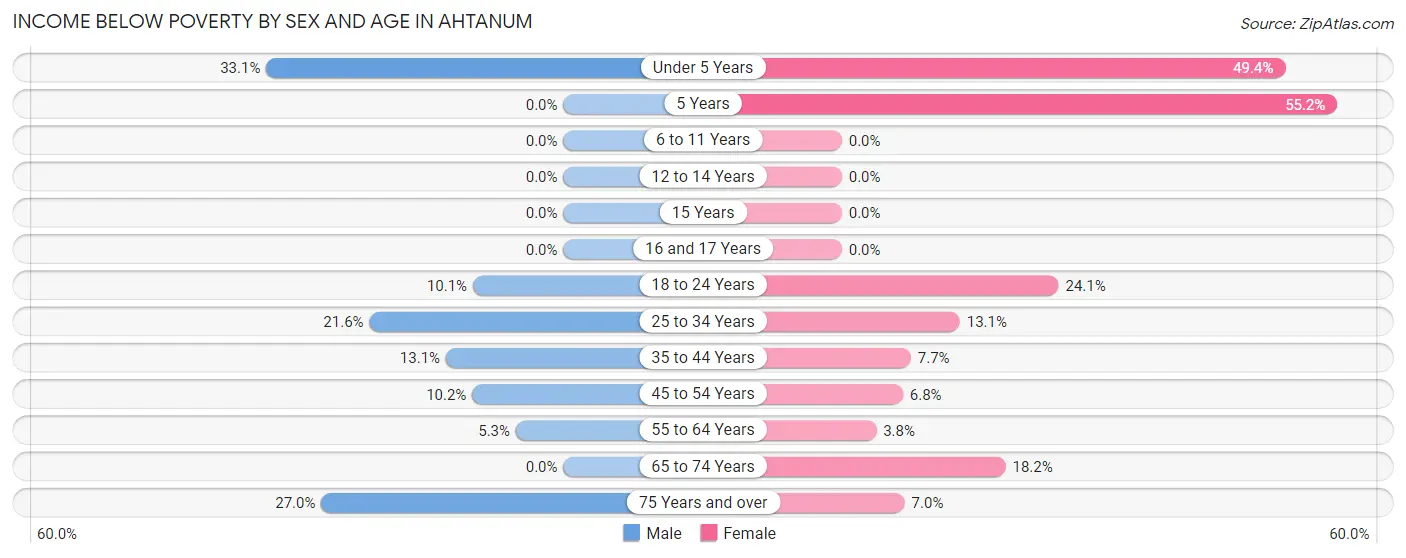
| Age Bracket | Male | Female |
| Under 5 Years | 46 (33.1%) | 40 (49.4%) |
| 5 Years | 0 (0.0%) | 16 (55.2%) |
| 6 to 11 Years | 0 (0.0%) | 0 (0.0%) |
| 12 to 14 Years | 0 (0.0%) | 0 (0.0%) |
| 15 Years | 0 (0.0%) | 0 (0.0%) |
| 16 and 17 Years | 0 (0.0%) | 0 (0.0%) |
| 18 to 24 Years | 27 (10.1%) | 28 (24.1%) |
| 25 to 34 Years | 27 (21.6%) | 23 (13.1%) |
| 35 to 44 Years | 14 (13.1%) | 11 (7.7%) |
| 45 to 54 Years | 20 (10.2%) | 10 (6.8%) |
| 55 to 64 Years | 18 (5.3%) | 10 (3.8%) |
| 65 to 74 Years | 0 (0.0%) | 27 (18.2%) |
| 75 Years and over | 31 (27.0%) | 7 (7.0%) |
| Total | 183 (9.8%) | 172 (11.6%) |
Income Above Poverty by Sex and Age in Ahtanum
According to the poverty statistics in Ahtanum, males aged 5 years and females aged 6 to 11 years are the age groups that are most secure financially, with 100.0% of males and 100.0% of females in these age groups living above the poverty line.
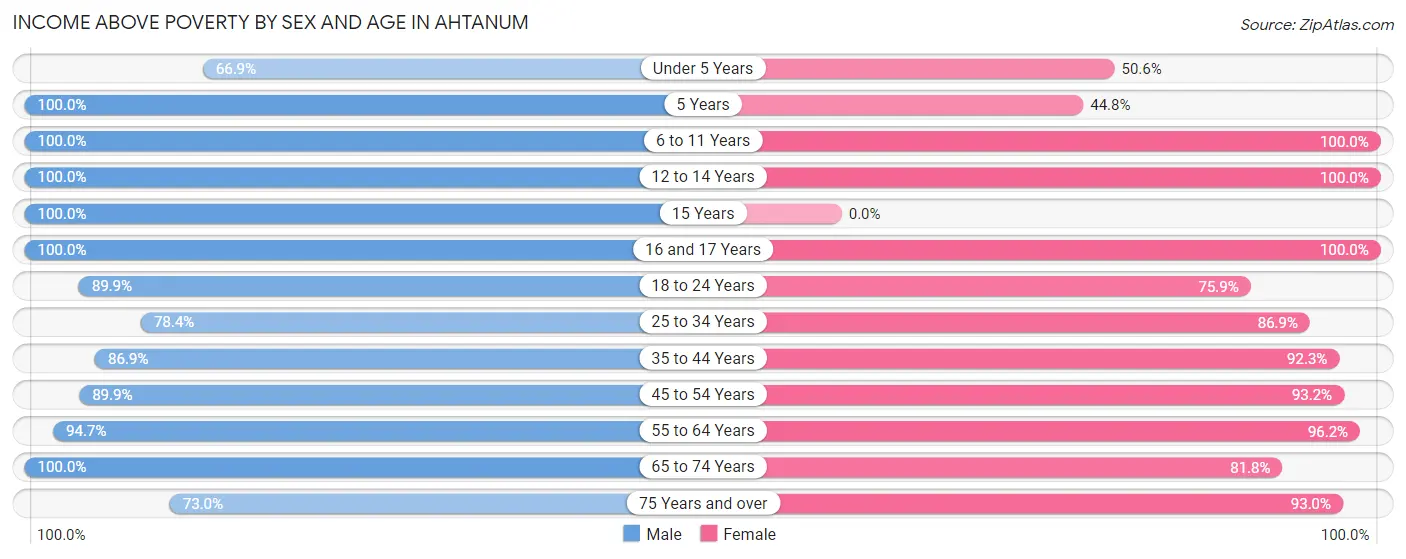
| Age Bracket | Male | Female |
| Under 5 Years | 93 (66.9%) | 41 (50.6%) |
| 5 Years | 47 (100.0%) | 13 (44.8%) |
| 6 to 11 Years | 121 (100.0%) | 95 (100.0%) |
| 12 to 14 Years | 71 (100.0%) | 120 (100.0%) |
| 15 Years | 48 (100.0%) | 0 (0.0%) |
| 16 and 17 Years | 94 (100.0%) | 63 (100.0%) |
| 18 to 24 Years | 241 (89.9%) | 88 (75.9%) |
| 25 to 34 Years | 98 (78.4%) | 152 (86.9%) |
| 35 to 44 Years | 93 (86.9%) | 132 (92.3%) |
| 45 to 54 Years | 177 (89.8%) | 137 (93.2%) |
| 55 to 64 Years | 322 (94.7%) | 251 (96.2%) |
| 65 to 74 Years | 203 (100.0%) | 121 (81.8%) |
| 75 Years and over | 84 (73.0%) | 93 (93.0%) |
| Total | 1,692 (90.2%) | 1,306 (88.4%) |
Income Below Poverty Among Married-Couple Families in Ahtanum
The poverty statistics for married-couple families in Ahtanum show that 6.8% or 49 of the total 724 families live below the poverty line. Families with 1 or 2 children have the highest poverty rate of 17.8%, comprising of 38 families. On the other hand, families with 3 or 4 children have the lowest poverty rate of 0.0%, which includes 0 families.
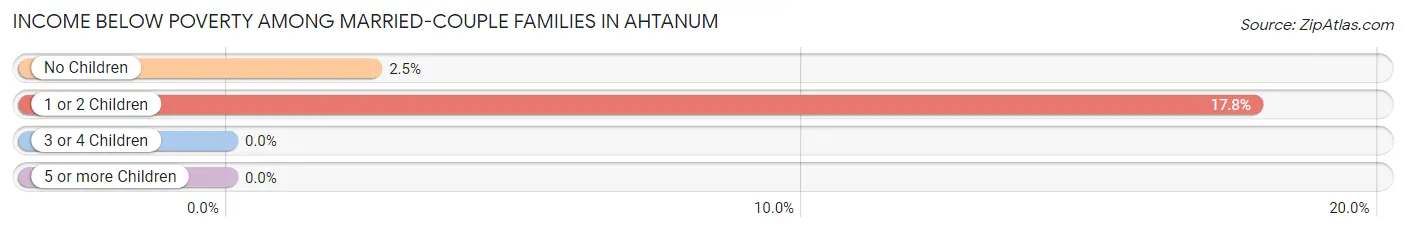
| Children | Above Poverty | Below Poverty |
| No Children | 428 (97.5%) | 11 (2.5%) |
| 1 or 2 Children | 175 (82.2%) | 38 (17.8%) |
| 3 or 4 Children | 72 (100.0%) | 0 (0.0%) |
| 5 or more Children | 0 (0.0%) | 0 (0.0%) |
| Total | 675 (93.2%) | 49 (6.8%) |
Income Below Poverty Among Single-Parent Households in Ahtanum
| Children | Single Father | Single Mother |
| No Children | 0 (0.0%) | 0 (0.0%) |
| 1 or 2 Children | 14 (23.0%) | 0 (0.0%) |
| 3 or 4 Children | 0 (0.0%) | 0 (0.0%) |
| 5 or more Children | 0 (0.0%) | 0 (0.0%) |
| Total | 14 (20.6%) | 0 (0.0%) |
Income Below Poverty Among Married-Couple vs Single-Parent Households in Ahtanum
The poverty data for Ahtanum shows that 49 of the married-couple family households (6.8%) and 14 of the single-parent households (10.1%) are living below the poverty level. Within the married-couple family households, those with 1 or 2 children have the highest poverty rate, with 38 households (17.8%) falling below the poverty line. Among the single-parent households, those with 1 or 2 children have the highest poverty rate, with 14 household (15.4%) living below poverty.
| Children | Married-Couple Families | Single-Parent Households |
| No Children | 11 (2.5%) | 0 (0.0%) |
| 1 or 2 Children | 38 (17.8%) | 14 (15.4%) |
| 3 or 4 Children | 0 (0.0%) | 0 (0.0%) |
| 5 or more Children | 0 (0.0%) | 0 (0.0%) |
| Total | 49 (6.8%) | 14 (10.1%) |
Race in Ahtanum
The most populous races in Ahtanum are White / Caucasian (2,315 | 69.0%), Hispanic or Latino (827 | 24.7%), and Some other Race (503 | 15.0%).
| Race | # Population | % Population |
| Asian | 22 | 0.7% |
| Black / African American | 77 | 2.3% |
| Hawaiian / Pacific | 0 | 0.0% |
| Hispanic or Latino | 827 | 24.7% |
| Native / Alaskan | 149 | 4.4% |
| White / Caucasian | 2,315 | 69.0% |
| Two or more Races | 287 | 8.6% |
| Some other Race | 503 | 15.0% |
| Total | 3,353 | 100.0% |
Ancestry in Ahtanum
The most populous ancestries reported in Ahtanum are Mexican (787 | 23.5%), German (465 | 13.9%), Irish (248 | 7.4%), English (168 | 5.0%), and American (156 | 4.6%), together accounting for 54.4% of all Ahtanum residents.
| Ancestry | # Population | % Population |
| American | 156 | 4.6% |
| Bhutanese | 30 | 0.9% |
| Blackfeet | 68 | 2.0% |
| British | 78 | 2.3% |
| Czech | 20 | 0.6% |
| Danish | 58 | 1.7% |
| English | 168 | 5.0% |
| European | 143 | 4.3% |
| French | 127 | 3.8% |
| French American Indian | 81 | 2.4% |
| German | 465 | 13.9% |
| Irish | 248 | 7.4% |
| Italian | 130 | 3.9% |
| Korean | 59 | 1.8% |
| Mexican | 787 | 23.5% |
| Mexican American Indian | 67 | 2.0% |
| Norwegian | 111 | 3.3% |
| Russian | 134 | 4.0% |
| Scandinavian | 31 | 0.9% |
| Scotch-Irish | 18 | 0.5% |
| Scottish | 11 | 0.3% |
| Spaniard | 18 | 0.5% |
| Spanish | 22 | 0.7% |
| Swedish | 60 | 1.8% |
| Swiss | 24 | 0.7% |
| Welsh | 10 | 0.3% | View All 26 Rows |
Immigrants in Ahtanum
The most numerous immigrant groups reported in Ahtanum came from Central America (89 | 2.6%), Latin America (89 | 2.6%), Mexico (89 | 2.6%), Canada (81 | 2.4%), and Asia (21 | 0.6%), together accounting for 11.0% of all Ahtanum residents.
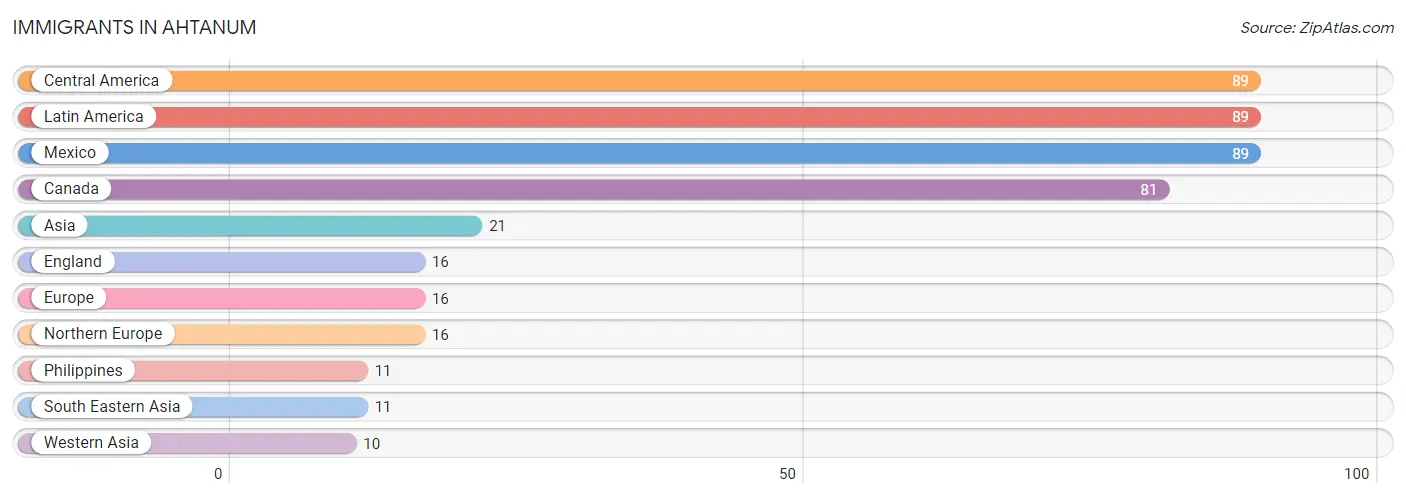
| Immigration Origin | # Population | % Population |
| Asia | 21 | 0.6% |
| Canada | 81 | 2.4% |
| Central America | 89 | 2.6% |
| England | 16 | 0.5% |
| Europe | 16 | 0.5% |
| Latin America | 89 | 2.6% |
| Mexico | 89 | 2.6% |
| Northern Europe | 16 | 0.5% |
| Philippines | 11 | 0.3% |
| South Eastern Asia | 11 | 0.3% |
| Western Asia | 10 | 0.3% | View All 11 Rows |
Sex and Age in Ahtanum
Sex and Age in Ahtanum
The most populous age groups in Ahtanum are 15 to 19 Years (304 | 16.2%) for men and 55 to 59 Years (172 | 11.6%) for women.
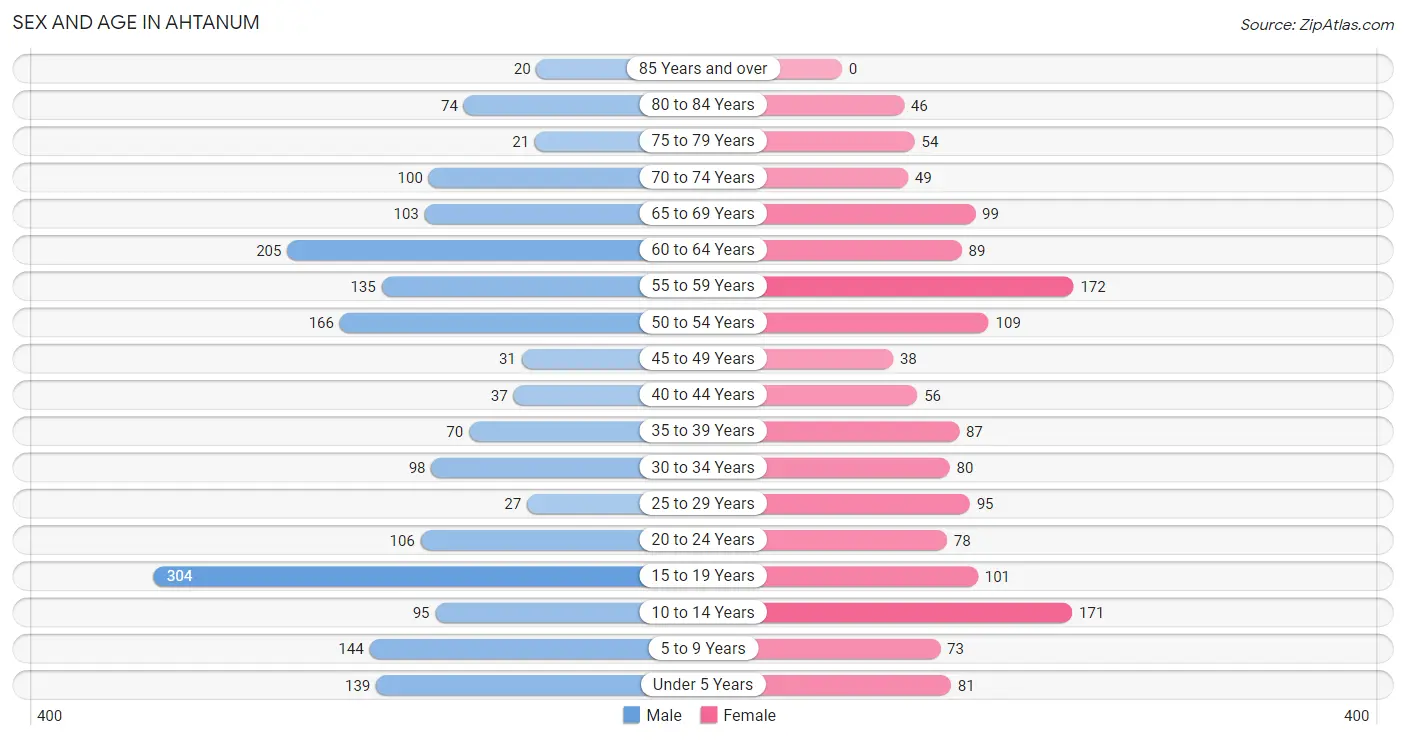
| Age Bracket | Male | Female |
| Under 5 Years | 139 (7.4%) | 81 (5.5%) |
| 5 to 9 Years | 144 (7.7%) | 73 (4.9%) |
| 10 to 14 Years | 95 (5.1%) | 171 (11.6%) |
| 15 to 19 Years | 304 (16.2%) | 101 (6.8%) |
| 20 to 24 Years | 106 (5.7%) | 78 (5.3%) |
| 25 to 29 Years | 27 (1.4%) | 95 (6.4%) |
| 30 to 34 Years | 98 (5.2%) | 80 (5.4%) |
| 35 to 39 Years | 70 (3.7%) | 87 (5.9%) |
| 40 to 44 Years | 37 (2.0%) | 56 (3.8%) |
| 45 to 49 Years | 31 (1.7%) | 38 (2.6%) |
| 50 to 54 Years | 166 (8.8%) | 109 (7.4%) |
| 55 to 59 Years | 135 (7.2%) | 172 (11.6%) |
| 60 to 64 Years | 205 (10.9%) | 89 (6.0%) |
| 65 to 69 Years | 103 (5.5%) | 99 (6.7%) |
| 70 to 74 Years | 100 (5.3%) | 49 (3.3%) |
| 75 to 79 Years | 21 (1.1%) | 54 (3.6%) |
| 80 to 84 Years | 74 (4.0%) | 46 (3.1%) |
| 85 Years and over | 20 (1.1%) | 0 (0.0%) |
| Total | 1,875 (100.0%) | 1,478 (100.0%) |
Families and Households in Ahtanum
Median Family Size in Ahtanum
The median family size in Ahtanum is 3.39 persons per family, with single female/mother families (71 | 8.2%) accounting for the largest median family size of 4.35 persons per family. On the other hand, single male/father families (68 | 7.9%) represent the smallest median family size with 2.88 persons per family.
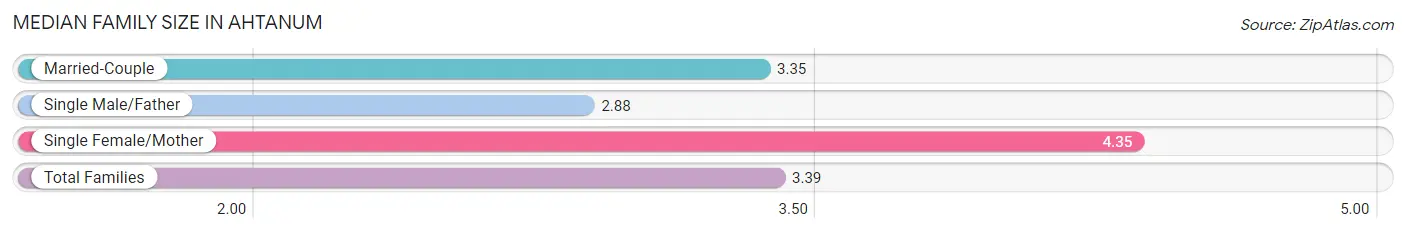
| Family Type | # Families | Family Size |
| Married-Couple | 724 (83.9%) | 3.35 |
| Single Male/Father | 68 (7.9%) | 2.88 |
| Single Female/Mother | 71 (8.2%) | 4.35 |
| Total Families | 863 (100.0%) | 3.39 |
Median Household Size in Ahtanum
The median household size in Ahtanum is 2.89 persons per household, with single female/mother households (71 | 6.1%) accounting for the largest median household size of 4.35 persons per household. non-family households (298 | 25.7%) represent the smallest median household size with 1.36 persons per household.
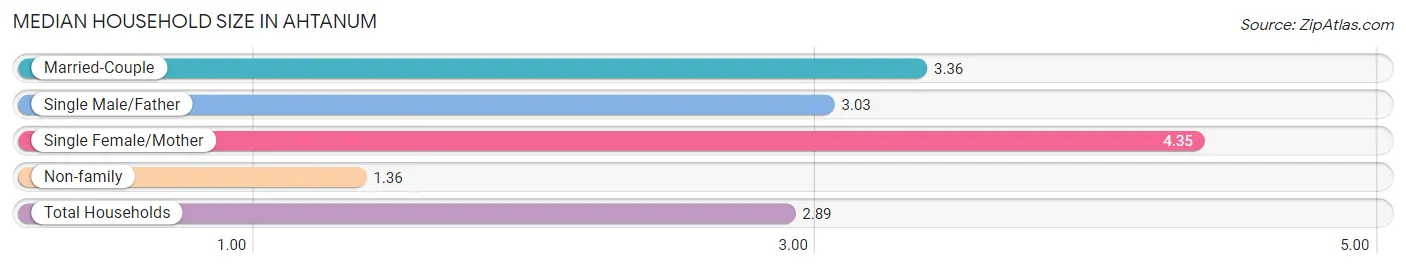
| Household Type | # Households | Household Size |
| Married-Couple | 724 (62.4%) | 3.36 |
| Single Male/Father | 68 (5.9%) | 3.03 |
| Single Female/Mother | 71 (6.1%) | 4.35 |
| Non-family | 298 (25.7%) | 1.36 |
| Total Households | 1,161 (100.0%) | 2.89 |
Household Size by Marriage Status in Ahtanum
Out of a total of 1,161 households in Ahtanum, 863 (74.3%) are family households, while 298 (25.7%) are nonfamily households. The most numerous type of family households are 2-person households, comprising 409, and the most common type of nonfamily households are 1-person households, comprising 225.
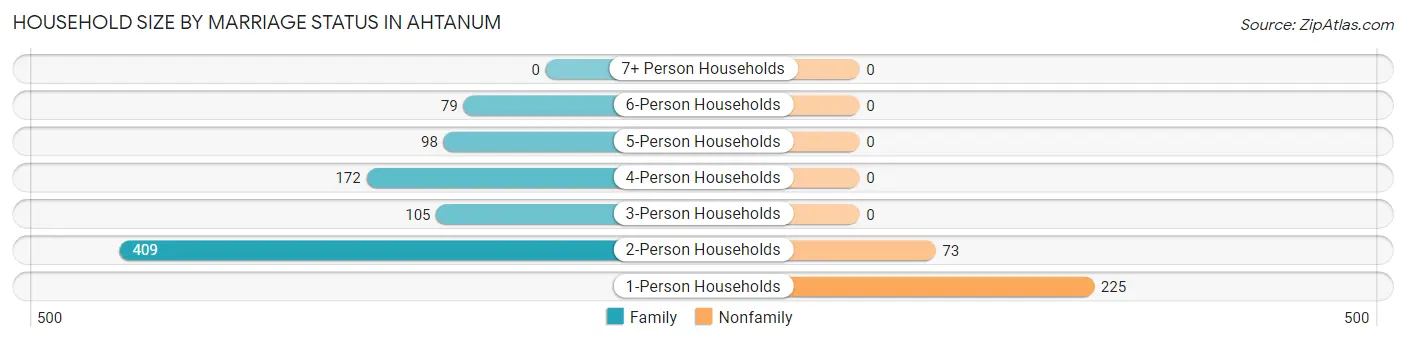
| Household Size | Family Households | Nonfamily Households |
| 1-Person Households | - | 225 (19.4%) |
| 2-Person Households | 409 (35.2%) | 73 (6.3%) |
| 3-Person Households | 105 (9.0%) | 0 (0.0%) |
| 4-Person Households | 172 (14.8%) | 0 (0.0%) |
| 5-Person Households | 98 (8.4%) | 0 (0.0%) |
| 6-Person Households | 79 (6.8%) | 0 (0.0%) |
| 7+ Person Households | 0 (0.0%) | 0 (0.0%) |
| Total | 863 (74.3%) | 298 (25.7%) |
Female Fertility in Ahtanum
Fertility by Age in Ahtanum
Average fertility rate in Ahtanum is 84.0 births per 1,000 women. Women in the age bracket of 20 to 34 years have the highest fertility rate with 178.0 births per 1,000 women. Women in the age bracket of 20 to 34 years acount for 100.0% of all women with births.
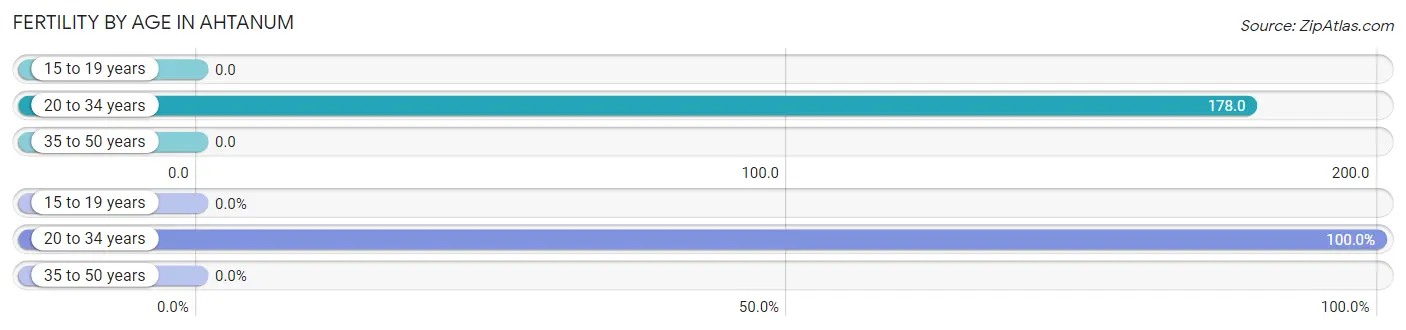
| Age Bracket | Women with Births | Births / 1,000 Women |
| 15 to 19 years | 0 (0.0%) | 0.0 |
| 20 to 34 years | 45 (100.0%) | 178.0 |
| 35 to 50 years | 0 (0.0%) | 0.0 |
| Total | 45 (100.0%) | 84.0 |
Fertility by Age by Marriage Status in Ahtanum
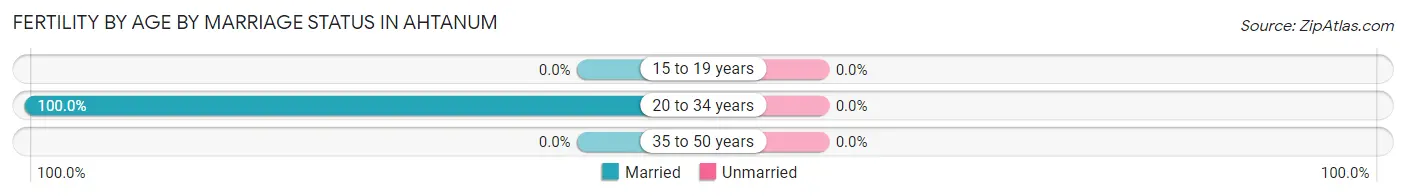
| Age Bracket | Married | Unmarried |
| 15 to 19 years | 0 (0.0%) | 0 (0.0%) |
| 20 to 34 years | 45 (100.0%) | 0 (0.0%) |
| 35 to 50 years | 0 (0.0%) | 0 (0.0%) |
| Total | 45 (100.0%) | 0 (0.0%) |
Fertility by Education in Ahtanum
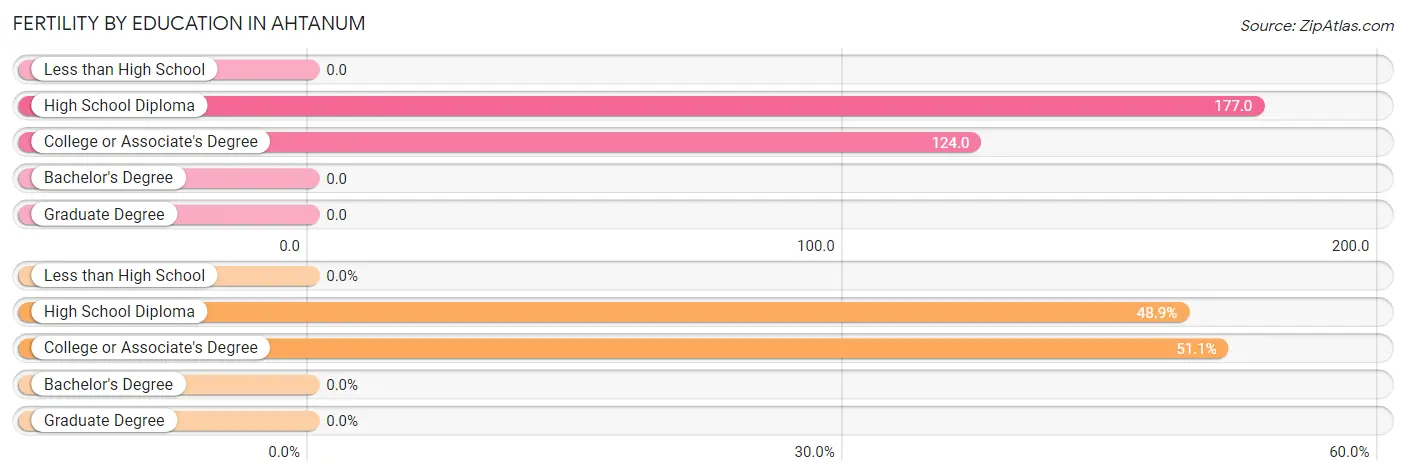
| Educational Attainment | Women with Births | Births / 1,000 Women |
| Less than High School | 0 (0.0%) | 0.0 |
| High School Diploma | 22 (48.9%) | 177.0 |
| College or Associate's Degree | 23 (51.1%) | 124.0 |
| Bachelor's Degree | 0 (0.0%) | 0.0 |
| Graduate Degree | 0 (0.0%) | 0.0 |
| Total | 45 (100.0%) | 84.0 |
Fertility by Education by Marriage Status in Ahtanum
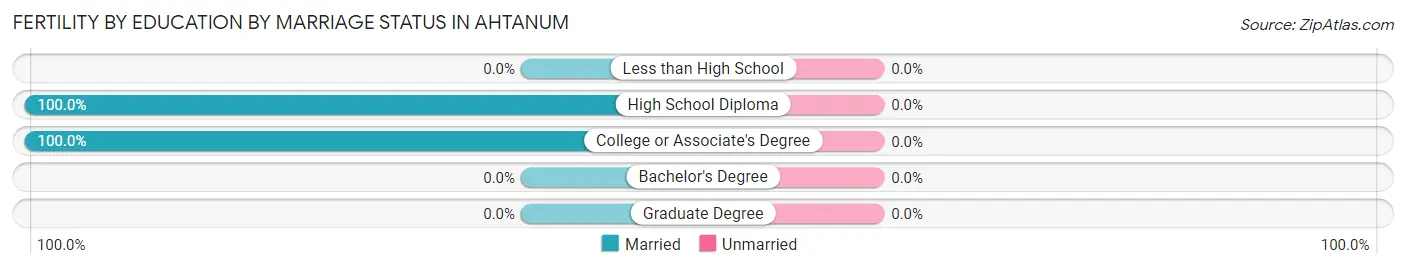
| Educational Attainment | Married | Unmarried |
| Less than High School | 0 (0.0%) | 0 (0.0%) |
| High School Diploma | 22 (100.0%) | 0 (0.0%) |
| College or Associate's Degree | 23 (100.0%) | 0 (0.0%) |
| Bachelor's Degree | 0 (0.0%) | 0 (0.0%) |
| Graduate Degree | 0 (0.0%) | 0 (0.0%) |
| Total | 45 (100.0%) | 0 (0.0%) |
Employment Characteristics in Ahtanum
Employment by Class of Employer in Ahtanum
Among the 1,357 employed individuals in Ahtanum, private company employees (806 | 59.4%), not-for-profit organizations (181 | 13.3%), and local government employees (158 | 11.6%) make up the most common classes of employment.
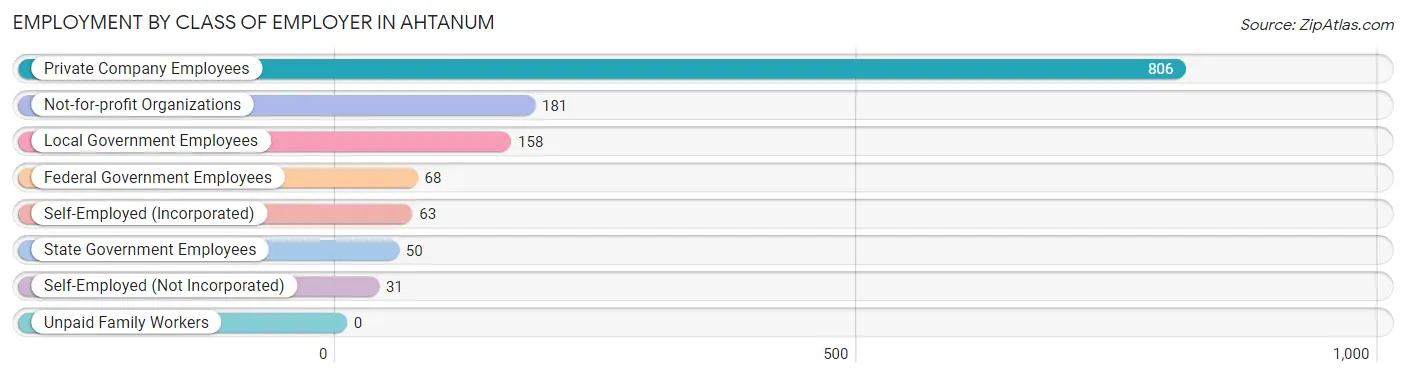
| Employer Class | # Employees | % Employees |
| Private Company Employees | 806 | 59.4% |
| Self-Employed (Incorporated) | 63 | 4.6% |
| Self-Employed (Not Incorporated) | 31 | 2.3% |
| Not-for-profit Organizations | 181 | 13.3% |
| Local Government Employees | 158 | 11.6% |
| State Government Employees | 50 | 3.7% |
| Federal Government Employees | 68 | 5.0% |
| Unpaid Family Workers | 0 | 0.0% |
| Total | 1,357 | 100.0% |
Employment Status by Age in Ahtanum
According to the labor force statistics for Ahtanum, out of the total population over 16 years of age (2,602), 60.9% or 1,585 individuals are in the labor force, with 8.8% or 139 of them unemployed. The age group with the highest labor force participation rate is 45 to 54 years, with 86.3% or 297 individuals in the labor force. Within the labor force, the 16 to 19 years age range has the highest percentage of unemployed individuals, with 55.4% or 102 of them being unemployed.
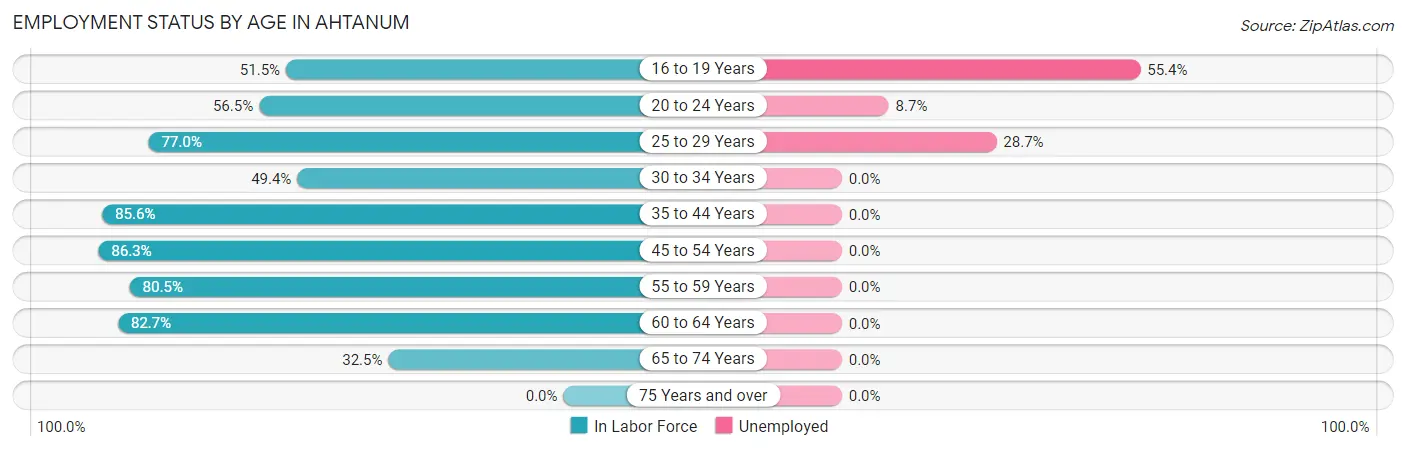
| Age Bracket | In Labor Force | Unemployed |
| 16 to 19 Years | 184 (51.5%) | 102 (55.4%) |
| 20 to 24 Years | 104 (56.5%) | 9 (8.7%) |
| 25 to 29 Years | 94 (77.0%) | 27 (28.7%) |
| 30 to 34 Years | 88 (49.4%) | 0 (0.0%) |
| 35 to 44 Years | 214 (85.6%) | 0 (0.0%) |
| 45 to 54 Years | 297 (86.3%) | 0 (0.0%) |
| 55 to 59 Years | 247 (80.5%) | 0 (0.0%) |
| 60 to 64 Years | 243 (82.7%) | 0 (0.0%) |
| 65 to 74 Years | 114 (32.5%) | 0 (0.0%) |
| 75 Years and over | 0 (0.0%) | 0 (0.0%) |
| Total | 1,585 (60.9%) | 139 (8.8%) |
Employment Status by Educational Attainment in Ahtanum
According to labor force statistics for Ahtanum, 79.1% of individuals (1,183) out of the total population between 25 and 64 years of age (1,495) are in the labor force, with 2.3% or 27 of them being unemployed. The group with the highest labor force participation rate are those with the educational attainment of bachelor's degree or higher, with 89.1% or 352 individuals in the labor force. Within the labor force, individuals with high school diploma education have the highest percentage of unemployment, with 10.9% or 27 of them being unemployed.
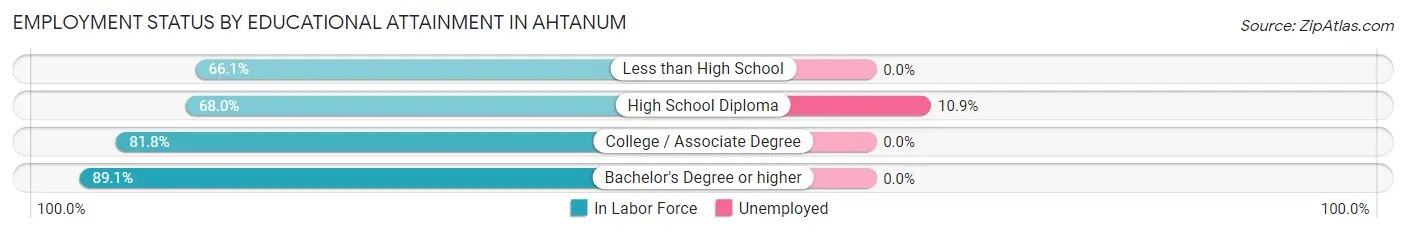
| Educational Attainment | In Labor Force | Unemployed |
| Less than High School | 80 (66.1%) | 0 (0.0%) |
| High School Diploma | 247 (68.0%) | 40 (10.9%) |
| College / Associate Degree | 504 (81.8%) | 0 (0.0%) |
| Bachelor's Degree or higher | 352 (89.1%) | 0 (0.0%) |
| Total | 1,183 (79.1%) | 34 (2.3%) |
Employment Occupations by Sex in Ahtanum
Management, Business, Science and Arts Occupations
The most common Management, Business, Science and Arts occupations in Ahtanum are Management (187 | 13.0%), Health Diagnosing & Treating (174 | 12.1%), Health Technologists (152 | 10.6%), Community & Social Service (85 | 5.9%), and Business & Financial (60 | 4.2%).
Management, Business, Science and Arts Occupations by Sex
Within the Management, Business, Science and Arts occupations in Ahtanum, the most male-oriented occupations are Legal Services & Support (100.0%), Management (85.6%), and Community & Social Service (35.3%), while the most female-oriented occupations are Business & Financial (100.0%), Education, Arts & Media (100.0%), and Education Instruction & Library (100.0%).
| Occupation | Male | Female |
| Management | 160 (85.6%) | 27 (14.4%) |
| Business & Financial | 0 (0.0%) | 60 (100.0%) |
| Computers, Engineering & Science | 0 (0.0%) | 0 (0.0%) |
| Computers & Mathematics | 0 (0.0%) | 0 (0.0%) |
| Architecture & Engineering | 0 (0.0%) | 0 (0.0%) |
| Life, Physical & Social Science | 0 (0.0%) | 0 (0.0%) |
| Community & Social Service | 30 (35.3%) | 55 (64.7%) |
| Education, Arts & Media | 0 (0.0%) | 23 (100.0%) |
| Legal Services & Support | 30 (100.0%) | 0 (0.0%) |
| Education Instruction & Library | 0 (0.0%) | 32 (100.0%) |
| Arts, Media & Entertainment | 0 (0.0%) | 0 (0.0%) |
| Health Diagnosing & Treating | 53 (30.5%) | 121 (69.5%) |
| Health Technologists | 53 (34.9%) | 99 (65.1%) |
| Total (Category) | 243 (48.0%) | 263 (52.0%) |
| Total (Overall) | 911 (63.4%) | 525 (36.6%) |
Services Occupations
The most common Services occupations in Ahtanum are Cleaning & Maintenance (98 | 6.8%), Personal Care & Service (73 | 5.1%), Healthcare Support (48 | 3.3%), and Food Preparation & Serving (24 | 1.7%).
Services Occupations by Sex
Within the Services occupations in Ahtanum, the most male-oriented occupations are Healthcare Support (100.0%), Cleaning & Maintenance (67.3%), and Food Preparation & Serving (58.3%), while the most female-oriented occupations are Personal Care & Service (63.0%), Food Preparation & Serving (41.7%), and Cleaning & Maintenance (32.7%).
| Occupation | Male | Female |
| Healthcare Support | 48 (100.0%) | 0 (0.0%) |
| Security & Protection | 0 (0.0%) | 0 (0.0%) |
| Firefighting & Prevention | 0 (0.0%) | 0 (0.0%) |
| Law Enforcement | 0 (0.0%) | 0 (0.0%) |
| Food Preparation & Serving | 14 (58.3%) | 10 (41.7%) |
| Cleaning & Maintenance | 66 (67.3%) | 32 (32.7%) |
| Personal Care & Service | 27 (37.0%) | 46 (63.0%) |
| Total (Category) | 155 (63.8%) | 88 (36.2%) |
| Total (Overall) | 911 (63.4%) | 525 (36.6%) |
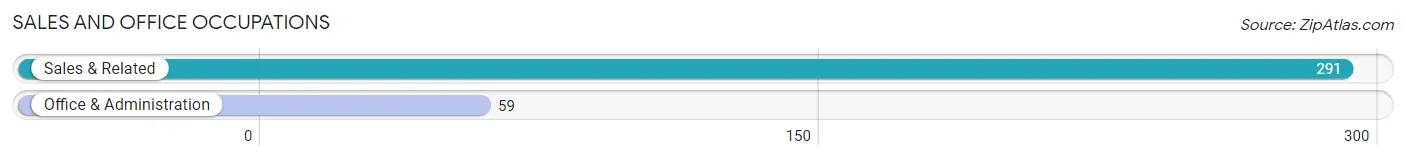
Sales and Office Occupations
The most common Sales and Office occupations in Ahtanum are Sales & Related (291 | 20.3%), and Office & Administration (59 | 4.1%).
Sales and Office Occupations by Sex
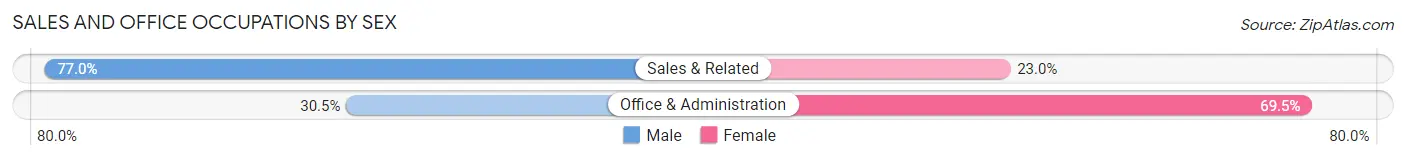
| Occupation | Male | Female |
| Sales & Related | 224 (77.0%) | 67 (23.0%) |
| Office & Administration | 18 (30.5%) | 41 (69.5%) |
| Total (Category) | 242 (69.1%) | 108 (30.9%) |
| Total (Overall) | 911 (63.4%) | 525 (36.6%) |
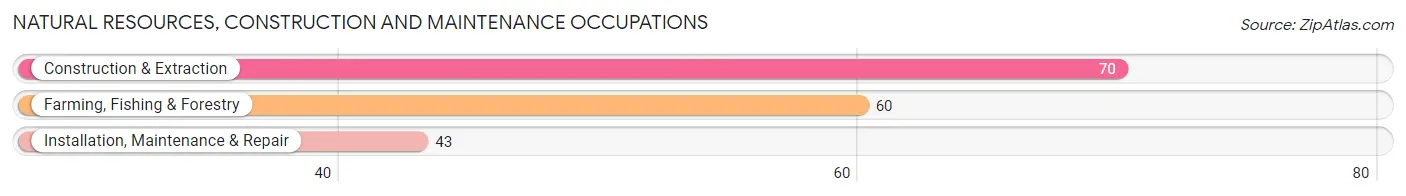
Natural Resources, Construction and Maintenance Occupations
The most common Natural Resources, Construction and Maintenance occupations in Ahtanum are Construction & Extraction (70 | 4.9%), Farming, Fishing & Forestry (60 | 4.2%), and Installation, Maintenance & Repair (43 | 3.0%).
Natural Resources, Construction and Maintenance Occupations by Sex
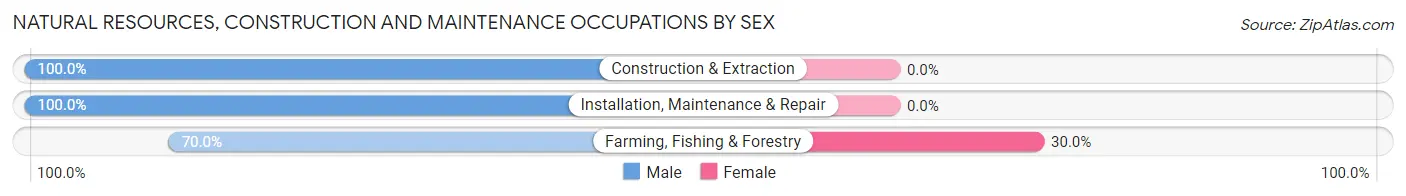
| Occupation | Male | Female |
| Farming, Fishing & Forestry | 42 (70.0%) | 18 (30.0%) |
| Construction & Extraction | 70 (100.0%) | 0 (0.0%) |
| Installation, Maintenance & Repair | 43 (100.0%) | 0 (0.0%) |
| Total (Category) | 155 (89.6%) | 18 (10.4%) |
| Total (Overall) | 911 (63.4%) | 525 (36.6%) |
Production, Transportation and Moving Occupations
The most common Production, Transportation and Moving occupations in Ahtanum are Production (85 | 5.9%), Material Moving (44 | 3.1%), and Transportation (35 | 2.4%).
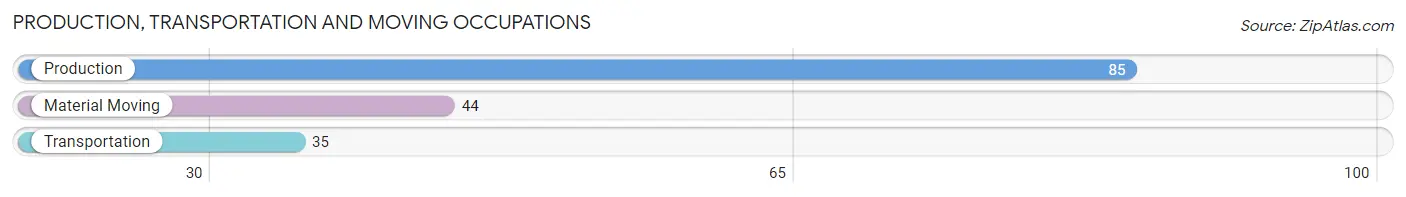
Production, Transportation and Moving Occupations by Sex
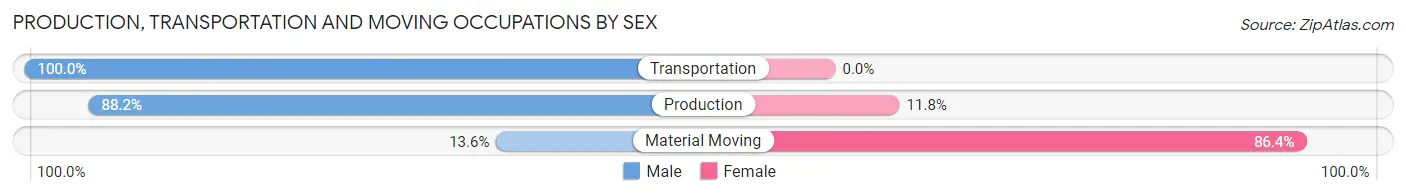
| Occupation | Male | Female |
| Production | 75 (88.2%) | 10 (11.8%) |
| Transportation | 35 (100.0%) | 0 (0.0%) |
| Material Moving | 6 (13.6%) | 38 (86.4%) |
| Total (Category) | 116 (70.7%) | 48 (29.3%) |
| Total (Overall) | 911 (63.4%) | 525 (36.6%) |
Employment Industries by Sex in Ahtanum
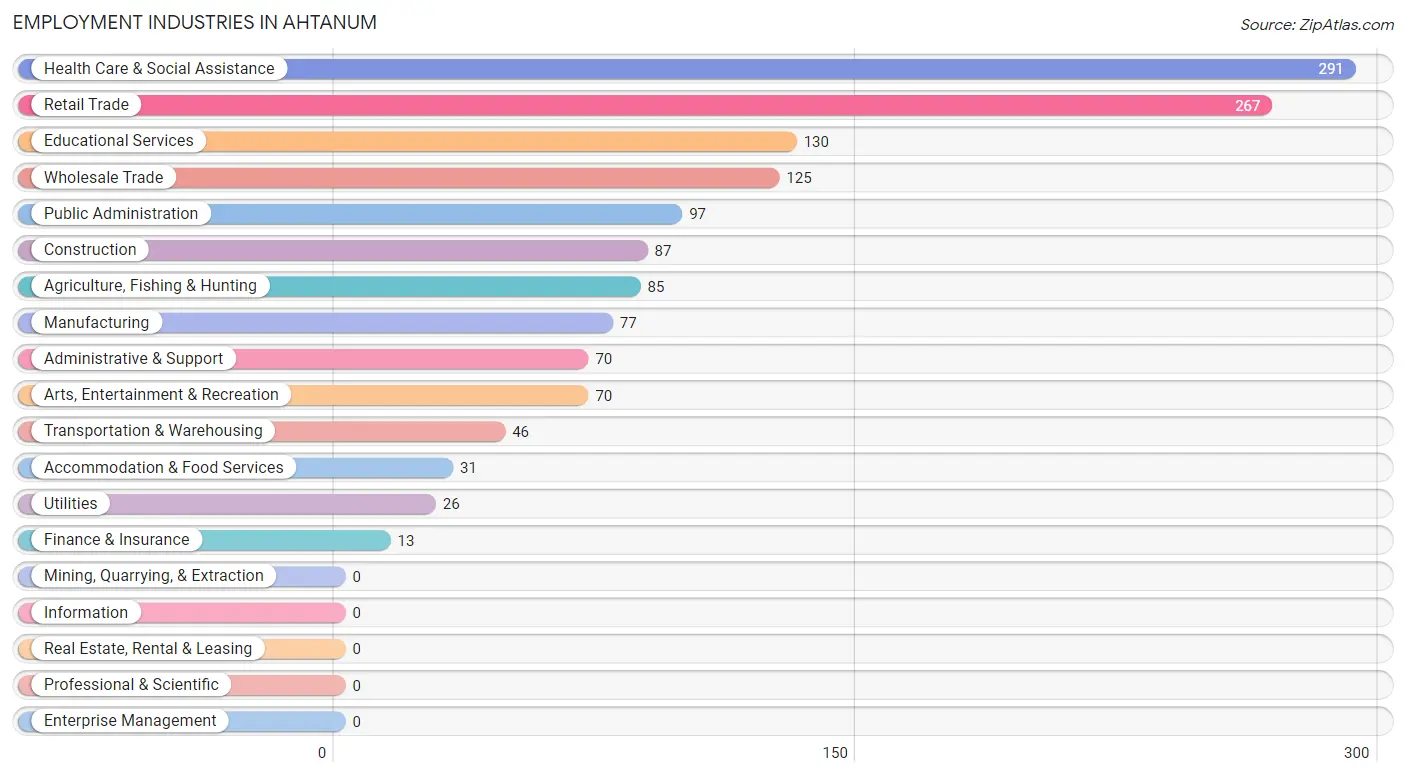
Employment Industries in Ahtanum
The major employment industries in Ahtanum include Health Care & Social Assistance (291 | 20.3%), Retail Trade (267 | 18.6%), Educational Services (130 | 9.0%), Wholesale Trade (125 | 8.7%), and Public Administration (97 | 6.8%).
Employment Industries by Sex in Ahtanum
The Ahtanum industries that see more men than women are Utilities (100.0%), Construction (87.4%), and Public Administration (85.6%), whereas the industries that tend to have a higher number of women are Finance & Insurance (100.0%), Educational Services (69.2%), and Arts, Entertainment & Recreation (61.4%).
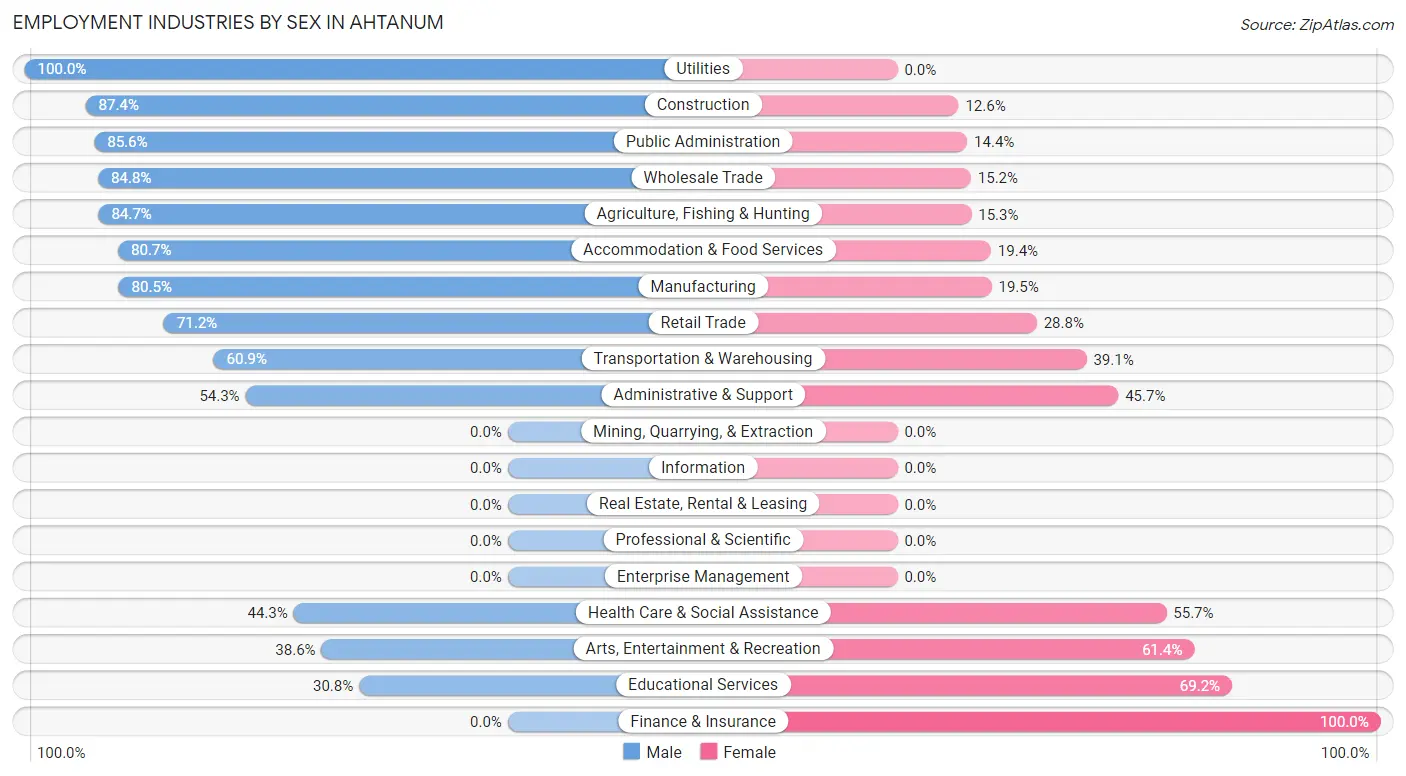
| Industry | Male | Female |
| Agriculture, Fishing & Hunting | 72 (84.7%) | 13 (15.3%) |
| Mining, Quarrying, & Extraction | 0 (0.0%) | 0 (0.0%) |
| Construction | 76 (87.4%) | 11 (12.6%) |
| Manufacturing | 62 (80.5%) | 15 (19.5%) |
| Wholesale Trade | 106 (84.8%) | 19 (15.2%) |
| Retail Trade | 190 (71.2%) | 77 (28.8%) |
| Transportation & Warehousing | 28 (60.9%) | 18 (39.1%) |
| Utilities | 26 (100.0%) | 0 (0.0%) |
| Information | 0 (0.0%) | 0 (0.0%) |
| Finance & Insurance | 0 (0.0%) | 13 (100.0%) |
| Real Estate, Rental & Leasing | 0 (0.0%) | 0 (0.0%) |
| Professional & Scientific | 0 (0.0%) | 0 (0.0%) |
| Enterprise Management | 0 (0.0%) | 0 (0.0%) |
| Administrative & Support | 38 (54.3%) | 32 (45.7%) |
| Educational Services | 40 (30.8%) | 90 (69.2%) |
| Health Care & Social Assistance | 129 (44.3%) | 162 (55.7%) |
| Arts, Entertainment & Recreation | 27 (38.6%) | 43 (61.4%) |
| Accommodation & Food Services | 25 (80.6%) | 6 (19.4%) |
| Public Administration | 83 (85.6%) | 14 (14.4%) |
| Total | 911 (63.4%) | 525 (36.6%) |
Education in Ahtanum
School Enrollment in Ahtanum
The most common levels of schooling among the 957 students in Ahtanum are high school (280 | 29.3%), elementary school (194 | 20.3%), and middle school (191 | 20.0%).
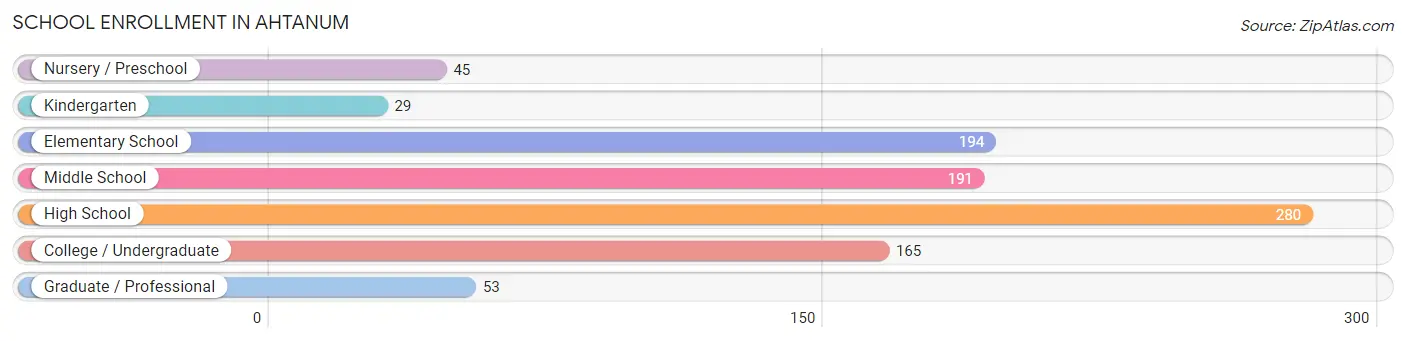
| School Level | # Students | % Students |
| Nursery / Preschool | 45 | 4.7% |
| Kindergarten | 29 | 3.0% |
| Elementary School | 194 | 20.3% |
| Middle School | 191 | 20.0% |
| High School | 280 | 29.3% |
| College / Undergraduate | 165 | 17.2% |
| Graduate / Professional | 53 | 5.5% |
| Total | 957 | 100.0% |
School Enrollment by Age by Funding Source in Ahtanum
Out of a total of 957 students who are enrolled in schools in Ahtanum, 103 (10.8%) attend a private institution, while the remaining 854 (89.2%) are enrolled in public schools. The age group of 3 to 4 year olds has the highest likelihood of being enrolled in private schools, with 9 (100.0% in the age bracket) enrolled. Conversely, the age group of 5 to 9 year old has the lowest likelihood of being enrolled in a private school, with 206 (100.0% in the age bracket) attending a public institution.
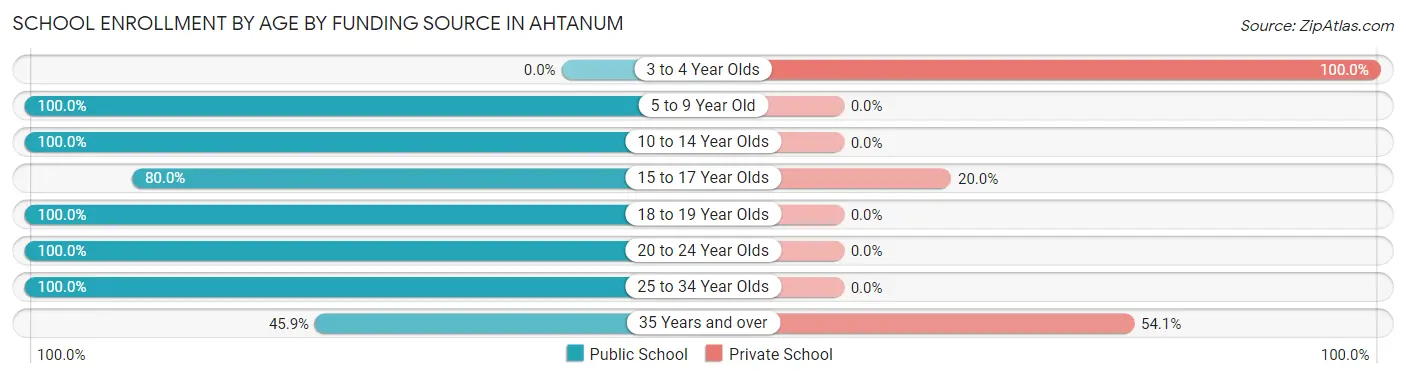
| Age Bracket | Public School | Private School |
| 3 to 4 Year Olds | 0 (0.0%) | 9 (100.0%) |
| 5 to 9 Year Old | 206 (100.0%) | 0 (0.0%) |
| 10 to 14 Year Olds | 266 (100.0%) | 0 (0.0%) |
| 15 to 17 Year Olds | 164 (80.0%) | 41 (20.0%) |
| 18 to 19 Year Olds | 53 (100.0%) | 0 (0.0%) |
| 20 to 24 Year Olds | 100 (100.0%) | 0 (0.0%) |
| 25 to 34 Year Olds | 20 (100.0%) | 0 (0.0%) |
| 35 Years and over | 45 (45.9%) | 53 (54.1%) |
| Total | 854 (89.2%) | 103 (10.8%) |
Educational Attainment by Field of Study in Ahtanum
Science & technology (84 | 16.9%), education (82 | 16.5%), physical & health sciences (81 | 16.3%), communications (48 | 9.7%), and social sciences (44 | 8.9%) are the most common fields of study among 496 individuals in Ahtanum who have obtained a bachelor's degree or higher.
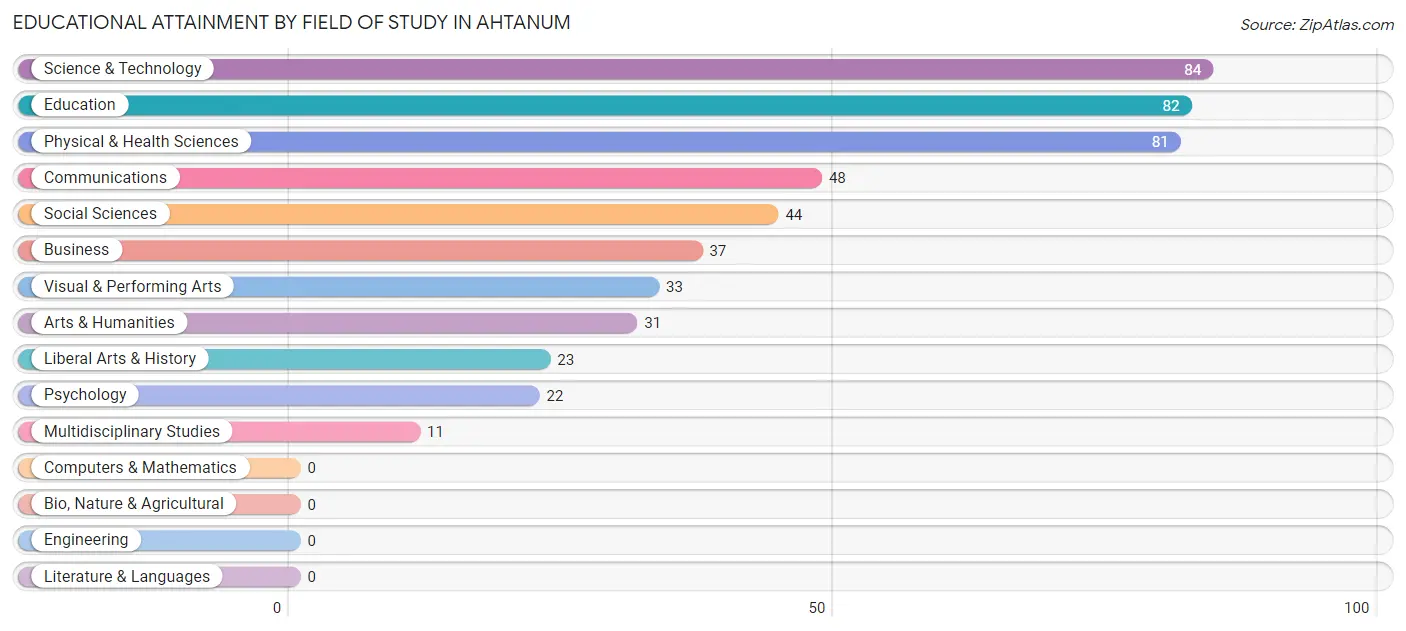
| Field of Study | # Graduates | % Graduates |
| Computers & Mathematics | 0 | 0.0% |
| Bio, Nature & Agricultural | 0 | 0.0% |
| Physical & Health Sciences | 81 | 16.3% |
| Psychology | 22 | 4.4% |
| Social Sciences | 44 | 8.9% |
| Engineering | 0 | 0.0% |
| Multidisciplinary Studies | 11 | 2.2% |
| Science & Technology | 84 | 16.9% |
| Business | 37 | 7.5% |
| Education | 82 | 16.5% |
| Literature & Languages | 0 | 0.0% |
| Liberal Arts & History | 23 | 4.6% |
| Visual & Performing Arts | 33 | 6.7% |
| Communications | 48 | 9.7% |
| Arts & Humanities | 31 | 6.2% |
| Total | 496 | 100.0% |
Transportation & Commute in Ahtanum
Vehicle Availability by Sex in Ahtanum
The most prevalent vehicle ownership categories in Ahtanum are males with 2 vehicles (231, accounting for 27.0%) and females with 2 vehicles (147, making up 46.2%).
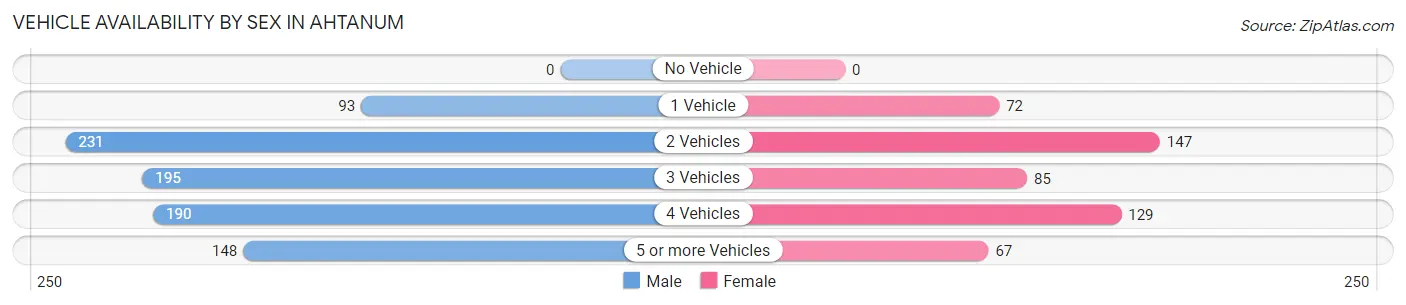
| Vehicles Available | Male | Female |
| No Vehicle | 0 (0.0%) | 0 (0.0%) |
| 1 Vehicle | 93 (10.8%) | 72 (14.4%) |
| 2 Vehicles | 231 (27.0%) | 147 (29.4%) |
| 3 Vehicles | 195 (22.8%) | 85 (17.0%) |
| 4 Vehicles | 190 (22.2%) | 129 (25.8%) |
| 5 or more Vehicles | 148 (17.3%) | 67 (13.4%) |
| Total | 857 (100.0%) | 500 (100.0%) |
Commute Time in Ahtanum
The most frequently occuring commute durations in Ahtanum are 20 to 24 minutes (273 commuters, 21.0%), 15 to 19 minutes (272 commuters, 20.9%), and 10 to 14 minutes (208 commuters, 16.0%).
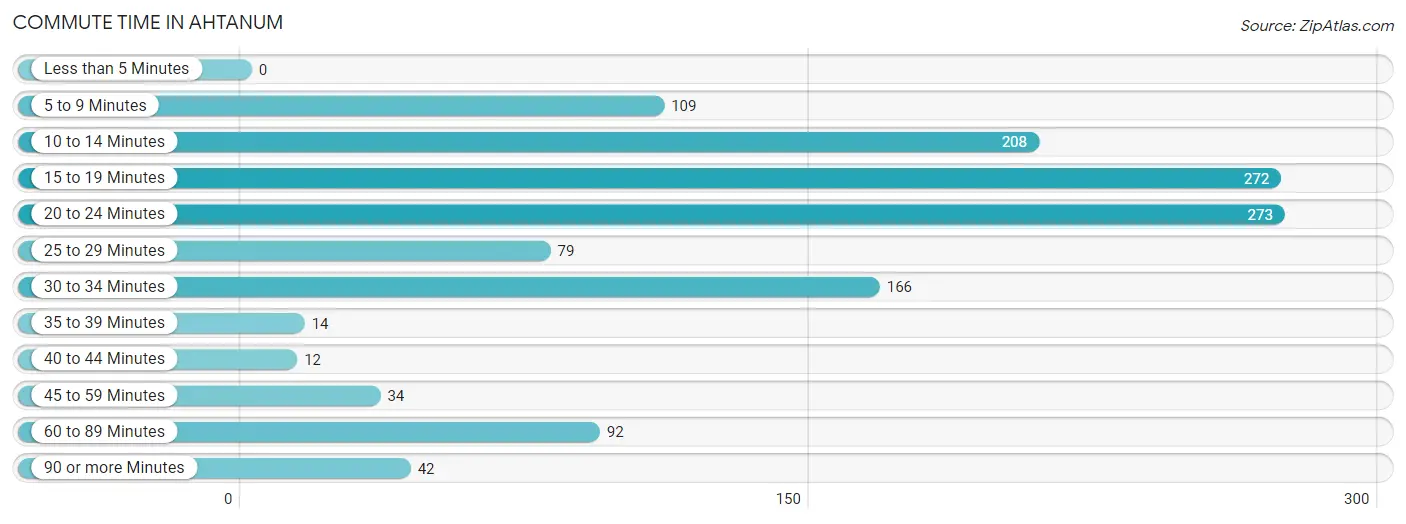
| Commute Time | # Commuters | % Commuters |
| Less than 5 Minutes | 0 | 0.0% |
| 5 to 9 Minutes | 109 | 8.4% |
| 10 to 14 Minutes | 208 | 16.0% |
| 15 to 19 Minutes | 272 | 20.9% |
| 20 to 24 Minutes | 273 | 21.0% |
| 25 to 29 Minutes | 79 | 6.1% |
| 30 to 34 Minutes | 166 | 12.8% |
| 35 to 39 Minutes | 14 | 1.1% |
| 40 to 44 Minutes | 12 | 0.9% |
| 45 to 59 Minutes | 34 | 2.6% |
| 60 to 89 Minutes | 92 | 7.1% |
| 90 or more Minutes | 42 | 3.2% |
Commute Time by Sex in Ahtanum
The most common commute times in Ahtanum are 20 to 24 minutes (208 commuters, 24.9%) for males and 10 to 14 minutes (163 commuters, 34.9%) for females.
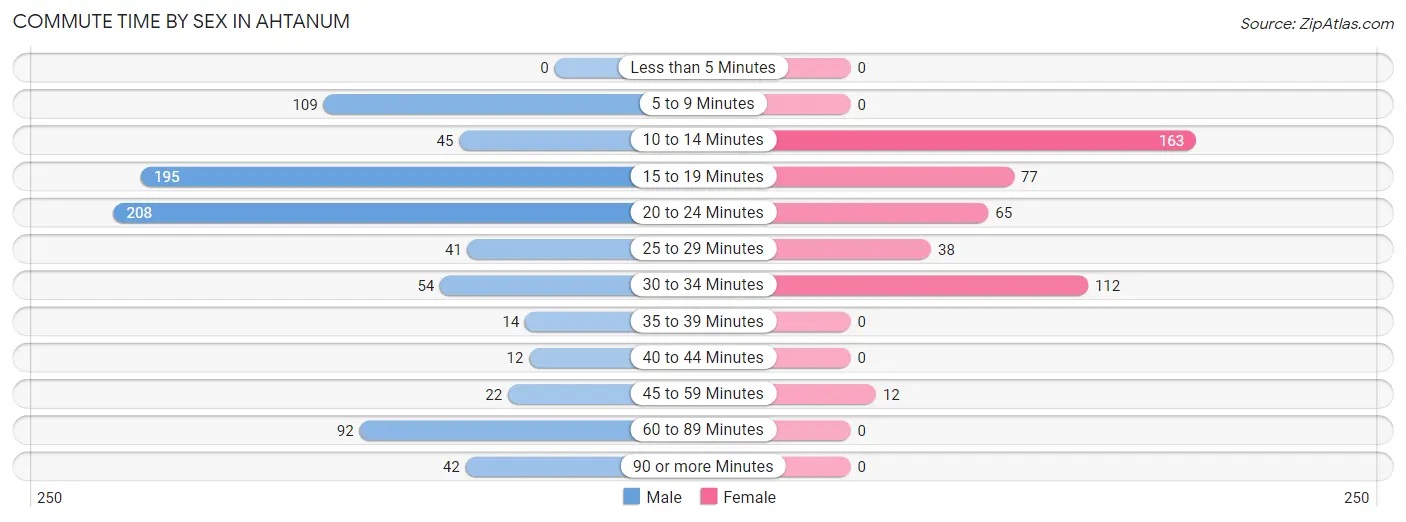
| Commute Time | Male | Female |
| Less than 5 Minutes | 0 (0.0%) | 0 (0.0%) |
| 5 to 9 Minutes | 109 (13.1%) | 0 (0.0%) |
| 10 to 14 Minutes | 45 (5.4%) | 163 (34.9%) |
| 15 to 19 Minutes | 195 (23.4%) | 77 (16.5%) |
| 20 to 24 Minutes | 208 (24.9%) | 65 (13.9%) |
| 25 to 29 Minutes | 41 (4.9%) | 38 (8.1%) |
| 30 to 34 Minutes | 54 (6.5%) | 112 (24.0%) |
| 35 to 39 Minutes | 14 (1.7%) | 0 (0.0%) |
| 40 to 44 Minutes | 12 (1.4%) | 0 (0.0%) |
| 45 to 59 Minutes | 22 (2.6%) | 12 (2.6%) |
| 60 to 89 Minutes | 92 (11.0%) | 0 (0.0%) |
| 90 or more Minutes | 42 (5.0%) | 0 (0.0%) |
Time of Departure to Work by Sex in Ahtanum
The most frequent times of departure to work in Ahtanum are 7:00 AM to 7:29 AM (186, 22.3%) for males and 7:00 AM to 7:29 AM (101, 21.6%) for females.
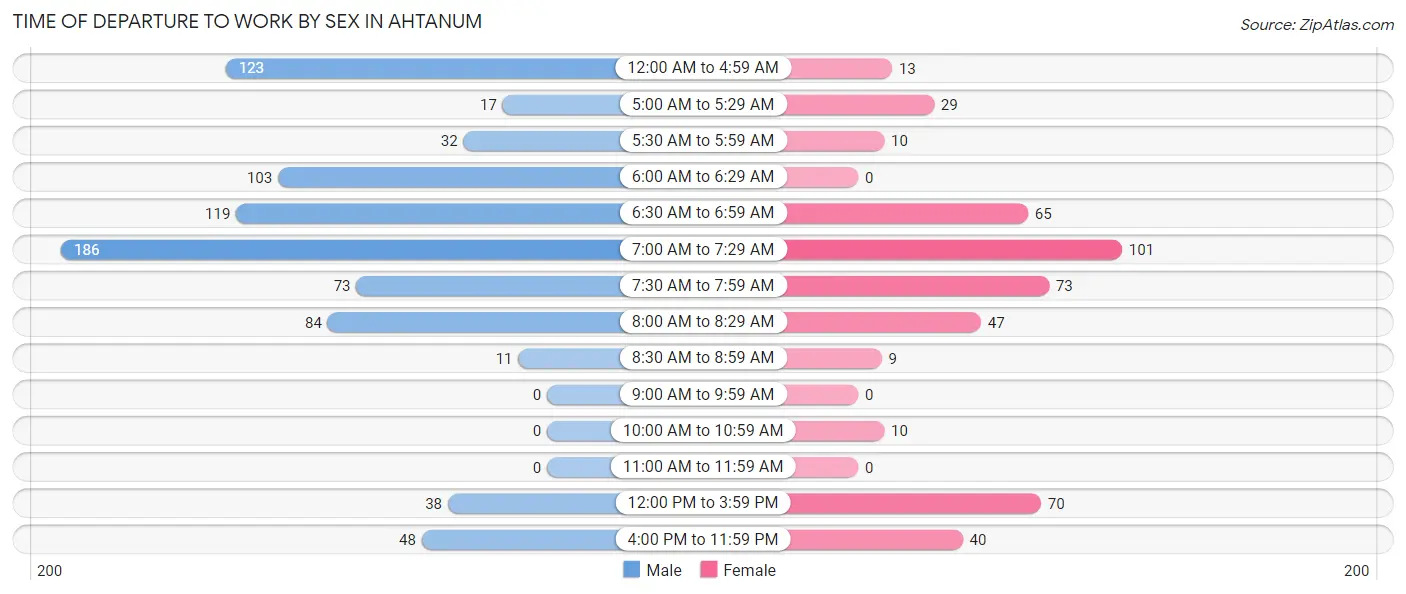
| Time of Departure | Male | Female |
| 12:00 AM to 4:59 AM | 123 (14.7%) | 13 (2.8%) |
| 5:00 AM to 5:29 AM | 17 (2.0%) | 29 (6.2%) |
| 5:30 AM to 5:59 AM | 32 (3.8%) | 10 (2.1%) |
| 6:00 AM to 6:29 AM | 103 (12.3%) | 0 (0.0%) |
| 6:30 AM to 6:59 AM | 119 (14.3%) | 65 (13.9%) |
| 7:00 AM to 7:29 AM | 186 (22.3%) | 101 (21.6%) |
| 7:30 AM to 7:59 AM | 73 (8.7%) | 73 (15.6%) |
| 8:00 AM to 8:29 AM | 84 (10.1%) | 47 (10.1%) |
| 8:30 AM to 8:59 AM | 11 (1.3%) | 9 (1.9%) |
| 9:00 AM to 9:59 AM | 0 (0.0%) | 0 (0.0%) |
| 10:00 AM to 10:59 AM | 0 (0.0%) | 10 (2.1%) |
| 11:00 AM to 11:59 AM | 0 (0.0%) | 0 (0.0%) |
| 12:00 PM to 3:59 PM | 38 (4.6%) | 70 (15.0%) |
| 4:00 PM to 11:59 PM | 48 (5.8%) | 40 (8.6%) |
| Total | 834 (100.0%) | 467 (100.0%) |
Housing Occupancy in Ahtanum
Occupancy by Ownership in Ahtanum
Of the total 1,161 dwellings in Ahtanum, owner-occupied units account for 1,037 (89.3%), while renter-occupied units make up 124 (10.7%).
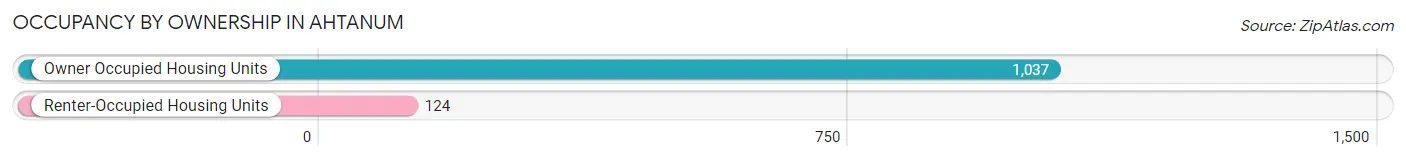
| Occupancy | # Housing Units | % Housing Units |
| Owner Occupied Housing Units | 1,037 | 89.3% |
| Renter-Occupied Housing Units | 124 | 10.7% |
| Total Occupied Housing Units | 1,161 | 100.0% |
Occupancy by Household Size in Ahtanum
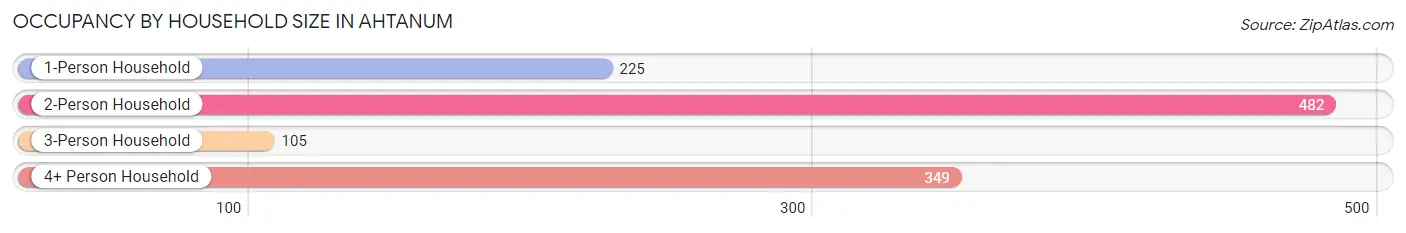
| Household Size | # Housing Units | % Housing Units |
| 1-Person Household | 225 | 19.4% |
| 2-Person Household | 482 | 41.5% |
| 3-Person Household | 105 | 9.0% |
| 4+ Person Household | 349 | 30.1% |
| Total Housing Units | 1,161 | 100.0% |
Occupancy by Ownership by Household Size in Ahtanum
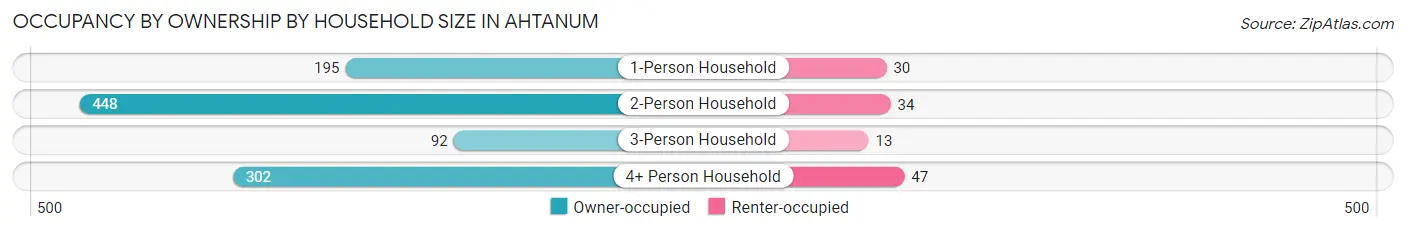
| Household Size | Owner-occupied | Renter-occupied |
| 1-Person Household | 195 (86.7%) | 30 (13.3%) |
| 2-Person Household | 448 (92.9%) | 34 (7.0%) |
| 3-Person Household | 92 (87.6%) | 13 (12.4%) |
| 4+ Person Household | 302 (86.5%) | 47 (13.5%) |
| Total Housing Units | 1,037 (89.3%) | 124 (10.7%) |
Occupancy by Educational Attainment in Ahtanum
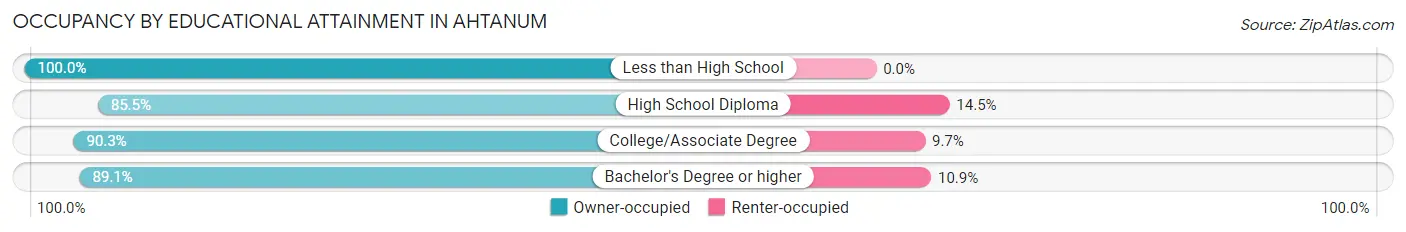
| Household Size | Owner-occupied | Renter-occupied |
| Less than High School | 72 (100.0%) | 0 (0.0%) |
| High School Diploma | 265 (85.5%) | 45 (14.5%) |
| College/Associate Degree | 438 (90.3%) | 47 (9.7%) |
| Bachelor's Degree or higher | 262 (89.1%) | 32 (10.9%) |
Occupancy by Age of Householder in Ahtanum
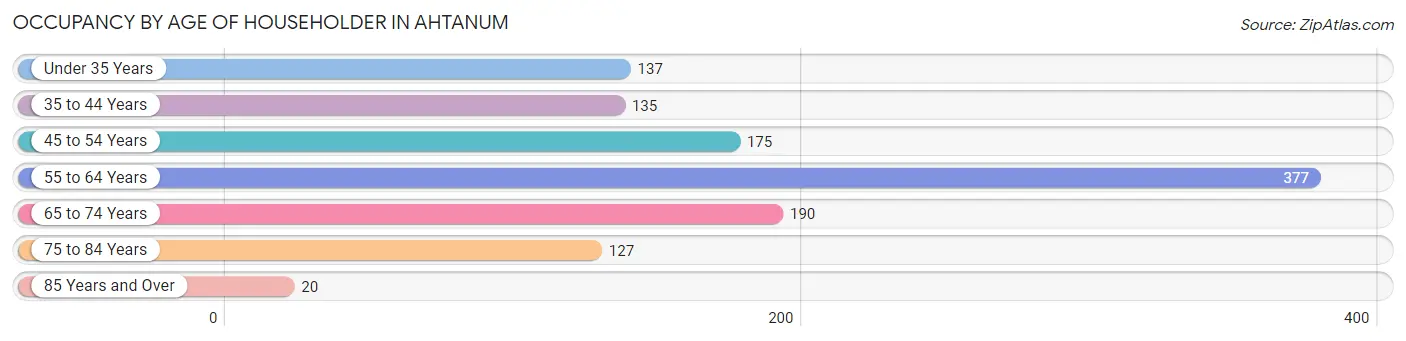
| Age Bracket | # Households | % Households |
| Under 35 Years | 137 | 11.8% |
| 35 to 44 Years | 135 | 11.6% |
| 45 to 54 Years | 175 | 15.1% |
| 55 to 64 Years | 377 | 32.5% |
| 65 to 74 Years | 190 | 16.4% |
| 75 to 84 Years | 127 | 10.9% |
| 85 Years and Over | 20 | 1.7% |
| Total | 1,161 | 100.0% |
Housing Finances in Ahtanum
Median Income by Occupancy in Ahtanum
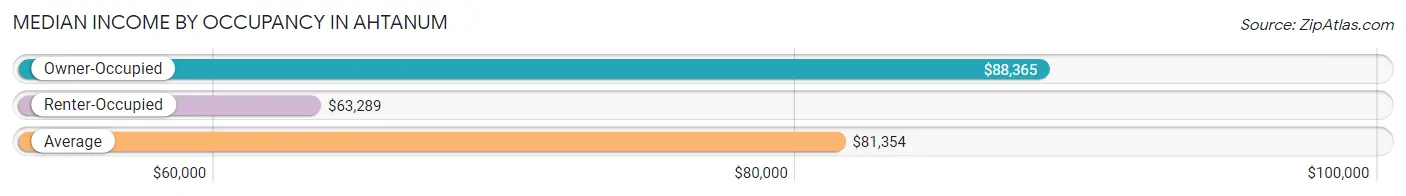
| Occupancy Type | # Households | Median Income |
| Owner-Occupied | 1,037 (89.3%) | $88,365 |
| Renter-Occupied | 124 (10.7%) | $63,289 |
| Average | 1,161 (100.0%) | $81,354 |
Occupancy by Householder Income Bracket in Ahtanum
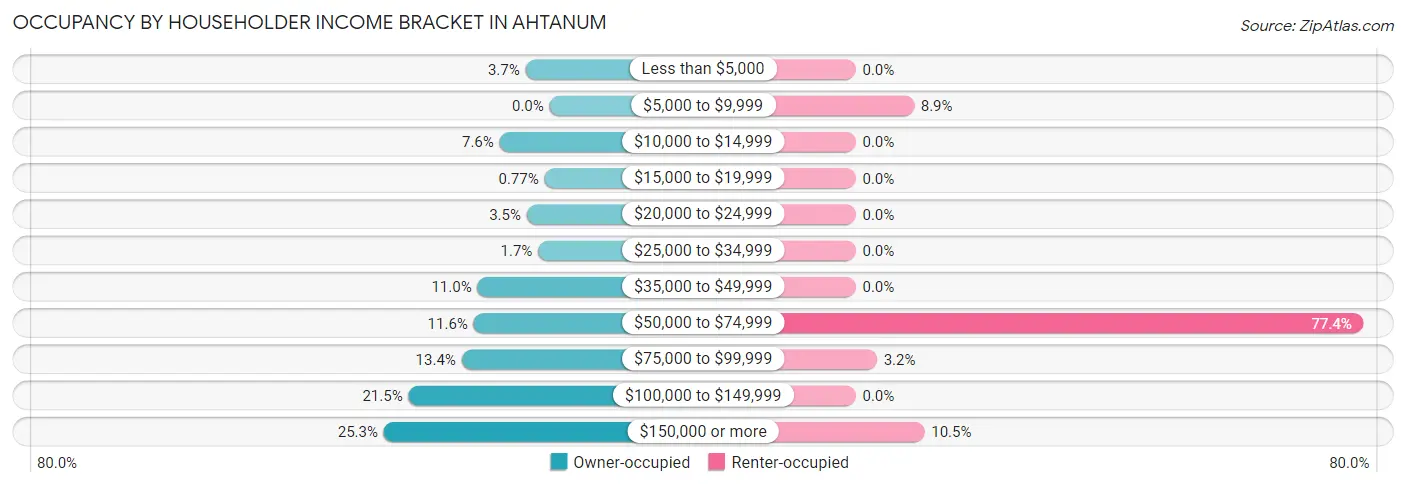
| Income Bracket | Owner-occupied | Renter-occupied |
| Less than $5,000 | 38 (3.7%) | 0 (0.0%) |
| $5,000 to $9,999 | 0 (0.0%) | 11 (8.9%) |
| $10,000 to $14,999 | 79 (7.6%) | 0 (0.0%) |
| $15,000 to $19,999 | 8 (0.8%) | 0 (0.0%) |
| $20,000 to $24,999 | 36 (3.5%) | 0 (0.0%) |
| $25,000 to $34,999 | 18 (1.7%) | 0 (0.0%) |
| $35,000 to $49,999 | 114 (11.0%) | 0 (0.0%) |
| $50,000 to $74,999 | 120 (11.6%) | 96 (77.4%) |
| $75,000 to $99,999 | 139 (13.4%) | 4 (3.2%) |
| $100,000 to $149,999 | 223 (21.5%) | 0 (0.0%) |
| $150,000 or more | 262 (25.3%) | 13 (10.5%) |
| Total | 1,037 (100.0%) | 124 (100.0%) |
Monthly Housing Cost Tiers in Ahtanum
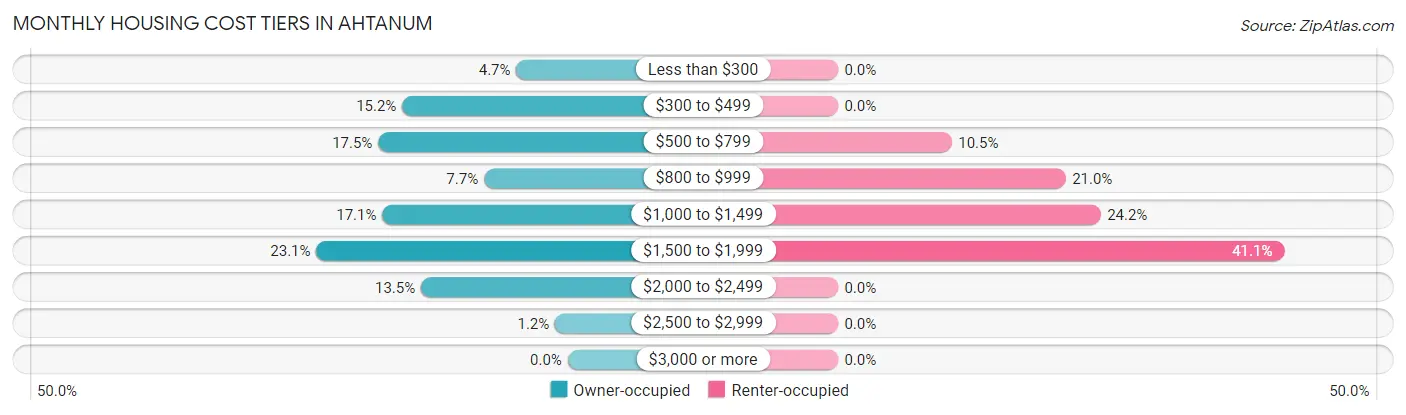
| Monthly Cost | Owner-occupied | Renter-occupied |
| Less than $300 | 49 (4.7%) | 0 (0.0%) |
| $300 to $499 | 158 (15.2%) | 0 (0.0%) |
| $500 to $799 | 181 (17.4%) | 13 (10.5%) |
| $800 to $999 | 80 (7.7%) | 26 (21.0%) |
| $1,000 to $1,499 | 177 (17.1%) | 30 (24.2%) |
| $1,500 to $1,999 | 240 (23.1%) | 51 (41.1%) |
| $2,000 to $2,499 | 140 (13.5%) | 0 (0.0%) |
| $2,500 to $2,999 | 12 (1.2%) | 0 (0.0%) |
| $3,000 or more | 0 (0.0%) | 0 (0.0%) |
| Total | 1,037 (100.0%) | 124 (100.0%) |
Physical Housing Characteristics in Ahtanum
Housing Structures in Ahtanum
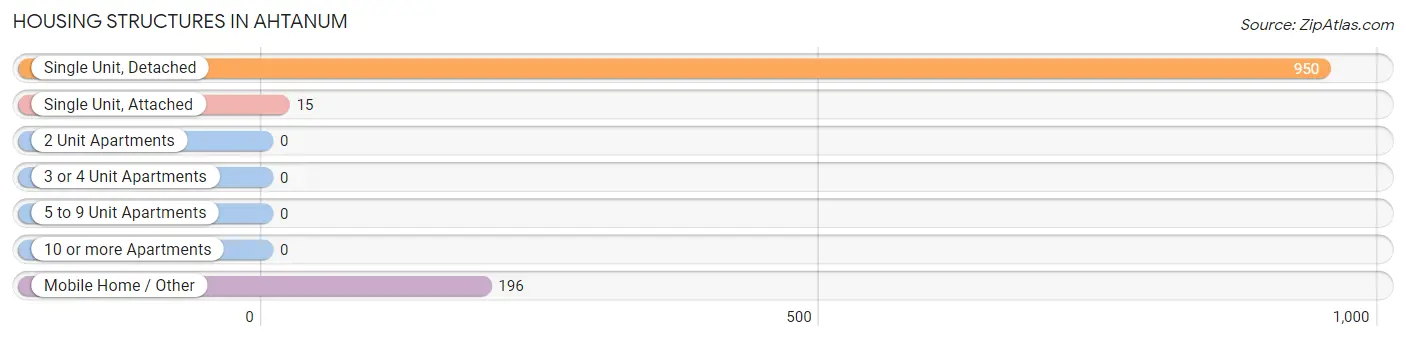
| Structure Type | # Housing Units | % Housing Units |
| Single Unit, Detached | 950 | 81.8% |
| Single Unit, Attached | 15 | 1.3% |
| 2 Unit Apartments | 0 | 0.0% |
| 3 or 4 Unit Apartments | 0 | 0.0% |
| 5 to 9 Unit Apartments | 0 | 0.0% |
| 10 or more Apartments | 0 | 0.0% |
| Mobile Home / Other | 196 | 16.9% |
| Total | 1,161 | 100.0% |
Housing Structures by Occupancy in Ahtanum
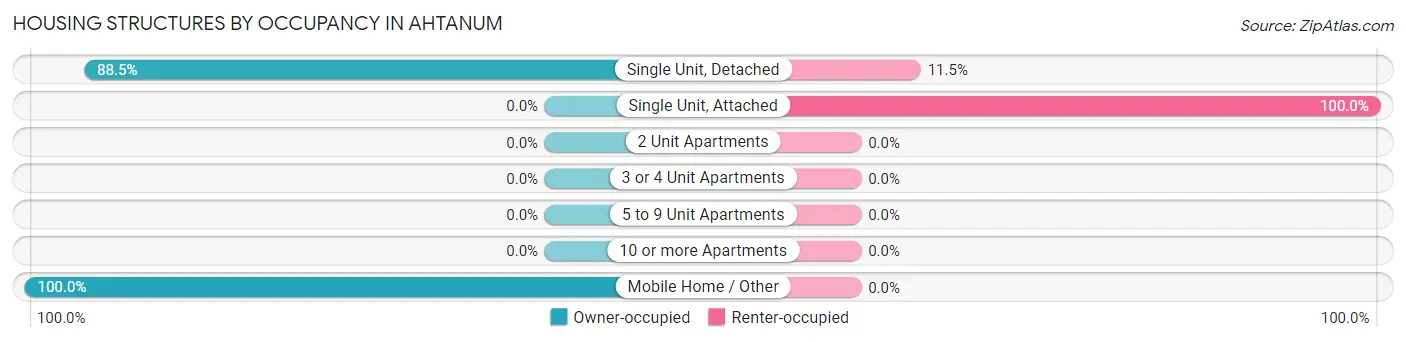
| Structure Type | Owner-occupied | Renter-occupied |
| Single Unit, Detached | 841 (88.5%) | 109 (11.5%) |
| Single Unit, Attached | 0 (0.0%) | 15 (100.0%) |
| 2 Unit Apartments | 0 (0.0%) | 0 (0.0%) |
| 3 or 4 Unit Apartments | 0 (0.0%) | 0 (0.0%) |
| 5 to 9 Unit Apartments | 0 (0.0%) | 0 (0.0%) |
| 10 or more Apartments | 0 (0.0%) | 0 (0.0%) |
| Mobile Home / Other | 196 (100.0%) | 0 (0.0%) |
| Total | 1,037 (89.3%) | 124 (10.7%) |
Housing Structures by Number of Rooms in Ahtanum
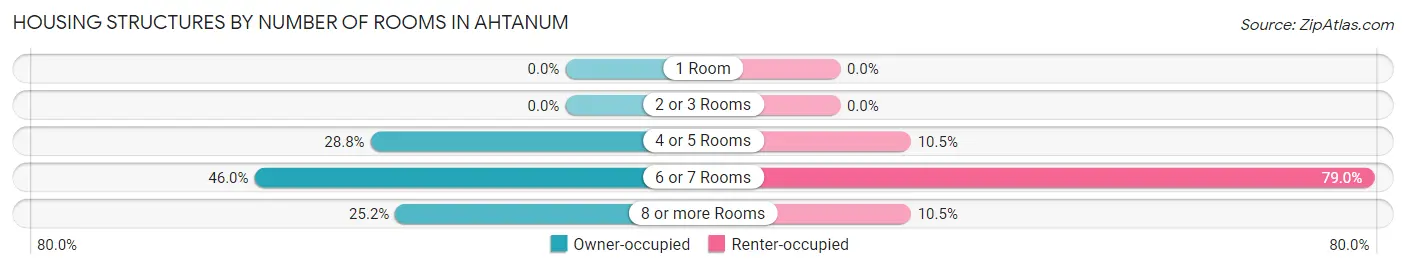
| Number of Rooms | Owner-occupied | Renter-occupied |
| 1 Room | 0 (0.0%) | 0 (0.0%) |
| 2 or 3 Rooms | 0 (0.0%) | 0 (0.0%) |
| 4 or 5 Rooms | 299 (28.8%) | 13 (10.5%) |
| 6 or 7 Rooms | 477 (46.0%) | 98 (79.0%) |
| 8 or more Rooms | 261 (25.2%) | 13 (10.5%) |
| Total | 1,037 (100.0%) | 124 (100.0%) |
Housing Structure by Heating Type in Ahtanum
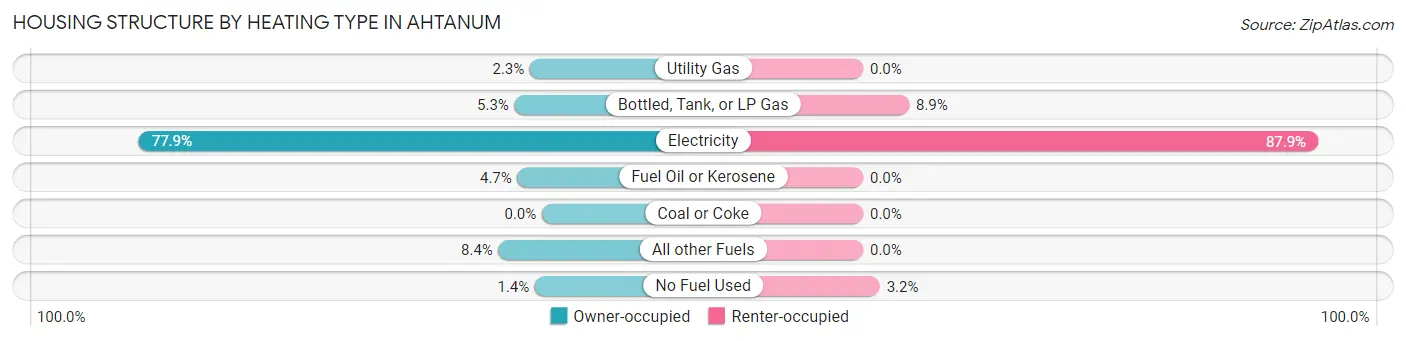
| Heating Type | Owner-occupied | Renter-occupied |
| Utility Gas | 24 (2.3%) | 0 (0.0%) |
| Bottled, Tank, or LP Gas | 55 (5.3%) | 11 (8.9%) |
| Electricity | 808 (77.9%) | 109 (87.9%) |
| Fuel Oil or Kerosene | 49 (4.7%) | 0 (0.0%) |
| Coal or Coke | 0 (0.0%) | 0 (0.0%) |
| All other Fuels | 87 (8.4%) | 0 (0.0%) |
| No Fuel Used | 14 (1.3%) | 4 (3.2%) |
| Total | 1,037 (100.0%) | 124 (100.0%) |
Household Vehicle Usage in Ahtanum
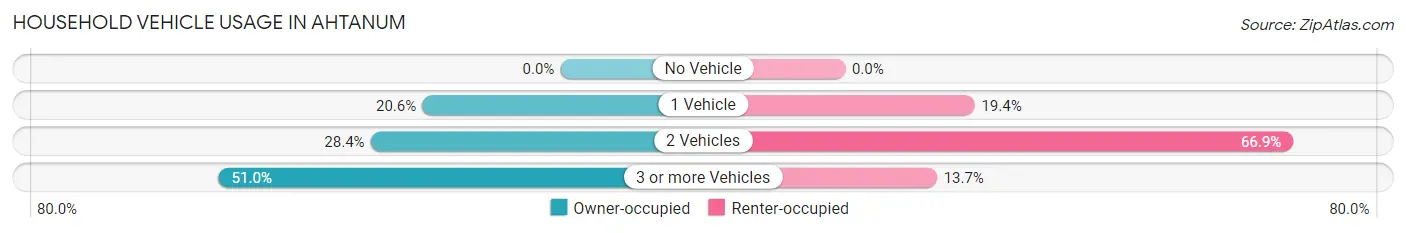
| Vehicles per Household | Owner-occupied | Renter-occupied |
| No Vehicle | 0 (0.0%) | 0 (0.0%) |
| 1 Vehicle | 214 (20.6%) | 24 (19.4%) |
| 2 Vehicles | 294 (28.3%) | 83 (66.9%) |
| 3 or more Vehicles | 529 (51.0%) | 17 (13.7%) |
| Total | 1,037 (100.0%) | 124 (100.0%) |
Real Estate & Mortgages in Ahtanum
Real Estate and Mortgage Overview in Ahtanum
| Characteristic | Without Mortgage | With Mortgage |
| Housing Units | 429 | 608 |
| Median Property Value | $215,300 | $291,600 |
| Median Household Income | $75,785 | $204 |
| Monthly Housing Costs | $510 | $0 |
| Real Estate Taxes | $2,071 | $0 |
Property Value by Mortgage Status in Ahtanum
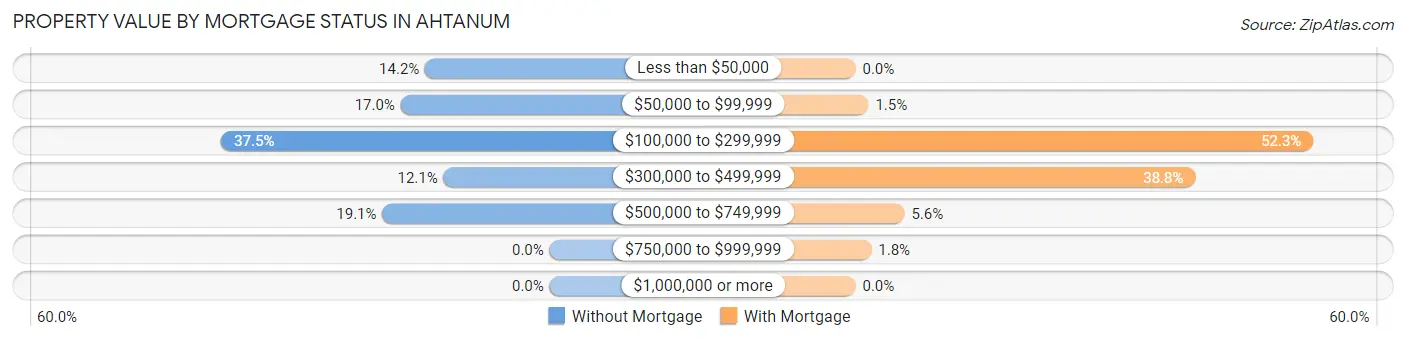
| Property Value | Without Mortgage | With Mortgage |
| Less than $50,000 | 61 (14.2%) | 0 (0.0%) |
| $50,000 to $99,999 | 73 (17.0%) | 9 (1.5%) |
| $100,000 to $299,999 | 161 (37.5%) | 318 (52.3%) |
| $300,000 to $499,999 | 52 (12.1%) | 236 (38.8%) |
| $500,000 to $749,999 | 82 (19.1%) | 34 (5.6%) |
| $750,000 to $999,999 | 0 (0.0%) | 11 (1.8%) |
| $1,000,000 or more | 0 (0.0%) | 0 (0.0%) |
| Total | 429 (100.0%) | 608 (100.0%) |
Household Income by Mortgage Status in Ahtanum
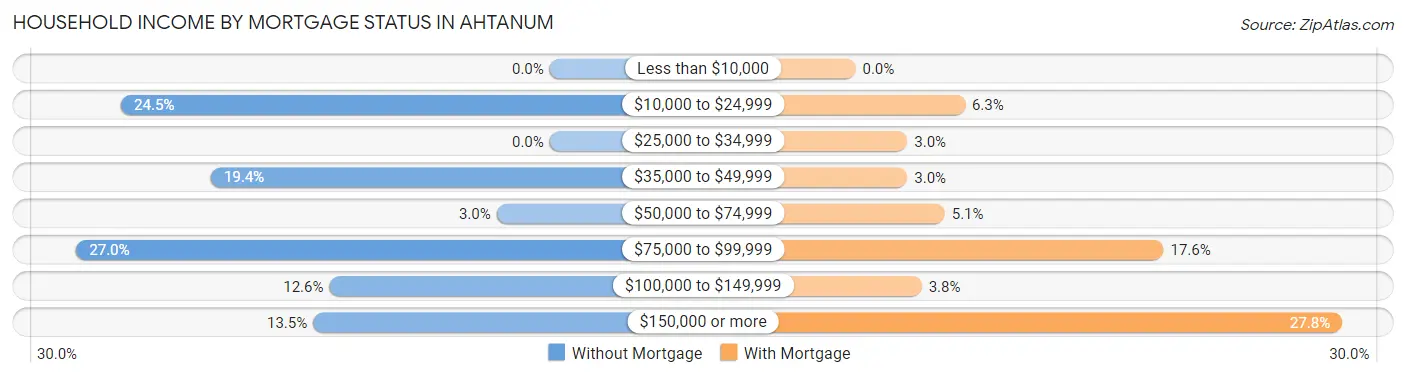
| Household Income | Without Mortgage | With Mortgage |
| Less than $10,000 | 0 (0.0%) | 0 (0.0%) |
| $10,000 to $24,999 | 105 (24.5%) | 38 (6.2%) |
| $25,000 to $34,999 | 0 (0.0%) | 18 (3.0%) |
| $35,000 to $49,999 | 83 (19.4%) | 18 (3.0%) |
| $50,000 to $74,999 | 13 (3.0%) | 31 (5.1%) |
| $75,000 to $99,999 | 116 (27.0%) | 107 (17.6%) |
| $100,000 to $149,999 | 54 (12.6%) | 23 (3.8%) |
| $150,000 or more | 58 (13.5%) | 169 (27.8%) |
| Total | 429 (100.0%) | 608 (100.0%) |
Property Value to Household Income Ratio in Ahtanum
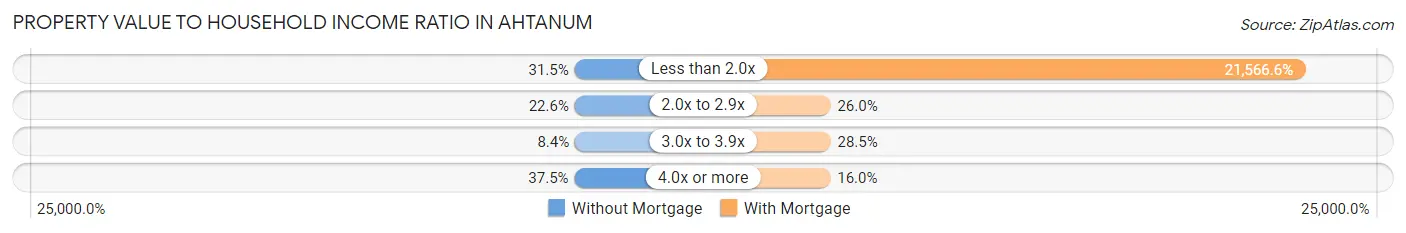
| Value-to-Income Ratio | Without Mortgage | With Mortgage |
| Less than 2.0x | 135 (31.5%) | 131,125 (21,566.6%) |
| 2.0x to 2.9x | 97 (22.6%) | 158 (26.0%) |
| 3.0x to 3.9x | 36 (8.4%) | 173 (28.4%) |
| 4.0x or more | 161 (37.5%) | 97 (16.0%) |
| Total | 429 (100.0%) | 608 (100.0%) |
Real Estate Taxes by Mortgage Status in Ahtanum
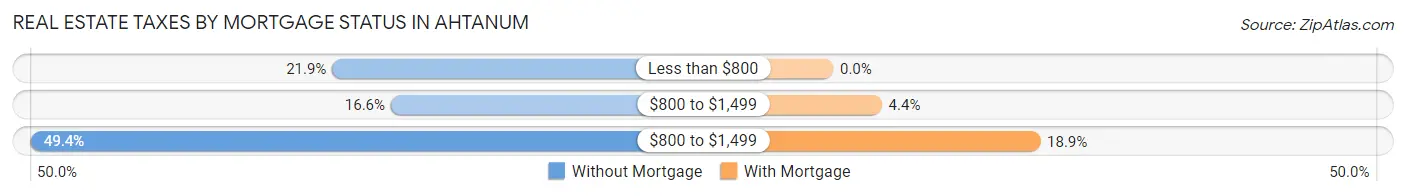
| Property Taxes | Without Mortgage | With Mortgage |
| Less than $800 | 94 (21.9%) | 0 (0.0%) |
| $800 to $1,499 | 71 (16.6%) | 27 (4.4%) |
| $800 to $1,499 | 212 (49.4%) | 115 (18.9%) |
| Total | 429 (100.0%) | 608 (100.0%) |
Health & Disability in Ahtanum
Health Insurance Coverage by Age in Ahtanum
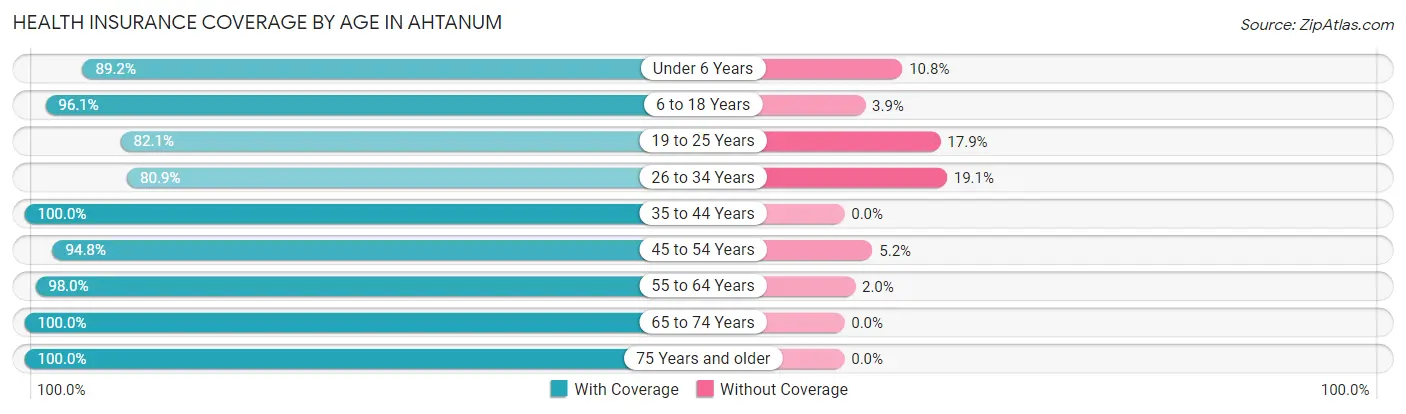
| Age Bracket | With Coverage | Without Coverage |
| Under 6 Years | 264 (89.2%) | 32 (10.8%) |
| 6 to 18 Years | 668 (96.1%) | 27 (3.9%) |
| 19 to 25 Years | 261 (82.1%) | 57 (17.9%) |
| 26 to 34 Years | 220 (80.9%) | 52 (19.1%) |
| 35 to 44 Years | 250 (100.0%) | 0 (0.0%) |
| 45 to 54 Years | 326 (94.8%) | 18 (5.2%) |
| 55 to 64 Years | 589 (98.0%) | 12 (2.0%) |
| 65 to 74 Years | 351 (100.0%) | 0 (0.0%) |
| 75 Years and older | 215 (100.0%) | 0 (0.0%) |
| Total | 3,144 (94.1%) | 198 (5.9%) |
Health Insurance Coverage by Citizenship Status in Ahtanum
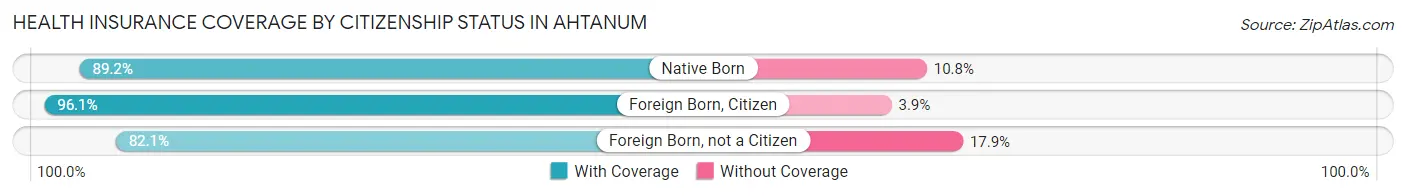
| Citizenship Status | With Coverage | Without Coverage |
| Native Born | 264 (89.2%) | 32 (10.8%) |
| Foreign Born, Citizen | 668 (96.1%) | 27 (3.9%) |
| Foreign Born, not a Citizen | 261 (82.1%) | 57 (17.9%) |
Health Insurance Coverage by Household Income in Ahtanum
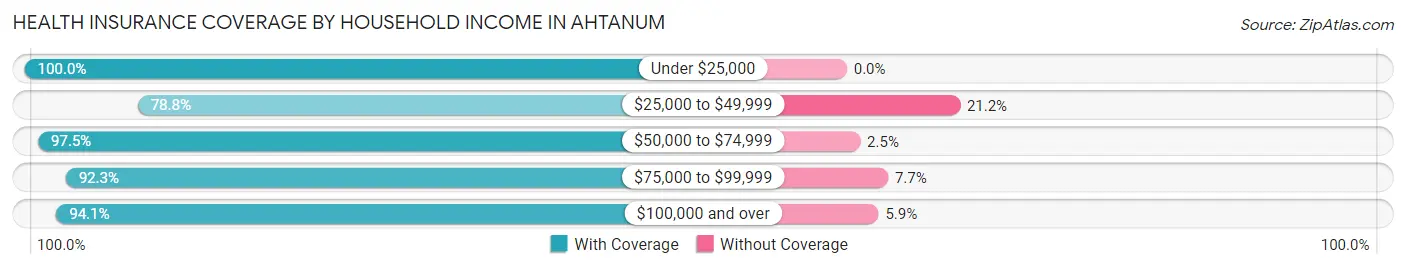
| Household Income | With Coverage | Without Coverage |
| Under $25,000 | 381 (100.0%) | 0 (0.0%) |
| $25,000 to $49,999 | 197 (78.8%) | 53 (21.2%) |
| $50,000 to $74,999 | 702 (97.5%) | 18 (2.5%) |
| $75,000 to $99,999 | 455 (92.3%) | 38 (7.7%) |
| $100,000 and over | 1,409 (94.1%) | 89 (5.9%) |
Public vs Private Health Insurance Coverage by Age in Ahtanum
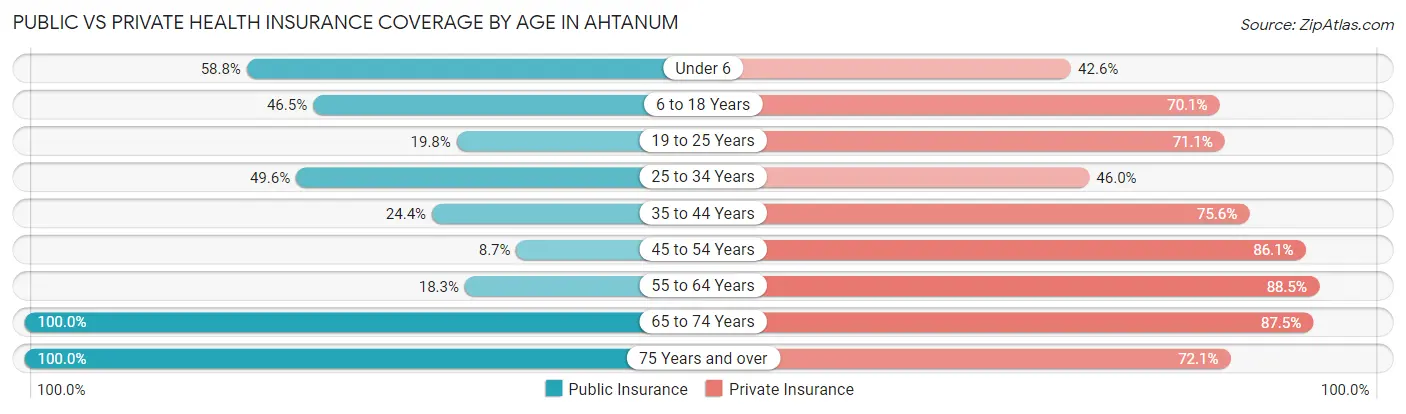
| Age Bracket | Public Insurance | Private Insurance |
| Under 6 | 174 (58.8%) | 126 (42.6%) |
| 6 to 18 Years | 323 (46.5%) | 487 (70.1%) |
| 19 to 25 Years | 63 (19.8%) | 226 (71.1%) |
| 25 to 34 Years | 135 (49.6%) | 125 (46.0%) |
| 35 to 44 Years | 61 (24.4%) | 189 (75.6%) |
| 45 to 54 Years | 30 (8.7%) | 296 (86.1%) |
| 55 to 64 Years | 110 (18.3%) | 532 (88.5%) |
| 65 to 74 Years | 351 (100.0%) | 307 (87.5%) |
| 75 Years and over | 215 (100.0%) | 155 (72.1%) |
| Total | 1,462 (43.8%) | 2,443 (73.1%) |
Disability Status by Sex by Age in Ahtanum
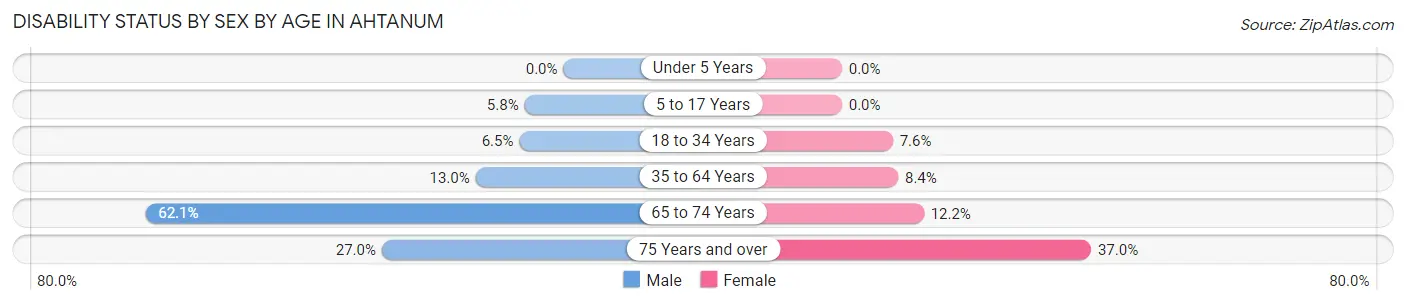
| Age Bracket | Male | Female |
| Under 5 Years | 0 (0.0%) | 0 (0.0%) |
| 5 to 17 Years | 22 (5.8%) | 0 (0.0%) |
| 18 to 34 Years | 25 (6.5%) | 22 (7.6%) |
| 35 to 64 Years | 84 (13.0%) | 46 (8.4%) |
| 65 to 74 Years | 126 (62.1%) | 18 (12.2%) |
| 75 Years and over | 31 (27.0%) | 37 (37.0%) |
Disability Class by Sex by Age in Ahtanum
Disability Class: Hearing Difficulty
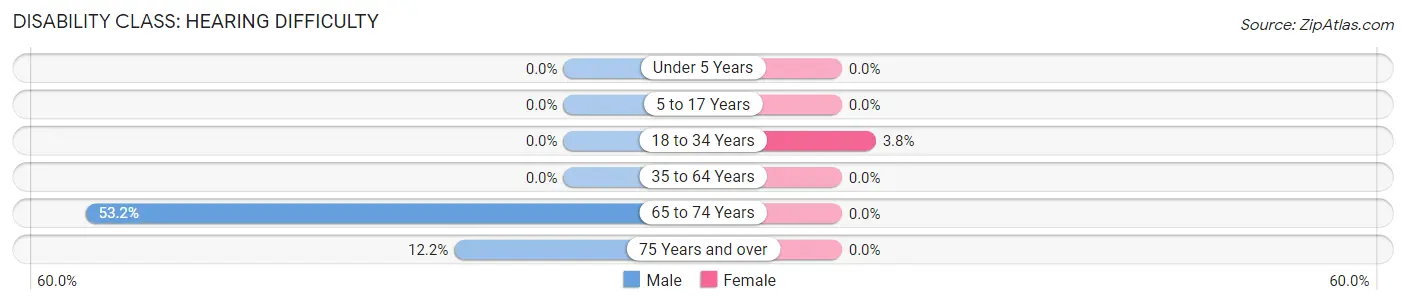
| Age Bracket | Male | Female |
| Under 5 Years | 0 (0.0%) | 0 (0.0%) |
| 5 to 17 Years | 0 (0.0%) | 0 (0.0%) |
| 18 to 34 Years | 0 (0.0%) | 11 (3.8%) |
| 35 to 64 Years | 0 (0.0%) | 0 (0.0%) |
| 65 to 74 Years | 108 (53.2%) | 0 (0.0%) |
| 75 Years and over | 14 (12.2%) | 0 (0.0%) |
Disability Class: Vision Difficulty
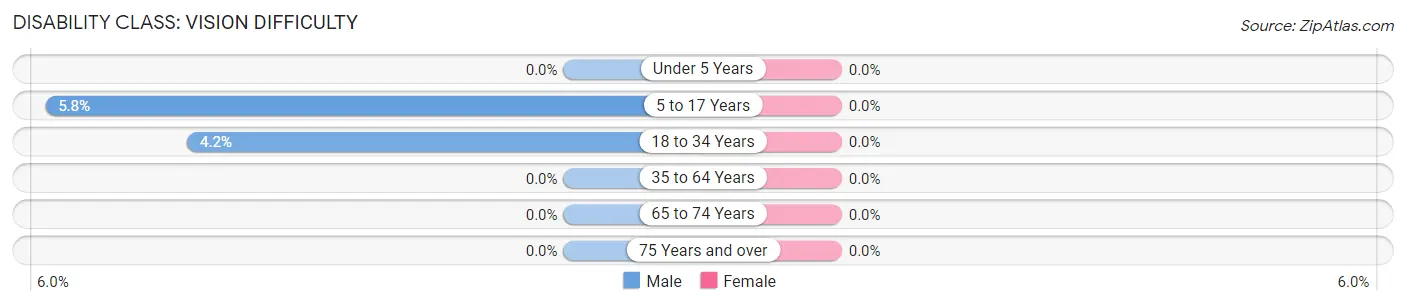
| Age Bracket | Male | Female |
| Under 5 Years | 0 (0.0%) | 0 (0.0%) |
| 5 to 17 Years | 22 (5.8%) | 0 (0.0%) |
| 18 to 34 Years | 16 (4.2%) | 0 (0.0%) |
| 35 to 64 Years | 0 (0.0%) | 0 (0.0%) |
| 65 to 74 Years | 0 (0.0%) | 0 (0.0%) |
| 75 Years and over | 0 (0.0%) | 0 (0.0%) |
Disability Class: Cognitive Difficulty
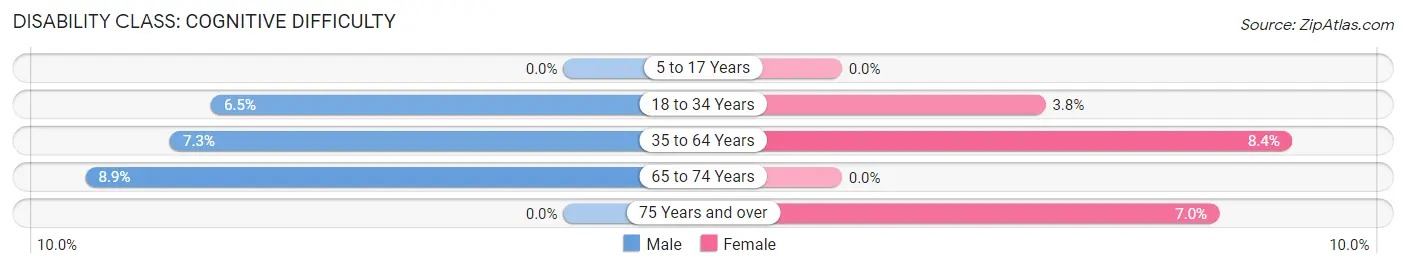
| Age Bracket | Male | Female |
| 5 to 17 Years | 0 (0.0%) | 0 (0.0%) |
| 18 to 34 Years | 25 (6.5%) | 11 (3.8%) |
| 35 to 64 Years | 47 (7.3%) | 46 (8.4%) |
| 65 to 74 Years | 18 (8.9%) | 0 (0.0%) |
| 75 Years and over | 0 (0.0%) | 7 (7.0%) |
Disability Class: Ambulatory Difficulty
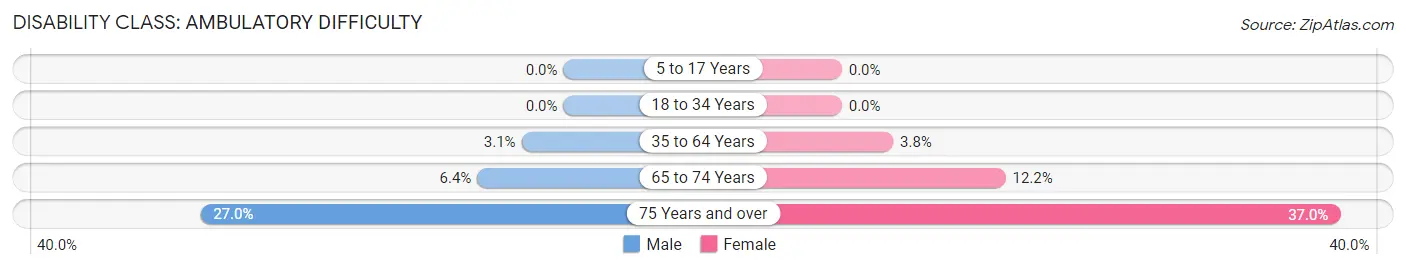
| Age Bracket | Male | Female |
| 5 to 17 Years | 0 (0.0%) | 0 (0.0%) |
| 18 to 34 Years | 0 (0.0%) | 0 (0.0%) |
| 35 to 64 Years | 20 (3.1%) | 21 (3.8%) |
| 65 to 74 Years | 13 (6.4%) | 18 (12.2%) |
| 75 Years and over | 31 (27.0%) | 37 (37.0%) |
Disability Class: Self-Care Difficulty
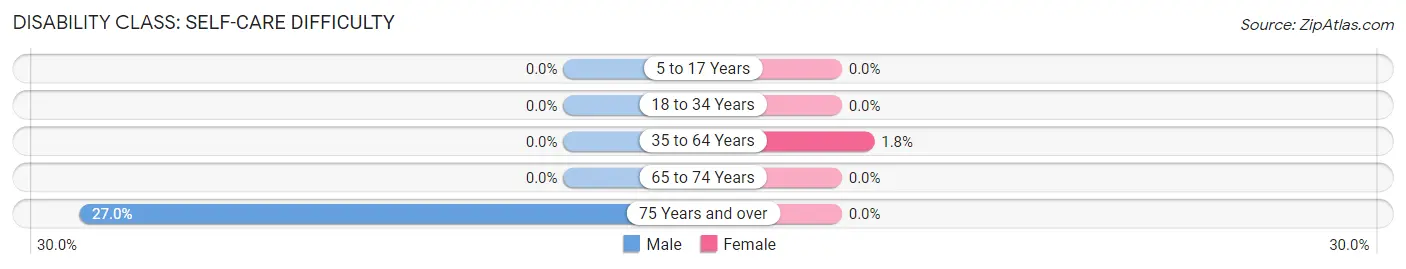
| Age Bracket | Male | Female |
| 5 to 17 Years | 0 (0.0%) | 0 (0.0%) |
| 18 to 34 Years | 0 (0.0%) | 0 (0.0%) |
| 35 to 64 Years | 0 (0.0%) | 10 (1.8%) |
| 65 to 74 Years | 0 (0.0%) | 0 (0.0%) |
| 75 Years and over | 31 (27.0%) | 0 (0.0%) |
Technology Access in Ahtanum
Computing Device Access in Ahtanum
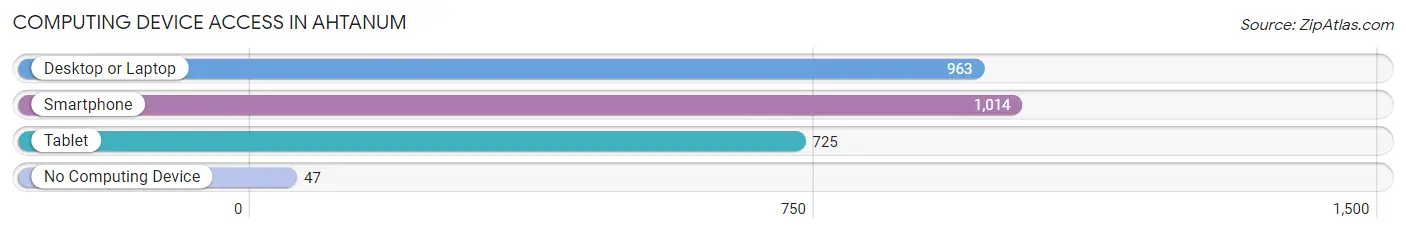
| Device Type | # Households | % Households |
| Desktop or Laptop | 963 | 83.0% |
| Smartphone | 1,014 | 87.3% |
| Tablet | 725 | 62.5% |
| No Computing Device | 47 | 4.1% |
| Total | 1,161 | 100.0% |
Internet Access in Ahtanum
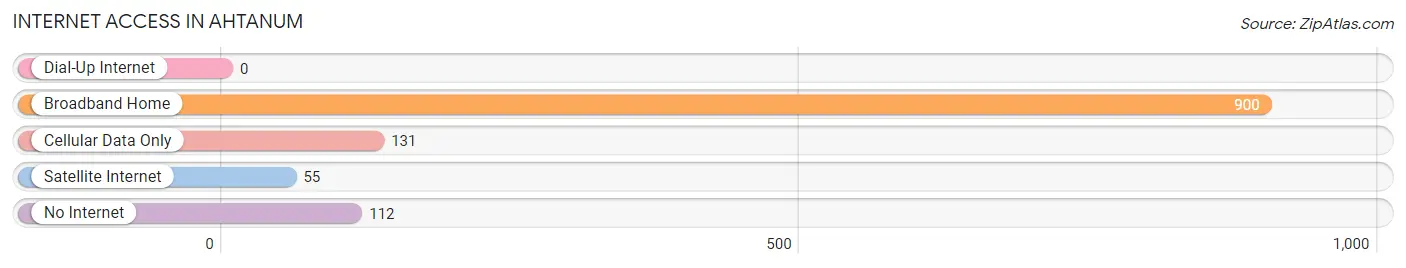
| Internet Type | # Households | % Households |
| Dial-Up Internet | 0 | 0.0% |
| Broadband Home | 900 | 77.5% |
| Cellular Data Only | 131 | 11.3% |
| Satellite Internet | 55 | 4.7% |
| No Internet | 112 | 9.7% |
| Total | 1,161 | 100.0% |
Ahtanum Summary
Ahtanum is a small unincorporated community located in Yakima County, Washington. It is situated in the foothills of the Cascade Mountains, approximately 10 miles west of Yakima. The area is known for its agricultural production, including apples, cherries, and hops.
History
The Ahtanum area was first settled by Native Americans, who used the area for hunting and gathering. The first European settlers arrived in the late 1800s, and the area was officially established as a community in 1891. The name Ahtanum is derived from the Yakama Indian word for “place of many springs.”
The area was initially used for farming and ranching, and the first hop fields were planted in the early 1900s. The hop industry quickly became the primary economic driver in the area, and by the 1920s, Ahtanum was the largest hop-producing region in the world. The hop industry declined in the 1950s, and the area shifted to a more diversified agricultural economy.
Geography
Ahtanum is located in the foothills of the Cascade Mountains, approximately 10 miles west of Yakima. The area is characterized by rolling hills and valleys, with an elevation of approximately 1,500 feet. The climate is semi-arid, with hot summers and cold winters.
The Ahtanum River runs through the area, and is a popular destination for fishing and recreation. The area is also home to several small lakes, including Ahtanum Lake, which is a popular destination for swimming and boating.
Economy
The economy of Ahtanum is largely based on agriculture. The area is known for its production of apples, cherries, and hops. The area is also home to several wineries, and is a popular destination for wine tasting.
In addition to agriculture, Ahtanum is home to several small businesses, including restaurants, shops, and services. The area is also home to several small manufacturing companies, including a woodworking shop and a metal fabrication shop.
Demographics
As of the 2010 census, the population of Ahtanum was 1,845. The population is largely white (90.3%), with small percentages of Hispanic (4.2%), Native American (2.2%), and Asian (1.3%) residents. The median household income is $45,000, and the median home value is $175,000.
The area is served by the Ahtanum School District, which includes two elementary schools, one middle school, and one high school. The area is also home to several churches, including the Ahtanum United Methodist Church and the Ahtanum Community Church.
Conclusion
Ahtanum is a small unincorporated community located in Yakima County, Washington. It is situated in the foothills of the Cascade Mountains, approximately 10 miles west of Yakima. The area is known for its agricultural production, including apples, cherries, and hops. The economy of Ahtanum is largely based on agriculture, and the area is also home to several small businesses, including restaurants, shops, and services. The population of Ahtanum is largely white, with small percentages of Hispanic, Native American, and Asian residents. The area is served by the Ahtanum School District, and is home to several churches.
Common Questions
What is Per Capita Income in Ahtanum?
Per Capita income in Ahtanum is $34,515.
What is the Median Family Income in Ahtanum?
Median Family Income in Ahtanum is $104,191.
What is the Median Household income in Ahtanum?
Median Household Income in Ahtanum is $81,354.
What is Income or Wage Gap in Ahtanum?
Income or Wage Gap in Ahtanum is 13.0%.
Women in Ahtanum earn 87.0 cents for every dollar earned by a man.
What is Inequality or Gini Index in Ahtanum?
Inequality or Gini Index in Ahtanum is 0.36.
What is the Total Population of Ahtanum?
Total Population of Ahtanum is 3,353.
What is the Total Male Population of Ahtanum?
Total Male Population of Ahtanum is 1,875.
What is the Total Female Population of Ahtanum?
Total Female Population of Ahtanum is 1,478.
What is the Ratio of Males per 100 Females in Ahtanum?
There are 126.86 Males per 100 Females in Ahtanum.
What is the Ratio of Females per 100 Males in Ahtanum?
There are 78.83 Females per 100 Males in Ahtanum.
What is the Median Population Age in Ahtanum?
Median Population Age in Ahtanum is 37.0 Years.
What is the Average Family Size in Ahtanum
Average Family Size in Ahtanum is 3.4 People.
What is the Average Household Size in Ahtanum
Average Household Size in Ahtanum is 2.9 People.
How Large is the Labor Force in Ahtanum?
There are 1,585 People in the Labor Forcein in Ahtanum.
What is the Percentage of People in the Labor Force in Ahtanum?
60.9% of People are in the Labor Force in Ahtanum.
What is the Unemployment Rate in Ahtanum?
Unemployment Rate in Ahtanum is 8.8%.