Brinnon, WA Map & Demographics
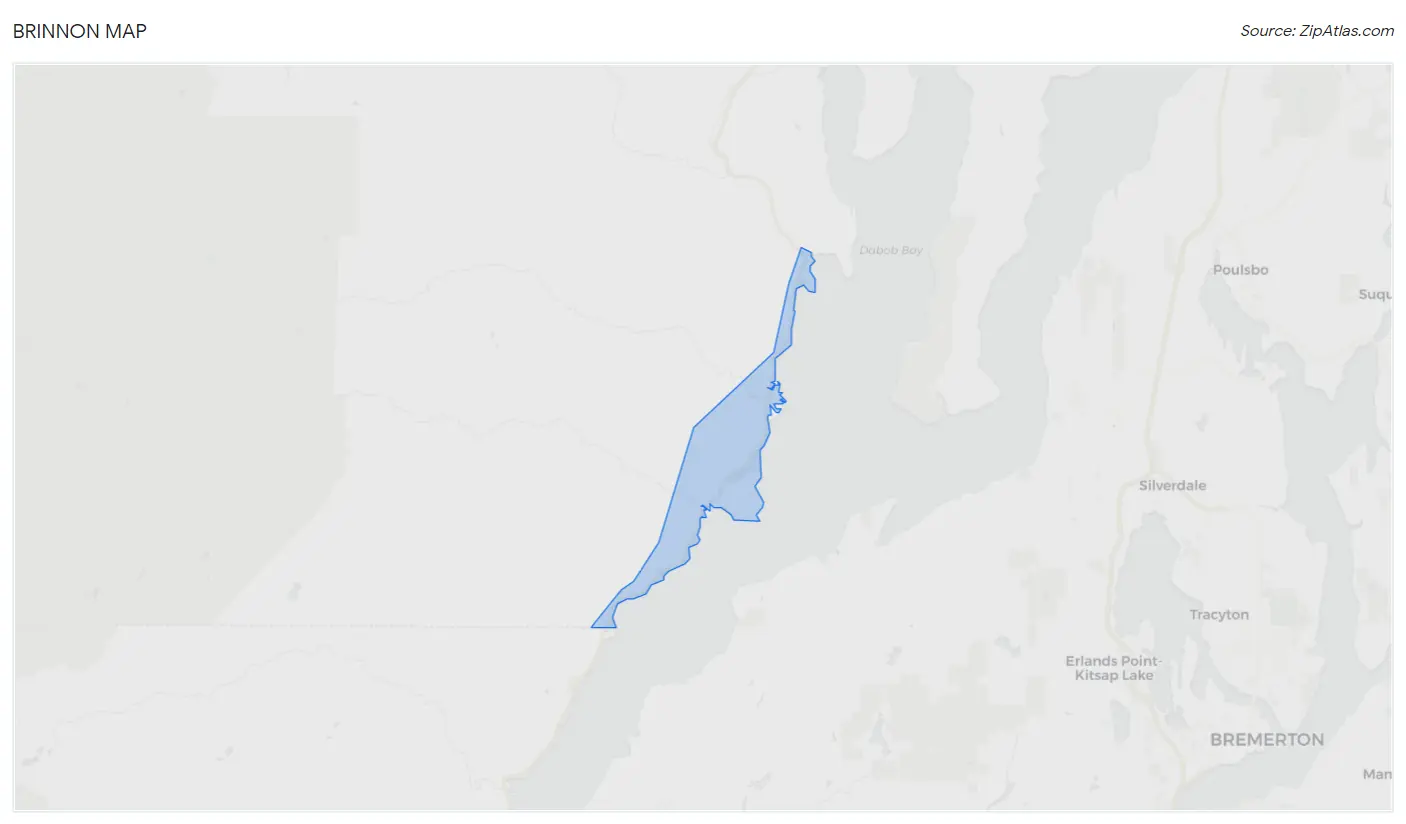
Brinnon Map
Brinnon Overview
$39,429
PER CAPITA INCOME
$92,712
AVG FAMILY INCOME
$57,000
AVG HOUSEHOLD INCOME
35.9%
WAGE / INCOME GAP [ % ]
64.1¢/ $1
WAGE / INCOME GAP [ $ ]
0.42
INEQUALITY / GINI INDEX
874
TOTAL POPULATION
462
MALE POPULATION
412
FEMALE POPULATION
112.14
MALES / 100 FEMALES
89.18
FEMALES / 100 MALES
63.2
MEDIAN AGE
2.6
AVG FAMILY SIZE
2.0
AVG HOUSEHOLD SIZE
255
LABOR FORCE [ PEOPLE ]
31.2%
PERCENT IN LABOR FORCE
9.0%
UNEMPLOYMENT RATE
Brinnon Zip Codes
Brinnon Area Codes
Income in Brinnon
Income Overview in Brinnon
Per Capita Income in Brinnon is $39,429, while median incomes of families and households are $92,712 and $57,000 respectively.
| Characteristic | Number | Measure |
| Per Capita Income | 874 | $39,429 |
| Median Family Income | 255 | $92,712 |
| Mean Family Income | 255 | $97,993 |
| Median Household Income | 436 | $57,000 |
| Mean Household Income | 436 | $76,393 |
| Income Deficit | 255 | $0 |
| Wage / Income Gap (%) | 874 | 35.87% |
| Wage / Income Gap ($) | 874 | 64.13¢ per $1 |
| Gini / Inequality Index | 874 | 0.42 |
Earnings by Sex in Brinnon
Average Earnings in Brinnon are $45,556, $59,375 for men and $38,077 for women, a difference of 35.9%.
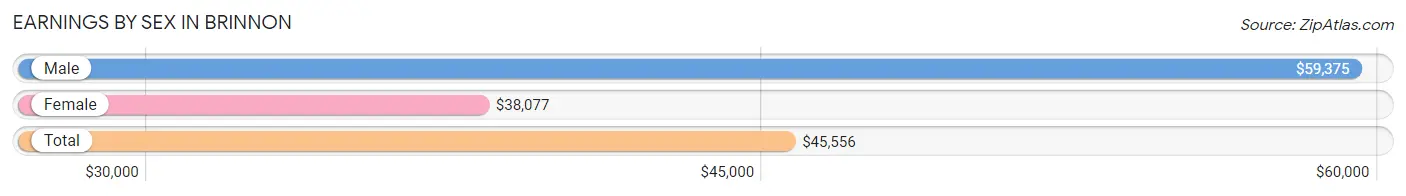
| Sex | Number | Average Earnings |
| Male | 110 (41.0%) | $59,375 |
| Female | 158 (59.0%) | $38,077 |
| Total | 268 (100.0%) | $45,556 |
Earnings by Sex by Income Bracket in Brinnon
The most common earnings brackets in Brinnon are $100,000+ for men (22 | 20.0%) and $65,000 to $74,999 for women (30 | 19.0%).
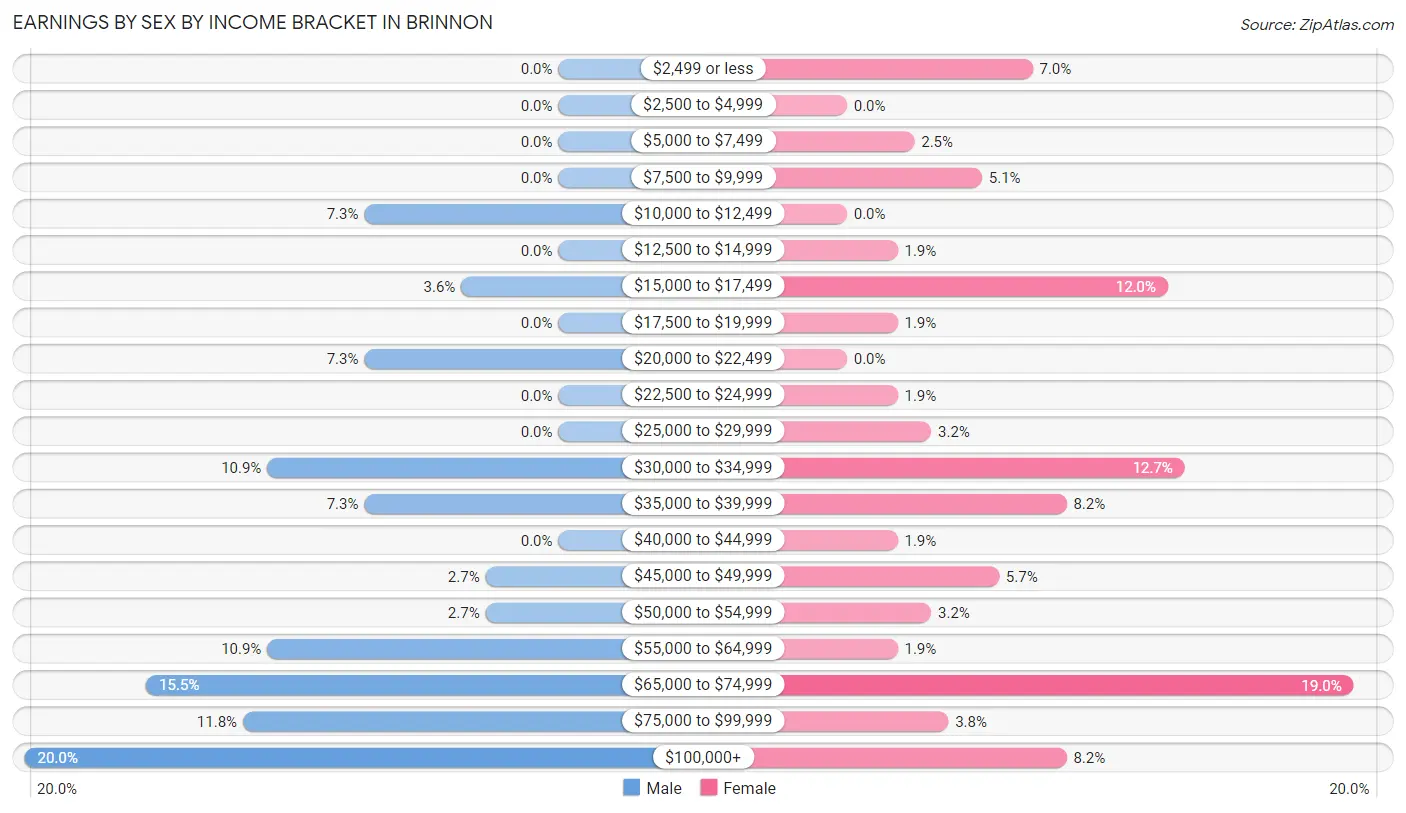
| Income | Male | Female |
| $2,499 or less | 0 (0.0%) | 11 (7.0%) |
| $2,500 to $4,999 | 0 (0.0%) | 0 (0.0%) |
| $5,000 to $7,499 | 0 (0.0%) | 4 (2.5%) |
| $7,500 to $9,999 | 0 (0.0%) | 8 (5.1%) |
| $10,000 to $12,499 | 8 (7.3%) | 0 (0.0%) |
| $12,500 to $14,999 | 0 (0.0%) | 3 (1.9%) |
| $15,000 to $17,499 | 4 (3.6%) | 19 (12.0%) |
| $17,500 to $19,999 | 0 (0.0%) | 3 (1.9%) |
| $20,000 to $22,499 | 8 (7.3%) | 0 (0.0%) |
| $22,500 to $24,999 | 0 (0.0%) | 3 (1.9%) |
| $25,000 to $29,999 | 0 (0.0%) | 5 (3.2%) |
| $30,000 to $34,999 | 12 (10.9%) | 20 (12.7%) |
| $35,000 to $39,999 | 8 (7.3%) | 13 (8.2%) |
| $40,000 to $44,999 | 0 (0.0%) | 3 (1.9%) |
| $45,000 to $49,999 | 3 (2.7%) | 9 (5.7%) |
| $50,000 to $54,999 | 3 (2.7%) | 5 (3.2%) |
| $55,000 to $64,999 | 12 (10.9%) | 3 (1.9%) |
| $65,000 to $74,999 | 17 (15.4%) | 30 (19.0%) |
| $75,000 to $99,999 | 13 (11.8%) | 6 (3.8%) |
| $100,000+ | 22 (20.0%) | 13 (8.2%) |
| Total | 110 (100.0%) | 158 (100.0%) |
Earnings by Sex by Educational Attainment in Brinnon
Average earnings in Brinnon are $67,604 for men and $38,077 for women, a difference of 43.7%. Men with an educational attainment of bachelor's degree enjoy the highest average annual earnings of $105,972, while those with college or associate's degree education earn the least with $31,705. Women with an educational attainment of graduate degree earn the most with the average annual earnings of $67,778, while those with college or associate's degree education have the smallest earnings of $38,750.
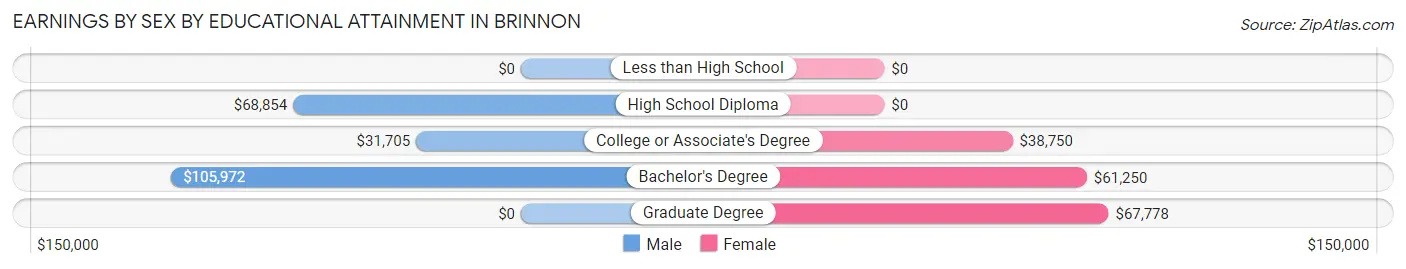
| Educational Attainment | Male Income | Female Income |
| Less than High School | - | - |
| High School Diploma | $68,854 | $0 |
| College or Associate's Degree | $31,705 | $38,750 |
| Bachelor's Degree | $105,972 | $61,250 |
| Graduate Degree | - | - |
| Total | $67,604 | $38,077 |
Family Income in Brinnon
Family Income Brackets in Brinnon
According to the Brinnon family income data, there are 78 families falling into the $75,000 to $99,999 income range, which is the most common income bracket and makes up 30.6% of all families.
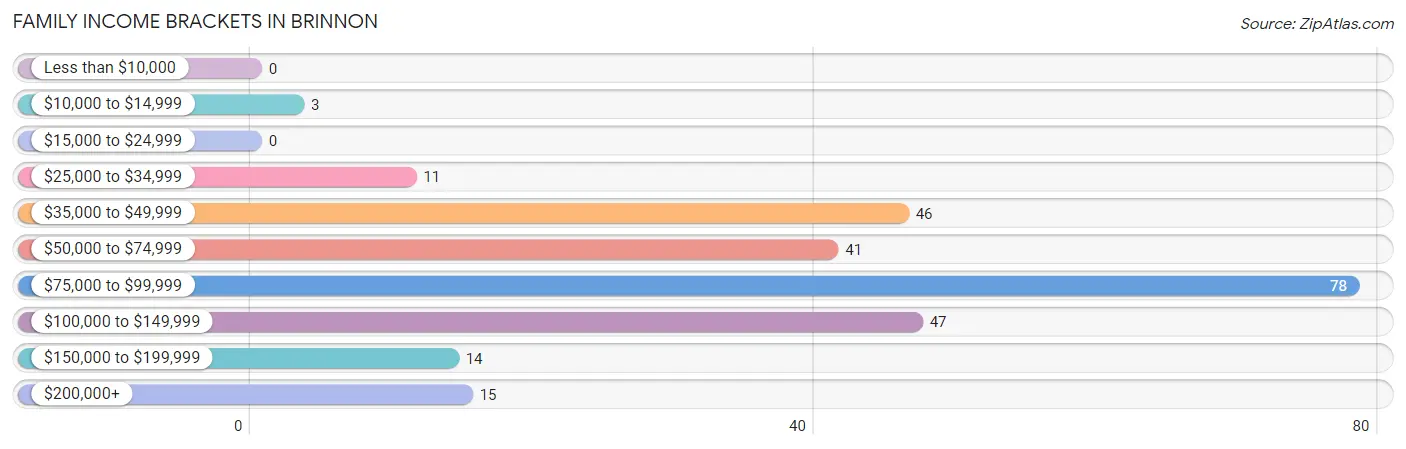
| Income Bracket | # Families | % Families |
| Less than $10,000 | 0 | 0.0% |
| $10,000 to $14,999 | 3 | 1.2% |
| $15,000 to $24,999 | 0 | 0.0% |
| $25,000 to $34,999 | 11 | 4.3% |
| $35,000 to $49,999 | 46 | 18.0% |
| $50,000 to $74,999 | 41 | 16.1% |
| $75,000 to $99,999 | 78 | 30.6% |
| $100,000 to $149,999 | 47 | 18.4% |
| $150,000 to $199,999 | 14 | 5.5% |
| $200,000+ | 15 | 5.9% |
Family Income by Famaliy Size in Brinnon
2-person families (163 | 63.9%) account for the highest median family income in Brinnon with $93,224 per family, while 2-person families (163 | 63.9%) have the highest median income of $46,612 per family member.
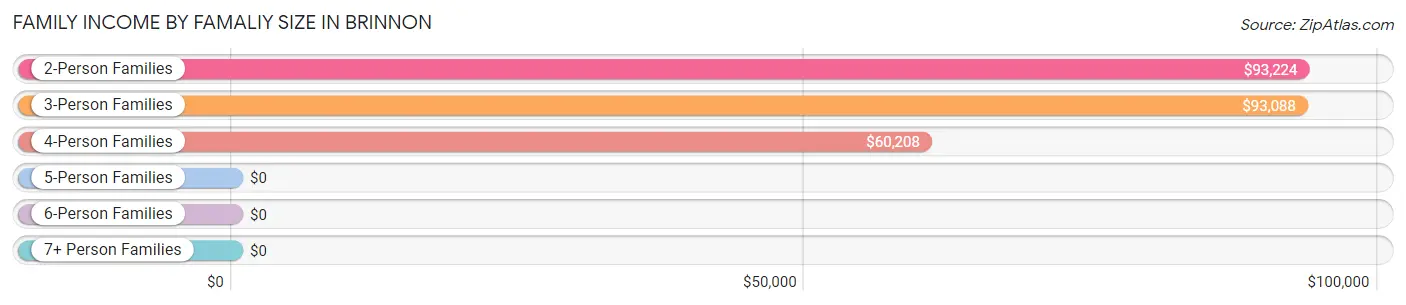
| Income Bracket | # Families | Median Income |
| 2-Person Families | 163 (63.9%) | $93,224 |
| 3-Person Families | 68 (26.7%) | $93,088 |
| 4-Person Families | 21 (8.2%) | $60,208 |
| 5-Person Families | 3 (1.2%) | $0 |
| 6-Person Families | 0 (0.0%) | $0 |
| 7+ Person Families | 0 (0.0%) | $0 |
| Total | 255 (100.0%) | $92,712 |
Family Income by Number of Earners in Brinnon
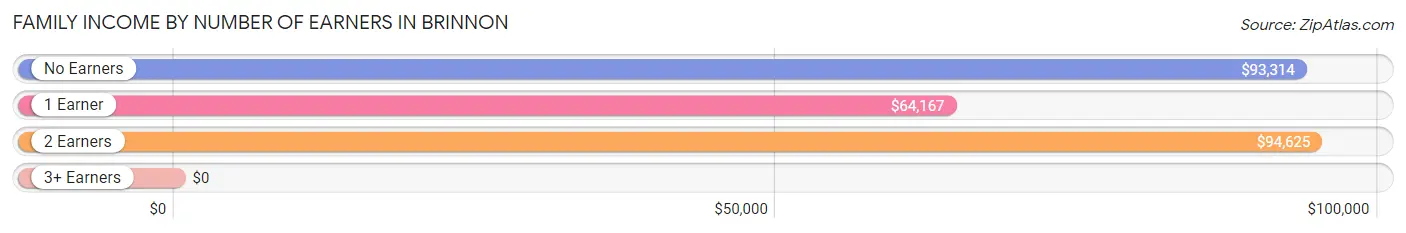
| Number of Earners | # Families | Median Income |
| No Earners | 116 (45.5%) | $93,314 |
| 1 Earner | 76 (29.8%) | $64,167 |
| 2 Earners | 63 (24.7%) | $94,625 |
| 3+ Earners | 0 (0.0%) | $0 |
| Total | 255 (100.0%) | $92,712 |
Household Income in Brinnon
Household Income Brackets in Brinnon
With 84 households falling in the category, the $50,000 to $74,999 income range is the most frequent in Brinnon, accounting for 19.3% of all households. In contrast, only 12 households (2.8%) fall into the $15,000 to $24,999 income bracket, making it the least populous group.
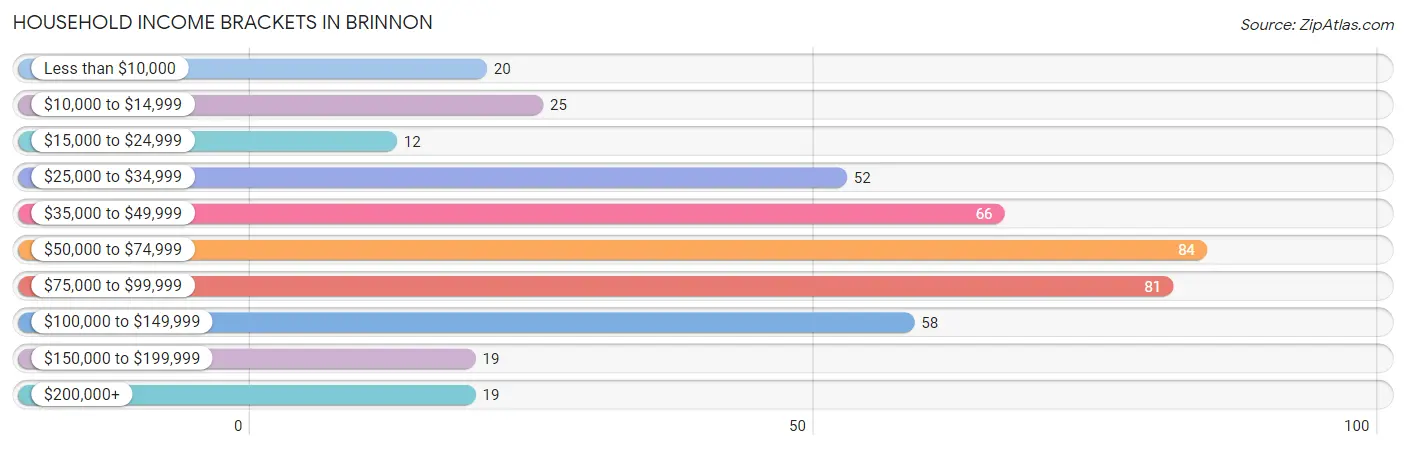
| Income Bracket | # Households | % Households |
| Less than $10,000 | 20 | 4.6% |
| $10,000 to $14,999 | 25 | 5.7% |
| $15,000 to $24,999 | 12 | 2.8% |
| $25,000 to $34,999 | 52 | 11.9% |
| $35,000 to $49,999 | 66 | 15.1% |
| $50,000 to $74,999 | 84 | 19.3% |
| $75,000 to $99,999 | 81 | 18.6% |
| $100,000 to $149,999 | 58 | 13.3% |
| $150,000 to $199,999 | 19 | 4.4% |
| $200,000+ | 19 | 4.4% |
Household Income by Householder Age in Brinnon
The median household income in Brinnon is $57,000, with the highest median household income of $76,000 found in the 45 to 64 years age bracket for the primary householder. A total of 116 households (26.6%) fall into this category.
| Income Bracket | # Households | Median Income |
| 15 to 24 Years | 0 (0.0%) | $0 |
| 25 to 44 Years | 65 (14.9%) | $41,083 |
| 45 to 64 Years | 116 (26.6%) | $76,000 |
| 65+ Years | 255 (58.5%) | $58,583 |
| Total | 436 (100.0%) | $57,000 |
Poverty in Brinnon
Income Below Poverty by Sex and Age in Brinnon
With 6.5% poverty level for males and 11.4% for females among the residents of Brinnon, under 5 year old males and 75 year old and over females are the most vulnerable to poverty, with 8 males (38.1%) and 21 females (31.8%) in their respective age groups living below the poverty level.
| Age Bracket | Male | Female |
| Under 5 Years | 8 (38.1%) | 0 (0.0%) |
| 5 Years | 0 (0.0%) | 0 (0.0%) |
| 6 to 11 Years | 0 (0.0%) | 0 (0.0%) |
| 12 to 14 Years | 0 (0.0%) | 0 (0.0%) |
| 15 Years | 0 (0.0%) | 0 (0.0%) |
| 16 and 17 Years | 0 (0.0%) | 0 (0.0%) |
| 18 to 24 Years | 0 (0.0%) | 0 (0.0%) |
| 25 to 34 Years | 0 (0.0%) | 0 (0.0%) |
| 35 to 44 Years | 0 (0.0%) | 10 (12.0%) |
| 45 to 54 Years | 8 (5.6%) | 13 (21.3%) |
| 55 to 64 Years | 8 (22.9%) | 0 (0.0%) |
| 65 to 74 Years | 0 (0.0%) | 3 (2.3%) |
| 75 Years and over | 6 (8.1%) | 21 (31.8%) |
| Total | 30 (6.5%) | 47 (11.4%) |
Income Above Poverty by Sex and Age in Brinnon
According to the poverty statistics in Brinnon, males aged 6 to 11 years and females aged 6 to 11 years are the age groups that are most secure financially, with 100.0% of males and 100.0% of females in these age groups living above the poverty line.
| Age Bracket | Male | Female |
| Under 5 Years | 13 (61.9%) | 0 (0.0%) |
| 5 Years | 0 (0.0%) | 0 (0.0%) |
| 6 to 11 Years | 4 (100.0%) | 17 (100.0%) |
| 12 to 14 Years | 7 (100.0%) | 7 (100.0%) |
| 15 Years | 0 (0.0%) | 0 (0.0%) |
| 16 and 17 Years | 4 (100.0%) | 0 (0.0%) |
| 18 to 24 Years | 12 (100.0%) | 0 (0.0%) |
| 25 to 34 Years | 6 (100.0%) | 13 (100.0%) |
| 35 to 44 Years | 15 (100.0%) | 73 (87.9%) |
| 45 to 54 Years | 135 (94.4%) | 48 (78.7%) |
| 55 to 64 Years | 27 (77.1%) | 34 (100.0%) |
| 65 to 74 Years | 141 (100.0%) | 128 (97.7%) |
| 75 Years and over | 68 (91.9%) | 45 (68.2%) |
| Total | 432 (93.5%) | 365 (88.6%) |
Income Below Poverty Among Married-Couple Families in Brinnon
| Children | Above Poverty | Below Poverty |
| No Children | 202 (100.0%) | 0 (0.0%) |
| 1 or 2 Children | 32 (100.0%) | 0 (0.0%) |
| 3 or 4 Children | 0 (0.0%) | 0 (0.0%) |
| 5 or more Children | 0 (0.0%) | 0 (0.0%) |
| Total | 234 (100.0%) | 0 (0.0%) |
Income Below Poverty Among Single-Parent Households in Brinnon
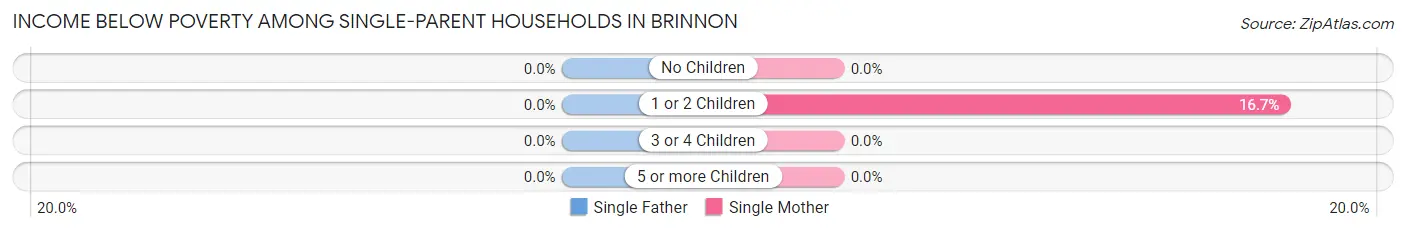
| Children | Single Father | Single Mother |
| No Children | 0 (0.0%) | 0 (0.0%) |
| 1 or 2 Children | 0 (0.0%) | 3 (16.7%) |
| 3 or 4 Children | 0 (0.0%) | 0 (0.0%) |
| 5 or more Children | 0 (0.0%) | 0 (0.0%) |
| Total | 0 (0.0%) | 3 (14.3%) |
Income Below Poverty Among Married-Couple vs Single-Parent Households in Brinnon
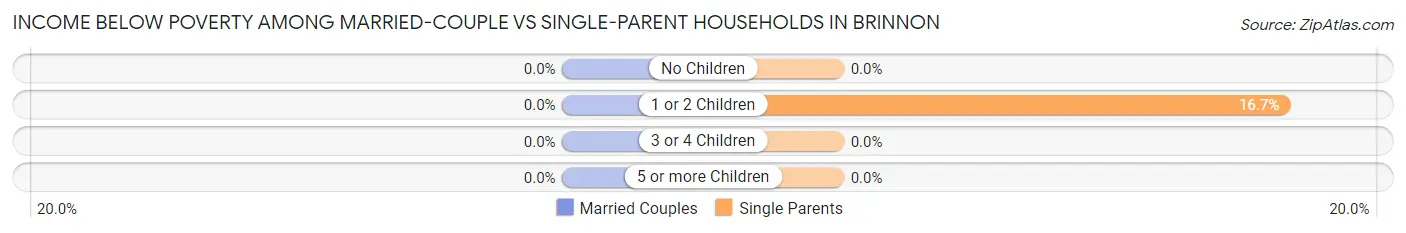
| Children | Married-Couple Families | Single-Parent Households |
| No Children | 0 (0.0%) | 0 (0.0%) |
| 1 or 2 Children | 0 (0.0%) | 3 (16.7%) |
| 3 or 4 Children | 0 (0.0%) | 0 (0.0%) |
| 5 or more Children | 0 (0.0%) | 0 (0.0%) |
| Total | 0 (0.0%) | 3 (14.3%) |
Race in Brinnon
The most populous races in Brinnon are White / Caucasian (749 | 85.7%), Two or more Races (64 | 7.3%), and Hispanic or Latino (42 | 4.8%).
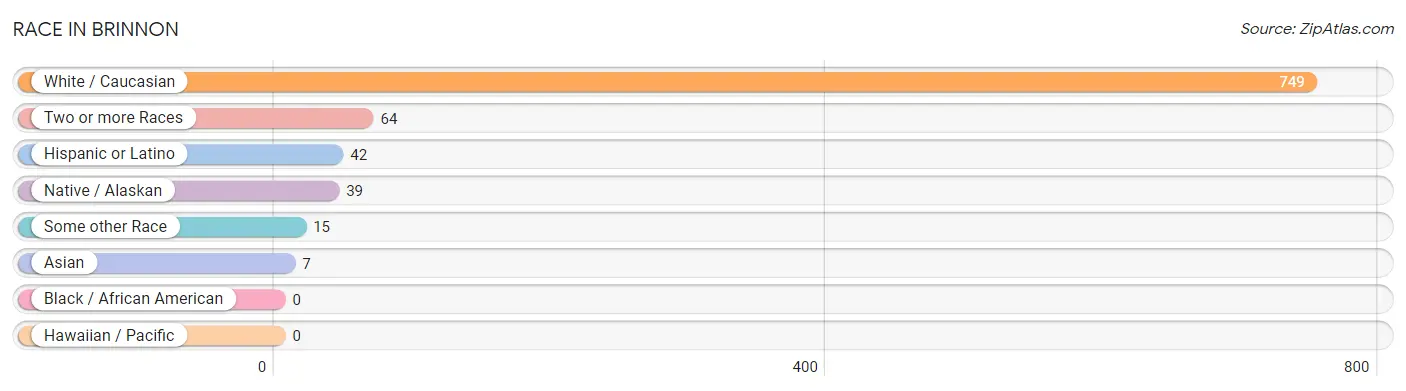
| Race | # Population | % Population |
| Asian | 7 | 0.8% |
| Black / African American | 0 | 0.0% |
| Hawaiian / Pacific | 0 | 0.0% |
| Hispanic or Latino | 42 | 4.8% |
| Native / Alaskan | 39 | 4.5% |
| White / Caucasian | 749 | 85.7% |
| Two or more Races | 64 | 7.3% |
| Some other Race | 15 | 1.7% |
| Total | 874 | 100.0% |
Ancestry in Brinnon
The most populous ancestries reported in Brinnon are Irish (202 | 23.1%), English (185 | 21.2%), German (99 | 11.3%), Scottish (45 | 5.1%), and Italian (35 | 4.0%), together accounting for 64.8% of all Brinnon residents.
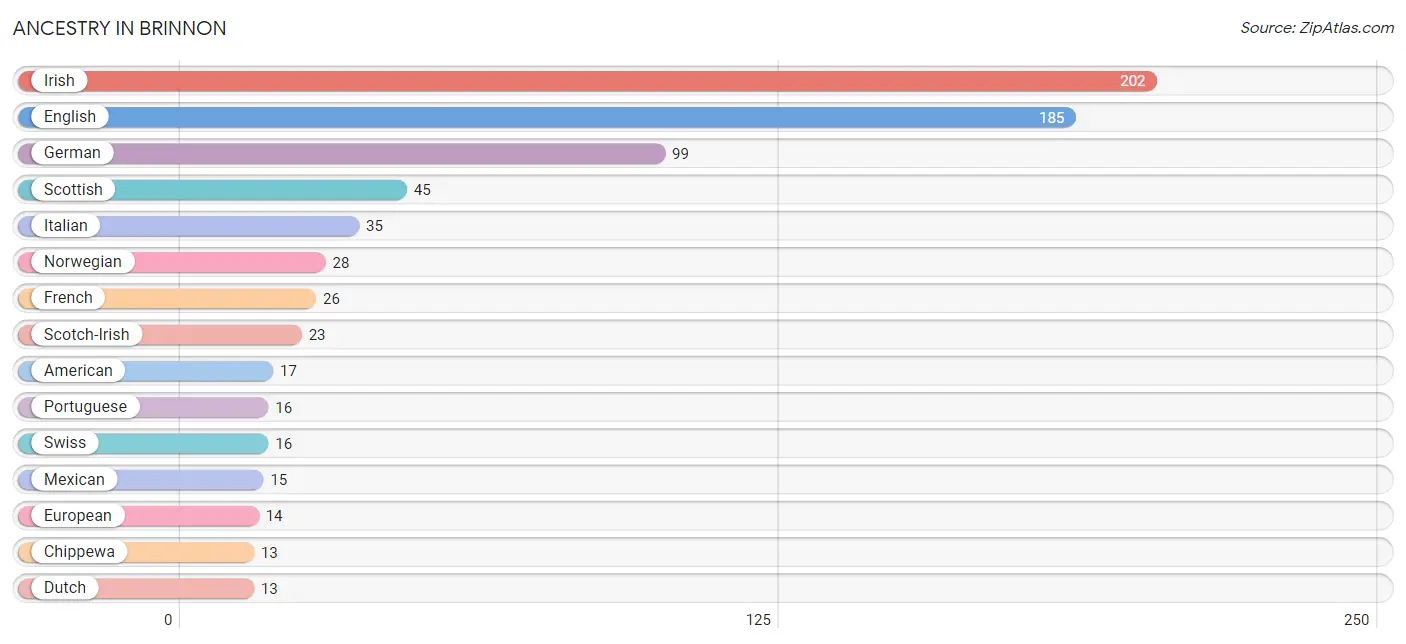
| Ancestry | # Population | % Population |
| Alaska Native | 5 | 0.6% |
| American | 17 | 1.9% |
| Chippewa | 13 | 1.5% |
| Czech | 5 | 0.6% |
| Danish | 4 | 0.5% |
| Dutch | 13 | 1.5% |
| Eastern European | 4 | 0.5% |
| English | 185 | 21.2% |
| European | 14 | 1.6% |
| French | 26 | 3.0% |
| German | 99 | 11.3% |
| Iranian | 13 | 1.5% |
| Irish | 202 | 23.1% |
| Italian | 35 | 4.0% |
| Korean | 7 | 0.8% |
| Lithuanian | 3 | 0.3% |
| Mexican | 15 | 1.7% |
| Norwegian | 28 | 3.2% |
| Polish | 7 | 0.8% |
| Portuguese | 16 | 1.8% |
| Scandinavian | 3 | 0.3% |
| Scotch-Irish | 23 | 2.6% |
| Scottish | 45 | 5.1% |
| Sioux | 10 | 1.1% |
| Swedish | 3 | 0.3% |
| Swiss | 16 | 1.8% |
| Ukrainian | 4 | 0.5% |
| Welsh | 4 | 0.5% | View All 28 Rows |
Immigrants in Brinnon
The most numerous immigrant groups reported in Brinnon came from Asia (13 | 1.5%), Iran (13 | 1.5%), South Central Asia (13 | 1.5%), and Canada (6 | 0.7%), together accounting for 5.2% of all Brinnon residents.
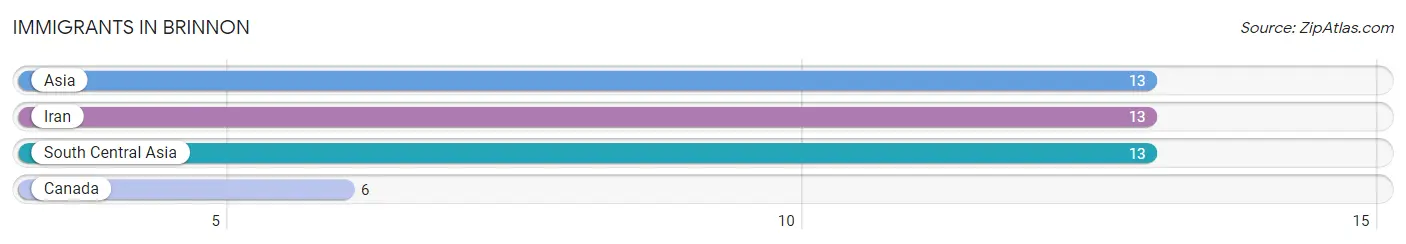
| Immigration Origin | # Population | % Population |
| Asia | 13 | 1.5% |
| Canada | 6 | 0.7% |
| Iran | 13 | 1.5% |
| South Central Asia | 13 | 1.5% | View All 4 Rows |
Sex and Age in Brinnon
Sex and Age in Brinnon
The most populous age groups in Brinnon are 70 to 74 Years (108 | 23.4%) for men and 70 to 74 Years (69 | 16.8%) for women.
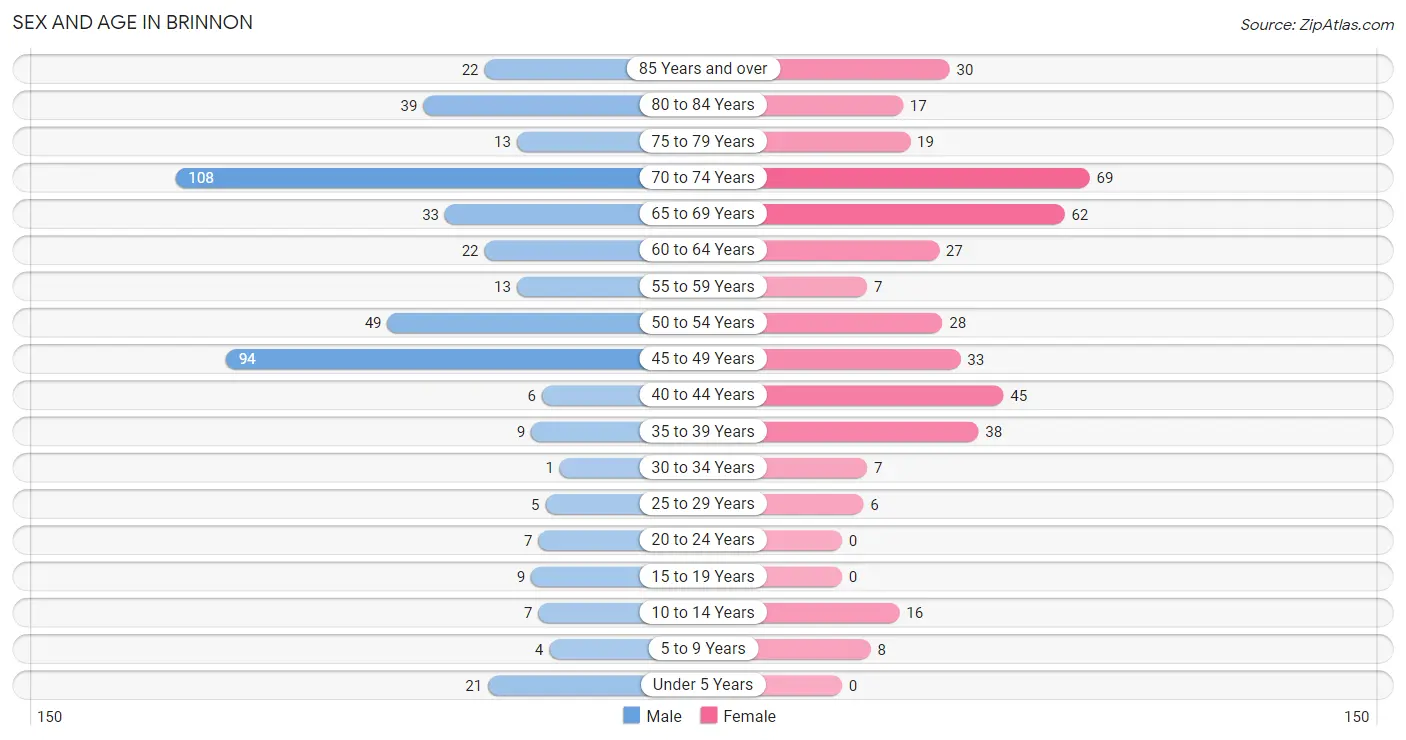
| Age Bracket | Male | Female |
| Under 5 Years | 21 (4.5%) | 0 (0.0%) |
| 5 to 9 Years | 4 (0.9%) | 8 (1.9%) |
| 10 to 14 Years | 7 (1.5%) | 16 (3.9%) |
| 15 to 19 Years | 9 (1.9%) | 0 (0.0%) |
| 20 to 24 Years | 7 (1.5%) | 0 (0.0%) |
| 25 to 29 Years | 5 (1.1%) | 6 (1.5%) |
| 30 to 34 Years | 1 (0.2%) | 7 (1.7%) |
| 35 to 39 Years | 9 (1.9%) | 38 (9.2%) |
| 40 to 44 Years | 6 (1.3%) | 45 (10.9%) |
| 45 to 49 Years | 94 (20.3%) | 33 (8.0%) |
| 50 to 54 Years | 49 (10.6%) | 28 (6.8%) |
| 55 to 59 Years | 13 (2.8%) | 7 (1.7%) |
| 60 to 64 Years | 22 (4.8%) | 27 (6.6%) |
| 65 to 69 Years | 33 (7.1%) | 62 (15.0%) |
| 70 to 74 Years | 108 (23.4%) | 69 (16.8%) |
| 75 to 79 Years | 13 (2.8%) | 19 (4.6%) |
| 80 to 84 Years | 39 (8.4%) | 17 (4.1%) |
| 85 Years and over | 22 (4.8%) | 30 (7.3%) |
| Total | 462 (100.0%) | 412 (100.0%) |
Families and Households in Brinnon
Median Family Size in Brinnon
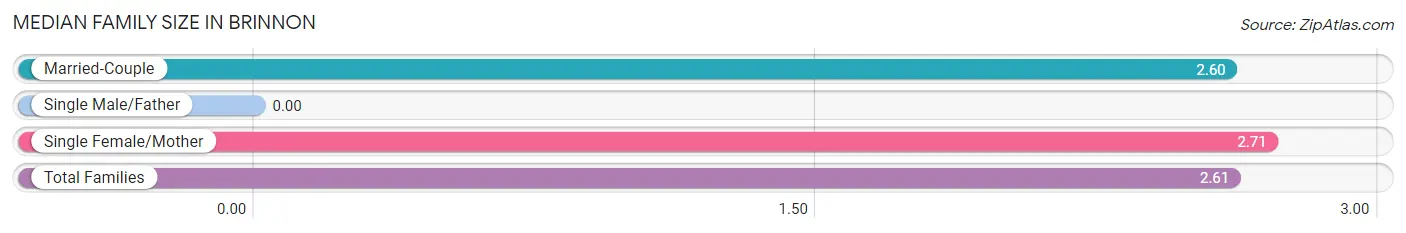
| Family Type | # Families | Family Size |
| Married-Couple | 234 (91.8%) | 2.60 |
| Single Male/Father | 0 (0.0%) | - |
| Single Female/Mother | 21 (8.2%) | 2.71 |
| Total Families | 255 (100.0%) | 2.61 |
Median Household Size in Brinnon
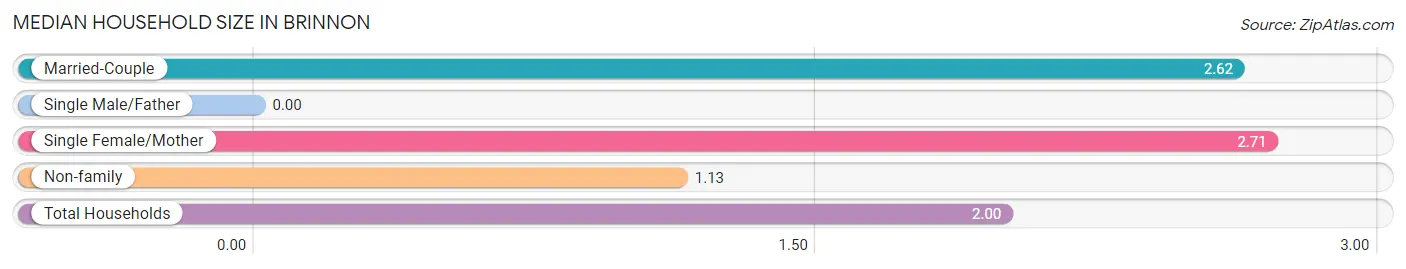
| Household Type | # Households | Household Size |
| Married-Couple | 234 (53.7%) | 2.62 |
| Single Male/Father | 0 (0.0%) | - |
| Single Female/Mother | 21 (4.8%) | 2.71 |
| Non-family | 181 (41.5%) | 1.13 |
| Total Households | 436 (100.0%) | 2.00 |
Household Size by Marriage Status in Brinnon
Out of a total of 436 households in Brinnon, 255 (58.5%) are family households, while 181 (41.5%) are nonfamily households. The most numerous type of family households are 2-person households, comprising 163, and the most common type of nonfamily households are 1-person households, comprising 160.
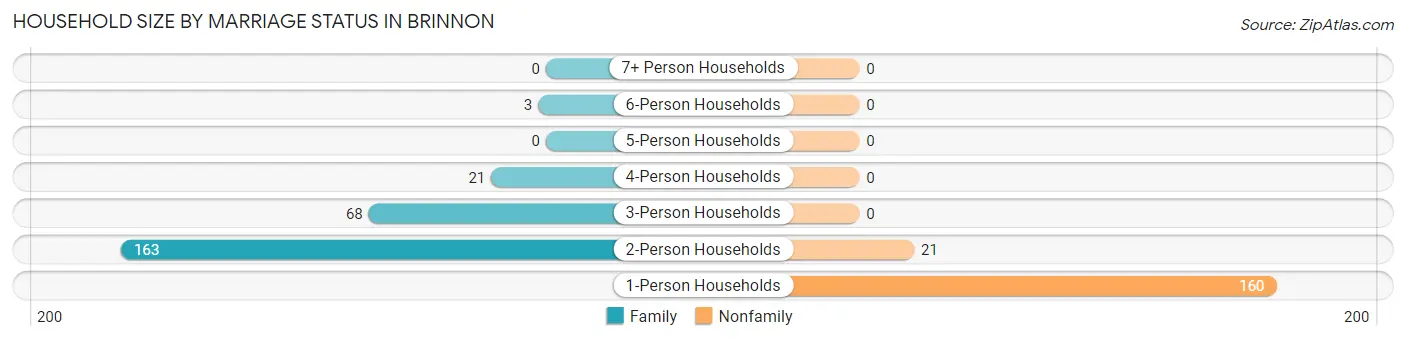
| Household Size | Family Households | Nonfamily Households |
| 1-Person Households | - | 160 (36.7%) |
| 2-Person Households | 163 (37.4%) | 21 (4.8%) |
| 3-Person Households | 68 (15.6%) | 0 (0.0%) |
| 4-Person Households | 21 (4.8%) | 0 (0.0%) |
| 5-Person Households | 0 (0.0%) | 0 (0.0%) |
| 6-Person Households | 3 (0.7%) | 0 (0.0%) |
| 7+ Person Households | 0 (0.0%) | 0 (0.0%) |
| Total | 255 (58.5%) | 181 (41.5%) |
Female Fertility in Brinnon
Fertility by Age in Brinnon
| Age Bracket | Women with Births | Births / 1,000 Women |
| 15 to 19 years | 0 (0.0%) | 0.0 |
| 20 to 34 years | 0 (0.0%) | 0.0 |
| 35 to 50 years | 0 (0.0%) | 0.0 |
| Total | 0 (0.0%) | 0.0 |
Fertility by Age by Marriage Status in Brinnon
| Age Bracket | Married | Unmarried |
| 15 to 19 years | 0 (0.0%) | 0 (0.0%) |
| 20 to 34 years | 0 (0.0%) | 0 (0.0%) |
| 35 to 50 years | 0 (0.0%) | 0 (0.0%) |
| Total | 0 (0.0%) | 0 (0.0%) |
Fertility by Education in Brinnon
| Educational Attainment | Women with Births | Births / 1,000 Women |
| Less than High School | 0 (0.0%) | 0.0 |
| High School Diploma | 0 (0.0%) | 0.0 |
| College or Associate's Degree | 0 (0.0%) | 0.0 |
| Bachelor's Degree | 0 (0.0%) | 0.0 |
| Graduate Degree | 0 (0.0%) | 0.0 |
| Total | 0 (0.0%) | 0.0 |
Fertility by Education by Marriage Status in Brinnon
| Educational Attainment | Married | Unmarried |
| Less than High School | 0 (0.0%) | 0 (0.0%) |
| High School Diploma | 0 (0.0%) | 0 (0.0%) |
| College or Associate's Degree | 0 (0.0%) | 0 (0.0%) |
| Bachelor's Degree | 0 (0.0%) | 0 (0.0%) |
| Graduate Degree | 0 (0.0%) | 0 (0.0%) |
| Total | 0 (0.0%) | 0 (0.0%) |
Employment Characteristics in Brinnon
Employment by Class of Employer in Brinnon
Among the 232 employed individuals in Brinnon, private company employees (106 | 45.7%), self-employed (not incorporated) (37 | 16.0%), and state government employees (34 | 14.7%) make up the most common classes of employment.
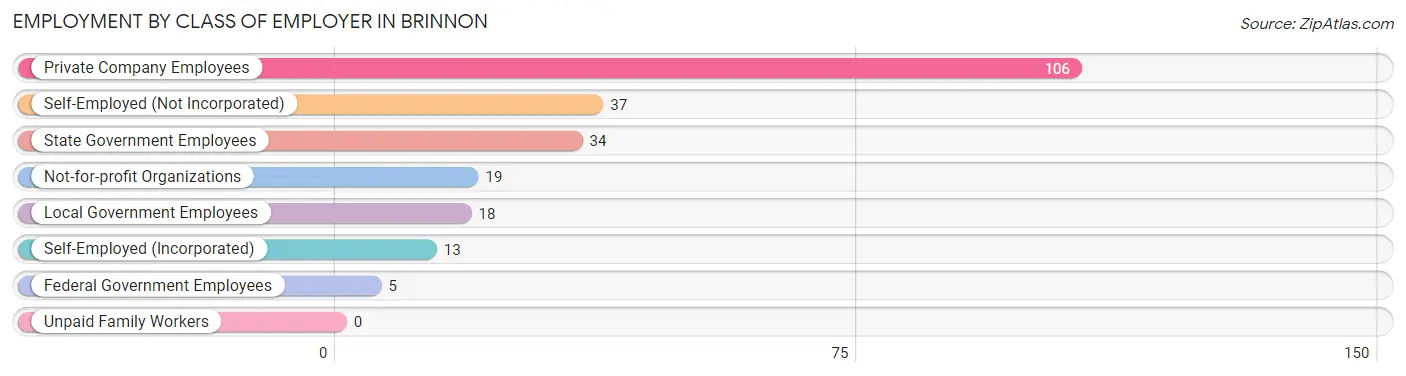
| Employer Class | # Employees | % Employees |
| Private Company Employees | 106 | 45.7% |
| Self-Employed (Incorporated) | 13 | 5.6% |
| Self-Employed (Not Incorporated) | 37 | 16.0% |
| Not-for-profit Organizations | 19 | 8.2% |
| Local Government Employees | 18 | 7.8% |
| State Government Employees | 34 | 14.7% |
| Federal Government Employees | 5 | 2.2% |
| Unpaid Family Workers | 0 | 0.0% |
| Total | 232 | 100.0% |
Employment Status by Age in Brinnon
According to the labor force statistics for Brinnon, out of the total population over 16 years of age (818), 31.2% or 255 individuals are in the labor force, with 9.0% or 23 of them unemployed. The age group with the highest labor force participation rate is 20 to 24 years, with 100.0% or 7 individuals in the labor force. Within the labor force, the 25 to 29 years age range has the highest percentage of unemployed individuals, with 54.5% or 6 of them being unemployed.
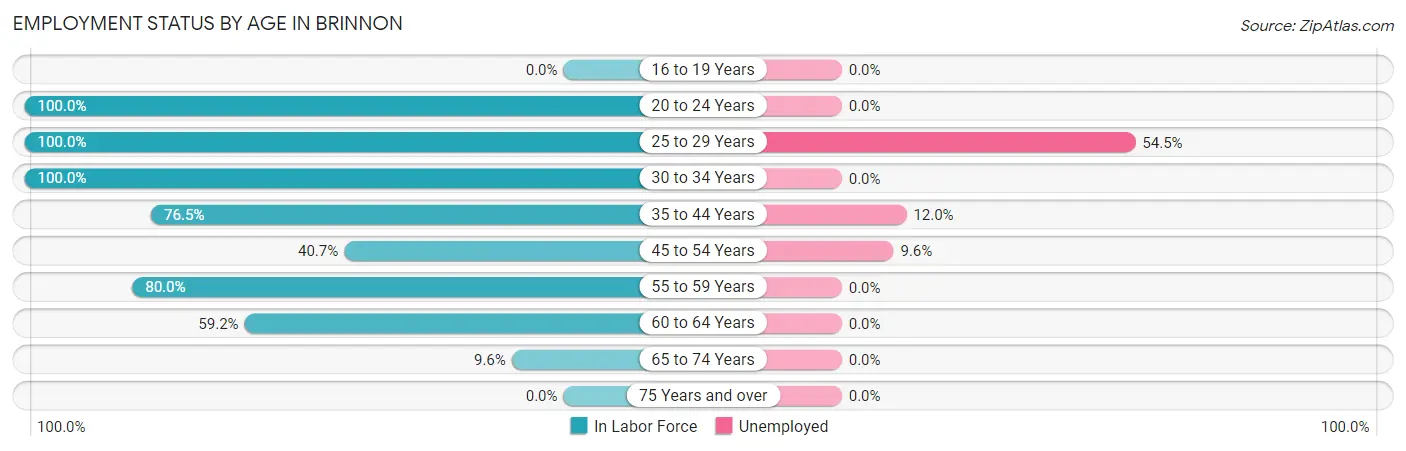
| Age Bracket | In Labor Force | Unemployed |
| 16 to 19 Years | 0 (0.0%) | 0 (0.0%) |
| 20 to 24 Years | 7 (100.0%) | 0 (0.0%) |
| 25 to 29 Years | 11 (100.0%) | 6 (54.5%) |
| 30 to 34 Years | 8 (100.0%) | 0 (0.0%) |
| 35 to 44 Years | 75 (76.5%) | 9 (12.0%) |
| 45 to 54 Years | 83 (40.7%) | 8 (9.6%) |
| 55 to 59 Years | 16 (80.0%) | 0 (0.0%) |
| 60 to 64 Years | 29 (59.2%) | 0 (0.0%) |
| 65 to 74 Years | 26 (9.6%) | 0 (0.0%) |
| 75 Years and over | 0 (0.0%) | 0 (0.0%) |
| Total | 255 (31.2%) | 23 (9.0%) |
Employment Status by Educational Attainment in Brinnon
According to labor force statistics for Brinnon, 56.9% of individuals (222) out of the total population between 25 and 64 years of age (390) are in the labor force, with 10.4% or 23 of them being unemployed. The group with the highest labor force participation rate are those with the educational attainment of less than high school, with 77.8% or 14 individuals in the labor force. Within the labor force, individuals with less than high school education have the highest percentage of unemployment, with 28.6% or 4 of them being unemployed.
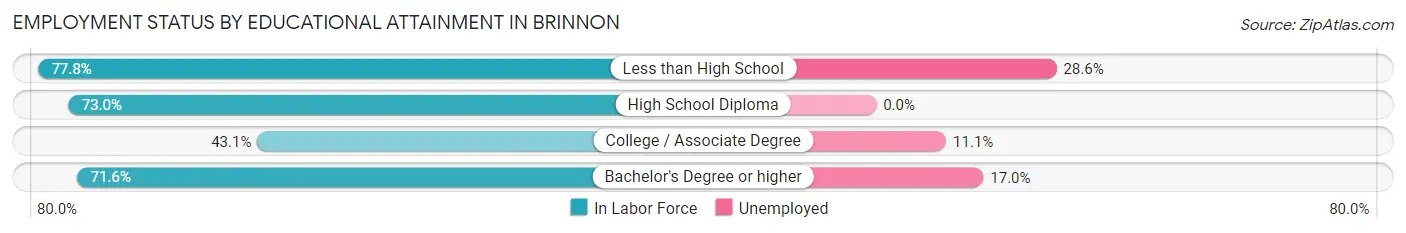
| Educational Attainment | In Labor Force | Unemployed |
| Less than High School | 14 (77.8%) | 5 (28.6%) |
| High School Diploma | 65 (73.0%) | 0 (0.0%) |
| College / Associate Degree | 90 (43.1%) | 23 (11.1%) |
| Bachelor's Degree or higher | 53 (71.6%) | 13 (17.0%) |
| Total | 222 (56.9%) | 41 (10.4%) |
Employment Occupations by Sex in Brinnon
Management, Business, Science and Arts Occupations
The most common Management, Business, Science and Arts occupations in Brinnon are Community & Social Service (46 | 19.8%), Legal Services & Support (17 | 7.3%), Education, Arts & Media (13 | 5.6%), Education Instruction & Library (13 | 5.6%), and Management (12 | 5.2%).
Management, Business, Science and Arts Occupations by Sex
Within the Management, Business, Science and Arts occupations in Brinnon, the most male-oriented occupations are Business & Financial (100.0%), Computers, Engineering & Science (100.0%), and Architecture & Engineering (100.0%), while the most female-oriented occupations are Community & Social Service (100.0%), Education, Arts & Media (100.0%), and Legal Services & Support (100.0%).
| Occupation | Male | Female |
| Management | 10 (83.3%) | 2 (16.7%) |
| Business & Financial | 5 (100.0%) | 0 (0.0%) |
| Computers, Engineering & Science | 9 (100.0%) | 0 (0.0%) |
| Computers & Mathematics | 0 (0.0%) | 0 (0.0%) |
| Architecture & Engineering | 9 (100.0%) | 0 (0.0%) |
| Life, Physical & Social Science | 0 (0.0%) | 0 (0.0%) |
| Community & Social Service | 0 (0.0%) | 46 (100.0%) |
| Education, Arts & Media | 0 (0.0%) | 13 (100.0%) |
| Legal Services & Support | 0 (0.0%) | 17 (100.0%) |
| Education Instruction & Library | 0 (0.0%) | 13 (100.0%) |
| Arts, Media & Entertainment | 0 (0.0%) | 3 (100.0%) |
| Health Diagnosing & Treating | 0 (0.0%) | 0 (0.0%) |
| Health Technologists | 0 (0.0%) | 0 (0.0%) |
| Total (Category) | 24 (33.3%) | 48 (66.7%) |
| Total (Overall) | 94 (40.5%) | 138 (59.5%) |
Services Occupations
The most common Services occupations in Brinnon are Healthcare Support (22 | 9.5%), Security & Protection (11 | 4.7%), Firefighting & Prevention (11 | 4.7%), and Cleaning & Maintenance (3 | 1.3%).
Services Occupations by Sex
Within the Services occupations in Brinnon, the most male-oriented occupations are Security & Protection (100.0%), Firefighting & Prevention (100.0%), and Healthcare Support (18.2%), while the most female-oriented occupations are Cleaning & Maintenance (100.0%), and Healthcare Support (81.8%).
| Occupation | Male | Female |
| Healthcare Support | 4 (18.2%) | 18 (81.8%) |
| Security & Protection | 11 (100.0%) | 0 (0.0%) |
| Firefighting & Prevention | 11 (100.0%) | 0 (0.0%) |
| Law Enforcement | 0 (0.0%) | 0 (0.0%) |
| Food Preparation & Serving | 0 (0.0%) | 0 (0.0%) |
| Cleaning & Maintenance | 0 (0.0%) | 3 (100.0%) |
| Personal Care & Service | 0 (0.0%) | 0 (0.0%) |
| Total (Category) | 15 (41.7%) | 21 (58.3%) |
| Total (Overall) | 94 (40.5%) | 138 (59.5%) |
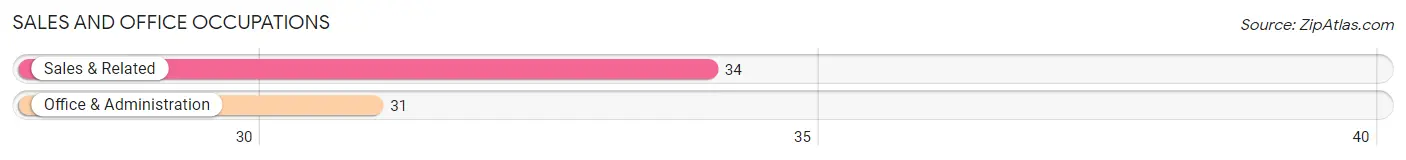
Sales and Office Occupations
The most common Sales and Office occupations in Brinnon are Sales & Related (34 | 14.7%), and Office & Administration (31 | 13.4%).
Sales and Office Occupations by Sex
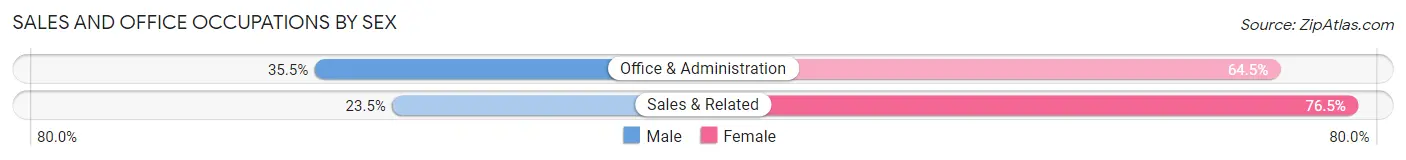
| Occupation | Male | Female |
| Sales & Related | 8 (23.5%) | 26 (76.5%) |
| Office & Administration | 11 (35.5%) | 20 (64.5%) |
| Total (Category) | 19 (29.2%) | 46 (70.8%) |
| Total (Overall) | 94 (40.5%) | 138 (59.5%) |
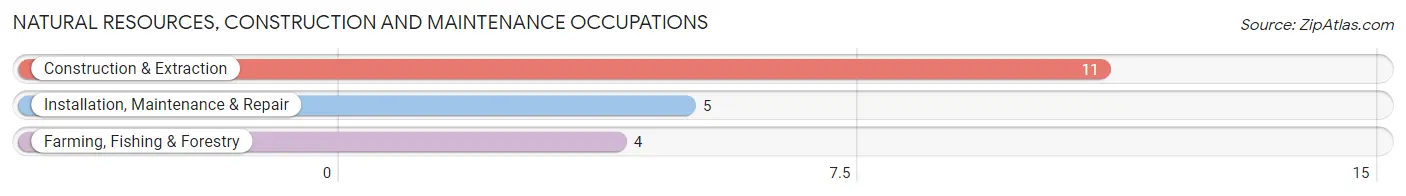
Natural Resources, Construction and Maintenance Occupations
The most common Natural Resources, Construction and Maintenance occupations in Brinnon are Construction & Extraction (11 | 4.7%), Installation, Maintenance & Repair (5 | 2.2%), and Farming, Fishing & Forestry (4 | 1.7%).
Natural Resources, Construction and Maintenance Occupations by Sex
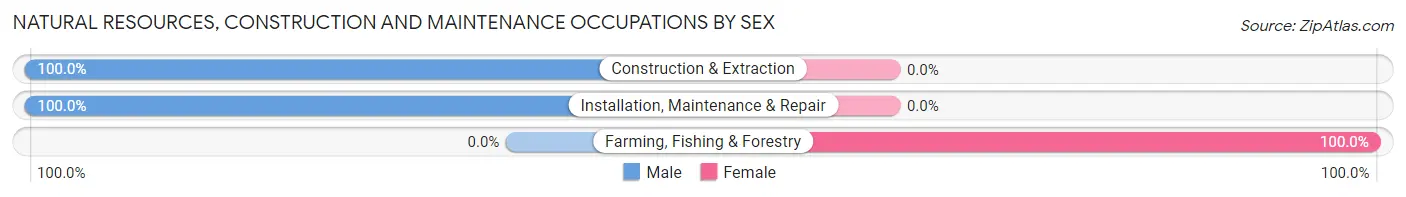
| Occupation | Male | Female |
| Farming, Fishing & Forestry | 0 (0.0%) | 4 (100.0%) |
| Construction & Extraction | 11 (100.0%) | 0 (0.0%) |
| Installation, Maintenance & Repair | 5 (100.0%) | 0 (0.0%) |
| Total (Category) | 16 (80.0%) | 4 (20.0%) |
| Total (Overall) | 94 (40.5%) | 138 (59.5%) |
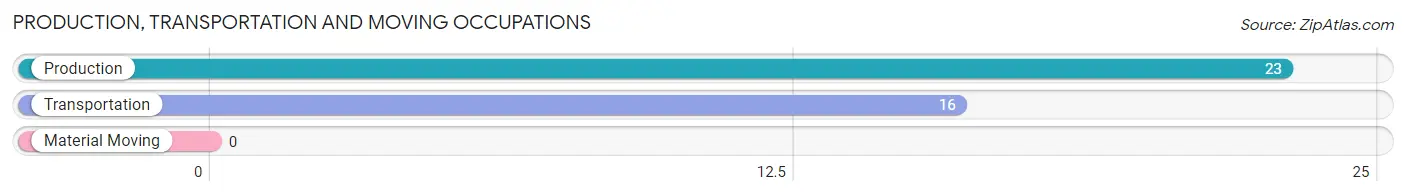
Production, Transportation and Moving Occupations
The most common Production, Transportation and Moving occupations in Brinnon are Production (23 | 9.9%), and Transportation (16 | 6.9%).
Production, Transportation and Moving Occupations by Sex
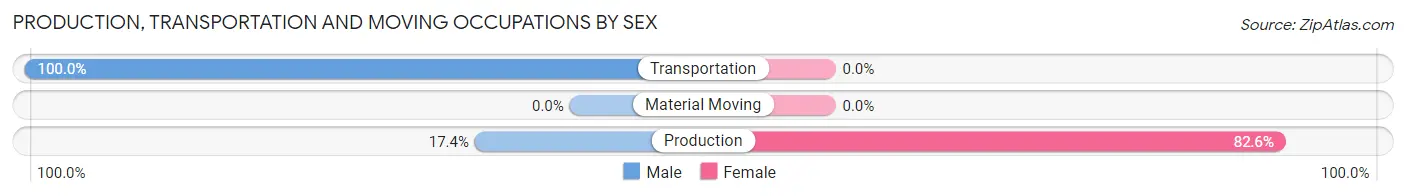
| Occupation | Male | Female |
| Production | 4 (17.4%) | 19 (82.6%) |
| Transportation | 16 (100.0%) | 0 (0.0%) |
| Material Moving | 0 (0.0%) | 0 (0.0%) |
| Total (Category) | 20 (51.3%) | 19 (48.7%) |
| Total (Overall) | 94 (40.5%) | 138 (59.5%) |
Employment Industries by Sex in Brinnon
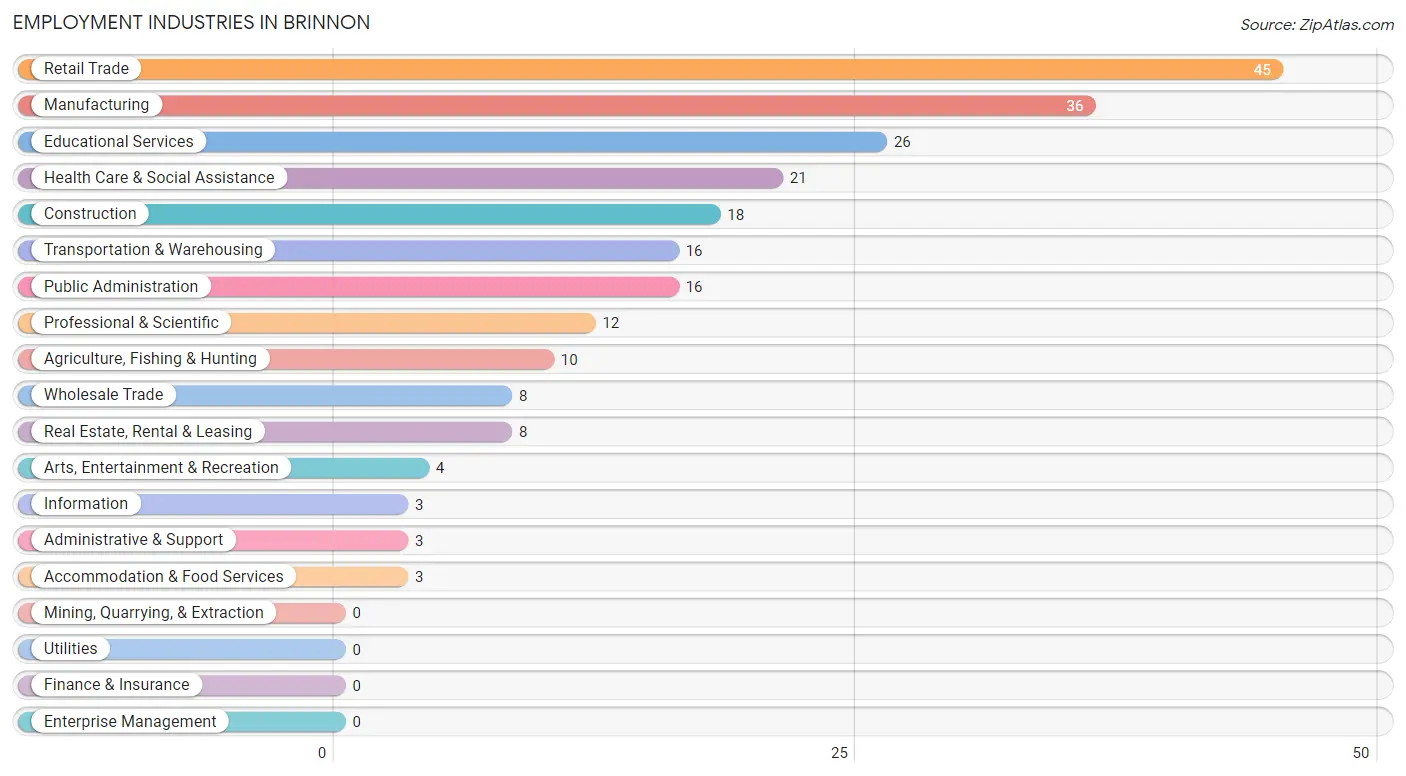
Employment Industries in Brinnon
The major employment industries in Brinnon include Retail Trade (45 | 19.4%), Manufacturing (36 | 15.5%), Educational Services (26 | 11.2%), Health Care & Social Assistance (21 | 9.0%), and Construction (18 | 7.8%).
Employment Industries by Sex in Brinnon
The Brinnon industries that see more men than women are Construction (100.0%), Wholesale Trade (100.0%), and Transportation & Warehousing (100.0%), whereas the industries that tend to have a higher number of women are Information (100.0%), Real Estate, Rental & Leasing (100.0%), and Professional & Scientific (100.0%).
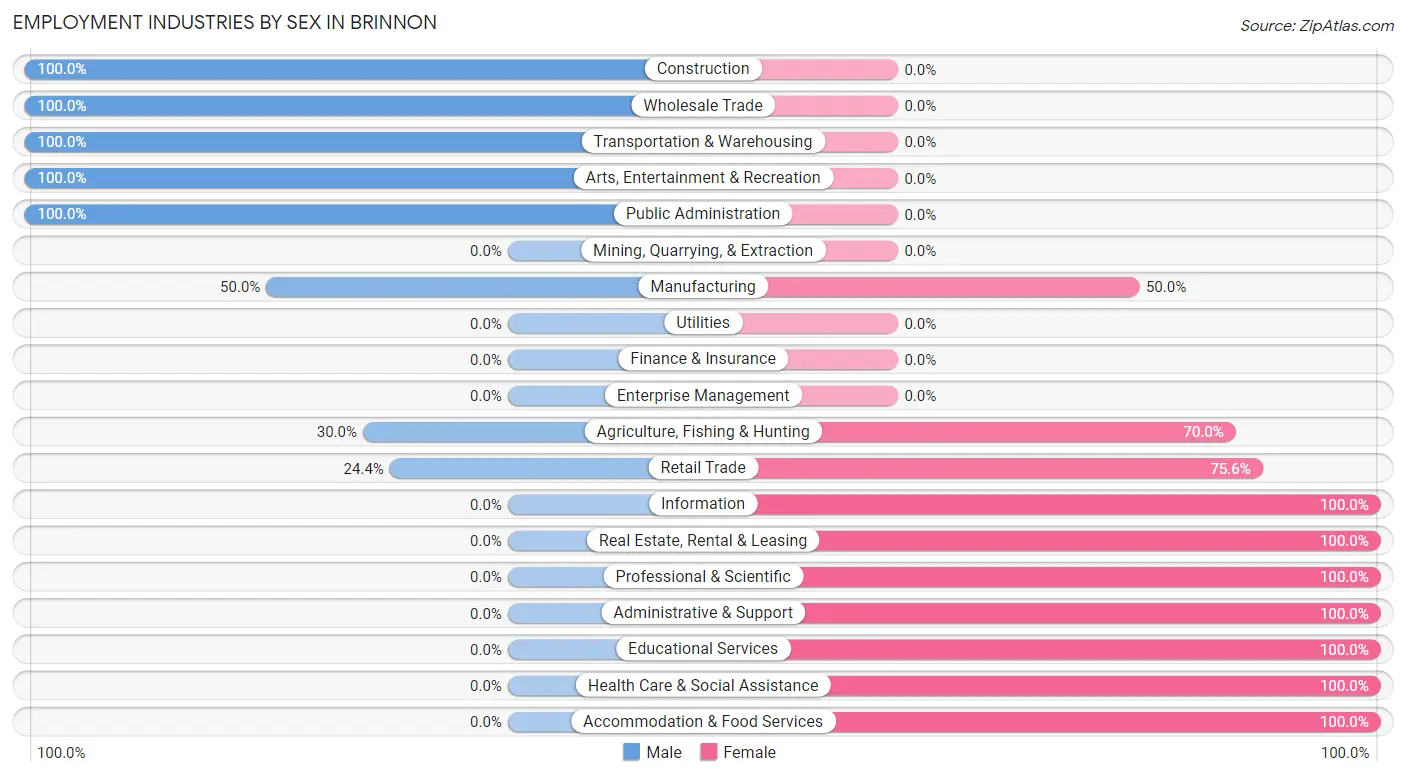
| Industry | Male | Female |
| Agriculture, Fishing & Hunting | 3 (30.0%) | 7 (70.0%) |
| Mining, Quarrying, & Extraction | 0 (0.0%) | 0 (0.0%) |
| Construction | 18 (100.0%) | 0 (0.0%) |
| Manufacturing | 18 (50.0%) | 18 (50.0%) |
| Wholesale Trade | 8 (100.0%) | 0 (0.0%) |
| Retail Trade | 11 (24.4%) | 34 (75.6%) |
| Transportation & Warehousing | 16 (100.0%) | 0 (0.0%) |
| Utilities | 0 (0.0%) | 0 (0.0%) |
| Information | 0 (0.0%) | 3 (100.0%) |
| Finance & Insurance | 0 (0.0%) | 0 (0.0%) |
| Real Estate, Rental & Leasing | 0 (0.0%) | 8 (100.0%) |
| Professional & Scientific | 0 (0.0%) | 12 (100.0%) |
| Enterprise Management | 0 (0.0%) | 0 (0.0%) |
| Administrative & Support | 0 (0.0%) | 3 (100.0%) |
| Educational Services | 0 (0.0%) | 26 (100.0%) |
| Health Care & Social Assistance | 0 (0.0%) | 21 (100.0%) |
| Arts, Entertainment & Recreation | 4 (100.0%) | 0 (0.0%) |
| Accommodation & Food Services | 0 (0.0%) | 3 (100.0%) |
| Public Administration | 16 (100.0%) | 0 (0.0%) |
| Total | 94 (40.5%) | 138 (59.5%) |
Education in Brinnon
School Enrollment in Brinnon
The most common levels of schooling among the 150 students in Brinnon are college / undergraduate (95 | 63.3%), middle school (19 | 12.7%), and elementary school (16 | 10.7%).
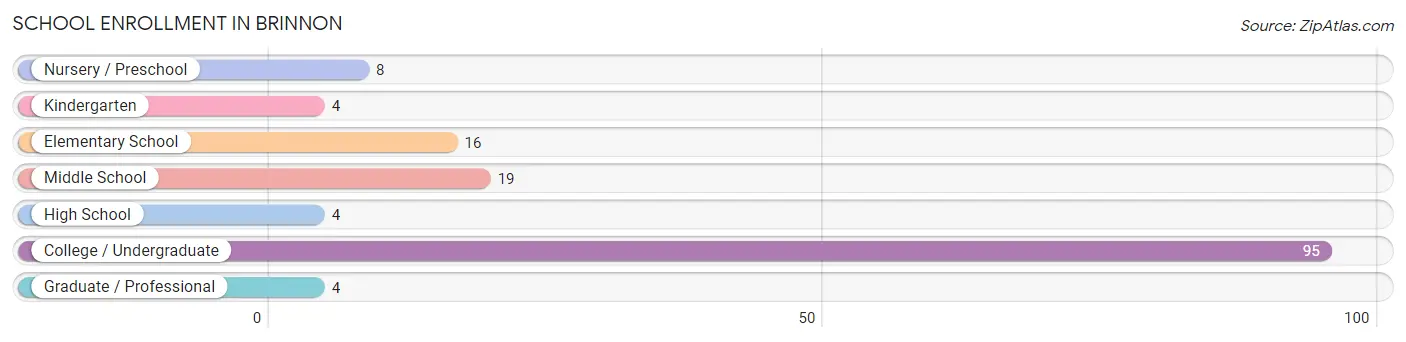
| School Level | # Students | % Students |
| Nursery / Preschool | 8 | 5.3% |
| Kindergarten | 4 | 2.7% |
| Elementary School | 16 | 10.7% |
| Middle School | 19 | 12.7% |
| High School | 4 | 2.7% |
| College / Undergraduate | 95 | 63.3% |
| Graduate / Professional | 4 | 2.7% |
| Total | 150 | 100.0% |
School Enrollment by Age by Funding Source in Brinnon
Out of a total of 150 students who are enrolled in schools in Brinnon, 4 (2.7%) attend a private institution, while the remaining 146 (97.3%) are enrolled in public schools. The age group of 35 years and over has the highest likelihood of being enrolled in private schools, with 4 (4.6% in the age bracket) enrolled. Conversely, the age group of 3 to 4 year olds has the lowest likelihood of being enrolled in a private school, with 12 (100.0% in the age bracket) attending a public institution.
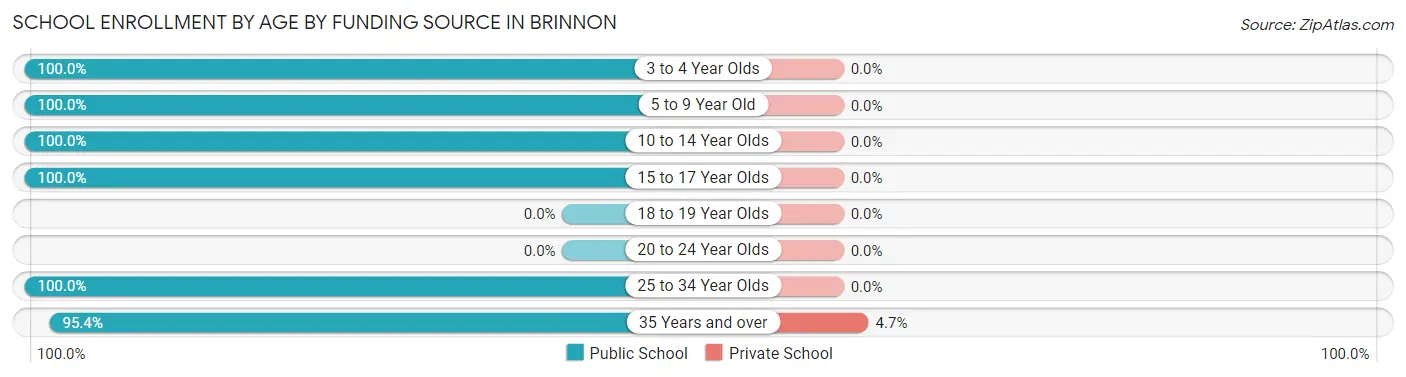
| Age Bracket | Public School | Private School |
| 3 to 4 Year Olds | 12 (100.0%) | 0 (0.0%) |
| 5 to 9 Year Old | 12 (100.0%) | 0 (0.0%) |
| 10 to 14 Year Olds | 23 (100.0%) | 0 (0.0%) |
| 15 to 17 Year Olds | 4 (100.0%) | 0 (0.0%) |
| 18 to 19 Year Olds | 0 (0.0%) | 0 (0.0%) |
| 20 to 24 Year Olds | 0 (0.0%) | 0 (0.0%) |
| 25 to 34 Year Olds | 13 (100.0%) | 0 (0.0%) |
| 35 Years and over | 82 (95.4%) | 4 (4.6%) |
| Total | 146 (97.3%) | 4 (2.7%) |
Educational Attainment by Field of Study in Brinnon
Liberal arts & history (31 | 23.7%), arts & humanities (28 | 21.4%), education (20 | 15.3%), social sciences (14 | 10.7%), and bio, nature & agricultural (7 | 5.3%) are the most common fields of study among 131 individuals in Brinnon who have obtained a bachelor's degree or higher.
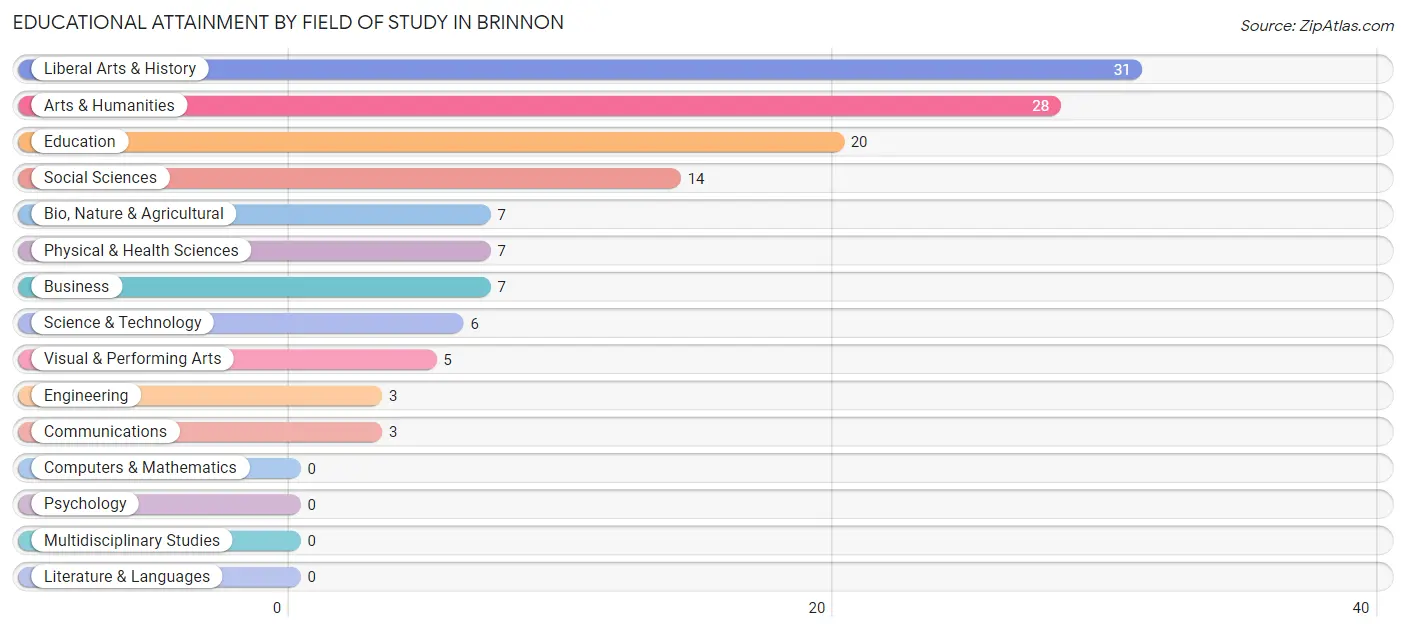
| Field of Study | # Graduates | % Graduates |
| Computers & Mathematics | 0 | 0.0% |
| Bio, Nature & Agricultural | 7 | 5.3% |
| Physical & Health Sciences | 7 | 5.3% |
| Psychology | 0 | 0.0% |
| Social Sciences | 14 | 10.7% |
| Engineering | 3 | 2.3% |
| Multidisciplinary Studies | 0 | 0.0% |
| Science & Technology | 6 | 4.6% |
| Business | 7 | 5.3% |
| Education | 20 | 15.3% |
| Literature & Languages | 0 | 0.0% |
| Liberal Arts & History | 31 | 23.7% |
| Visual & Performing Arts | 5 | 3.8% |
| Communications | 3 | 2.3% |
| Arts & Humanities | 28 | 21.4% |
| Total | 131 | 100.0% |
Transportation & Commute in Brinnon
Vehicle Availability by Sex in Brinnon
The most prevalent vehicle ownership categories in Brinnon are males with 2 vehicles (50, accounting for 53.2%) and females with 2 vehicles (25, making up 36.2%).
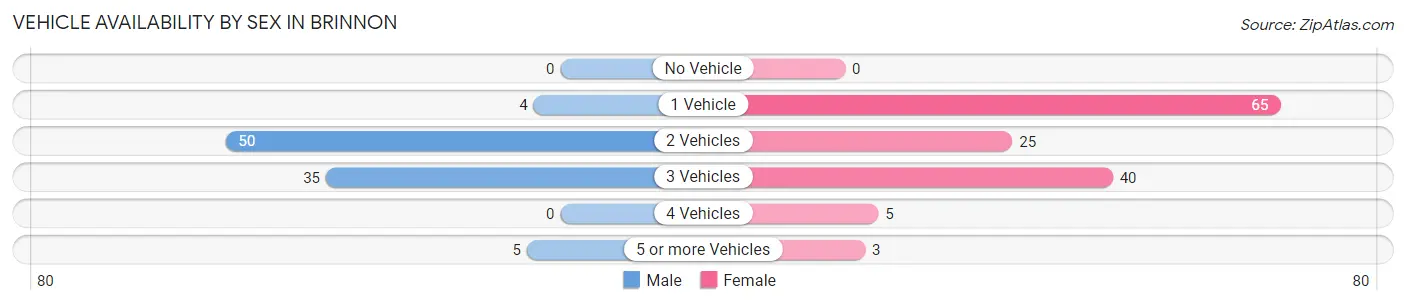
| Vehicles Available | Male | Female |
| No Vehicle | 0 (0.0%) | 0 (0.0%) |
| 1 Vehicle | 4 (4.3%) | 65 (47.1%) |
| 2 Vehicles | 50 (53.2%) | 25 (18.1%) |
| 3 Vehicles | 35 (37.2%) | 40 (29.0%) |
| 4 Vehicles | 0 (0.0%) | 5 (3.6%) |
| 5 or more Vehicles | 5 (5.3%) | 3 (2.2%) |
| Total | 94 (100.0%) | 138 (100.0%) |
Commute Time in Brinnon
The most frequently occuring commute durations in Brinnon are 90 or more minutes (45 commuters, 22.3%), 45 to 59 minutes (29 commuters, 14.4%), and 60 to 89 minutes (28 commuters, 13.9%).
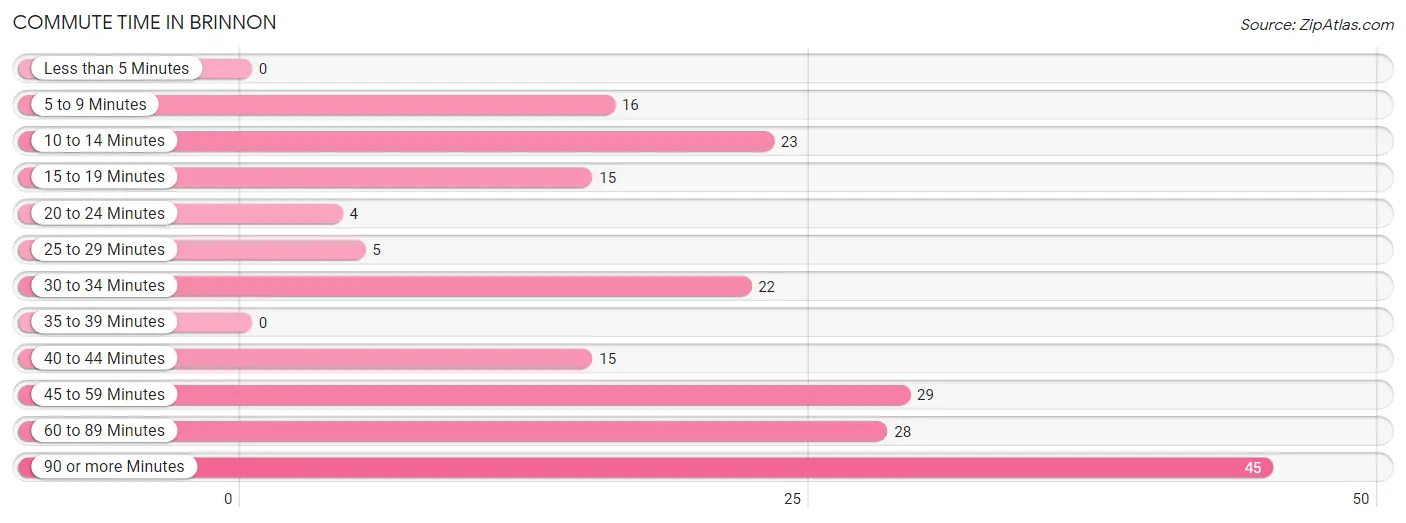
| Commute Time | # Commuters | % Commuters |
| Less than 5 Minutes | 0 | 0.0% |
| 5 to 9 Minutes | 16 | 7.9% |
| 10 to 14 Minutes | 23 | 11.4% |
| 15 to 19 Minutes | 15 | 7.4% |
| 20 to 24 Minutes | 4 | 2.0% |
| 25 to 29 Minutes | 5 | 2.5% |
| 30 to 34 Minutes | 22 | 10.9% |
| 35 to 39 Minutes | 0 | 0.0% |
| 40 to 44 Minutes | 15 | 7.4% |
| 45 to 59 Minutes | 29 | 14.4% |
| 60 to 89 Minutes | 28 | 13.9% |
| 90 or more Minutes | 45 | 22.3% |
Commute Time by Sex in Brinnon
The most common commute times in Brinnon are 90 or more minutes (25 commuters, 30.9%) for males and 10 to 14 minutes (23 commuters, 19.0%) for females.
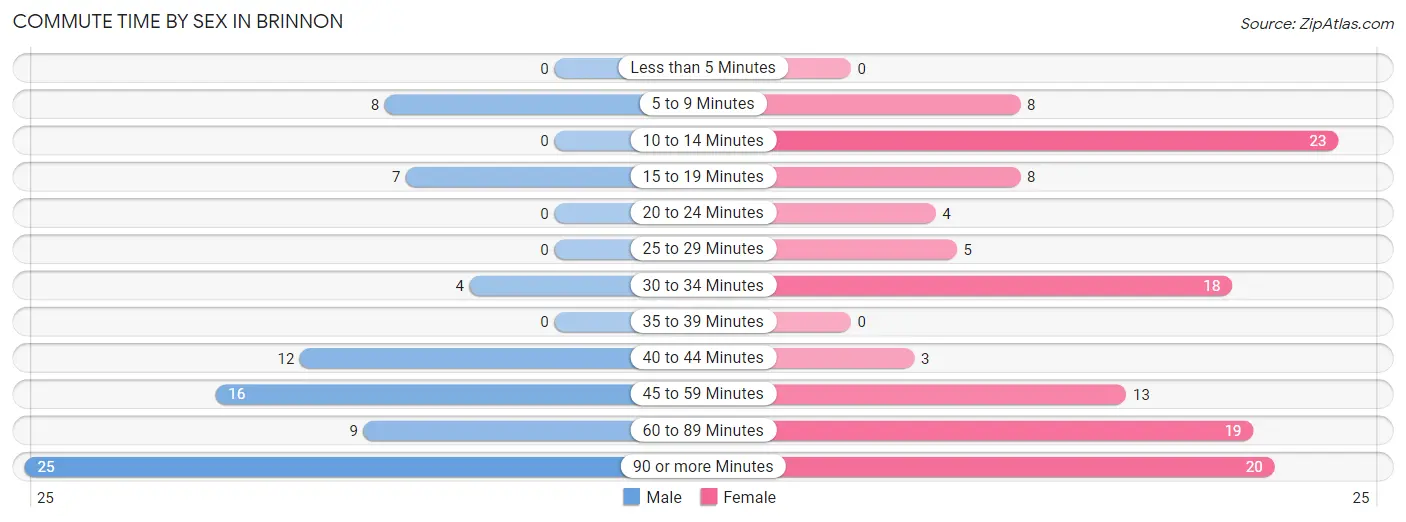
| Commute Time | Male | Female |
| Less than 5 Minutes | 0 (0.0%) | 0 (0.0%) |
| 5 to 9 Minutes | 8 (9.9%) | 8 (6.6%) |
| 10 to 14 Minutes | 0 (0.0%) | 23 (19.0%) |
| 15 to 19 Minutes | 7 (8.6%) | 8 (6.6%) |
| 20 to 24 Minutes | 0 (0.0%) | 4 (3.3%) |
| 25 to 29 Minutes | 0 (0.0%) | 5 (4.1%) |
| 30 to 34 Minutes | 4 (4.9%) | 18 (14.9%) |
| 35 to 39 Minutes | 0 (0.0%) | 0 (0.0%) |
| 40 to 44 Minutes | 12 (14.8%) | 3 (2.5%) |
| 45 to 59 Minutes | 16 (19.8%) | 13 (10.7%) |
| 60 to 89 Minutes | 9 (11.1%) | 19 (15.7%) |
| 90 or more Minutes | 25 (30.9%) | 20 (16.5%) |
Time of Departure to Work by Sex in Brinnon
The most frequent times of departure to work in Brinnon are 12:00 AM to 4:59 AM (33, 40.7%) for males and 8:30 AM to 8:59 AM (31, 25.6%) for females.
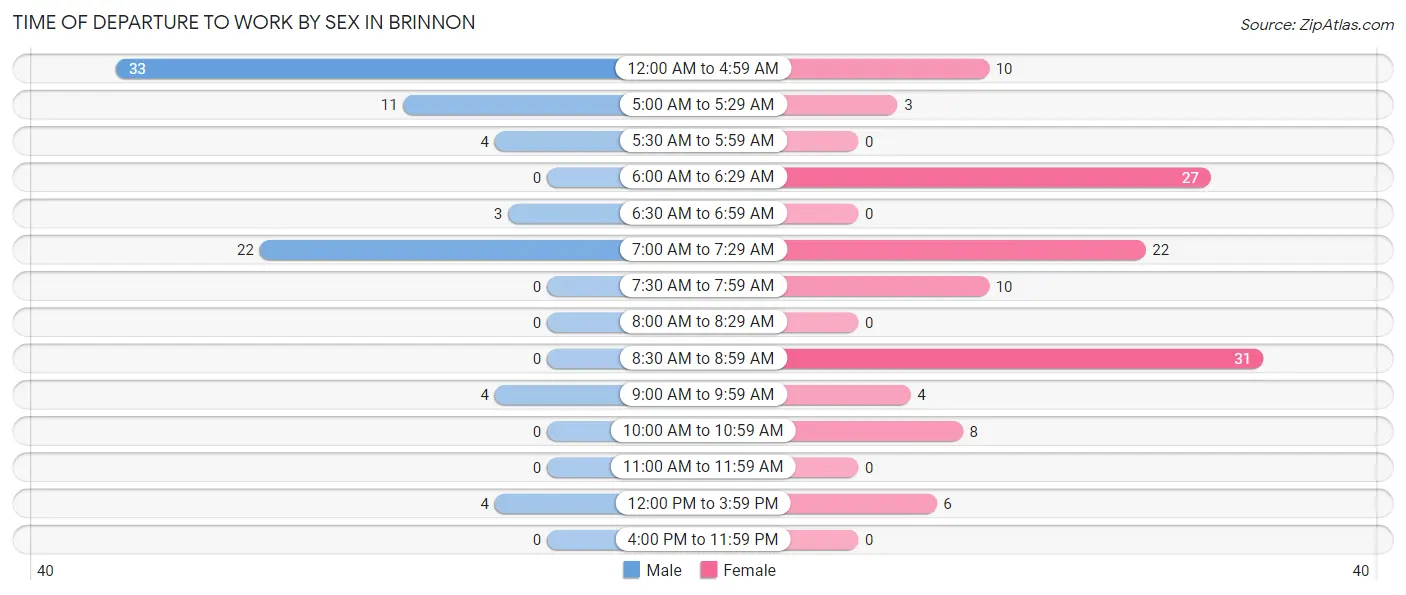
| Time of Departure | Male | Female |
| 12:00 AM to 4:59 AM | 33 (40.7%) | 10 (8.3%) |
| 5:00 AM to 5:29 AM | 11 (13.6%) | 3 (2.5%) |
| 5:30 AM to 5:59 AM | 4 (4.9%) | 0 (0.0%) |
| 6:00 AM to 6:29 AM | 0 (0.0%) | 27 (22.3%) |
| 6:30 AM to 6:59 AM | 3 (3.7%) | 0 (0.0%) |
| 7:00 AM to 7:29 AM | 22 (27.2%) | 22 (18.2%) |
| 7:30 AM to 7:59 AM | 0 (0.0%) | 10 (8.3%) |
| 8:00 AM to 8:29 AM | 0 (0.0%) | 0 (0.0%) |
| 8:30 AM to 8:59 AM | 0 (0.0%) | 31 (25.6%) |
| 9:00 AM to 9:59 AM | 4 (4.9%) | 4 (3.3%) |
| 10:00 AM to 10:59 AM | 0 (0.0%) | 8 (6.6%) |
| 11:00 AM to 11:59 AM | 0 (0.0%) | 0 (0.0%) |
| 12:00 PM to 3:59 PM | 4 (4.9%) | 6 (5.0%) |
| 4:00 PM to 11:59 PM | 0 (0.0%) | 0 (0.0%) |
| Total | 81 (100.0%) | 121 (100.0%) |
Housing Occupancy in Brinnon
Occupancy by Ownership in Brinnon
Of the total 436 dwellings in Brinnon, owner-occupied units account for 379 (86.9%), while renter-occupied units make up 57 (13.1%).
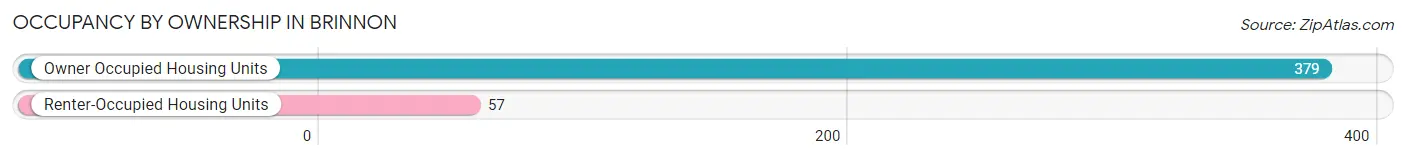
| Occupancy | # Housing Units | % Housing Units |
| Owner Occupied Housing Units | 379 | 86.9% |
| Renter-Occupied Housing Units | 57 | 13.1% |
| Total Occupied Housing Units | 436 | 100.0% |
Occupancy by Household Size in Brinnon
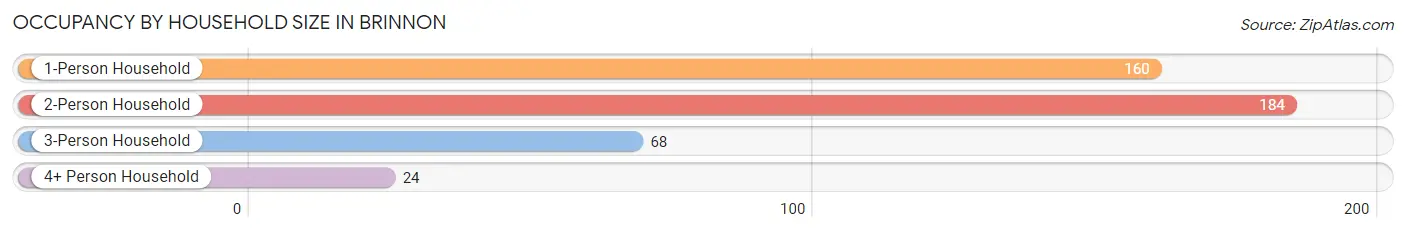
| Household Size | # Housing Units | % Housing Units |
| 1-Person Household | 160 | 36.7% |
| 2-Person Household | 184 | 42.2% |
| 3-Person Household | 68 | 15.6% |
| 4+ Person Household | 24 | 5.5% |
| Total Housing Units | 436 | 100.0% |
Occupancy by Ownership by Household Size in Brinnon
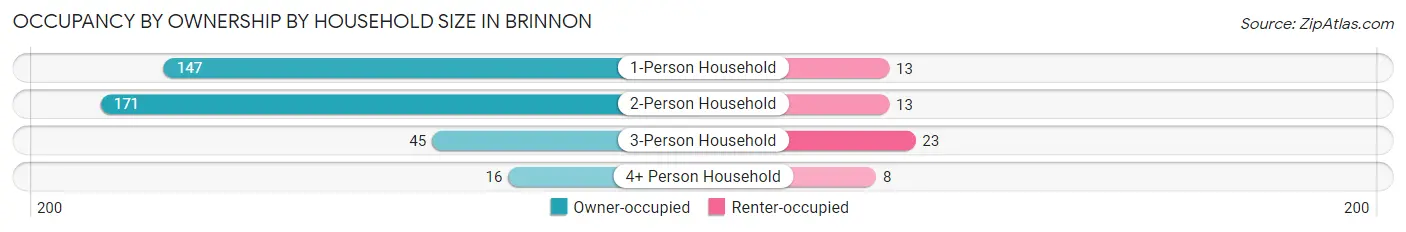
| Household Size | Owner-occupied | Renter-occupied |
| 1-Person Household | 147 (91.9%) | 13 (8.1%) |
| 2-Person Household | 171 (92.9%) | 13 (7.1%) |
| 3-Person Household | 45 (66.2%) | 23 (33.8%) |
| 4+ Person Household | 16 (66.7%) | 8 (33.3%) |
| Total Housing Units | 379 (86.9%) | 57 (13.1%) |
Occupancy by Educational Attainment in Brinnon
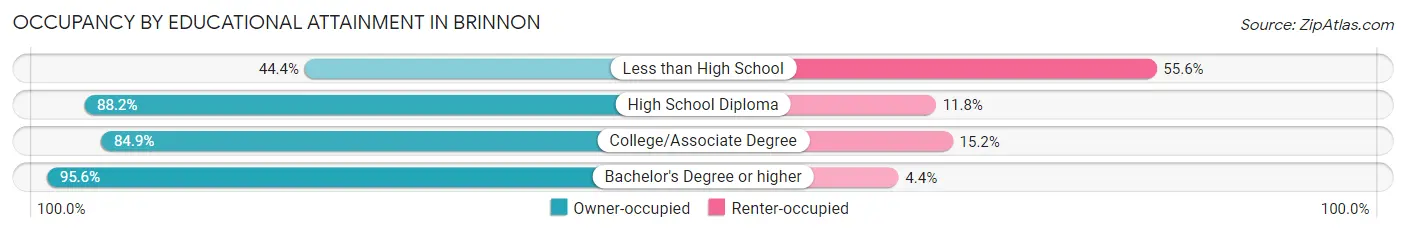
| Household Size | Owner-occupied | Renter-occupied |
| Less than High School | 4 (44.4%) | 5 (55.6%) |
| High School Diploma | 142 (88.2%) | 19 (11.8%) |
| College/Associate Degree | 168 (84.9%) | 30 (15.1%) |
| Bachelor's Degree or higher | 65 (95.6%) | 3 (4.4%) |
Occupancy by Age of Householder in Brinnon
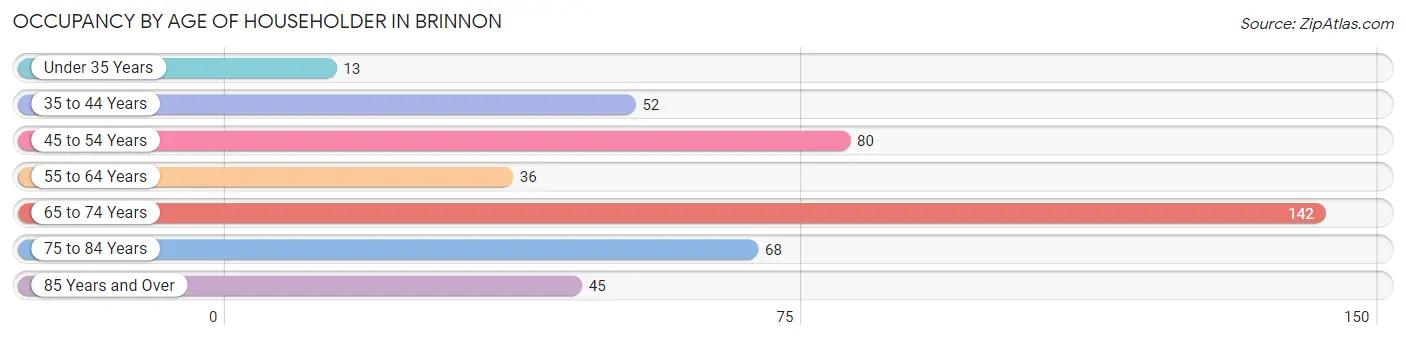
| Age Bracket | # Households | % Households |
| Under 35 Years | 13 | 3.0% |
| 35 to 44 Years | 52 | 11.9% |
| 45 to 54 Years | 80 | 18.3% |
| 55 to 64 Years | 36 | 8.3% |
| 65 to 74 Years | 142 | 32.6% |
| 75 to 84 Years | 68 | 15.6% |
| 85 Years and Over | 45 | 10.3% |
| Total | 436 | 100.0% |
Housing Finances in Brinnon
Median Income by Occupancy in Brinnon
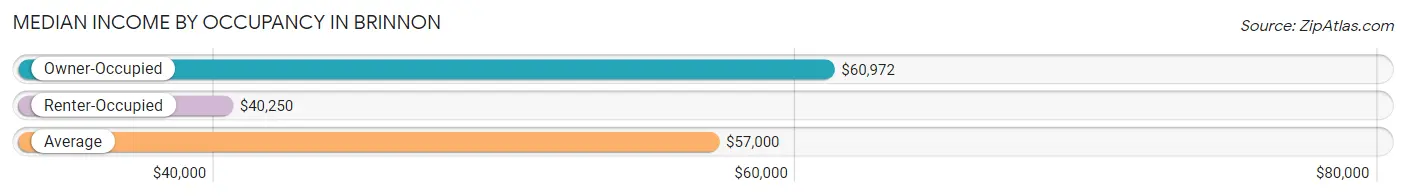
| Occupancy Type | # Households | Median Income |
| Owner-Occupied | 379 (86.9%) | $60,972 |
| Renter-Occupied | 57 (13.1%) | $40,250 |
| Average | 436 (100.0%) | $57,000 |
Occupancy by Householder Income Bracket in Brinnon
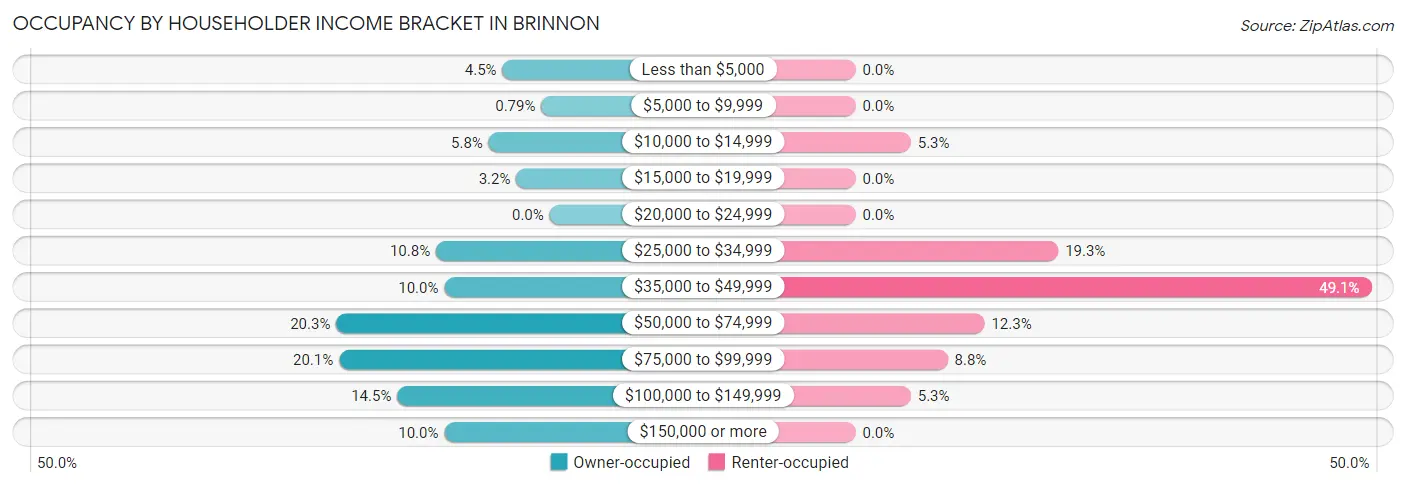
| Income Bracket | Owner-occupied | Renter-occupied |
| Less than $5,000 | 17 (4.5%) | 0 (0.0%) |
| $5,000 to $9,999 | 3 (0.8%) | 0 (0.0%) |
| $10,000 to $14,999 | 22 (5.8%) | 3 (5.3%) |
| $15,000 to $19,999 | 12 (3.2%) | 0 (0.0%) |
| $20,000 to $24,999 | 0 (0.0%) | 0 (0.0%) |
| $25,000 to $34,999 | 41 (10.8%) | 11 (19.3%) |
| $35,000 to $49,999 | 38 (10.0%) | 28 (49.1%) |
| $50,000 to $74,999 | 77 (20.3%) | 7 (12.3%) |
| $75,000 to $99,999 | 76 (20.1%) | 5 (8.8%) |
| $100,000 to $149,999 | 55 (14.5%) | 3 (5.3%) |
| $150,000 or more | 38 (10.0%) | 0 (0.0%) |
| Total | 379 (100.0%) | 57 (100.0%) |
Monthly Housing Cost Tiers in Brinnon
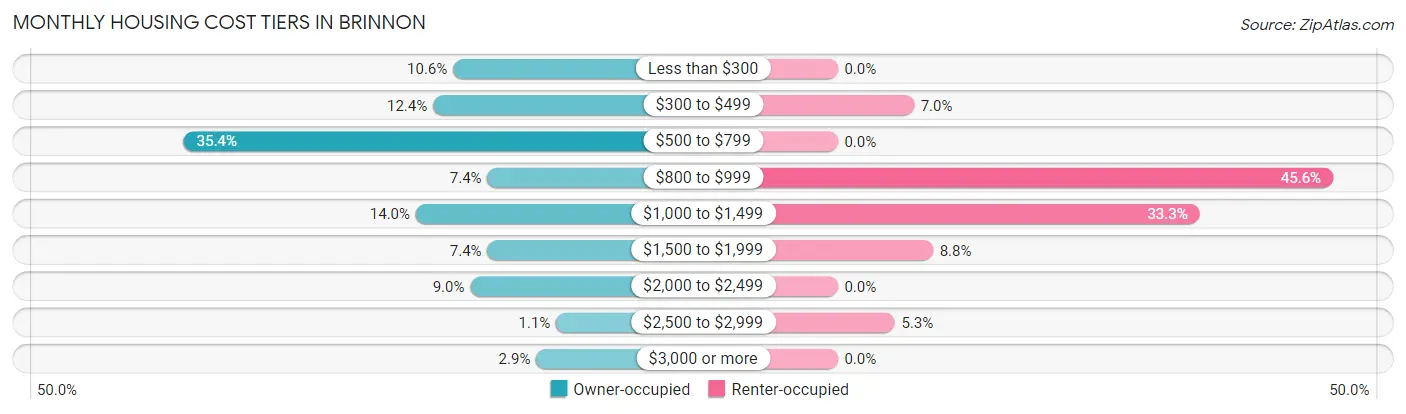
| Monthly Cost | Owner-occupied | Renter-occupied |
| Less than $300 | 40 (10.5%) | 0 (0.0%) |
| $300 to $499 | 47 (12.4%) | 4 (7.0%) |
| $500 to $799 | 134 (35.4%) | 0 (0.0%) |
| $800 to $999 | 28 (7.4%) | 26 (45.6%) |
| $1,000 to $1,499 | 53 (14.0%) | 19 (33.3%) |
| $1,500 to $1,999 | 28 (7.4%) | 5 (8.8%) |
| $2,000 to $2,499 | 34 (9.0%) | 0 (0.0%) |
| $2,500 to $2,999 | 4 (1.1%) | 3 (5.3%) |
| $3,000 or more | 11 (2.9%) | 0 (0.0%) |
| Total | 379 (100.0%) | 57 (100.0%) |
Physical Housing Characteristics in Brinnon
Housing Structures in Brinnon
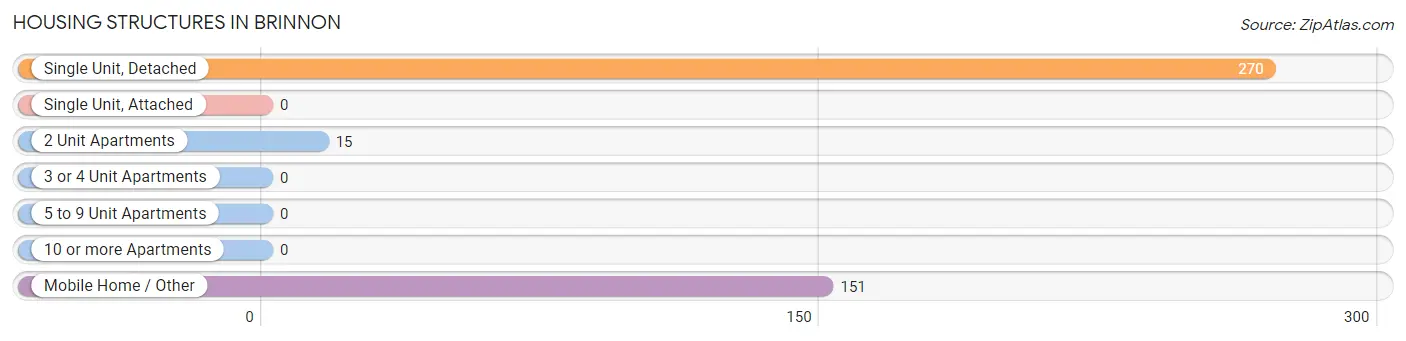
| Structure Type | # Housing Units | % Housing Units |
| Single Unit, Detached | 270 | 61.9% |
| Single Unit, Attached | 0 | 0.0% |
| 2 Unit Apartments | 15 | 3.4% |
| 3 or 4 Unit Apartments | 0 | 0.0% |
| 5 to 9 Unit Apartments | 0 | 0.0% |
| 10 or more Apartments | 0 | 0.0% |
| Mobile Home / Other | 151 | 34.6% |
| Total | 436 | 100.0% |
Housing Structures by Occupancy in Brinnon
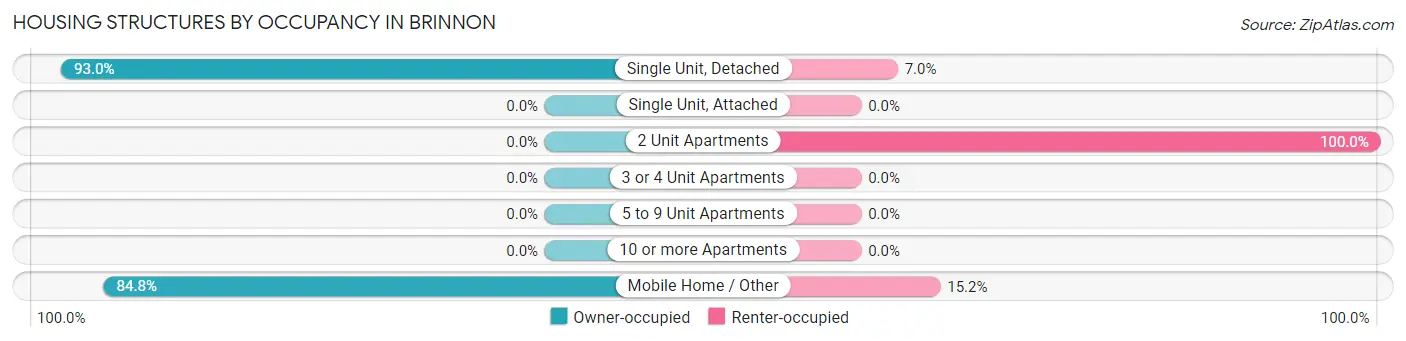
| Structure Type | Owner-occupied | Renter-occupied |
| Single Unit, Detached | 251 (93.0%) | 19 (7.0%) |
| Single Unit, Attached | 0 (0.0%) | 0 (0.0%) |
| 2 Unit Apartments | 0 (0.0%) | 15 (100.0%) |
| 3 or 4 Unit Apartments | 0 (0.0%) | 0 (0.0%) |
| 5 to 9 Unit Apartments | 0 (0.0%) | 0 (0.0%) |
| 10 or more Apartments | 0 (0.0%) | 0 (0.0%) |
| Mobile Home / Other | 128 (84.8%) | 23 (15.2%) |
| Total | 379 (86.9%) | 57 (13.1%) |
Housing Structures by Number of Rooms in Brinnon
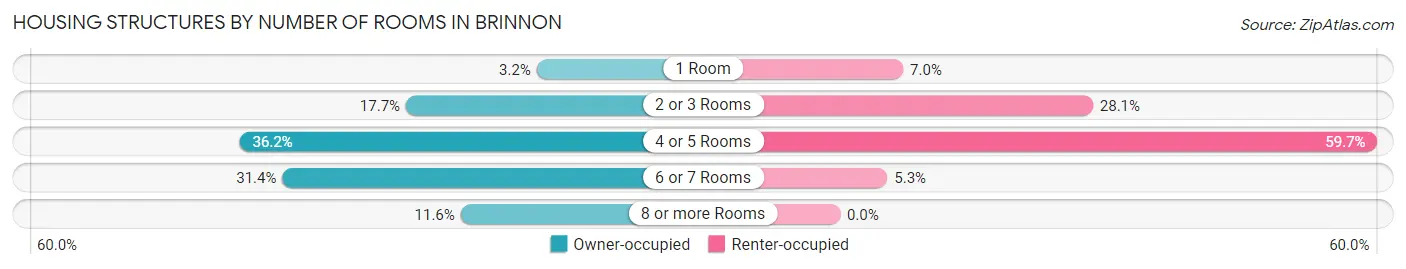
| Number of Rooms | Owner-occupied | Renter-occupied |
| 1 Room | 12 (3.2%) | 4 (7.0%) |
| 2 or 3 Rooms | 67 (17.7%) | 16 (28.1%) |
| 4 or 5 Rooms | 137 (36.1%) | 34 (59.7%) |
| 6 or 7 Rooms | 119 (31.4%) | 3 (5.3%) |
| 8 or more Rooms | 44 (11.6%) | 0 (0.0%) |
| Total | 379 (100.0%) | 57 (100.0%) |
Housing Structure by Heating Type in Brinnon
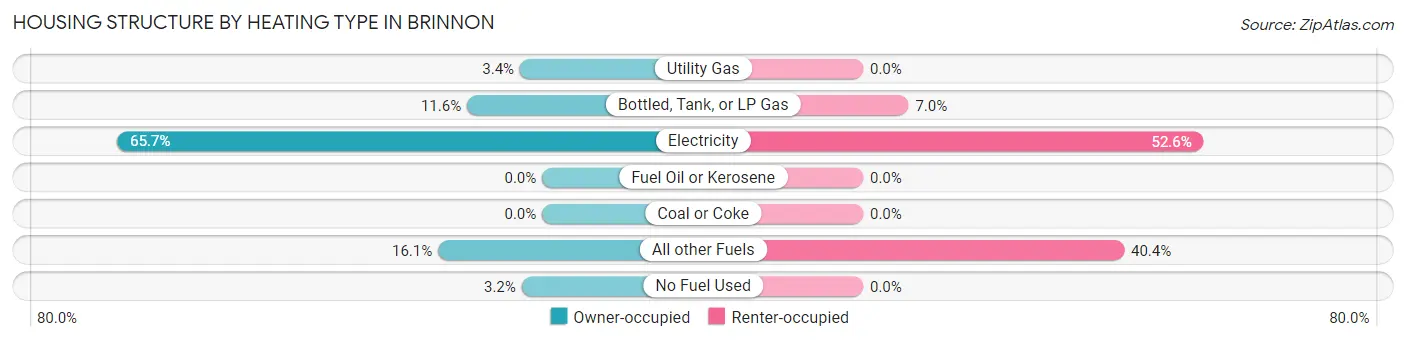
| Heating Type | Owner-occupied | Renter-occupied |
| Utility Gas | 13 (3.4%) | 0 (0.0%) |
| Bottled, Tank, or LP Gas | 44 (11.6%) | 4 (7.0%) |
| Electricity | 249 (65.7%) | 30 (52.6%) |
| Fuel Oil or Kerosene | 0 (0.0%) | 0 (0.0%) |
| Coal or Coke | 0 (0.0%) | 0 (0.0%) |
| All other Fuels | 61 (16.1%) | 23 (40.4%) |
| No Fuel Used | 12 (3.2%) | 0 (0.0%) |
| Total | 379 (100.0%) | 57 (100.0%) |
Household Vehicle Usage in Brinnon
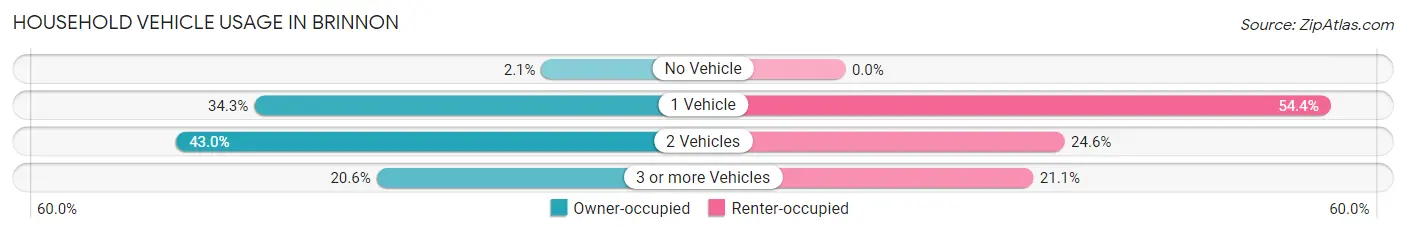
| Vehicles per Household | Owner-occupied | Renter-occupied |
| No Vehicle | 8 (2.1%) | 0 (0.0%) |
| 1 Vehicle | 130 (34.3%) | 31 (54.4%) |
| 2 Vehicles | 163 (43.0%) | 14 (24.6%) |
| 3 or more Vehicles | 78 (20.6%) | 12 (21.0%) |
| Total | 379 (100.0%) | 57 (100.0%) |
Real Estate & Mortgages in Brinnon
Real Estate and Mortgage Overview in Brinnon
| Characteristic | Without Mortgage | With Mortgage |
| Housing Units | 173 | 206 |
| Median Property Value | $243,500 | $280,000 |
| Median Household Income | $54,196 | $19 |
| Monthly Housing Costs | $520 | $11 |
| Real Estate Taxes | $1,530 | $6 |
Property Value by Mortgage Status in Brinnon
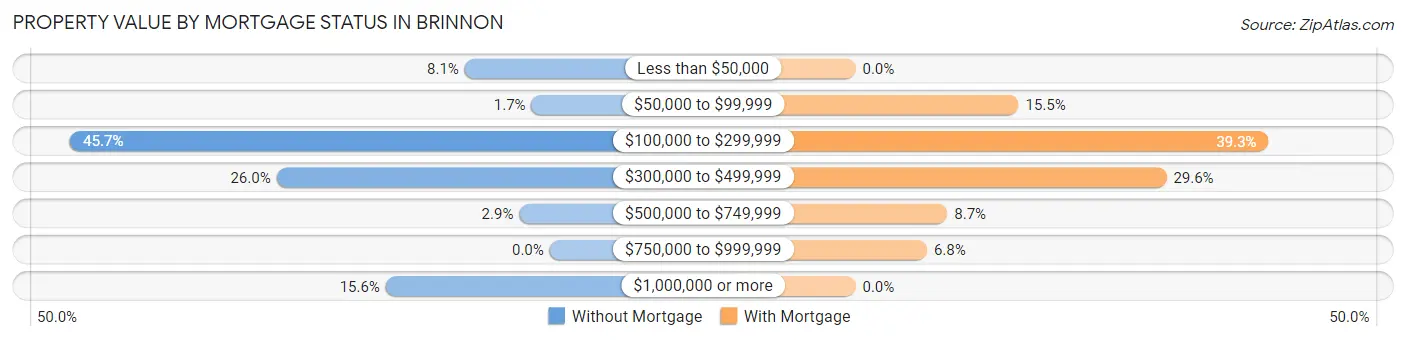
| Property Value | Without Mortgage | With Mortgage |
| Less than $50,000 | 14 (8.1%) | 0 (0.0%) |
| $50,000 to $99,999 | 3 (1.7%) | 32 (15.5%) |
| $100,000 to $299,999 | 79 (45.7%) | 81 (39.3%) |
| $300,000 to $499,999 | 45 (26.0%) | 61 (29.6%) |
| $500,000 to $749,999 | 5 (2.9%) | 18 (8.7%) |
| $750,000 to $999,999 | 0 (0.0%) | 14 (6.8%) |
| $1,000,000 or more | 27 (15.6%) | 0 (0.0%) |
| Total | 173 (100.0%) | 206 (100.0%) |
Household Income by Mortgage Status in Brinnon
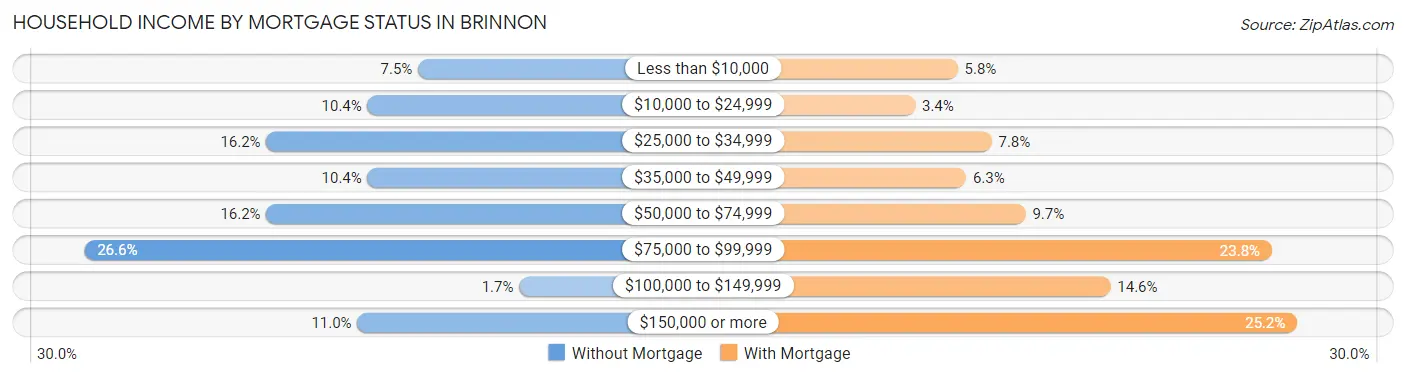
| Household Income | Without Mortgage | With Mortgage |
| Less than $10,000 | 13 (7.5%) | 12 (5.8%) |
| $10,000 to $24,999 | 18 (10.4%) | 7 (3.4%) |
| $25,000 to $34,999 | 28 (16.2%) | 16 (7.8%) |
| $35,000 to $49,999 | 18 (10.4%) | 13 (6.3%) |
| $50,000 to $74,999 | 28 (16.2%) | 20 (9.7%) |
| $75,000 to $99,999 | 46 (26.6%) | 49 (23.8%) |
| $100,000 to $149,999 | 3 (1.7%) | 30 (14.6%) |
| $150,000 or more | 19 (11.0%) | 52 (25.2%) |
| Total | 173 (100.0%) | 206 (100.0%) |
Property Value to Household Income Ratio in Brinnon
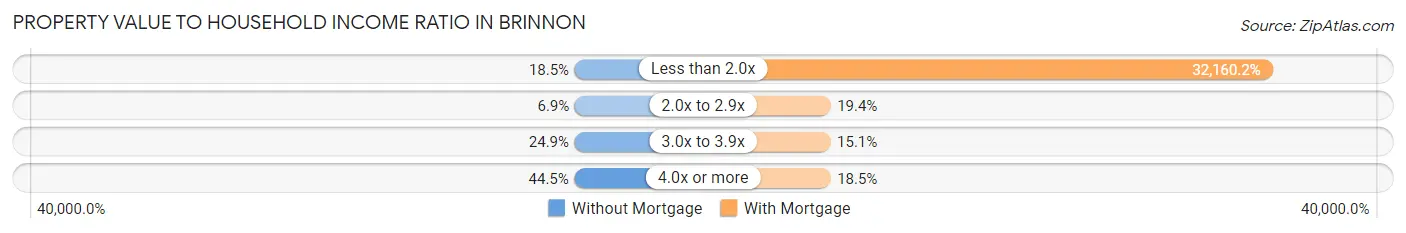
| Value-to-Income Ratio | Without Mortgage | With Mortgage |
| Less than 2.0x | 32 (18.5%) | 66,250 (32,160.2%) |
| 2.0x to 2.9x | 12 (6.9%) | 40 (19.4%) |
| 3.0x to 3.9x | 43 (24.9%) | 31 (15.0%) |
| 4.0x or more | 77 (44.5%) | 38 (18.4%) |
| Total | 173 (100.0%) | 206 (100.0%) |
Real Estate Taxes by Mortgage Status in Brinnon
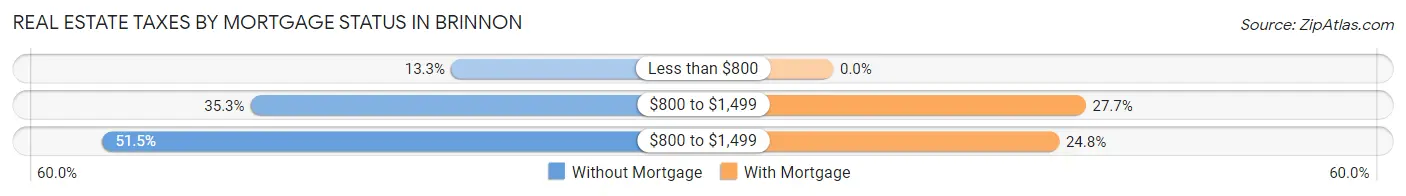
| Property Taxes | Without Mortgage | With Mortgage |
| Less than $800 | 23 (13.3%) | 0 (0.0%) |
| $800 to $1,499 | 61 (35.3%) | 57 (27.7%) |
| $800 to $1,499 | 89 (51.4%) | 51 (24.8%) |
| Total | 173 (100.0%) | 206 (100.0%) |
Health & Disability in Brinnon
Health Insurance Coverage by Age in Brinnon
| Age Bracket | With Coverage | Without Coverage |
| Under 6 Years | 21 (100.0%) | 0 (0.0%) |
| 6 to 18 Years | 39 (100.0%) | 0 (0.0%) |
| 19 to 25 Years | 12 (100.0%) | 0 (0.0%) |
| 26 to 34 Years | 19 (100.0%) | 0 (0.0%) |
| 35 to 44 Years | 84 (85.7%) | 14 (14.3%) |
| 45 to 54 Years | 192 (94.1%) | 12 (5.9%) |
| 55 to 64 Years | 62 (89.9%) | 7 (10.1%) |
| 65 to 74 Years | 272 (100.0%) | 0 (0.0%) |
| 75 Years and older | 140 (100.0%) | 0 (0.0%) |
| Total | 841 (96.2%) | 33 (3.8%) |
Health Insurance Coverage by Citizenship Status in Brinnon
| Citizenship Status | With Coverage | Without Coverage |
| Native Born | 21 (100.0%) | 0 (0.0%) |
| Foreign Born, Citizen | 39 (100.0%) | 0 (0.0%) |
| Foreign Born, not a Citizen | 12 (100.0%) | 0 (0.0%) |
Health Insurance Coverage by Household Income in Brinnon
| Household Income | With Coverage | Without Coverage |
| Under $25,000 | 60 (81.1%) | 14 (18.9%) |
| $25,000 to $49,999 | 184 (96.3%) | 7 (3.7%) |
| $50,000 to $74,999 | 154 (100.0%) | 0 (0.0%) |
| $75,000 to $99,999 | 252 (100.0%) | 0 (0.0%) |
| $100,000 and over | 191 (94.1%) | 12 (5.9%) |
Public vs Private Health Insurance Coverage by Age in Brinnon
| Age Bracket | Public Insurance | Private Insurance |
| Under 6 | 21 (100.0%) | 4 (19.1%) |
| 6 to 18 Years | 39 (100.0%) | 5 (12.8%) |
| 19 to 25 Years | 5 (41.7%) | 7 (58.3%) |
| 25 to 34 Years | 7 (36.8%) | 12 (63.2%) |
| 35 to 44 Years | 38 (38.8%) | 46 (46.9%) |
| 45 to 54 Years | 126 (61.8%) | 70 (34.3%) |
| 55 to 64 Years | 13 (18.8%) | 49 (71.0%) |
| 65 to 74 Years | 268 (98.5%) | 187 (68.8%) |
| 75 Years and over | 140 (100.0%) | 83 (59.3%) |
| Total | 657 (75.2%) | 463 (53.0%) |
Disability Status by Sex by Age in Brinnon
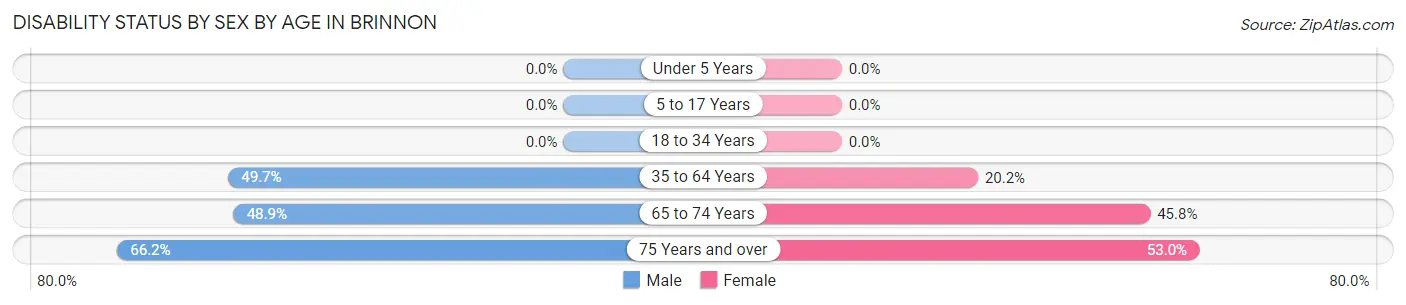
| Age Bracket | Male | Female |
| Under 5 Years | 0 (0.0%) | 0 (0.0%) |
| 5 to 17 Years | 0 (0.0%) | 0 (0.0%) |
| 18 to 34 Years | 0 (0.0%) | 0 (0.0%) |
| 35 to 64 Years | 96 (49.7%) | 36 (20.2%) |
| 65 to 74 Years | 69 (48.9%) | 60 (45.8%) |
| 75 Years and over | 49 (66.2%) | 35 (53.0%) |
Disability Class by Sex by Age in Brinnon
Disability Class: Hearing Difficulty
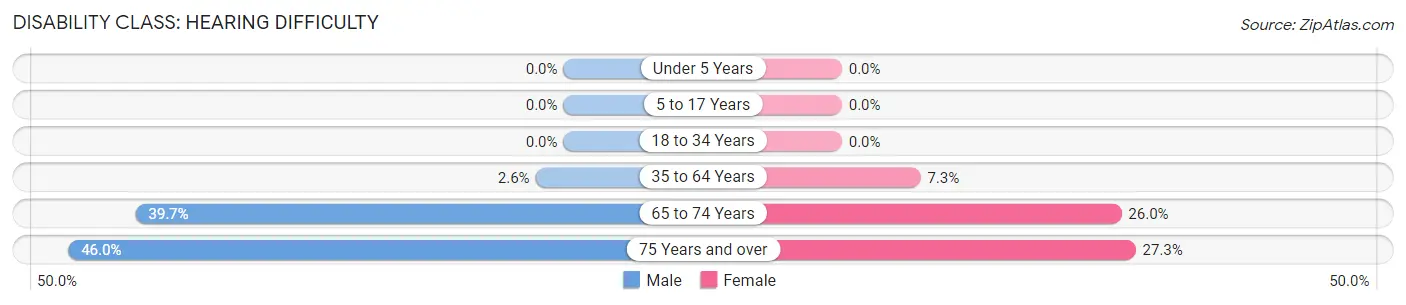
| Age Bracket | Male | Female |
| Under 5 Years | 0 (0.0%) | 0 (0.0%) |
| 5 to 17 Years | 0 (0.0%) | 0 (0.0%) |
| 18 to 34 Years | 0 (0.0%) | 0 (0.0%) |
| 35 to 64 Years | 5 (2.6%) | 13 (7.3%) |
| 65 to 74 Years | 56 (39.7%) | 34 (26.0%) |
| 75 Years and over | 34 (46.0%) | 18 (27.3%) |
Disability Class: Vision Difficulty
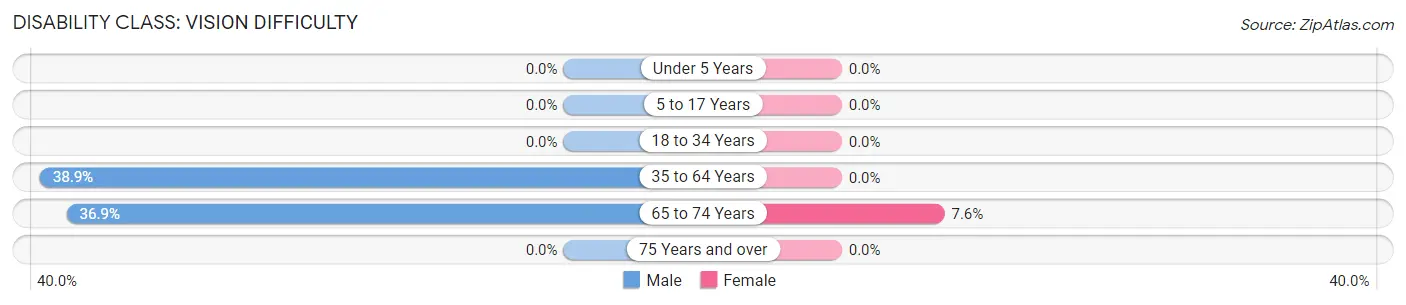
| Age Bracket | Male | Female |
| Under 5 Years | 0 (0.0%) | 0 (0.0%) |
| 5 to 17 Years | 0 (0.0%) | 0 (0.0%) |
| 18 to 34 Years | 0 (0.0%) | 0 (0.0%) |
| 35 to 64 Years | 75 (38.9%) | 0 (0.0%) |
| 65 to 74 Years | 52 (36.9%) | 10 (7.6%) |
| 75 Years and over | 0 (0.0%) | 0 (0.0%) |
Disability Class: Cognitive Difficulty
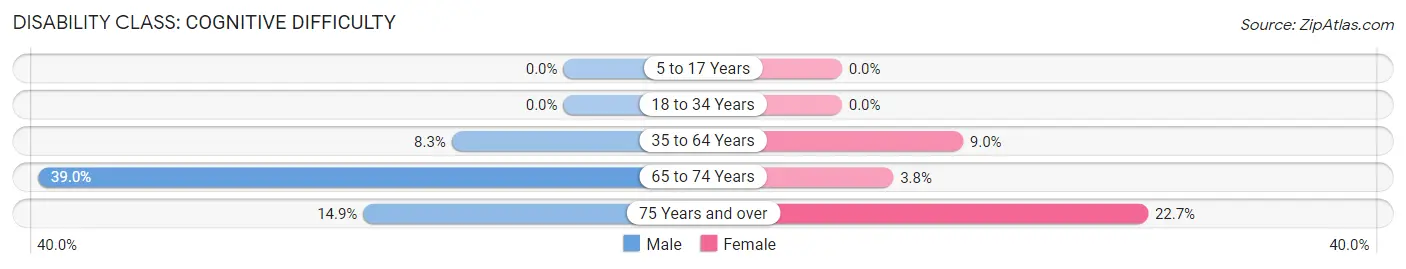
| Age Bracket | Male | Female |
| 5 to 17 Years | 0 (0.0%) | 0 (0.0%) |
| 18 to 34 Years | 0 (0.0%) | 0 (0.0%) |
| 35 to 64 Years | 16 (8.3%) | 16 (9.0%) |
| 65 to 74 Years | 55 (39.0%) | 5 (3.8%) |
| 75 Years and over | 11 (14.9%) | 15 (22.7%) |
Disability Class: Ambulatory Difficulty
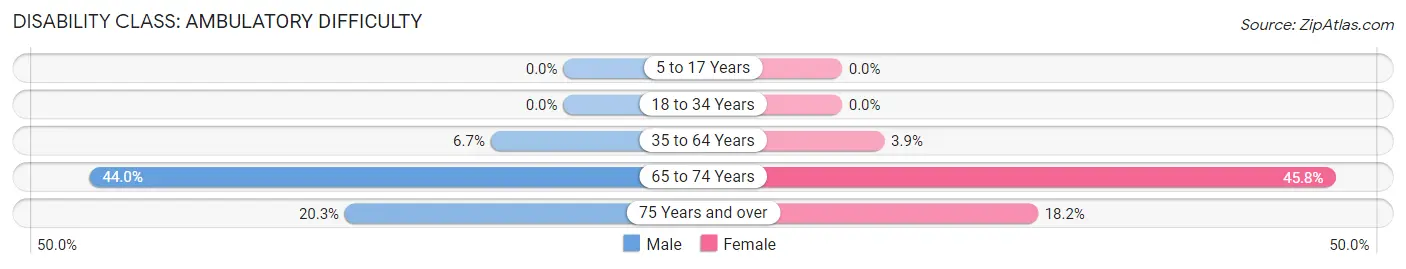
| Age Bracket | Male | Female |
| 5 to 17 Years | 0 (0.0%) | 0 (0.0%) |
| 18 to 34 Years | 0 (0.0%) | 0 (0.0%) |
| 35 to 64 Years | 13 (6.7%) | 7 (3.9%) |
| 65 to 74 Years | 62 (44.0%) | 60 (45.8%) |
| 75 Years and over | 15 (20.3%) | 12 (18.2%) |
Disability Class: Self-Care Difficulty
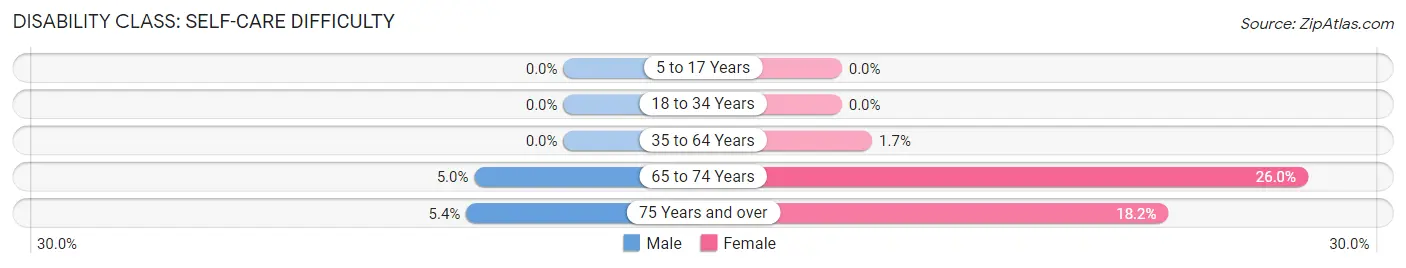
| Age Bracket | Male | Female |
| 5 to 17 Years | 0 (0.0%) | 0 (0.0%) |
| 18 to 34 Years | 0 (0.0%) | 0 (0.0%) |
| 35 to 64 Years | 0 (0.0%) | 3 (1.7%) |
| 65 to 74 Years | 7 (5.0%) | 34 (26.0%) |
| 75 Years and over | 4 (5.4%) | 12 (18.2%) |
Technology Access in Brinnon
Computing Device Access in Brinnon
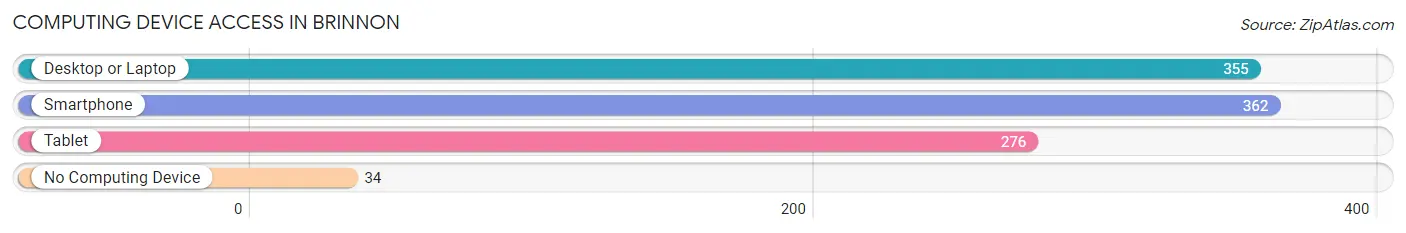
| Device Type | # Households | % Households |
| Desktop or Laptop | 355 | 81.4% |
| Smartphone | 362 | 83.0% |
| Tablet | 276 | 63.3% |
| No Computing Device | 34 | 7.8% |
| Total | 436 | 100.0% |
Internet Access in Brinnon
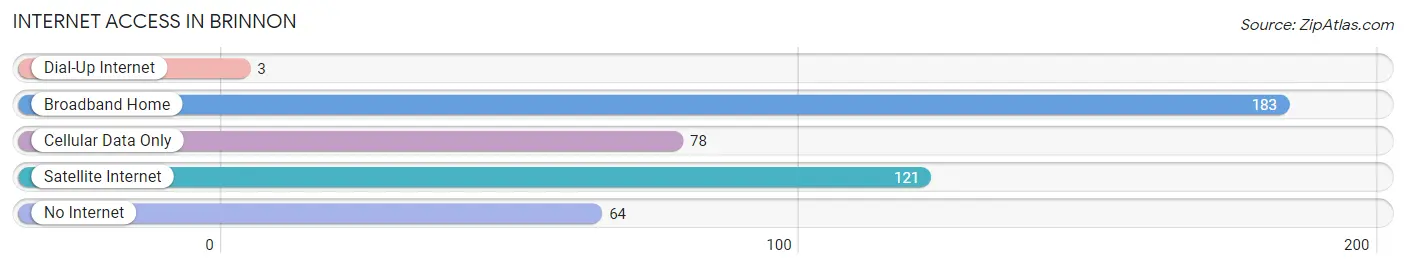
| Internet Type | # Households | % Households |
| Dial-Up Internet | 3 | 0.7% |
| Broadband Home | 183 | 42.0% |
| Cellular Data Only | 78 | 17.9% |
| Satellite Internet | 121 | 27.8% |
| No Internet | 64 | 14.7% |
| Total | 436 | 100.0% |
Brinnon Summary
Brinnon is a small unincorporated community located in Jefferson County, Washington, United States. It is situated on the Hood Canal, a fjord of the Puget Sound. The population of Brinnon was 1,093 as of the 2010 census.
History
The area that is now Brinnon was first inhabited by the Skokomish Tribe, who lived in the area for thousands of years before the arrival of European settlers. The first European settlers arrived in the area in the late 19th century, and the town was officially founded in 1891. The town was named after the nearby Brinnon Creek, which was named after a local settler, John Brinnon.
The town was initially a logging and fishing community, and the local economy was largely based on these industries. In the early 20th century, the town began to develop as a tourist destination, and it remains a popular destination for outdoor recreation today.
Geography
Brinnon is located in the Olympic Peninsula of Washington State, on the Hood Canal. The town is situated at the mouth of the Dosewallips River, and is surrounded by the Olympic National Forest. The town is located approximately 60 miles west of Seattle, and is accessible by car via State Route 101.
The climate in Brinnon is mild and temperate, with warm summers and cool winters. The average annual temperature is around 50 degrees Fahrenheit, and the average annual precipitation is around 40 inches.
Economy
The economy of Brinnon is largely based on tourism and outdoor recreation. The town is a popular destination for fishing, boating, camping, and hiking. There are several marinas and boat launches in the area, as well as several campgrounds and hiking trails.
The town is also home to several small businesses, including restaurants, cafes, and shops. There is also a small airport located in the town, which serves as a base for private and charter flights.
Demographics
As of the 2010 census, the population of Brinnon was 1,093. The racial makeup of the town was 94.3% White, 0.7% African American, 0.7% Native American, 0.7% Asian, 0.3% Pacific Islander, and 2.7% from other races. The median household income was $41,250, and the median family income was $50,000.
Conclusion
Brinnon is a small unincorporated community located in Jefferson County, Washington, United States. It is situated on the Hood Canal, a fjord of the Puget Sound. The town was founded in 1891, and the local economy is largely based on tourism and outdoor recreation. The population of Brinnon was 1,093 as of the 2010 census, and the median household income was $41,250. Brinnon is a popular destination for fishing, boating, camping, and hiking, and is home to several small businesses.
Common Questions
What is Per Capita Income in Brinnon?
Per Capita income in Brinnon is $39,429.
What is the Median Family Income in Brinnon?
Median Family Income in Brinnon is $92,712.
What is the Median Household income in Brinnon?
Median Household Income in Brinnon is $57,000.
What is Income or Wage Gap in Brinnon?
Income or Wage Gap in Brinnon is 35.9%.
Women in Brinnon earn 64.1 cents for every dollar earned by a man.
What is Inequality or Gini Index in Brinnon?
Inequality or Gini Index in Brinnon is 0.42.
What is the Total Population of Brinnon?
Total Population of Brinnon is 874.
What is the Total Male Population of Brinnon?
Total Male Population of Brinnon is 462.
What is the Total Female Population of Brinnon?
Total Female Population of Brinnon is 412.
What is the Ratio of Males per 100 Females in Brinnon?
There are 112.14 Males per 100 Females in Brinnon.
What is the Ratio of Females per 100 Males in Brinnon?
There are 89.18 Females per 100 Males in Brinnon.
What is the Median Population Age in Brinnon?
Median Population Age in Brinnon is 63.2 Years.
What is the Average Family Size in Brinnon
Average Family Size in Brinnon is 2.6 People.
What is the Average Household Size in Brinnon
Average Household Size in Brinnon is 2.0 People.
How Large is the Labor Force in Brinnon?
There are 255 People in the Labor Forcein in Brinnon.
What is the Percentage of People in the Labor Force in Brinnon?
31.2% of People are in the Labor Force in Brinnon.
What is the Unemployment Rate in Brinnon?
Unemployment Rate in Brinnon is 9.0%.