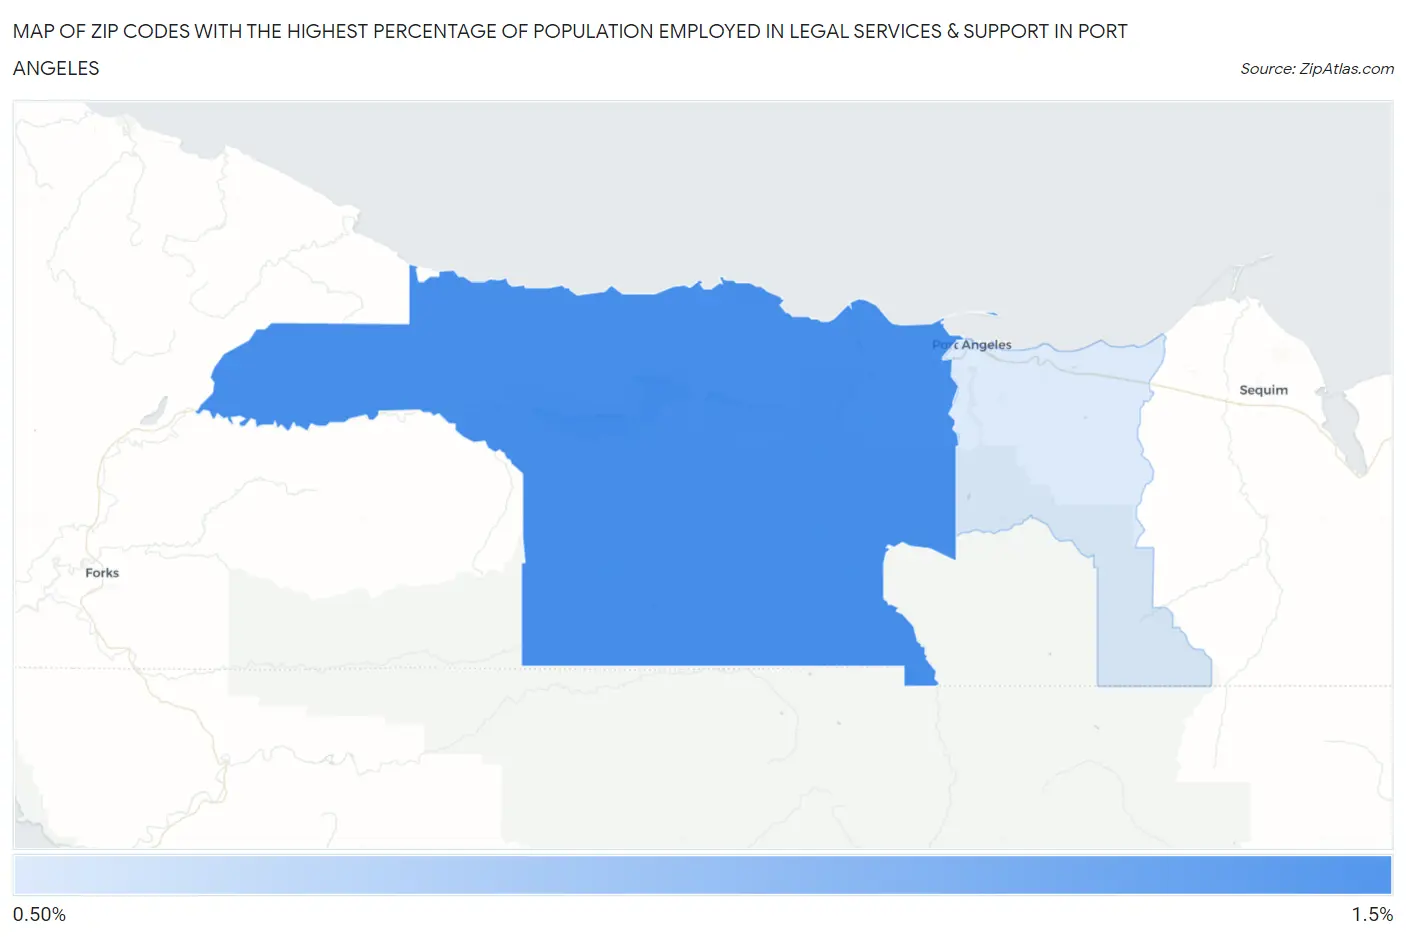
Zip Codes with the Highest Percentage of Population Employed in Legal Services & Support in Port Angeles, WA
RELATED REPORTS & OPTIONS
Legal Services & Support
Port Angeles
Compare Zip Codes
Map of Zip Codes with the Highest Percentage of Population Employed in Legal Services & Support in Port Angeles
0.97%
1.0%
Zip Codes with the Highest Percentage of Population Employed in Legal Services & Support in Port Angeles, WA
| Zip Code | % Employed | vs State | vs National | |
| 1. | 98363 | 1.0% | 1.1%(-0.069)#159 | 1.2%(-0.178)#7,786 |
| 2. | 98362 | 0.97% | 1.1%(-0.107)#169 | 1.2%(-0.216)#8,056 |
1
Common Questions
What are the Top Zip Codes with the Highest Percentage of Population Employed in Legal Services & Support in Port Angeles, WA?
Top Zip Codes with the Highest Percentage of Population Employed in Legal Services & Support in Port Angeles, WA are:
What zip code has the Highest Percentage of Population Employed in Legal Services & Support in Port Angeles, WA?
98363 has the Highest Percentage of Population Employed in Legal Services & Support in Port Angeles, WA with 1.0%.
What is the Percentage of Population Employed in Legal Services & Support in Port Angeles, WA?
Percentage of Population Employed in Legal Services & Support in Port Angeles is 1.0%.
What is the Percentage of Population Employed in Legal Services & Support in Washington?
Percentage of Population Employed in Legal Services & Support in Washington is 1.1%.
What is the Percentage of Population Employed in Legal Services & Support in the United States?
Percentage of Population Employed in Legal Services & Support in the United States is 1.2%.