Spokane, WA Map & Demographics
Spokane Map
Spokane Overview
$36,513
PER CAPITA INCOME
$82,941
AVG FAMILY INCOME
$63,316
AVG HOUSEHOLD INCOME
16.5%
WAGE / INCOME GAP [ % ]
83.5¢/ $1
WAGE / INCOME GAP [ $ ]
$10,757
FAMILY INCOME DEFICIT
0.46
INEQUALITY / GINI INDEX
227,922
TOTAL POPULATION
113,640
MALE POPULATION
114,282
FEMALE POPULATION
99.44
MALES / 100 FEMALES
100.56
FEMALES / 100 MALES
37.0
MEDIAN AGE
3.0
AVG FAMILY SIZE
2.3
AVG HOUSEHOLD SIZE
116,633
LABOR FORCE [ PEOPLE ]
62.6%
PERCENT IN LABOR FORCE
6.2%
UNEMPLOYMENT RATE
Spokane Zip Codes
Spokane Area Codes
Income in Spokane
Income Overview in Spokane
Per Capita Income in Spokane is $36,513, while median incomes of families and households are $82,941 and $63,316 respectively.
| Characteristic | Number | Measure |
| Per Capita Income | 227,922 | $36,513 |
| Median Family Income | 52,151 | $82,941 |
| Mean Family Income | 52,151 | $105,109 |
| Median Household Income | 96,007 | $63,316 |
| Mean Household Income | 96,007 | $84,416 |
| Income Deficit | 52,151 | $10,757 |
| Wage / Income Gap (%) | 227,922 | 16.53% |
| Wage / Income Gap ($) | 227,922 | 83.47¢ per $1 |
| Gini / Inequality Index | 227,922 | 0.46 |
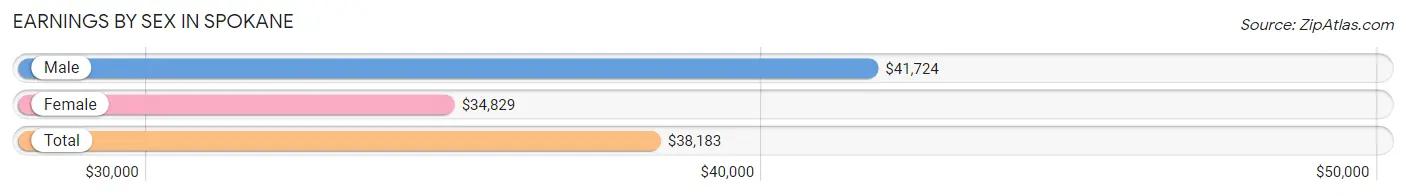
Earnings by Sex in Spokane
Average Earnings in Spokane are $38,183, $41,724 for men and $34,829 for women, a difference of 16.5%.
| Sex | Number | Average Earnings |
| Male | 65,226 (52.3%) | $41,724 |
| Female | 59,503 (47.7%) | $34,829 |
| Total | 124,729 (100.0%) | $38,183 |
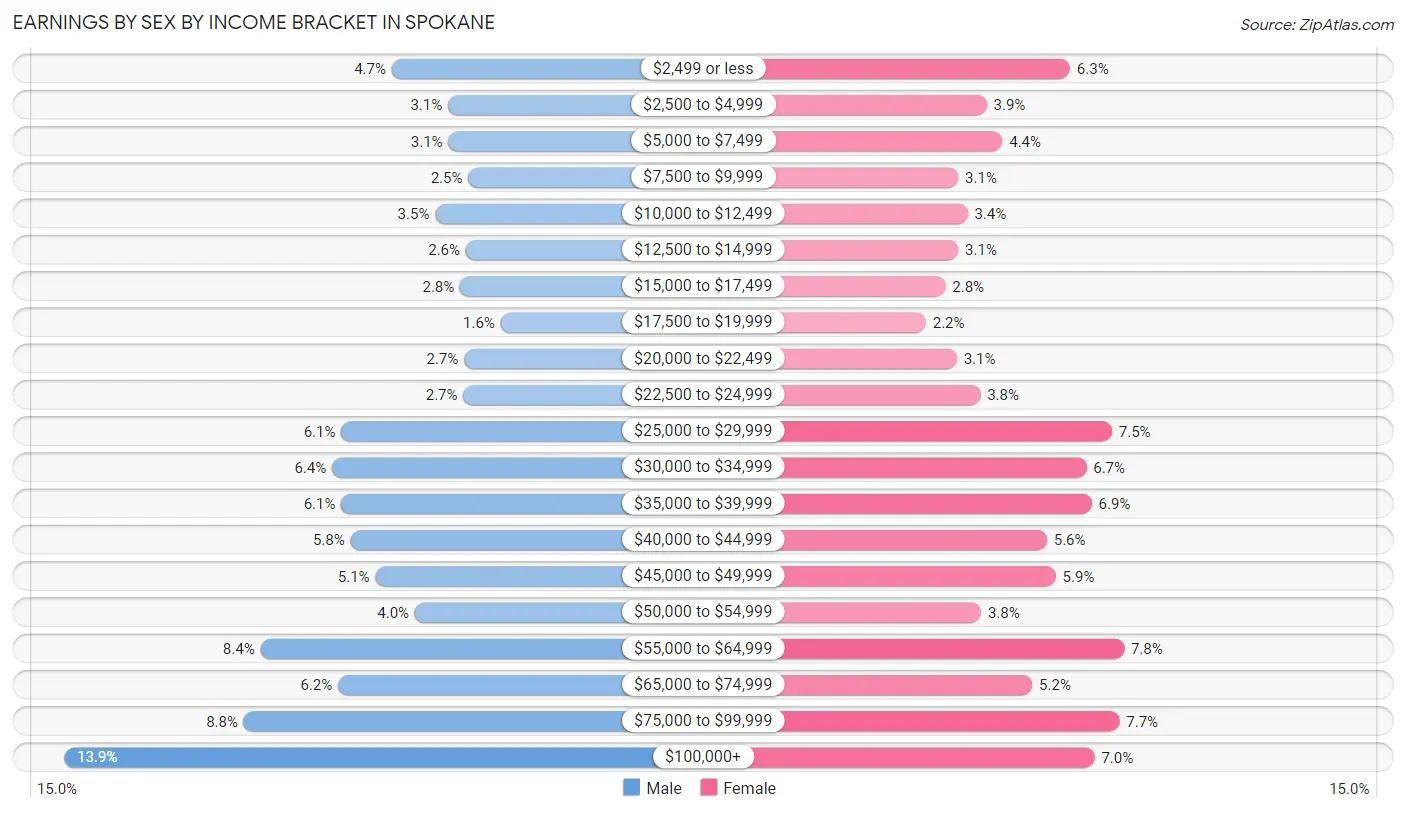
Earnings by Sex by Income Bracket in Spokane
The most common earnings brackets in Spokane are $100,000+ for men (9,059 | 13.9%) and $55,000 to $64,999 for women (4,637 | 7.8%).
| Income | Male | Female |
| $2,499 or less | 3,050 (4.7%) | 3,732 (6.3%) |
| $2,500 to $4,999 | 2,020 (3.1%) | 2,339 (3.9%) |
| $5,000 to $7,499 | 2,018 (3.1%) | 2,600 (4.4%) |
| $7,500 to $9,999 | 1,648 (2.5%) | 1,862 (3.1%) |
| $10,000 to $12,499 | 2,254 (3.5%) | 2,018 (3.4%) |
| $12,500 to $14,999 | 1,698 (2.6%) | 1,864 (3.1%) |
| $15,000 to $17,499 | 1,799 (2.8%) | 1,651 (2.8%) |
| $17,500 to $19,999 | 1,056 (1.6%) | 1,323 (2.2%) |
| $20,000 to $22,499 | 1,731 (2.6%) | 1,841 (3.1%) |
| $22,500 to $24,999 | 1,739 (2.7%) | 2,229 (3.7%) |
| $25,000 to $29,999 | 3,981 (6.1%) | 4,435 (7.4%) |
| $30,000 to $34,999 | 4,146 (6.4%) | 4,002 (6.7%) |
| $35,000 to $39,999 | 3,976 (6.1%) | 4,094 (6.9%) |
| $40,000 to $44,999 | 3,809 (5.8%) | 3,343 (5.6%) |
| $45,000 to $49,999 | 3,353 (5.1%) | 3,495 (5.9%) |
| $50,000 to $54,999 | 2,628 (4.0%) | 2,242 (3.8%) |
| $55,000 to $64,999 | 5,459 (8.4%) | 4,637 (7.8%) |
| $65,000 to $74,999 | 4,036 (6.2%) | 3,102 (5.2%) |
| $75,000 to $99,999 | 5,766 (8.8%) | 4,555 (7.7%) |
| $100,000+ | 9,059 (13.9%) | 4,139 (7.0%) |
| Total | 65,226 (100.0%) | 59,503 (100.0%) |
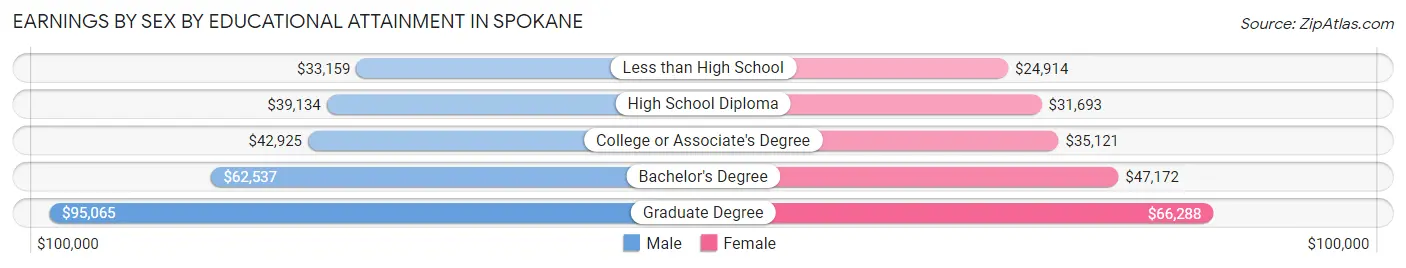
Earnings by Sex by Educational Attainment in Spokane
Average earnings in Spokane are $47,943 for men and $39,233 for women, a difference of 18.2%. Men with an educational attainment of graduate degree enjoy the highest average annual earnings of $95,065, while those with less than high school education earn the least with $33,159. Women with an educational attainment of graduate degree earn the most with the average annual earnings of $66,288, while those with less than high school education have the smallest earnings of $24,914.
| Educational Attainment | Male Income | Female Income |
| Less than High School | $33,159 | $24,914 |
| High School Diploma | $39,134 | $31,693 |
| College or Associate's Degree | $42,925 | $35,121 |
| Bachelor's Degree | $62,537 | $47,172 |
| Graduate Degree | $95,065 | $66,288 |
| Total | $47,943 | $39,233 |
Family Income in Spokane
Family Income Brackets in Spokane
According to the Spokane family income data, there are 11,056 families falling into the $100,000 to $149,999 income range, which is the most common income bracket and makes up 21.2% of all families. Conversely, the $10,000 to $14,999 income bracket is the least frequent group with only 1,252 families (2.4%) belonging to this category.
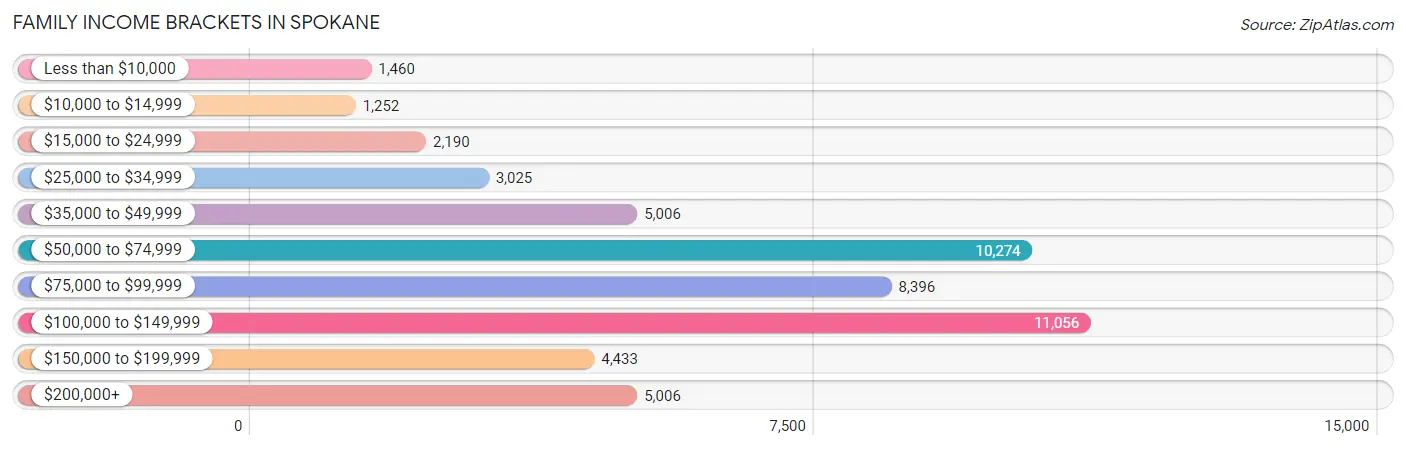
| Income Bracket | # Families | % Families |
| Less than $10,000 | 1,460 | 2.8% |
| $10,000 to $14,999 | 1,252 | 2.4% |
| $15,000 to $24,999 | 2,190 | 4.2% |
| $25,000 to $34,999 | 3,025 | 5.8% |
| $35,000 to $49,999 | 5,006 | 9.6% |
| $50,000 to $74,999 | 10,274 | 19.7% |
| $75,000 to $99,999 | 8,396 | 16.1% |
| $100,000 to $149,999 | 11,056 | 21.2% |
| $150,000 to $199,999 | 4,433 | 8.5% |
| $200,000+ | 5,006 | 9.6% |
Family Income by Famaliy Size in Spokane
4-person families (8,761 | 16.8%) account for the highest median family income in Spokane with $99,487 per family, while 2-person families (26,607 | 51.0%) have the highest median income of $38,786 per family member.
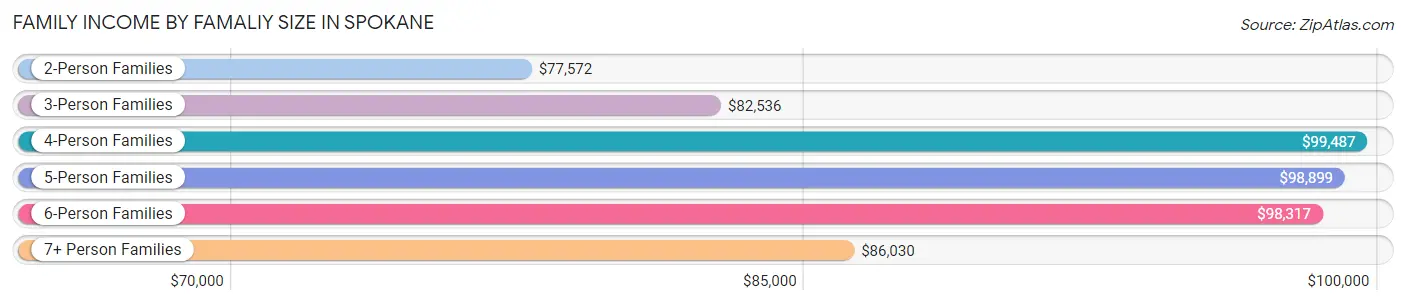
| Income Bracket | # Families | Median Income |
| 2-Person Families | 26,607 (51.0%) | $77,572 |
| 3-Person Families | 10,721 (20.6%) | $82,536 |
| 4-Person Families | 8,761 (16.8%) | $99,487 |
| 5-Person Families | 3,691 (7.1%) | $98,899 |
| 6-Person Families | 1,378 (2.6%) | $98,317 |
| 7+ Person Families | 993 (1.9%) | $86,030 |
| Total | 52,151 (100.0%) | $82,941 |
Family Income by Number of Earners in Spokane
The median family income in Spokane is $82,941, with families comprising 3+ earners (4,516) having the highest median family income of $129,474, while families with no earners (7,789) have the lowest median family income of $48,204, accounting for 8.7% and 14.9% of families, respectively.
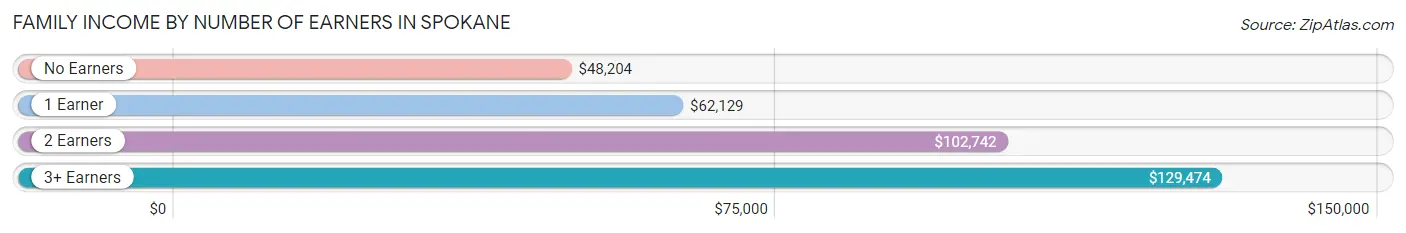
| Number of Earners | # Families | Median Income |
| No Earners | 7,789 (14.9%) | $48,204 |
| 1 Earner | 16,685 (32.0%) | $62,129 |
| 2 Earners | 23,161 (44.4%) | $102,742 |
| 3+ Earners | 4,516 (8.7%) | $129,474 |
| Total | 52,151 (100.0%) | $82,941 |
Household Income in Spokane
Household Income Brackets in Spokane
With 17,857 households falling in the category, the $50,000 to $74,999 income range is the most frequent in Spokane, accounting for 18.6% of all households. In contrast, only 4,896 households (5.1%) fall into the less than $10,000 income bracket, making it the least populous group.
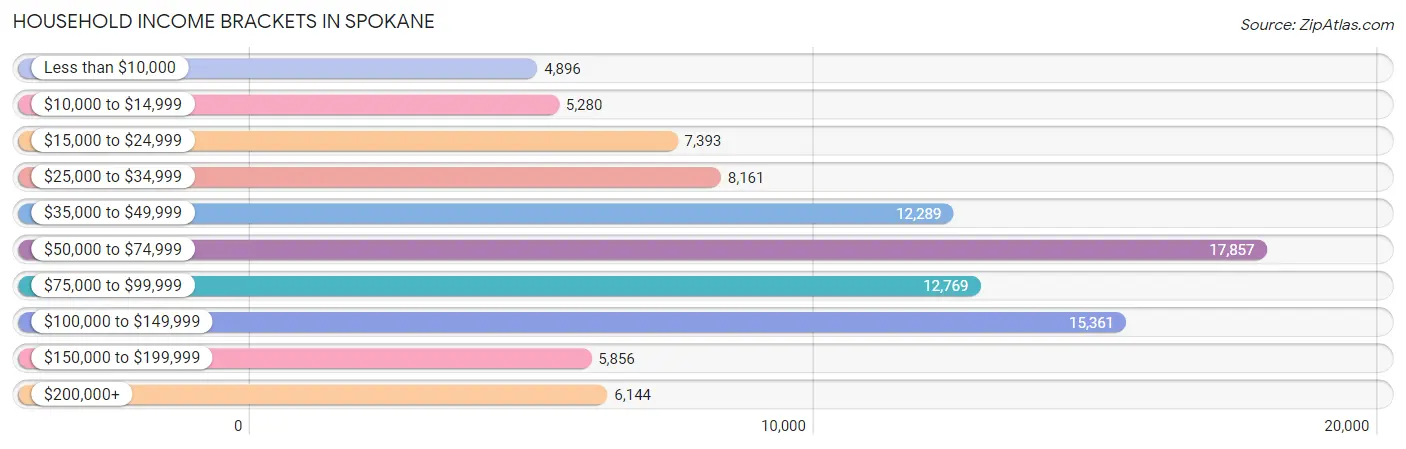
| Income Bracket | # Households | % Households |
| Less than $10,000 | 4,896 | 5.1% |
| $10,000 to $14,999 | 5,280 | 5.5% |
| $15,000 to $24,999 | 7,393 | 7.7% |
| $25,000 to $34,999 | 8,161 | 8.5% |
| $35,000 to $49,999 | 12,289 | 12.8% |
| $50,000 to $74,999 | 17,857 | 18.6% |
| $75,000 to $99,999 | 12,769 | 13.3% |
| $100,000 to $149,999 | 15,361 | 16.0% |
| $150,000 to $199,999 | 5,856 | 6.1% |
| $200,000+ | 6,144 | 6.4% |
Household Income by Householder Age in Spokane
The median household income in Spokane is $63,316, with the highest median household income of $73,518 found in the 45 to 64 years age bracket for the primary householder. A total of 32,056 households (33.4%) fall into this category. Meanwhile, the 65+ years age bracket for the primary householder has the lowest median household income of $46,320, with 24,361 households (25.4%) in this group.
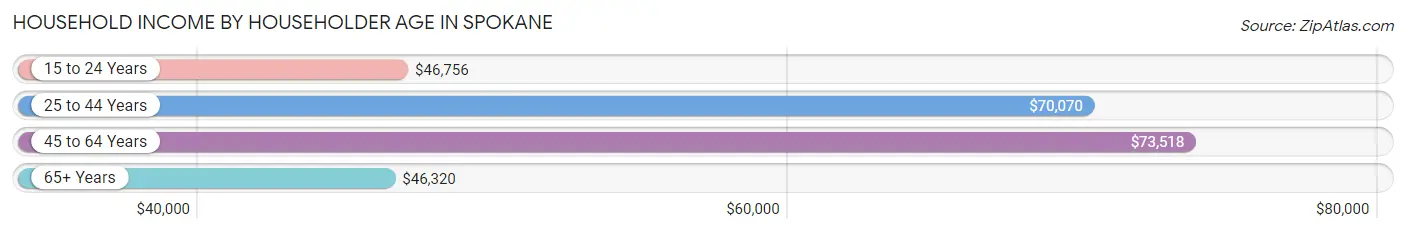
| Income Bracket | # Households | Median Income |
| 15 to 24 Years | 5,348 (5.6%) | $46,756 |
| 25 to 44 Years | 34,242 (35.7%) | $70,070 |
| 45 to 64 Years | 32,056 (33.4%) | $73,518 |
| 65+ Years | 24,361 (25.4%) | $46,320 |
| Total | 96,007 (100.0%) | $63,316 |
Poverty in Spokane
Income Below Poverty by Sex and Age in Spokane
With 13.7% poverty level for males and 15.9% for females among the residents of Spokane, 18 to 24 year old males and 5 year old females are the most vulnerable to poverty, with 2,650 males (25.3%) and 547 females (33.0%) in their respective age groups living below the poverty level.
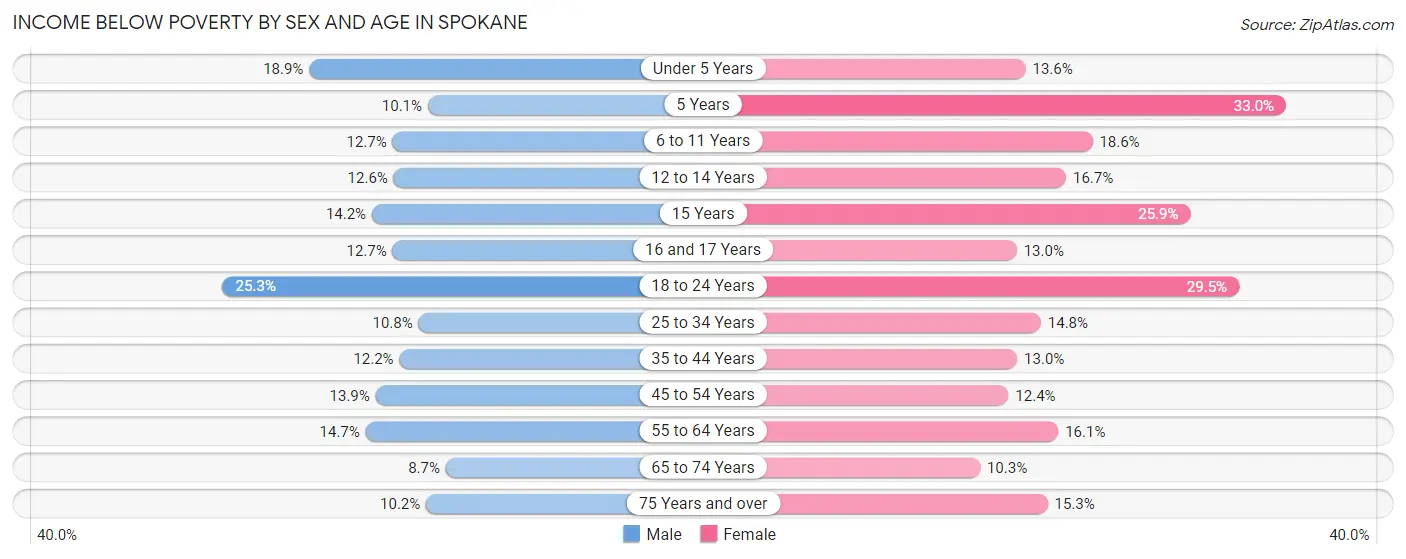
| Age Bracket | Male | Female |
| Under 5 Years | 1,198 (18.9%) | 760 (13.6%) |
| 5 Years | 109 (10.1%) | 547 (33.0%) |
| 6 to 11 Years | 1,031 (12.7%) | 1,487 (18.6%) |
| 12 to 14 Years | 486 (12.6%) | 601 (16.7%) |
| 15 Years | 237 (14.2%) | 283 (25.9%) |
| 16 and 17 Years | 283 (12.7%) | 304 (13.0%) |
| 18 to 24 Years | 2,650 (25.3%) | 2,787 (29.5%) |
| 25 to 34 Years | 2,081 (10.7%) | 2,806 (14.8%) |
| 35 to 44 Years | 1,862 (12.2%) | 1,887 (13.0%) |
| 45 to 54 Years | 1,849 (13.9%) | 1,547 (12.4%) |
| 55 to 64 Years | 1,904 (14.7%) | 2,312 (16.1%) |
| 65 to 74 Years | 942 (8.7%) | 1,186 (10.3%) |
| 75 Years and over | 519 (10.2%) | 1,255 (15.3%) |
| Total | 15,151 (13.7%) | 17,762 (15.9%) |
Income Above Poverty by Sex and Age in Spokane
According to the poverty statistics in Spokane, males aged 65 to 74 years and females aged 65 to 74 years are the age groups that are most secure financially, with 91.3% of males and 89.7% of females in these age groups living above the poverty line.
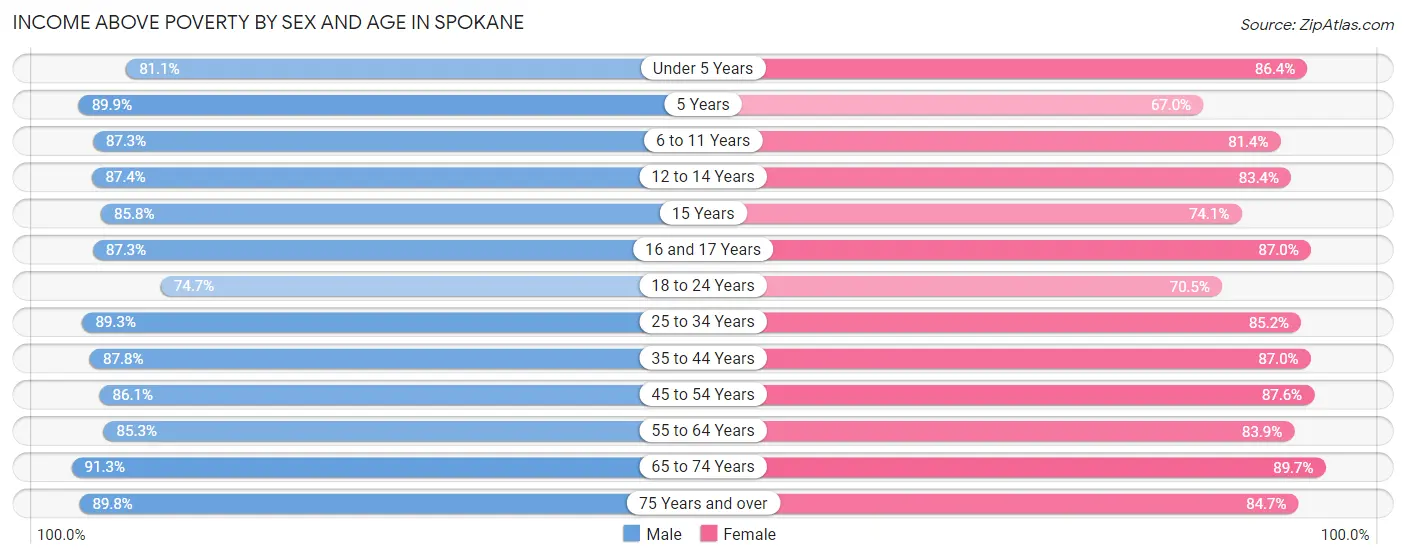
| Age Bracket | Male | Female |
| Under 5 Years | 5,150 (81.1%) | 4,810 (86.4%) |
| 5 Years | 975 (89.9%) | 1,112 (67.0%) |
| 6 to 11 Years | 7,102 (87.3%) | 6,503 (81.4%) |
| 12 to 14 Years | 3,372 (87.4%) | 3,008 (83.4%) |
| 15 Years | 1,431 (85.8%) | 811 (74.1%) |
| 16 and 17 Years | 1,949 (87.3%) | 2,036 (87.0%) |
| 18 to 24 Years | 7,824 (74.7%) | 6,667 (70.5%) |
| 25 to 34 Years | 17,283 (89.2%) | 16,180 (85.2%) |
| 35 to 44 Years | 13,442 (87.8%) | 12,603 (87.0%) |
| 45 to 54 Years | 11,412 (86.1%) | 10,957 (87.6%) |
| 55 to 64 Years | 11,063 (85.3%) | 12,075 (83.9%) |
| 65 to 74 Years | 9,843 (91.3%) | 10,376 (89.7%) |
| 75 Years and over | 4,575 (89.8%) | 6,957 (84.7%) |
| Total | 95,421 (86.3%) | 94,095 (84.1%) |
Income Below Poverty Among Married-Couple Families in Spokane
The poverty statistics for married-couple families in Spokane show that 3.8% or 1,374 of the total 36,397 families live below the poverty line. Families with 5 or more children have the highest poverty rate of 23.7%, comprising of 108 families. On the other hand, families with no children have the lowest poverty rate of 2.9%, which includes 628 families.
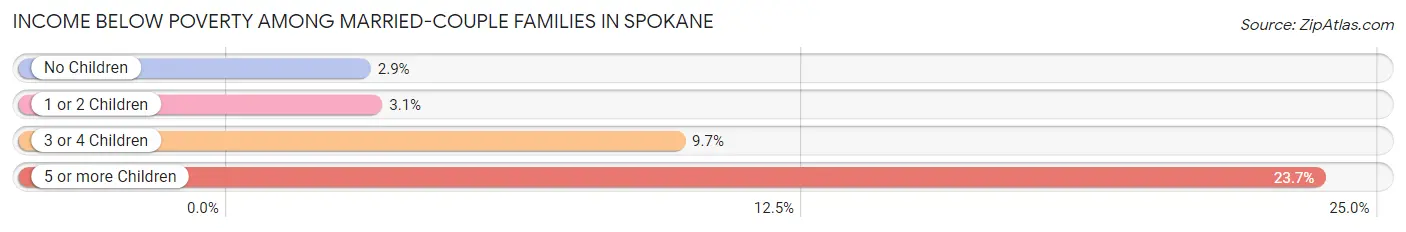
| Children | Above Poverty | Below Poverty |
| No Children | 21,067 (97.1%) | 628 (2.9%) |
| 1 or 2 Children | 10,992 (96.9%) | 356 (3.1%) |
| 3 or 4 Children | 2,616 (90.3%) | 282 (9.7%) |
| 5 or more Children | 348 (76.3%) | 108 (23.7%) |
| Total | 35,023 (96.2%) | 1,374 (3.8%) |
Income Below Poverty Among Single-Parent Households in Spokane
According to the poverty data in Spokane, 14.5% or 674 single-father households and 21.1% or 2,342 single-mother households are living below the poverty line. Among single-father households, those with 5 or more children have the highest poverty rate, with 10 households (32.3%) experiencing poverty. Likewise, among single-mother households, those with 5 or more children have the highest poverty rate, with 96 households (56.1%) falling below the poverty line.
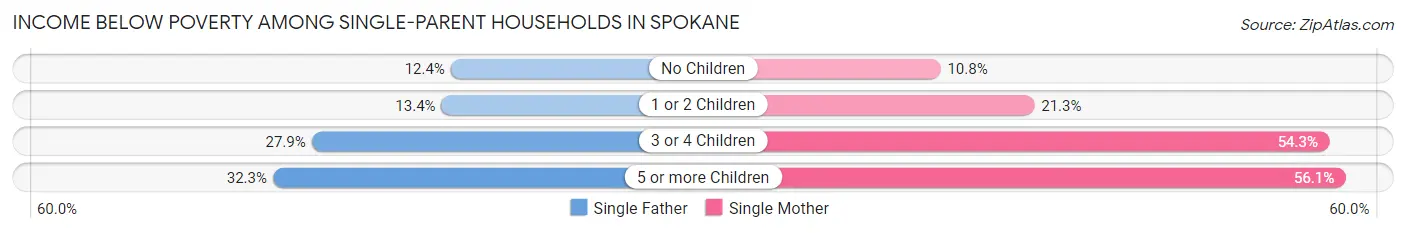
| Children | Single Father | Single Mother |
| No Children | 182 (12.4%) | 466 (10.8%) |
| 1 or 2 Children | 370 (13.4%) | 1,170 (21.3%) |
| 3 or 4 Children | 112 (27.9%) | 610 (54.3%) |
| 5 or more Children | 10 (32.3%) | 96 (56.1%) |
| Total | 674 (14.5%) | 2,342 (21.1%) |
Income Below Poverty Among Married-Couple vs Single-Parent Households in Spokane
The poverty data for Spokane shows that 1,374 of the married-couple family households (3.8%) and 3,016 of the single-parent households (19.1%) are living below the poverty level. Within the married-couple family households, those with 5 or more children have the highest poverty rate, with 108 households (23.7%) falling below the poverty line. Among the single-parent households, those with 5 or more children have the highest poverty rate, with 106 household (52.5%) living below poverty.
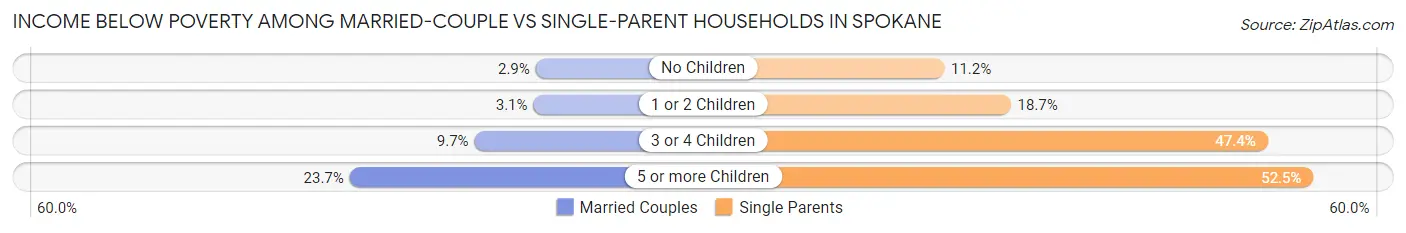
| Children | Married-Couple Families | Single-Parent Households |
| No Children | 628 (2.9%) | 648 (11.2%) |
| 1 or 2 Children | 356 (3.1%) | 1,540 (18.7%) |
| 3 or 4 Children | 282 (9.7%) | 722 (47.4%) |
| 5 or more Children | 108 (23.7%) | 106 (52.5%) |
| Total | 1,374 (3.8%) | 3,016 (19.1%) |
Race in Spokane
The most populous races in Spokane are White / Caucasian (186,820 | 82.0%), Two or more Races (19,866 | 8.7%), and Hispanic or Latino (16,457 | 7.2%).
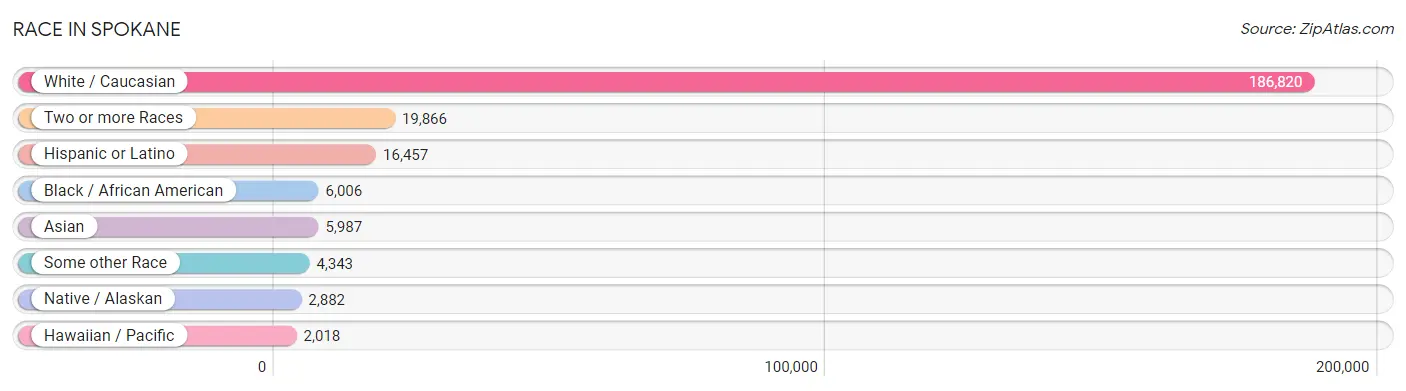
| Race | # Population | % Population |
| Asian | 5,987 | 2.6% |
| Black / African American | 6,006 | 2.6% |
| Hawaiian / Pacific | 2,018 | 0.9% |
| Hispanic or Latino | 16,457 | 7.2% |
| Native / Alaskan | 2,882 | 1.3% |
| White / Caucasian | 186,820 | 82.0% |
| Two or more Races | 19,866 | 8.7% |
| Some other Race | 4,343 | 1.9% |
| Total | 227,922 | 100.0% |
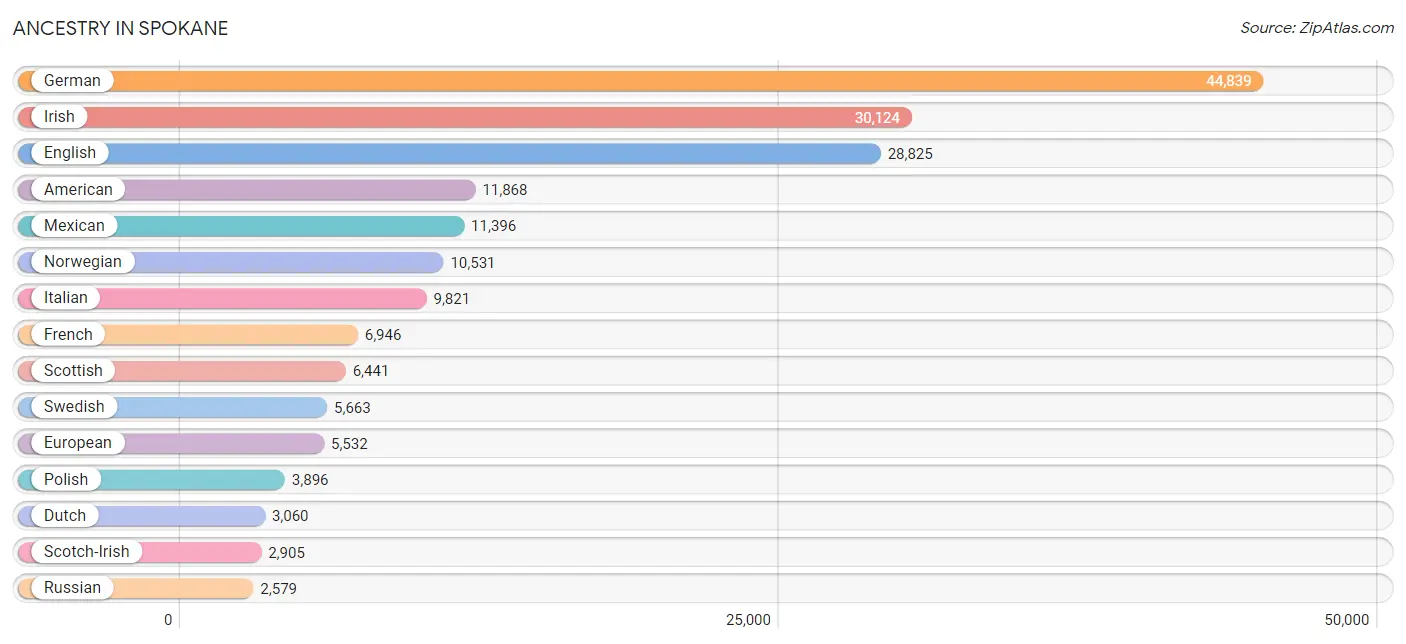
Ancestry in Spokane
The most populous ancestries reported in Spokane are German (44,839 | 19.7%), Irish (30,124 | 13.2%), English (28,825 | 12.7%), American (11,868 | 5.2%), and Mexican (11,396 | 5.0%), together accounting for 55.8% of all Spokane residents.
| Ancestry | # Population | % Population |
| Afghan | 138 | 0.1% |
| African | 603 | 0.3% |
| Alaska Native | 109 | 0.1% |
| Alaskan Athabascan | 24 | 0.0% |
| Albanian | 142 | 0.1% |
| Aleut | 35 | 0.0% |
| American | 11,868 | 5.2% |
| Apache | 204 | 0.1% |
| Arab | 1,883 | 0.8% |
| Armenian | 149 | 0.1% |
| Assyrian / Chaldean / Syriac | 24 | 0.0% |
| Australian | 123 | 0.1% |
| Austrian | 901 | 0.4% |
| Bahamian | 9 | 0.0% |
| Bangladeshi | 76 | 0.0% |
| Basque | 158 | 0.1% |
| Belgian | 204 | 0.1% |
| Bhutanese | 2,105 | 0.9% |
| Blackfeet | 561 | 0.3% |
| Brazilian | 117 | 0.1% |
| British | 1,466 | 0.6% |
| British West Indian | 21 | 0.0% |
| Bulgarian | 21 | 0.0% |
| Burmese | 744 | 0.3% |
| Cajun | 6 | 0.0% |
| Cambodian | 102 | 0.0% |
| Canadian | 699 | 0.3% |
| Cape Verdean | 47 | 0.0% |
| Celtic | 65 | 0.0% |
| Central American | 689 | 0.3% |
| Central American Indian | 153 | 0.1% |
| Cherokee | 892 | 0.4% |
| Cheyenne | 19 | 0.0% |
| Chickasaw | 14 | 0.0% |
| Chilean | 45 | 0.0% |
| Chinese | 10 | 0.0% |
| Chippewa | 362 | 0.2% |
| Choctaw | 157 | 0.1% |
| Colombian | 62 | 0.0% |
| Colville | 471 | 0.2% |
| Costa Rican | 89 | 0.0% |
| Cree | 26 | 0.0% |
| Creek | 61 | 0.0% |
| Croatian | 303 | 0.1% |
| Crow | 72 | 0.0% |
| Cuban | 409 | 0.2% |
| Czech | 902 | 0.4% |
| Czechoslovakian | 165 | 0.1% |
| Danish | 1,914 | 0.8% |
| Dutch | 3,060 | 1.3% |
| Eastern European | 370 | 0.2% |
| Ecuadorian | 40 | 0.0% |
| Egyptian | 84 | 0.0% |
| English | 28,825 | 12.7% |
| Estonian | 82 | 0.0% |
| Ethiopian | 343 | 0.2% |
| European | 5,532 | 2.4% |
| Fijian | 1,131 | 0.5% |
| Filipino | 78 | 0.0% |
| Finnish | 904 | 0.4% |
| French | 6,946 | 3.0% |
| French American Indian | 82 | 0.0% |
| French Canadian | 1,816 | 0.8% |
| German | 44,839 | 19.7% |
| German Russian | 48 | 0.0% |
| Ghanaian | 16 | 0.0% |
| Greek | 762 | 0.3% |
| Guamanian / Chamorro | 252 | 0.1% |
| Guatemalan | 180 | 0.1% |
| Guyanese | 53 | 0.0% |
| Haitian | 8 | 0.0% |
| Honduran | 49 | 0.0% |
| Hungarian | 716 | 0.3% |
| Icelander | 248 | 0.1% |
| Indian (Asian) | 1,457 | 0.6% |
| Indonesian | 608 | 0.3% |
| Inupiat | 209 | 0.1% |
| Iranian | 94 | 0.0% |
| Iraqi | 518 | 0.2% |
| Irish | 30,124 | 13.2% |
| Iroquois | 49 | 0.0% |
| Italian | 9,821 | 4.3% |
| Jamaican | 230 | 0.1% |
| Japanese | 199 | 0.1% |
| Kenyan | 24 | 0.0% |
| Korean | 2,331 | 1.0% |
| Laotian | 27 | 0.0% |
| Latvian | 9 | 0.0% |
| Lebanese | 75 | 0.0% |
| Liberian | 7 | 0.0% |
| Lithuanian | 498 | 0.2% |
| Luxembourger | 50 | 0.0% |
| Macedonian | 85 | 0.0% |
| Malaysian | 42 | 0.0% |
| Maltese | 37 | 0.0% |
| Marshallese | 25 | 0.0% |
| Mexican | 11,396 | 5.0% |
| Mexican American Indian | 87 | 0.0% |
| Native Hawaiian | 1,113 | 0.5% |
| Navajo | 82 | 0.0% |
| Nepalese | 6 | 0.0% |
| New Zealander | 21 | 0.0% |
| Nicaraguan | 48 | 0.0% |
| Nigerian | 223 | 0.1% |
| Northern European | 1,420 | 0.6% |
| Norwegian | 10,531 | 4.6% |
| Osage | 16 | 0.0% |
| Paiute | 59 | 0.0% |
| Pakistani | 780 | 0.3% |
| Palestinian | 26 | 0.0% |
| Panamanian | 94 | 0.0% |
| Pennsylvania German | 87 | 0.0% |
| Peruvian | 57 | 0.0% |
| Polish | 3,896 | 1.7% |
| Portuguese | 417 | 0.2% |
| Potawatomi | 58 | 0.0% |
| Pueblo | 40 | 0.0% |
| Puerto Rican | 1,182 | 0.5% |
| Puget Sound Salish | 216 | 0.1% |
| Romanian | 386 | 0.2% |
| Russian | 2,579 | 1.1% |
| Salvadoran | 222 | 0.1% |
| Samoan | 122 | 0.1% |
| Scandinavian | 2,050 | 0.9% |
| Scotch-Irish | 2,905 | 1.3% |
| Scottish | 6,441 | 2.8% |
| Serbian | 70 | 0.0% |
| Sioux | 349 | 0.2% |
| Slavic | 92 | 0.0% |
| Slovak | 86 | 0.0% |
| Slovene | 132 | 0.1% |
| South African | 50 | 0.0% |
| South American | 328 | 0.1% |
| South American Indian | 50 | 0.0% |
| Spaniard | 951 | 0.4% |
| Spanish | 798 | 0.4% |
| Spanish American Indian | 23 | 0.0% |
| Sri Lankan | 1,576 | 0.7% |
| Subsaharan African | 1,973 | 0.9% |
| Sudanese | 28 | 0.0% |
| Swedish | 5,663 | 2.5% |
| Swiss | 703 | 0.3% |
| Syrian | 130 | 0.1% |
| Thai | 386 | 0.2% |
| Tlingit-Haida | 88 | 0.0% |
| Tongan | 51 | 0.0% |
| Turkish | 173 | 0.1% |
| Ugandan | 290 | 0.1% |
| Ukrainian | 1,505 | 0.7% |
| Venezuelan | 124 | 0.1% |
| Welsh | 1,899 | 0.8% |
| West Indian | 20 | 0.0% |
| Yakama | 27 | 0.0% |
| Yaqui | 31 | 0.0% |
| Yugoslavian | 264 | 0.1% |
| Yuman | 30 | 0.0% |
| Yup'ik | 29 | 0.0% | View All 157 Rows |
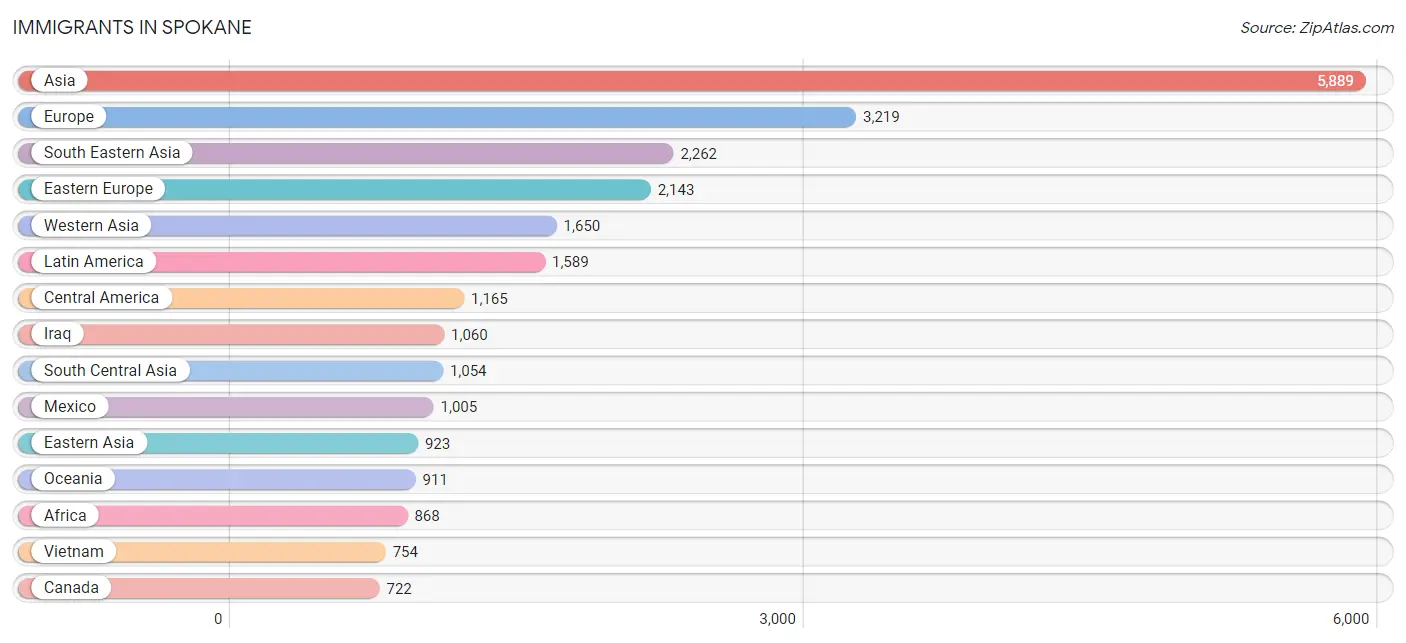
Immigrants in Spokane
The most numerous immigrant groups reported in Spokane came from Asia (5,889 | 2.6%), Europe (3,219 | 1.4%), South Eastern Asia (2,262 | 1.0%), Eastern Europe (2,143 | 0.9%), and Western Asia (1,650 | 0.7%), together accounting for 6.6% of all Spokane residents.
| Immigration Origin | # Population | % Population |
| Afghanistan | 229 | 0.1% |
| Africa | 868 | 0.4% |
| Albania | 105 | 0.1% |
| Argentina | 11 | 0.0% |
| Armenia | 7 | 0.0% |
| Asia | 5,889 | 2.6% |
| Australia | 5 | 0.0% |
| Austria | 11 | 0.0% |
| Bahamas | 9 | 0.0% |
| Belarus | 98 | 0.0% |
| Bosnia and Herzegovina | 80 | 0.0% |
| Brazil | 64 | 0.0% |
| Cambodia | 80 | 0.0% |
| Canada | 722 | 0.3% |
| Caribbean | 174 | 0.1% |
| Central America | 1,165 | 0.5% |
| China | 535 | 0.2% |
| Colombia | 46 | 0.0% |
| Congo | 56 | 0.0% |
| Costa Rica | 12 | 0.0% |
| Croatia | 19 | 0.0% |
| Cuba | 124 | 0.1% |
| Denmark | 9 | 0.0% |
| Eastern Africa | 677 | 0.3% |
| Eastern Asia | 923 | 0.4% |
| Eastern Europe | 2,143 | 0.9% |
| Ecuador | 26 | 0.0% |
| Egypt | 1 | 0.0% |
| El Salvador | 41 | 0.0% |
| England | 174 | 0.1% |
| Eritrea | 63 | 0.0% |
| Ethiopia | 275 | 0.1% |
| Europe | 3,219 | 1.4% |
| France | 35 | 0.0% |
| Germany | 392 | 0.2% |
| Ghana | 16 | 0.0% |
| Greece | 8 | 0.0% |
| Guatemala | 65 | 0.0% |
| Guyana | 16 | 0.0% |
| Honduras | 3 | 0.0% |
| Hong Kong | 23 | 0.0% |
| Hungary | 23 | 0.0% |
| India | 326 | 0.1% |
| Indonesia | 11 | 0.0% |
| Iran | 45 | 0.0% |
| Iraq | 1,060 | 0.5% |
| Ireland | 56 | 0.0% |
| Italy | 88 | 0.0% |
| Jamaica | 9 | 0.0% |
| Japan | 145 | 0.1% |
| Kazakhstan | 122 | 0.1% |
| Kenya | 24 | 0.0% |
| Korea | 238 | 0.1% |
| Laos | 97 | 0.0% |
| Latin America | 1,589 | 0.7% |
| Latvia | 82 | 0.0% |
| Liberia | 7 | 0.0% |
| Malaysia | 80 | 0.0% |
| Mexico | 1,005 | 0.4% |
| Micronesia | 189 | 0.1% |
| Middle Africa | 85 | 0.0% |
| Moldova | 239 | 0.1% |
| Nepal | 75 | 0.0% |
| Netherlands | 47 | 0.0% |
| Nigeria | 43 | 0.0% |
| Northern Africa | 29 | 0.0% |
| Northern Europe | 428 | 0.2% |
| Norway | 25 | 0.0% |
| Oceania | 911 | 0.4% |
| Pakistan | 38 | 0.0% |
| Panama | 39 | 0.0% |
| Peru | 14 | 0.0% |
| Philippines | 611 | 0.3% |
| Poland | 48 | 0.0% |
| Romania | 14 | 0.0% |
| Russia | 590 | 0.3% |
| Saudi Arabia | 174 | 0.1% |
| Scotland | 83 | 0.0% |
| South America | 250 | 0.1% |
| South Central Asia | 1,054 | 0.5% |
| South Eastern Asia | 2,262 | 1.0% |
| Southern Europe | 163 | 0.1% |
| Spain | 67 | 0.0% |
| Sudan | 28 | 0.0% |
| Sweden | 4 | 0.0% |
| Syria | 314 | 0.1% |
| Taiwan | 89 | 0.0% |
| Thailand | 362 | 0.2% |
| Trinidad and Tobago | 32 | 0.0% |
| Turkey | 58 | 0.0% |
| Uganda | 140 | 0.1% |
| Ukraine | 693 | 0.3% |
| Uzbekistan | 14 | 0.0% |
| Venezuela | 73 | 0.0% |
| Vietnam | 754 | 0.3% |
| Western Africa | 66 | 0.0% |
| Western Asia | 1,650 | 0.7% |
| Western Europe | 485 | 0.2% |
| Zaire | 29 | 0.0% |
| Zimbabwe | 9 | 0.0% | View All 100 Rows |
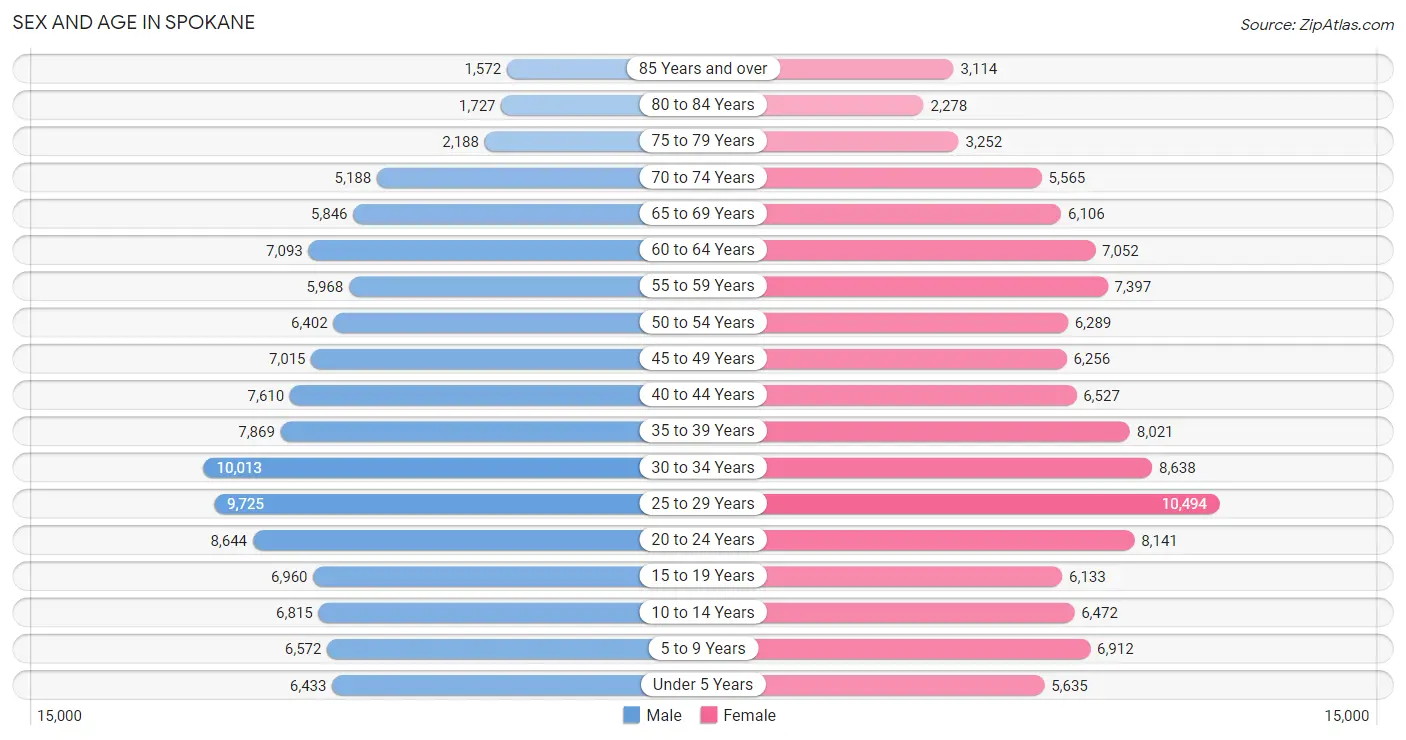
Sex and Age in Spokane
Sex and Age in Spokane
The most populous age groups in Spokane are 30 to 34 Years (10,013 | 8.8%) for men and 25 to 29 Years (10,494 | 9.2%) for women.
| Age Bracket | Male | Female |
| Under 5 Years | 6,433 (5.7%) | 5,635 (4.9%) |
| 5 to 9 Years | 6,572 (5.8%) | 6,912 (6.0%) |
| 10 to 14 Years | 6,815 (6.0%) | 6,472 (5.7%) |
| 15 to 19 Years | 6,960 (6.1%) | 6,133 (5.4%) |
| 20 to 24 Years | 8,644 (7.6%) | 8,141 (7.1%) |
| 25 to 29 Years | 9,725 (8.6%) | 10,494 (9.2%) |
| 30 to 34 Years | 10,013 (8.8%) | 8,638 (7.6%) |
| 35 to 39 Years | 7,869 (6.9%) | 8,021 (7.0%) |
| 40 to 44 Years | 7,610 (6.7%) | 6,527 (5.7%) |
| 45 to 49 Years | 7,015 (6.2%) | 6,256 (5.5%) |
| 50 to 54 Years | 6,402 (5.6%) | 6,289 (5.5%) |
| 55 to 59 Years | 5,968 (5.2%) | 7,397 (6.5%) |
| 60 to 64 Years | 7,093 (6.2%) | 7,052 (6.2%) |
| 65 to 69 Years | 5,846 (5.1%) | 6,106 (5.3%) |
| 70 to 74 Years | 5,188 (4.6%) | 5,565 (4.9%) |
| 75 to 79 Years | 2,188 (1.9%) | 3,252 (2.9%) |
| 80 to 84 Years | 1,727 (1.5%) | 2,278 (2.0%) |
| 85 Years and over | 1,572 (1.4%) | 3,114 (2.7%) |
| Total | 113,640 (100.0%) | 114,282 (100.0%) |
Families and Households in Spokane
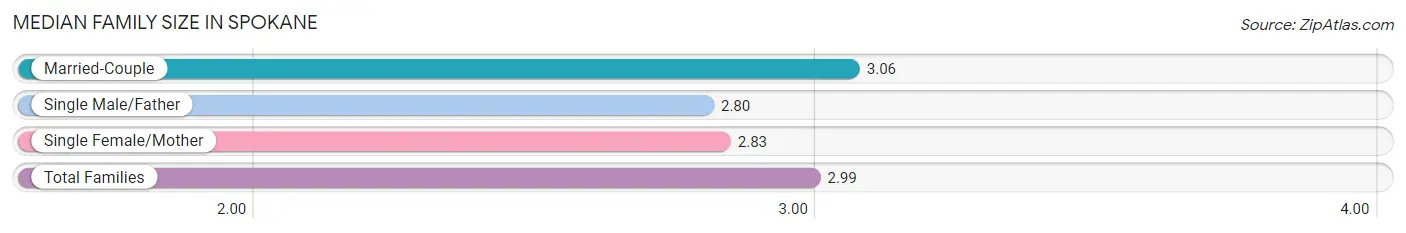
Median Family Size in Spokane
The median family size in Spokane is 2.99 persons per family, with married-couple families (36,397 | 69.8%) accounting for the largest median family size of 3.06 persons per family. On the other hand, single male/father families (4,660 | 8.9%) represent the smallest median family size with 2.80 persons per family.
| Family Type | # Families | Family Size |
| Married-Couple | 36,397 (69.8%) | 3.06 |
| Single Male/Father | 4,660 (8.9%) | 2.80 |
| Single Female/Mother | 11,094 (21.3%) | 2.83 |
| Total Families | 52,151 (100.0%) | 2.99 |
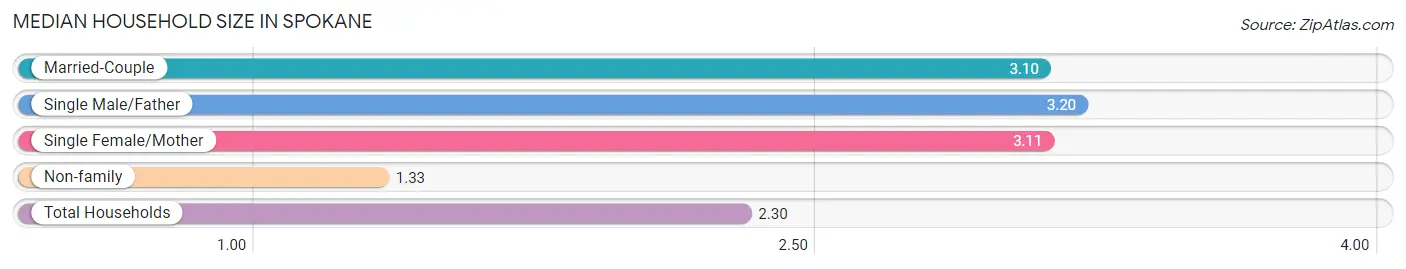
Median Household Size in Spokane
The median household size in Spokane is 2.30 persons per household, with single male/father households (4,660 | 4.9%) accounting for the largest median household size of 3.2 persons per household. non-family households (43,856 | 45.7%) represent the smallest median household size with 1.33 persons per household.
| Household Type | # Households | Household Size |
| Married-Couple | 36,397 (37.9%) | 3.10 |
| Single Male/Father | 4,660 (4.9%) | 3.20 |
| Single Female/Mother | 11,094 (11.6%) | 3.11 |
| Non-family | 43,856 (45.7%) | 1.33 |
| Total Households | 96,007 (100.0%) | 2.30 |
Household Size by Marriage Status in Spokane
Out of a total of 96,007 households in Spokane, 52,151 (54.3%) are family households, while 43,856 (45.7%) are nonfamily households. The most numerous type of family households are 2-person households, comprising 24,013, and the most common type of nonfamily households are 1-person households, comprising 34,103.
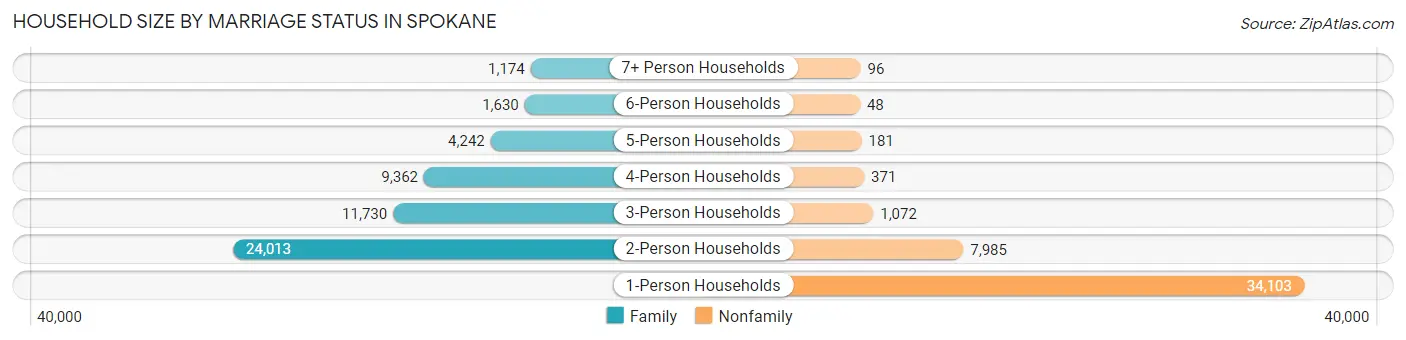
| Household Size | Family Households | Nonfamily Households |
| 1-Person Households | - | 34,103 (35.5%) |
| 2-Person Households | 24,013 (25.0%) | 7,985 (8.3%) |
| 3-Person Households | 11,730 (12.2%) | 1,072 (1.1%) |
| 4-Person Households | 9,362 (9.8%) | 371 (0.4%) |
| 5-Person Households | 4,242 (4.4%) | 181 (0.2%) |
| 6-Person Households | 1,630 (1.7%) | 48 (0.1%) |
| 7+ Person Households | 1,174 (1.2%) | 96 (0.1%) |
| Total | 52,151 (54.3%) | 43,856 (45.7%) |
Female Fertility in Spokane
Fertility by Age in Spokane
Average fertility rate in Spokane is 51.0 births per 1,000 women. Women in the age bracket of 20 to 34 years have the highest fertility rate with 76.0 births per 1,000 women. Women in the age bracket of 20 to 34 years acount for 73.7% of all women with births.
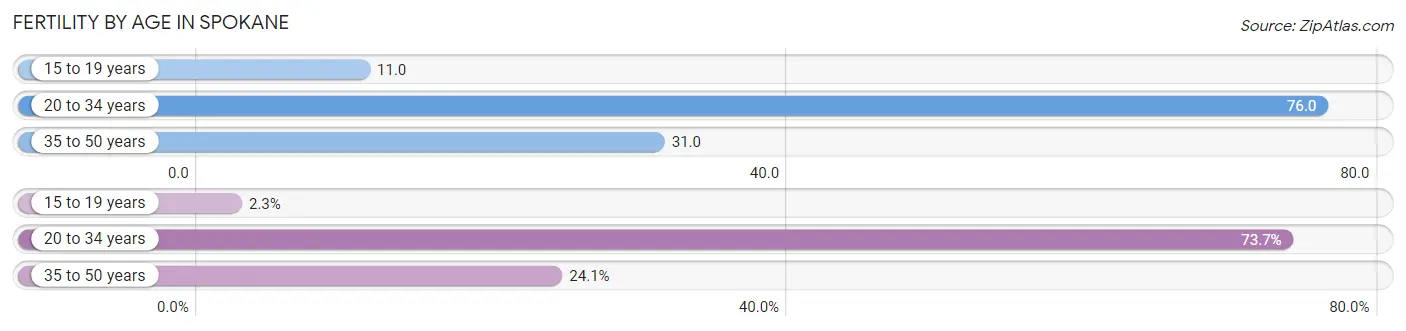
| Age Bracket | Women with Births | Births / 1,000 Women |
| 15 to 19 years | 65 (2.3%) | 11.0 |
| 20 to 34 years | 2,086 (73.7%) | 76.0 |
| 35 to 50 years | 681 (24.0%) | 31.0 |
| Total | 2,832 (100.0%) | 51.0 |
Fertility by Age by Marriage Status in Spokane
72.0% of women with births (2,832) in Spokane are married. The highest percentage of unmarried women with births falls into 15 to 19 years age bracket with 96.9% of them unmarried at the time of birth, while the lowest percentage of unmarried women with births belong to 35 to 50 years age bracket with 11.6% of them unmarried.
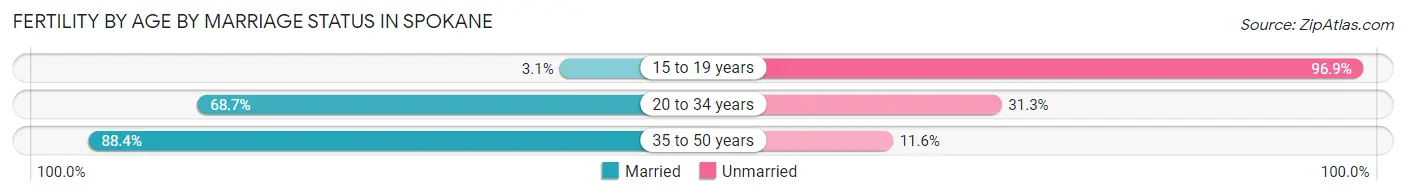
| Age Bracket | Married | Unmarried |
| 15 to 19 years | 2 (3.1%) | 63 (96.9%) |
| 20 to 34 years | 1,433 (68.7%) | 653 (31.3%) |
| 35 to 50 years | 602 (88.4%) | 79 (11.6%) |
| Total | 2,039 (72.0%) | 793 (28.0%) |
Fertility by Education in Spokane
Average fertility rate in Spokane is 51.0 births per 1,000 women. Women with the education attainment of bachelor's degree have the highest fertility rate of 60.0 births per 1,000 women, while women with the education attainment of less than high school have the lowest fertility at 37.0 births per 1,000 women. Women with the education attainment of college or associate's degree represent 38.0% of all women with births.
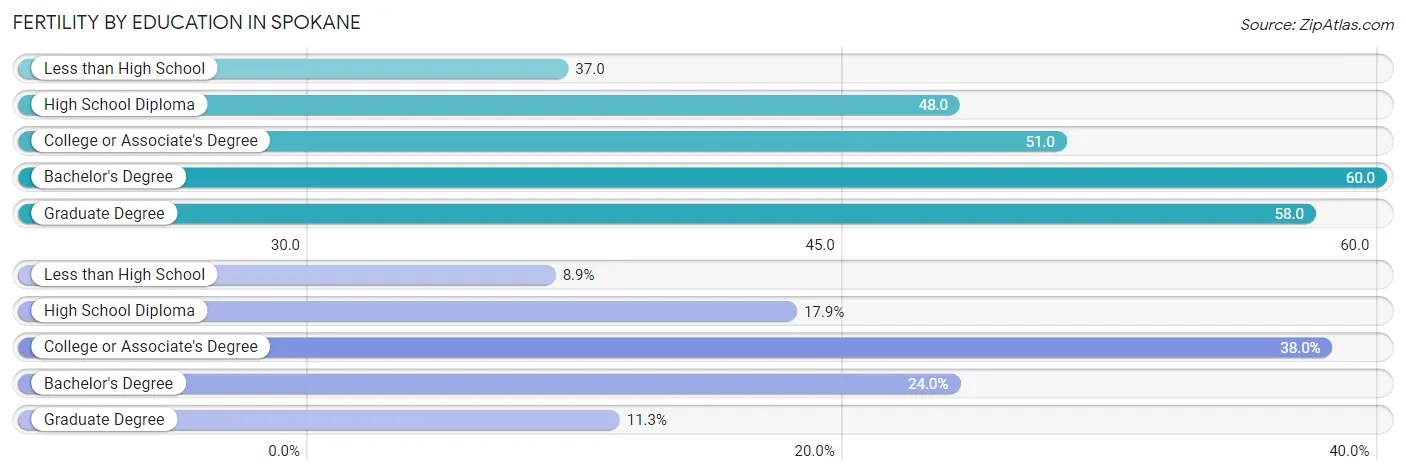
| Educational Attainment | Women with Births | Births / 1,000 Women |
| Less than High School | 251 (8.9%) | 37.0 |
| High School Diploma | 507 (17.9%) | 48.0 |
| College or Associate's Degree | 1,075 (38.0%) | 51.0 |
| Bachelor's Degree | 680 (24.0%) | 60.0 |
| Graduate Degree | 319 (11.3%) | 58.0 |
| Total | 2,832 (100.0%) | 51.0 |
Fertility by Education by Marriage Status in Spokane
28.0% of women with births in Spokane are unmarried. Women with the educational attainment of graduate degree are most likely to be married with 100.0% of them married at childbirth, while women with the educational attainment of less than high school are least likely to be married with 41.8% of them unmarried at childbirth.
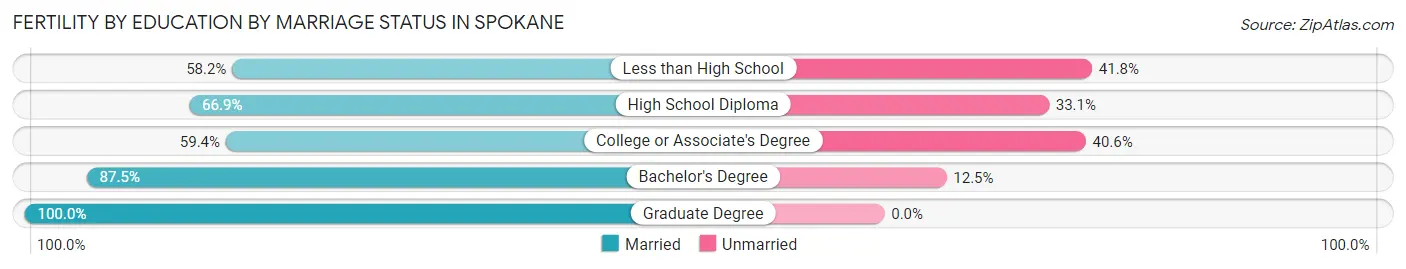
| Educational Attainment | Married | Unmarried |
| Less than High School | 146 (58.2%) | 105 (41.8%) |
| High School Diploma | 339 (66.9%) | 168 (33.1%) |
| College or Associate's Degree | 639 (59.4%) | 436 (40.6%) |
| Bachelor's Degree | 595 (87.5%) | 85 (12.5%) |
| Graduate Degree | 319 (100.0%) | 0 (0.0%) |
| Total | 2,039 (72.0%) | 793 (28.0%) |
Employment Characteristics in Spokane
Employment by Class of Employer in Spokane
Among the 106,996 employed individuals in Spokane, private company employees (69,002 | 64.5%), not-for-profit organizations (12,838 | 12.0%), and local government employees (6,853 | 6.4%) make up the most common classes of employment.
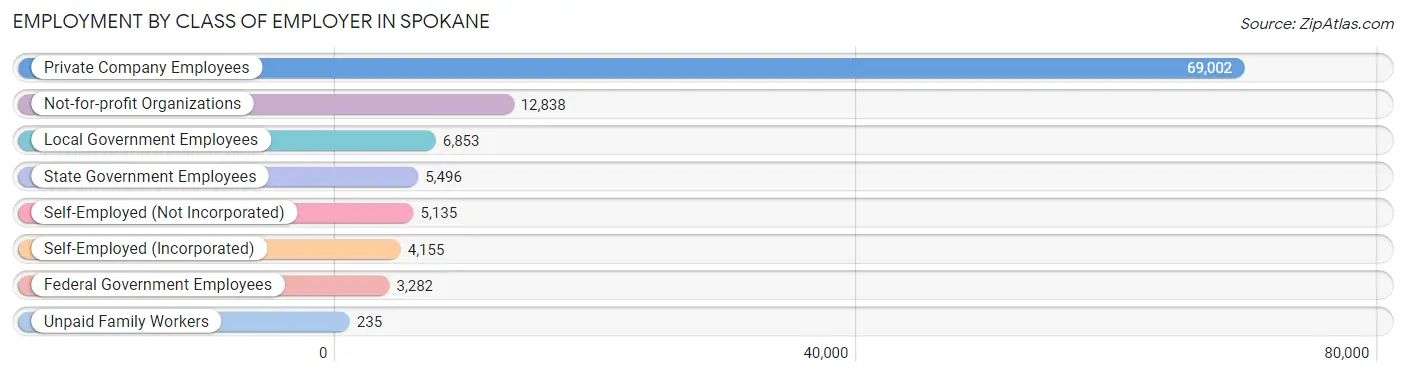
| Employer Class | # Employees | % Employees |
| Private Company Employees | 69,002 | 64.5% |
| Self-Employed (Incorporated) | 4,155 | 3.9% |
| Self-Employed (Not Incorporated) | 5,135 | 4.8% |
| Not-for-profit Organizations | 12,838 | 12.0% |
| Local Government Employees | 6,853 | 6.4% |
| State Government Employees | 5,496 | 5.1% |
| Federal Government Employees | 3,282 | 3.1% |
| Unpaid Family Workers | 235 | 0.2% |
| Total | 106,996 | 100.0% |
Employment Status by Age in Spokane
According to the labor force statistics for Spokane, out of the total population over 16 years of age (186,314), 62.6% or 116,633 individuals are in the labor force, with 6.2% or 7,231 of them unemployed. The age group with the highest labor force participation rate is 25 to 29 years, with 84.6% or 17,105 individuals in the labor force. Within the labor force, the 16 to 19 years age range has the highest percentage of unemployed individuals, with 15.8% or 646 of them being unemployed.
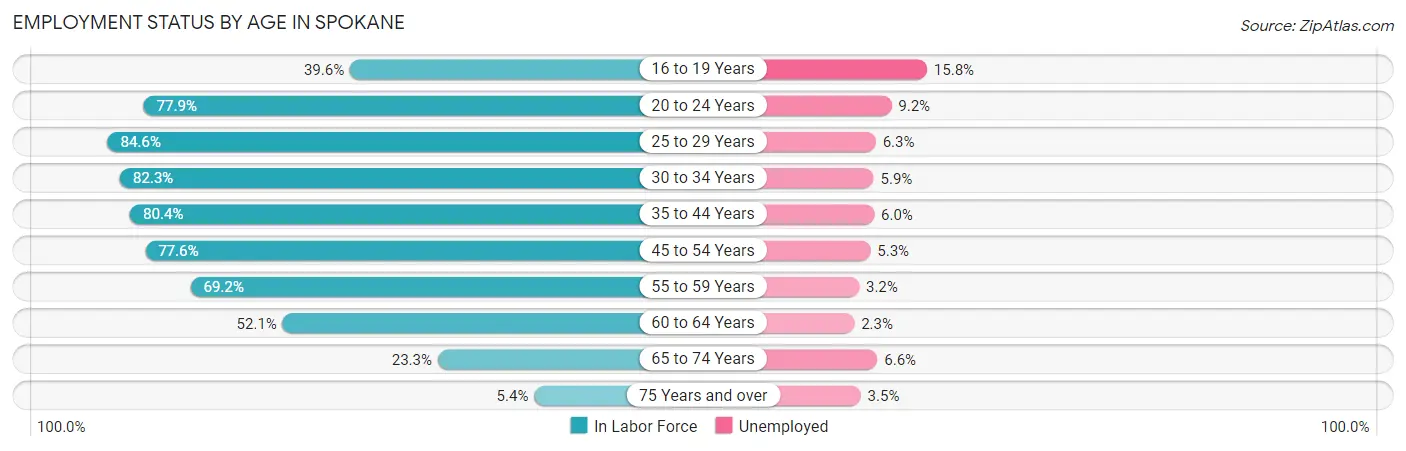
| Age Bracket | In Labor Force | Unemployed |
| 16 to 19 Years | 4,088 (39.6%) | 646 (15.8%) |
| 20 to 24 Years | 13,076 (77.9%) | 1,203 (9.2%) |
| 25 to 29 Years | 17,105 (84.6%) | 1,078 (6.3%) |
| 30 to 34 Years | 15,350 (82.3%) | 906 (5.9%) |
| 35 to 44 Years | 24,142 (80.4%) | 1,449 (6.0%) |
| 45 to 54 Years | 20,147 (77.6%) | 1,068 (5.3%) |
| 55 to 59 Years | 9,249 (69.2%) | 296 (3.2%) |
| 60 to 64 Years | 7,370 (52.1%) | 170 (2.3%) |
| 65 to 74 Years | 5,290 (23.3%) | 349 (6.6%) |
| 75 Years and over | 763 (5.4%) | 27 (3.5%) |
| Total | 116,633 (62.6%) | 7,231 (6.2%) |
Employment Status by Educational Attainment in Spokane
According to labor force statistics for Spokane, 76.3% of individuals (93,368) out of the total population between 25 and 64 years of age (122,369) are in the labor force, with 5.3% or 4,949 of them being unemployed. The group with the highest labor force participation rate are those with the educational attainment of bachelor's degree or higher, with 86.5% or 33,824 individuals in the labor force. Within the labor force, individuals with less than high school education have the highest percentage of unemployment, with 12.8% or 611 of them being unemployed.
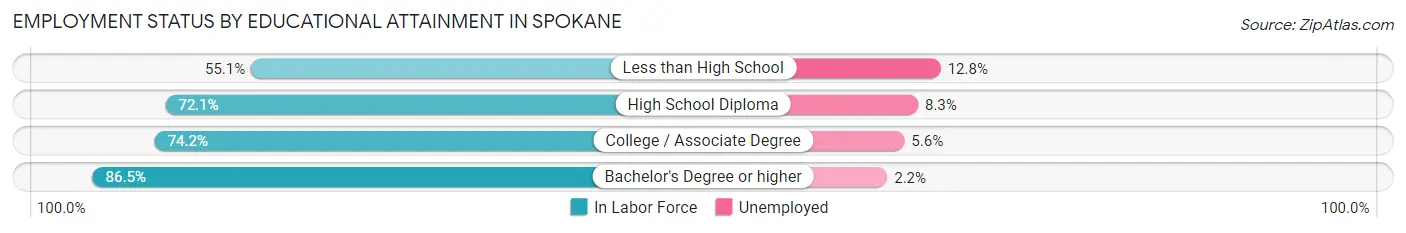
| Educational Attainment | In Labor Force | Unemployed |
| Less than High School | 4,772 (55.1%) | 1,109 (12.8%) |
| High School Diploma | 20,001 (72.1%) | 2,303 (8.3%) |
| College / Associate Degree | 34,773 (74.2%) | 2,624 (5.6%) |
| Bachelor's Degree or higher | 33,824 (86.5%) | 860 (2.2%) |
| Total | 93,368 (76.3%) | 6,486 (5.3%) |
Employment Occupations by Sex in Spokane
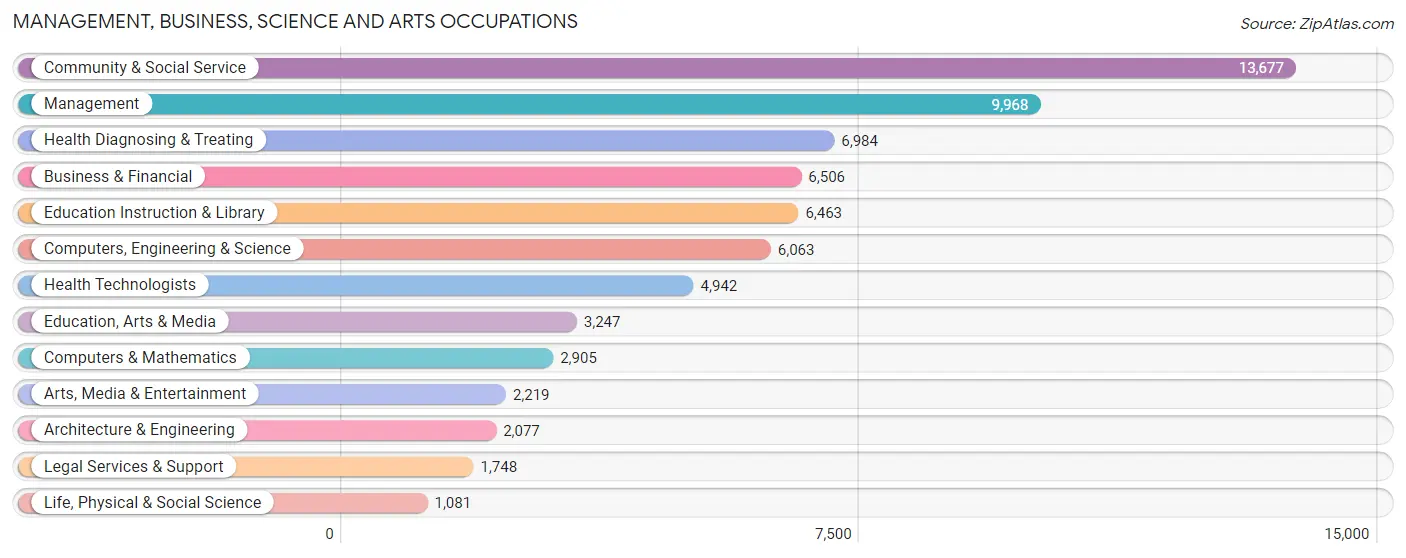
Management, Business, Science and Arts Occupations
The most common Management, Business, Science and Arts occupations in Spokane are Community & Social Service (13,677 | 12.6%), Management (9,968 | 9.2%), Health Diagnosing & Treating (6,984 | 6.4%), Business & Financial (6,506 | 6.0%), and Education Instruction & Library (6,463 | 5.9%).
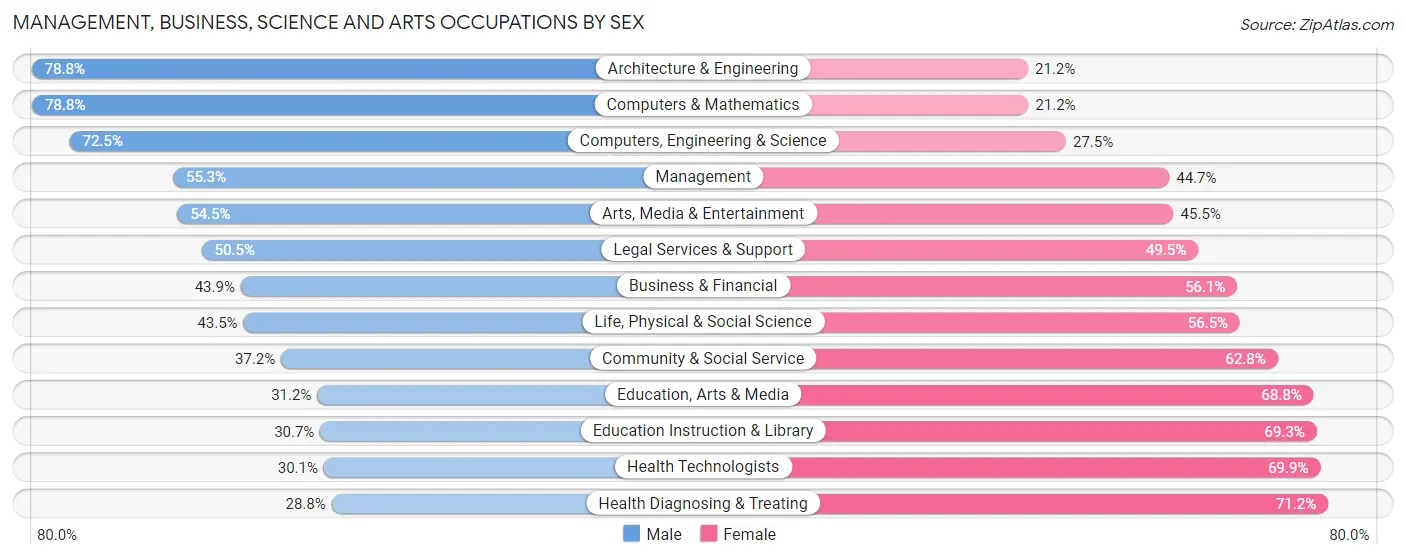
Management, Business, Science and Arts Occupations by Sex
Within the Management, Business, Science and Arts occupations in Spokane, the most male-oriented occupations are Architecture & Engineering (78.8%), Computers & Mathematics (78.8%), and Computers, Engineering & Science (72.5%), while the most female-oriented occupations are Health Diagnosing & Treating (71.2%), Health Technologists (69.9%), and Education Instruction & Library (69.3%).
| Occupation | Male | Female |
| Management | 5,508 (55.3%) | 4,460 (44.7%) |
| Business & Financial | 2,858 (43.9%) | 3,648 (56.1%) |
| Computers, Engineering & Science | 4,395 (72.5%) | 1,668 (27.5%) |
| Computers & Mathematics | 2,288 (78.8%) | 617 (21.2%) |
| Architecture & Engineering | 1,637 (78.8%) | 440 (21.2%) |
| Life, Physical & Social Science | 470 (43.5%) | 611 (56.5%) |
| Community & Social Service | 5,086 (37.2%) | 8,591 (62.8%) |
| Education, Arts & Media | 1,012 (31.2%) | 2,235 (68.8%) |
| Legal Services & Support | 882 (50.5%) | 866 (49.5%) |
| Education Instruction & Library | 1,982 (30.7%) | 4,481 (69.3%) |
| Arts, Media & Entertainment | 1,210 (54.5%) | 1,009 (45.5%) |
| Health Diagnosing & Treating | 2,009 (28.8%) | 4,975 (71.2%) |
| Health Technologists | 1,486 (30.1%) | 3,456 (69.9%) |
| Total (Category) | 19,856 (46.0%) | 23,342 (54.0%) |
| Total (Overall) | 56,059 (51.5%) | 52,763 (48.5%) |
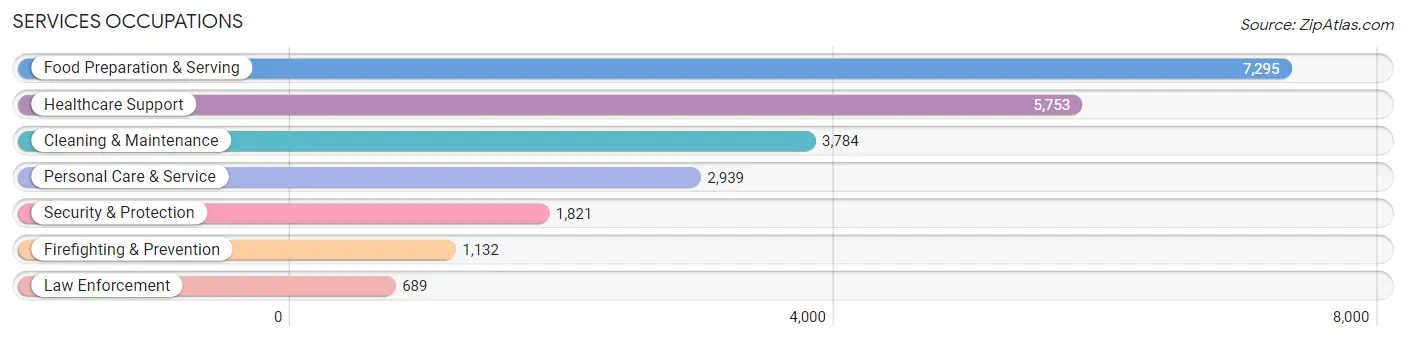
Services Occupations
The most common Services occupations in Spokane are Food Preparation & Serving (7,295 | 6.7%), Healthcare Support (5,753 | 5.3%), Cleaning & Maintenance (3,784 | 3.5%), Personal Care & Service (2,939 | 2.7%), and Security & Protection (1,821 | 1.7%).
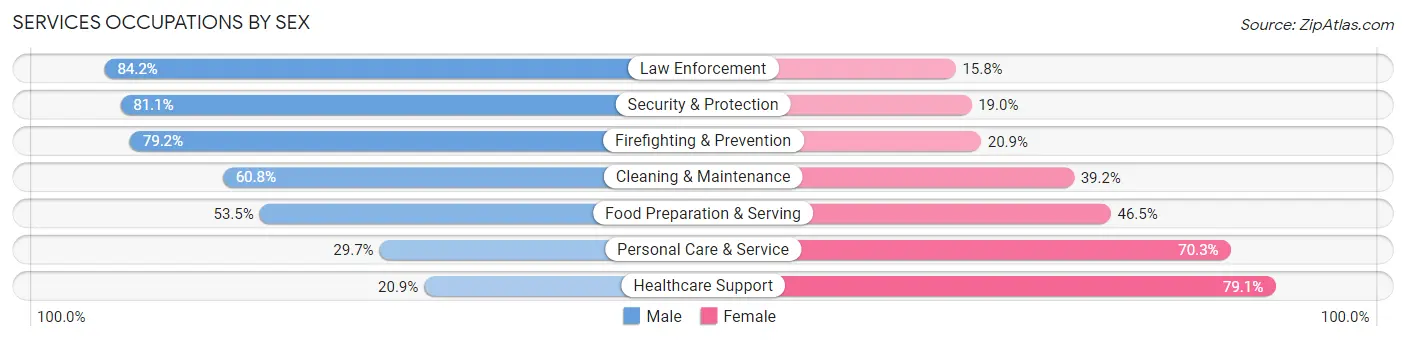
Services Occupations by Sex
Within the Services occupations in Spokane, the most male-oriented occupations are Law Enforcement (84.2%), Security & Protection (81.0%), and Firefighting & Prevention (79.1%), while the most female-oriented occupations are Healthcare Support (79.1%), Personal Care & Service (70.3%), and Food Preparation & Serving (46.5%).
| Occupation | Male | Female |
| Healthcare Support | 1,202 (20.9%) | 4,551 (79.1%) |
| Security & Protection | 1,476 (81.0%) | 345 (19.0%) |
| Firefighting & Prevention | 896 (79.1%) | 236 (20.8%) |
| Law Enforcement | 580 (84.2%) | 109 (15.8%) |
| Food Preparation & Serving | 3,901 (53.5%) | 3,394 (46.5%) |
| Cleaning & Maintenance | 2,299 (60.8%) | 1,485 (39.2%) |
| Personal Care & Service | 874 (29.7%) | 2,065 (70.3%) |
| Total (Category) | 9,752 (45.2%) | 11,840 (54.8%) |
| Total (Overall) | 56,059 (51.5%) | 52,763 (48.5%) |
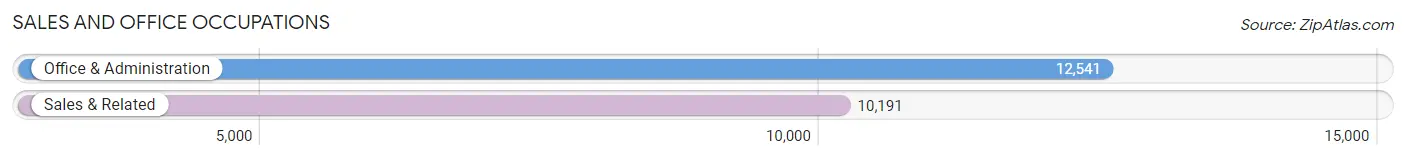
Sales and Office Occupations
The most common Sales and Office occupations in Spokane are Office & Administration (12,541 | 11.5%), and Sales & Related (10,191 | 9.4%).
Sales and Office Occupations by Sex
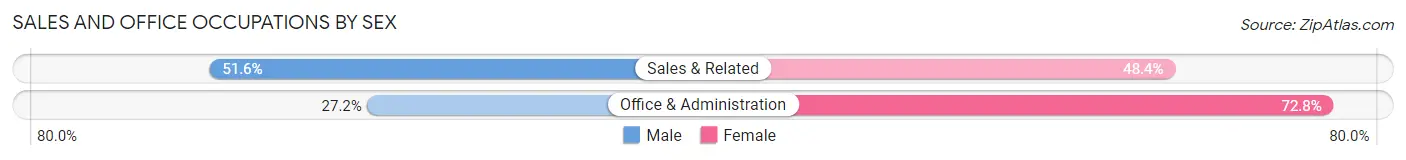
| Occupation | Male | Female |
| Sales & Related | 5,255 (51.6%) | 4,936 (48.4%) |
| Office & Administration | 3,415 (27.2%) | 9,126 (72.8%) |
| Total (Category) | 8,670 (38.1%) | 14,062 (61.9%) |
| Total (Overall) | 56,059 (51.5%) | 52,763 (48.5%) |
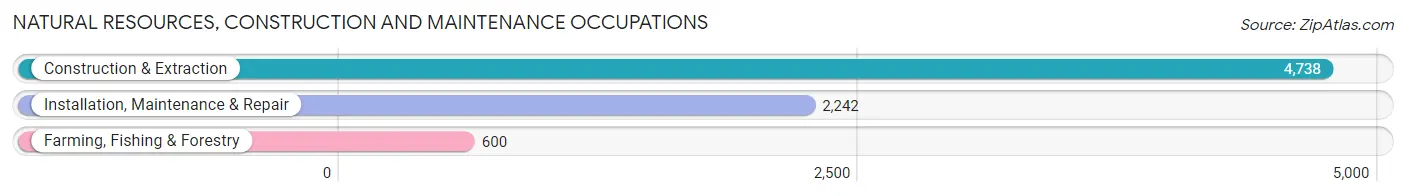
Natural Resources, Construction and Maintenance Occupations
The most common Natural Resources, Construction and Maintenance occupations in Spokane are Construction & Extraction (4,738 | 4.3%), Installation, Maintenance & Repair (2,242 | 2.1%), and Farming, Fishing & Forestry (600 | 0.5%).
Natural Resources, Construction and Maintenance Occupations by Sex
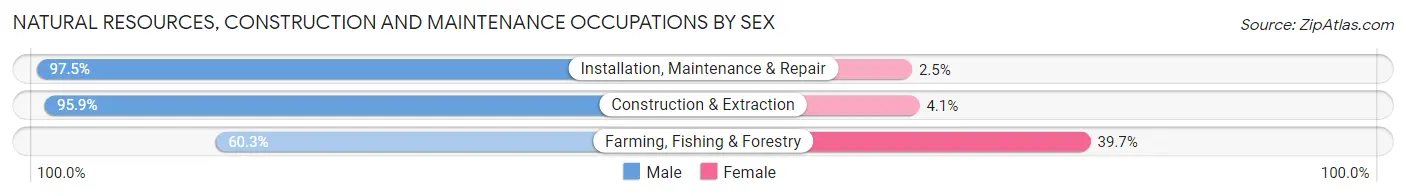
| Occupation | Male | Female |
| Farming, Fishing & Forestry | 362 (60.3%) | 238 (39.7%) |
| Construction & Extraction | 4,545 (95.9%) | 193 (4.1%) |
| Installation, Maintenance & Repair | 2,186 (97.5%) | 56 (2.5%) |
| Total (Category) | 7,093 (93.6%) | 487 (6.4%) |
| Total (Overall) | 56,059 (51.5%) | 52,763 (48.5%) |
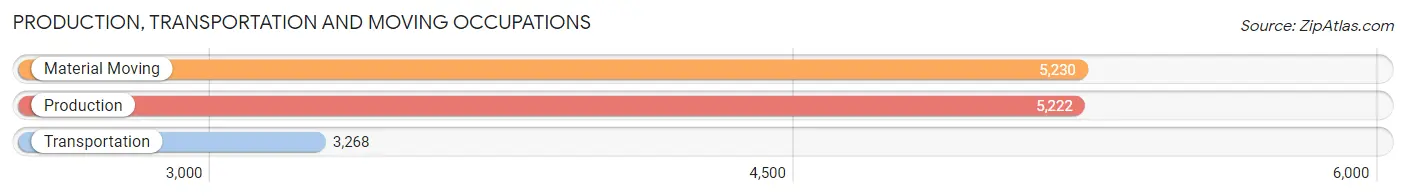
Production, Transportation and Moving Occupations
The most common Production, Transportation and Moving occupations in Spokane are Material Moving (5,230 | 4.8%), Production (5,222 | 4.8%), and Transportation (3,268 | 3.0%).
Production, Transportation and Moving Occupations by Sex
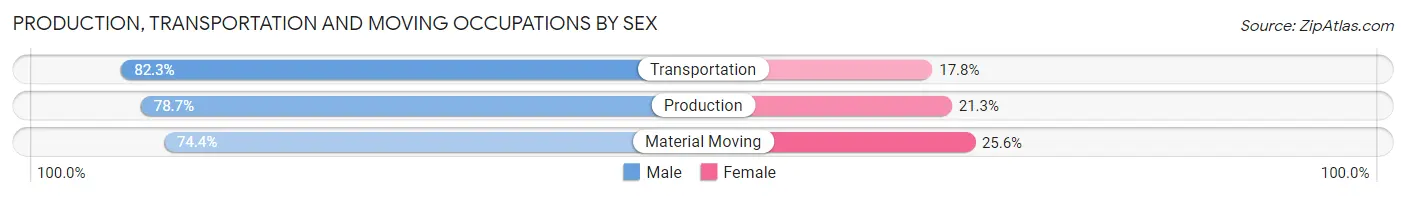
| Occupation | Male | Female |
| Production | 4,108 (78.7%) | 1,114 (21.3%) |
| Transportation | 2,688 (82.3%) | 580 (17.7%) |
| Material Moving | 3,892 (74.4%) | 1,338 (25.6%) |
| Total (Category) | 10,688 (77.9%) | 3,032 (22.1%) |
| Total (Overall) | 56,059 (51.5%) | 52,763 (48.5%) |
Employment Industries by Sex in Spokane
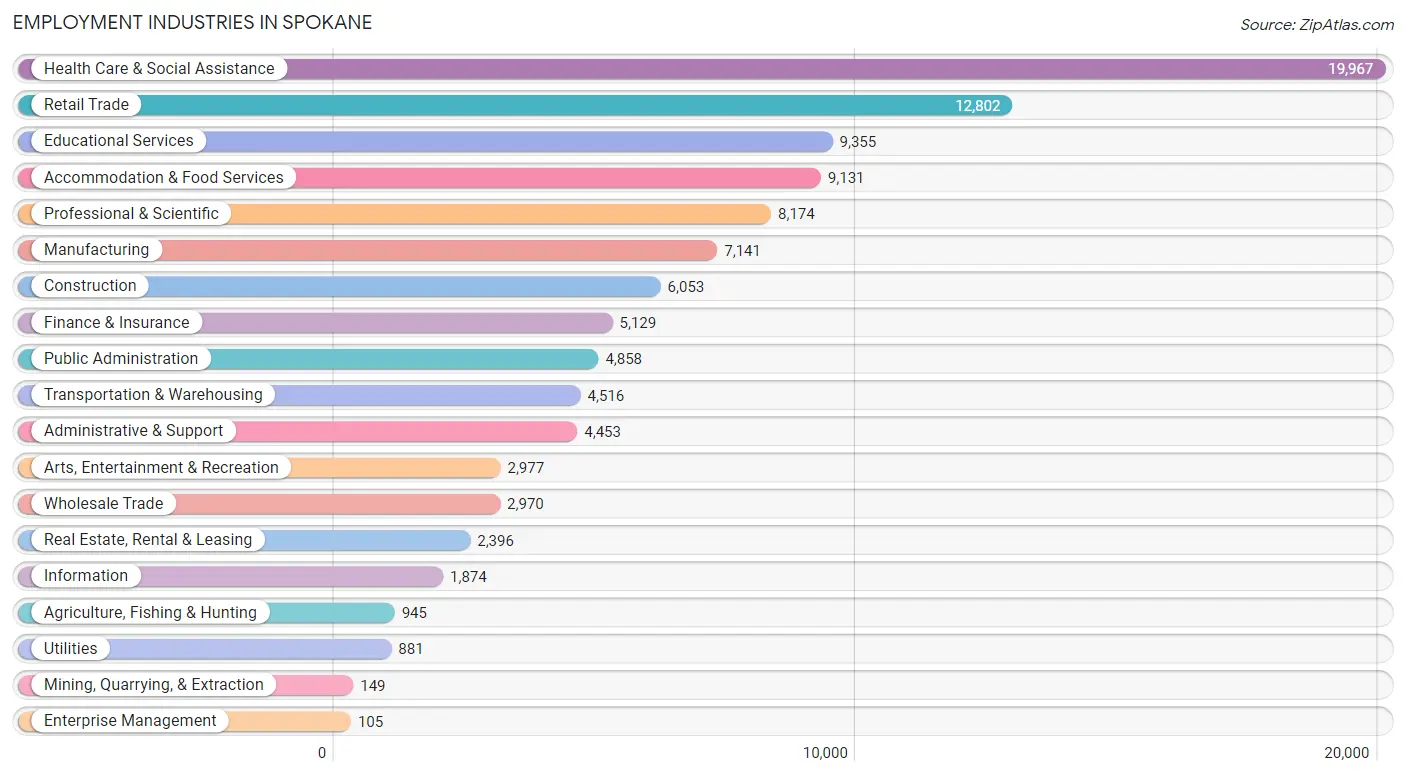
Employment Industries in Spokane
The major employment industries in Spokane include Health Care & Social Assistance (19,967 | 18.3%), Retail Trade (12,802 | 11.8%), Educational Services (9,355 | 8.6%), Accommodation & Food Services (9,131 | 8.4%), and Professional & Scientific (8,174 | 7.5%).
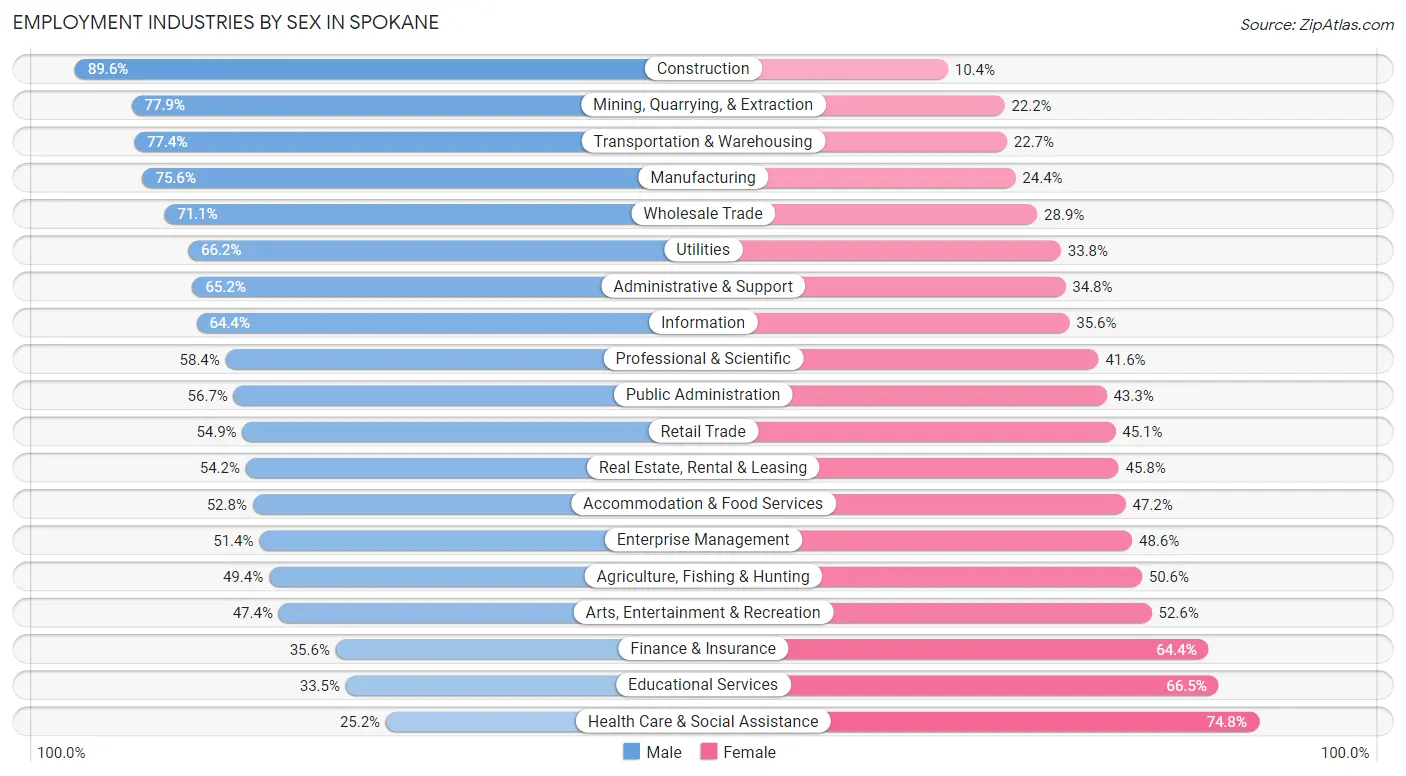
Employment Industries by Sex in Spokane
The Spokane industries that see more men than women are Construction (89.6%), Mining, Quarrying, & Extraction (77.8%), and Transportation & Warehousing (77.3%), whereas the industries that tend to have a higher number of women are Health Care & Social Assistance (74.8%), Educational Services (66.5%), and Finance & Insurance (64.4%).
| Industry | Male | Female |
| Agriculture, Fishing & Hunting | 467 (49.4%) | 478 (50.6%) |
| Mining, Quarrying, & Extraction | 116 (77.8%) | 33 (22.2%) |
| Construction | 5,422 (89.6%) | 631 (10.4%) |
| Manufacturing | 5,397 (75.6%) | 1,744 (24.4%) |
| Wholesale Trade | 2,111 (71.1%) | 859 (28.9%) |
| Retail Trade | 7,030 (54.9%) | 5,772 (45.1%) |
| Transportation & Warehousing | 3,493 (77.3%) | 1,023 (22.7%) |
| Utilities | 583 (66.2%) | 298 (33.8%) |
| Information | 1,207 (64.4%) | 667 (35.6%) |
| Finance & Insurance | 1,826 (35.6%) | 3,303 (64.4%) |
| Real Estate, Rental & Leasing | 1,299 (54.2%) | 1,097 (45.8%) |
| Professional & Scientific | 4,773 (58.4%) | 3,401 (41.6%) |
| Enterprise Management | 54 (51.4%) | 51 (48.6%) |
| Administrative & Support | 2,905 (65.2%) | 1,548 (34.8%) |
| Educational Services | 3,135 (33.5%) | 6,220 (66.5%) |
| Health Care & Social Assistance | 5,033 (25.2%) | 14,934 (74.8%) |
| Arts, Entertainment & Recreation | 1,411 (47.4%) | 1,566 (52.6%) |
| Accommodation & Food Services | 4,819 (52.8%) | 4,312 (47.2%) |
| Public Administration | 2,756 (56.7%) | 2,102 (43.3%) |
| Total | 56,059 (51.5%) | 52,763 (48.5%) |
Education in Spokane
School Enrollment in Spokane
The most common levels of schooling among the 54,253 students in Spokane are college / undergraduate (14,622 | 27.0%), elementary school (10,645 | 19.6%), and middle school (10,637 | 19.6%).
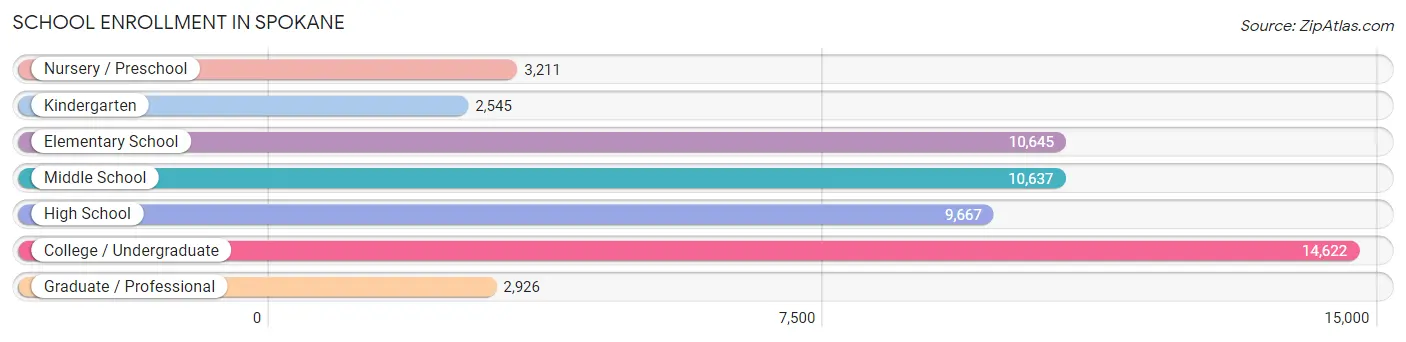
| School Level | # Students | % Students |
| Nursery / Preschool | 3,211 | 5.9% |
| Kindergarten | 2,545 | 4.7% |
| Elementary School | 10,645 | 19.6% |
| Middle School | 10,637 | 19.6% |
| High School | 9,667 | 17.8% |
| College / Undergraduate | 14,622 | 27.0% |
| Graduate / Professional | 2,926 | 5.4% |
| Total | 54,253 | 100.0% |
School Enrollment by Age by Funding Source in Spokane
Out of a total of 54,253 students who are enrolled in schools in Spokane, 11,285 (20.8%) attend a private institution, while the remaining 42,968 (79.2%) are enrolled in public schools. The age group of 3 to 4 year olds has the highest likelihood of being enrolled in private schools, with 1,090 (48.1% in the age bracket) enrolled. Conversely, the age group of 15 to 17 year olds has the lowest likelihood of being enrolled in a private school, with 6,493 (90.2% in the age bracket) attending a public institution.
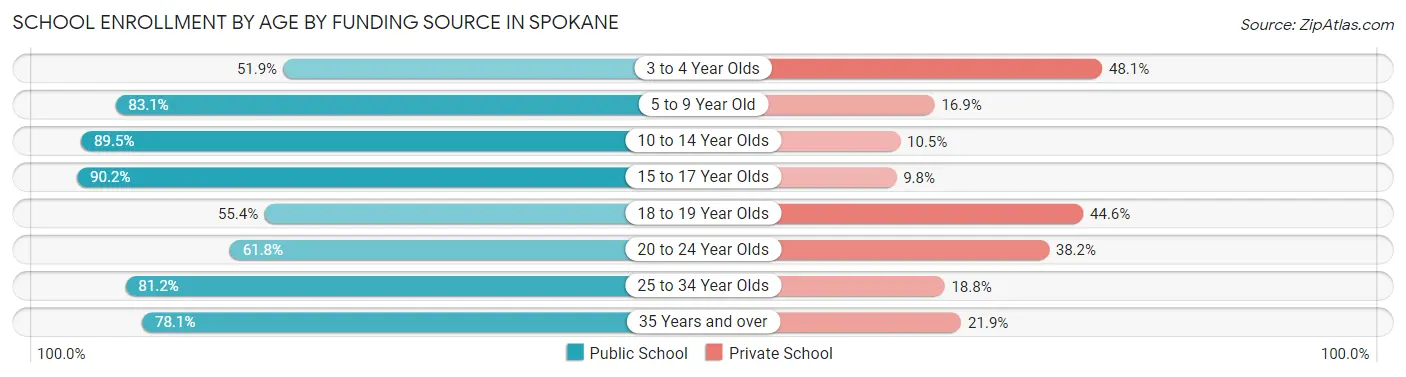
| Age Bracket | Public School | Private School |
| 3 to 4 Year Olds | 1,175 (51.9%) | 1,090 (48.1%) |
| 5 to 9 Year Old | 10,349 (83.1%) | 2,108 (16.9%) |
| 10 to 14 Year Olds | 11,690 (89.5%) | 1,373 (10.5%) |
| 15 to 17 Year Olds | 6,493 (90.2%) | 705 (9.8%) |
| 18 to 19 Year Olds | 2,158 (55.4%) | 1,737 (44.6%) |
| 20 to 24 Year Olds | 4,137 (61.8%) | 2,558 (38.2%) |
| 25 to 34 Year Olds | 4,663 (81.2%) | 1,078 (18.8%) |
| 35 Years and over | 2,296 (78.1%) | 643 (21.9%) |
| Total | 42,968 (79.2%) | 11,285 (20.8%) |
Educational Attainment by Field of Study in Spokane
Business (8,617 | 14.9%), education (6,905 | 11.9%), science & technology (6,899 | 11.9%), social sciences (5,378 | 9.3%), and arts & humanities (4,391 | 7.6%) are the most common fields of study among 57,800 individuals in Spokane who have obtained a bachelor's degree or higher.
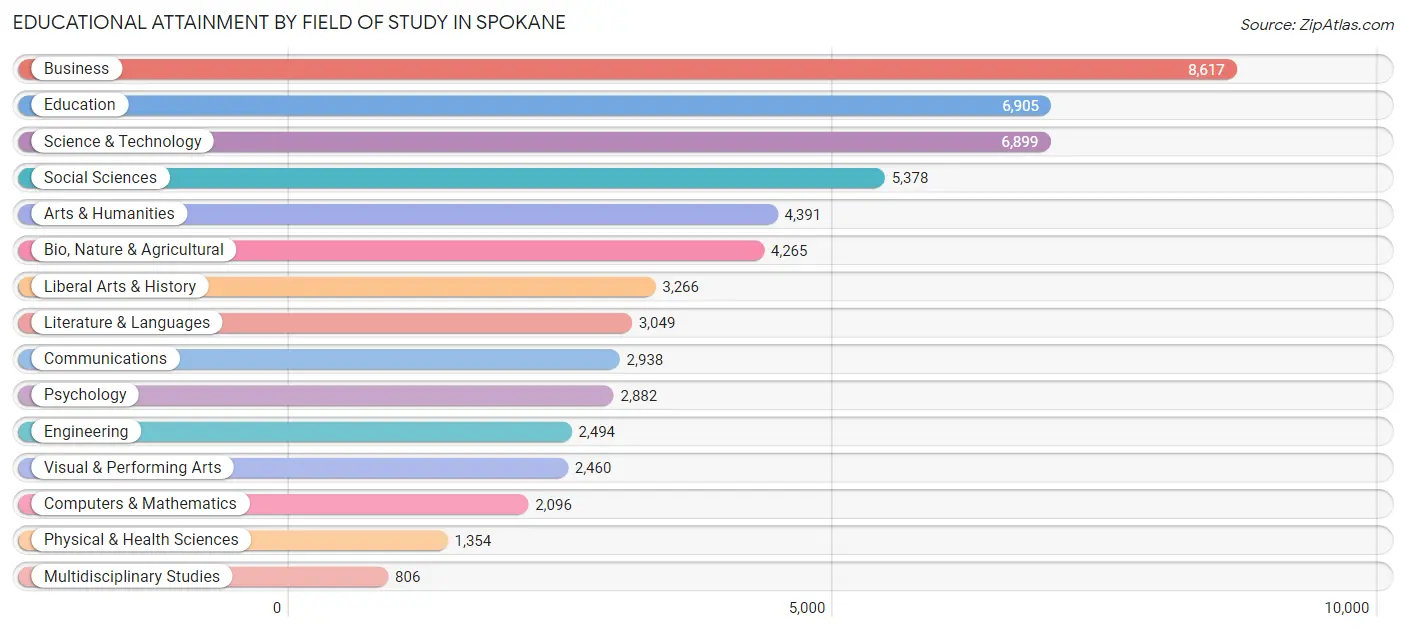
| Field of Study | # Graduates | % Graduates |
| Computers & Mathematics | 2,096 | 3.6% |
| Bio, Nature & Agricultural | 4,265 | 7.4% |
| Physical & Health Sciences | 1,354 | 2.3% |
| Psychology | 2,882 | 5.0% |
| Social Sciences | 5,378 | 9.3% |
| Engineering | 2,494 | 4.3% |
| Multidisciplinary Studies | 806 | 1.4% |
| Science & Technology | 6,899 | 11.9% |
| Business | 8,617 | 14.9% |
| Education | 6,905 | 11.9% |
| Literature & Languages | 3,049 | 5.3% |
| Liberal Arts & History | 3,266 | 5.7% |
| Visual & Performing Arts | 2,460 | 4.3% |
| Communications | 2,938 | 5.1% |
| Arts & Humanities | 4,391 | 7.6% |
| Total | 57,800 | 100.0% |
Transportation & Commute in Spokane
Vehicle Availability by Sex in Spokane
The most prevalent vehicle ownership categories in Spokane are males with 2 vehicles (23,971, accounting for 43.7%) and females with 2 vehicles (22,119, making up 47.0%).
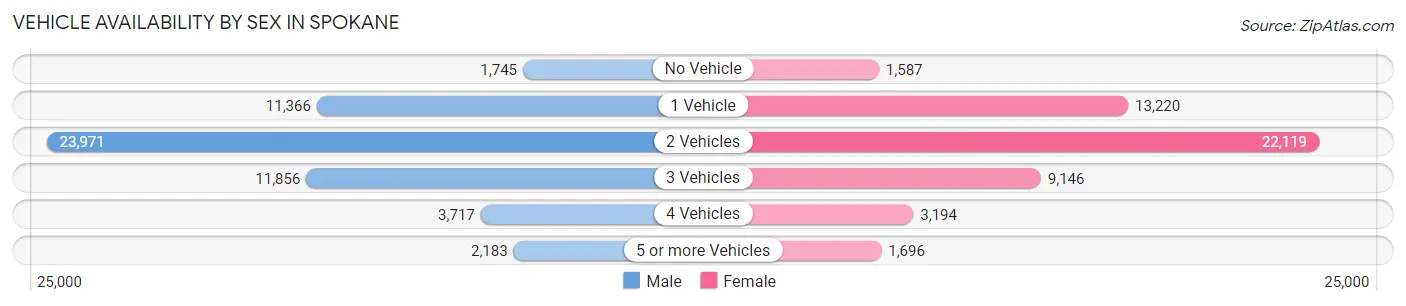
| Vehicles Available | Male | Female |
| No Vehicle | 1,745 (3.2%) | 1,587 (3.1%) |
| 1 Vehicle | 11,366 (20.7%) | 13,220 (25.9%) |
| 2 Vehicles | 23,971 (43.7%) | 22,119 (43.4%) |
| 3 Vehicles | 11,856 (21.6%) | 9,146 (17.9%) |
| 4 Vehicles | 3,717 (6.8%) | 3,194 (6.3%) |
| 5 or more Vehicles | 2,183 (4.0%) | 1,696 (3.3%) |
| Total | 54,838 (100.0%) | 50,962 (100.0%) |
Commute Time in Spokane
The most frequently occuring commute durations in Spokane are 15 to 19 minutes (19,668 commuters, 20.9%), 20 to 24 minutes (17,465 commuters, 18.5%), and 10 to 14 minutes (16,906 commuters, 17.9%).
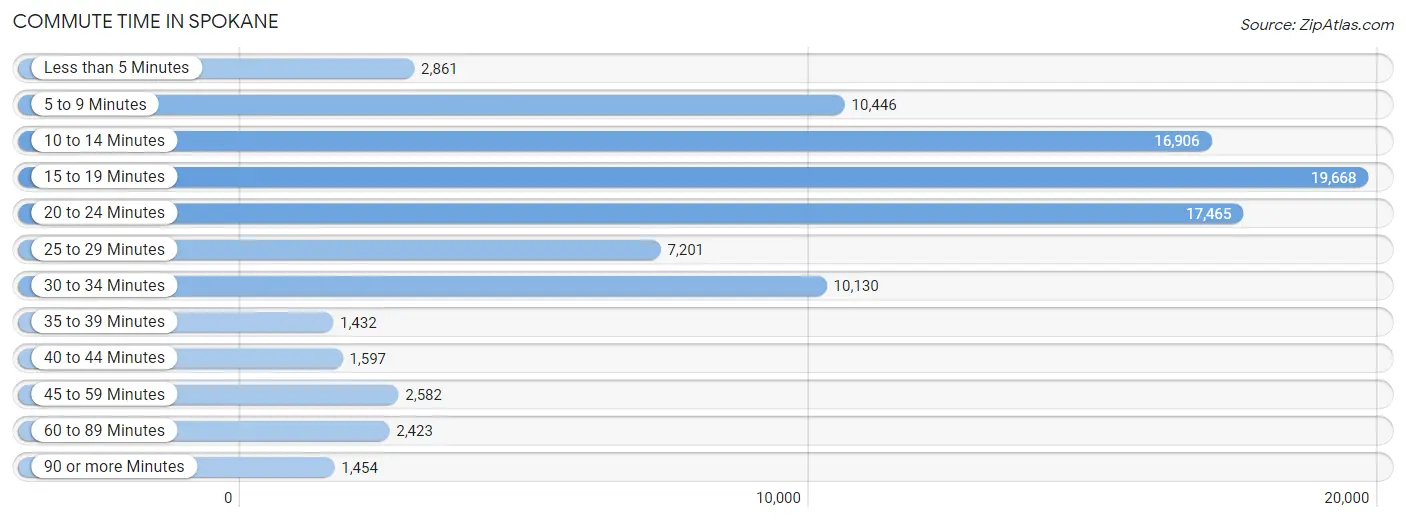
| Commute Time | # Commuters | % Commuters |
| Less than 5 Minutes | 2,861 | 3.0% |
| 5 to 9 Minutes | 10,446 | 11.1% |
| 10 to 14 Minutes | 16,906 | 17.9% |
| 15 to 19 Minutes | 19,668 | 20.9% |
| 20 to 24 Minutes | 17,465 | 18.5% |
| 25 to 29 Minutes | 7,201 | 7.6% |
| 30 to 34 Minutes | 10,130 | 10.8% |
| 35 to 39 Minutes | 1,432 | 1.5% |
| 40 to 44 Minutes | 1,597 | 1.7% |
| 45 to 59 Minutes | 2,582 | 2.7% |
| 60 to 89 Minutes | 2,423 | 2.6% |
| 90 or more Minutes | 1,454 | 1.5% |
Commute Time by Sex in Spokane
The most common commute times in Spokane are 15 to 19 minutes (10,660 commuters, 21.4%) for males and 15 to 19 minutes (9,008 commuters, 20.3%) for females.
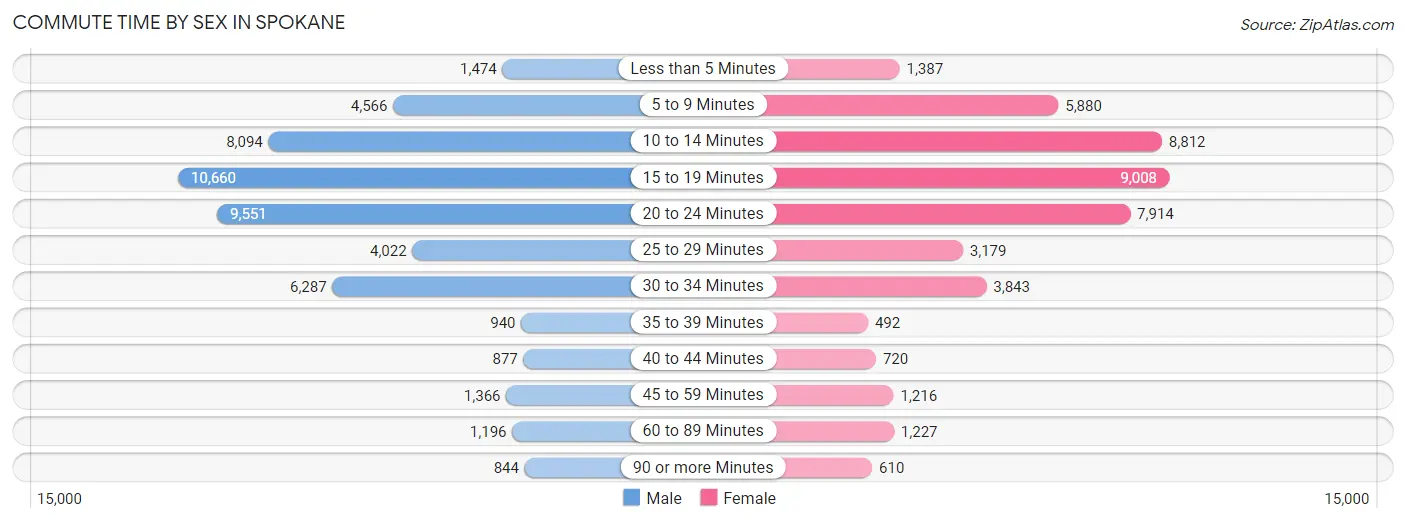
| Commute Time | Male | Female |
| Less than 5 Minutes | 1,474 (3.0%) | 1,387 (3.1%) |
| 5 to 9 Minutes | 4,566 (9.1%) | 5,880 (13.3%) |
| 10 to 14 Minutes | 8,094 (16.2%) | 8,812 (19.9%) |
| 15 to 19 Minutes | 10,660 (21.4%) | 9,008 (20.3%) |
| 20 to 24 Minutes | 9,551 (19.2%) | 7,914 (17.9%) |
| 25 to 29 Minutes | 4,022 (8.1%) | 3,179 (7.2%) |
| 30 to 34 Minutes | 6,287 (12.6%) | 3,843 (8.7%) |
| 35 to 39 Minutes | 940 (1.9%) | 492 (1.1%) |
| 40 to 44 Minutes | 877 (1.8%) | 720 (1.6%) |
| 45 to 59 Minutes | 1,366 (2.7%) | 1,216 (2.8%) |
| 60 to 89 Minutes | 1,196 (2.4%) | 1,227 (2.8%) |
| 90 or more Minutes | 844 (1.7%) | 610 (1.4%) |
Time of Departure to Work by Sex in Spokane
The most frequent times of departure to work in Spokane are 7:30 AM to 7:59 AM (6,099, 12.2%) for males and 7:00 AM to 7:29 AM (6,543, 14.8%) for females.
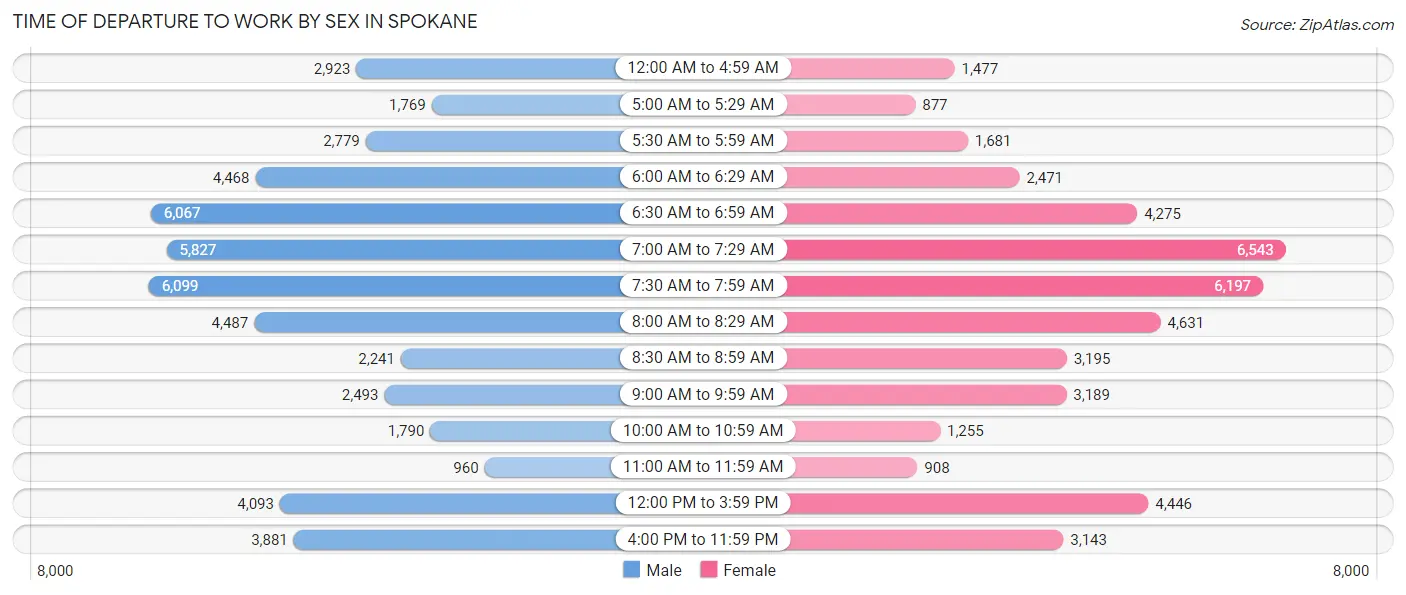
| Time of Departure | Male | Female |
| 12:00 AM to 4:59 AM | 2,923 (5.9%) | 1,477 (3.3%) |
| 5:00 AM to 5:29 AM | 1,769 (3.5%) | 877 (2.0%) |
| 5:30 AM to 5:59 AM | 2,779 (5.6%) | 1,681 (3.8%) |
| 6:00 AM to 6:29 AM | 4,468 (9.0%) | 2,471 (5.6%) |
| 6:30 AM to 6:59 AM | 6,067 (12.2%) | 4,275 (9.7%) |
| 7:00 AM to 7:29 AM | 5,827 (11.7%) | 6,543 (14.8%) |
| 7:30 AM to 7:59 AM | 6,099 (12.2%) | 6,197 (14.0%) |
| 8:00 AM to 8:29 AM | 4,487 (9.0%) | 4,631 (10.5%) |
| 8:30 AM to 8:59 AM | 2,241 (4.5%) | 3,195 (7.2%) |
| 9:00 AM to 9:59 AM | 2,493 (5.0%) | 3,189 (7.2%) |
| 10:00 AM to 10:59 AM | 1,790 (3.6%) | 1,255 (2.8%) |
| 11:00 AM to 11:59 AM | 960 (1.9%) | 908 (2.1%) |
| 12:00 PM to 3:59 PM | 4,093 (8.2%) | 4,446 (10.0%) |
| 4:00 PM to 11:59 PM | 3,881 (7.8%) | 3,143 (7.1%) |
| Total | 49,877 (100.0%) | 44,288 (100.0%) |
Housing Occupancy in Spokane
Occupancy by Ownership in Spokane
Of the total 96,007 dwellings in Spokane, owner-occupied units account for 55,211 (57.5%), while renter-occupied units make up 40,796 (42.5%).
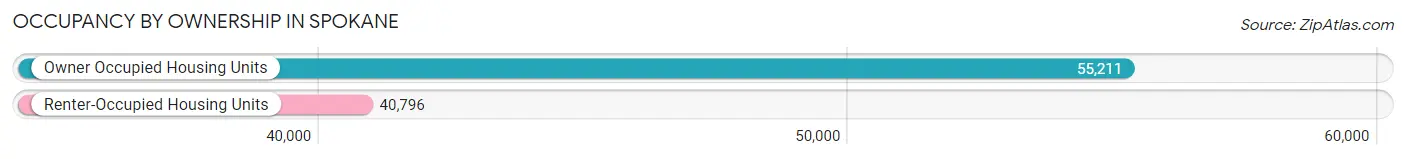
| Occupancy | # Housing Units | % Housing Units |
| Owner Occupied Housing Units | 55,211 | 57.5% |
| Renter-Occupied Housing Units | 40,796 | 42.5% |
| Total Occupied Housing Units | 96,007 | 100.0% |
Occupancy by Household Size in Spokane
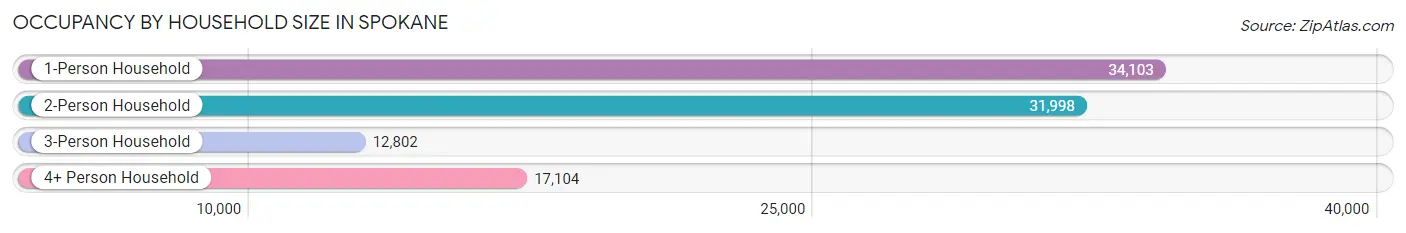
| Household Size | # Housing Units | % Housing Units |
| 1-Person Household | 34,103 | 35.5% |
| 2-Person Household | 31,998 | 33.3% |
| 3-Person Household | 12,802 | 13.3% |
| 4+ Person Household | 17,104 | 17.8% |
| Total Housing Units | 96,007 | 100.0% |
Occupancy by Ownership by Household Size in Spokane
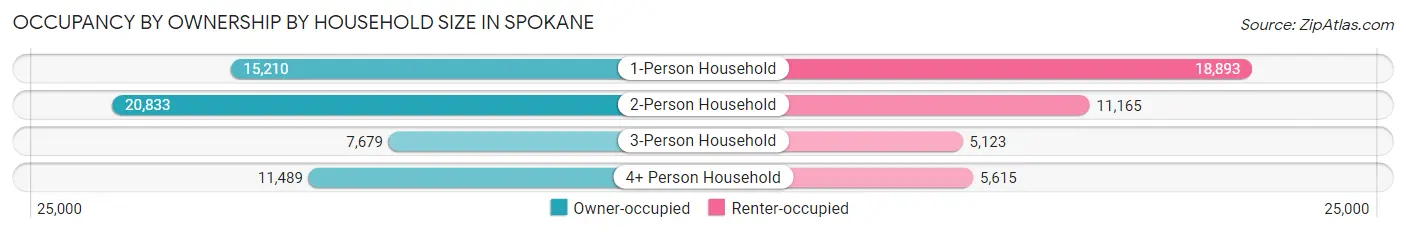
| Household Size | Owner-occupied | Renter-occupied |
| 1-Person Household | 15,210 (44.6%) | 18,893 (55.4%) |
| 2-Person Household | 20,833 (65.1%) | 11,165 (34.9%) |
| 3-Person Household | 7,679 (60.0%) | 5,123 (40.0%) |
| 4+ Person Household | 11,489 (67.2%) | 5,615 (32.8%) |
| Total Housing Units | 55,211 (57.5%) | 40,796 (42.5%) |
Occupancy by Educational Attainment in Spokane
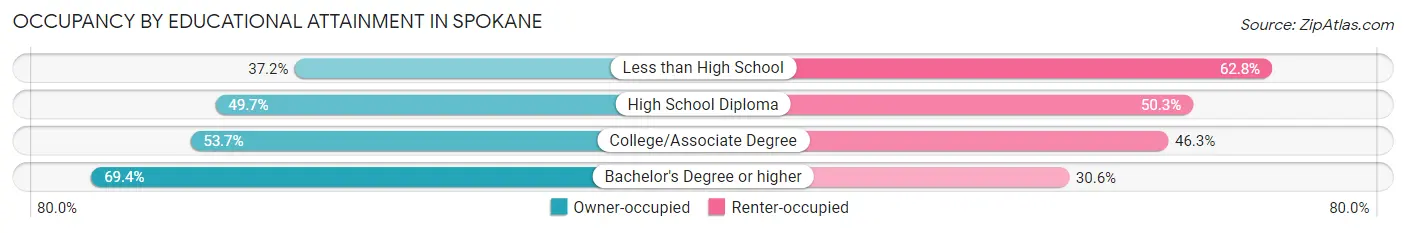
| Household Size | Owner-occupied | Renter-occupied |
| Less than High School | 1,896 (37.2%) | 3,197 (62.8%) |
| High School Diploma | 9,534 (49.7%) | 9,634 (50.3%) |
| College/Associate Degree | 20,609 (53.7%) | 17,764 (46.3%) |
| Bachelor's Degree or higher | 23,172 (69.4%) | 10,201 (30.6%) |
Occupancy by Age of Householder in Spokane
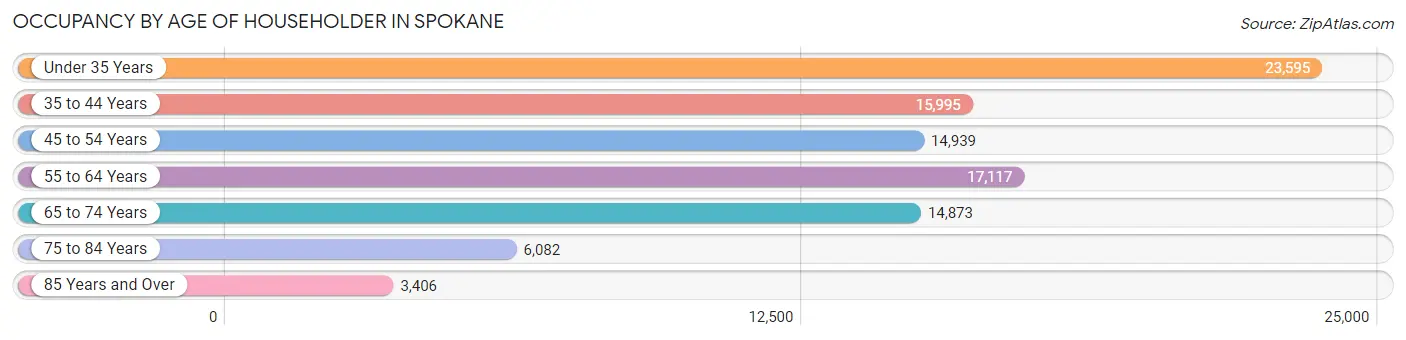
| Age Bracket | # Households | % Households |
| Under 35 Years | 23,595 | 24.6% |
| 35 to 44 Years | 15,995 | 16.7% |
| 45 to 54 Years | 14,939 | 15.6% |
| 55 to 64 Years | 17,117 | 17.8% |
| 65 to 74 Years | 14,873 | 15.5% |
| 75 to 84 Years | 6,082 | 6.3% |
| 85 Years and Over | 3,406 | 3.5% |
| Total | 96,007 | 100.0% |
Housing Finances in Spokane
Median Income by Occupancy in Spokane
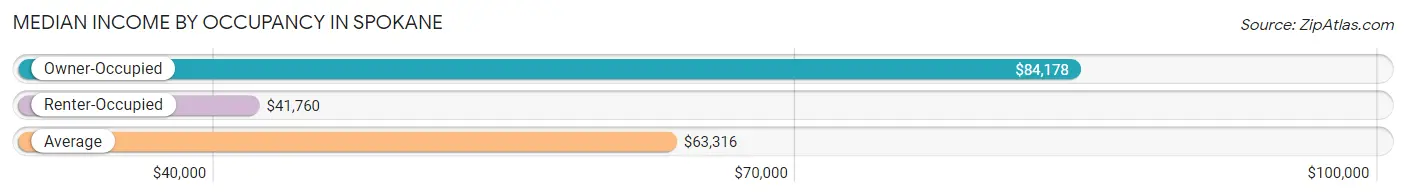
| Occupancy Type | # Households | Median Income |
| Owner-Occupied | 55,211 (57.5%) | $84,178 |
| Renter-Occupied | 40,796 (42.5%) | $41,760 |
| Average | 96,007 (100.0%) | $63,316 |
Occupancy by Householder Income Bracket in Spokane
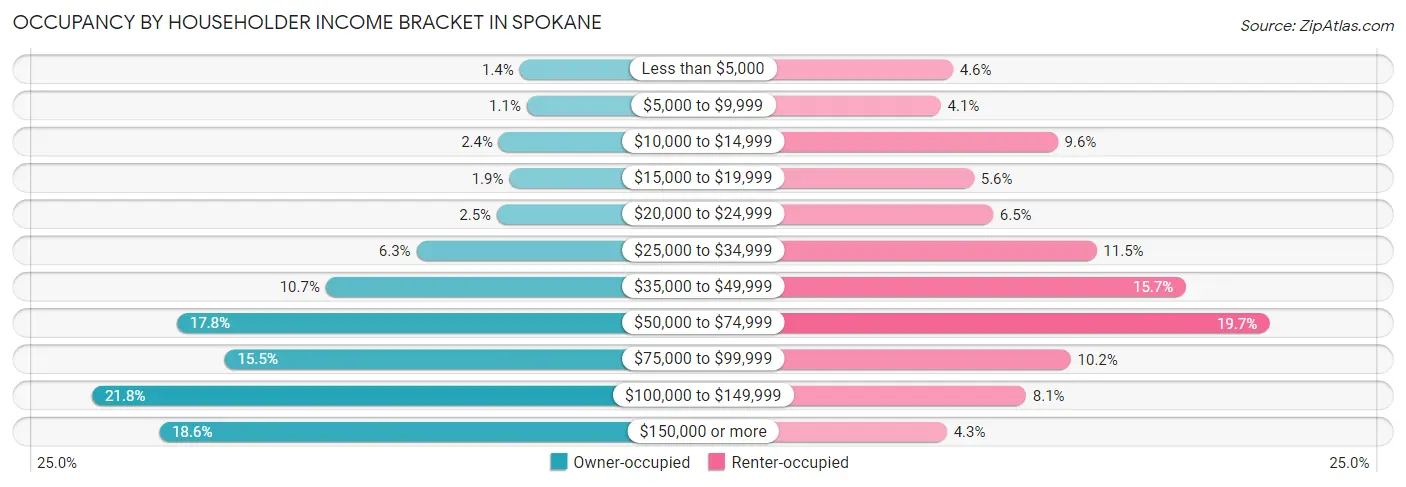
| Income Bracket | Owner-occupied | Renter-occupied |
| Less than $5,000 | 790 (1.4%) | 1,888 (4.6%) |
| $5,000 to $9,999 | 603 (1.1%) | 1,652 (4.1%) |
| $10,000 to $14,999 | 1,338 (2.4%) | 3,926 (9.6%) |
| $15,000 to $19,999 | 1,060 (1.9%) | 2,296 (5.6%) |
| $20,000 to $24,999 | 1,388 (2.5%) | 2,667 (6.5%) |
| $25,000 to $34,999 | 3,500 (6.3%) | 4,680 (11.5%) |
| $35,000 to $49,999 | 5,883 (10.7%) | 6,401 (15.7%) |
| $50,000 to $74,999 | 9,798 (17.7%) | 8,031 (19.7%) |
| $75,000 to $99,999 | 8,548 (15.5%) | 4,176 (10.2%) |
| $100,000 to $149,999 | 12,032 (21.8%) | 3,307 (8.1%) |
| $150,000 or more | 10,271 (18.6%) | 1,772 (4.3%) |
| Total | 55,211 (100.0%) | 40,796 (100.0%) |
Monthly Housing Cost Tiers in Spokane
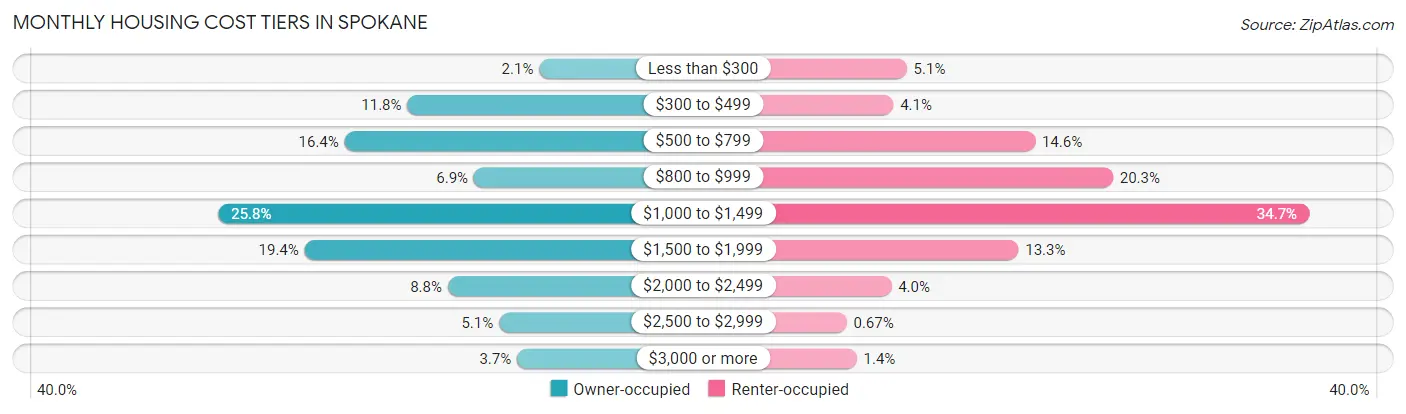
| Monthly Cost | Owner-occupied | Renter-occupied |
| Less than $300 | 1,159 (2.1%) | 2,079 (5.1%) |
| $300 to $499 | 6,518 (11.8%) | 1,676 (4.1%) |
| $500 to $799 | 9,070 (16.4%) | 5,936 (14.5%) |
| $800 to $999 | 3,813 (6.9%) | 8,274 (20.3%) |
| $1,000 to $1,499 | 14,219 (25.8%) | 14,165 (34.7%) |
| $1,500 to $1,999 | 10,701 (19.4%) | 5,433 (13.3%) |
| $2,000 to $2,499 | 4,875 (8.8%) | 1,617 (4.0%) |
| $2,500 to $2,999 | 2,796 (5.1%) | 274 (0.7%) |
| $3,000 or more | 2,060 (3.7%) | 574 (1.4%) |
| Total | 55,211 (100.0%) | 40,796 (100.0%) |
Physical Housing Characteristics in Spokane
Housing Structures in Spokane
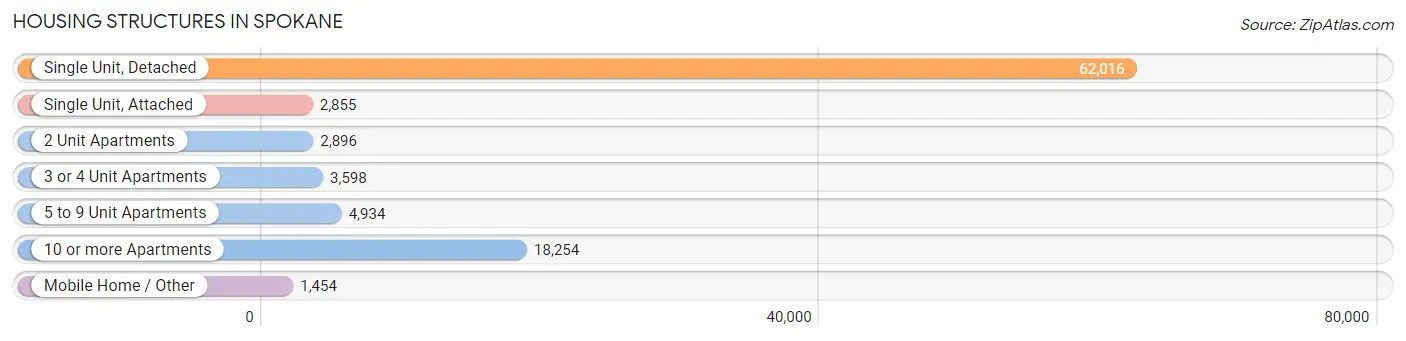
| Structure Type | # Housing Units | % Housing Units |
| Single Unit, Detached | 62,016 | 64.6% |
| Single Unit, Attached | 2,855 | 3.0% |
| 2 Unit Apartments | 2,896 | 3.0% |
| 3 or 4 Unit Apartments | 3,598 | 3.7% |
| 5 to 9 Unit Apartments | 4,934 | 5.1% |
| 10 or more Apartments | 18,254 | 19.0% |
| Mobile Home / Other | 1,454 | 1.5% |
| Total | 96,007 | 100.0% |
Housing Structures by Occupancy in Spokane
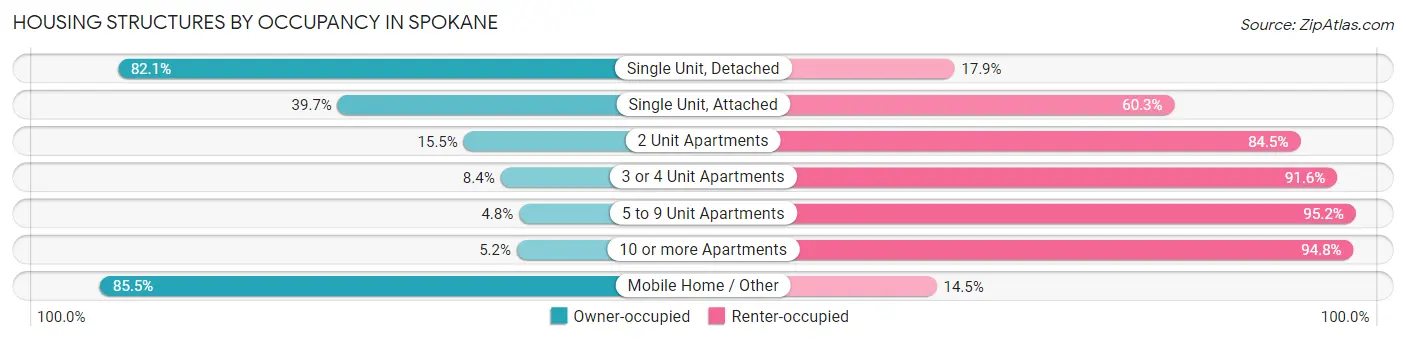
| Structure Type | Owner-occupied | Renter-occupied |
| Single Unit, Detached | 50,893 (82.1%) | 11,123 (17.9%) |
| Single Unit, Attached | 1,134 (39.7%) | 1,721 (60.3%) |
| 2 Unit Apartments | 448 (15.5%) | 2,448 (84.5%) |
| 3 or 4 Unit Apartments | 301 (8.4%) | 3,297 (91.6%) |
| 5 to 9 Unit Apartments | 237 (4.8%) | 4,697 (95.2%) |
| 10 or more Apartments | 955 (5.2%) | 17,299 (94.8%) |
| Mobile Home / Other | 1,243 (85.5%) | 211 (14.5%) |
| Total | 55,211 (57.5%) | 40,796 (42.5%) |
Housing Structures by Number of Rooms in Spokane
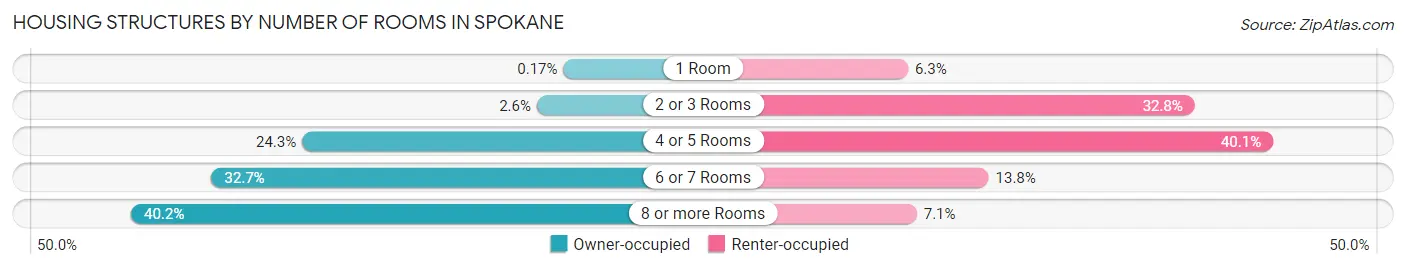
| Number of Rooms | Owner-occupied | Renter-occupied |
| 1 Room | 93 (0.2%) | 2,566 (6.3%) |
| 2 or 3 Rooms | 1,450 (2.6%) | 13,384 (32.8%) |
| 4 or 5 Rooms | 13,438 (24.3%) | 16,337 (40.1%) |
| 6 or 7 Rooms | 18,064 (32.7%) | 5,610 (13.8%) |
| 8 or more Rooms | 22,166 (40.2%) | 2,899 (7.1%) |
| Total | 55,211 (100.0%) | 40,796 (100.0%) |
Housing Structure by Heating Type in Spokane
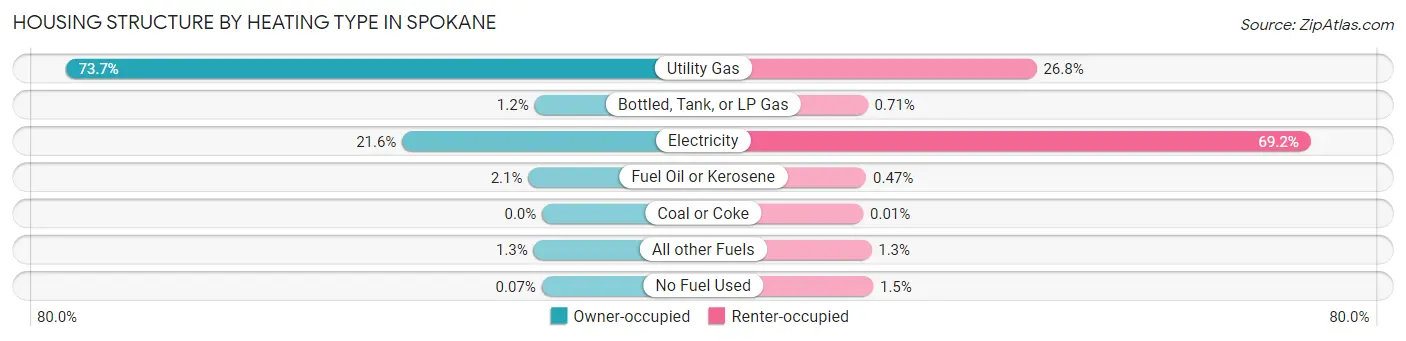
| Heating Type | Owner-occupied | Renter-occupied |
| Utility Gas | 40,681 (73.7%) | 10,939 (26.8%) |
| Bottled, Tank, or LP Gas | 653 (1.2%) | 288 (0.7%) |
| Electricity | 11,944 (21.6%) | 28,228 (69.2%) |
| Fuel Oil or Kerosene | 1,174 (2.1%) | 191 (0.5%) |
| Coal or Coke | 0 (0.0%) | 6 (0.0%) |
| All other Fuels | 723 (1.3%) | 517 (1.3%) |
| No Fuel Used | 36 (0.1%) | 627 (1.5%) |
| Total | 55,211 (100.0%) | 40,796 (100.0%) |
Household Vehicle Usage in Spokane
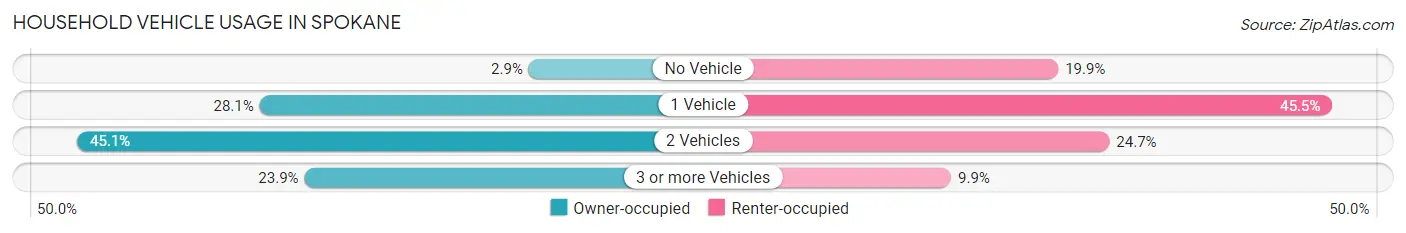
| Vehicles per Household | Owner-occupied | Renter-occupied |
| No Vehicle | 1,622 (2.9%) | 8,122 (19.9%) |
| 1 Vehicle | 15,495 (28.1%) | 18,557 (45.5%) |
| 2 Vehicles | 24,907 (45.1%) | 10,074 (24.7%) |
| 3 or more Vehicles | 13,187 (23.9%) | 4,043 (9.9%) |
| Total | 55,211 (100.0%) | 40,796 (100.0%) |
Real Estate & Mortgages in Spokane
Real Estate and Mortgage Overview in Spokane
| Characteristic | Without Mortgage | With Mortgage |
| Housing Units | 17,511 | 37,700 |
| Median Property Value | $271,300 | $294,000 |
| Median Household Income | $61,315 | $7,840 |
| Monthly Housing Costs | $547 | $2,002 |
| Real Estate Taxes | $2,472 | $997 |
Property Value by Mortgage Status in Spokane
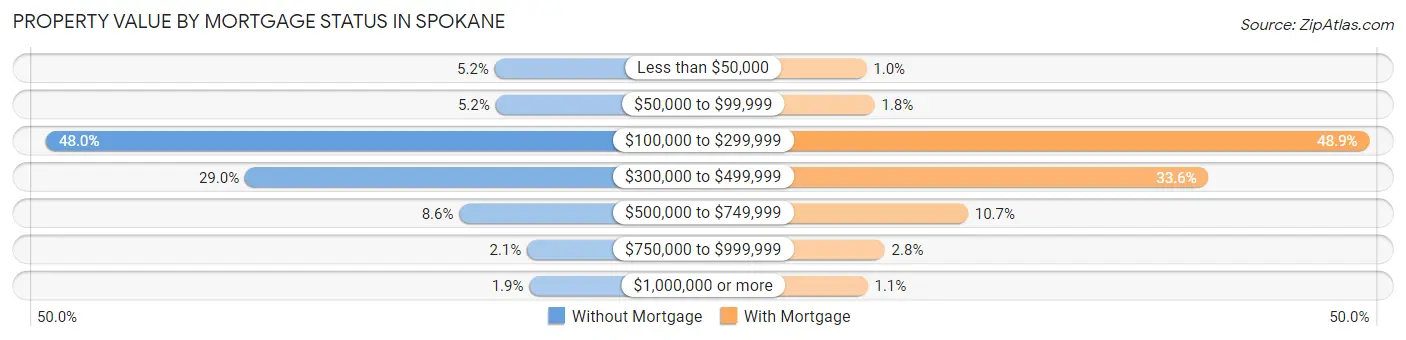
| Property Value | Without Mortgage | With Mortgage |
| Less than $50,000 | 915 (5.2%) | 387 (1.0%) |
| $50,000 to $99,999 | 901 (5.1%) | 681 (1.8%) |
| $100,000 to $299,999 | 8,397 (47.9%) | 18,450 (48.9%) |
| $300,000 to $499,999 | 5,080 (29.0%) | 12,676 (33.6%) |
| $500,000 to $749,999 | 1,506 (8.6%) | 4,030 (10.7%) |
| $750,000 to $999,999 | 374 (2.1%) | 1,045 (2.8%) |
| $1,000,000 or more | 338 (1.9%) | 431 (1.1%) |
| Total | 17,511 (100.0%) | 37,700 (100.0%) |
Household Income by Mortgage Status in Spokane
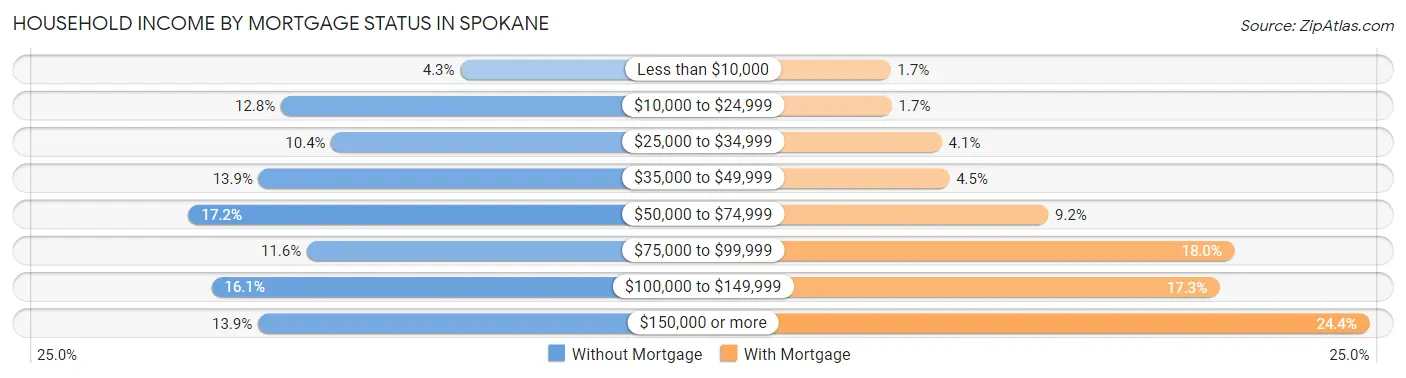
| Household Income | Without Mortgage | With Mortgage |
| Less than $10,000 | 744 (4.3%) | 626 (1.7%) |
| $10,000 to $24,999 | 2,240 (12.8%) | 649 (1.7%) |
| $25,000 to $34,999 | 1,820 (10.4%) | 1,546 (4.1%) |
| $35,000 to $49,999 | 2,425 (13.9%) | 1,680 (4.5%) |
| $50,000 to $74,999 | 3,010 (17.2%) | 3,458 (9.2%) |
| $75,000 to $99,999 | 2,022 (11.6%) | 6,788 (18.0%) |
| $100,000 to $149,999 | 2,819 (16.1%) | 6,526 (17.3%) |
| $150,000 or more | 2,431 (13.9%) | 9,213 (24.4%) |
| Total | 17,511 (100.0%) | 37,700 (100.0%) |
Property Value to Household Income Ratio in Spokane
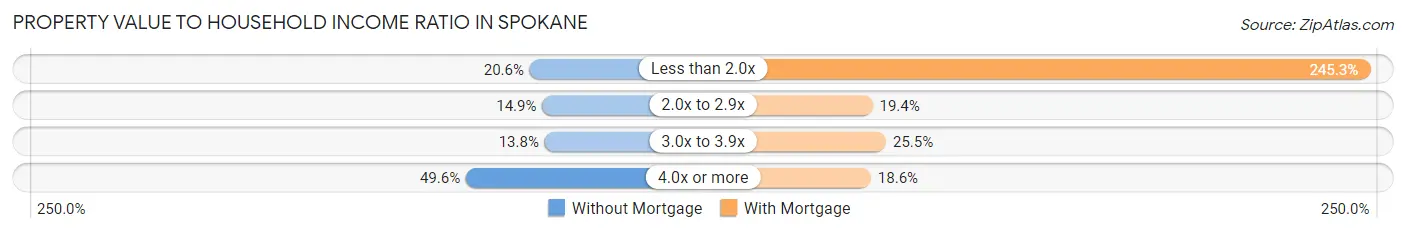
| Value-to-Income Ratio | Without Mortgage | With Mortgage |
| Less than 2.0x | 3,615 (20.6%) | 92,462 (245.3%) |
| 2.0x to 2.9x | 2,617 (14.9%) | 7,296 (19.4%) |
| 3.0x to 3.9x | 2,424 (13.8%) | 9,601 (25.5%) |
| 4.0x or more | 8,684 (49.6%) | 7,019 (18.6%) |
| Total | 17,511 (100.0%) | 37,700 (100.0%) |
Real Estate Taxes by Mortgage Status in Spokane
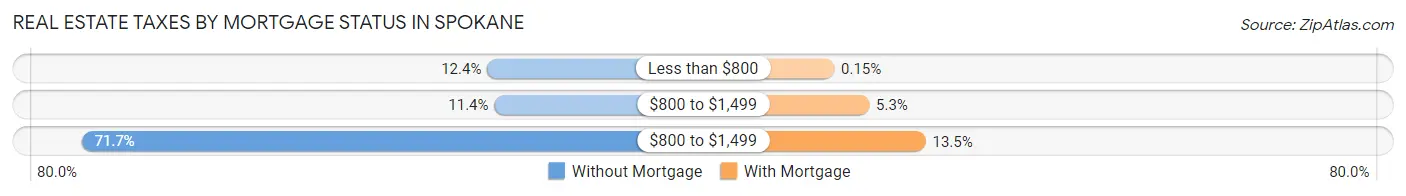
| Property Taxes | Without Mortgage | With Mortgage |
| Less than $800 | 2,172 (12.4%) | 58 (0.2%) |
| $800 to $1,499 | 1,990 (11.4%) | 1,987 (5.3%) |
| $800 to $1,499 | 12,554 (71.7%) | 5,096 (13.5%) |
| Total | 17,511 (100.0%) | 37,700 (100.0%) |
Health & Disability in Spokane
Health Insurance Coverage by Age in Spokane
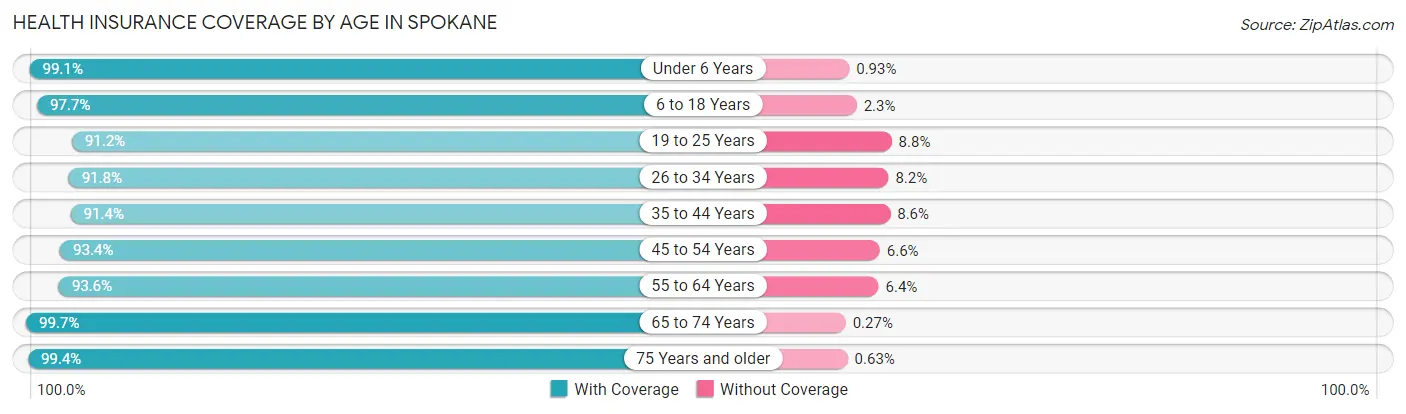
| Age Bracket | With Coverage | Without Coverage |
| Under 6 Years | 14,699 (99.1%) | 138 (0.9%) |
| 6 to 18 Years | 33,382 (97.7%) | 793 (2.3%) |
| 19 to 25 Years | 21,394 (91.2%) | 2,072 (8.8%) |
| 26 to 34 Years | 31,140 (91.8%) | 2,797 (8.2%) |
| 35 to 44 Years | 27,163 (91.4%) | 2,550 (8.6%) |
| 45 to 54 Years | 23,993 (93.4%) | 1,703 (6.6%) |
| 55 to 64 Years | 25,607 (93.6%) | 1,747 (6.4%) |
| 65 to 74 Years | 22,286 (99.7%) | 61 (0.3%) |
| 75 Years and older | 13,222 (99.4%) | 84 (0.6%) |
| Total | 212,886 (94.7%) | 11,945 (5.3%) |
Health Insurance Coverage by Citizenship Status in Spokane
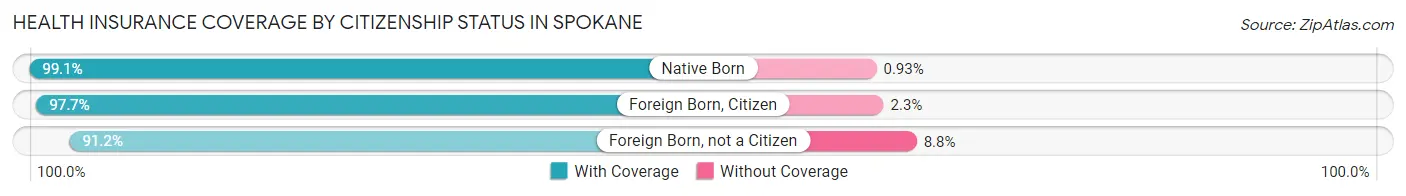
| Citizenship Status | With Coverage | Without Coverage |
| Native Born | 14,699 (99.1%) | 138 (0.9%) |
| Foreign Born, Citizen | 33,382 (97.7%) | 793 (2.3%) |
| Foreign Born, not a Citizen | 21,394 (91.2%) | 2,072 (8.8%) |
Health Insurance Coverage by Household Income in Spokane
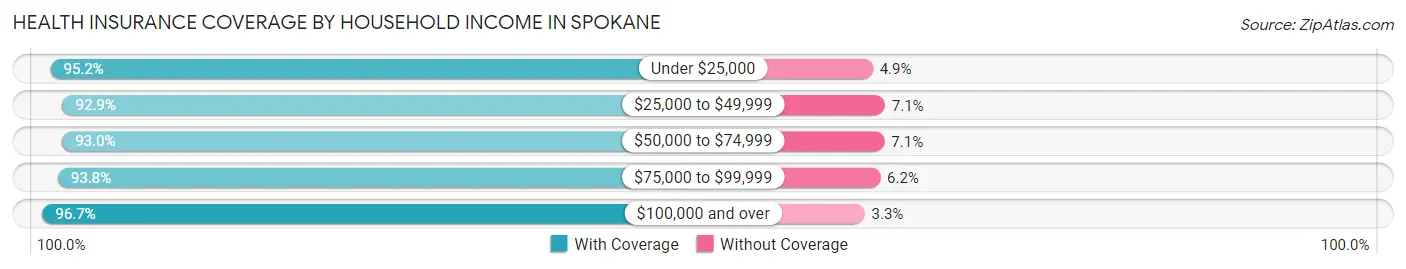
| Household Income | With Coverage | Without Coverage |
| Under $25,000 | 26,216 (95.2%) | 1,336 (4.9%) |
| $25,000 to $49,999 | 34,218 (92.9%) | 2,629 (7.1%) |
| $50,000 to $74,999 | 39,466 (92.9%) | 2,995 (7.0%) |
| $75,000 to $99,999 | 29,929 (93.8%) | 1,993 (6.2%) |
| $100,000 and over | 78,257 (96.7%) | 2,705 (3.3%) |
Public vs Private Health Insurance Coverage by Age in Spokane
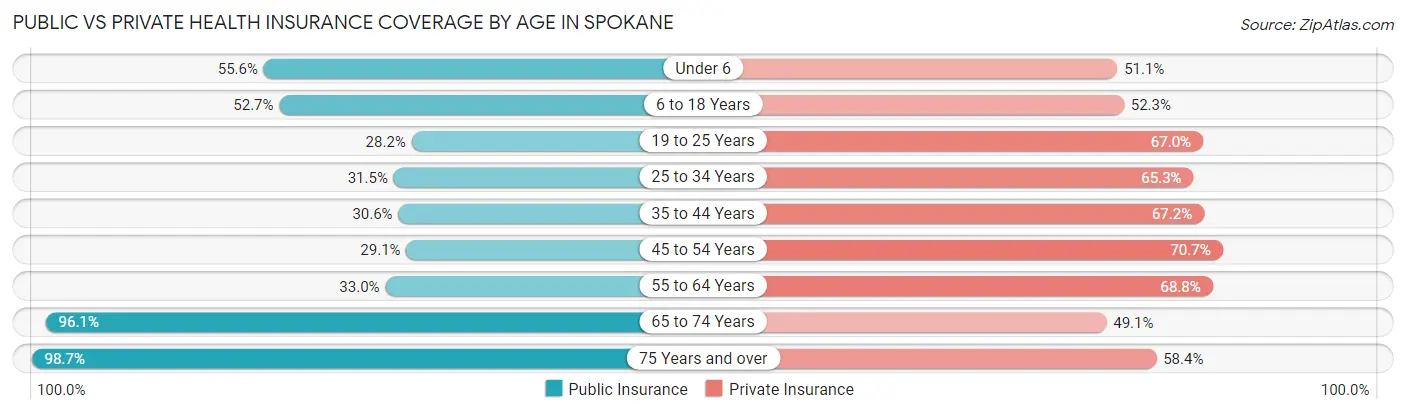
| Age Bracket | Public Insurance | Private Insurance |
| Under 6 | 8,250 (55.6%) | 7,584 (51.1%) |
| 6 to 18 Years | 18,012 (52.7%) | 17,888 (52.3%) |
| 19 to 25 Years | 6,608 (28.2%) | 15,727 (67.0%) |
| 25 to 34 Years | 10,683 (31.5%) | 22,146 (65.3%) |
| 35 to 44 Years | 9,096 (30.6%) | 19,974 (67.2%) |
| 45 to 54 Years | 7,484 (29.1%) | 18,154 (70.7%) |
| 55 to 64 Years | 9,035 (33.0%) | 18,825 (68.8%) |
| 65 to 74 Years | 21,474 (96.1%) | 10,973 (49.1%) |
| 75 Years and over | 13,133 (98.7%) | 7,765 (58.4%) |
| Total | 103,775 (46.2%) | 139,036 (61.8%) |
Disability Status by Sex by Age in Spokane
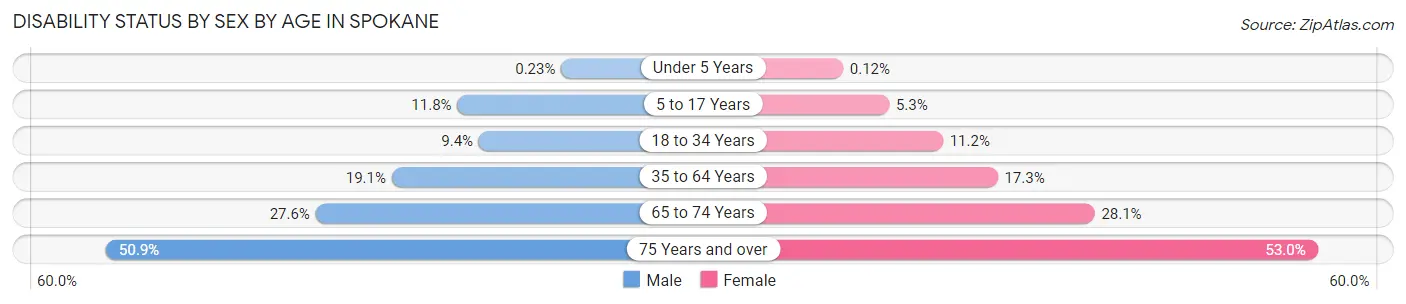
| Age Bracket | Male | Female |
| Under 5 Years | 15 (0.2%) | 7 (0.1%) |
| 5 to 17 Years | 2,038 (11.8%) | 883 (5.2%) |
| 18 to 34 Years | 2,880 (9.4%) | 3,330 (11.2%) |
| 35 to 64 Years | 7,911 (19.1%) | 7,171 (17.3%) |
| 65 to 74 Years | 2,974 (27.6%) | 3,254 (28.1%) |
| 75 Years and over | 2,595 (50.9%) | 4,351 (53.0%) |
Disability Class by Sex by Age in Spokane
Disability Class: Hearing Difficulty
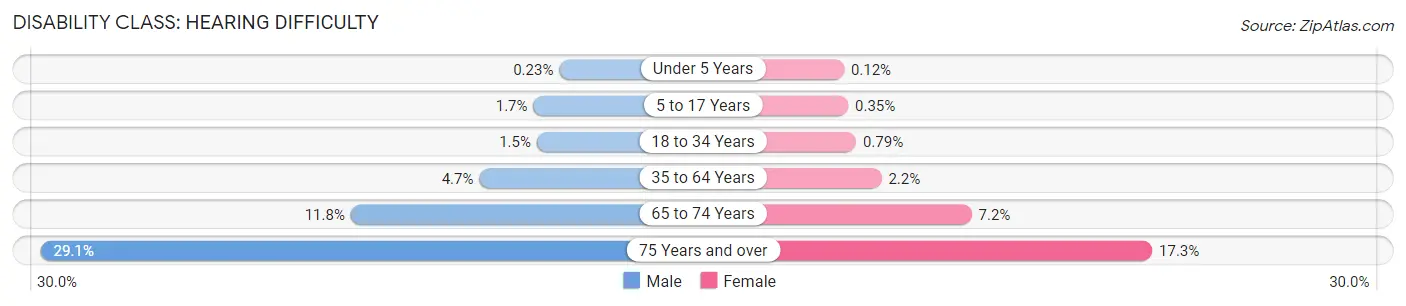
| Age Bracket | Male | Female |
| Under 5 Years | 15 (0.2%) | 7 (0.1%) |
| 5 to 17 Years | 288 (1.7%) | 59 (0.4%) |
| 18 to 34 Years | 453 (1.5%) | 235 (0.8%) |
| 35 to 64 Years | 1,938 (4.7%) | 915 (2.2%) |
| 65 to 74 Years | 1,277 (11.8%) | 836 (7.2%) |
| 75 Years and over | 1,483 (29.1%) | 1,419 (17.3%) |
Disability Class: Vision Difficulty
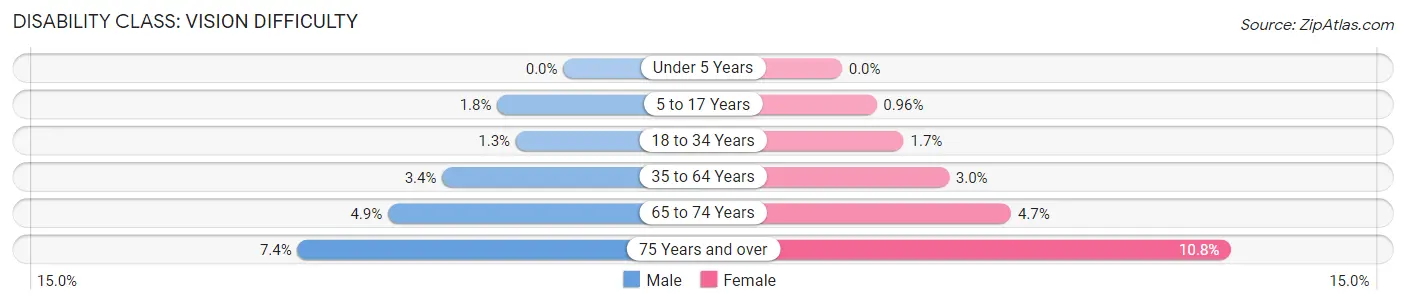
| Age Bracket | Male | Female |
| Under 5 Years | 0 (0.0%) | 0 (0.0%) |
| 5 to 17 Years | 318 (1.8%) | 162 (1.0%) |
| 18 to 34 Years | 403 (1.3%) | 510 (1.7%) |
| 35 to 64 Years | 1,396 (3.4%) | 1,234 (3.0%) |
| 65 to 74 Years | 526 (4.9%) | 545 (4.7%) |
| 75 Years and over | 377 (7.4%) | 890 (10.8%) |
Disability Class: Cognitive Difficulty
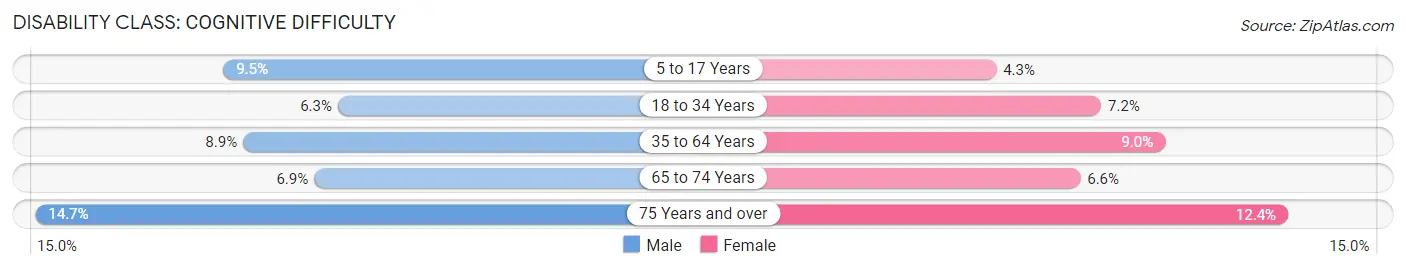
| Age Bracket | Male | Female |
| 5 to 17 Years | 1,635 (9.5%) | 723 (4.3%) |
| 18 to 34 Years | 1,924 (6.3%) | 2,140 (7.2%) |
| 35 to 64 Years | 3,693 (8.9%) | 3,722 (9.0%) |
| 65 to 74 Years | 748 (6.9%) | 768 (6.6%) |
| 75 Years and over | 749 (14.7%) | 1,020 (12.4%) |
Disability Class: Ambulatory Difficulty
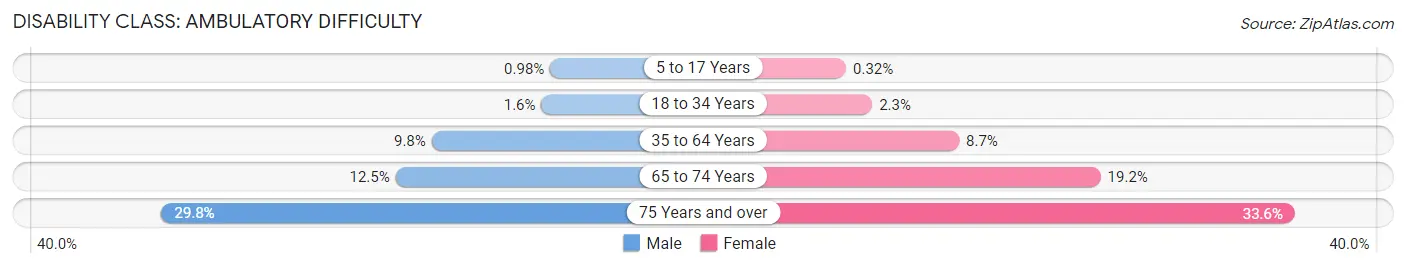
| Age Bracket | Male | Female |
| 5 to 17 Years | 170 (1.0%) | 54 (0.3%) |
| 18 to 34 Years | 499 (1.6%) | 671 (2.3%) |
| 35 to 64 Years | 4,047 (9.8%) | 3,604 (8.7%) |
| 65 to 74 Years | 1,344 (12.5%) | 2,222 (19.2%) |
| 75 Years and over | 1,520 (29.8%) | 2,762 (33.6%) |
Disability Class: Self-Care Difficulty
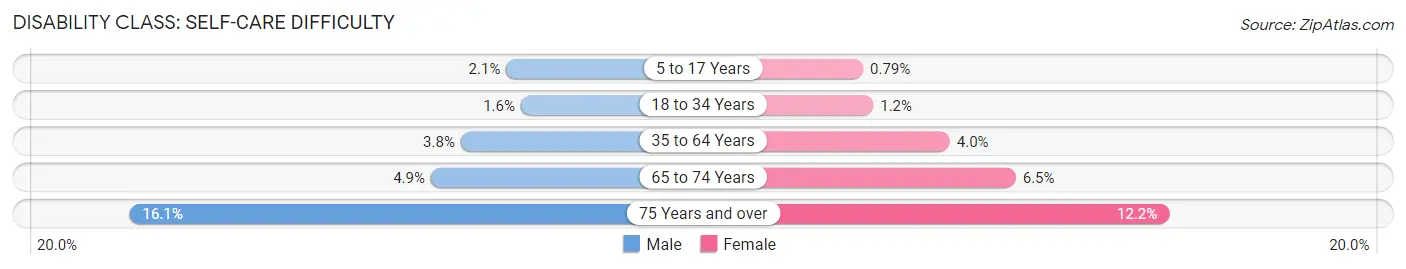
| Age Bracket | Male | Female |
| 5 to 17 Years | 366 (2.1%) | 133 (0.8%) |
| 18 to 34 Years | 484 (1.6%) | 348 (1.2%) |
| 35 to 64 Years | 1,579 (3.8%) | 1,660 (4.0%) |
| 65 to 74 Years | 531 (4.9%) | 747 (6.5%) |
| 75 Years and over | 820 (16.1%) | 998 (12.1%) |
Technology Access in Spokane
Computing Device Access in Spokane
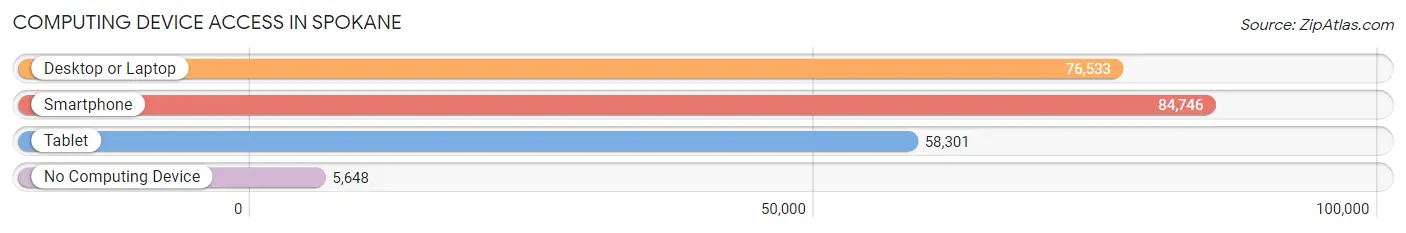
| Device Type | # Households | % Households |
| Desktop or Laptop | 76,533 | 79.7% |
| Smartphone | 84,746 | 88.3% |
| Tablet | 58,301 | 60.7% |
| No Computing Device | 5,648 | 5.9% |
| Total | 96,007 | 100.0% |
Internet Access in Spokane
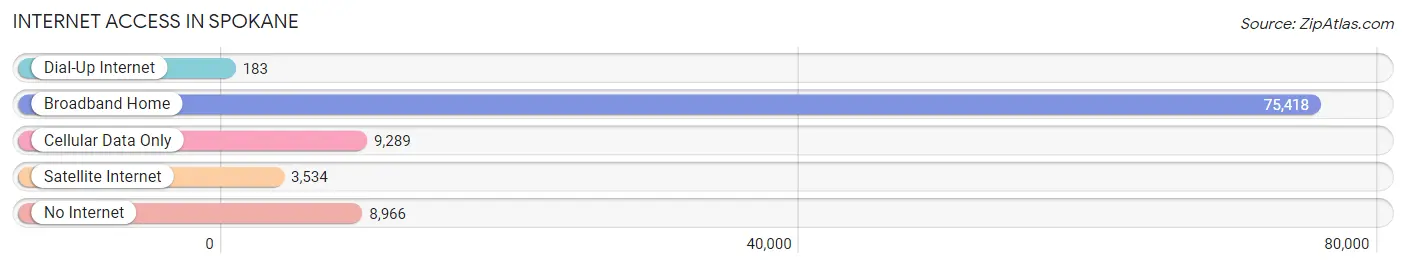
| Internet Type | # Households | % Households |
| Dial-Up Internet | 183 | 0.2% |
| Broadband Home | 75,418 | 78.5% |
| Cellular Data Only | 9,289 | 9.7% |
| Satellite Internet | 3,534 | 3.7% |
| No Internet | 8,966 | 9.3% |
| Total | 96,007 | 100.0% |
Spokane Summary
Spokane, Washington is a city located in the eastern part of the state, in the Inland Northwest region. It is the second-largest city in the state, with a population of over 210,000 people. Spokane is the county seat of Spokane County, and is the economic and cultural center of the region.
History
The Spokane area has been inhabited by Native Americans for thousands of years. The Spokane Tribe, a branch of the Salish-speaking people, were the first to settle in the area. The tribe was known for its fishing and trading, and the Spokane River was an important part of their culture.
In 1810, the first European settlers arrived in the area, led by fur trader and explorer David Thompson. The settlement was named Spokane House, and it was the first permanent white settlement in the area. The settlement was a trading post for the Hudson's Bay Company, and it was a major hub for the fur trade.
In 1881, the Northern Pacific Railroad arrived in the area, and the city of Spokane was officially incorporated in 1881. The city quickly grew, and by the early 1900s, it was the largest city in the state. The city was a major hub for the mining, timber, and railroad industries, and it was also a major center for the arts and culture.
Geography
Spokane is located in the eastern part of Washington, in the Inland Northwest region. It is situated on the Spokane River, near the Idaho border. The city is surrounded by mountains, including the Selkirk Mountains to the north, the Blue Mountains to the east, and the Cascade Mountains to the west.
The city has a total area of 58.7 square miles, of which 57.7 square miles is land and 1.0 square mile is water. The city has a humid continental climate, with cold winters and hot summers.
Economy
Spokane is the economic and cultural center of the Inland Northwest region. The city is home to a variety of industries, including healthcare, manufacturing, technology, and tourism.
The city is home to several major employers, including Providence Health & Services, Kaiser Permanente, and the Spokane Public Schools. The city is also home to several major universities, including Gonzaga University, Whitworth University, and Eastern Washington University.
The city is also a major tourist destination, with attractions such as Riverfront Park, the Spokane Falls, and the Spokane Convention Center. The city is also home to several major events, including Hoopfest, Bloomsday, and the Lilac Festival.
Demographics
As of the 2010 census, the population of Spokane was 210,721. The city has a population density of 3,611 people per square mile. The racial makeup of the city is 79.2% White, 5.3% African American, 1.7% Native American, 4.2% Asian, 0.2% Pacific Islander, 5.3% from other races, and 4.1% from two or more races.
The median household income in Spokane is $45,837, and the median family income is $54,817. The per capita income in the city is $25,837. The city has a poverty rate of 17.2%.
Conclusion
Spokane, Washington is a city located in the eastern part of the state, in the Inland Northwest region. It is the second-largest city in the state, with a population of over 210,000 people. Spokane is the county seat of Spokane County, and is the economic and cultural center of the region. The city has a long history, and it is home to a variety of industries, including healthcare, manufacturing, technology, and tourism. The city is also a major tourist destination, with attractions such as Riverfront Park, the Spokane Falls, and the Spokane Convention Center. The population of Spokane is diverse, with a median household income of $45,837 and a poverty rate of 17.2%. Spokane is a vibrant city with a rich history and a bright future.
Common Questions
What is Per Capita Income in Spokane?
Per Capita income in Spokane is $36,513.
What is the Median Family Income in Spokane?
Median Family Income in Spokane is $82,941.
What is the Median Household income in Spokane?
Median Household Income in Spokane is $63,316.
What is Income or Wage Gap in Spokane?
Income or Wage Gap in Spokane is 16.5%.
Women in Spokane earn 83.5 cents for every dollar earned by a man.
What is Family Income Deficit in Spokane?
Family Income Deficit in Spokane is $10,757.
Families that are below poverty line in Spokane earn $10,757 less on average than the poverty threshold level.
What is Inequality or Gini Index in Spokane?
Inequality or Gini Index in Spokane is 0.46.
What is the Total Population of Spokane?
Total Population of Spokane is 227,922.
What is the Total Male Population of Spokane?
Total Male Population of Spokane is 113,640.
What is the Total Female Population of Spokane?
Total Female Population of Spokane is 114,282.
What is the Ratio of Males per 100 Females in Spokane?
There are 99.44 Males per 100 Females in Spokane.
What is the Ratio of Females per 100 Males in Spokane?
There are 100.56 Females per 100 Males in Spokane.
What is the Median Population Age in Spokane?
Median Population Age in Spokane is 37.0 Years.
What is the Average Family Size in Spokane
Average Family Size in Spokane is 3.0 People.
What is the Average Household Size in Spokane
Average Household Size in Spokane is 2.3 People.
How Large is the Labor Force in Spokane?
There are 116,633 People in the Labor Forcein in Spokane.
What is the Percentage of People in the Labor Force in Spokane?
62.6% of People are in the Labor Force in Spokane.
What is the Unemployment Rate in Spokane?
Unemployment Rate in Spokane is 6.2%.