Cathcart, WA Map & Demographics
Cathcart Map
Cathcart Overview
$57,742
PER CAPITA INCOME
$144,618
AVG FAMILY INCOME
$121,856
AVG HOUSEHOLD INCOME
48.4%
WAGE / INCOME GAP [ % ]
51.6¢/ $1
WAGE / INCOME GAP [ $ ]
0.37
INEQUALITY / GINI INDEX
2,105
TOTAL POPULATION
1,083
MALE POPULATION
1,022
FEMALE POPULATION
105.97
MALES / 100 FEMALES
94.37
FEMALES / 100 MALES
45.4
MEDIAN AGE
3.1
AVG FAMILY SIZE
2.6
AVG HOUSEHOLD SIZE
1,058
LABOR FORCE [ PEOPLE ]
57.6%
PERCENT IN LABOR FORCE
1.0%
UNEMPLOYMENT RATE
Income in Cathcart
Income Overview in Cathcart
Per Capita Income in Cathcart is $57,742, while median incomes of families and households are $144,618 and $121,856 respectively.
| Characteristic | Number | Measure |
| Per Capita Income | 2,105 | $57,742 |
| Median Family Income | 563 | $144,618 |
| Mean Family Income | 563 | $171,220 |
| Median Household Income | 819 | $121,856 |
| Mean Household Income | 819 | $145,289 |
| Income Deficit | 563 | $0 |
| Wage / Income Gap (%) | 2,105 | 48.43% |
| Wage / Income Gap ($) | 2,105 | 51.57¢ per $1 |
| Gini / Inequality Index | 2,105 | 0.37 |
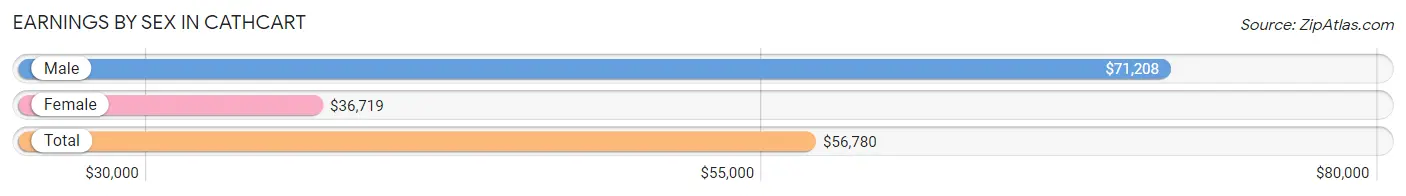
Earnings by Sex in Cathcart
Average Earnings in Cathcart are $56,780, $71,208 for men and $36,719 for women, a difference of 48.4%.
| Sex | Number | Average Earnings |
| Male | 569 (50.6%) | $71,208 |
| Female | 556 (49.4%) | $36,719 |
| Total | 1,125 (100.0%) | $56,780 |
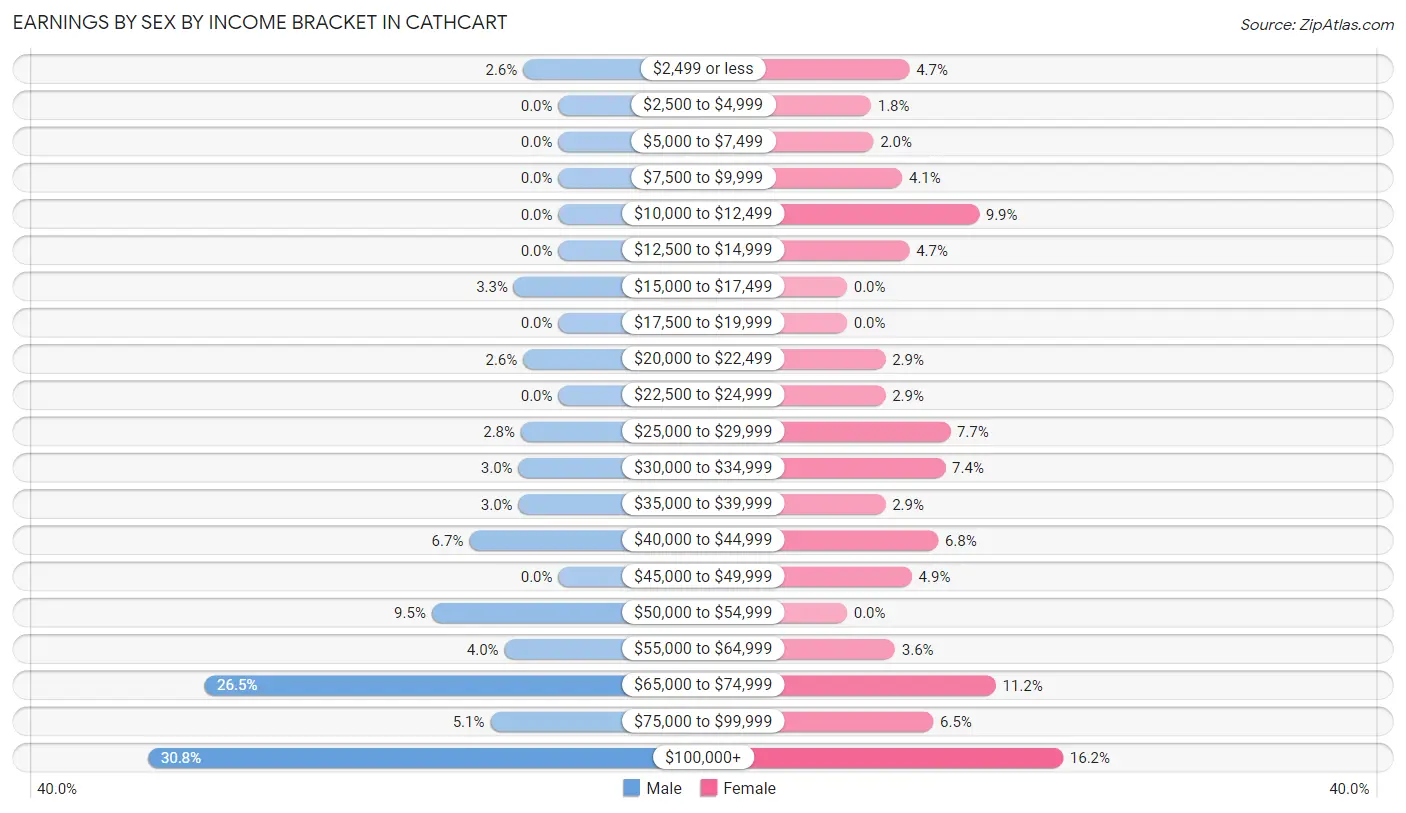
Earnings by Sex by Income Bracket in Cathcart
The most common earnings brackets in Cathcart are $100,000+ for men (175 | 30.8%) and $100,000+ for women (90 | 16.2%).
| Income | Male | Female |
| $2,499 or less | 15 (2.6%) | 26 (4.7%) |
| $2,500 to $4,999 | 0 (0.0%) | 10 (1.8%) |
| $5,000 to $7,499 | 0 (0.0%) | 11 (2.0%) |
| $7,500 to $9,999 | 0 (0.0%) | 23 (4.1%) |
| $10,000 to $12,499 | 0 (0.0%) | 55 (9.9%) |
| $12,500 to $14,999 | 0 (0.0%) | 26 (4.7%) |
| $15,000 to $17,499 | 19 (3.3%) | 0 (0.0%) |
| $17,500 to $19,999 | 0 (0.0%) | 0 (0.0%) |
| $20,000 to $22,499 | 15 (2.6%) | 16 (2.9%) |
| $22,500 to $24,999 | 0 (0.0%) | 16 (2.9%) |
| $25,000 to $29,999 | 16 (2.8%) | 43 (7.7%) |
| $30,000 to $34,999 | 17 (3.0%) | 41 (7.4%) |
| $35,000 to $39,999 | 17 (3.0%) | 16 (2.9%) |
| $40,000 to $44,999 | 38 (6.7%) | 38 (6.8%) |
| $45,000 to $49,999 | 0 (0.0%) | 27 (4.9%) |
| $50,000 to $54,999 | 54 (9.5%) | 0 (0.0%) |
| $55,000 to $64,999 | 23 (4.0%) | 20 (3.6%) |
| $65,000 to $74,999 | 151 (26.5%) | 62 (11.2%) |
| $75,000 to $99,999 | 29 (5.1%) | 36 (6.5%) |
| $100,000+ | 175 (30.8%) | 90 (16.2%) |
| Total | 569 (100.0%) | 556 (100.0%) |
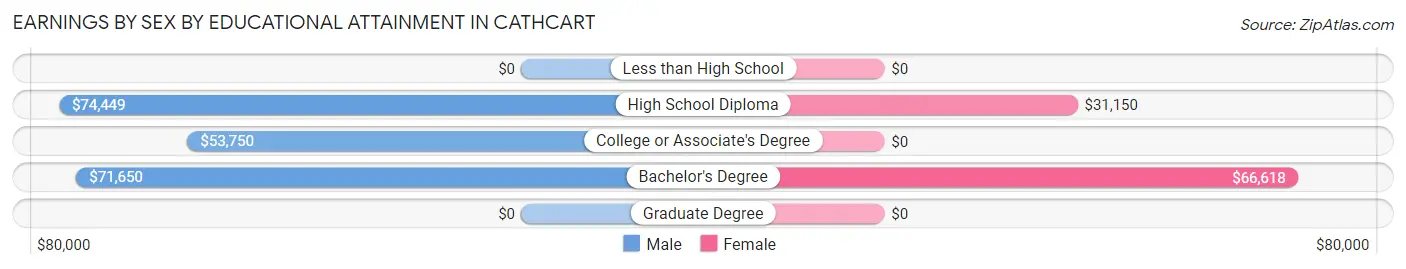
Earnings by Sex by Educational Attainment in Cathcart
Average earnings in Cathcart are $71,222 for men and $43,882 for women, a difference of 38.4%. Men with an educational attainment of high school diploma enjoy the highest average annual earnings of $74,449, while those with college or associate's degree education earn the least with $53,750. Women with an educational attainment of bachelor's degree earn the most with the average annual earnings of $66,618, while those with high school diploma education have the smallest earnings of $31,150.
| Educational Attainment | Male Income | Female Income |
| Less than High School | - | - |
| High School Diploma | $74,449 | $31,150 |
| College or Associate's Degree | $53,750 | $0 |
| Bachelor's Degree | $71,650 | $66,618 |
| Graduate Degree | - | - |
| Total | $71,222 | $43,882 |
Family Income in Cathcart
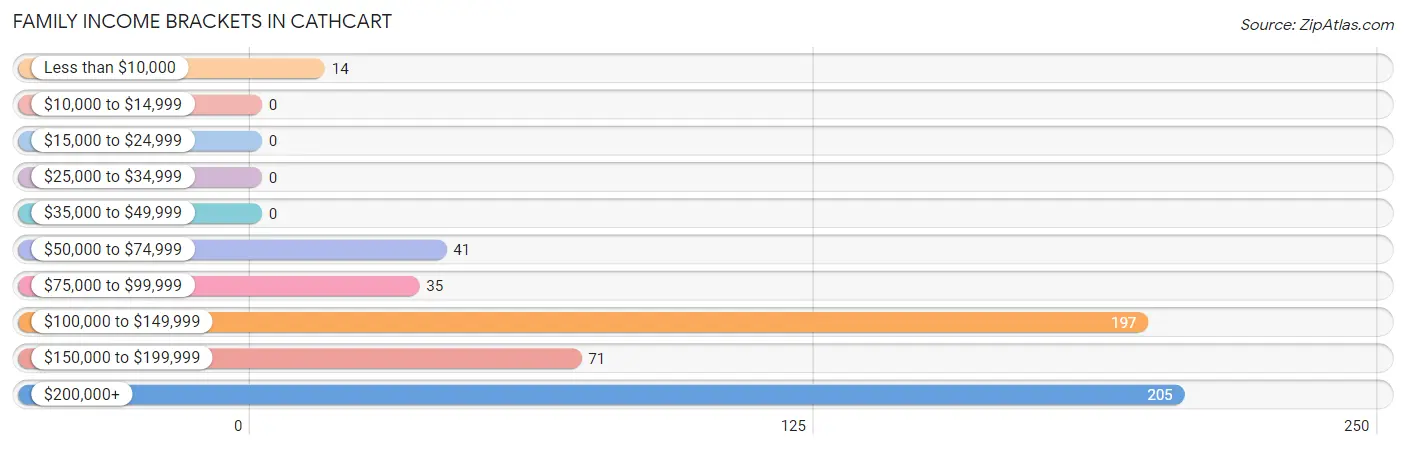
Family Income Brackets in Cathcart
According to the Cathcart family income data, there are 205 families falling into the $200,000+ income range, which is the most common income bracket and makes up 36.4% of all families.
| Income Bracket | # Families | % Families |
| Less than $10,000 | 14 | 2.5% |
| $10,000 to $14,999 | 0 | 0.0% |
| $15,000 to $24,999 | 0 | 0.0% |
| $25,000 to $34,999 | 0 | 0.0% |
| $35,000 to $49,999 | 0 | 0.0% |
| $50,000 to $74,999 | 41 | 7.3% |
| $75,000 to $99,999 | 35 | 6.2% |
| $100,000 to $149,999 | 197 | 35.0% |
| $150,000 to $199,999 | 71 | 12.6% |
| $200,000+ | 205 | 36.4% |
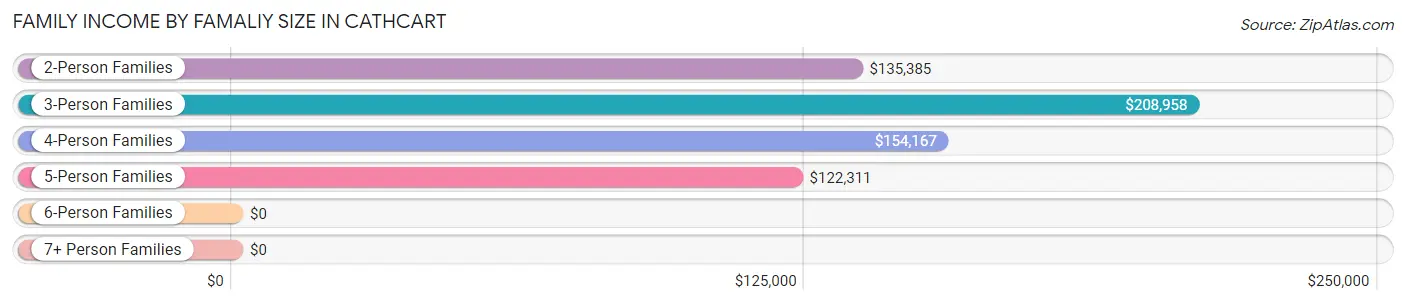
Family Income by Famaliy Size in Cathcart
3-person families (128 | 22.7%) account for the highest median family income in Cathcart with $208,958 per family, while 3-person families (128 | 22.7%) have the highest median income of $69,653 per family member.
| Income Bracket | # Families | Median Income |
| 2-Person Families | 272 (48.3%) | $135,385 |
| 3-Person Families | 128 (22.7%) | $208,958 |
| 4-Person Families | 72 (12.8%) | $154,167 |
| 5-Person Families | 61 (10.8%) | $122,311 |
| 6-Person Families | 0 (0.0%) | $0 |
| 7+ Person Families | 30 (5.3%) | $0 |
| Total | 563 (100.0%) | $144,618 |
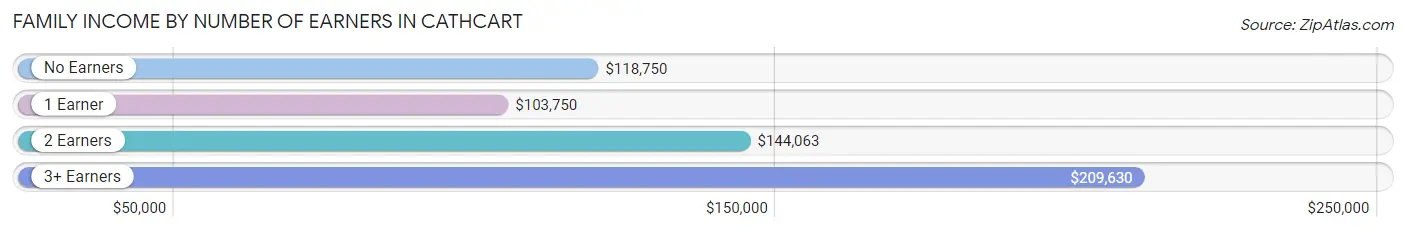
Family Income by Number of Earners in Cathcart
The median family income in Cathcart is $144,618, with families comprising 3+ earners (78) having the highest median family income of $209,630, while families with 1 earner (166) have the lowest median family income of $103,750, accounting for 13.9% and 29.5% of families, respectively.
| Number of Earners | # Families | Median Income |
| No Earners | 112 (19.9%) | $118,750 |
| 1 Earner | 166 (29.5%) | $103,750 |
| 2 Earners | 207 (36.8%) | $144,063 |
| 3+ Earners | 78 (13.9%) | $209,630 |
| Total | 563 (100.0%) | $144,618 |
Household Income in Cathcart
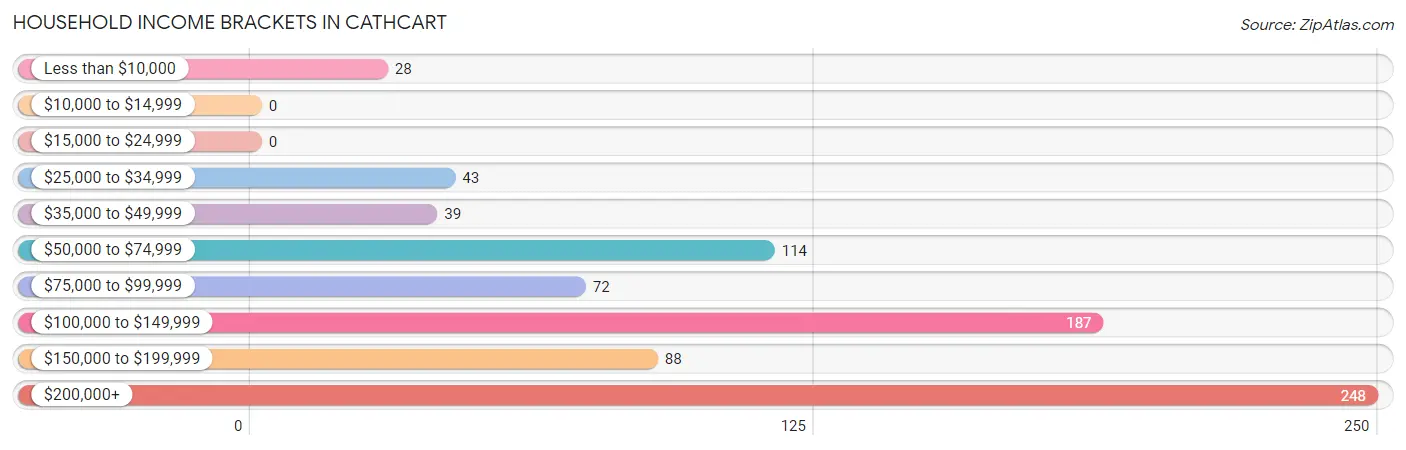
Household Income Brackets in Cathcart
With 248 households falling in the category, the $200,000+ income range is the most frequent in Cathcart, accounting for 30.3% of all households.
| Income Bracket | # Households | % Households |
| Less than $10,000 | 28 | 3.4% |
| $10,000 to $14,999 | 0 | 0.0% |
| $15,000 to $24,999 | 0 | 0.0% |
| $25,000 to $34,999 | 43 | 5.3% |
| $35,000 to $49,999 | 39 | 4.8% |
| $50,000 to $74,999 | 114 | 13.9% |
| $75,000 to $99,999 | 72 | 8.8% |
| $100,000 to $149,999 | 187 | 22.8% |
| $150,000 to $199,999 | 88 | 10.7% |
| $200,000+ | 248 | 30.3% |
Household Income by Householder Age in Cathcart
The median household income in Cathcart is $121,856, with the highest median household income of $163,897 found in the 45 to 64 years age bracket for the primary householder. A total of 297 households (36.3%) fall into this category. Meanwhile, the 15 to 24 years age bracket for the primary householder has the lowest median household income of $0, with 58 households (7.1%) in this group.
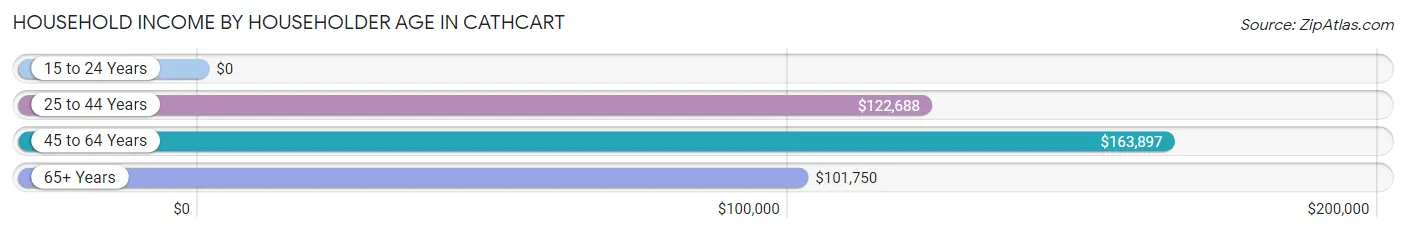
| Income Bracket | # Households | Median Income |
| 15 to 24 Years | 58 (7.1%) | $0 |
| 25 to 44 Years | 195 (23.8%) | $122,688 |
| 45 to 64 Years | 297 (36.3%) | $163,897 |
| 65+ Years | 269 (32.8%) | $101,750 |
| Total | 819 (100.0%) | $121,856 |
Poverty in Cathcart
Income Below Poverty by Sex and Age in Cathcart
With 1.3% poverty level for males and 2.7% for females among the residents of Cathcart, 55 to 64 year old males and 25 to 34 year old females are the most vulnerable to poverty, with 14 males (5.9%) and 14 females (7.9%) in their respective age groups living below the poverty level.
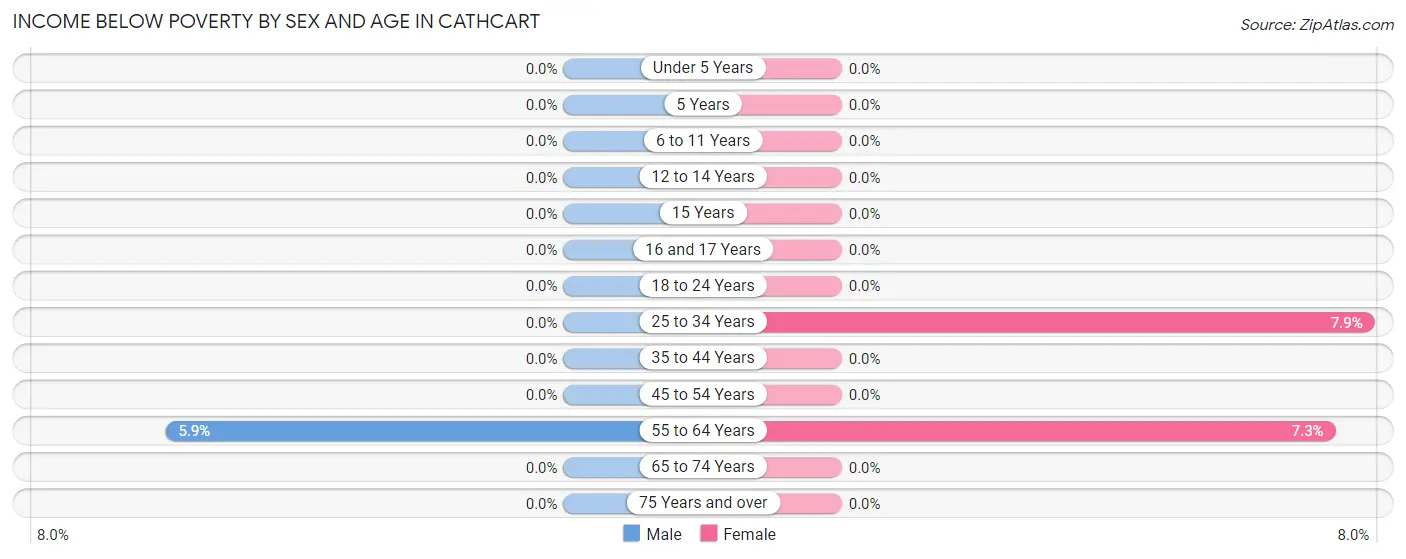
| Age Bracket | Male | Female |
| Under 5 Years | 0 (0.0%) | 0 (0.0%) |
| 5 Years | 0 (0.0%) | 0 (0.0%) |
| 6 to 11 Years | 0 (0.0%) | 0 (0.0%) |
| 12 to 14 Years | 0 (0.0%) | 0 (0.0%) |
| 15 Years | 0 (0.0%) | 0 (0.0%) |
| 16 and 17 Years | 0 (0.0%) | 0 (0.0%) |
| 18 to 24 Years | 0 (0.0%) | 0 (0.0%) |
| 25 to 34 Years | 0 (0.0%) | 14 (7.9%) |
| 35 to 44 Years | 0 (0.0%) | 0 (0.0%) |
| 45 to 54 Years | 0 (0.0%) | 0 (0.0%) |
| 55 to 64 Years | 14 (5.9%) | 14 (7.3%) |
| 65 to 74 Years | 0 (0.0%) | 0 (0.0%) |
| 75 Years and over | 0 (0.0%) | 0 (0.0%) |
| Total | 14 (1.3%) | 28 (2.7%) |
Income Above Poverty by Sex and Age in Cathcart
According to the poverty statistics in Cathcart, males aged under 5 years and females aged under 5 years are the age groups that are most secure financially, with 100.0% of males and 100.0% of females in these age groups living above the poverty line.
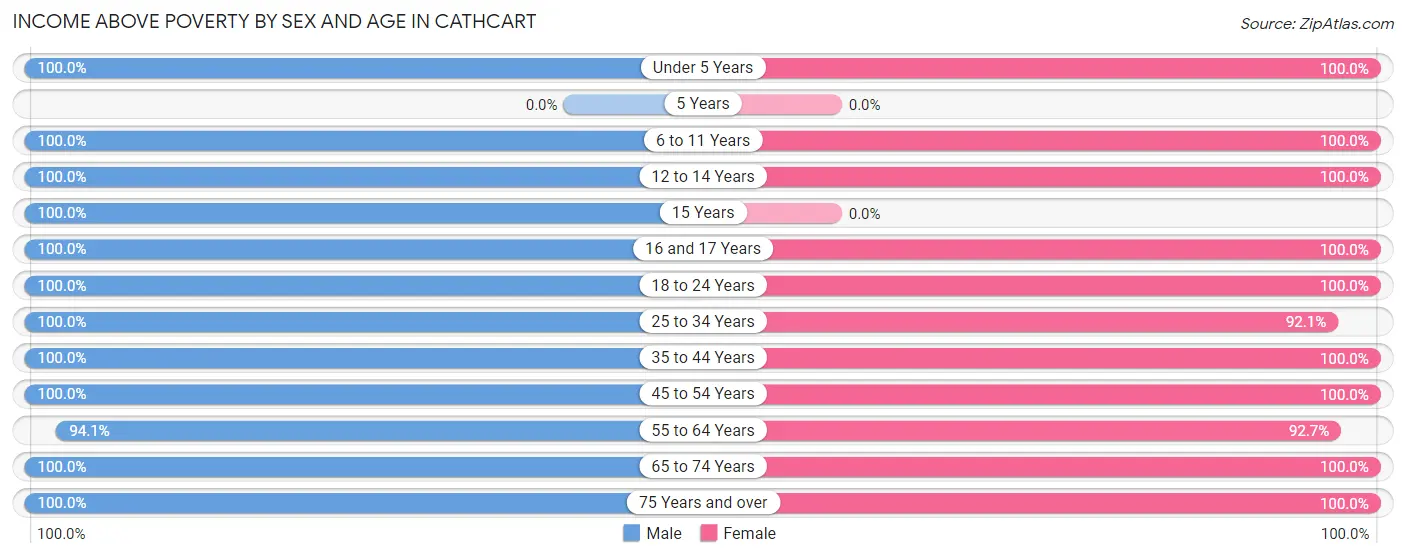
| Age Bracket | Male | Female |
| Under 5 Years | 101 (100.0%) | 31 (100.0%) |
| 5 Years | 0 (0.0%) | 0 (0.0%) |
| 6 to 11 Years | 9 (100.0%) | 76 (100.0%) |
| 12 to 14 Years | 13 (100.0%) | 29 (100.0%) |
| 15 Years | 10 (100.0%) | 0 (0.0%) |
| 16 and 17 Years | 61 (100.0%) | 13 (100.0%) |
| 18 to 24 Years | 61 (100.0%) | 69 (100.0%) |
| 25 to 34 Years | 240 (100.0%) | 163 (92.1%) |
| 35 to 44 Years | 89 (100.0%) | 56 (100.0%) |
| 45 to 54 Years | 86 (100.0%) | 148 (100.0%) |
| 55 to 64 Years | 223 (94.1%) | 177 (92.7%) |
| 65 to 74 Years | 111 (100.0%) | 156 (100.0%) |
| 75 Years and over | 65 (100.0%) | 76 (100.0%) |
| Total | 1,069 (98.7%) | 994 (97.3%) |
Income Below Poverty Among Married-Couple Families in Cathcart
The poverty statistics for married-couple families in Cathcart show that 2.7% or 14 of the total 511 families live below the poverty line. Families with no children have the highest poverty rate of 4.3%, comprising of 14 families. On the other hand, families with 1 or 2 children have the lowest poverty rate of 0.0%, which includes 0 families.
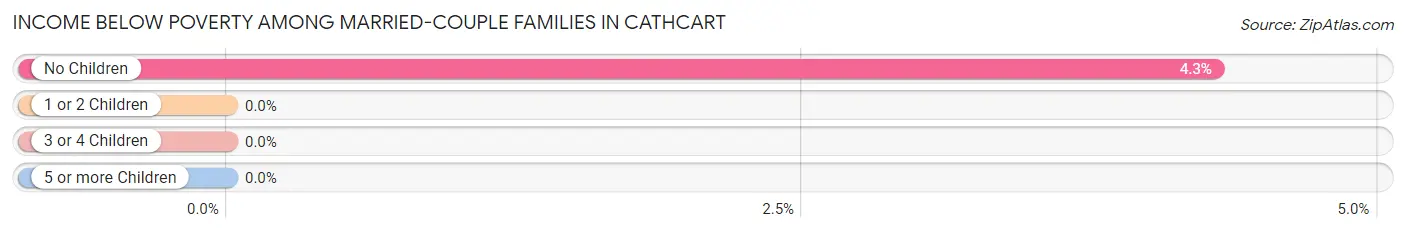
| Children | Above Poverty | Below Poverty |
| No Children | 312 (95.7%) | 14 (4.3%) |
| 1 or 2 Children | 162 (100.0%) | 0 (0.0%) |
| 3 or 4 Children | 13 (100.0%) | 0 (0.0%) |
| 5 or more Children | 10 (100.0%) | 0 (0.0%) |
| Total | 497 (97.3%) | 14 (2.7%) |
Income Below Poverty Among Single-Parent Households in Cathcart
| Children | Single Father | Single Mother |
| No Children | 0 (0.0%) | 0 (0.0%) |
| 1 or 2 Children | 0 (0.0%) | 0 (0.0%) |
| 3 or 4 Children | 0 (0.0%) | 0 (0.0%) |
| 5 or more Children | 0 (0.0%) | 0 (0.0%) |
| Total | 0 (0.0%) | 0 (0.0%) |
Income Below Poverty Among Married-Couple vs Single-Parent Households in Cathcart
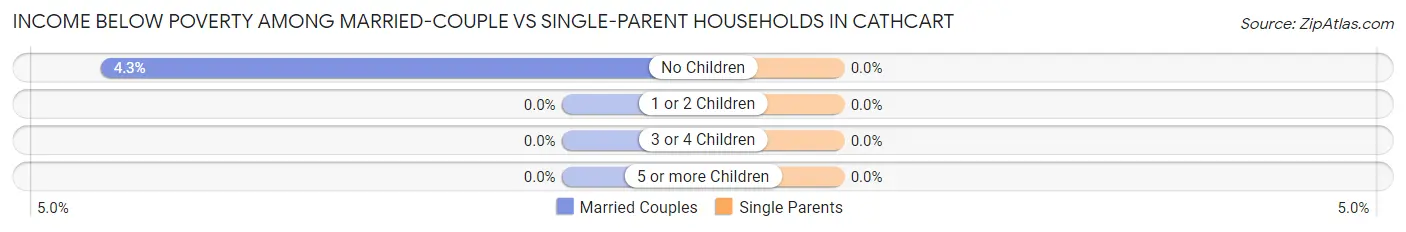
| Children | Married-Couple Families | Single-Parent Households |
| No Children | 14 (4.3%) | 0 (0.0%) |
| 1 or 2 Children | 0 (0.0%) | 0 (0.0%) |
| 3 or 4 Children | 0 (0.0%) | 0 (0.0%) |
| 5 or more Children | 0 (0.0%) | 0 (0.0%) |
| Total | 14 (2.7%) | 0 (0.0%) |
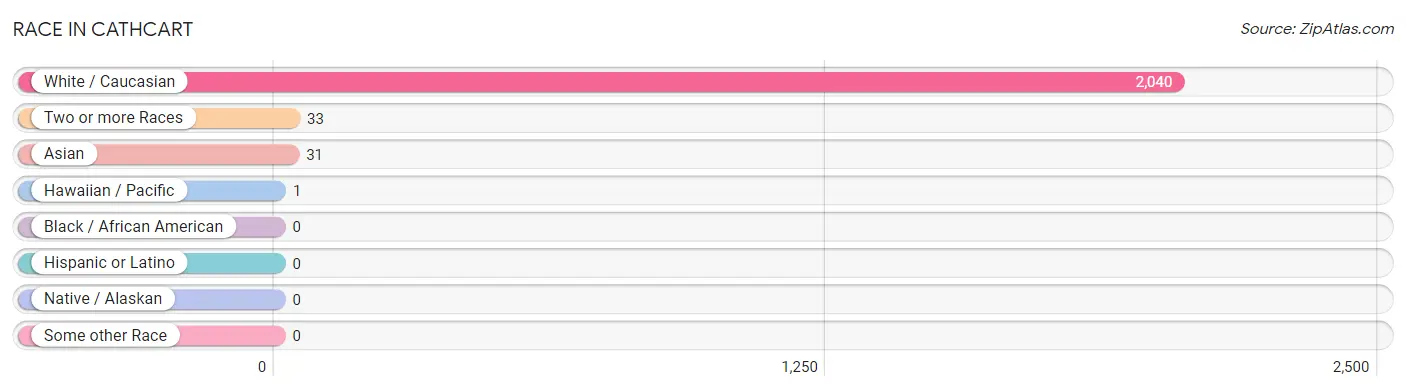
Race in Cathcart
The most populous races in Cathcart are White / Caucasian (2,040 | 96.9%), Two or more Races (33 | 1.6%), and Asian (31 | 1.5%).
| Race | # Population | % Population |
| Asian | 31 | 1.5% |
| Black / African American | 0 | 0.0% |
| Hawaiian / Pacific | 1 | 0.1% |
| Hispanic or Latino | 0 | 0.0% |
| Native / Alaskan | 0 | 0.0% |
| White / Caucasian | 2,040 | 96.9% |
| Two or more Races | 33 | 1.6% |
| Some other Race | 0 | 0.0% |
| Total | 2,105 | 100.0% |
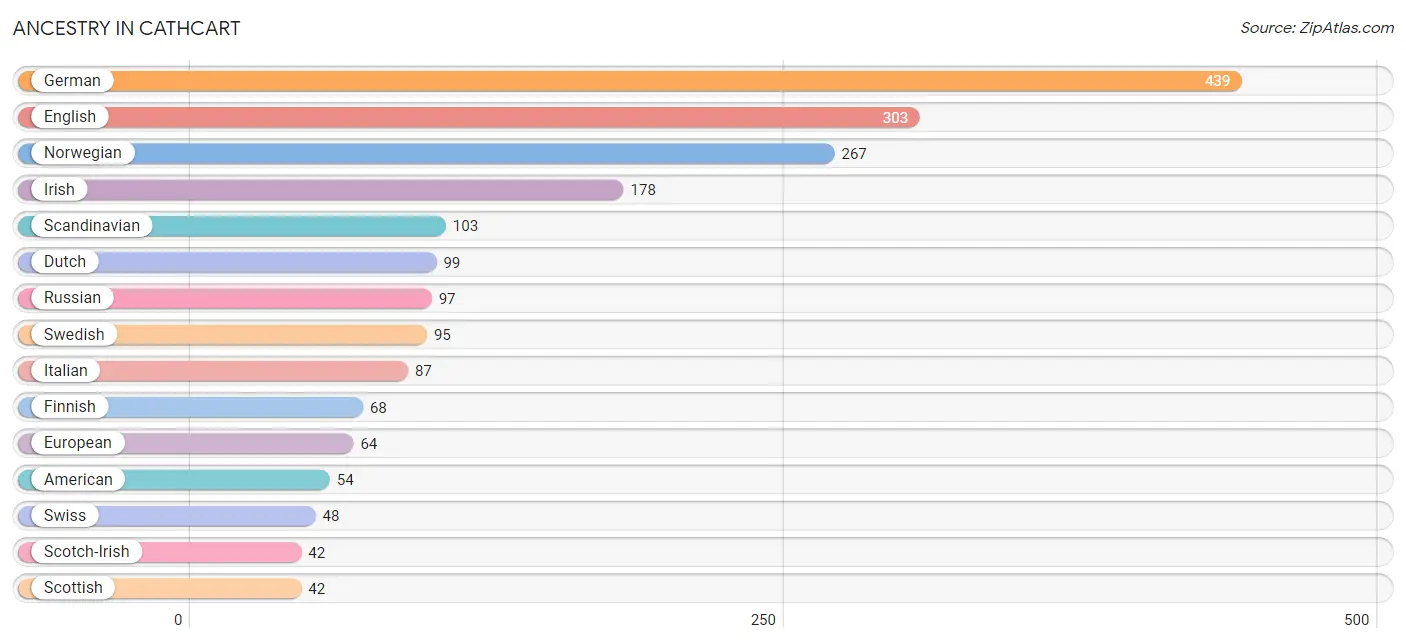
Ancestry in Cathcart
The most populous ancestries reported in Cathcart are German (439 | 20.9%), English (303 | 14.4%), Norwegian (267 | 12.7%), Irish (178 | 8.5%), and Scandinavian (103 | 4.9%), together accounting for 61.3% of all Cathcart residents.
| Ancestry | # Population | % Population |
| American | 54 | 2.6% |
| Armenian | 15 | 0.7% |
| British | 35 | 1.7% |
| Canadian | 24 | 1.1% |
| Cherokee | 16 | 0.8% |
| Dutch | 99 | 4.7% |
| English | 303 | 14.4% |
| European | 64 | 3.0% |
| Finnish | 68 | 3.2% |
| French | 25 | 1.2% |
| German | 439 | 20.9% |
| Greek | 10 | 0.5% |
| Indian (Asian) | 15 | 0.7% |
| Irish | 178 | 8.5% |
| Italian | 87 | 4.1% |
| Mongolian | 16 | 0.8% |
| Norwegian | 267 | 12.7% |
| Polish | 26 | 1.2% |
| Russian | 97 | 4.6% |
| Samoan | 1 | 0.1% |
| Scandinavian | 103 | 4.9% |
| Scotch-Irish | 42 | 2.0% |
| Scottish | 42 | 2.0% |
| Swedish | 95 | 4.5% |
| Swiss | 48 | 2.3% |
| Ukrainian | 24 | 1.1% |
| Welsh | 22 | 1.1% | View All 27 Rows |
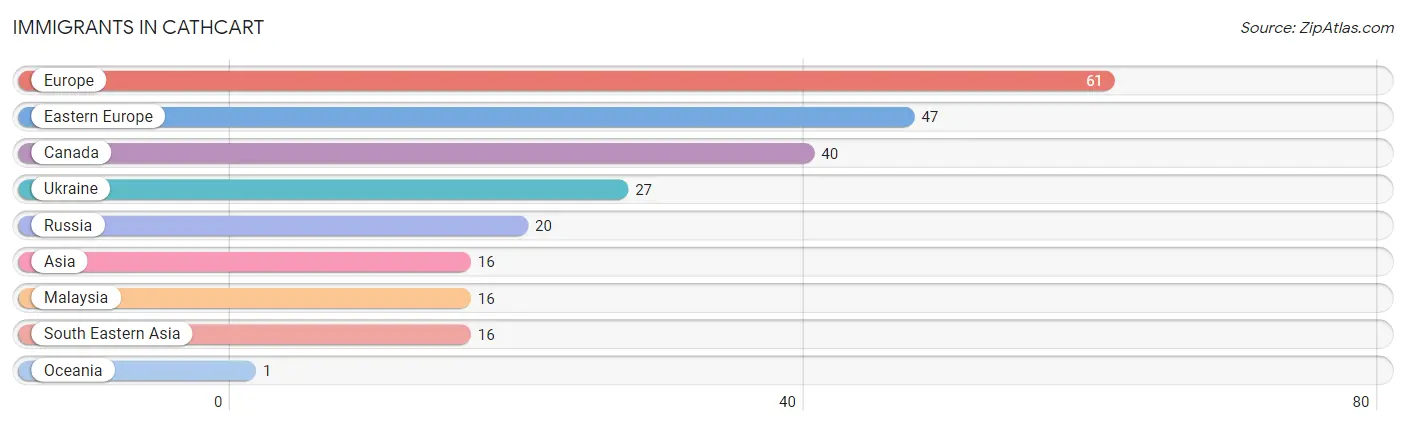
Immigrants in Cathcart
The most numerous immigrant groups reported in Cathcart came from Europe (61 | 2.9%), Eastern Europe (47 | 2.2%), Canada (40 | 1.9%), Ukraine (27 | 1.3%), and Russia (20 | 0.9%), together accounting for 9.3% of all Cathcart residents.
| Immigration Origin | # Population | % Population |
| Asia | 16 | 0.8% |
| Canada | 40 | 1.9% |
| Eastern Europe | 47 | 2.2% |
| Europe | 61 | 2.9% |
| Malaysia | 16 | 0.8% |
| Oceania | 1 | 0.1% |
| Russia | 20 | 0.9% |
| South Eastern Asia | 16 | 0.8% |
| Ukraine | 27 | 1.3% | View All 9 Rows |
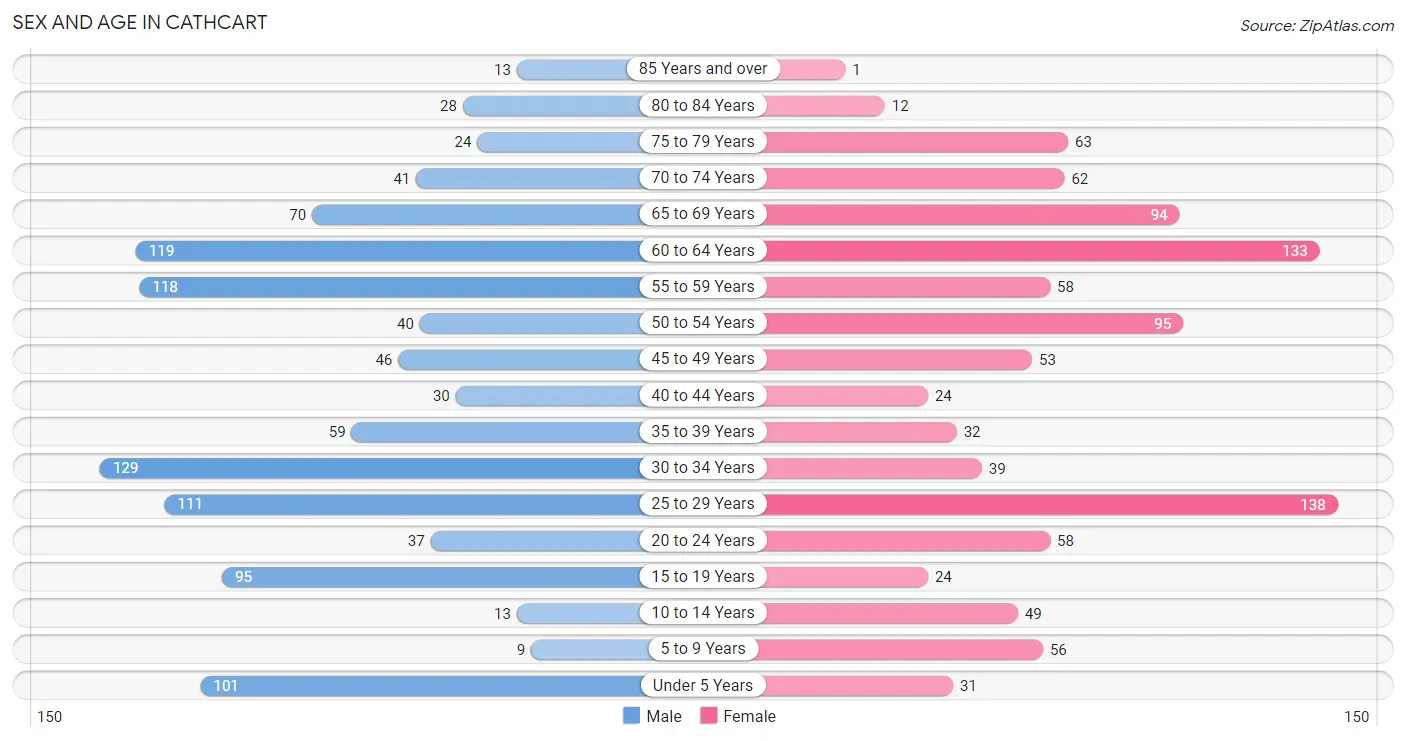
Sex and Age in Cathcart
Sex and Age in Cathcart
The most populous age groups in Cathcart are 30 to 34 Years (129 | 11.9%) for men and 25 to 29 Years (138 | 13.5%) for women.
| Age Bracket | Male | Female |
| Under 5 Years | 101 (9.3%) | 31 (3.0%) |
| 5 to 9 Years | 9 (0.8%) | 56 (5.5%) |
| 10 to 14 Years | 13 (1.2%) | 49 (4.8%) |
| 15 to 19 Years | 95 (8.8%) | 24 (2.4%) |
| 20 to 24 Years | 37 (3.4%) | 58 (5.7%) |
| 25 to 29 Years | 111 (10.2%) | 138 (13.5%) |
| 30 to 34 Years | 129 (11.9%) | 39 (3.8%) |
| 35 to 39 Years | 59 (5.4%) | 32 (3.1%) |
| 40 to 44 Years | 30 (2.8%) | 24 (2.4%) |
| 45 to 49 Years | 46 (4.3%) | 53 (5.2%) |
| 50 to 54 Years | 40 (3.7%) | 95 (9.3%) |
| 55 to 59 Years | 118 (10.9%) | 58 (5.7%) |
| 60 to 64 Years | 119 (11.0%) | 133 (13.0%) |
| 65 to 69 Years | 70 (6.5%) | 94 (9.2%) |
| 70 to 74 Years | 41 (3.8%) | 62 (6.1%) |
| 75 to 79 Years | 24 (2.2%) | 63 (6.2%) |
| 80 to 84 Years | 28 (2.6%) | 12 (1.2%) |
| 85 Years and over | 13 (1.2%) | 1 (0.1%) |
| Total | 1,083 (100.0%) | 1,022 (100.0%) |
Families and Households in Cathcart
Median Family Size in Cathcart
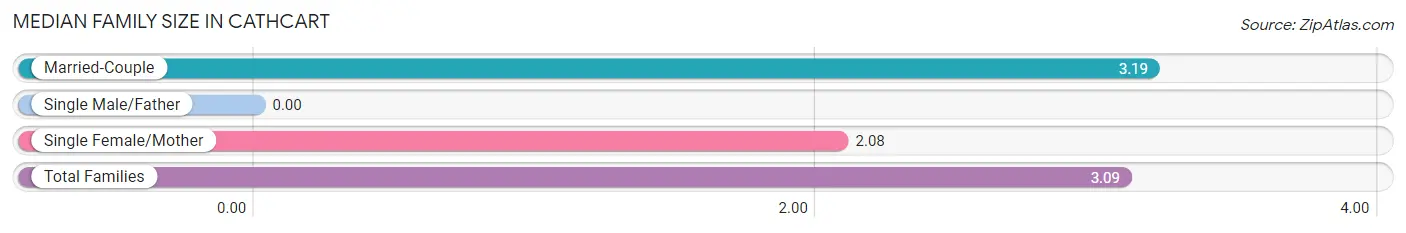
| Family Type | # Families | Family Size |
| Married-Couple | 511 (90.8%) | 3.19 |
| Single Male/Father | 0 (0.0%) | - |
| Single Female/Mother | 52 (9.2%) | 2.08 |
| Total Families | 563 (100.0%) | 3.09 |
Median Household Size in Cathcart
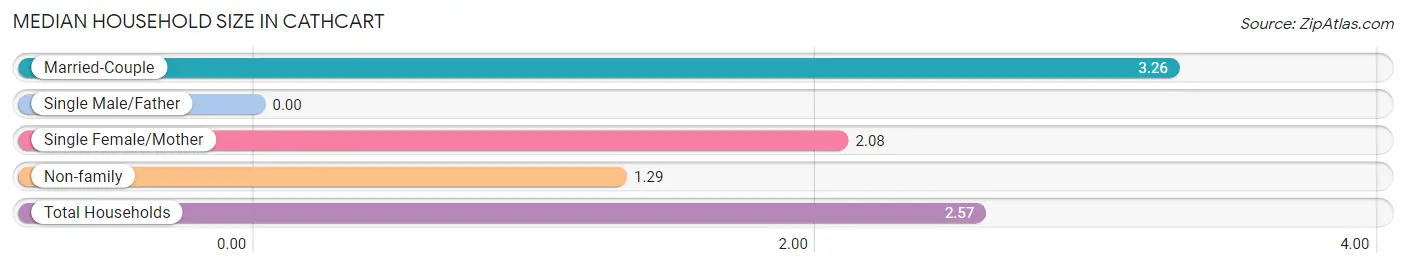
| Household Type | # Households | Household Size |
| Married-Couple | 511 (62.4%) | 3.26 |
| Single Male/Father | 0 (0.0%) | - |
| Single Female/Mother | 52 (6.4%) | 2.08 |
| Non-family | 256 (31.3%) | 1.29 |
| Total Households | 819 (100.0%) | 2.57 |
Household Size by Marriage Status in Cathcart
Out of a total of 819 households in Cathcart, 563 (68.7%) are family households, while 256 (31.3%) are nonfamily households. The most numerous type of family households are 2-person households, comprising 259, and the most common type of nonfamily households are 1-person households, comprising 188.
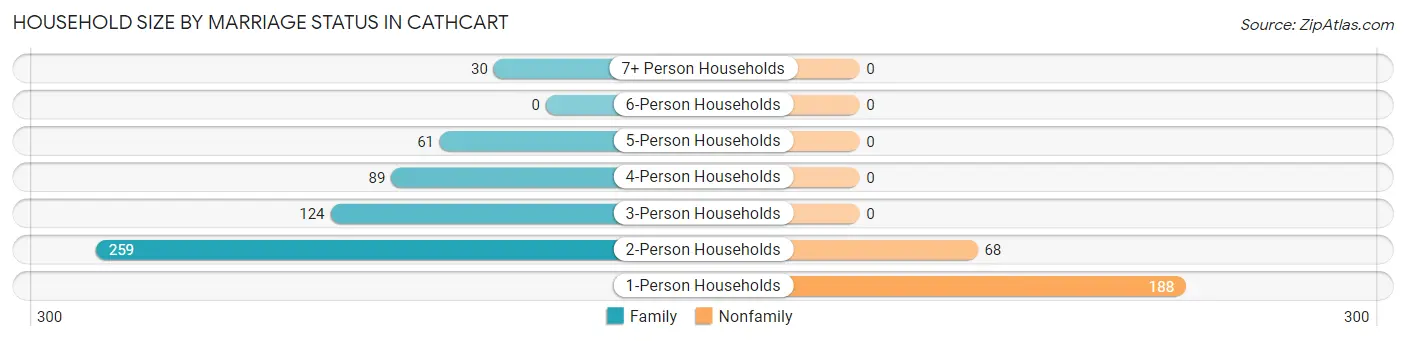
| Household Size | Family Households | Nonfamily Households |
| 1-Person Households | - | 188 (23.0%) |
| 2-Person Households | 259 (31.6%) | 68 (8.3%) |
| 3-Person Households | 124 (15.1%) | 0 (0.0%) |
| 4-Person Households | 89 (10.9%) | 0 (0.0%) |
| 5-Person Households | 61 (7.4%) | 0 (0.0%) |
| 6-Person Households | 0 (0.0%) | 0 (0.0%) |
| 7+ Person Households | 30 (3.7%) | 0 (0.0%) |
| Total | 563 (68.7%) | 256 (31.3%) |
Female Fertility in Cathcart
Fertility by Age in Cathcart
| Age Bracket | Women with Births | Births / 1,000 Women |
| 15 to 19 years | 0 (0.0%) | 0.0 |
| 20 to 34 years | 0 (0.0%) | 0.0 |
| 35 to 50 years | 0 (0.0%) | 0.0 |
| Total | 0 (0.0%) | 0.0 |
Fertility by Age by Marriage Status in Cathcart
| Age Bracket | Married | Unmarried |
| 15 to 19 years | 0 (0.0%) | 0 (0.0%) |
| 20 to 34 years | 0 (0.0%) | 0 (0.0%) |
| 35 to 50 years | 0 (0.0%) | 0 (0.0%) |
| Total | 0 (0.0%) | 0 (0.0%) |
Fertility by Education in Cathcart
| Educational Attainment | Women with Births | Births / 1,000 Women |
| Less than High School | 0 (0.0%) | 0.0 |
| High School Diploma | 0 (0.0%) | 0.0 |
| College or Associate's Degree | 0 (0.0%) | 0.0 |
| Bachelor's Degree | 0 (0.0%) | 0.0 |
| Graduate Degree | 0 (0.0%) | 0.0 |
| Total | 0 (0.0%) | 0.0 |
Fertility by Education by Marriage Status in Cathcart
| Educational Attainment | Married | Unmarried |
| Less than High School | 0 (0.0%) | 0 (0.0%) |
| High School Diploma | 0 (0.0%) | 0 (0.0%) |
| College or Associate's Degree | 0 (0.0%) | 0 (0.0%) |
| Bachelor's Degree | 0 (0.0%) | 0 (0.0%) |
| Graduate Degree | 0 (0.0%) | 0 (0.0%) |
| Total | 0 (0.0%) | 0 (0.0%) |
Employment Characteristics in Cathcart
Employment by Class of Employer in Cathcart
Among the 1,046 employed individuals in Cathcart, private company employees (726 | 69.4%), local government employees (82 | 7.8%), and self-employed (not incorporated) (78 | 7.5%) make up the most common classes of employment.
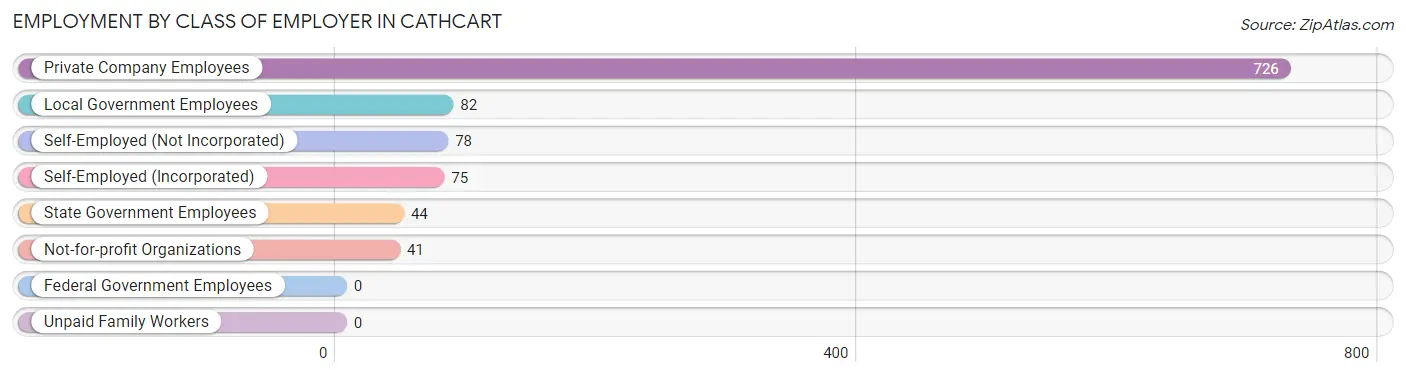
| Employer Class | # Employees | % Employees |
| Private Company Employees | 726 | 69.4% |
| Self-Employed (Incorporated) | 75 | 7.2% |
| Self-Employed (Not Incorporated) | 78 | 7.5% |
| Not-for-profit Organizations | 41 | 3.9% |
| Local Government Employees | 82 | 7.8% |
| State Government Employees | 44 | 4.2% |
| Federal Government Employees | 0 | 0.0% |
| Unpaid Family Workers | 0 | 0.0% |
| Total | 1,046 | 100.0% |
Employment Status by Age in Cathcart
According to the labor force statistics for Cathcart, out of the total population over 16 years of age (1,836), 57.6% or 1,058 individuals are in the labor force, with 1.0% or 11 of them unemployed. The age group with the highest labor force participation rate is 20 to 24 years, with 100.0% or 95 individuals in the labor force. Within the labor force, the 16 to 19 years age range has the highest percentage of unemployed individuals, with 100.0% or 11 of them being unemployed.
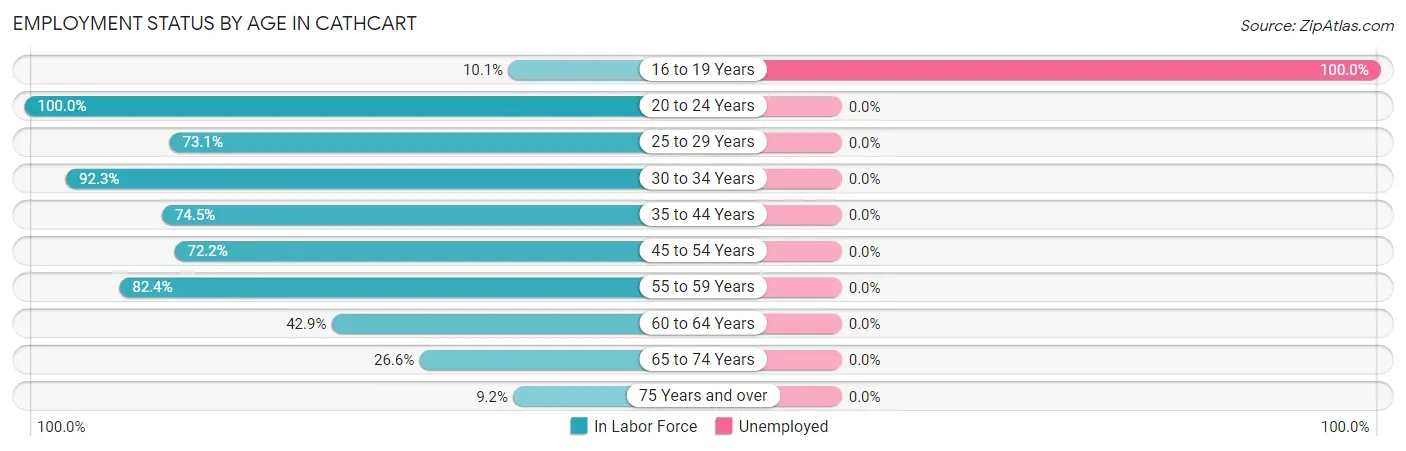
| Age Bracket | In Labor Force | Unemployed |
| 16 to 19 Years | 11 (10.1%) | 11 (100.0%) |
| 20 to 24 Years | 95 (100.0%) | 0 (0.0%) |
| 25 to 29 Years | 182 (73.1%) | 0 (0.0%) |
| 30 to 34 Years | 155 (92.3%) | 0 (0.0%) |
| 35 to 44 Years | 108 (74.5%) | 0 (0.0%) |
| 45 to 54 Years | 169 (72.2%) | 0 (0.0%) |
| 55 to 59 Years | 145 (82.4%) | 0 (0.0%) |
| 60 to 64 Years | 108 (42.9%) | 0 (0.0%) |
| 65 to 74 Years | 71 (26.6%) | 0 (0.0%) |
| 75 Years and over | 13 (9.2%) | 0 (0.0%) |
| Total | 1,058 (57.6%) | 11 (1.0%) |
Employment Status by Educational Attainment in Cathcart
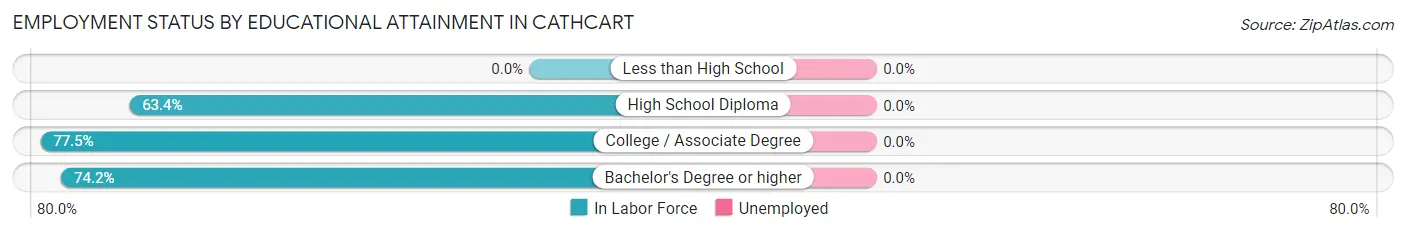
| Educational Attainment | In Labor Force | Unemployed |
| Less than High School | 0 (0.0%) | 0 (0.0%) |
| High School Diploma | 199 (63.4%) | 0 (0.0%) |
| College / Associate Degree | 328 (77.5%) | 0 (0.0%) |
| Bachelor's Degree or higher | 340 (74.2%) | 0 (0.0%) |
| Total | 867 (70.8%) | 0 (0.0%) |
Employment Occupations by Sex in Cathcart
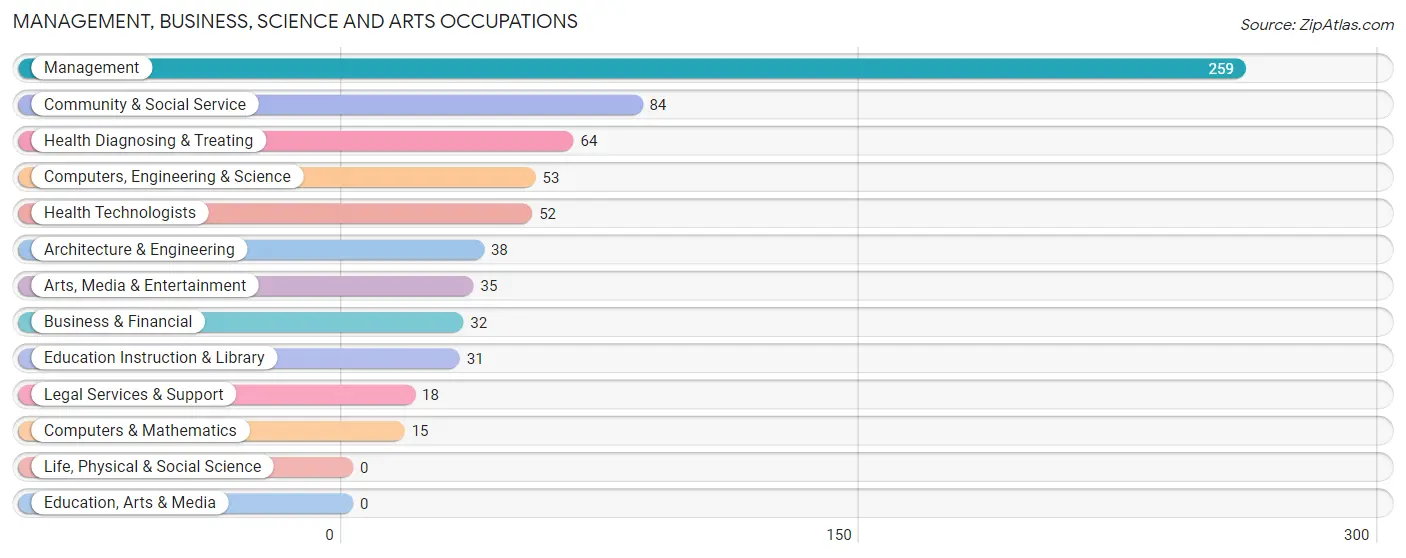
Management, Business, Science and Arts Occupations
The most common Management, Business, Science and Arts occupations in Cathcart are Management (259 | 24.8%), Community & Social Service (84 | 8.0%), Health Diagnosing & Treating (64 | 6.1%), Computers, Engineering & Science (53 | 5.1%), and Health Technologists (52 | 5.0%).
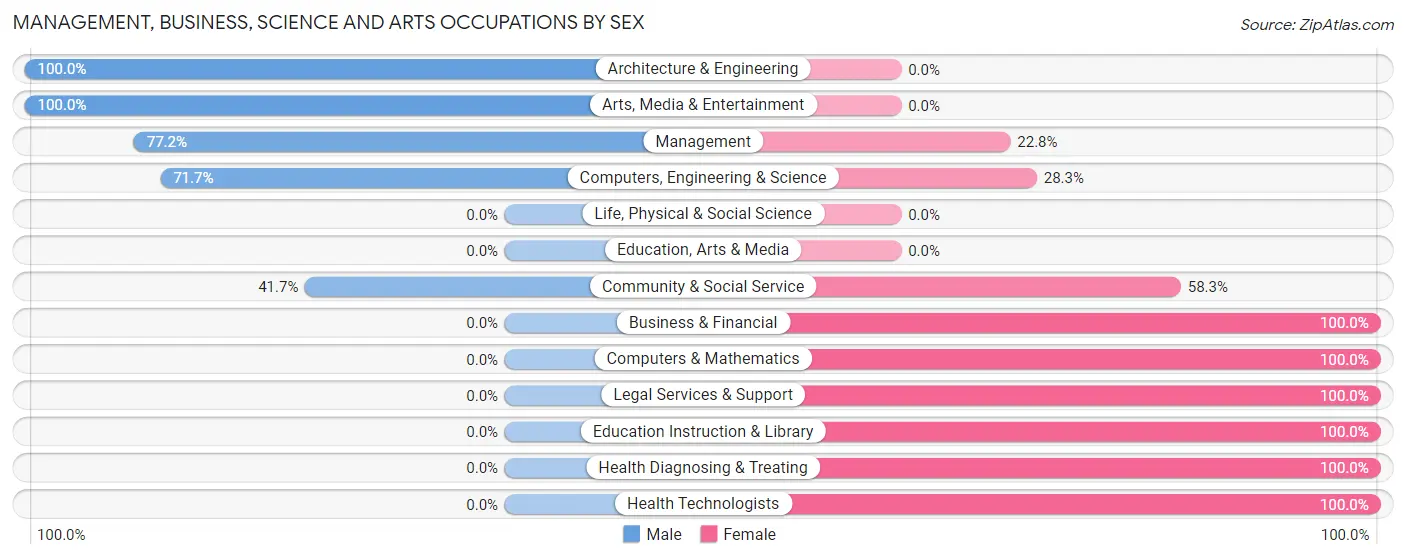
Management, Business, Science and Arts Occupations by Sex
Within the Management, Business, Science and Arts occupations in Cathcart, the most male-oriented occupations are Architecture & Engineering (100.0%), Arts, Media & Entertainment (100.0%), and Management (77.2%), while the most female-oriented occupations are Business & Financial (100.0%), Computers & Mathematics (100.0%), and Legal Services & Support (100.0%).
| Occupation | Male | Female |
| Management | 200 (77.2%) | 59 (22.8%) |
| Business & Financial | 0 (0.0%) | 32 (100.0%) |
| Computers, Engineering & Science | 38 (71.7%) | 15 (28.3%) |
| Computers & Mathematics | 0 (0.0%) | 15 (100.0%) |
| Architecture & Engineering | 38 (100.0%) | 0 (0.0%) |
| Life, Physical & Social Science | 0 (0.0%) | 0 (0.0%) |
| Community & Social Service | 35 (41.7%) | 49 (58.3%) |
| Education, Arts & Media | 0 (0.0%) | 0 (0.0%) |
| Legal Services & Support | 0 (0.0%) | 18 (100.0%) |
| Education Instruction & Library | 0 (0.0%) | 31 (100.0%) |
| Arts, Media & Entertainment | 35 (100.0%) | 0 (0.0%) |
| Health Diagnosing & Treating | 0 (0.0%) | 64 (100.0%) |
| Health Technologists | 0 (0.0%) | 52 (100.0%) |
| Total (Category) | 273 (55.5%) | 219 (44.5%) |
| Total (Overall) | 554 (53.0%) | 492 (47.0%) |
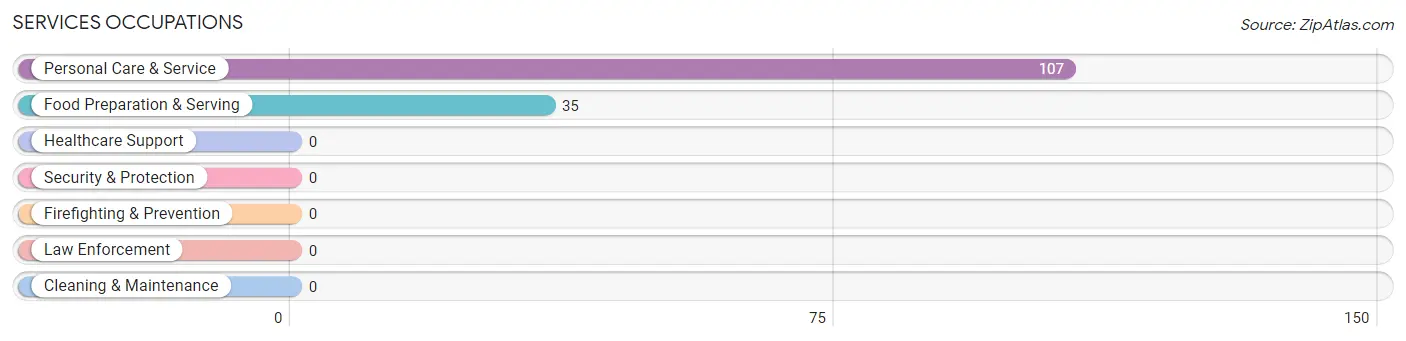
Services Occupations
The most common Services occupations in Cathcart are Personal Care & Service (107 | 10.2%), and Food Preparation & Serving (35 | 3.4%).
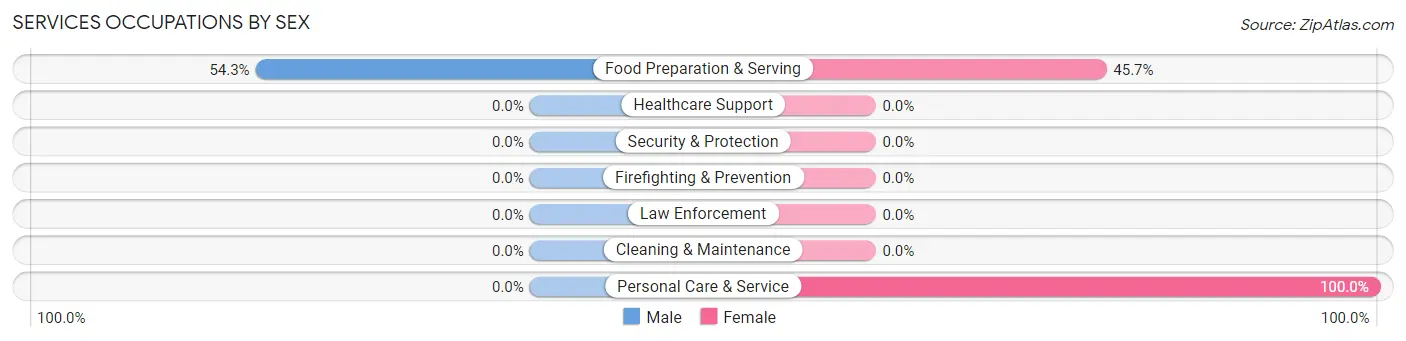
Services Occupations by Sex
| Occupation | Male | Female |
| Healthcare Support | 0 (0.0%) | 0 (0.0%) |
| Security & Protection | 0 (0.0%) | 0 (0.0%) |
| Firefighting & Prevention | 0 (0.0%) | 0 (0.0%) |
| Law Enforcement | 0 (0.0%) | 0 (0.0%) |
| Food Preparation & Serving | 19 (54.3%) | 16 (45.7%) |
| Cleaning & Maintenance | 0 (0.0%) | 0 (0.0%) |
| Personal Care & Service | 0 (0.0%) | 107 (100.0%) |
| Total (Category) | 19 (13.4%) | 123 (86.6%) |
| Total (Overall) | 554 (53.0%) | 492 (47.0%) |
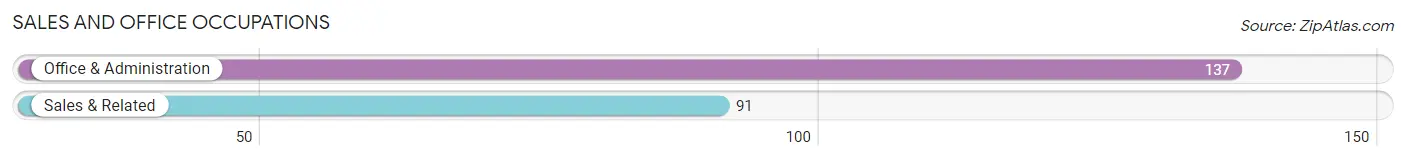
Sales and Office Occupations
The most common Sales and Office occupations in Cathcart are Office & Administration (137 | 13.1%), and Sales & Related (91 | 8.7%).
Sales and Office Occupations by Sex
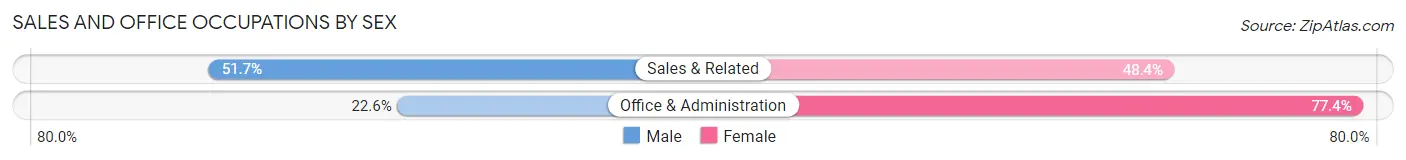
| Occupation | Male | Female |
| Sales & Related | 47 (51.6%) | 44 (48.3%) |
| Office & Administration | 31 (22.6%) | 106 (77.4%) |
| Total (Category) | 78 (34.2%) | 150 (65.8%) |
| Total (Overall) | 554 (53.0%) | 492 (47.0%) |
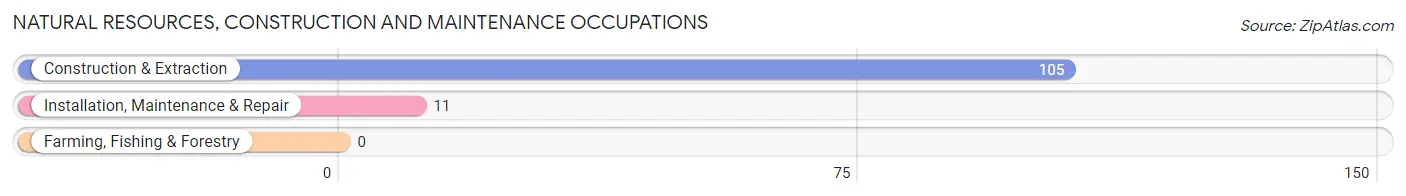
Natural Resources, Construction and Maintenance Occupations
The most common Natural Resources, Construction and Maintenance occupations in Cathcart are Construction & Extraction (105 | 10.0%), and Installation, Maintenance & Repair (11 | 1.1%).
Natural Resources, Construction and Maintenance Occupations by Sex
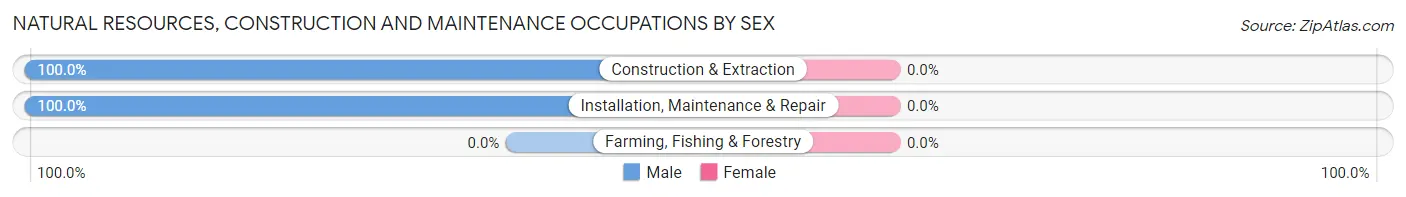
| Occupation | Male | Female |
| Farming, Fishing & Forestry | 0 (0.0%) | 0 (0.0%) |
| Construction & Extraction | 105 (100.0%) | 0 (0.0%) |
| Installation, Maintenance & Repair | 11 (100.0%) | 0 (0.0%) |
| Total (Category) | 116 (100.0%) | 0 (0.0%) |
| Total (Overall) | 554 (53.0%) | 492 (47.0%) |
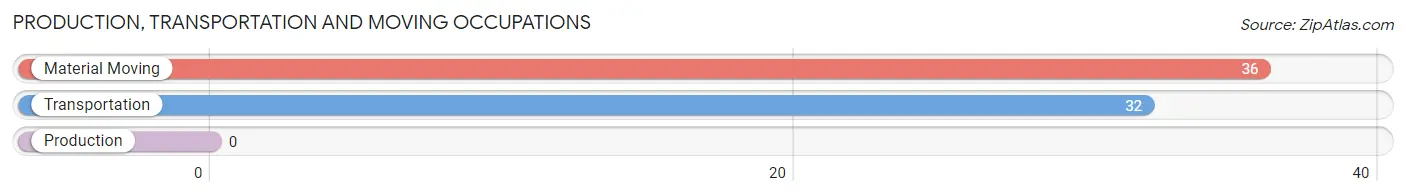
Production, Transportation and Moving Occupations
The most common Production, Transportation and Moving occupations in Cathcart are Material Moving (36 | 3.4%), and Transportation (32 | 3.1%).
Production, Transportation and Moving Occupations by Sex
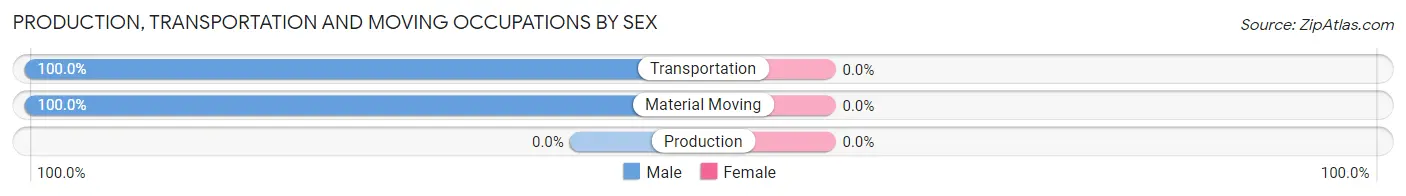
| Occupation | Male | Female |
| Production | 0 (0.0%) | 0 (0.0%) |
| Transportation | 32 (100.0%) | 0 (0.0%) |
| Material Moving | 36 (100.0%) | 0 (0.0%) |
| Total (Category) | 68 (100.0%) | 0 (0.0%) |
| Total (Overall) | 554 (53.0%) | 492 (47.0%) |
Employment Industries by Sex in Cathcart
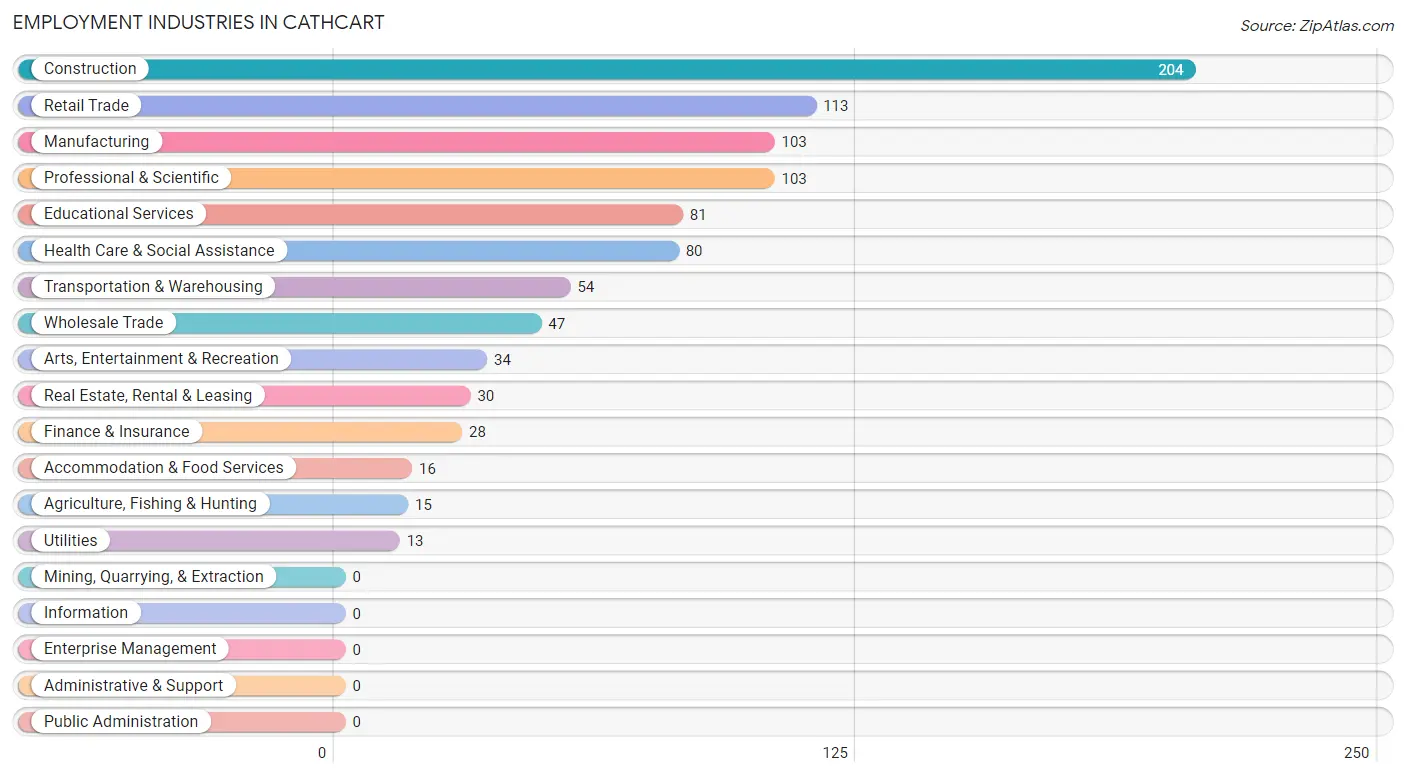
Employment Industries in Cathcart
The major employment industries in Cathcart include Construction (204 | 19.5%), Retail Trade (113 | 10.8%), Manufacturing (103 | 9.9%), Professional & Scientific (103 | 9.9%), and Educational Services (81 | 7.7%).
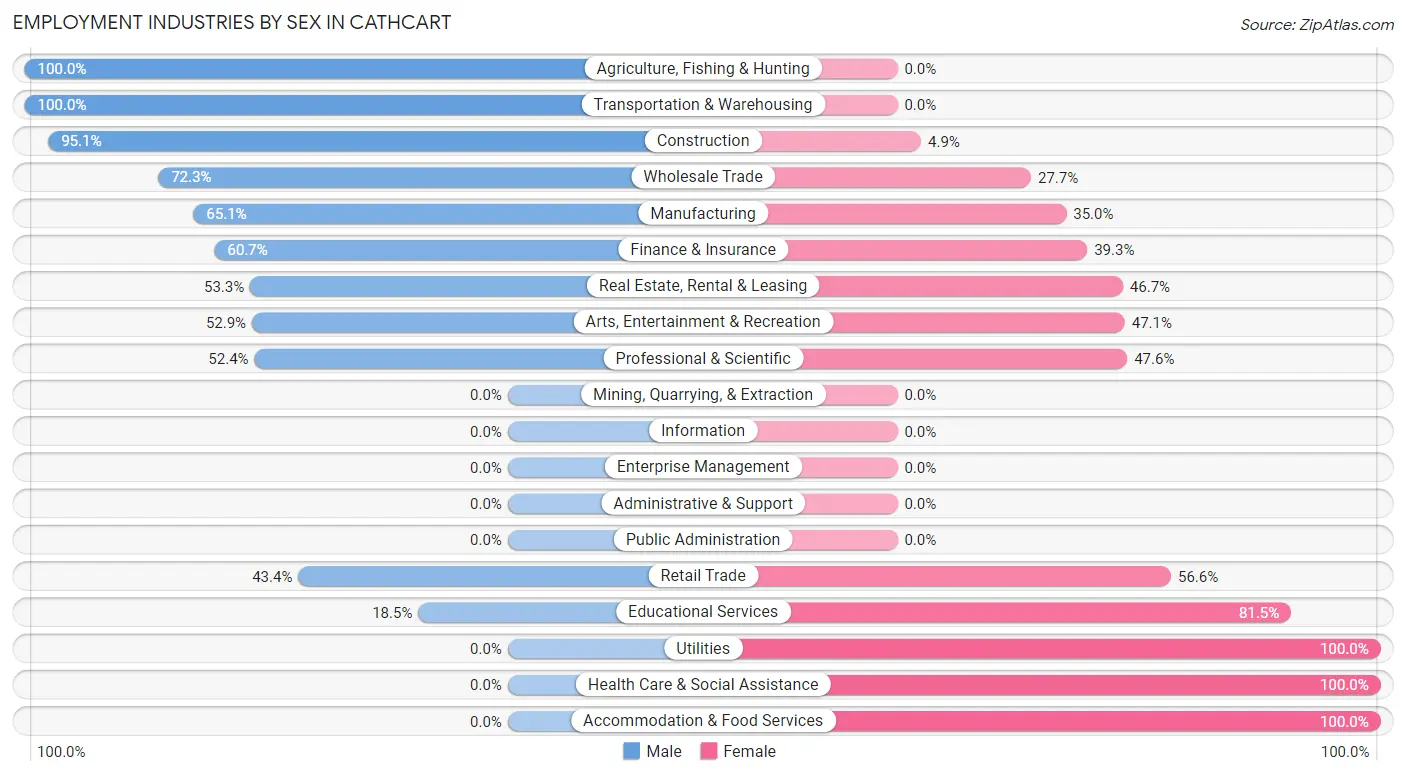
Employment Industries by Sex in Cathcart
The Cathcart industries that see more men than women are Agriculture, Fishing & Hunting (100.0%), Transportation & Warehousing (100.0%), and Construction (95.1%), whereas the industries that tend to have a higher number of women are Utilities (100.0%), Health Care & Social Assistance (100.0%), and Accommodation & Food Services (100.0%).
| Industry | Male | Female |
| Agriculture, Fishing & Hunting | 15 (100.0%) | 0 (0.0%) |
| Mining, Quarrying, & Extraction | 0 (0.0%) | 0 (0.0%) |
| Construction | 194 (95.1%) | 10 (4.9%) |
| Manufacturing | 67 (65.0%) | 36 (34.9%) |
| Wholesale Trade | 34 (72.3%) | 13 (27.7%) |
| Retail Trade | 49 (43.4%) | 64 (56.6%) |
| Transportation & Warehousing | 54 (100.0%) | 0 (0.0%) |
| Utilities | 0 (0.0%) | 13 (100.0%) |
| Information | 0 (0.0%) | 0 (0.0%) |
| Finance & Insurance | 17 (60.7%) | 11 (39.3%) |
| Real Estate, Rental & Leasing | 16 (53.3%) | 14 (46.7%) |
| Professional & Scientific | 54 (52.4%) | 49 (47.6%) |
| Enterprise Management | 0 (0.0%) | 0 (0.0%) |
| Administrative & Support | 0 (0.0%) | 0 (0.0%) |
| Educational Services | 15 (18.5%) | 66 (81.5%) |
| Health Care & Social Assistance | 0 (0.0%) | 80 (100.0%) |
| Arts, Entertainment & Recreation | 18 (52.9%) | 16 (47.1%) |
| Accommodation & Food Services | 0 (0.0%) | 16 (100.0%) |
| Public Administration | 0 (0.0%) | 0 (0.0%) |
| Total | 554 (53.0%) | 492 (47.0%) |
Education in Cathcart
School Enrollment in Cathcart
The most common levels of schooling among the 299 students in Cathcart are high school (108 | 36.1%), middle school (62 | 20.7%), and college / undergraduate (58 | 19.4%).
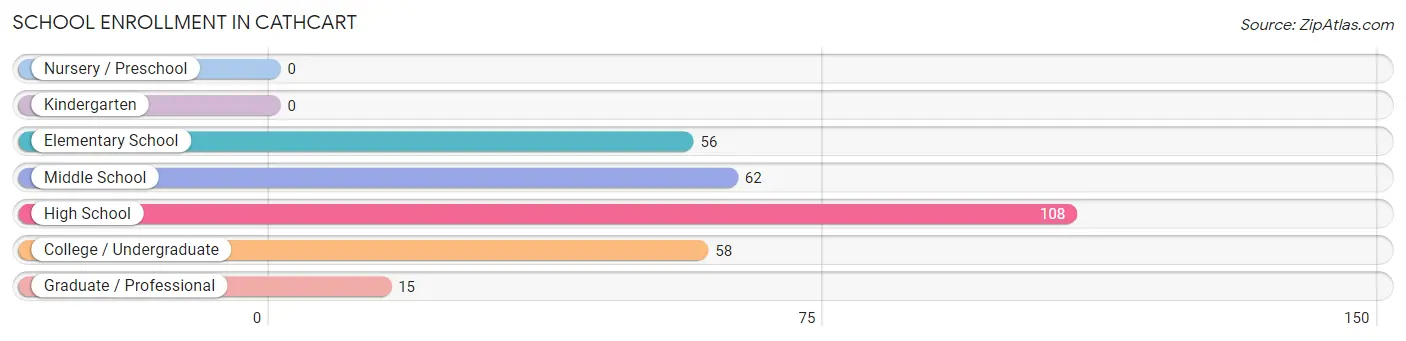
| School Level | # Students | % Students |
| Nursery / Preschool | 0 | 0.0% |
| Kindergarten | 0 | 0.0% |
| Elementary School | 56 | 18.7% |
| Middle School | 62 | 20.7% |
| High School | 108 | 36.1% |
| College / Undergraduate | 58 | 19.4% |
| Graduate / Professional | 15 | 5.0% |
| Total | 299 | 100.0% |
School Enrollment by Age by Funding Source in Cathcart
Out of a total of 299 students who are enrolled in schools in Cathcart, 32 (10.7%) attend a private institution, while the remaining 267 (89.3%) are enrolled in public schools. The age group of 5 to 9 year old has the highest likelihood of being enrolled in private schools, with 13 (23.2% in the age bracket) enrolled. Conversely, the age group of 18 to 19 year olds has the lowest likelihood of being enrolled in a private school, with 24 (100.0% in the age bracket) attending a public institution.
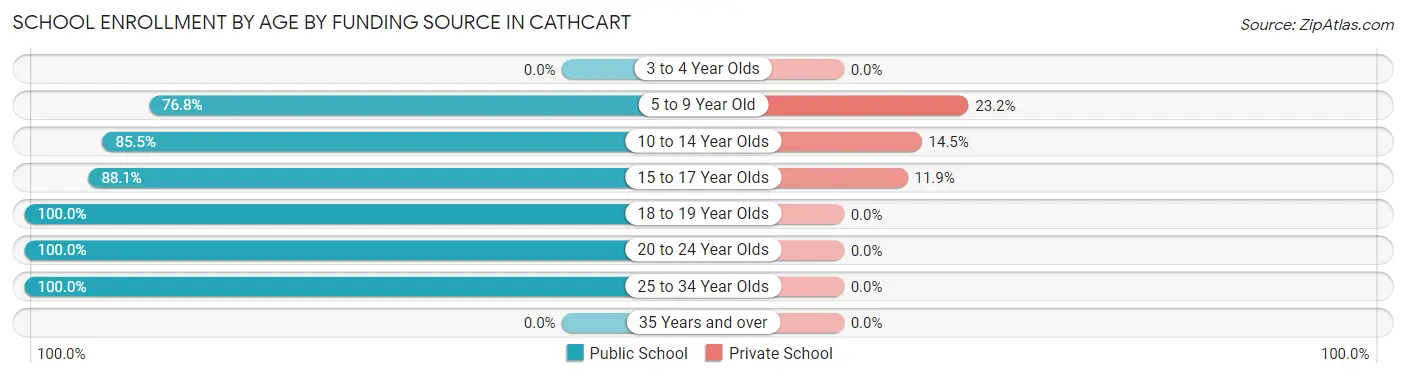
| Age Bracket | Public School | Private School |
| 3 to 4 Year Olds | 0 (0.0%) | 0 (0.0%) |
| 5 to 9 Year Old | 43 (76.8%) | 13 (23.2%) |
| 10 to 14 Year Olds | 53 (85.5%) | 9 (14.5%) |
| 15 to 17 Year Olds | 74 (88.1%) | 10 (11.9%) |
| 18 to 19 Year Olds | 24 (100.0%) | 0 (0.0%) |
| 20 to 24 Year Olds | 19 (100.0%) | 0 (0.0%) |
| 25 to 34 Year Olds | 54 (100.0%) | 0 (0.0%) |
| 35 Years and over | 0 (0.0%) | 0 (0.0%) |
| Total | 267 (89.3%) | 32 (10.7%) |
Educational Attainment by Field of Study in Cathcart
Business (92 | 15.7%), arts & humanities (60 | 10.2%), liberal arts & history (57 | 9.7%), education (54 | 9.2%), and social sciences (53 | 9.0%) are the most common fields of study among 587 individuals in Cathcart who have obtained a bachelor's degree or higher.
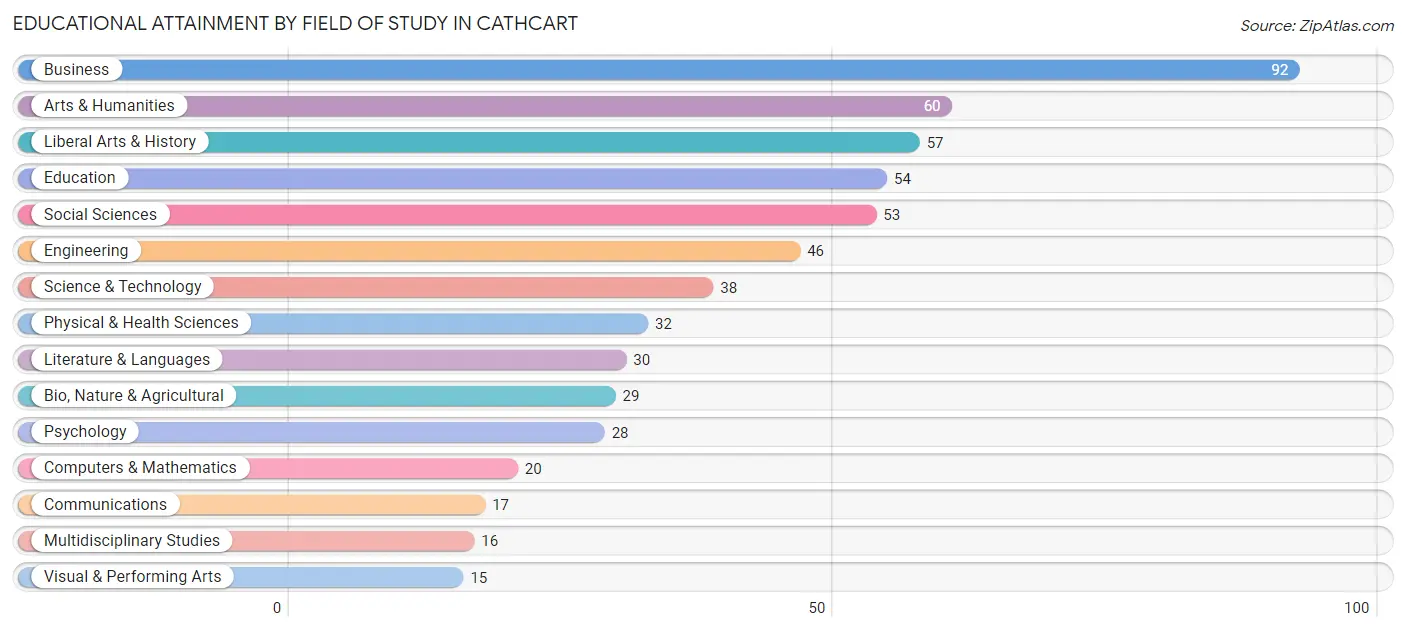
| Field of Study | # Graduates | % Graduates |
| Computers & Mathematics | 20 | 3.4% |
| Bio, Nature & Agricultural | 29 | 4.9% |
| Physical & Health Sciences | 32 | 5.4% |
| Psychology | 28 | 4.8% |
| Social Sciences | 53 | 9.0% |
| Engineering | 46 | 7.8% |
| Multidisciplinary Studies | 16 | 2.7% |
| Science & Technology | 38 | 6.5% |
| Business | 92 | 15.7% |
| Education | 54 | 9.2% |
| Literature & Languages | 30 | 5.1% |
| Liberal Arts & History | 57 | 9.7% |
| Visual & Performing Arts | 15 | 2.6% |
| Communications | 17 | 2.9% |
| Arts & Humanities | 60 | 10.2% |
| Total | 587 | 100.0% |
Transportation & Commute in Cathcart
Vehicle Availability by Sex in Cathcart
The most prevalent vehicle ownership categories in Cathcart are males with 3 vehicles (213, accounting for 38.5%) and females with 3 vehicles (122, making up 43.3%).
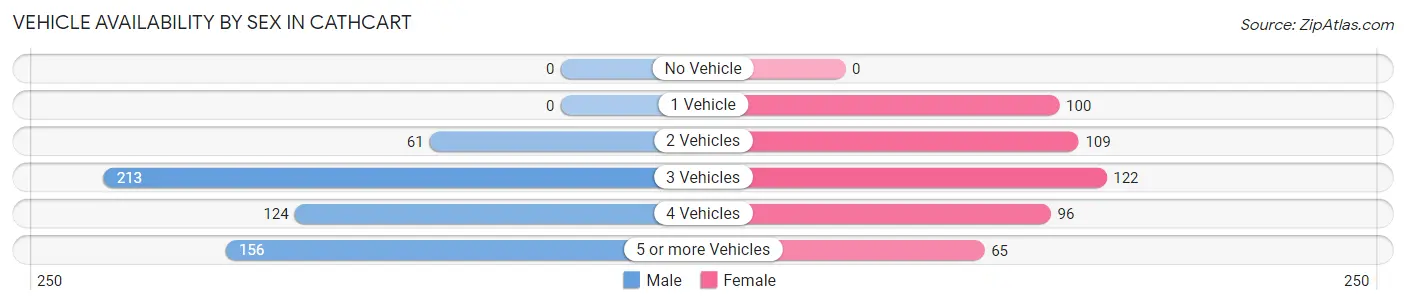
| Vehicles Available | Male | Female |
| No Vehicle | 0 (0.0%) | 0 (0.0%) |
| 1 Vehicle | 0 (0.0%) | 100 (20.3%) |
| 2 Vehicles | 61 (11.0%) | 109 (22.2%) |
| 3 Vehicles | 213 (38.5%) | 122 (24.8%) |
| 4 Vehicles | 124 (22.4%) | 96 (19.5%) |
| 5 or more Vehicles | 156 (28.2%) | 65 (13.2%) |
| Total | 554 (100.0%) | 492 (100.0%) |
Commute Time in Cathcart
The most frequently occuring commute durations in Cathcart are 30 to 34 minutes (234 commuters, 26.6%), 45 to 59 minutes (149 commuters, 17.0%), and 15 to 19 minutes (102 commuters, 11.6%).
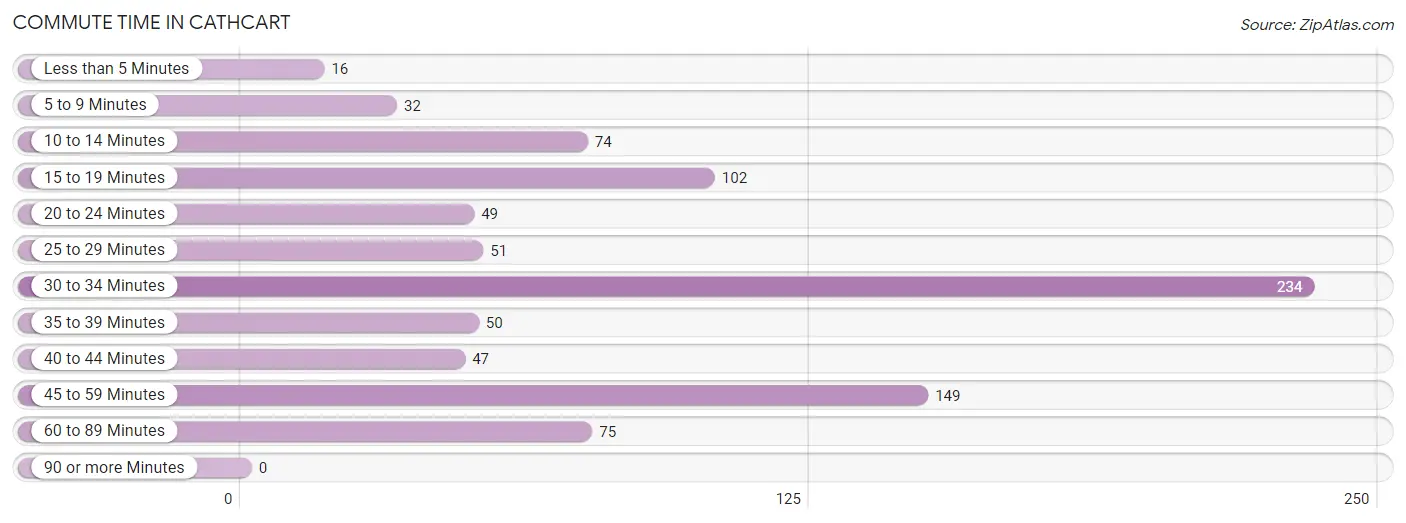
| Commute Time | # Commuters | % Commuters |
| Less than 5 Minutes | 16 | 1.8% |
| 5 to 9 Minutes | 32 | 3.6% |
| 10 to 14 Minutes | 74 | 8.4% |
| 15 to 19 Minutes | 102 | 11.6% |
| 20 to 24 Minutes | 49 | 5.6% |
| 25 to 29 Minutes | 51 | 5.8% |
| 30 to 34 Minutes | 234 | 26.6% |
| 35 to 39 Minutes | 50 | 5.7% |
| 40 to 44 Minutes | 47 | 5.3% |
| 45 to 59 Minutes | 149 | 17.0% |
| 60 to 89 Minutes | 75 | 8.5% |
| 90 or more Minutes | 0 | 0.0% |
Commute Time by Sex in Cathcart
The most common commute times in Cathcart are 30 to 34 minutes (138 commuters, 29.3%) for males and 30 to 34 minutes (96 commuters, 23.5%) for females.
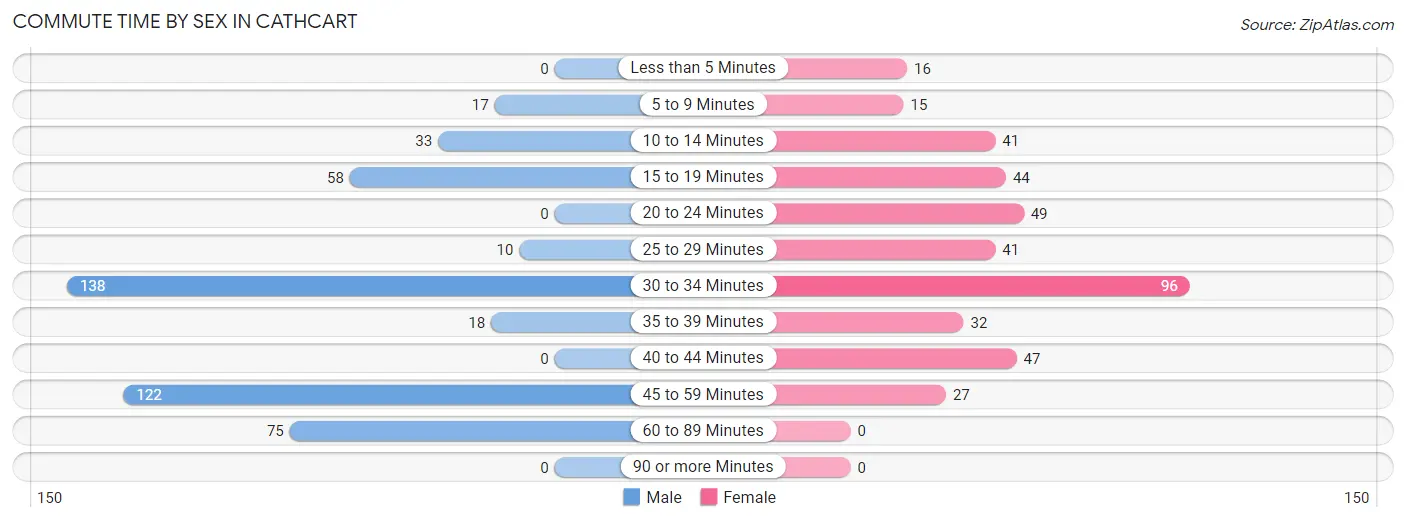
| Commute Time | Male | Female |
| Less than 5 Minutes | 0 (0.0%) | 16 (3.9%) |
| 5 to 9 Minutes | 17 (3.6%) | 15 (3.7%) |
| 10 to 14 Minutes | 33 (7.0%) | 41 (10.1%) |
| 15 to 19 Minutes | 58 (12.3%) | 44 (10.8%) |
| 20 to 24 Minutes | 0 (0.0%) | 49 (12.0%) |
| 25 to 29 Minutes | 10 (2.1%) | 41 (10.1%) |
| 30 to 34 Minutes | 138 (29.3%) | 96 (23.5%) |
| 35 to 39 Minutes | 18 (3.8%) | 32 (7.8%) |
| 40 to 44 Minutes | 0 (0.0%) | 47 (11.5%) |
| 45 to 59 Minutes | 122 (25.9%) | 27 (6.6%) |
| 60 to 89 Minutes | 75 (15.9%) | 0 (0.0%) |
| 90 or more Minutes | 0 (0.0%) | 0 (0.0%) |
Time of Departure to Work by Sex in Cathcart
The most frequent times of departure to work in Cathcart are 5:30 AM to 5:59 AM (162, 34.4%) for males and 9:00 AM to 9:59 AM (111, 27.2%) for females.
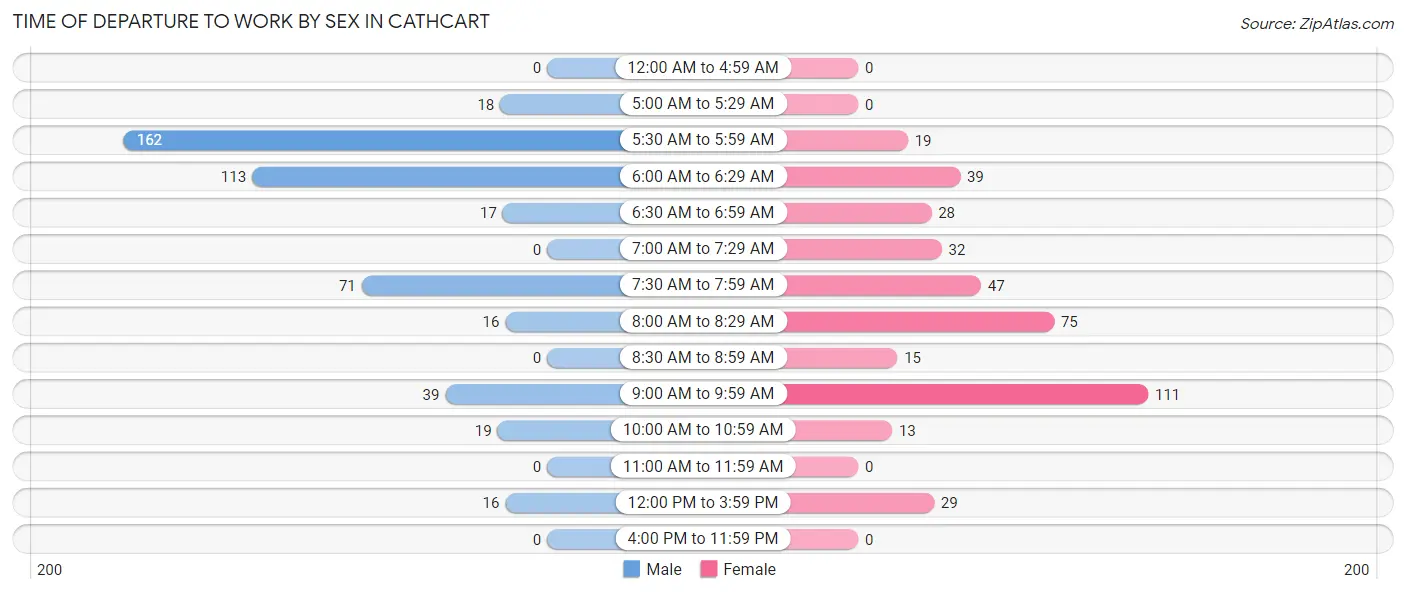
| Time of Departure | Male | Female |
| 12:00 AM to 4:59 AM | 0 (0.0%) | 0 (0.0%) |
| 5:00 AM to 5:29 AM | 18 (3.8%) | 0 (0.0%) |
| 5:30 AM to 5:59 AM | 162 (34.4%) | 19 (4.7%) |
| 6:00 AM to 6:29 AM | 113 (24.0%) | 39 (9.6%) |
| 6:30 AM to 6:59 AM | 17 (3.6%) | 28 (6.9%) |
| 7:00 AM to 7:29 AM | 0 (0.0%) | 32 (7.8%) |
| 7:30 AM to 7:59 AM | 71 (15.1%) | 47 (11.5%) |
| 8:00 AM to 8:29 AM | 16 (3.4%) | 75 (18.4%) |
| 8:30 AM to 8:59 AM | 0 (0.0%) | 15 (3.7%) |
| 9:00 AM to 9:59 AM | 39 (8.3%) | 111 (27.2%) |
| 10:00 AM to 10:59 AM | 19 (4.0%) | 13 (3.2%) |
| 11:00 AM to 11:59 AM | 0 (0.0%) | 0 (0.0%) |
| 12:00 PM to 3:59 PM | 16 (3.4%) | 29 (7.1%) |
| 4:00 PM to 11:59 PM | 0 (0.0%) | 0 (0.0%) |
| Total | 471 (100.0%) | 408 (100.0%) |
Housing Occupancy in Cathcart
Occupancy by Ownership in Cathcart
Of the total 819 dwellings in Cathcart, owner-occupied units account for 728 (88.9%), while renter-occupied units make up 91 (11.1%).
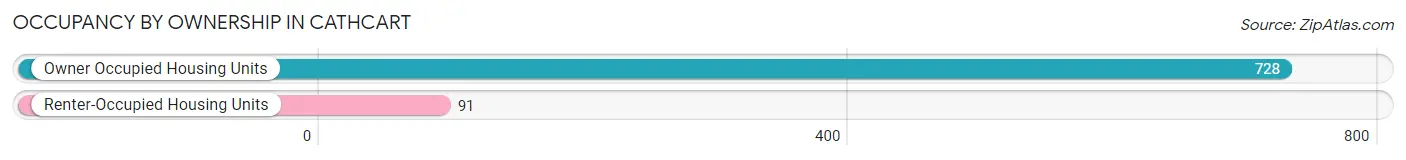
| Occupancy | # Housing Units | % Housing Units |
| Owner Occupied Housing Units | 728 | 88.9% |
| Renter-Occupied Housing Units | 91 | 11.1% |
| Total Occupied Housing Units | 819 | 100.0% |
Occupancy by Household Size in Cathcart
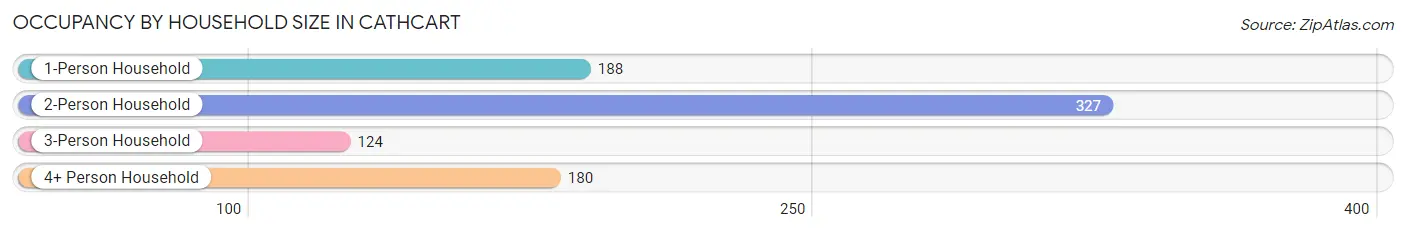
| Household Size | # Housing Units | % Housing Units |
| 1-Person Household | 188 | 23.0% |
| 2-Person Household | 327 | 39.9% |
| 3-Person Household | 124 | 15.1% |
| 4+ Person Household | 180 | 22.0% |
| Total Housing Units | 819 | 100.0% |
Occupancy by Ownership by Household Size in Cathcart
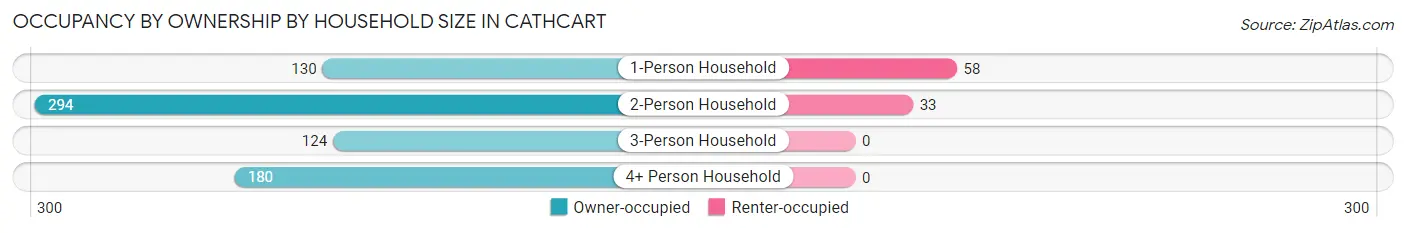
| Household Size | Owner-occupied | Renter-occupied |
| 1-Person Household | 130 (69.2%) | 58 (30.8%) |
| 2-Person Household | 294 (89.9%) | 33 (10.1%) |
| 3-Person Household | 124 (100.0%) | 0 (0.0%) |
| 4+ Person Household | 180 (100.0%) | 0 (0.0%) |
| Total Housing Units | 728 (88.9%) | 91 (11.1%) |
Occupancy by Educational Attainment in Cathcart
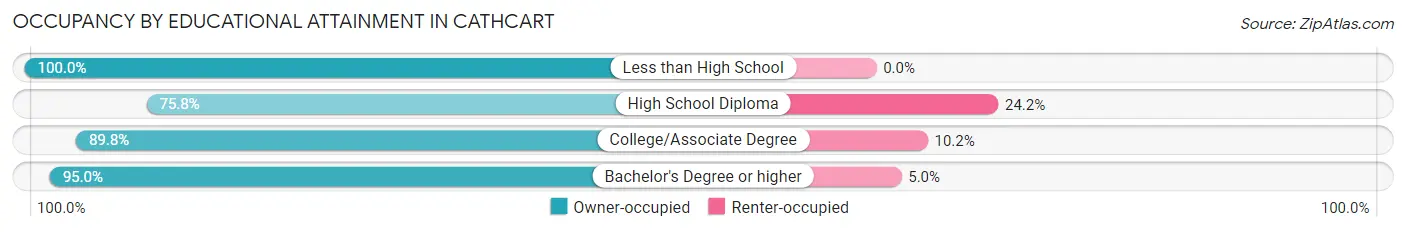
| Household Size | Owner-occupied | Renter-occupied |
| Less than High School | 16 (100.0%) | 0 (0.0%) |
| High School Diploma | 135 (75.8%) | 43 (24.2%) |
| College/Associate Degree | 291 (89.8%) | 33 (10.2%) |
| Bachelor's Degree or higher | 286 (95.0%) | 15 (5.0%) |
Occupancy by Age of Householder in Cathcart
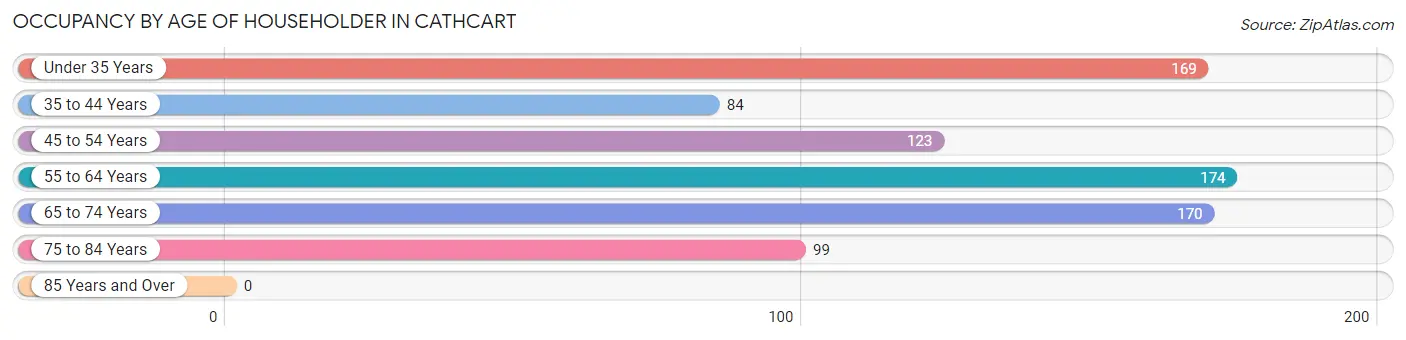
| Age Bracket | # Households | % Households |
| Under 35 Years | 169 | 20.6% |
| 35 to 44 Years | 84 | 10.3% |
| 45 to 54 Years | 123 | 15.0% |
| 55 to 64 Years | 174 | 21.2% |
| 65 to 74 Years | 170 | 20.8% |
| 75 to 84 Years | 99 | 12.1% |
| 85 Years and Over | 0 | 0.0% |
| Total | 819 | 100.0% |
Housing Finances in Cathcart
Median Income by Occupancy in Cathcart
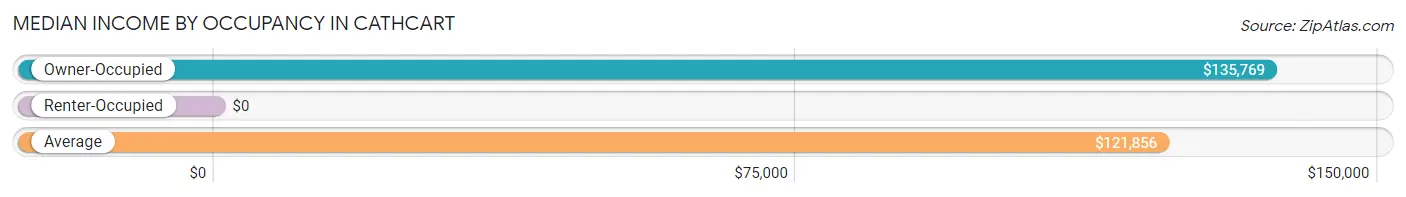
| Occupancy Type | # Households | Median Income |
| Owner-Occupied | 728 (88.9%) | $135,769 |
| Renter-Occupied | 91 (11.1%) | $0 |
| Average | 819 (100.0%) | $121,856 |
Occupancy by Householder Income Bracket in Cathcart
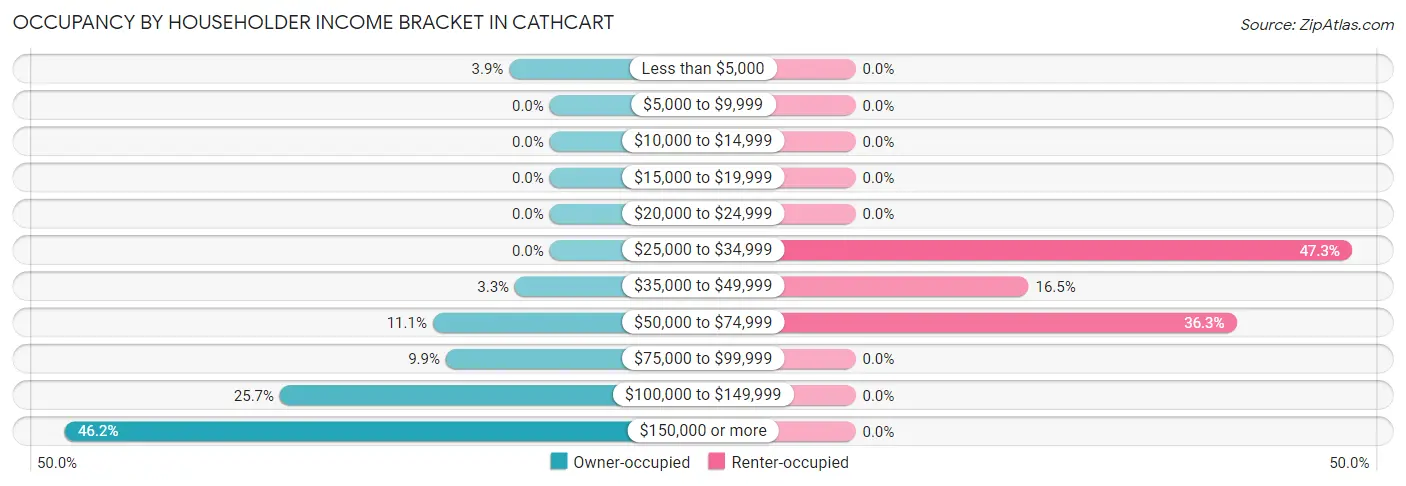
| Income Bracket | Owner-occupied | Renter-occupied |
| Less than $5,000 | 28 (3.8%) | 0 (0.0%) |
| $5,000 to $9,999 | 0 (0.0%) | 0 (0.0%) |
| $10,000 to $14,999 | 0 (0.0%) | 0 (0.0%) |
| $15,000 to $19,999 | 0 (0.0%) | 0 (0.0%) |
| $20,000 to $24,999 | 0 (0.0%) | 0 (0.0%) |
| $25,000 to $34,999 | 0 (0.0%) | 43 (47.2%) |
| $35,000 to $49,999 | 24 (3.3%) | 15 (16.5%) |
| $50,000 to $74,999 | 81 (11.1%) | 33 (36.3%) |
| $75,000 to $99,999 | 72 (9.9%) | 0 (0.0%) |
| $100,000 to $149,999 | 187 (25.7%) | 0 (0.0%) |
| $150,000 or more | 336 (46.2%) | 0 (0.0%) |
| Total | 728 (100.0%) | 91 (100.0%) |
Monthly Housing Cost Tiers in Cathcart
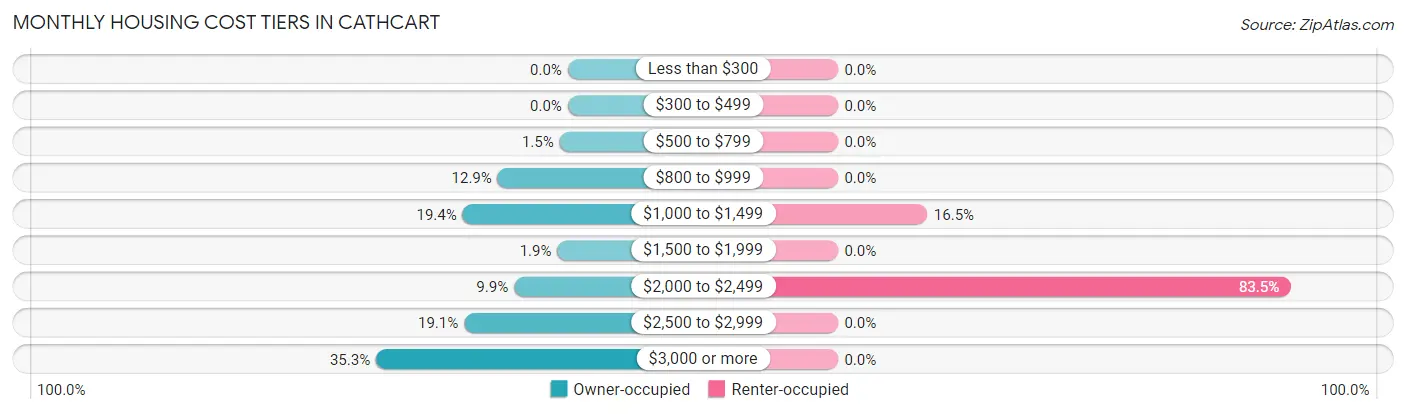
| Monthly Cost | Owner-occupied | Renter-occupied |
| Less than $300 | 0 (0.0%) | 0 (0.0%) |
| $300 to $499 | 0 (0.0%) | 0 (0.0%) |
| $500 to $799 | 11 (1.5%) | 0 (0.0%) |
| $800 to $999 | 94 (12.9%) | 0 (0.0%) |
| $1,000 to $1,499 | 141 (19.4%) | 15 (16.5%) |
| $1,500 to $1,999 | 14 (1.9%) | 0 (0.0%) |
| $2,000 to $2,499 | 72 (9.9%) | 76 (83.5%) |
| $2,500 to $2,999 | 139 (19.1%) | 0 (0.0%) |
| $3,000 or more | 257 (35.3%) | 0 (0.0%) |
| Total | 728 (100.0%) | 91 (100.0%) |
Physical Housing Characteristics in Cathcart
Housing Structures in Cathcart
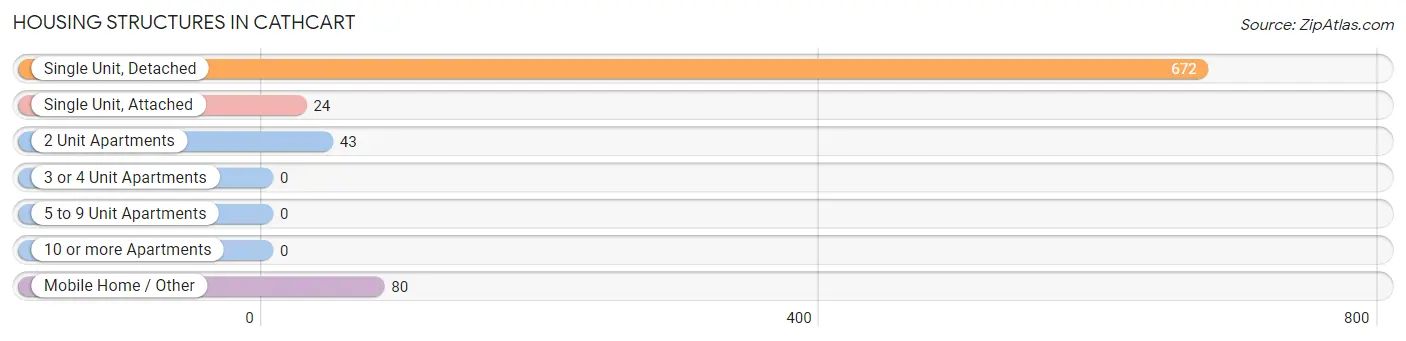
| Structure Type | # Housing Units | % Housing Units |
| Single Unit, Detached | 672 | 82.1% |
| Single Unit, Attached | 24 | 2.9% |
| 2 Unit Apartments | 43 | 5.2% |
| 3 or 4 Unit Apartments | 0 | 0.0% |
| 5 to 9 Unit Apartments | 0 | 0.0% |
| 10 or more Apartments | 0 | 0.0% |
| Mobile Home / Other | 80 | 9.8% |
| Total | 819 | 100.0% |
Housing Structures by Occupancy in Cathcart
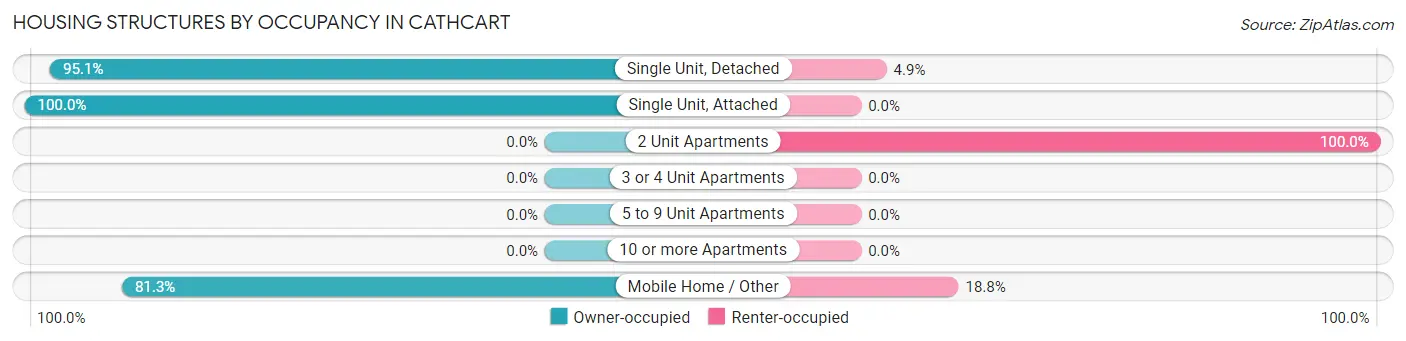
| Structure Type | Owner-occupied | Renter-occupied |
| Single Unit, Detached | 639 (95.1%) | 33 (4.9%) |
| Single Unit, Attached | 24 (100.0%) | 0 (0.0%) |
| 2 Unit Apartments | 0 (0.0%) | 43 (100.0%) |
| 3 or 4 Unit Apartments | 0 (0.0%) | 0 (0.0%) |
| 5 to 9 Unit Apartments | 0 (0.0%) | 0 (0.0%) |
| 10 or more Apartments | 0 (0.0%) | 0 (0.0%) |
| Mobile Home / Other | 65 (81.2%) | 15 (18.8%) |
| Total | 728 (88.9%) | 91 (11.1%) |
Housing Structures by Number of Rooms in Cathcart
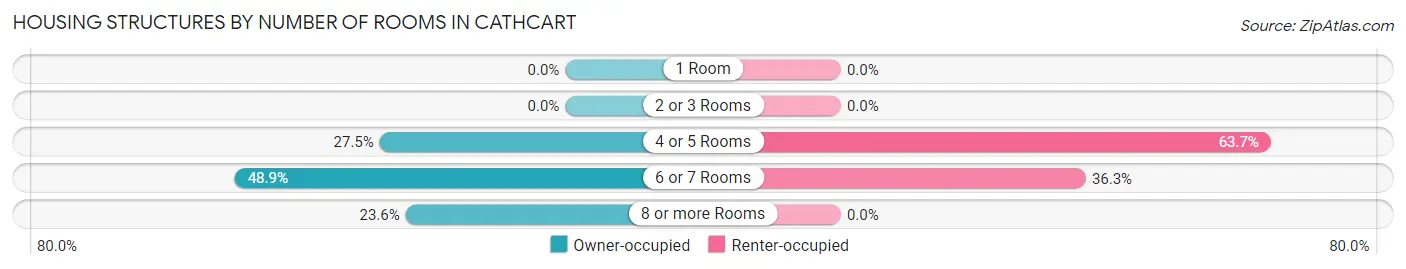
| Number of Rooms | Owner-occupied | Renter-occupied |
| 1 Room | 0 (0.0%) | 0 (0.0%) |
| 2 or 3 Rooms | 0 (0.0%) | 0 (0.0%) |
| 4 or 5 Rooms | 200 (27.5%) | 58 (63.7%) |
| 6 or 7 Rooms | 356 (48.9%) | 33 (36.3%) |
| 8 or more Rooms | 172 (23.6%) | 0 (0.0%) |
| Total | 728 (100.0%) | 91 (100.0%) |
Housing Structure by Heating Type in Cathcart
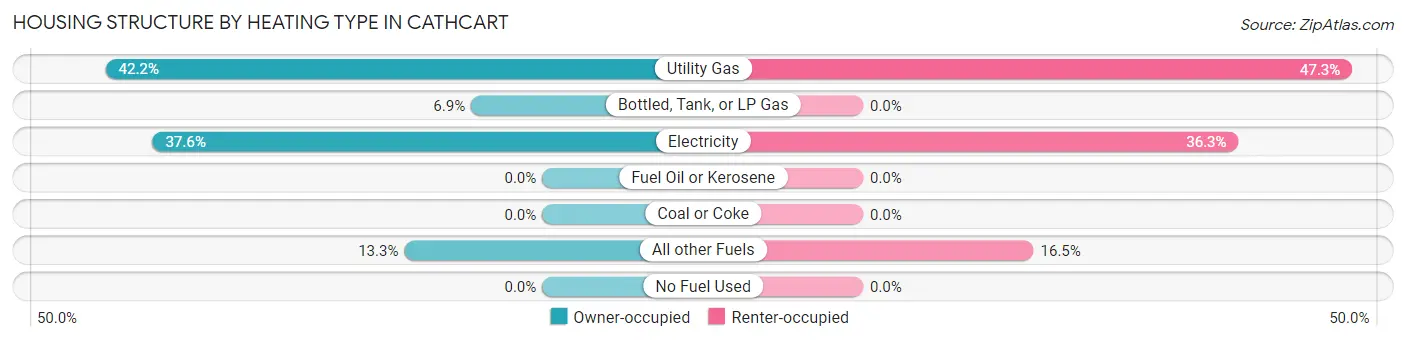
| Heating Type | Owner-occupied | Renter-occupied |
| Utility Gas | 307 (42.2%) | 43 (47.2%) |
| Bottled, Tank, or LP Gas | 50 (6.9%) | 0 (0.0%) |
| Electricity | 274 (37.6%) | 33 (36.3%) |
| Fuel Oil or Kerosene | 0 (0.0%) | 0 (0.0%) |
| Coal or Coke | 0 (0.0%) | 0 (0.0%) |
| All other Fuels | 97 (13.3%) | 15 (16.5%) |
| No Fuel Used | 0 (0.0%) | 0 (0.0%) |
| Total | 728 (100.0%) | 91 (100.0%) |
Household Vehicle Usage in Cathcart
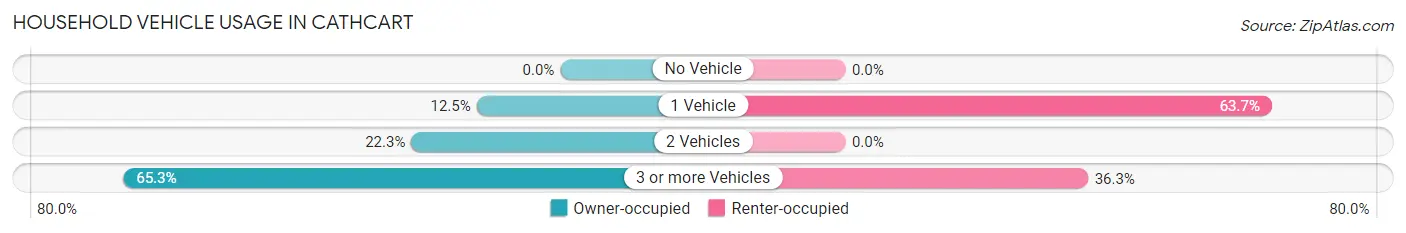
| Vehicles per Household | Owner-occupied | Renter-occupied |
| No Vehicle | 0 (0.0%) | 0 (0.0%) |
| 1 Vehicle | 91 (12.5%) | 58 (63.7%) |
| 2 Vehicles | 162 (22.3%) | 0 (0.0%) |
| 3 or more Vehicles | 475 (65.2%) | 33 (36.3%) |
| Total | 728 (100.0%) | 91 (100.0%) |
Real Estate & Mortgages in Cathcart
Real Estate and Mortgage Overview in Cathcart
| Characteristic | Without Mortgage | With Mortgage |
| Housing Units | 218 | 510 |
| Median Property Value | $681,500 | $792,900 |
| Median Household Income | $101,379 | $263 |
| Monthly Housing Costs | $1,029 | $257 |
| Real Estate Taxes | $6,092 | $0 |
Property Value by Mortgage Status in Cathcart
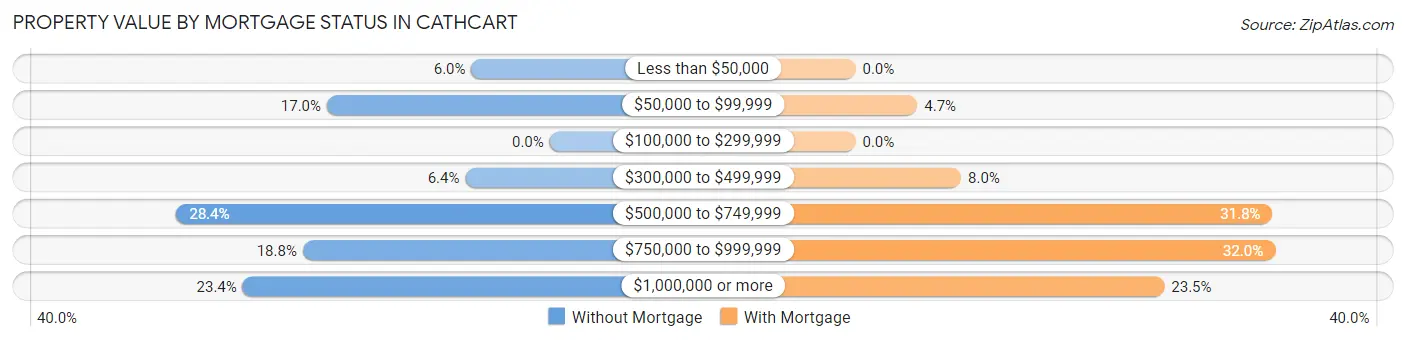
| Property Value | Without Mortgage | With Mortgage |
| Less than $50,000 | 13 (6.0%) | 0 (0.0%) |
| $50,000 to $99,999 | 37 (17.0%) | 24 (4.7%) |
| $100,000 to $299,999 | 0 (0.0%) | 0 (0.0%) |
| $300,000 to $499,999 | 14 (6.4%) | 41 (8.0%) |
| $500,000 to $749,999 | 62 (28.4%) | 162 (31.8%) |
| $750,000 to $999,999 | 41 (18.8%) | 163 (32.0%) |
| $1,000,000 or more | 51 (23.4%) | 120 (23.5%) |
| Total | 218 (100.0%) | 510 (100.0%) |
Household Income by Mortgage Status in Cathcart
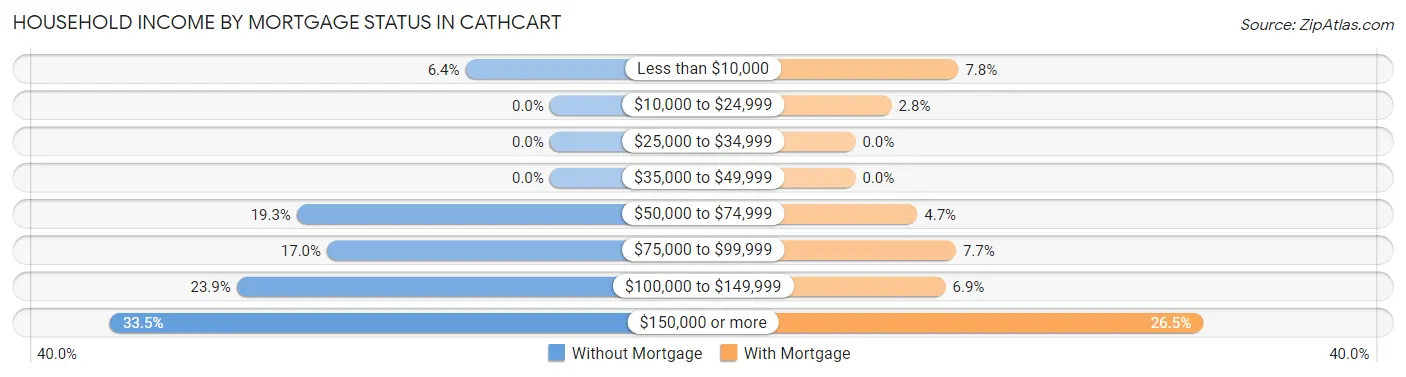
| Household Income | Without Mortgage | With Mortgage |
| Less than $10,000 | 14 (6.4%) | 40 (7.8%) |
| $10,000 to $24,999 | 0 (0.0%) | 14 (2.8%) |
| $25,000 to $34,999 | 0 (0.0%) | 0 (0.0%) |
| $35,000 to $49,999 | 0 (0.0%) | 0 (0.0%) |
| $50,000 to $74,999 | 42 (19.3%) | 24 (4.7%) |
| $75,000 to $99,999 | 37 (17.0%) | 39 (7.6%) |
| $100,000 to $149,999 | 52 (23.8%) | 35 (6.9%) |
| $150,000 or more | 73 (33.5%) | 135 (26.5%) |
| Total | 218 (100.0%) | 510 (100.0%) |
Property Value to Household Income Ratio in Cathcart
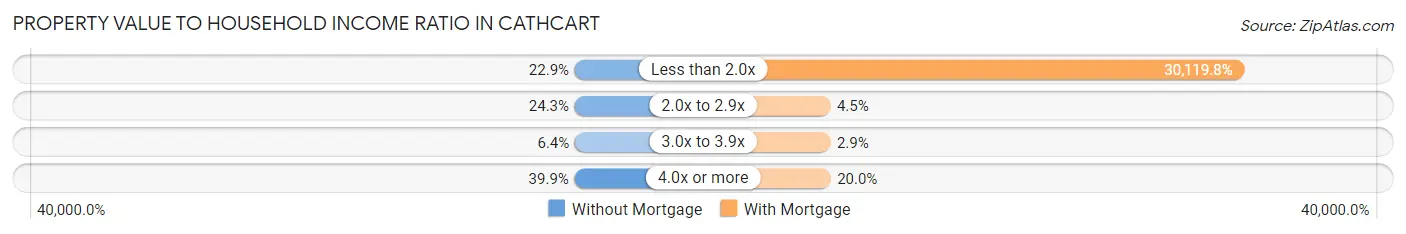
| Value-to-Income Ratio | Without Mortgage | With Mortgage |
| Less than 2.0x | 50 (22.9%) | 153,611 (30,119.8%) |
| 2.0x to 2.9x | 53 (24.3%) | 23 (4.5%) |
| 3.0x to 3.9x | 14 (6.4%) | 15 (2.9%) |
| 4.0x or more | 87 (39.9%) | 102 (20.0%) |
| Total | 218 (100.0%) | 510 (100.0%) |
Real Estate Taxes by Mortgage Status in Cathcart
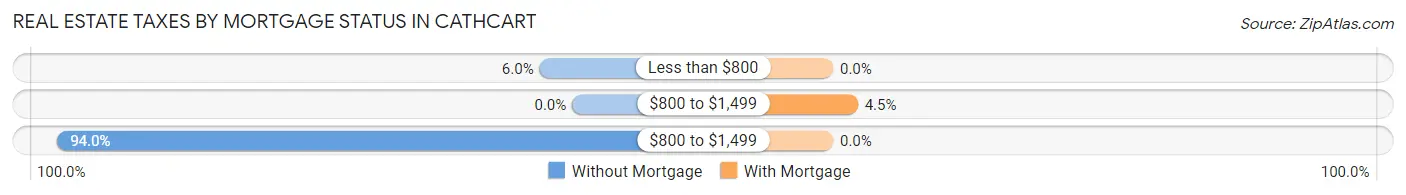
| Property Taxes | Without Mortgage | With Mortgage |
| Less than $800 | 13 (6.0%) | 0 (0.0%) |
| $800 to $1,499 | 0 (0.0%) | 23 (4.5%) |
| $800 to $1,499 | 205 (94.0%) | 0 (0.0%) |
| Total | 218 (100.0%) | 510 (100.0%) |
Health & Disability in Cathcart
Health Insurance Coverage by Age in Cathcart
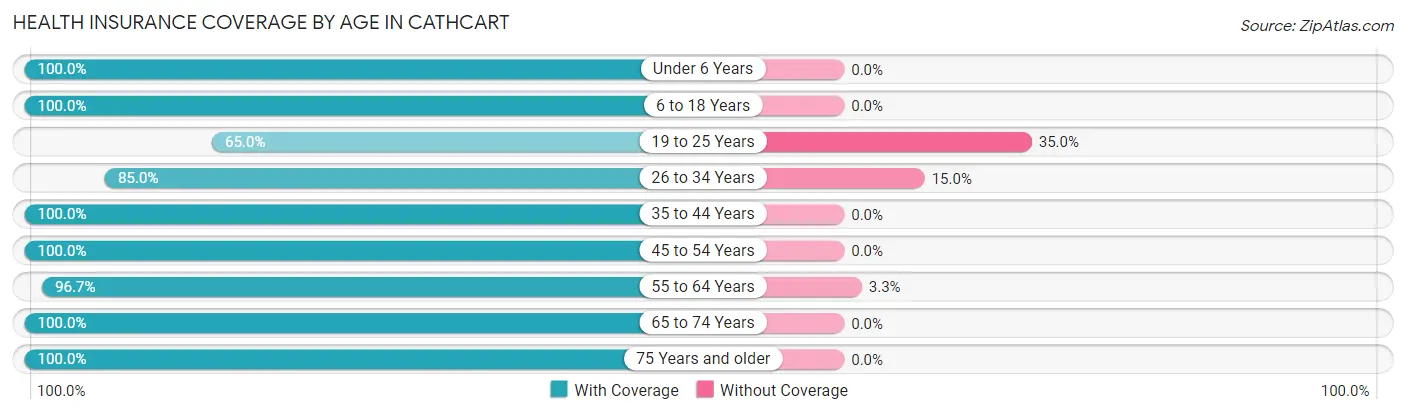
| Age Bracket | With Coverage | Without Coverage |
| Under 6 Years | 132 (100.0%) | 0 (0.0%) |
| 6 to 18 Years | 235 (100.0%) | 0 (0.0%) |
| 19 to 25 Years | 80 (65.0%) | 43 (35.0%) |
| 26 to 34 Years | 340 (85.0%) | 60 (15.0%) |
| 35 to 44 Years | 145 (100.0%) | 0 (0.0%) |
| 45 to 54 Years | 234 (100.0%) | 0 (0.0%) |
| 55 to 64 Years | 414 (96.7%) | 14 (3.3%) |
| 65 to 74 Years | 267 (100.0%) | 0 (0.0%) |
| 75 Years and older | 141 (100.0%) | 0 (0.0%) |
| Total | 1,988 (94.4%) | 117 (5.6%) |
Health Insurance Coverage by Citizenship Status in Cathcart
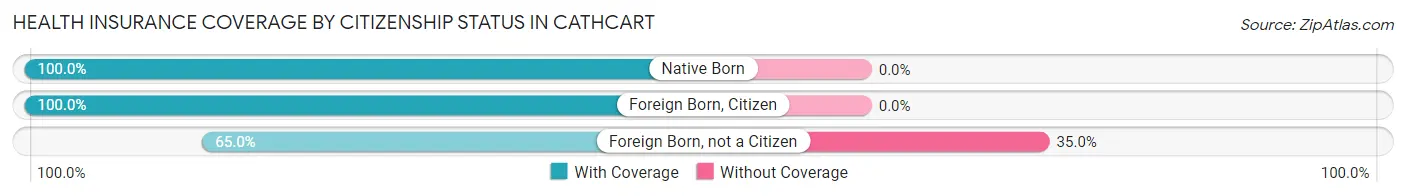
| Citizenship Status | With Coverage | Without Coverage |
| Native Born | 132 (100.0%) | 0 (0.0%) |
| Foreign Born, Citizen | 235 (100.0%) | 0 (0.0%) |
| Foreign Born, not a Citizen | 80 (65.0%) | 43 (35.0%) |
Health Insurance Coverage by Household Income in Cathcart
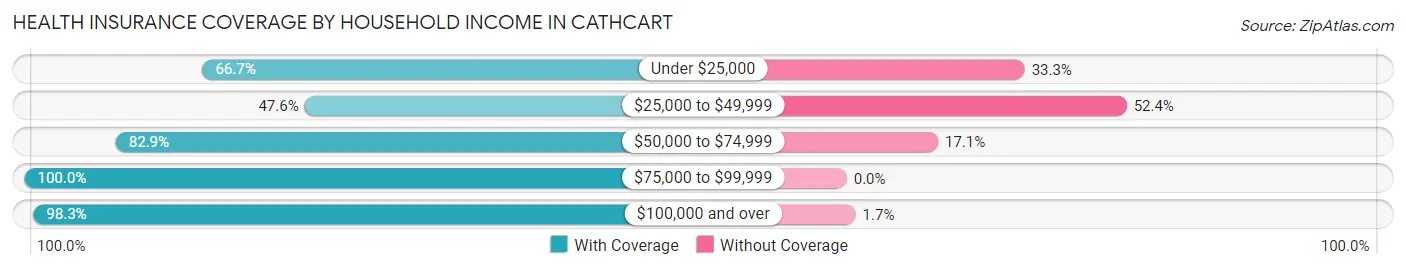
| Household Income | With Coverage | Without Coverage |
| Under $25,000 | 28 (66.7%) | 14 (33.3%) |
| $25,000 to $49,999 | 39 (47.6%) | 43 (52.4%) |
| $50,000 to $74,999 | 160 (82.9%) | 33 (17.1%) |
| $75,000 to $99,999 | 154 (100.0%) | 0 (0.0%) |
| $100,000 and over | 1,604 (98.3%) | 27 (1.7%) |
Public vs Private Health Insurance Coverage by Age in Cathcart
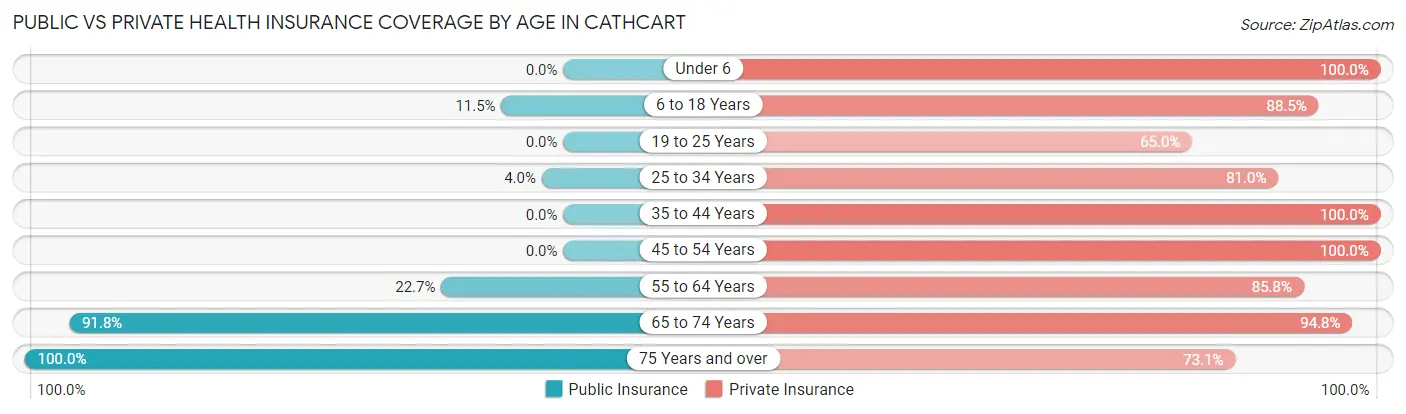
| Age Bracket | Public Insurance | Private Insurance |
| Under 6 | 0 (0.0%) | 132 (100.0%) |
| 6 to 18 Years | 27 (11.5%) | 208 (88.5%) |
| 19 to 25 Years | 0 (0.0%) | 80 (65.0%) |
| 25 to 34 Years | 16 (4.0%) | 324 (81.0%) |
| 35 to 44 Years | 0 (0.0%) | 145 (100.0%) |
| 45 to 54 Years | 0 (0.0%) | 234 (100.0%) |
| 55 to 64 Years | 97 (22.7%) | 367 (85.8%) |
| 65 to 74 Years | 245 (91.8%) | 253 (94.8%) |
| 75 Years and over | 141 (100.0%) | 103 (73.1%) |
| Total | 526 (25.0%) | 1,846 (87.7%) |
Disability Status by Sex by Age in Cathcart
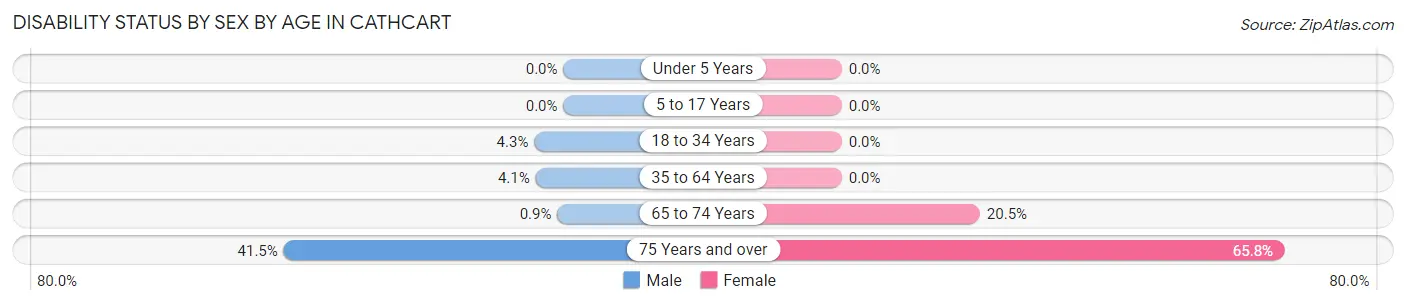
| Age Bracket | Male | Female |
| Under 5 Years | 0 (0.0%) | 0 (0.0%) |
| 5 to 17 Years | 0 (0.0%) | 0 (0.0%) |
| 18 to 34 Years | 13 (4.3%) | 0 (0.0%) |
| 35 to 64 Years | 17 (4.1%) | 0 (0.0%) |
| 65 to 74 Years | 1 (0.9%) | 32 (20.5%) |
| 75 Years and over | 27 (41.5%) | 50 (65.8%) |
Disability Class by Sex by Age in Cathcart
Disability Class: Hearing Difficulty
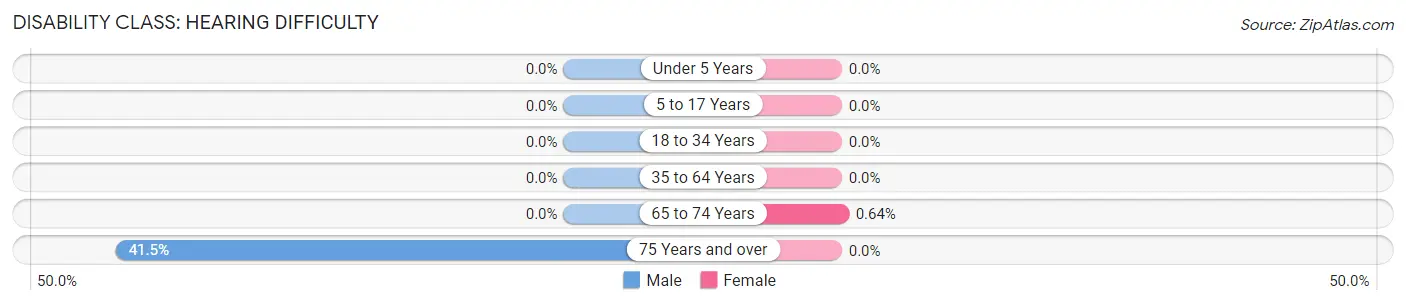
| Age Bracket | Male | Female |
| Under 5 Years | 0 (0.0%) | 0 (0.0%) |
| 5 to 17 Years | 0 (0.0%) | 0 (0.0%) |
| 18 to 34 Years | 0 (0.0%) | 0 (0.0%) |
| 35 to 64 Years | 0 (0.0%) | 0 (0.0%) |
| 65 to 74 Years | 0 (0.0%) | 1 (0.6%) |
| 75 Years and over | 27 (41.5%) | 0 (0.0%) |
Disability Class: Vision Difficulty
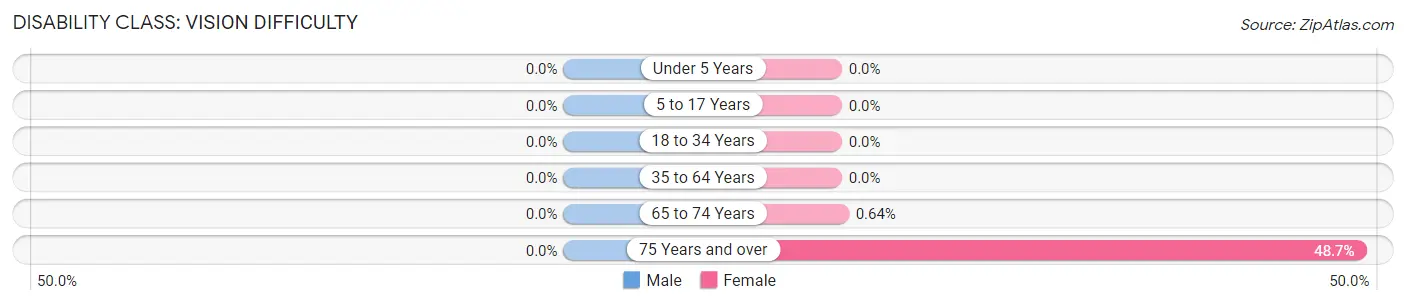
| Age Bracket | Male | Female |
| Under 5 Years | 0 (0.0%) | 0 (0.0%) |
| 5 to 17 Years | 0 (0.0%) | 0 (0.0%) |
| 18 to 34 Years | 0 (0.0%) | 0 (0.0%) |
| 35 to 64 Years | 0 (0.0%) | 0 (0.0%) |
| 65 to 74 Years | 0 (0.0%) | 1 (0.6%) |
| 75 Years and over | 0 (0.0%) | 37 (48.7%) |
Disability Class: Cognitive Difficulty
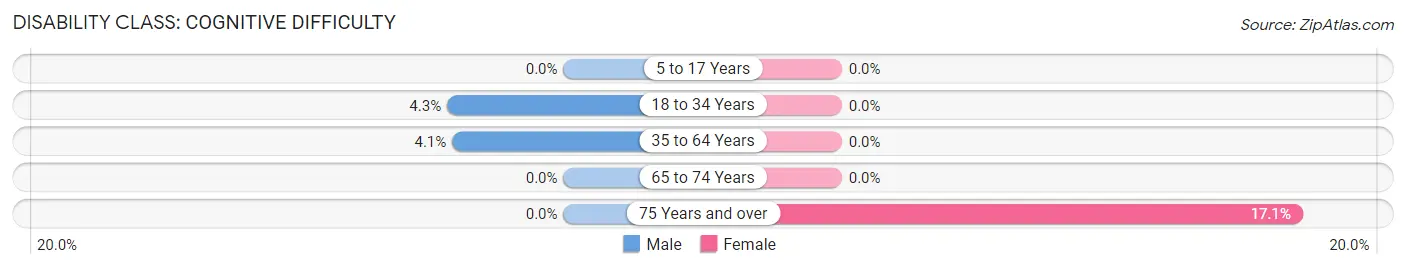
| Age Bracket | Male | Female |
| 5 to 17 Years | 0 (0.0%) | 0 (0.0%) |
| 18 to 34 Years | 13 (4.3%) | 0 (0.0%) |
| 35 to 64 Years | 17 (4.1%) | 0 (0.0%) |
| 65 to 74 Years | 0 (0.0%) | 0 (0.0%) |
| 75 Years and over | 0 (0.0%) | 13 (17.1%) |
Disability Class: Ambulatory Difficulty
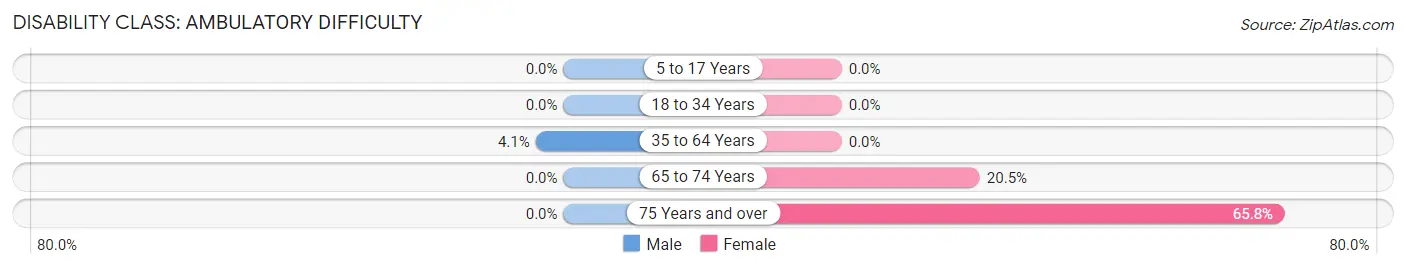
| Age Bracket | Male | Female |
| 5 to 17 Years | 0 (0.0%) | 0 (0.0%) |
| 18 to 34 Years | 0 (0.0%) | 0 (0.0%) |
| 35 to 64 Years | 17 (4.1%) | 0 (0.0%) |
| 65 to 74 Years | 0 (0.0%) | 32 (20.5%) |
| 75 Years and over | 0 (0.0%) | 50 (65.8%) |
Disability Class: Self-Care Difficulty
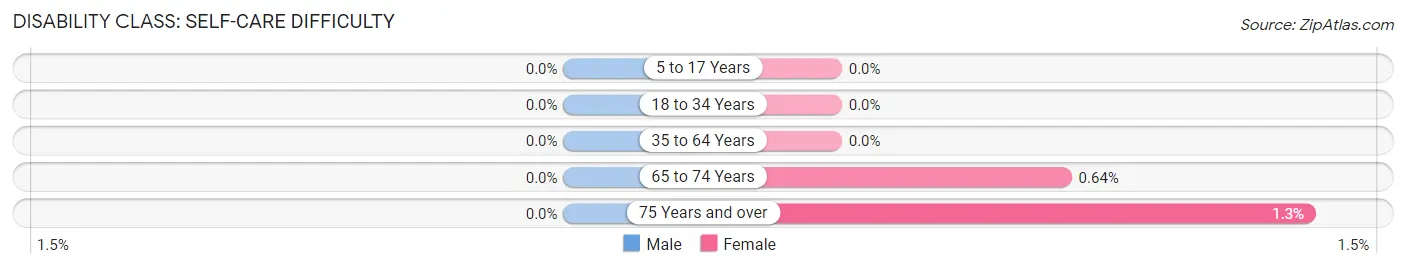
| Age Bracket | Male | Female |
| 5 to 17 Years | 0 (0.0%) | 0 (0.0%) |
| 18 to 34 Years | 0 (0.0%) | 0 (0.0%) |
| 35 to 64 Years | 0 (0.0%) | 0 (0.0%) |
| 65 to 74 Years | 0 (0.0%) | 1 (0.6%) |
| 75 Years and over | 0 (0.0%) | 1 (1.3%) |
Technology Access in Cathcart
Computing Device Access in Cathcart
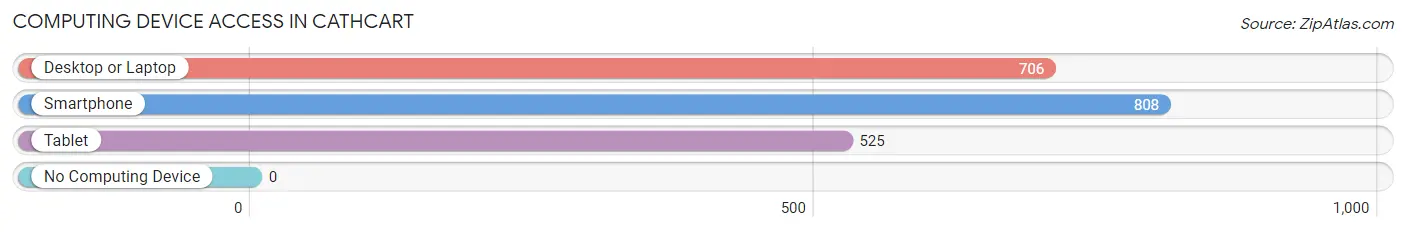
| Device Type | # Households | % Households |
| Desktop or Laptop | 706 | 86.2% |
| Smartphone | 808 | 98.7% |
| Tablet | 525 | 64.1% |
| No Computing Device | 0 | 0.0% |
| Total | 819 | 100.0% |
Internet Access in Cathcart
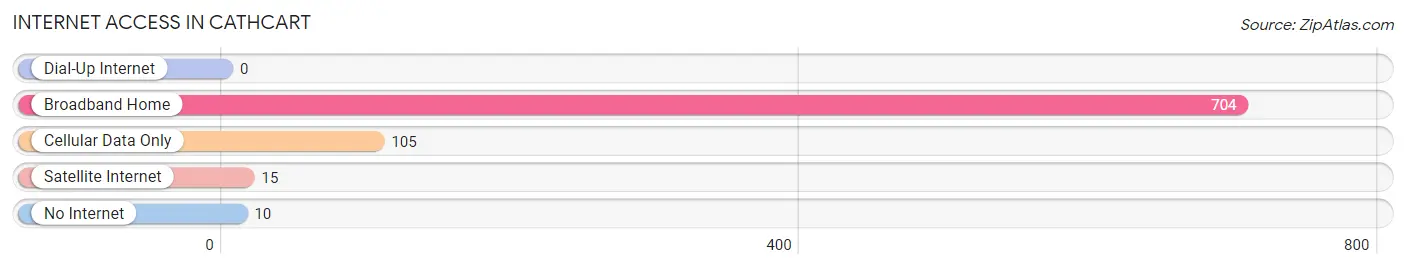
| Internet Type | # Households | % Households |
| Dial-Up Internet | 0 | 0.0% |
| Broadband Home | 704 | 86.0% |
| Cellular Data Only | 105 | 12.8% |
| Satellite Internet | 15 | 1.8% |
| No Internet | 10 | 1.2% |
| Total | 819 | 100.0% |
Cathcart Summary
History
The area now known as Cathcart, Washington was first inhabited by the Chinook and Cowlitz Native American tribes. The first European settlers arrived in the area in the late 1800s, and the town was officially founded in 1891. The town was named after the Cathcart family, who were among the first settlers in the area.
The town was initially a logging and farming community, and the first sawmill was built in 1892. The town grew rapidly in the early 1900s, and by 1910, it had a population of over 500 people. The town was incorporated in 1911, and the first mayor was elected in 1912.
The town continued to grow throughout the 20th century, and by the 1950s, it had a population of over 1,000 people. The town was home to several businesses, including a lumber mill, a cannery, and a dairy.
Geography
Cathcart is located in the southwestern corner of Washington State, in the foothills of the Cascade Mountains. The town is situated on the banks of the Cowlitz River, and is surrounded by forests and rolling hills. The town is located about 25 miles east of the city of Olympia, and about 50 miles south of Seattle.
The climate in Cathcart is mild and temperate, with warm summers and cool winters. The average annual temperature is around 50 degrees Fahrenheit, and the average annual precipitation is around 40 inches.
Economy
The economy of Cathcart is largely based on agriculture and forestry. The town is home to several farms, and the surrounding area is home to several timber companies. The town is also home to several small businesses, including restaurants, shops, and a hardware store.
The town is also home to a small manufacturing sector, which produces a variety of products, including furniture, clothing, and electronics. The town is also home to a small tourism industry, which attracts visitors from around the region.
Demographics
As of the 2010 census, the population of Cathcart was 1,093. The racial makeup of the town was 94.3% White, 0.7% African American, 0.7% Native American, 0.7% Asian, 0.3% Pacific Islander, and 2.7% from other races. The median household income was $45,000, and the median family income was $50,000.
The town is home to a variety of religious denominations, including Catholic, Protestant, and Mormon. The town is also home to a variety of cultural and recreational activities, including a local theater, a library, and several parks.
Common Questions
What is Per Capita Income in Cathcart?
Per Capita income in Cathcart is $57,742.
What is the Median Family Income in Cathcart?
Median Family Income in Cathcart is $144,618.
What is the Median Household income in Cathcart?
Median Household Income in Cathcart is $121,856.
What is Income or Wage Gap in Cathcart?
Income or Wage Gap in Cathcart is 48.4%.
Women in Cathcart earn 51.6 cents for every dollar earned by a man.
What is Inequality or Gini Index in Cathcart?
Inequality or Gini Index in Cathcart is 0.37.
What is the Total Population of Cathcart?
Total Population of Cathcart is 2,105.
What is the Total Male Population of Cathcart?
Total Male Population of Cathcart is 1,083.
What is the Total Female Population of Cathcart?
Total Female Population of Cathcart is 1,022.
What is the Ratio of Males per 100 Females in Cathcart?
There are 105.97 Males per 100 Females in Cathcart.
What is the Ratio of Females per 100 Males in Cathcart?
There are 94.37 Females per 100 Males in Cathcart.
What is the Median Population Age in Cathcart?
Median Population Age in Cathcart is 45.4 Years.
What is the Average Family Size in Cathcart
Average Family Size in Cathcart is 3.1 People.
What is the Average Household Size in Cathcart
Average Household Size in Cathcart is 2.6 People.
How Large is the Labor Force in Cathcart?
There are 1,058 People in the Labor Forcein in Cathcart.
What is the Percentage of People in the Labor Force in Cathcart?
57.6% of People are in the Labor Force in Cathcart.
What is the Unemployment Rate in Cathcart?
Unemployment Rate in Cathcart is 1.0%.