Neah Bay, WA Map & Demographics
Neah Bay Map
Neah Bay Overview
$26,795
PER CAPITA INCOME
$64,722
AVG FAMILY INCOME
$63,750
AVG HOUSEHOLD INCOME
7.1%
WAGE / INCOME GAP [ % ]
92.9¢/ $1
WAGE / INCOME GAP [ $ ]
0.45
INEQUALITY / GINI INDEX
1,081
TOTAL POPULATION
499
MALE POPULATION
582
FEMALE POPULATION
85.74
MALES / 100 FEMALES
116.63
FEMALES / 100 MALES
27.3
MEDIAN AGE
3.7
AVG FAMILY SIZE
3.2
AVG HOUSEHOLD SIZE
545
LABOR FORCE [ PEOPLE ]
66.3%
PERCENT IN LABOR FORCE
8.5%
UNEMPLOYMENT RATE
Neah Bay Zip Codes
Neah Bay Area Codes
Income in Neah Bay
Income Overview in Neah Bay
Per Capita Income in Neah Bay is $26,795, while median incomes of families and households are $64,722 and $63,750 respectively.
| Characteristic | Number | Measure |
| Per Capita Income | 1,081 | $26,795 |
| Median Family Income | 218 | $64,722 |
| Mean Family Income | 218 | $76,397 |
| Median Household Income | 333 | $63,750 |
| Mean Household Income | 333 | $77,327 |
| Income Deficit | 218 | $0 |
| Wage / Income Gap (%) | 1,081 | 7.12% |
| Wage / Income Gap ($) | 1,081 | 92.88¢ per $1 |
| Gini / Inequality Index | 1,081 | 0.45 |
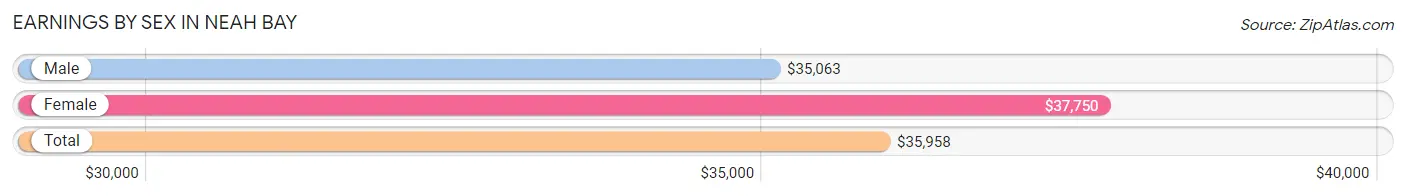
Earnings by Sex in Neah Bay
Average Earnings in Neah Bay are $35,958, $35,063 for men and $37,750 for women, a difference of 7.1%.
| Sex | Number | Average Earnings |
| Male | 323 (55.2%) | $35,063 |
| Female | 262 (44.8%) | $37,750 |
| Total | 585 (100.0%) | $35,958 |
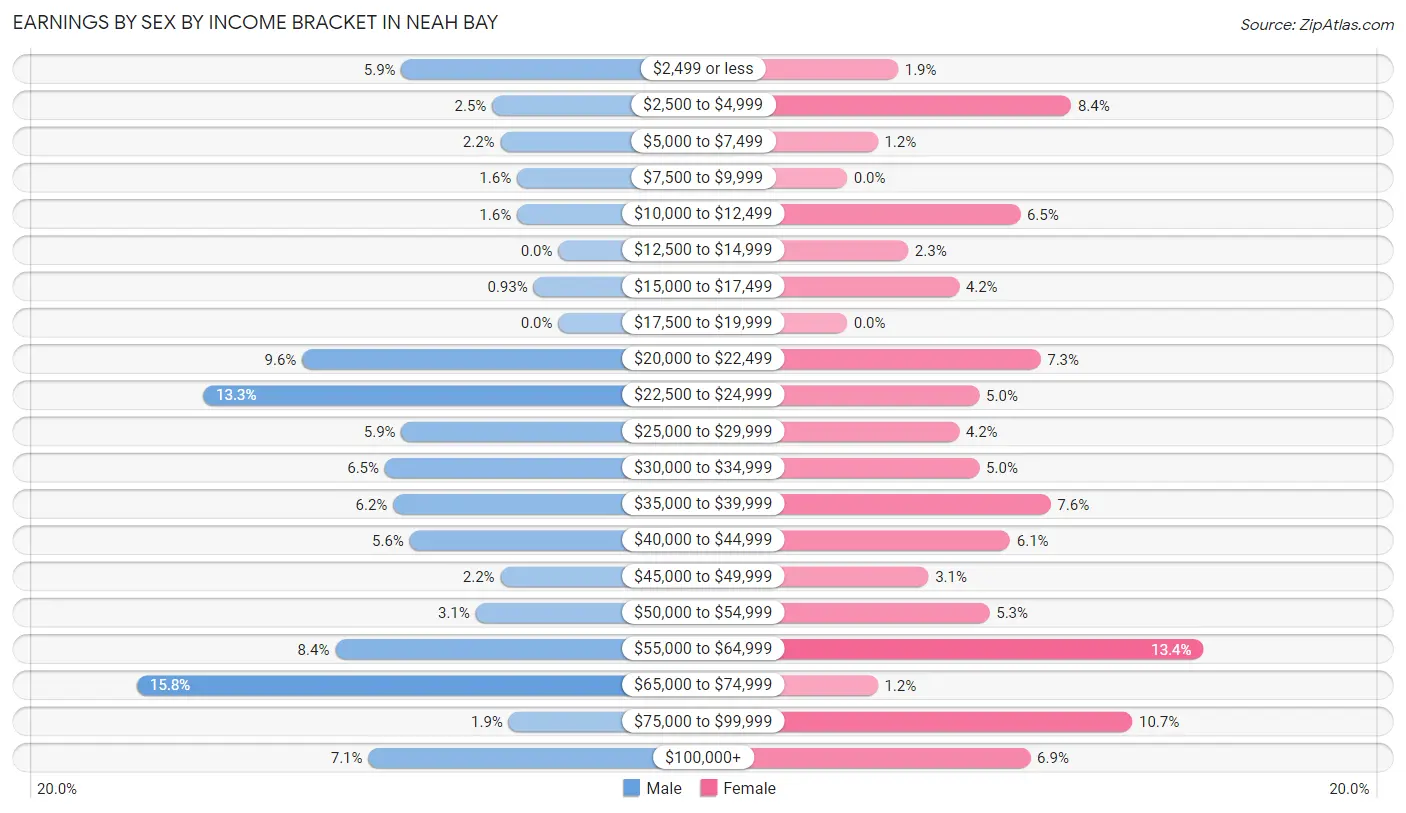
Earnings by Sex by Income Bracket in Neah Bay
The most common earnings brackets in Neah Bay are $65,000 to $74,999 for men (51 | 15.8%) and $55,000 to $64,999 for women (35 | 13.4%).
| Income | Male | Female |
| $2,499 or less | 19 (5.9%) | 5 (1.9%) |
| $2,500 to $4,999 | 8 (2.5%) | 22 (8.4%) |
| $5,000 to $7,499 | 7 (2.2%) | 3 (1.1%) |
| $7,500 to $9,999 | 5 (1.5%) | 0 (0.0%) |
| $10,000 to $12,499 | 5 (1.5%) | 17 (6.5%) |
| $12,500 to $14,999 | 0 (0.0%) | 6 (2.3%) |
| $15,000 to $17,499 | 3 (0.9%) | 11 (4.2%) |
| $17,500 to $19,999 | 0 (0.0%) | 0 (0.0%) |
| $20,000 to $22,499 | 31 (9.6%) | 19 (7.2%) |
| $22,500 to $24,999 | 43 (13.3%) | 13 (5.0%) |
| $25,000 to $29,999 | 19 (5.9%) | 11 (4.2%) |
| $30,000 to $34,999 | 21 (6.5%) | 13 (5.0%) |
| $35,000 to $39,999 | 20 (6.2%) | 20 (7.6%) |
| $40,000 to $44,999 | 18 (5.6%) | 16 (6.1%) |
| $45,000 to $49,999 | 7 (2.2%) | 8 (3.0%) |
| $50,000 to $54,999 | 10 (3.1%) | 14 (5.3%) |
| $55,000 to $64,999 | 27 (8.4%) | 35 (13.4%) |
| $65,000 to $74,999 | 51 (15.8%) | 3 (1.1%) |
| $75,000 to $99,999 | 6 (1.9%) | 28 (10.7%) |
| $100,000+ | 23 (7.1%) | 18 (6.9%) |
| Total | 323 (100.0%) | 262 (100.0%) |
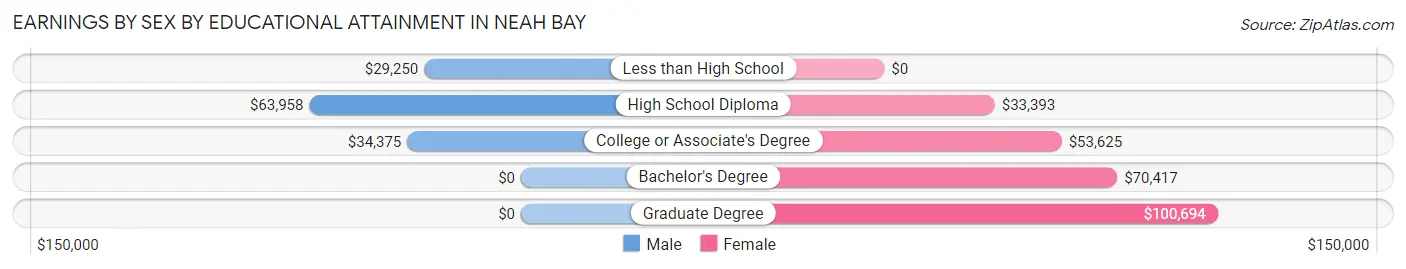
Earnings by Sex by Educational Attainment in Neah Bay
Average earnings in Neah Bay are $40,481 for men and $53,000 for women, a difference of 23.6%. Men with an educational attainment of high school diploma enjoy the highest average annual earnings of $63,958, while those with less than high school education earn the least with $29,250. Women with an educational attainment of graduate degree earn the most with the average annual earnings of $100,694, while those with high school diploma education have the smallest earnings of $33,393.
| Educational Attainment | Male Income | Female Income |
| Less than High School | $29,250 | $0 |
| High School Diploma | $63,958 | $33,393 |
| College or Associate's Degree | $34,375 | $53,625 |
| Bachelor's Degree | - | - |
| Graduate Degree | - | - |
| Total | $40,481 | $53,000 |
Family Income in Neah Bay
Family Income Brackets in Neah Bay
According to the Neah Bay family income data, there are 59 families falling into the $50,000 to $74,999 income range, which is the most common income bracket and makes up 27.1% of all families.
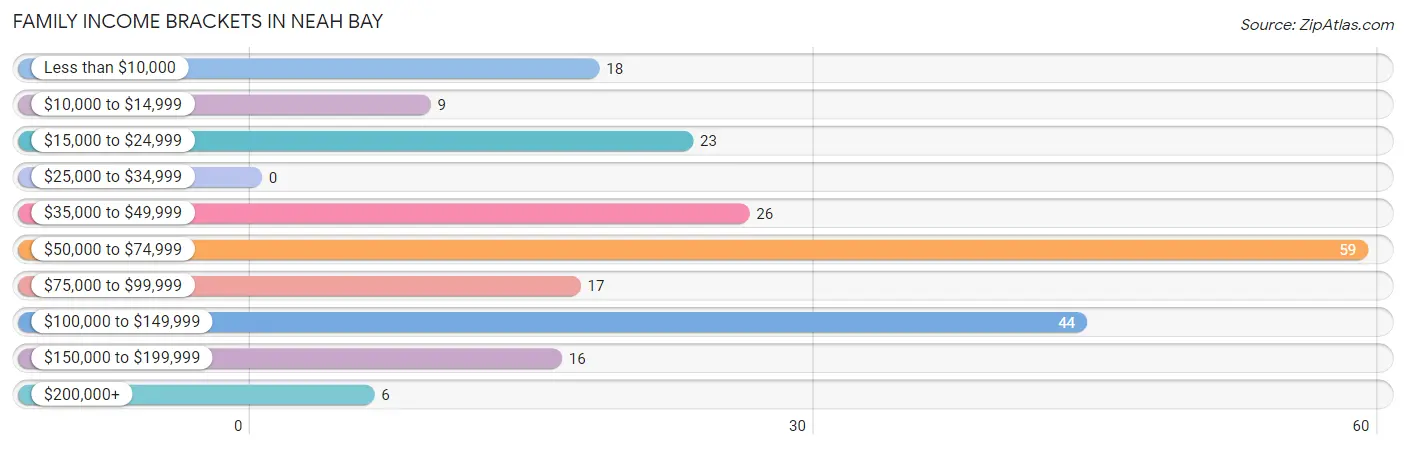
| Income Bracket | # Families | % Families |
| Less than $10,000 | 18 | 8.3% |
| $10,000 to $14,999 | 9 | 4.1% |
| $15,000 to $24,999 | 23 | 10.6% |
| $25,000 to $34,999 | 0 | 0.0% |
| $35,000 to $49,999 | 26 | 11.9% |
| $50,000 to $74,999 | 59 | 27.1% |
| $75,000 to $99,999 | 17 | 7.8% |
| $100,000 to $149,999 | 44 | 20.2% |
| $150,000 to $199,999 | 16 | 7.3% |
| $200,000+ | 6 | 2.8% |
Family Income by Famaliy Size in Neah Bay
3-person families (57 | 26.2%) account for the highest median family income in Neah Bay with $62,750 per family, while 2-person families (59 | 27.1%) have the highest median income of $29,875 per family member.
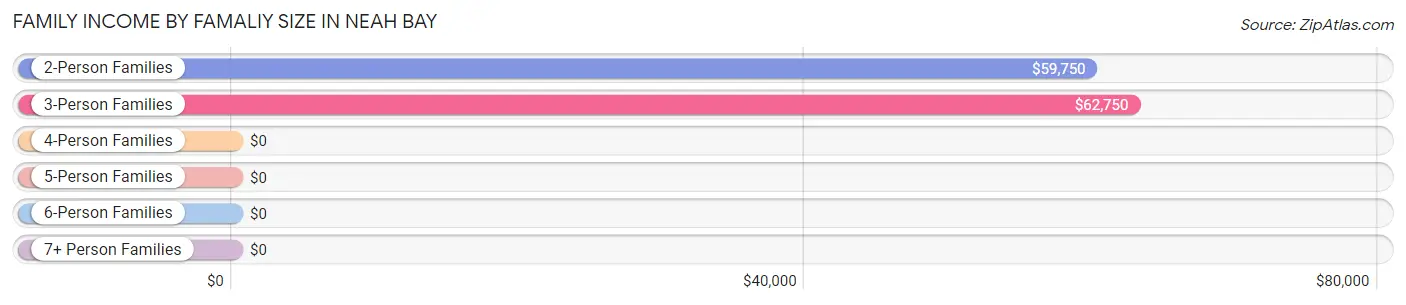
| Income Bracket | # Families | Median Income |
| 2-Person Families | 59 (27.1%) | $59,750 |
| 3-Person Families | 57 (26.2%) | $62,750 |
| 4-Person Families | 70 (32.1%) | $0 |
| 5-Person Families | 16 (7.3%) | $0 |
| 6-Person Families | 10 (4.6%) | $0 |
| 7+ Person Families | 6 (2.8%) | $0 |
| Total | 218 (100.0%) | $64,722 |
Family Income by Number of Earners in Neah Bay
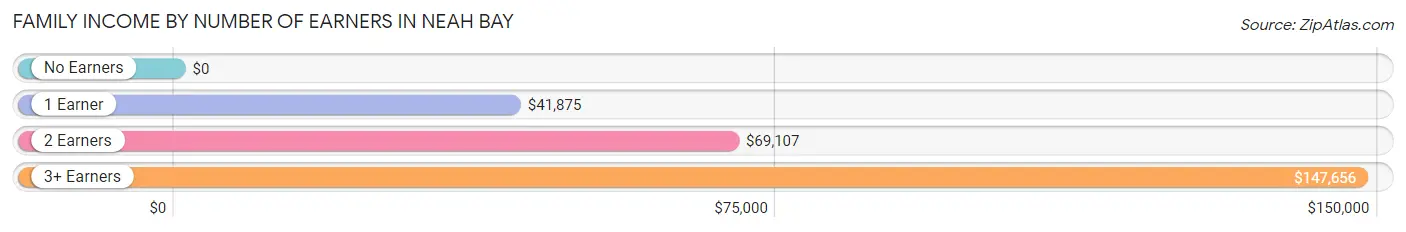
| Number of Earners | # Families | Median Income |
| No Earners | 38 (17.4%) | $0 |
| 1 Earner | 62 (28.4%) | $41,875 |
| 2 Earners | 75 (34.4%) | $69,107 |
| 3+ Earners | 43 (19.7%) | $147,656 |
| Total | 218 (100.0%) | $64,722 |
Household Income in Neah Bay
Household Income Brackets in Neah Bay
With 69 households falling in the category, the $50,000 to $74,999 income range is the most frequent in Neah Bay, accounting for 20.7% of all households. In contrast, only 8 households (2.4%) fall into the $25,000 to $34,999 income bracket, making it the least populous group.
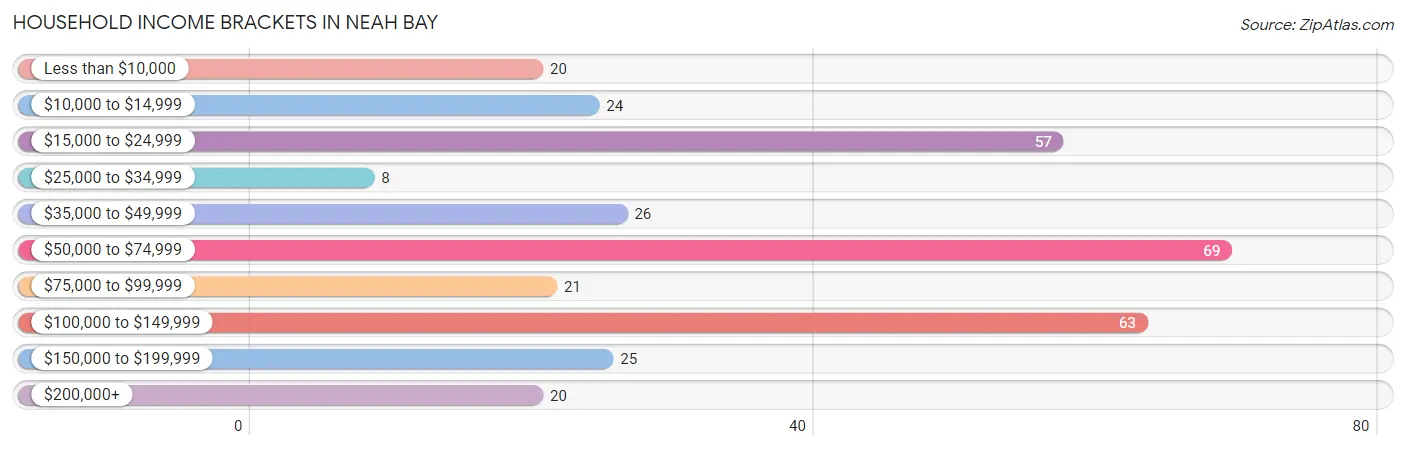
| Income Bracket | # Households | % Households |
| Less than $10,000 | 20 | 6.0% |
| $10,000 to $14,999 | 24 | 7.2% |
| $15,000 to $24,999 | 57 | 17.1% |
| $25,000 to $34,999 | 8 | 2.4% |
| $35,000 to $49,999 | 26 | 7.8% |
| $50,000 to $74,999 | 69 | 20.7% |
| $75,000 to $99,999 | 21 | 6.3% |
| $100,000 to $149,999 | 63 | 18.9% |
| $150,000 to $199,999 | 25 | 7.5% |
| $200,000+ | 20 | 6.0% |
Household Income by Householder Age in Neah Bay
The median household income in Neah Bay is $63,750, with the highest median household income of $66,518 found in the 45 to 64 years age bracket for the primary householder. A total of 163 households (48.9%) fall into this category. Meanwhile, the 15 to 24 years age bracket for the primary householder has the lowest median household income of $0, with 31 households (9.3%) in this group.
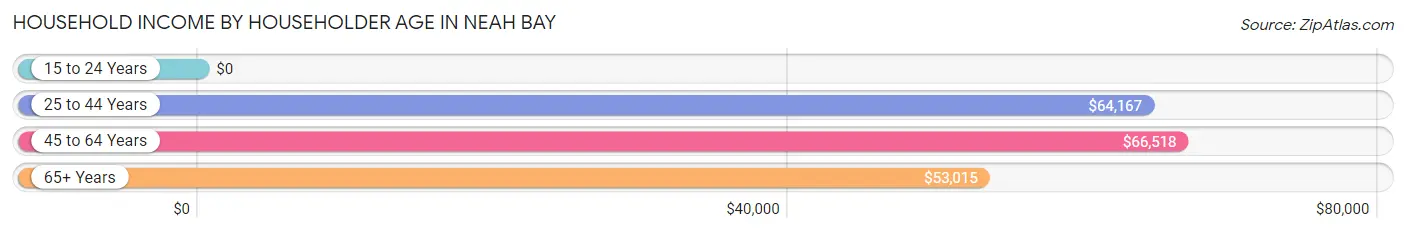
| Income Bracket | # Households | Median Income |
| 15 to 24 Years | 31 (9.3%) | $0 |
| 25 to 44 Years | 52 (15.6%) | $64,167 |
| 45 to 64 Years | 163 (48.9%) | $66,518 |
| 65+ Years | 87 (26.1%) | $53,015 |
| Total | 333 (100.0%) | $63,750 |
Poverty in Neah Bay
Income Below Poverty by Sex and Age in Neah Bay
With 12.4% poverty level for males and 19.5% for females among the residents of Neah Bay, 75 year old and over males and 15 year old females are the most vulnerable to poverty, with 3 males (50.0%) and 8 females (100.0%) in their respective age groups living below the poverty level.
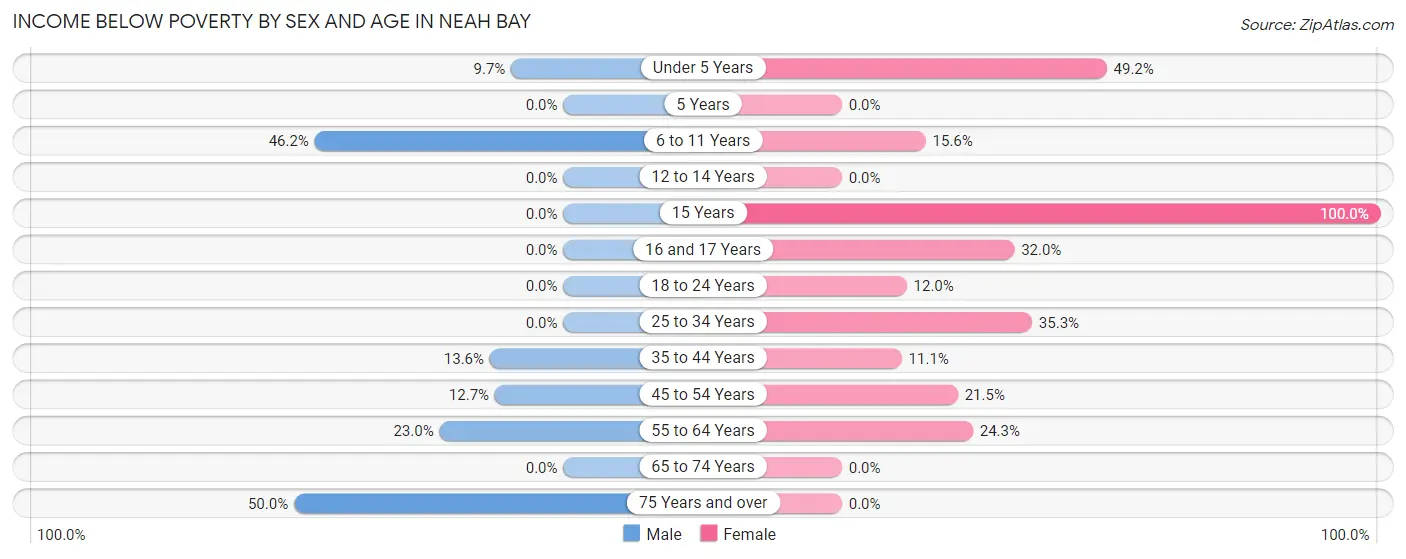
| Age Bracket | Male | Female |
| Under 5 Years | 3 (9.7%) | 29 (49.1%) |
| 5 Years | 0 (0.0%) | 0 (0.0%) |
| 6 to 11 Years | 18 (46.2%) | 7 (15.6%) |
| 12 to 14 Years | 0 (0.0%) | 0 (0.0%) |
| 15 Years | 0 (0.0%) | 8 (100.0%) |
| 16 and 17 Years | 0 (0.0%) | 8 (32.0%) |
| 18 to 24 Years | 0 (0.0%) | 16 (12.0%) |
| 25 to 34 Years | 0 (0.0%) | 12 (35.3%) |
| 35 to 44 Years | 6 (13.6%) | 5 (11.1%) |
| 45 to 54 Years | 8 (12.7%) | 17 (21.5%) |
| 55 to 64 Years | 20 (23.0%) | 9 (24.3%) |
| 65 to 74 Years | 0 (0.0%) | 0 (0.0%) |
| 75 Years and over | 3 (50.0%) | 0 (0.0%) |
| Total | 58 (12.4%) | 111 (19.5%) |
Income Above Poverty by Sex and Age in Neah Bay
According to the poverty statistics in Neah Bay, males aged 12 to 14 years and females aged 5 years are the age groups that are most secure financially, with 100.0% of males and 100.0% of females in these age groups living above the poverty line.
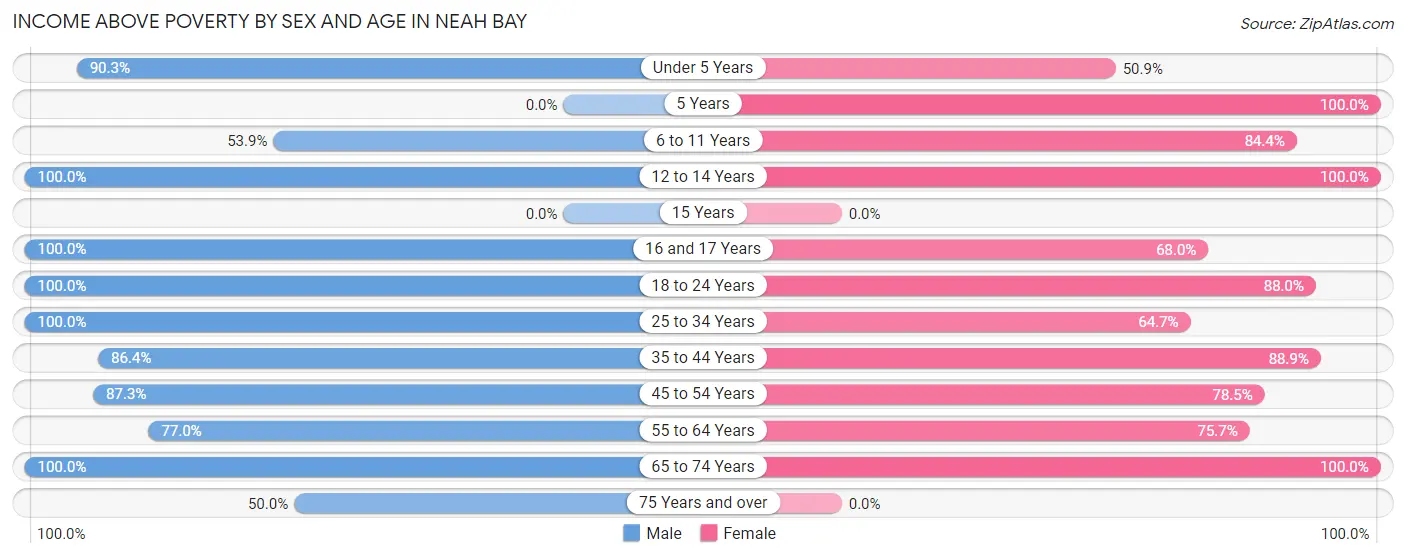
| Age Bracket | Male | Female |
| Under 5 Years | 28 (90.3%) | 30 (50.8%) |
| 5 Years | 0 (0.0%) | 14 (100.0%) |
| 6 to 11 Years | 21 (53.8%) | 38 (84.4%) |
| 12 to 14 Years | 13 (100.0%) | 28 (100.0%) |
| 15 Years | 0 (0.0%) | 0 (0.0%) |
| 16 and 17 Years | 17 (100.0%) | 17 (68.0%) |
| 18 to 24 Years | 84 (100.0%) | 117 (88.0%) |
| 25 to 34 Years | 21 (100.0%) | 22 (64.7%) |
| 35 to 44 Years | 38 (86.4%) | 40 (88.9%) |
| 45 to 54 Years | 55 (87.3%) | 62 (78.5%) |
| 55 to 64 Years | 67 (77.0%) | 28 (75.7%) |
| 65 to 74 Years | 62 (100.0%) | 62 (100.0%) |
| 75 Years and over | 3 (50.0%) | 0 (0.0%) |
| Total | 409 (87.6%) | 458 (80.5%) |
Income Below Poverty Among Married-Couple Families in Neah Bay
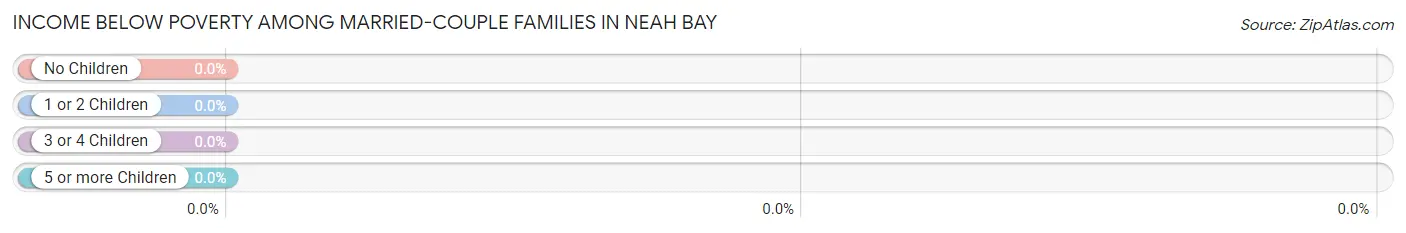
| Children | Above Poverty | Below Poverty |
| No Children | 59 (100.0%) | 0 (0.0%) |
| 1 or 2 Children | 25 (100.0%) | 0 (0.0%) |
| 3 or 4 Children | 3 (100.0%) | 0 (0.0%) |
| 5 or more Children | 6 (100.0%) | 0 (0.0%) |
| Total | 93 (100.0%) | 0 (0.0%) |
Income Below Poverty Among Single-Parent Households in Neah Bay
According to the poverty data in Neah Bay, 12.8% or 5 single-father households and 30.2% or 26 single-mother households are living below the poverty line. Among single-father households, those with 3 or 4 children have the highest poverty rate, with 5 households (100.0%) experiencing poverty. Likewise, among single-mother households, those with 1 or 2 children have the highest poverty rate, with 17 households (38.6%) falling below the poverty line.
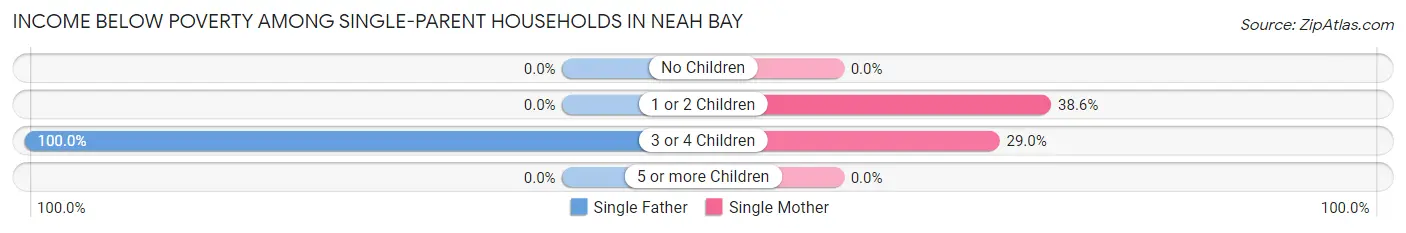
| Children | Single Father | Single Mother |
| No Children | 0 (0.0%) | 0 (0.0%) |
| 1 or 2 Children | 0 (0.0%) | 17 (38.6%) |
| 3 or 4 Children | 5 (100.0%) | 9 (29.0%) |
| 5 or more Children | 0 (0.0%) | 0 (0.0%) |
| Total | 5 (12.8%) | 26 (30.2%) |
Income Below Poverty Among Married-Couple vs Single-Parent Households in Neah Bay
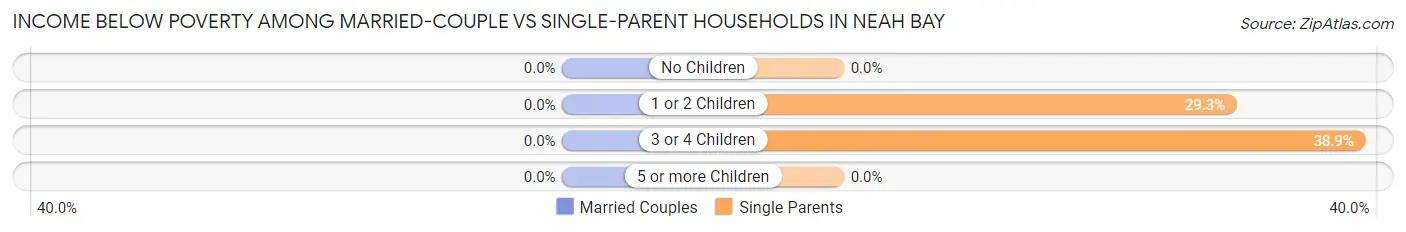
| Children | Married-Couple Families | Single-Parent Households |
| No Children | 0 (0.0%) | 0 (0.0%) |
| 1 or 2 Children | 0 (0.0%) | 17 (29.3%) |
| 3 or 4 Children | 0 (0.0%) | 14 (38.9%) |
| 5 or more Children | 0 (0.0%) | 0 (0.0%) |
| Total | 0 (0.0%) | 31 (24.8%) |
Race in Neah Bay
The most populous races in Neah Bay are Native / Alaskan (743 | 68.7%), Two or more Races (172 | 15.9%), and White / Caucasian (163 | 15.1%).

| Race | # Population | % Population |
| Asian | 0 | 0.0% |
| Black / African American | 0 | 0.0% |
| Hawaiian / Pacific | 0 | 0.0% |
| Hispanic or Latino | 106 | 9.8% |
| Native / Alaskan | 743 | 68.7% |
| White / Caucasian | 163 | 15.1% |
| Two or more Races | 172 | 15.9% |
| Some other Race | 3 | 0.3% |
| Total | 1,081 | 100.0% |
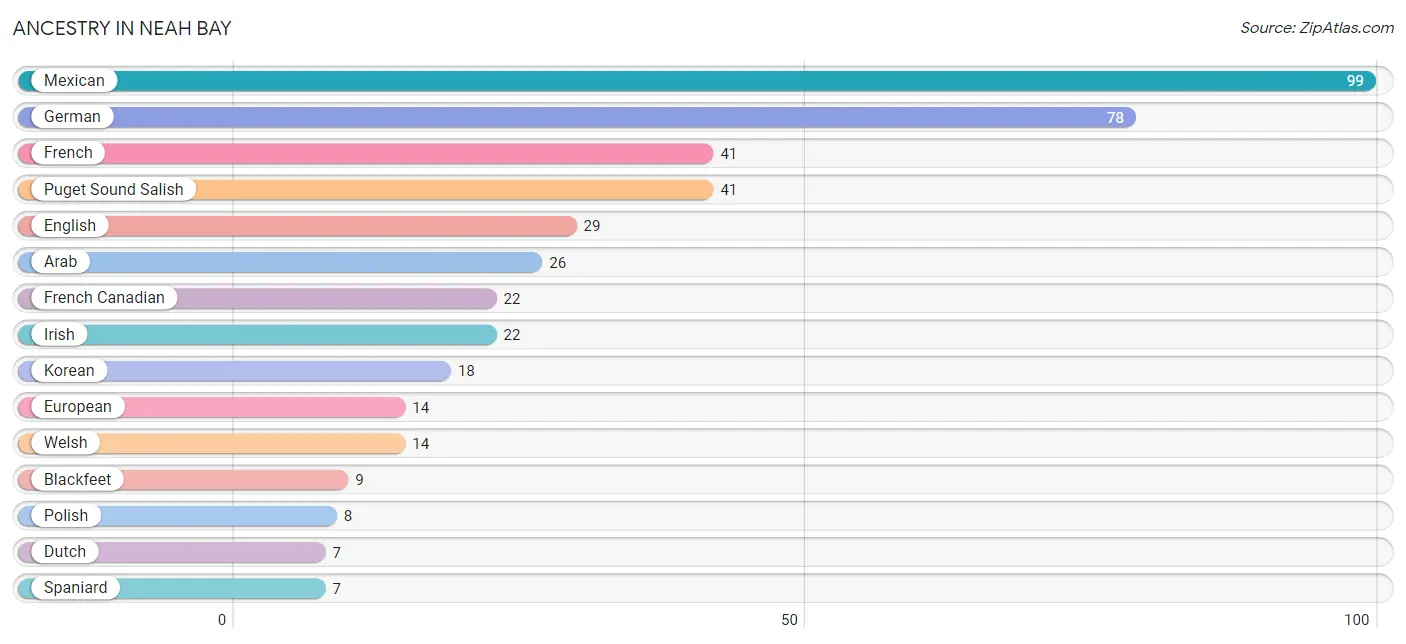
Ancestry in Neah Bay
The most populous ancestries reported in Neah Bay are Mexican (99 | 9.2%), German (78 | 7.2%), French (41 | 3.8%), Puget Sound Salish (41 | 3.8%), and English (29 | 2.7%), together accounting for 26.6% of all Neah Bay residents.
| Ancestry | # Population | % Population |
| Arab | 26 | 2.4% |
| Blackfeet | 9 | 0.8% |
| Burmese | 5 | 0.5% |
| Canadian | 5 | 0.5% |
| Cherokee | 2 | 0.2% |
| Colville | 6 | 0.6% |
| Danish | 1 | 0.1% |
| Dutch | 7 | 0.6% |
| English | 29 | 2.7% |
| European | 14 | 1.3% |
| French | 41 | 3.8% |
| French American Indian | 4 | 0.4% |
| French Canadian | 22 | 2.0% |
| German | 78 | 7.2% |
| Irish | 22 | 2.0% |
| Italian | 2 | 0.2% |
| Korean | 18 | 1.7% |
| Mexican | 99 | 9.2% |
| Norwegian | 3 | 0.3% |
| Polish | 8 | 0.7% |
| Puget Sound Salish | 41 | 3.8% |
| Scottish | 3 | 0.3% |
| Spaniard | 7 | 0.6% |
| Welsh | 14 | 1.3% | View All 24 Rows |
Immigrants in Neah Bay

| Immigration Origin | # Population | % Population | View All 0 Rows |
Sex and Age in Neah Bay
Sex and Age in Neah Bay
The most populous age groups in Neah Bay are 20 to 24 Years (68 | 13.6%) for men and 20 to 24 Years (99 | 17.0%) for women.
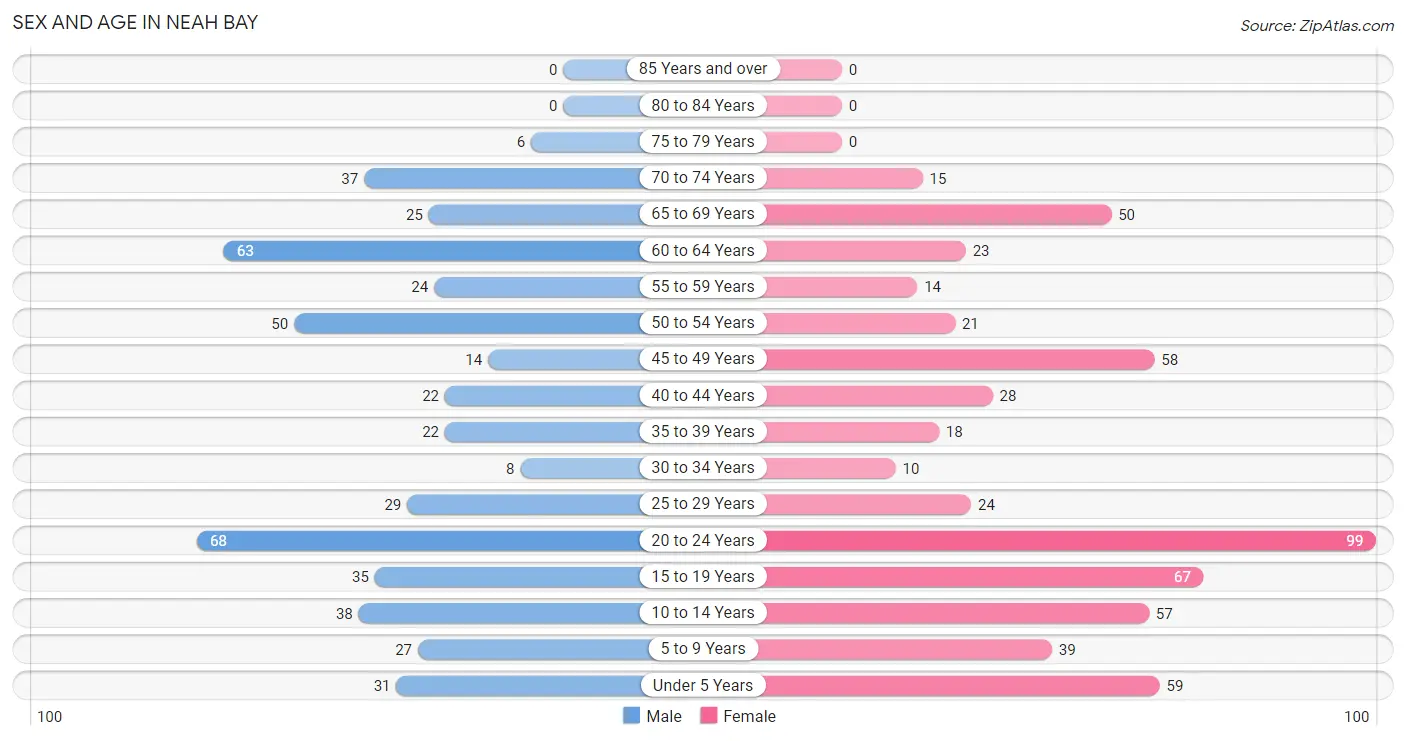
| Age Bracket | Male | Female |
| Under 5 Years | 31 (6.2%) | 59 (10.1%) |
| 5 to 9 Years | 27 (5.4%) | 39 (6.7%) |
| 10 to 14 Years | 38 (7.6%) | 57 (9.8%) |
| 15 to 19 Years | 35 (7.0%) | 67 (11.5%) |
| 20 to 24 Years | 68 (13.6%) | 99 (17.0%) |
| 25 to 29 Years | 29 (5.8%) | 24 (4.1%) |
| 30 to 34 Years | 8 (1.6%) | 10 (1.7%) |
| 35 to 39 Years | 22 (4.4%) | 18 (3.1%) |
| 40 to 44 Years | 22 (4.4%) | 28 (4.8%) |
| 45 to 49 Years | 14 (2.8%) | 58 (10.0%) |
| 50 to 54 Years | 50 (10.0%) | 21 (3.6%) |
| 55 to 59 Years | 24 (4.8%) | 14 (2.4%) |
| 60 to 64 Years | 63 (12.6%) | 23 (4.0%) |
| 65 to 69 Years | 25 (5.0%) | 50 (8.6%) |
| 70 to 74 Years | 37 (7.4%) | 15 (2.6%) |
| 75 to 79 Years | 6 (1.2%) | 0 (0.0%) |
| 80 to 84 Years | 0 (0.0%) | 0 (0.0%) |
| 85 Years and over | 0 (0.0%) | 0 (0.0%) |
| Total | 499 (100.0%) | 582 (100.0%) |
Families and Households in Neah Bay
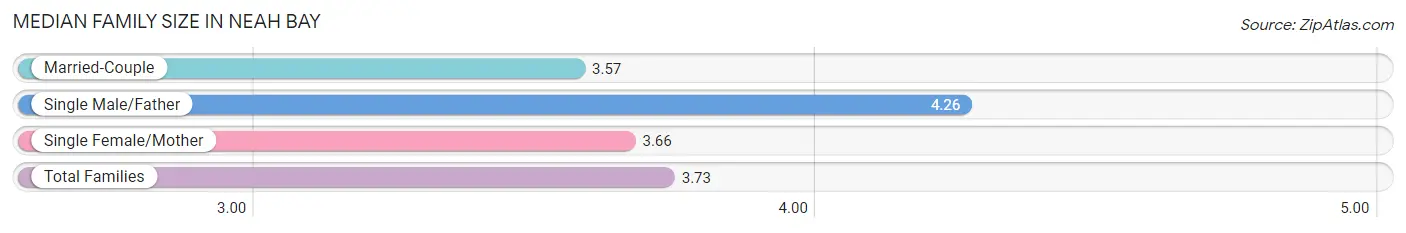
Median Family Size in Neah Bay
The median family size in Neah Bay is 3.73 persons per family, with single male/father families (39 | 17.9%) accounting for the largest median family size of 4.26 persons per family. On the other hand, married-couple families (93 | 42.7%) represent the smallest median family size with 3.57 persons per family.
| Family Type | # Families | Family Size |
| Married-Couple | 93 (42.7%) | 3.57 |
| Single Male/Father | 39 (17.9%) | 4.26 |
| Single Female/Mother | 86 (39.5%) | 3.66 |
| Total Families | 218 (100.0%) | 3.73 |
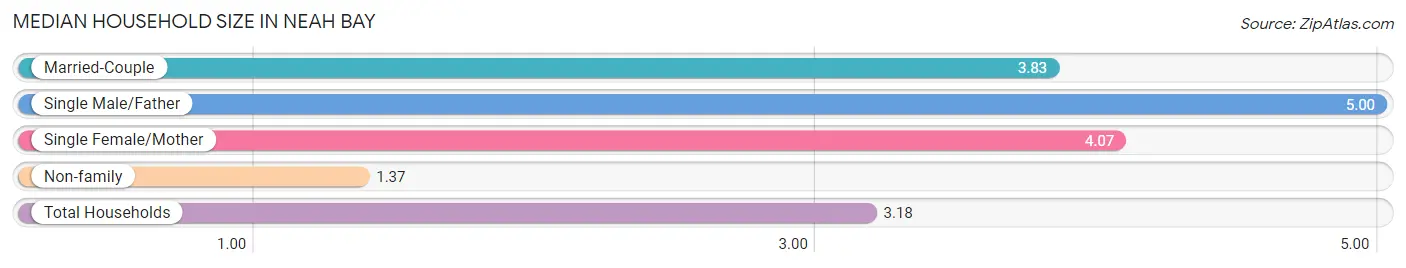
Median Household Size in Neah Bay
The median household size in Neah Bay is 3.18 persons per household, with single male/father households (39 | 11.7%) accounting for the largest median household size of 5 persons per household. non-family households (115 | 34.5%) represent the smallest median household size with 1.37 persons per household.
| Household Type | # Households | Household Size |
| Married-Couple | 93 (27.9%) | 3.83 |
| Single Male/Father | 39 (11.7%) | 5.00 |
| Single Female/Mother | 86 (25.8%) | 4.07 |
| Non-family | 115 (34.5%) | 1.37 |
| Total Households | 333 (100.0%) | 3.18 |
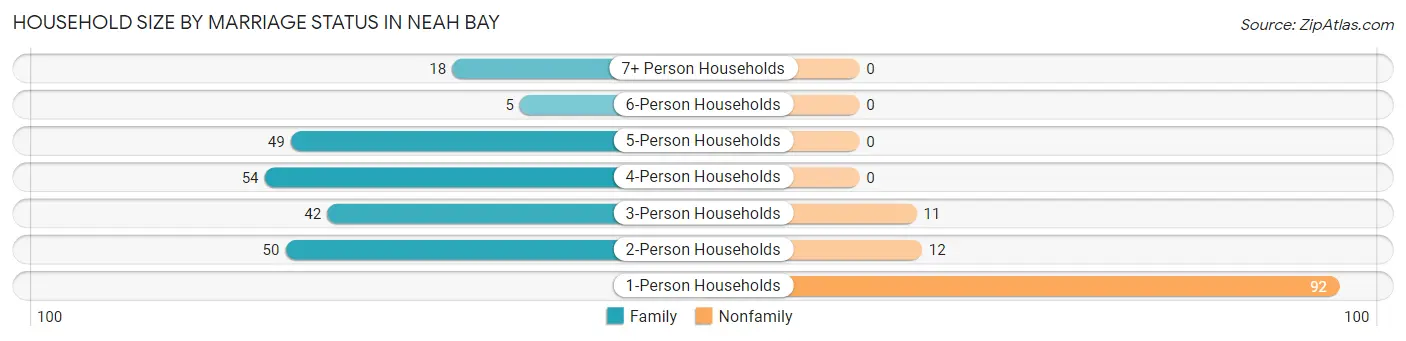
Household Size by Marriage Status in Neah Bay
Out of a total of 333 households in Neah Bay, 218 (65.5%) are family households, while 115 (34.5%) are nonfamily households. The most numerous type of family households are 4-person households, comprising 54, and the most common type of nonfamily households are 1-person households, comprising 92.
| Household Size | Family Households | Nonfamily Households |
| 1-Person Households | - | 92 (27.6%) |
| 2-Person Households | 50 (15.0%) | 12 (3.6%) |
| 3-Person Households | 42 (12.6%) | 11 (3.3%) |
| 4-Person Households | 54 (16.2%) | 0 (0.0%) |
| 5-Person Households | 49 (14.7%) | 0 (0.0%) |
| 6-Person Households | 5 (1.5%) | 0 (0.0%) |
| 7+ Person Households | 18 (5.4%) | 0 (0.0%) |
| Total | 218 (65.5%) | 115 (34.5%) |
Female Fertility in Neah Bay
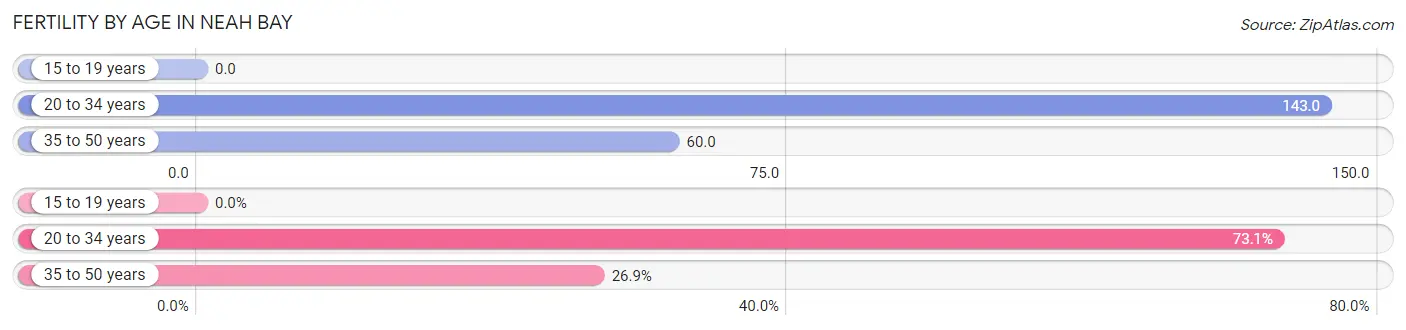
Fertility by Age in Neah Bay
Average fertility rate in Neah Bay is 82.0 births per 1,000 women. Women in the age bracket of 20 to 34 years have the highest fertility rate with 143.0 births per 1,000 women. Women in the age bracket of 20 to 34 years acount for 73.1% of all women with births.
| Age Bracket | Women with Births | Births / 1,000 Women |
| 15 to 19 years | 0 (0.0%) | 0.0 |
| 20 to 34 years | 19 (73.1%) | 143.0 |
| 35 to 50 years | 7 (26.9%) | 60.0 |
| Total | 26 (100.0%) | 82.0 |
Fertility by Age by Marriage Status in Neah Bay
38.5% of women with births (26) in Neah Bay are married. The highest percentage of unmarried women with births falls into 35 to 50 years age bracket with 100.0% of them unmarried at the time of birth, while the lowest percentage of unmarried women with births belong to 20 to 34 years age bracket with 47.4% of them unmarried.
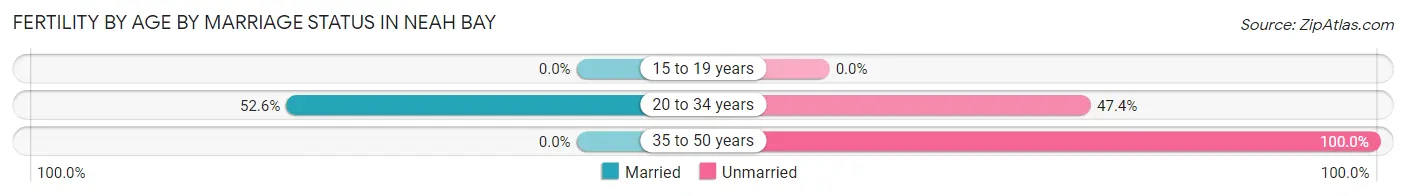
| Age Bracket | Married | Unmarried |
| 15 to 19 years | 0 (0.0%) | 0 (0.0%) |
| 20 to 34 years | 10 (52.6%) | 9 (47.4%) |
| 35 to 50 years | 0 (0.0%) | 7 (100.0%) |
| Total | 10 (38.5%) | 16 (61.5%) |
Fertility by Education in Neah Bay
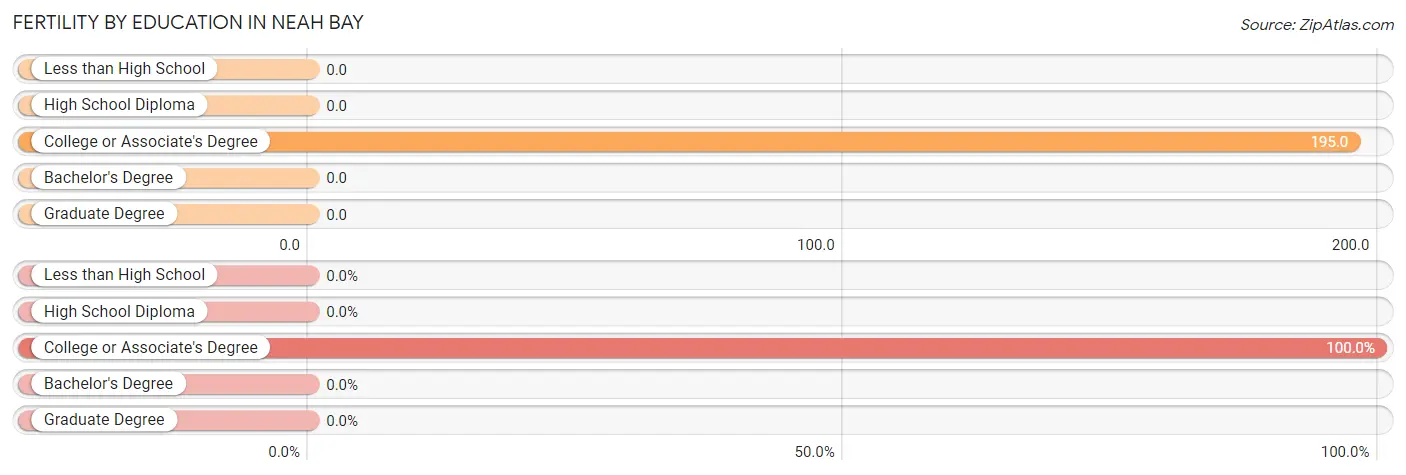
| Educational Attainment | Women with Births | Births / 1,000 Women |
| Less than High School | 0 (0.0%) | 0.0 |
| High School Diploma | 0 (0.0%) | 0.0 |
| College or Associate's Degree | 26 (100.0%) | 195.0 |
| Bachelor's Degree | 0 (0.0%) | 0.0 |
| Graduate Degree | 0 (0.0%) | 0.0 |
| Total | 26 (100.0%) | 82.0 |
Fertility by Education by Marriage Status in Neah Bay
61.5% of women with births in Neah Bay are unmarried. Women with the educational attainment of college or associate's degree are most likely to be married with 38.5% of them married at childbirth, while women with the educational attainment of college or associate's degree are least likely to be married with 61.5% of them unmarried at childbirth.
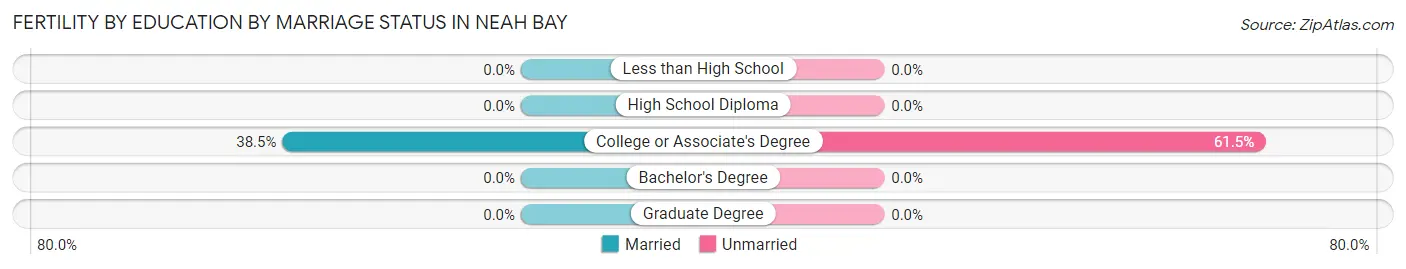
| Educational Attainment | Married | Unmarried |
| Less than High School | 0 (0.0%) | 0 (0.0%) |
| High School Diploma | 0 (0.0%) | 0 (0.0%) |
| College or Associate's Degree | 10 (38.5%) | 16 (61.5%) |
| Bachelor's Degree | 0 (0.0%) | 0 (0.0%) |
| Graduate Degree | 0 (0.0%) | 0 (0.0%) |
| Total | 10 (38.5%) | 16 (61.5%) |
Employment Characteristics in Neah Bay
Employment by Class of Employer in Neah Bay
Among the 491 employed individuals in Neah Bay, local government employees (213 | 43.4%), private company employees (75 | 15.3%), and federal government employees (63 | 12.8%) make up the most common classes of employment.
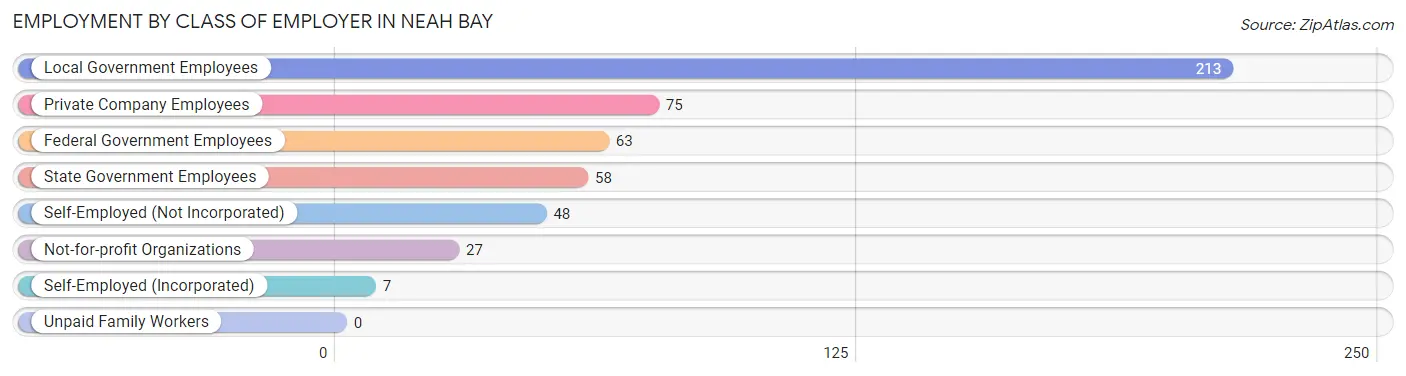
| Employer Class | # Employees | % Employees |
| Private Company Employees | 75 | 15.3% |
| Self-Employed (Incorporated) | 7 | 1.4% |
| Self-Employed (Not Incorporated) | 48 | 9.8% |
| Not-for-profit Organizations | 27 | 5.5% |
| Local Government Employees | 213 | 43.4% |
| State Government Employees | 58 | 11.8% |
| Federal Government Employees | 63 | 12.8% |
| Unpaid Family Workers | 0 | 0.0% |
| Total | 491 | 100.0% |
Employment Status by Age in Neah Bay
According to the labor force statistics for Neah Bay, out of the total population over 16 years of age (822), 66.3% or 545 individuals are in the labor force, with 8.5% or 46 of them unemployed. The age group with the highest labor force participation rate is 35 to 44 years, with 90.0% or 81 individuals in the labor force. Within the labor force, the 16 to 19 years age range has the highest percentage of unemployed individuals, with 16.7% or 4 of them being unemployed.
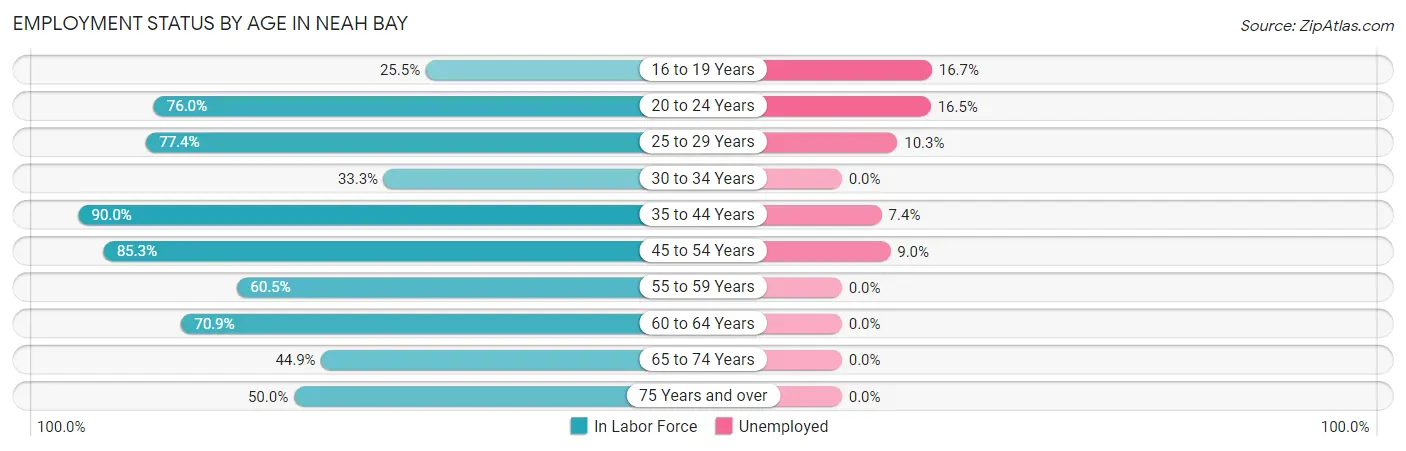
| Age Bracket | In Labor Force | Unemployed |
| 16 to 19 Years | 24 (25.5%) | 4 (16.7%) |
| 20 to 24 Years | 127 (76.0%) | 21 (16.5%) |
| 25 to 29 Years | 41 (77.4%) | 4 (10.3%) |
| 30 to 34 Years | 6 (33.3%) | 0 (0.0%) |
| 35 to 44 Years | 81 (90.0%) | 6 (7.4%) |
| 45 to 54 Years | 122 (85.3%) | 11 (9.0%) |
| 55 to 59 Years | 23 (60.5%) | 0 (0.0%) |
| 60 to 64 Years | 61 (70.9%) | 0 (0.0%) |
| 65 to 74 Years | 57 (44.9%) | 0 (0.0%) |
| 75 Years and over | 3 (50.0%) | 0 (0.0%) |
| Total | 545 (66.3%) | 46 (8.5%) |
Employment Status by Educational Attainment in Neah Bay
According to labor force statistics for Neah Bay, 78.0% of individuals (334) out of the total population between 25 and 64 years of age (428) are in the labor force, with 6.3% or 21 of them being unemployed. The group with the highest labor force participation rate are those with the educational attainment of bachelor's degree or higher, with 100.0% or 46 individuals in the labor force. Within the labor force, individuals with less than high school education have the highest percentage of unemployment, with 17.6% or 3 of them being unemployed.
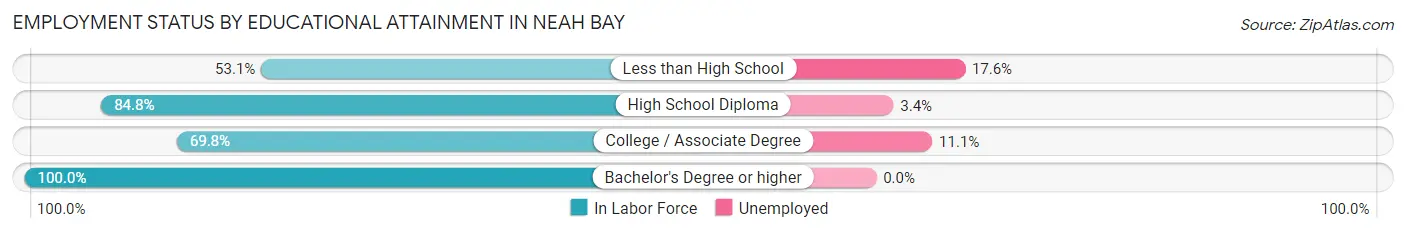
| Educational Attainment | In Labor Force | Unemployed |
| Less than High School | 17 (53.1%) | 6 (17.6%) |
| High School Diploma | 151 (84.8%) | 6 (3.4%) |
| College / Associate Degree | 120 (69.8%) | 19 (11.1%) |
| Bachelor's Degree or higher | 46 (100.0%) | 0 (0.0%) |
| Total | 334 (78.0%) | 27 (6.3%) |
Employment Occupations by Sex in Neah Bay
Management, Business, Science and Arts Occupations
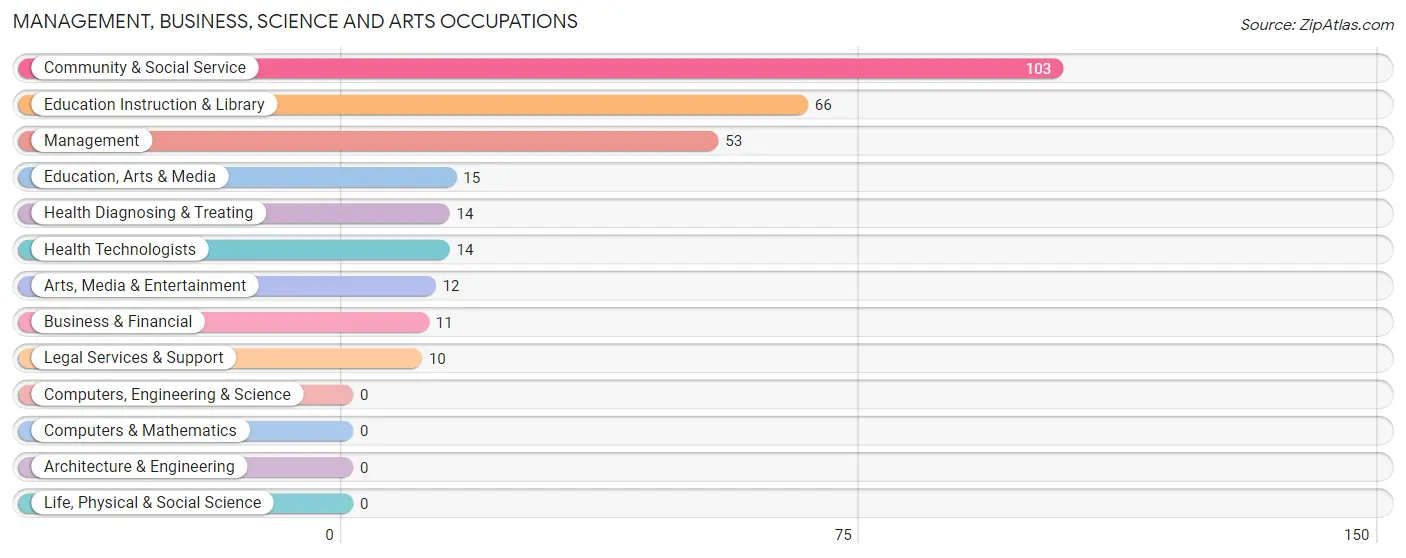
The most common Management, Business, Science and Arts occupations in Neah Bay are Community & Social Service (103 | 21.3%), Education Instruction & Library (66 | 13.6%), Management (53 | 11.0%), Education, Arts & Media (15 | 3.1%), and Health Diagnosing & Treating (14 | 2.9%).
Management, Business, Science and Arts Occupations by Sex
Within the Management, Business, Science and Arts occupations in Neah Bay, the most male-oriented occupations are Health Diagnosing & Treating (100.0%), Health Technologists (100.0%), and Education, Arts & Media (66.7%), while the most female-oriented occupations are Business & Financial (100.0%), Legal Services & Support (100.0%), and Education Instruction & Library (89.4%).
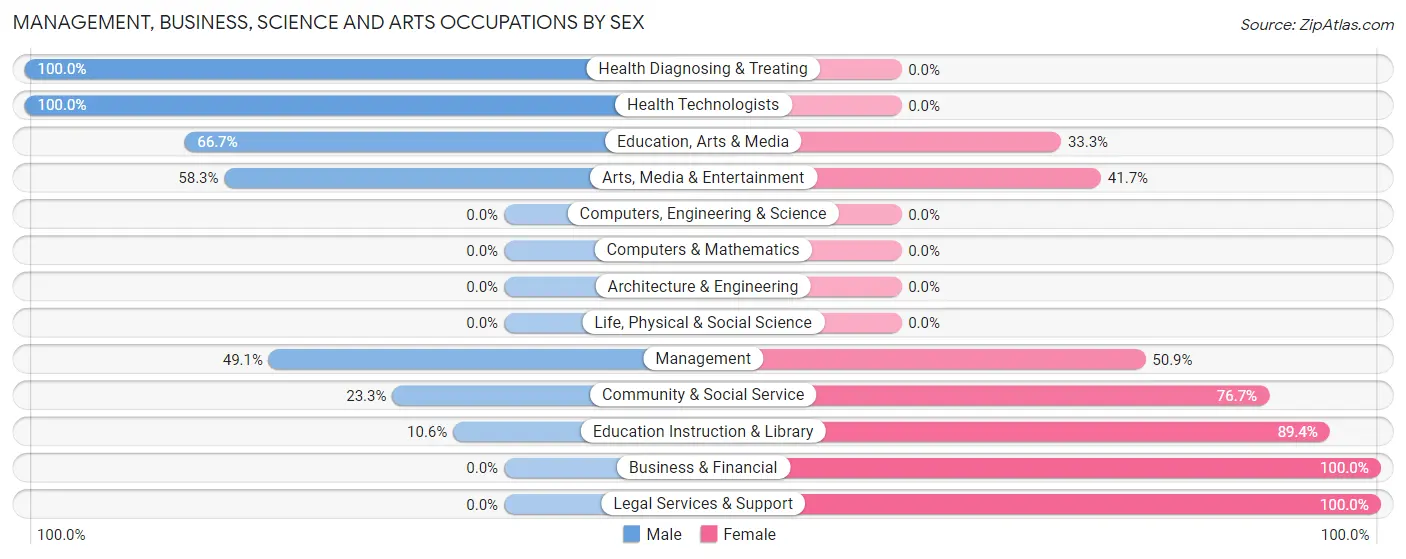
| Occupation | Male | Female |
| Management | 26 (49.1%) | 27 (50.9%) |
| Business & Financial | 0 (0.0%) | 11 (100.0%) |
| Computers, Engineering & Science | 0 (0.0%) | 0 (0.0%) |
| Computers & Mathematics | 0 (0.0%) | 0 (0.0%) |
| Architecture & Engineering | 0 (0.0%) | 0 (0.0%) |
| Life, Physical & Social Science | 0 (0.0%) | 0 (0.0%) |
| Community & Social Service | 24 (23.3%) | 79 (76.7%) |
| Education, Arts & Media | 10 (66.7%) | 5 (33.3%) |
| Legal Services & Support | 0 (0.0%) | 10 (100.0%) |
| Education Instruction & Library | 7 (10.6%) | 59 (89.4%) |
| Arts, Media & Entertainment | 7 (58.3%) | 5 (41.7%) |
| Health Diagnosing & Treating | 14 (100.0%) | 0 (0.0%) |
| Health Technologists | 14 (100.0%) | 0 (0.0%) |
| Total (Category) | 64 (35.4%) | 117 (64.6%) |
| Total (Overall) | 255 (52.7%) | 229 (47.3%) |
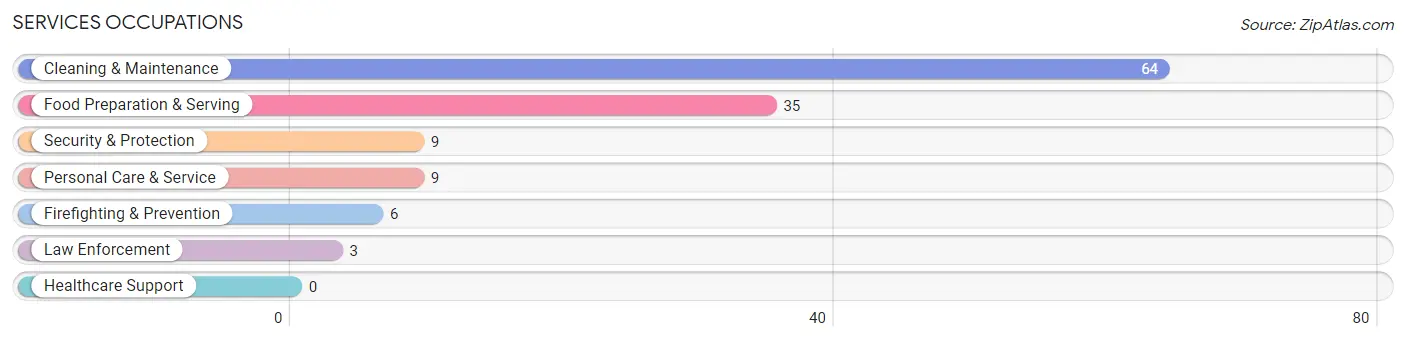
Services Occupations
The most common Services occupations in Neah Bay are Cleaning & Maintenance (64 | 13.2%), Food Preparation & Serving (35 | 7.2%), Security & Protection (9 | 1.9%), Personal Care & Service (9 | 1.9%), and Firefighting & Prevention (6 | 1.2%).
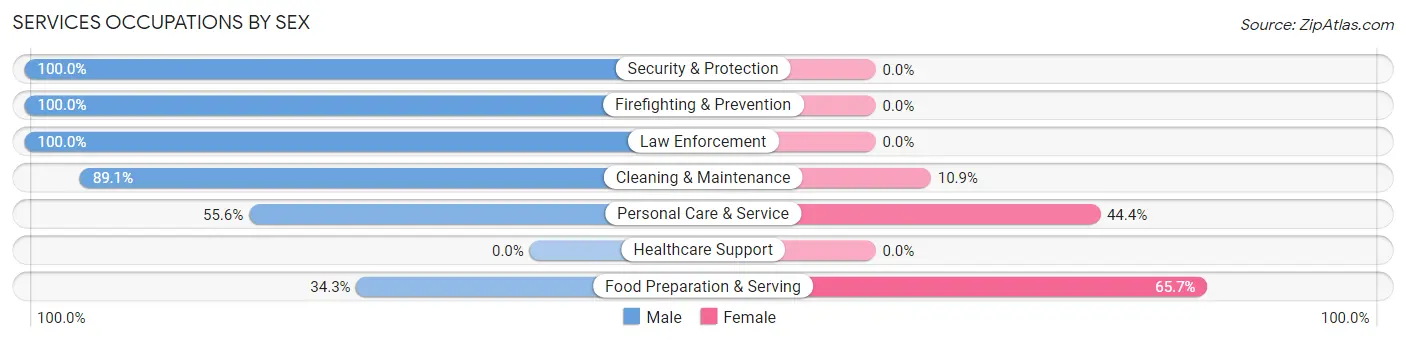
Services Occupations by Sex
Within the Services occupations in Neah Bay, the most male-oriented occupations are Security & Protection (100.0%), Firefighting & Prevention (100.0%), and Law Enforcement (100.0%), while the most female-oriented occupations are Food Preparation & Serving (65.7%), Personal Care & Service (44.4%), and Cleaning & Maintenance (10.9%).
| Occupation | Male | Female |
| Healthcare Support | 0 (0.0%) | 0 (0.0%) |
| Security & Protection | 9 (100.0%) | 0 (0.0%) |
| Firefighting & Prevention | 6 (100.0%) | 0 (0.0%) |
| Law Enforcement | 3 (100.0%) | 0 (0.0%) |
| Food Preparation & Serving | 12 (34.3%) | 23 (65.7%) |
| Cleaning & Maintenance | 57 (89.1%) | 7 (10.9%) |
| Personal Care & Service | 5 (55.6%) | 4 (44.4%) |
| Total (Category) | 83 (70.9%) | 34 (29.1%) |
| Total (Overall) | 255 (52.7%) | 229 (47.3%) |
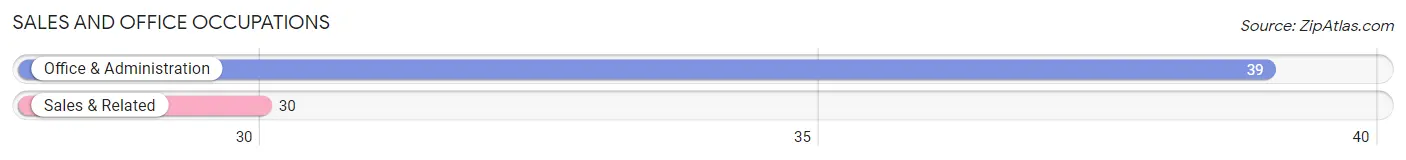
Sales and Office Occupations
The most common Sales and Office occupations in Neah Bay are Office & Administration (39 | 8.1%), and Sales & Related (30 | 6.2%).
Sales and Office Occupations by Sex
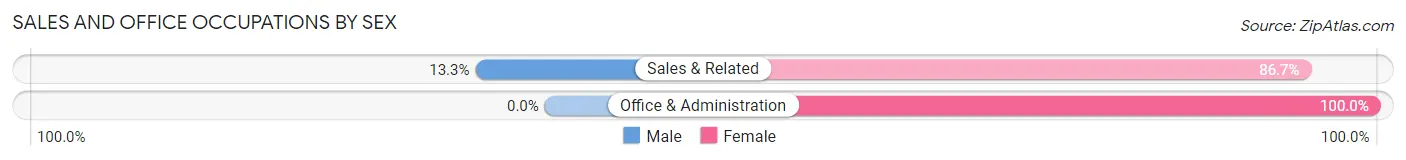
| Occupation | Male | Female |
| Sales & Related | 4 (13.3%) | 26 (86.7%) |
| Office & Administration | 0 (0.0%) | 39 (100.0%) |
| Total (Category) | 4 (5.8%) | 65 (94.2%) |
| Total (Overall) | 255 (52.7%) | 229 (47.3%) |
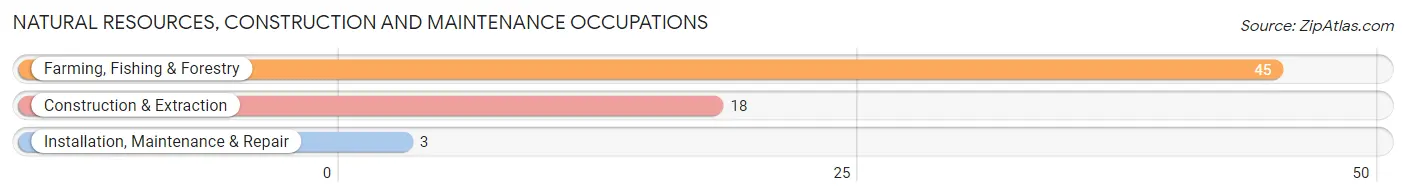
Natural Resources, Construction and Maintenance Occupations
The most common Natural Resources, Construction and Maintenance occupations in Neah Bay are Farming, Fishing & Forestry (45 | 9.3%), Construction & Extraction (18 | 3.7%), and Installation, Maintenance & Repair (3 | 0.6%).
Natural Resources, Construction and Maintenance Occupations by Sex
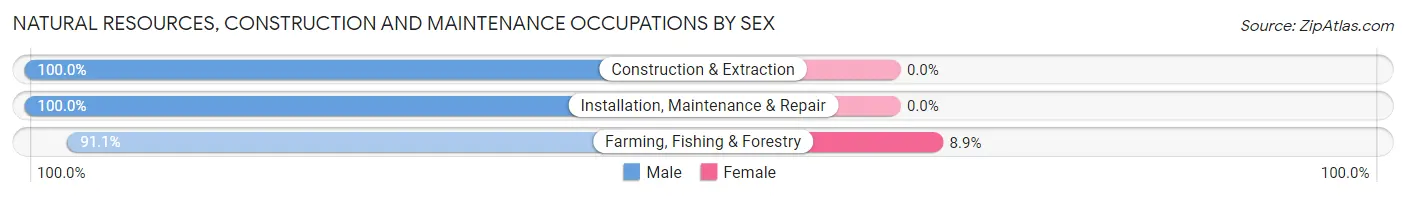
| Occupation | Male | Female |
| Farming, Fishing & Forestry | 41 (91.1%) | 4 (8.9%) |
| Construction & Extraction | 18 (100.0%) | 0 (0.0%) |
| Installation, Maintenance & Repair | 3 (100.0%) | 0 (0.0%) |
| Total (Category) | 62 (93.9%) | 4 (6.1%) |
| Total (Overall) | 255 (52.7%) | 229 (47.3%) |
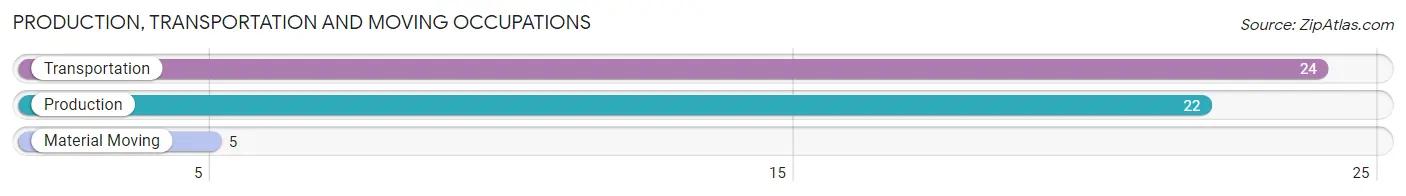
Production, Transportation and Moving Occupations
The most common Production, Transportation and Moving occupations in Neah Bay are Transportation (24 | 5.0%), Production (22 | 4.5%), and Material Moving (5 | 1.0%).
Production, Transportation and Moving Occupations by Sex
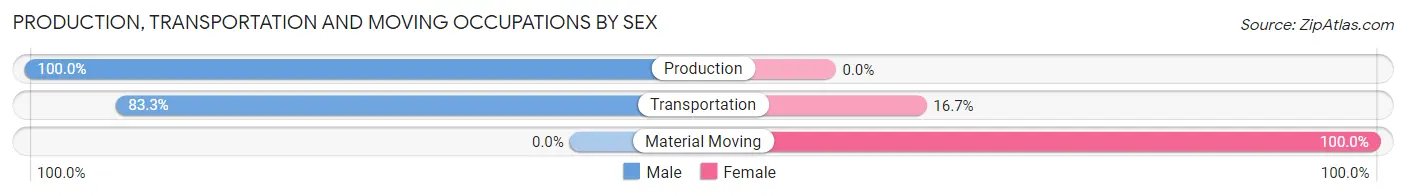
| Occupation | Male | Female |
| Production | 22 (100.0%) | 0 (0.0%) |
| Transportation | 20 (83.3%) | 4 (16.7%) |
| Material Moving | 0 (0.0%) | 5 (100.0%) |
| Total (Category) | 42 (82.4%) | 9 (17.6%) |
| Total (Overall) | 255 (52.7%) | 229 (47.3%) |
Employment Industries by Sex in Neah Bay
Employment Industries in Neah Bay
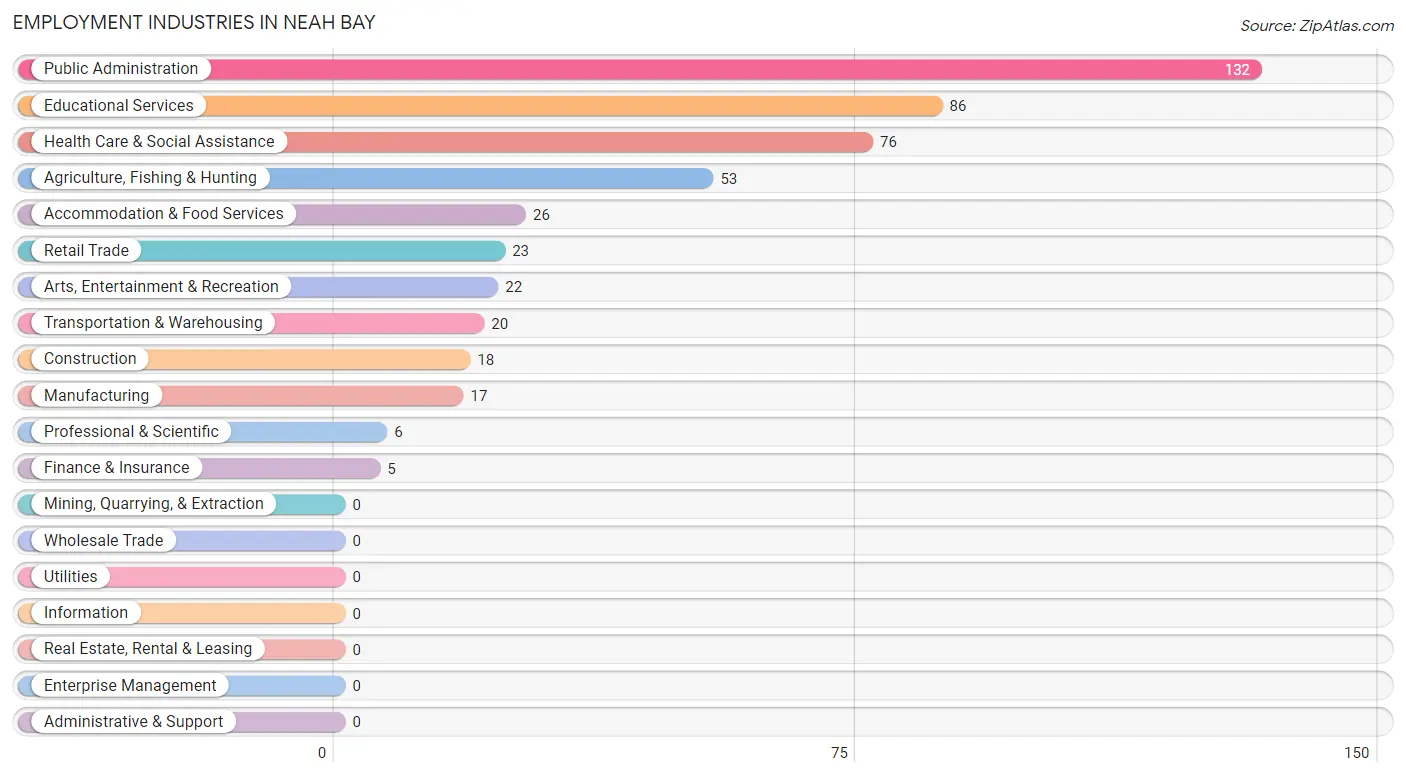
The major employment industries in Neah Bay include Public Administration (132 | 27.3%), Educational Services (86 | 17.8%), Health Care & Social Assistance (76 | 15.7%), Agriculture, Fishing & Hunting (53 | 11.0%), and Accommodation & Food Services (26 | 5.4%).
Employment Industries by Sex in Neah Bay
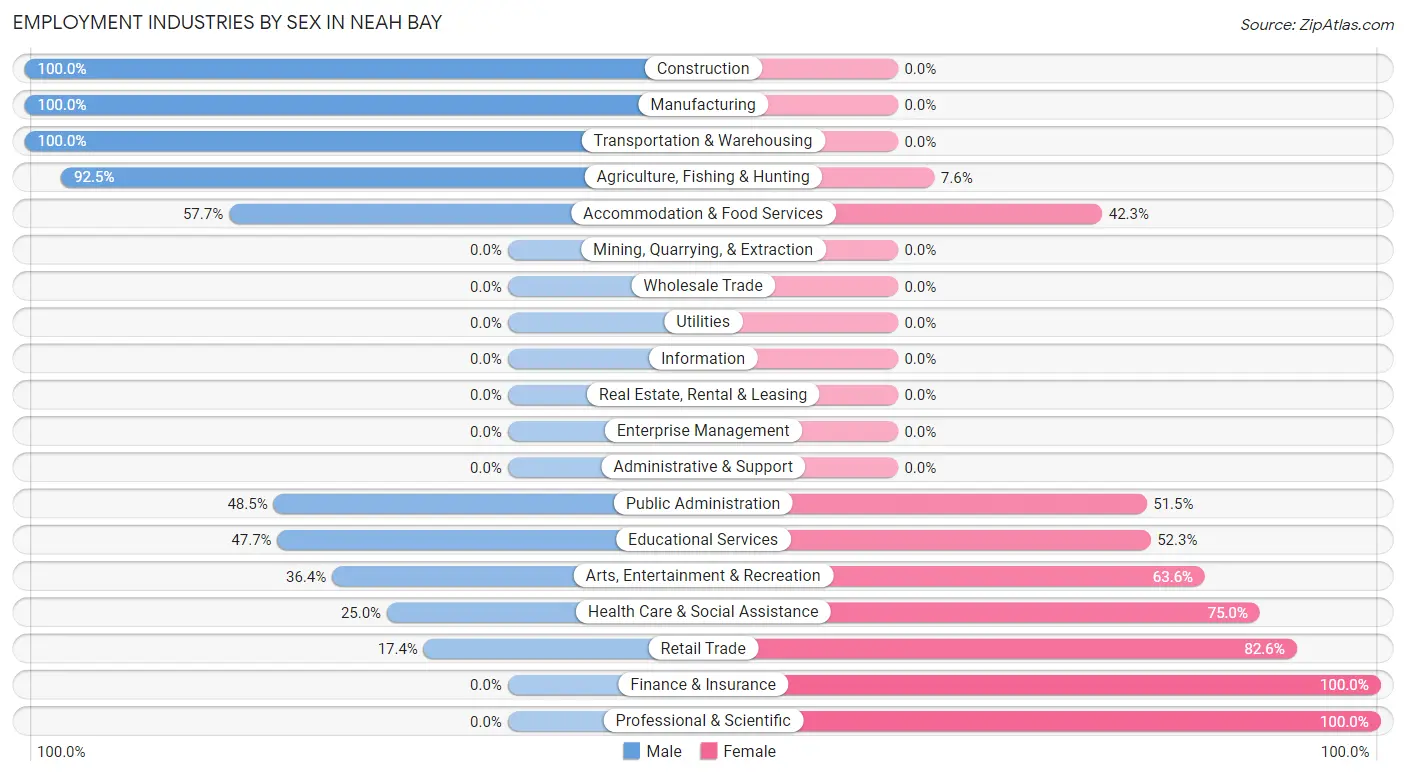
The Neah Bay industries that see more men than women are Construction (100.0%), Manufacturing (100.0%), and Transportation & Warehousing (100.0%), whereas the industries that tend to have a higher number of women are Finance & Insurance (100.0%), Professional & Scientific (100.0%), and Retail Trade (82.6%).
| Industry | Male | Female |
| Agriculture, Fishing & Hunting | 49 (92.4%) | 4 (7.5%) |
| Mining, Quarrying, & Extraction | 0 (0.0%) | 0 (0.0%) |
| Construction | 18 (100.0%) | 0 (0.0%) |
| Manufacturing | 17 (100.0%) | 0 (0.0%) |
| Wholesale Trade | 0 (0.0%) | 0 (0.0%) |
| Retail Trade | 4 (17.4%) | 19 (82.6%) |
| Transportation & Warehousing | 20 (100.0%) | 0 (0.0%) |
| Utilities | 0 (0.0%) | 0 (0.0%) |
| Information | 0 (0.0%) | 0 (0.0%) |
| Finance & Insurance | 0 (0.0%) | 5 (100.0%) |
| Real Estate, Rental & Leasing | 0 (0.0%) | 0 (0.0%) |
| Professional & Scientific | 0 (0.0%) | 6 (100.0%) |
| Enterprise Management | 0 (0.0%) | 0 (0.0%) |
| Administrative & Support | 0 (0.0%) | 0 (0.0%) |
| Educational Services | 41 (47.7%) | 45 (52.3%) |
| Health Care & Social Assistance | 19 (25.0%) | 57 (75.0%) |
| Arts, Entertainment & Recreation | 8 (36.4%) | 14 (63.6%) |
| Accommodation & Food Services | 15 (57.7%) | 11 (42.3%) |
| Public Administration | 64 (48.5%) | 68 (51.5%) |
| Total | 255 (52.7%) | 229 (47.3%) |
Education in Neah Bay
School Enrollment in Neah Bay
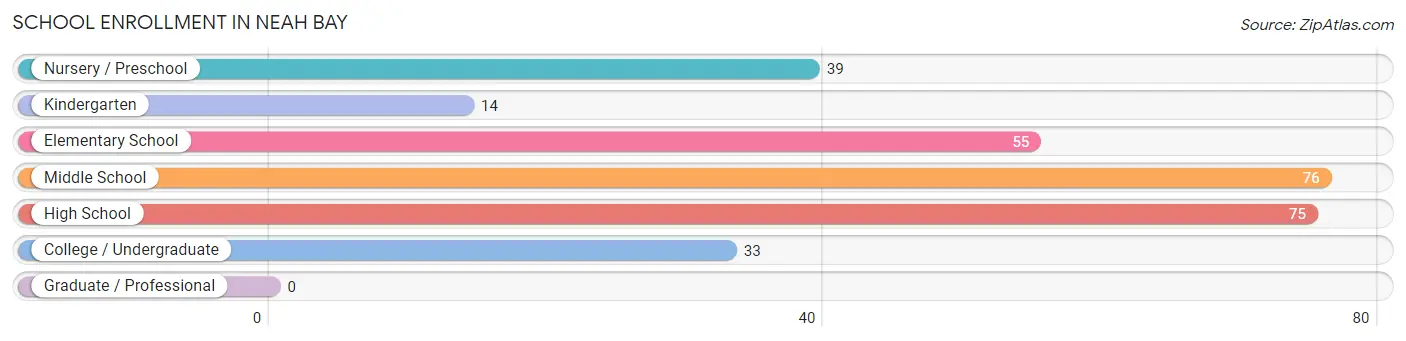
The most common levels of schooling among the 292 students in Neah Bay are middle school (76 | 26.0%), high school (75 | 25.7%), and elementary school (55 | 18.8%).
| School Level | # Students | % Students |
| Nursery / Preschool | 39 | 13.4% |
| Kindergarten | 14 | 4.8% |
| Elementary School | 55 | 18.8% |
| Middle School | 76 | 26.0% |
| High School | 75 | 25.7% |
| College / Undergraduate | 33 | 11.3% |
| Graduate / Professional | 0 | 0.0% |
| Total | 292 | 100.0% |
School Enrollment by Age by Funding Source in Neah Bay
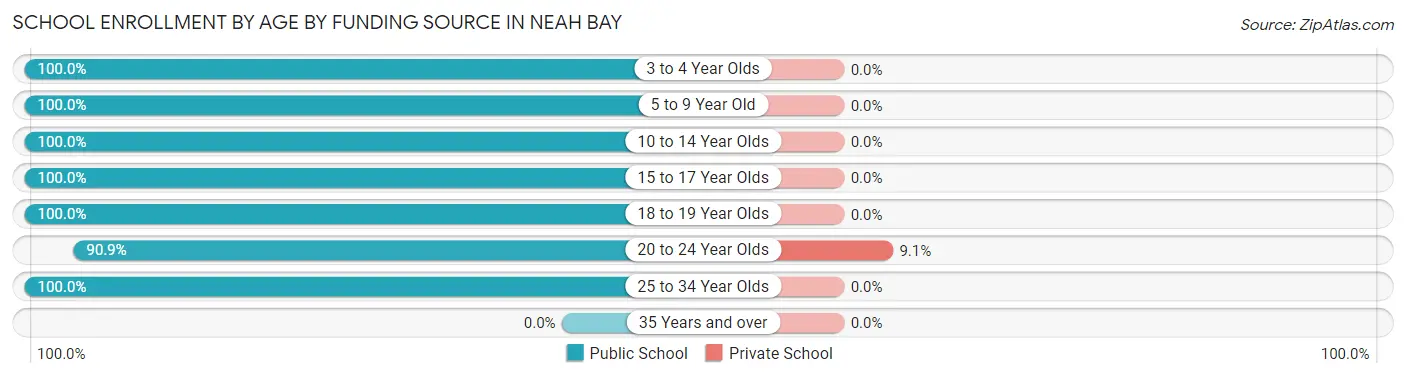
Out of a total of 292 students who are enrolled in schools in Neah Bay, 2 (0.7%) attend a private institution, while the remaining 290 (99.3%) are enrolled in public schools. The age group of 20 to 24 year olds has the highest likelihood of being enrolled in private schools, with 2 (9.1% in the age bracket) enrolled. Conversely, the age group of 3 to 4 year olds has the lowest likelihood of being enrolled in a private school, with 33 (100.0% in the age bracket) attending a public institution.
| Age Bracket | Public School | Private School |
| 3 to 4 Year Olds | 33 (100.0%) | 0 (0.0%) |
| 5 to 9 Year Old | 66 (100.0%) | 0 (0.0%) |
| 10 to 14 Year Olds | 95 (100.0%) | 0 (0.0%) |
| 15 to 17 Year Olds | 50 (100.0%) | 0 (0.0%) |
| 18 to 19 Year Olds | 23 (100.0%) | 0 (0.0%) |
| 20 to 24 Year Olds | 20 (90.9%) | 2 (9.1%) |
| 25 to 34 Year Olds | 3 (100.0%) | 0 (0.0%) |
| 35 Years and over | 0 (0.0%) | 0 (0.0%) |
| Total | 290 (99.3%) | 2 (0.7%) |
Educational Attainment by Field of Study in Neah Bay
Liberal arts & history (45 | 43.3%), literature & languages (14 | 13.5%), education (12 | 11.5%), arts & humanities (11 | 10.6%), and psychology (10 | 9.6%) are the most common fields of study among 104 individuals in Neah Bay who have obtained a bachelor's degree or higher.
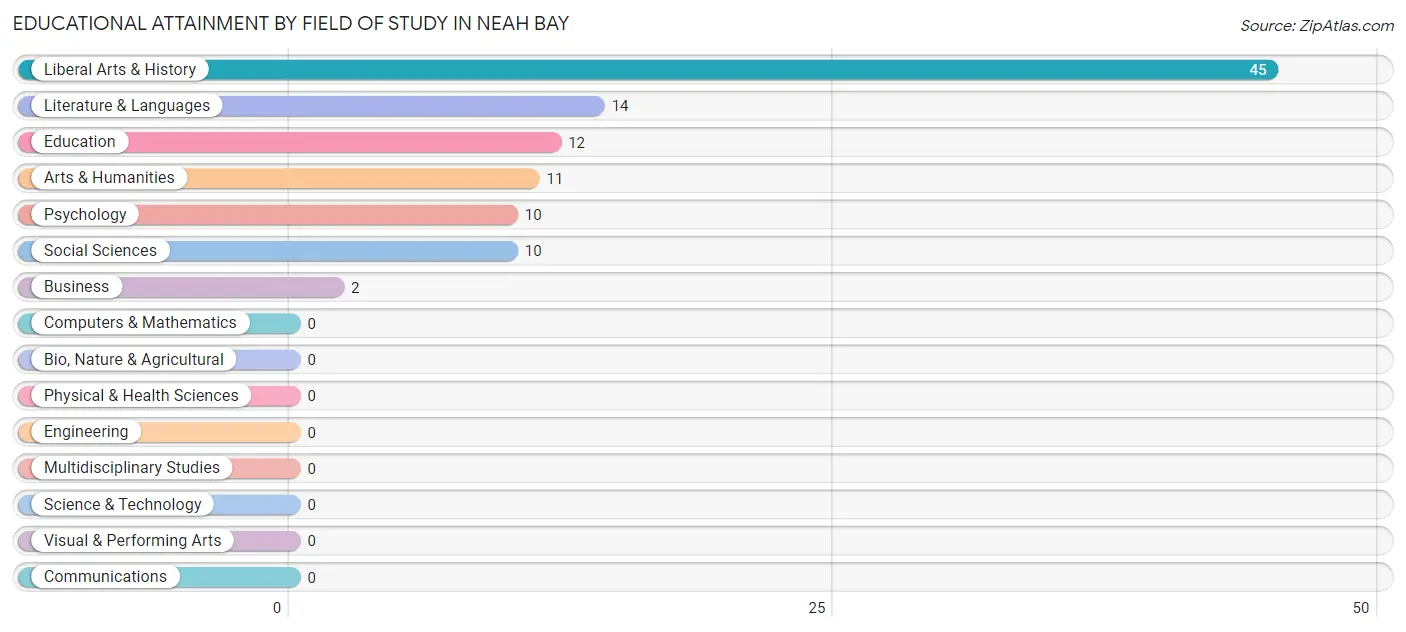
| Field of Study | # Graduates | % Graduates |
| Computers & Mathematics | 0 | 0.0% |
| Bio, Nature & Agricultural | 0 | 0.0% |
| Physical & Health Sciences | 0 | 0.0% |
| Psychology | 10 | 9.6% |
| Social Sciences | 10 | 9.6% |
| Engineering | 0 | 0.0% |
| Multidisciplinary Studies | 0 | 0.0% |
| Science & Technology | 0 | 0.0% |
| Business | 2 | 1.9% |
| Education | 12 | 11.5% |
| Literature & Languages | 14 | 13.5% |
| Liberal Arts & History | 45 | 43.3% |
| Visual & Performing Arts | 0 | 0.0% |
| Communications | 0 | 0.0% |
| Arts & Humanities | 11 | 10.6% |
| Total | 104 | 100.0% |
Transportation & Commute in Neah Bay
Vehicle Availability by Sex in Neah Bay
The most prevalent vehicle ownership categories in Neah Bay are males with 2 vehicles (92, accounting for 35.5%) and females with 2 vehicles (46, making up 41.8%).
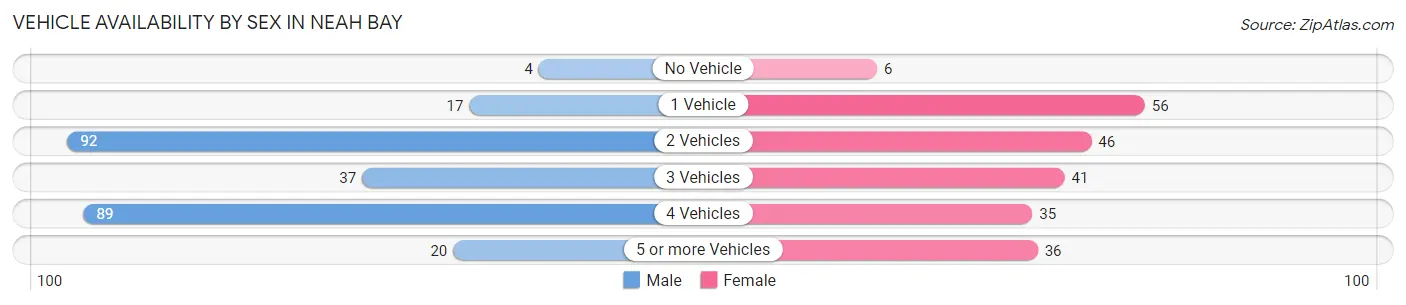
| Vehicles Available | Male | Female |
| No Vehicle | 4 (1.5%) | 6 (2.7%) |
| 1 Vehicle | 17 (6.6%) | 56 (25.5%) |
| 2 Vehicles | 92 (35.5%) | 46 (20.9%) |
| 3 Vehicles | 37 (14.3%) | 41 (18.6%) |
| 4 Vehicles | 89 (34.4%) | 35 (15.9%) |
| 5 or more Vehicles | 20 (7.7%) | 36 (16.4%) |
| Total | 259 (100.0%) | 220 (100.0%) |
Commute Time in Neah Bay
The most frequently occuring commute durations in Neah Bay are 5 to 9 minutes (232 commuters, 50.7%), less than 5 minutes (129 commuters, 28.2%), and 10 to 14 minutes (55 commuters, 12.0%).
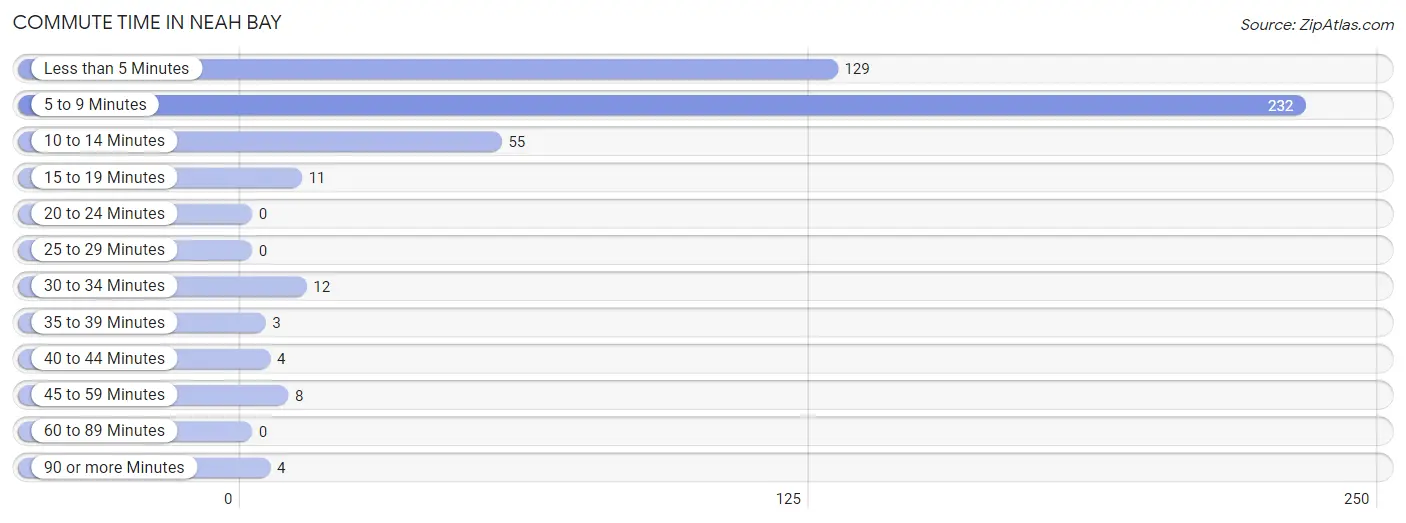
| Commute Time | # Commuters | % Commuters |
| Less than 5 Minutes | 129 | 28.2% |
| 5 to 9 Minutes | 232 | 50.7% |
| 10 to 14 Minutes | 55 | 12.0% |
| 15 to 19 Minutes | 11 | 2.4% |
| 20 to 24 Minutes | 0 | 0.0% |
| 25 to 29 Minutes | 0 | 0.0% |
| 30 to 34 Minutes | 12 | 2.6% |
| 35 to 39 Minutes | 3 | 0.7% |
| 40 to 44 Minutes | 4 | 0.9% |
| 45 to 59 Minutes | 8 | 1.8% |
| 60 to 89 Minutes | 0 | 0.0% |
| 90 or more Minutes | 4 | 0.9% |
Commute Time by Sex in Neah Bay
The most common commute times in Neah Bay are 5 to 9 minutes (120 commuters, 47.2%) for males and 5 to 9 minutes (112 commuters, 54.9%) for females.
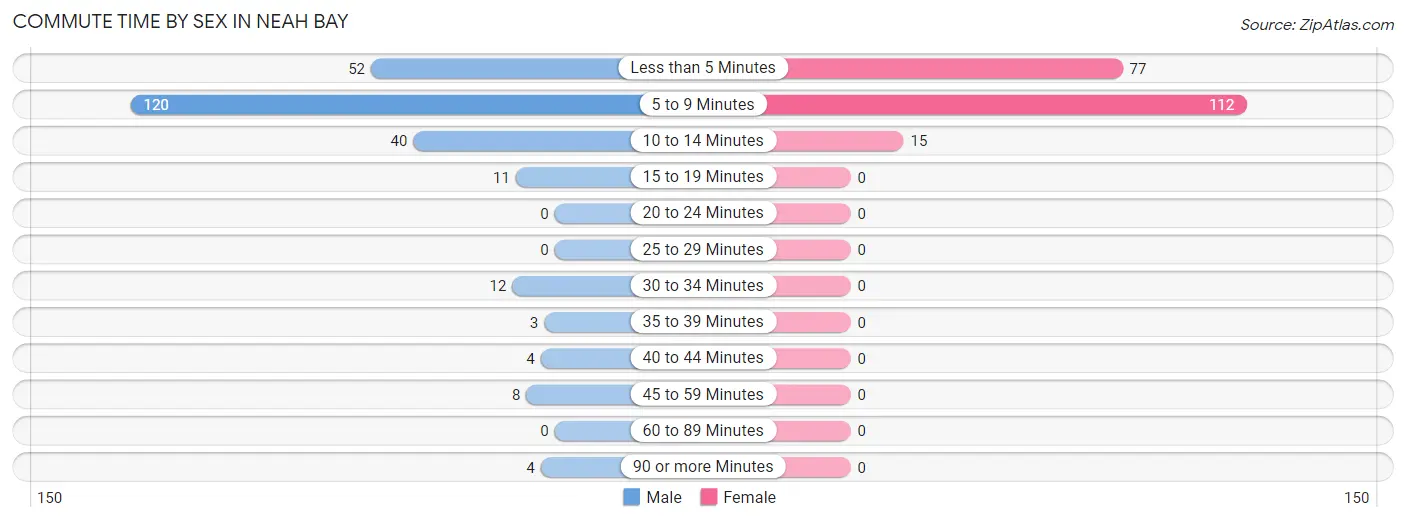
| Commute Time | Male | Female |
| Less than 5 Minutes | 52 (20.5%) | 77 (37.8%) |
| 5 to 9 Minutes | 120 (47.2%) | 112 (54.9%) |
| 10 to 14 Minutes | 40 (15.8%) | 15 (7.3%) |
| 15 to 19 Minutes | 11 (4.3%) | 0 (0.0%) |
| 20 to 24 Minutes | 0 (0.0%) | 0 (0.0%) |
| 25 to 29 Minutes | 0 (0.0%) | 0 (0.0%) |
| 30 to 34 Minutes | 12 (4.7%) | 0 (0.0%) |
| 35 to 39 Minutes | 3 (1.2%) | 0 (0.0%) |
| 40 to 44 Minutes | 4 (1.6%) | 0 (0.0%) |
| 45 to 59 Minutes | 8 (3.2%) | 0 (0.0%) |
| 60 to 89 Minutes | 0 (0.0%) | 0 (0.0%) |
| 90 or more Minutes | 4 (1.6%) | 0 (0.0%) |
Time of Departure to Work by Sex in Neah Bay
The most frequent times of departure to work in Neah Bay are 7:30 AM to 7:59 AM (80, 31.5%) for males and 7:00 AM to 7:29 AM (49, 24.0%) for females.
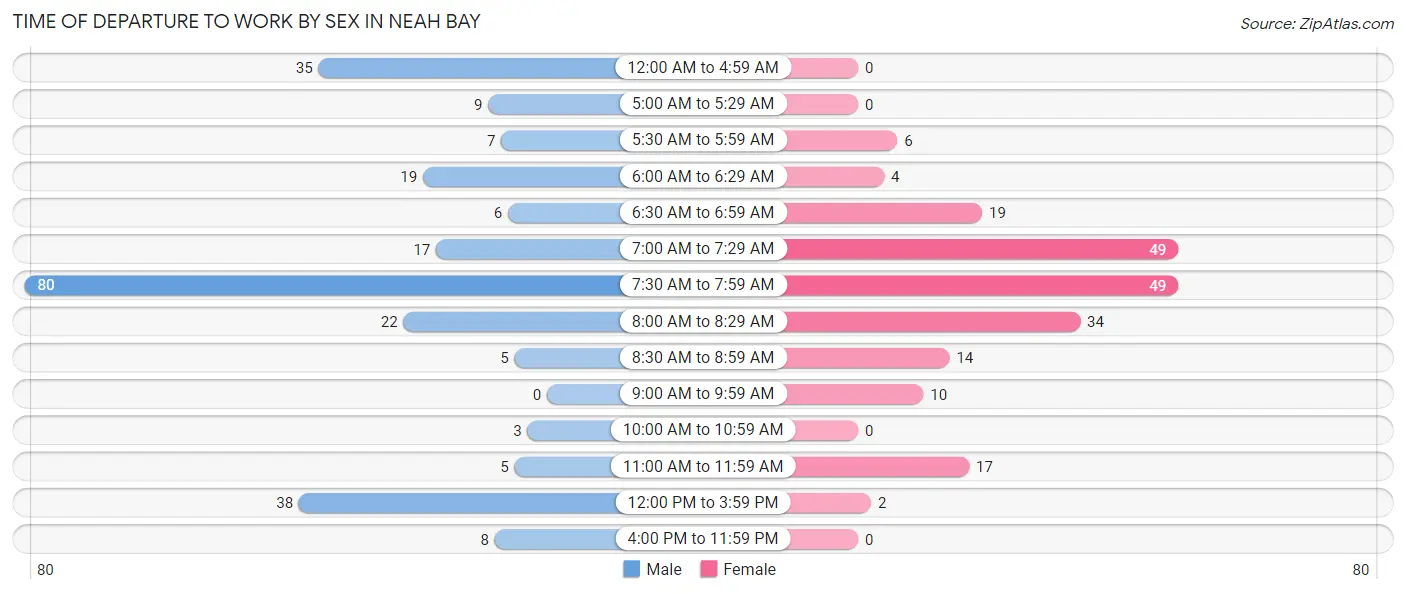
| Time of Departure | Male | Female |
| 12:00 AM to 4:59 AM | 35 (13.8%) | 0 (0.0%) |
| 5:00 AM to 5:29 AM | 9 (3.5%) | 0 (0.0%) |
| 5:30 AM to 5:59 AM | 7 (2.8%) | 6 (2.9%) |
| 6:00 AM to 6:29 AM | 19 (7.5%) | 4 (2.0%) |
| 6:30 AM to 6:59 AM | 6 (2.4%) | 19 (9.3%) |
| 7:00 AM to 7:29 AM | 17 (6.7%) | 49 (24.0%) |
| 7:30 AM to 7:59 AM | 80 (31.5%) | 49 (24.0%) |
| 8:00 AM to 8:29 AM | 22 (8.7%) | 34 (16.7%) |
| 8:30 AM to 8:59 AM | 5 (2.0%) | 14 (6.9%) |
| 9:00 AM to 9:59 AM | 0 (0.0%) | 10 (4.9%) |
| 10:00 AM to 10:59 AM | 3 (1.2%) | 0 (0.0%) |
| 11:00 AM to 11:59 AM | 5 (2.0%) | 17 (8.3%) |
| 12:00 PM to 3:59 PM | 38 (15.0%) | 2 (1.0%) |
| 4:00 PM to 11:59 PM | 8 (3.2%) | 0 (0.0%) |
| Total | 254 (100.0%) | 204 (100.0%) |
Housing Occupancy in Neah Bay
Occupancy by Ownership in Neah Bay
Of the total 333 dwellings in Neah Bay, owner-occupied units account for 254 (76.3%), while renter-occupied units make up 79 (23.7%).
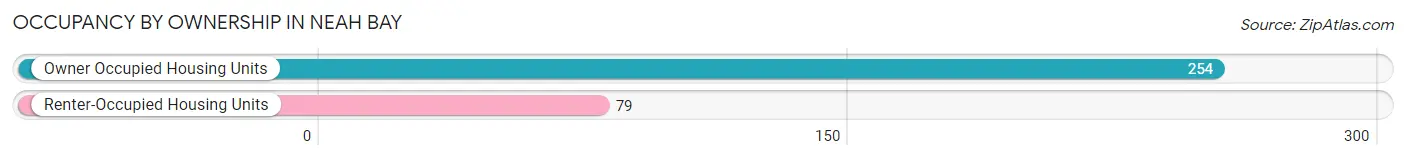
| Occupancy | # Housing Units | % Housing Units |
| Owner Occupied Housing Units | 254 | 76.3% |
| Renter-Occupied Housing Units | 79 | 23.7% |
| Total Occupied Housing Units | 333 | 100.0% |
Occupancy by Household Size in Neah Bay
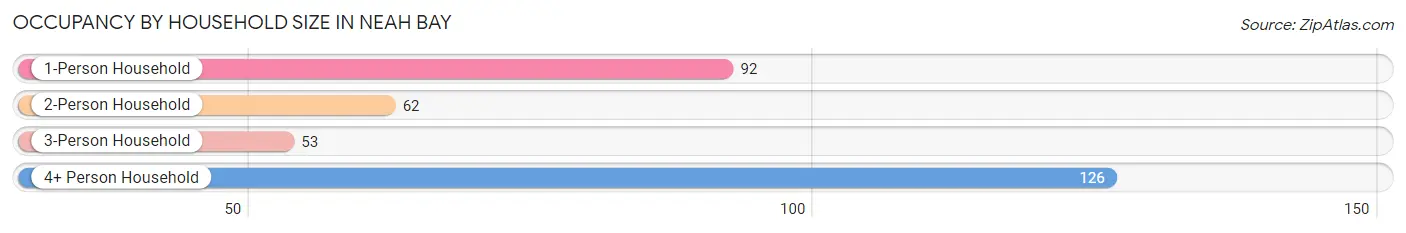
| Household Size | # Housing Units | % Housing Units |
| 1-Person Household | 92 | 27.6% |
| 2-Person Household | 62 | 18.6% |
| 3-Person Household | 53 | 15.9% |
| 4+ Person Household | 126 | 37.8% |
| Total Housing Units | 333 | 100.0% |
Occupancy by Ownership by Household Size in Neah Bay
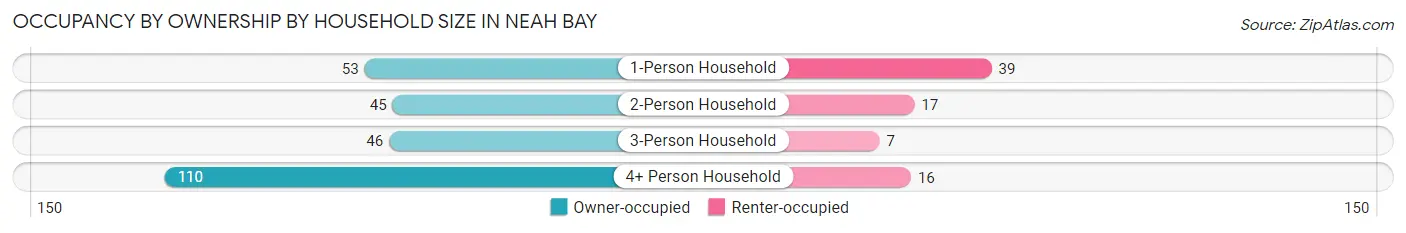
| Household Size | Owner-occupied | Renter-occupied |
| 1-Person Household | 53 (57.6%) | 39 (42.4%) |
| 2-Person Household | 45 (72.6%) | 17 (27.4%) |
| 3-Person Household | 46 (86.8%) | 7 (13.2%) |
| 4+ Person Household | 110 (87.3%) | 16 (12.7%) |
| Total Housing Units | 254 (76.3%) | 79 (23.7%) |
Occupancy by Educational Attainment in Neah Bay
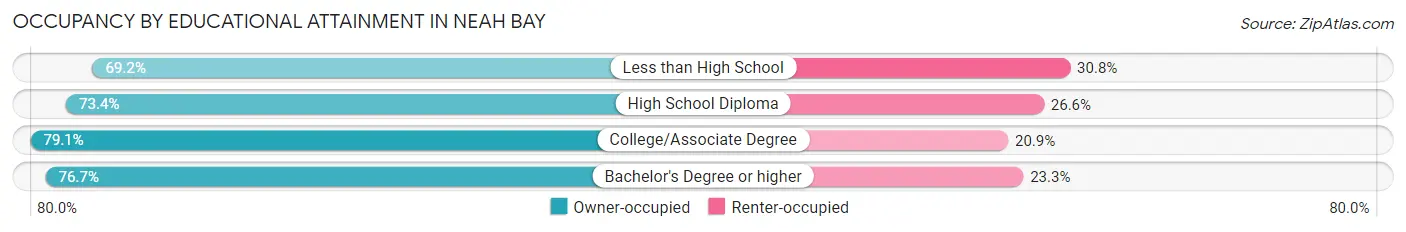
| Household Size | Owner-occupied | Renter-occupied |
| Less than High School | 18 (69.2%) | 8 (30.8%) |
| High School Diploma | 69 (73.4%) | 25 (26.6%) |
| College/Associate Degree | 121 (79.1%) | 32 (20.9%) |
| Bachelor's Degree or higher | 46 (76.7%) | 14 (23.3%) |
Occupancy by Age of Householder in Neah Bay
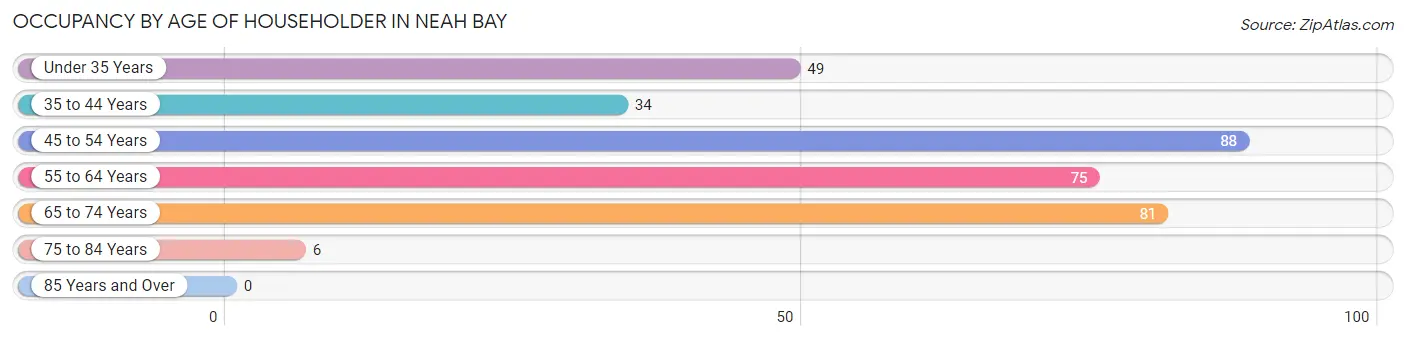
| Age Bracket | # Households | % Households |
| Under 35 Years | 49 | 14.7% |
| 35 to 44 Years | 34 | 10.2% |
| 45 to 54 Years | 88 | 26.4% |
| 55 to 64 Years | 75 | 22.5% |
| 65 to 74 Years | 81 | 24.3% |
| 75 to 84 Years | 6 | 1.8% |
| 85 Years and Over | 0 | 0.0% |
| Total | 333 | 100.0% |
Housing Finances in Neah Bay
Median Income by Occupancy in Neah Bay
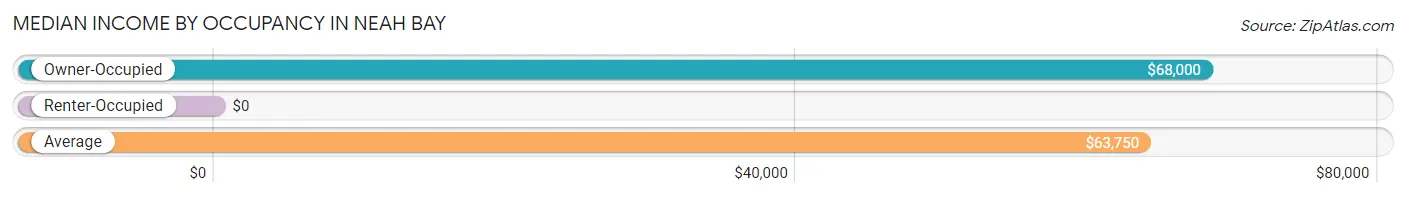
| Occupancy Type | # Households | Median Income |
| Owner-Occupied | 254 (76.3%) | $68,000 |
| Renter-Occupied | 79 (23.7%) | $0 |
| Average | 333 (100.0%) | $63,750 |
Occupancy by Householder Income Bracket in Neah Bay
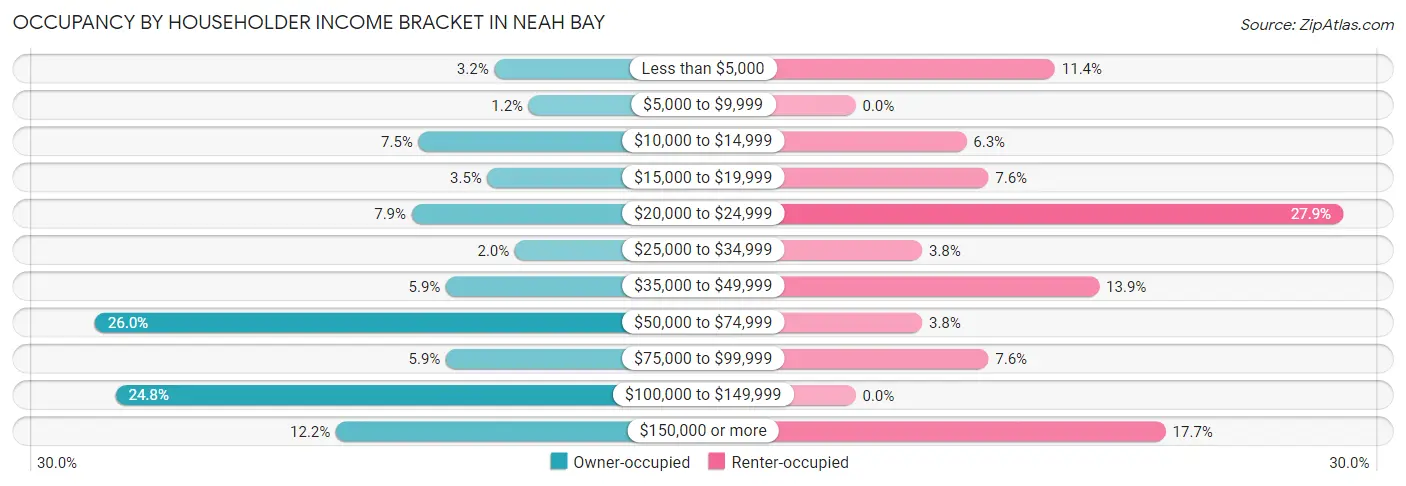
| Income Bracket | Owner-occupied | Renter-occupied |
| Less than $5,000 | 8 (3.2%) | 9 (11.4%) |
| $5,000 to $9,999 | 3 (1.2%) | 0 (0.0%) |
| $10,000 to $14,999 | 19 (7.5%) | 5 (6.3%) |
| $15,000 to $19,999 | 9 (3.5%) | 6 (7.6%) |
| $20,000 to $24,999 | 20 (7.9%) | 22 (27.9%) |
| $25,000 to $34,999 | 5 (2.0%) | 3 (3.8%) |
| $35,000 to $49,999 | 15 (5.9%) | 11 (13.9%) |
| $50,000 to $74,999 | 66 (26.0%) | 3 (3.8%) |
| $75,000 to $99,999 | 15 (5.9%) | 6 (7.6%) |
| $100,000 to $149,999 | 63 (24.8%) | 0 (0.0%) |
| $150,000 or more | 31 (12.2%) | 14 (17.7%) |
| Total | 254 (100.0%) | 79 (100.0%) |
Monthly Housing Cost Tiers in Neah Bay
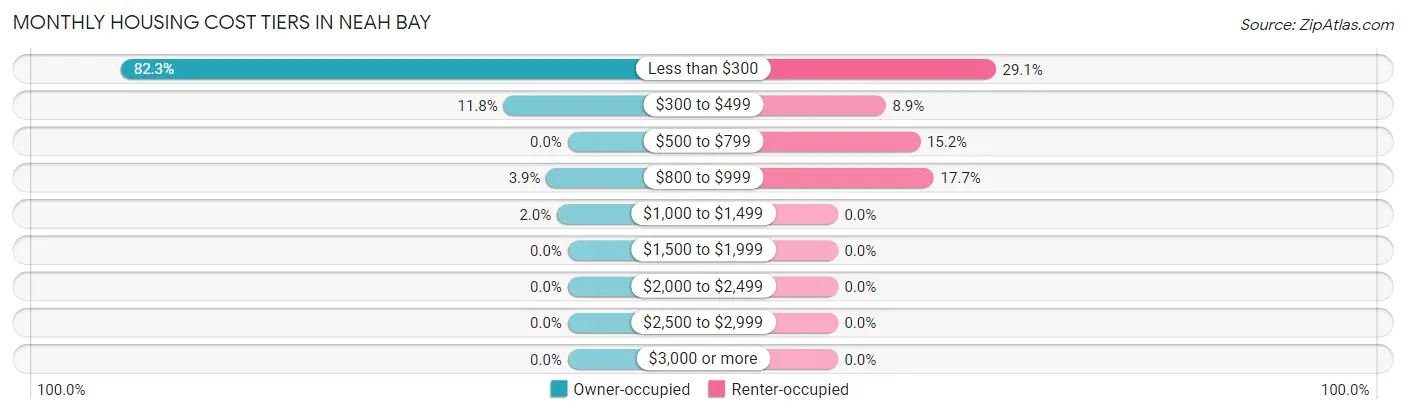
| Monthly Cost | Owner-occupied | Renter-occupied |
| Less than $300 | 209 (82.3%) | 23 (29.1%) |
| $300 to $499 | 30 (11.8%) | 7 (8.9%) |
| $500 to $799 | 0 (0.0%) | 12 (15.2%) |
| $800 to $999 | 10 (3.9%) | 14 (17.7%) |
| $1,000 to $1,499 | 5 (2.0%) | 0 (0.0%) |
| $1,500 to $1,999 | 0 (0.0%) | 0 (0.0%) |
| $2,000 to $2,499 | 0 (0.0%) | 0 (0.0%) |
| $2,500 to $2,999 | 0 (0.0%) | 0 (0.0%) |
| $3,000 or more | 0 (0.0%) | 0 (0.0%) |
| Total | 254 (100.0%) | 79 (100.0%) |
Physical Housing Characteristics in Neah Bay
Housing Structures in Neah Bay
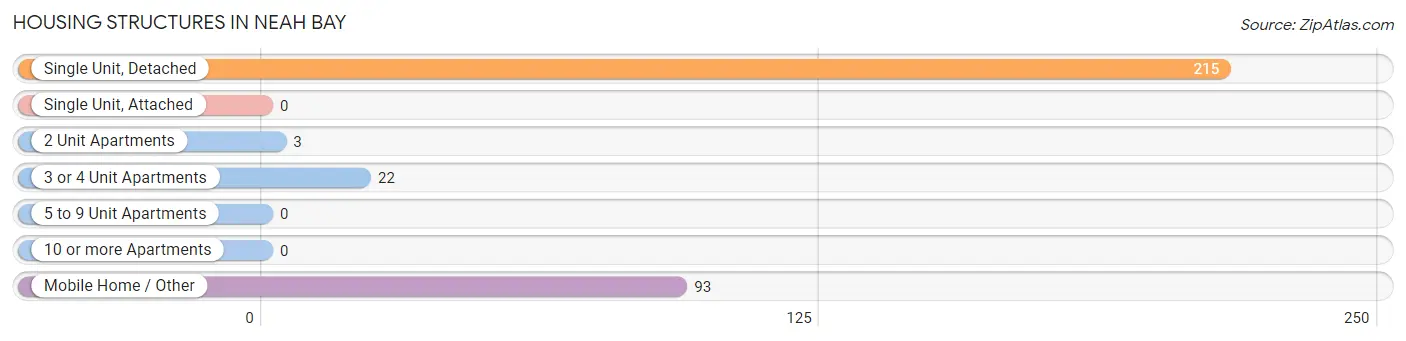
| Structure Type | # Housing Units | % Housing Units |
| Single Unit, Detached | 215 | 64.6% |
| Single Unit, Attached | 0 | 0.0% |
| 2 Unit Apartments | 3 | 0.9% |
| 3 or 4 Unit Apartments | 22 | 6.6% |
| 5 to 9 Unit Apartments | 0 | 0.0% |
| 10 or more Apartments | 0 | 0.0% |
| Mobile Home / Other | 93 | 27.9% |
| Total | 333 | 100.0% |
Housing Structures by Occupancy in Neah Bay
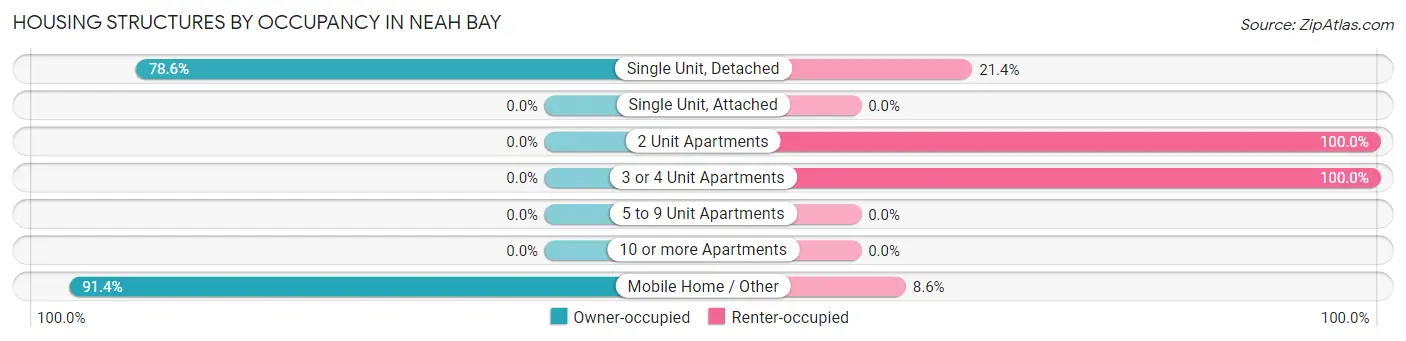
| Structure Type | Owner-occupied | Renter-occupied |
| Single Unit, Detached | 169 (78.6%) | 46 (21.4%) |
| Single Unit, Attached | 0 (0.0%) | 0 (0.0%) |
| 2 Unit Apartments | 0 (0.0%) | 3 (100.0%) |
| 3 or 4 Unit Apartments | 0 (0.0%) | 22 (100.0%) |
| 5 to 9 Unit Apartments | 0 (0.0%) | 0 (0.0%) |
| 10 or more Apartments | 0 (0.0%) | 0 (0.0%) |
| Mobile Home / Other | 85 (91.4%) | 8 (8.6%) |
| Total | 254 (76.3%) | 79 (23.7%) |
Housing Structures by Number of Rooms in Neah Bay
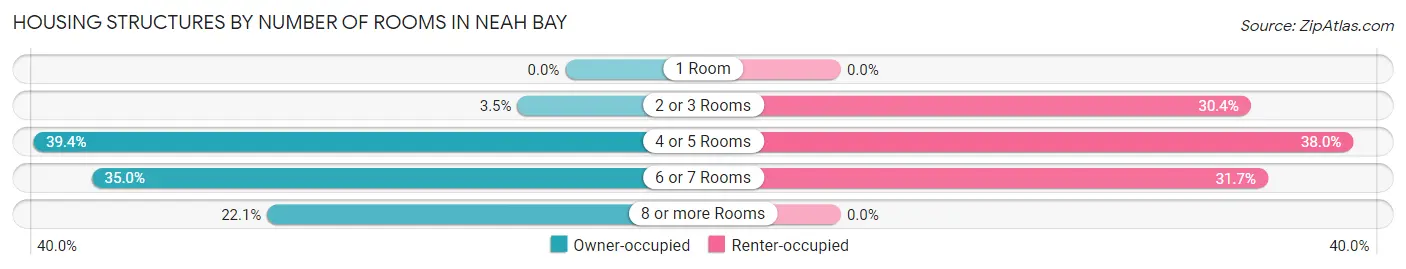
| Number of Rooms | Owner-occupied | Renter-occupied |
| 1 Room | 0 (0.0%) | 0 (0.0%) |
| 2 or 3 Rooms | 9 (3.5%) | 24 (30.4%) |
| 4 or 5 Rooms | 100 (39.4%) | 30 (38.0%) |
| 6 or 7 Rooms | 89 (35.0%) | 25 (31.7%) |
| 8 or more Rooms | 56 (22.1%) | 0 (0.0%) |
| Total | 254 (100.0%) | 79 (100.0%) |
Housing Structure by Heating Type in Neah Bay
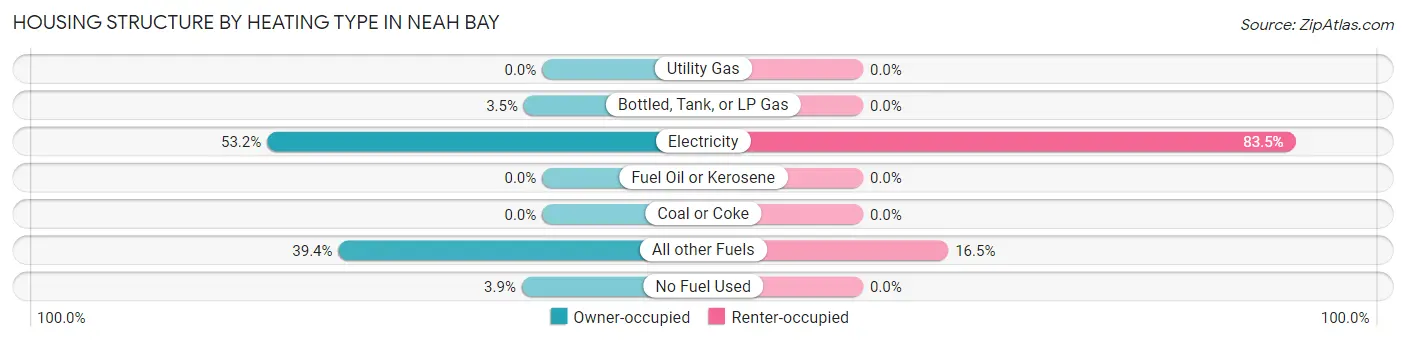
| Heating Type | Owner-occupied | Renter-occupied |
| Utility Gas | 0 (0.0%) | 0 (0.0%) |
| Bottled, Tank, or LP Gas | 9 (3.5%) | 0 (0.0%) |
| Electricity | 135 (53.1%) | 66 (83.5%) |
| Fuel Oil or Kerosene | 0 (0.0%) | 0 (0.0%) |
| Coal or Coke | 0 (0.0%) | 0 (0.0%) |
| All other Fuels | 100 (39.4%) | 13 (16.5%) |
| No Fuel Used | 10 (3.9%) | 0 (0.0%) |
| Total | 254 (100.0%) | 79 (100.0%) |
Household Vehicle Usage in Neah Bay
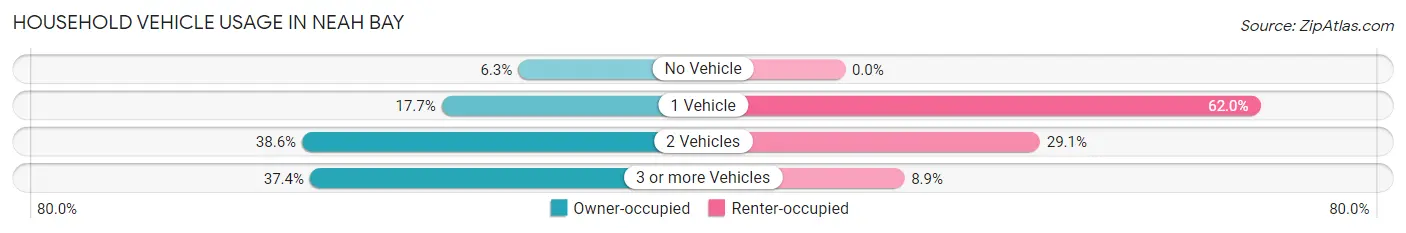
| Vehicles per Household | Owner-occupied | Renter-occupied |
| No Vehicle | 16 (6.3%) | 0 (0.0%) |
| 1 Vehicle | 45 (17.7%) | 49 (62.0%) |
| 2 Vehicles | 98 (38.6%) | 23 (29.1%) |
| 3 or more Vehicles | 95 (37.4%) | 7 (8.9%) |
| Total | 254 (100.0%) | 79 (100.0%) |
Real Estate & Mortgages in Neah Bay
Real Estate and Mortgage Overview in Neah Bay
| Characteristic | Without Mortgage | With Mortgage |
| Housing Units | 235 | 19 |
| Median Property Value | $135,200 | $212,500 |
| Median Household Income | $68,750 | $4 |
| Monthly Housing Costs | $204 | $0 |
| Real Estate Taxes | $199 | $19 |
Property Value by Mortgage Status in Neah Bay
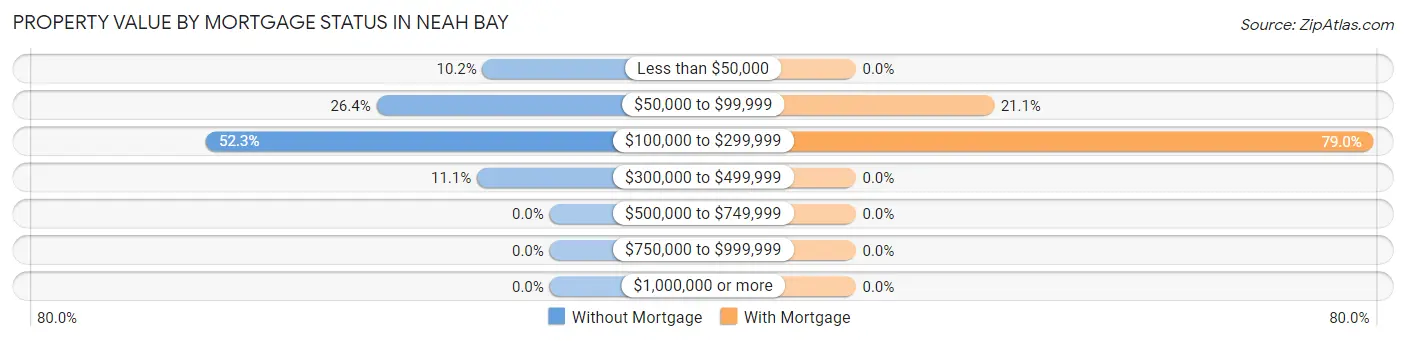
| Property Value | Without Mortgage | With Mortgage |
| Less than $50,000 | 24 (10.2%) | 0 (0.0%) |
| $50,000 to $99,999 | 62 (26.4%) | 4 (21.0%) |
| $100,000 to $299,999 | 123 (52.3%) | 15 (78.9%) |
| $300,000 to $499,999 | 26 (11.1%) | 0 (0.0%) |
| $500,000 to $749,999 | 0 (0.0%) | 0 (0.0%) |
| $750,000 to $999,999 | 0 (0.0%) | 0 (0.0%) |
| $1,000,000 or more | 0 (0.0%) | 0 (0.0%) |
| Total | 235 (100.0%) | 19 (100.0%) |
Household Income by Mortgage Status in Neah Bay
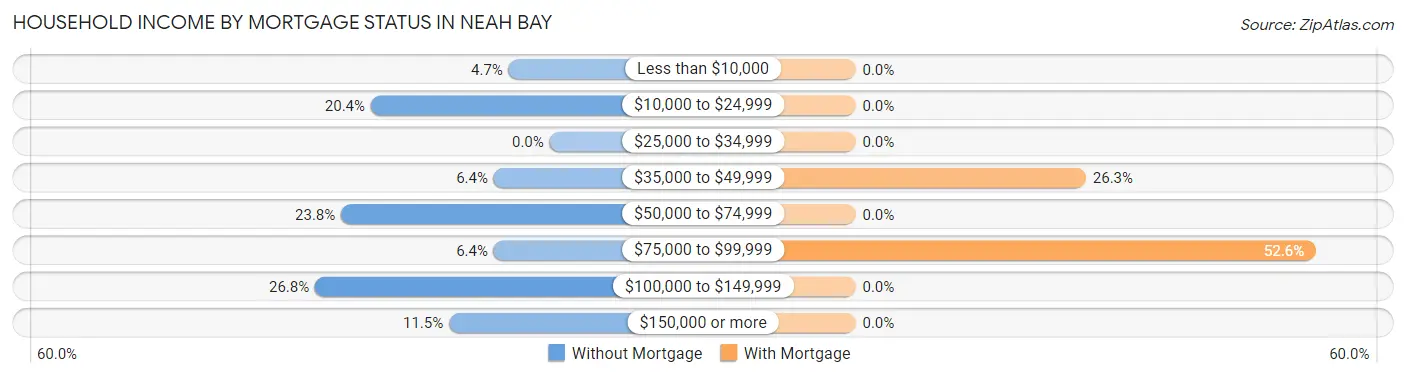
| Household Income | Without Mortgage | With Mortgage |
| Less than $10,000 | 11 (4.7%) | 0 (0.0%) |
| $10,000 to $24,999 | 48 (20.4%) | 0 (0.0%) |
| $25,000 to $34,999 | 0 (0.0%) | 0 (0.0%) |
| $35,000 to $49,999 | 15 (6.4%) | 5 (26.3%) |
| $50,000 to $74,999 | 56 (23.8%) | 0 (0.0%) |
| $75,000 to $99,999 | 15 (6.4%) | 10 (52.6%) |
| $100,000 to $149,999 | 63 (26.8%) | 0 (0.0%) |
| $150,000 or more | 27 (11.5%) | 0 (0.0%) |
| Total | 235 (100.0%) | 19 (100.0%) |
Property Value to Household Income Ratio in Neah Bay

| Value-to-Income Ratio | Without Mortgage | With Mortgage |
| Less than 2.0x | 126 (53.6%) | 66,875 (351,973.7%) |
| 2.0x to 2.9x | 32 (13.6%) | 8 (42.1%) |
| 3.0x to 3.9x | 10 (4.3%) | 0 (0.0%) |
| 4.0x or more | 59 (25.1%) | 6 (31.6%) |
| Total | 235 (100.0%) | 19 (100.0%) |
Real Estate Taxes by Mortgage Status in Neah Bay
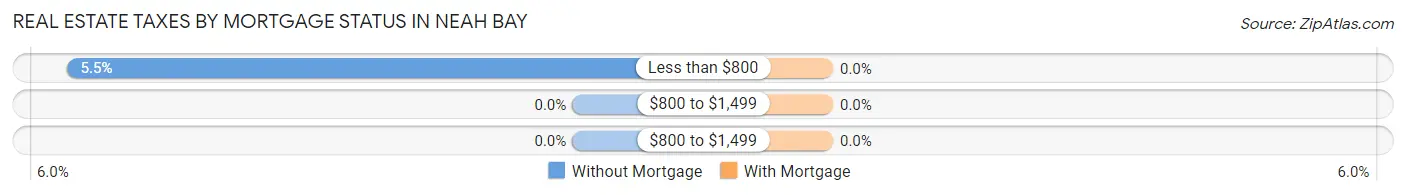
| Property Taxes | Without Mortgage | With Mortgage |
| Less than $800 | 13 (5.5%) | 0 (0.0%) |
| $800 to $1,499 | 0 (0.0%) | 0 (0.0%) |
| $800 to $1,499 | 0 (0.0%) | 0 (0.0%) |
| Total | 235 (100.0%) | 19 (100.0%) |
Health & Disability in Neah Bay
Health Insurance Coverage by Age in Neah Bay
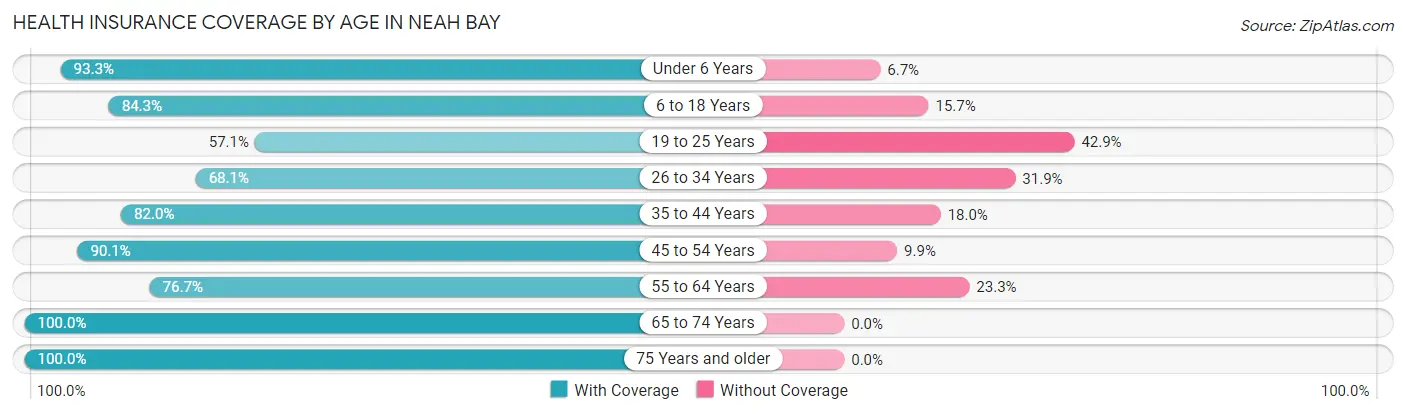
| Age Bracket | With Coverage | Without Coverage |
| Under 6 Years | 97 (93.3%) | 7 (6.7%) |
| 6 to 18 Years | 177 (84.3%) | 33 (15.7%) |
| 19 to 25 Years | 121 (57.1%) | 91 (42.9%) |
| 26 to 34 Years | 32 (68.1%) | 15 (31.9%) |
| 35 to 44 Years | 73 (82.0%) | 16 (18.0%) |
| 45 to 54 Years | 128 (90.1%) | 14 (9.9%) |
| 55 to 64 Years | 92 (76.7%) | 28 (23.3%) |
| 65 to 74 Years | 124 (100.0%) | 0 (0.0%) |
| 75 Years and older | 6 (100.0%) | 0 (0.0%) |
| Total | 850 (80.6%) | 204 (19.4%) |
Health Insurance Coverage by Citizenship Status in Neah Bay
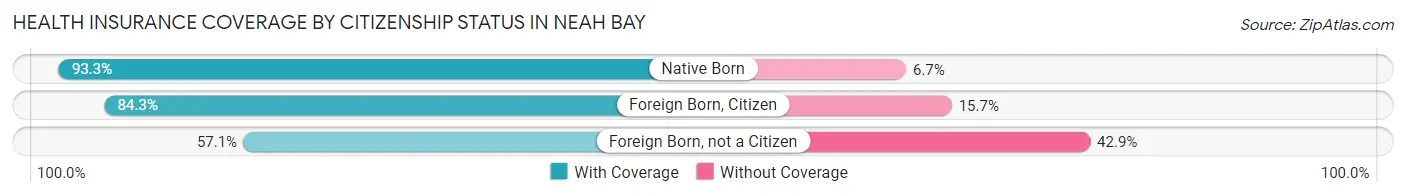
| Citizenship Status | With Coverage | Without Coverage |
| Native Born | 97 (93.3%) | 7 (6.7%) |
| Foreign Born, Citizen | 177 (84.3%) | 33 (15.7%) |
| Foreign Born, not a Citizen | 121 (57.1%) | 91 (42.9%) |
Health Insurance Coverage by Household Income in Neah Bay
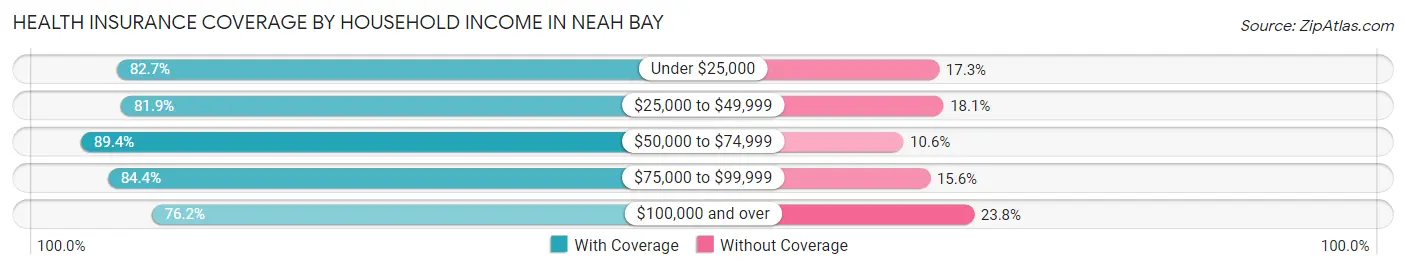
| Household Income | With Coverage | Without Coverage |
| Under $25,000 | 139 (82.7%) | 29 (17.3%) |
| $25,000 to $49,999 | 118 (81.9%) | 26 (18.1%) |
| $50,000 to $74,999 | 144 (89.4%) | 17 (10.6%) |
| $75,000 to $99,999 | 65 (84.4%) | 12 (15.6%) |
| $100,000 and over | 384 (76.2%) | 120 (23.8%) |
Public vs Private Health Insurance Coverage by Age in Neah Bay
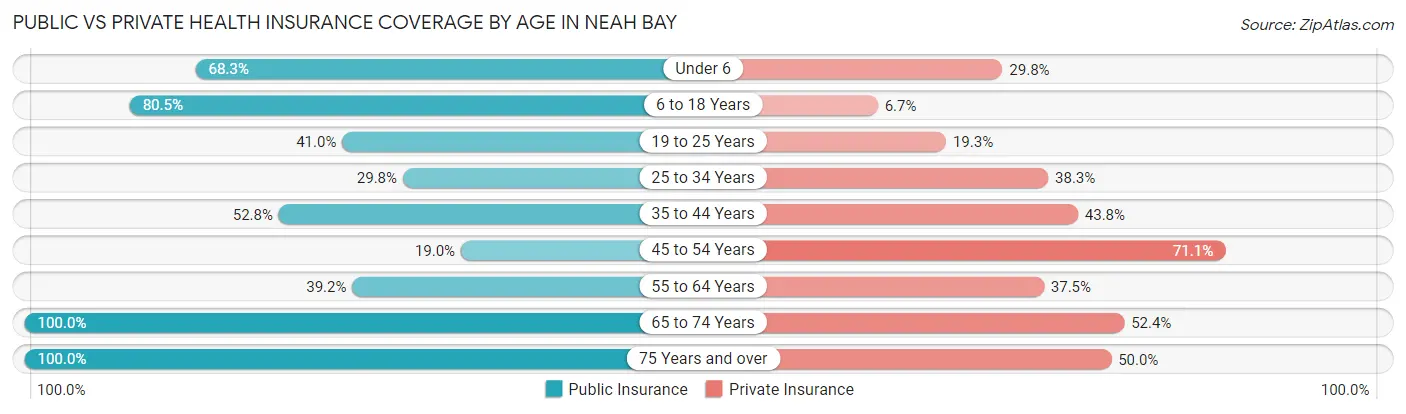
| Age Bracket | Public Insurance | Private Insurance |
| Under 6 | 71 (68.3%) | 31 (29.8%) |
| 6 to 18 Years | 169 (80.5%) | 14 (6.7%) |
| 19 to 25 Years | 87 (41.0%) | 41 (19.3%) |
| 25 to 34 Years | 14 (29.8%) | 18 (38.3%) |
| 35 to 44 Years | 47 (52.8%) | 39 (43.8%) |
| 45 to 54 Years | 27 (19.0%) | 101 (71.1%) |
| 55 to 64 Years | 47 (39.2%) | 45 (37.5%) |
| 65 to 74 Years | 124 (100.0%) | 65 (52.4%) |
| 75 Years and over | 6 (100.0%) | 3 (50.0%) |
| Total | 592 (56.2%) | 357 (33.9%) |
Disability Status by Sex by Age in Neah Bay
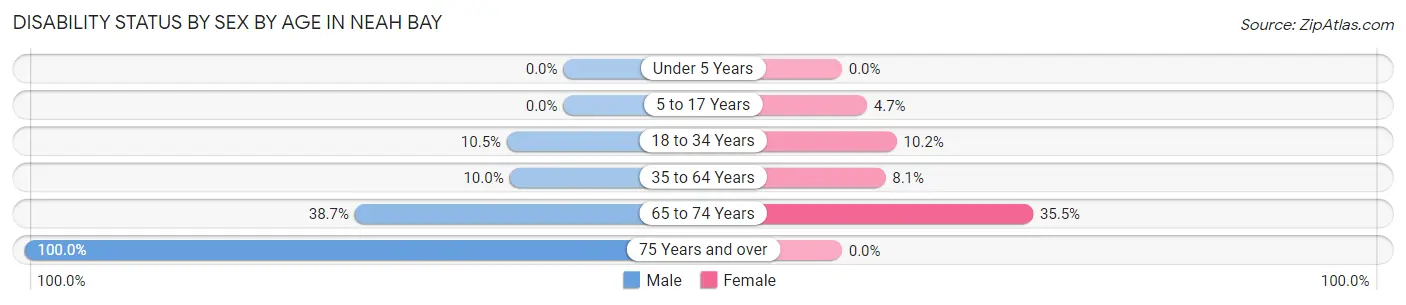
| Age Bracket | Male | Female |
| Under 5 Years | 0 (0.0%) | 0 (0.0%) |
| 5 to 17 Years | 0 (0.0%) | 6 (4.6%) |
| 18 to 34 Years | 11 (10.5%) | 17 (10.2%) |
| 35 to 64 Years | 19 (10.0%) | 13 (8.1%) |
| 65 to 74 Years | 24 (38.7%) | 22 (35.5%) |
| 75 Years and over | 6 (100.0%) | 0 (0.0%) |
Disability Class by Sex by Age in Neah Bay
Disability Class: Hearing Difficulty
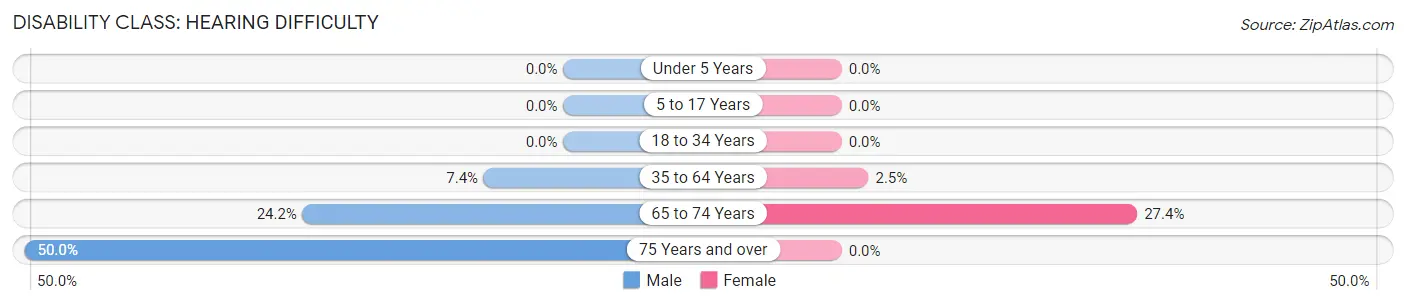
| Age Bracket | Male | Female |
| Under 5 Years | 0 (0.0%) | 0 (0.0%) |
| 5 to 17 Years | 0 (0.0%) | 0 (0.0%) |
| 18 to 34 Years | 0 (0.0%) | 0 (0.0%) |
| 35 to 64 Years | 14 (7.4%) | 4 (2.5%) |
| 65 to 74 Years | 15 (24.2%) | 17 (27.4%) |
| 75 Years and over | 3 (50.0%) | 0 (0.0%) |
Disability Class: Vision Difficulty
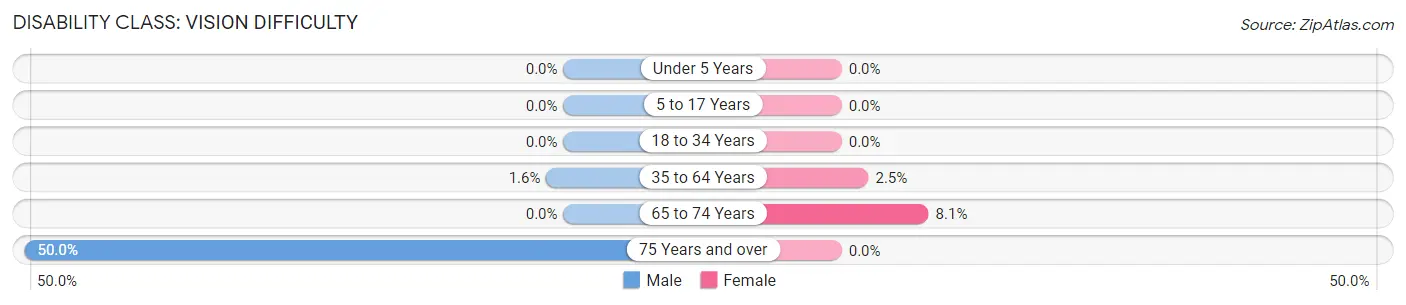
| Age Bracket | Male | Female |
| Under 5 Years | 0 (0.0%) | 0 (0.0%) |
| 5 to 17 Years | 0 (0.0%) | 0 (0.0%) |
| 18 to 34 Years | 0 (0.0%) | 0 (0.0%) |
| 35 to 64 Years | 3 (1.6%) | 4 (2.5%) |
| 65 to 74 Years | 0 (0.0%) | 5 (8.1%) |
| 75 Years and over | 3 (50.0%) | 0 (0.0%) |
Disability Class: Cognitive Difficulty
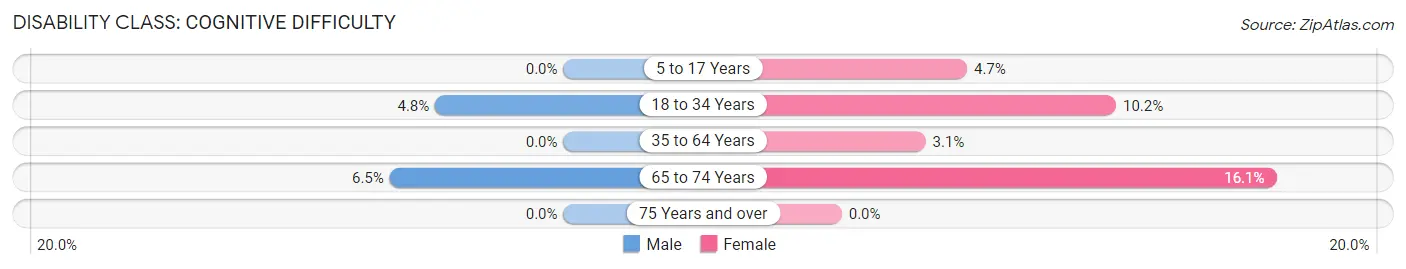
| Age Bracket | Male | Female |
| 5 to 17 Years | 0 (0.0%) | 6 (4.6%) |
| 18 to 34 Years | 5 (4.8%) | 17 (10.2%) |
| 35 to 64 Years | 0 (0.0%) | 5 (3.1%) |
| 65 to 74 Years | 4 (6.5%) | 10 (16.1%) |
| 75 Years and over | 0 (0.0%) | 0 (0.0%) |
Disability Class: Ambulatory Difficulty
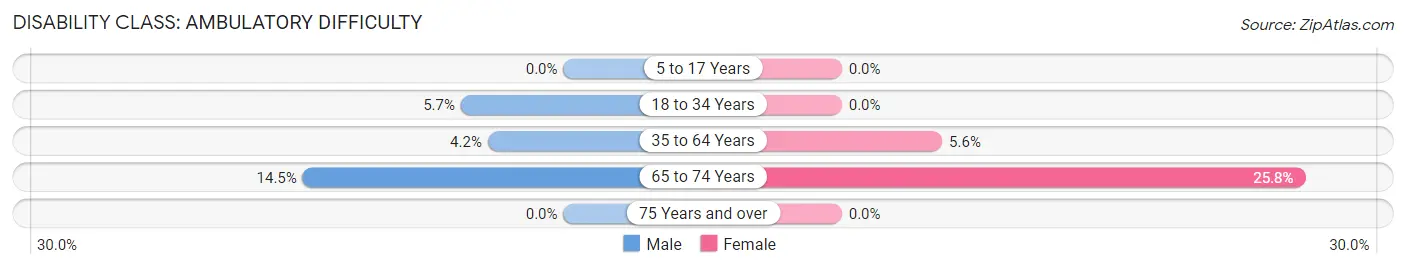
| Age Bracket | Male | Female |
| 5 to 17 Years | 0 (0.0%) | 0 (0.0%) |
| 18 to 34 Years | 6 (5.7%) | 0 (0.0%) |
| 35 to 64 Years | 8 (4.2%) | 9 (5.6%) |
| 65 to 74 Years | 9 (14.5%) | 16 (25.8%) |
| 75 Years and over | 0 (0.0%) | 0 (0.0%) |
Disability Class: Self-Care Difficulty
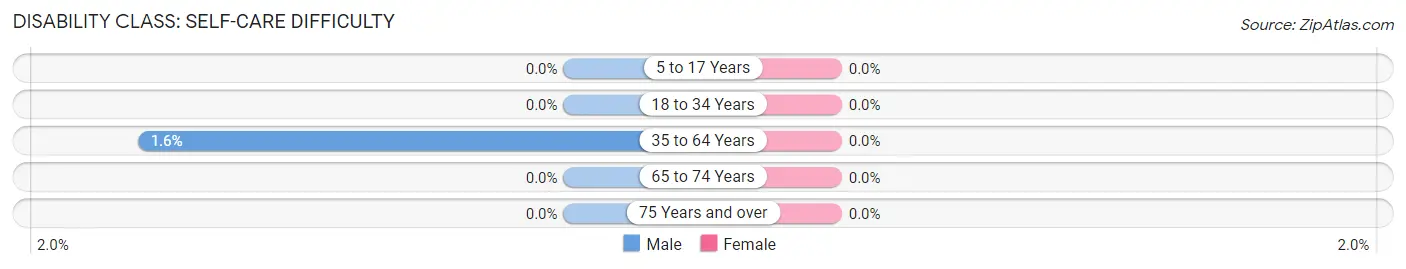
| Age Bracket | Male | Female |
| 5 to 17 Years | 0 (0.0%) | 0 (0.0%) |
| 18 to 34 Years | 0 (0.0%) | 0 (0.0%) |
| 35 to 64 Years | 3 (1.6%) | 0 (0.0%) |
| 65 to 74 Years | 0 (0.0%) | 0 (0.0%) |
| 75 Years and over | 0 (0.0%) | 0 (0.0%) |
Technology Access in Neah Bay
Computing Device Access in Neah Bay
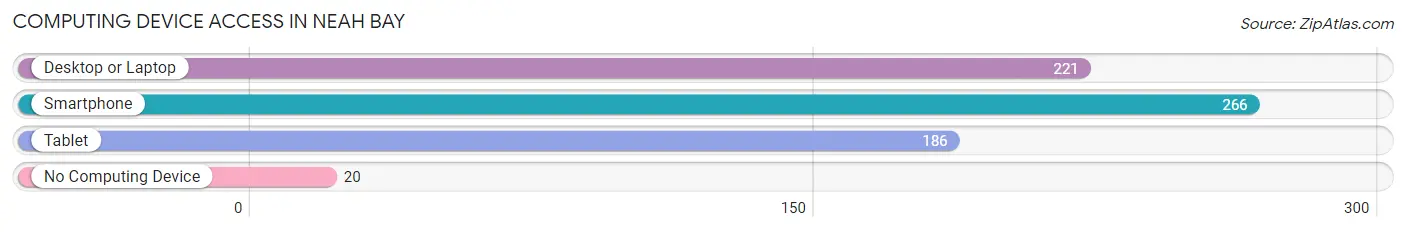
| Device Type | # Households | % Households |
| Desktop or Laptop | 221 | 66.4% |
| Smartphone | 266 | 79.9% |
| Tablet | 186 | 55.9% |
| No Computing Device | 20 | 6.0% |
| Total | 333 | 100.0% |
Internet Access in Neah Bay
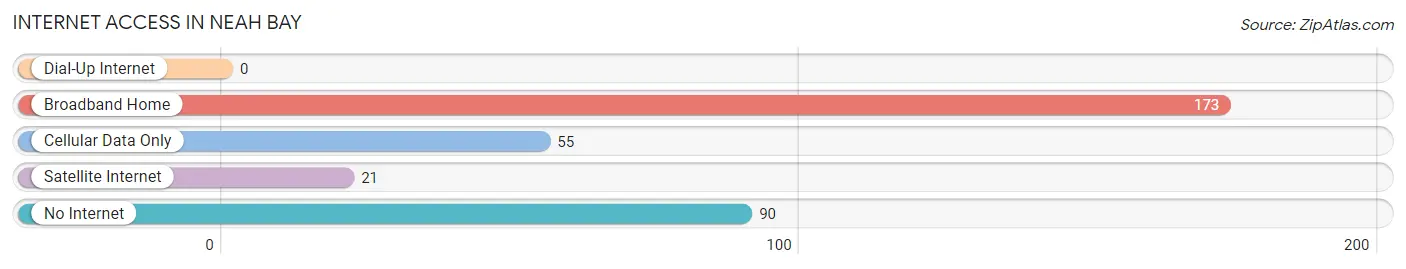
| Internet Type | # Households | % Households |
| Dial-Up Internet | 0 | 0.0% |
| Broadband Home | 173 | 51.9% |
| Cellular Data Only | 55 | 16.5% |
| Satellite Internet | 21 | 6.3% |
| No Internet | 90 | 27.0% |
| Total | 333 | 100.0% |
Neah Bay Summary
Neah Bay is a small unincorporated community located on the Makah Indian Reservation in the northwest corner of Washington State. It is situated on the Strait of Juan de Fuca, just south of Cape Flattery, the northwesternmost point in the contiguous United States. Neah Bay is the traditional home of the Makah people, who have lived in the area for thousands of years.
History
The Makah people have lived in the Neah Bay area for thousands of years, and the area has been an important part of their culture and history. The Makah were a seafaring people, and their traditional territory extended from the Olympic Peninsula to Vancouver Island. They were known for their whaling and fishing skills, and their villages were located along the coast.
The first Europeans to visit the area were Spanish explorers in 1790. In 1834, the Hudson's Bay Company established a trading post at Neah Bay, and the Makah began trading with the Europeans. In 1855, the Makah signed the Treaty of Neah Bay, which established the Makah Reservation and granted the Makah fishing and whaling rights.
In the late 19th century, Neah Bay became a popular destination for tourists, and the town grew rapidly. In the early 20th century, the town was home to a cannery, a sawmill, and a salmon hatchery. In the 1950s, the town was connected to the mainland by a bridge, and the population continued to grow.
Geography
Neah Bay is located on the Makah Indian Reservation in the northwest corner of Washington State. It is situated on the Strait of Juan de Fuca, just south of Cape Flattery, the northwesternmost point in the contiguous United States. The town is surrounded by the Olympic National Park and the Olympic National Forest.
The climate in Neah Bay is mild and temperate, with cool summers and mild winters. The average annual temperature is 50°F (10°C). The average annual precipitation is 60 inches (152 cm).
Economy
The economy of Neah Bay is largely based on fishing and tourism. The Makah Tribe operates a fish hatchery and a fish processing plant in the town. The Makah also operate a number of tourist attractions, including a whale watching center, a museum, and a cultural center.
The town is also home to a number of small businesses, including restaurants, gift shops, and art galleries. The Makah Tribe also operates a number of businesses, including a marina, a hotel, and a casino.
Demographics
As of the 2010 census, the population of Neah Bay was 1,398. The population is predominantly Native American, with the Makah Tribe making up the majority of the population. The median age is 33.7 years, and the median household income is $30,938.
Conclusion
Neah Bay is a small unincorporated community located on the Makah Indian Reservation in the northwest corner of Washington State. It is the traditional home of the Makah people, who have lived in the area for thousands of years. The economy of Neah Bay is largely based on fishing and tourism, and the population is predominantly Native American. Neah Bay is a unique and vibrant community, and it is an important part of the history and culture of the Makah people.
Common Questions
What is Per Capita Income in Neah Bay?
Per Capita income in Neah Bay is $26,795.
What is the Median Family Income in Neah Bay?
Median Family Income in Neah Bay is $64,722.
What is the Median Household income in Neah Bay?
Median Household Income in Neah Bay is $63,750.
What is Income or Wage Gap in Neah Bay?
Income or Wage Gap in Neah Bay is 7.1%.
Women in Neah Bay earn 92.9 cents for every dollar earned by a man.
What is Inequality or Gini Index in Neah Bay?
Inequality or Gini Index in Neah Bay is 0.45.
What is the Total Population of Neah Bay?
Total Population of Neah Bay is 1,081.
What is the Total Male Population of Neah Bay?
Total Male Population of Neah Bay is 499.
What is the Total Female Population of Neah Bay?
Total Female Population of Neah Bay is 582.
What is the Ratio of Males per 100 Females in Neah Bay?
There are 85.74 Males per 100 Females in Neah Bay.
What is the Ratio of Females per 100 Males in Neah Bay?
There are 116.63 Females per 100 Males in Neah Bay.
What is the Median Population Age in Neah Bay?
Median Population Age in Neah Bay is 27.3 Years.
What is the Average Family Size in Neah Bay
Average Family Size in Neah Bay is 3.7 People.
What is the Average Household Size in Neah Bay
Average Household Size in Neah Bay is 3.2 People.
How Large is the Labor Force in Neah Bay?
There are 545 People in the Labor Forcein in Neah Bay.
What is the Percentage of People in the Labor Force in Neah Bay?
66.3% of People are in the Labor Force in Neah Bay.
What is the Unemployment Rate in Neah Bay?
Unemployment Rate in Neah Bay is 8.5%.