Zip Codes with the Highest Percentage of Population Employed in Legal Services & Support in Bremerton, WA
RELATED REPORTS & OPTIONS
Legal Services & Support
Bremerton
Compare Zip Codes
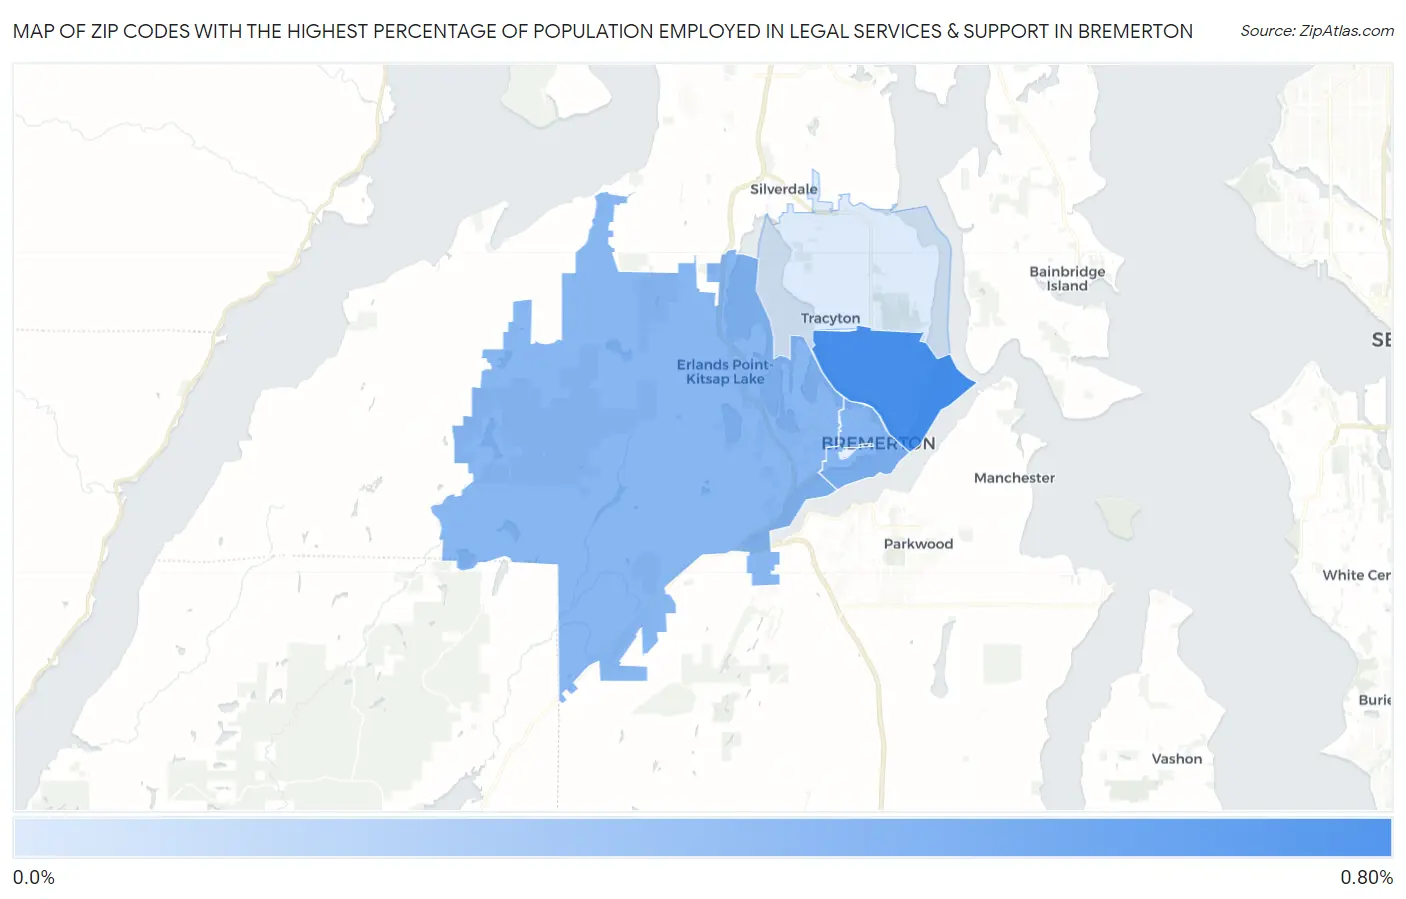
Map of Zip Codes with the Highest Percentage of Population Employed in Legal Services & Support in Bremerton
0.11%
0.66%
Zip Codes with the Highest Percentage of Population Employed in Legal Services & Support in Bremerton, WA
| Zip Code | % Employed | vs State | vs National | |
| 1. | 98310 | 0.66% | 1.1%(-0.418)#252 | 1.2%(-0.527)#10,862 |
| 2. | 98337 | 0.43% | 1.1%(-0.644)#305 | 1.2%(-0.754)#13,487 |
| 3. | 98312 | 0.43% | 1.1%(-0.648)#306 | 1.2%(-0.757)#13,531 |
| 4. | 98311 | 0.11% | 1.1%(-0.960)#356 | 1.2%(-1.07)#17,005 |
1
Common Questions
What are the Top 3 Zip Codes with the Highest Percentage of Population Employed in Legal Services & Support in Bremerton, WA?
Top 3 Zip Codes with the Highest Percentage of Population Employed in Legal Services & Support in Bremerton, WA are:
What zip code has the Highest Percentage of Population Employed in Legal Services & Support in Bremerton, WA?
98310 has the Highest Percentage of Population Employed in Legal Services & Support in Bremerton, WA with 0.66%.
What is the Percentage of Population Employed in Legal Services & Support in Bremerton, WA?
Percentage of Population Employed in Legal Services & Support in Bremerton is 0.36%.
What is the Percentage of Population Employed in Legal Services & Support in Washington?
Percentage of Population Employed in Legal Services & Support in Washington is 1.1%.
What is the Percentage of Population Employed in Legal Services & Support in the United States?
Percentage of Population Employed in Legal Services & Support in the United States is 1.2%.