Cohassett Beach, WA Map & Demographics
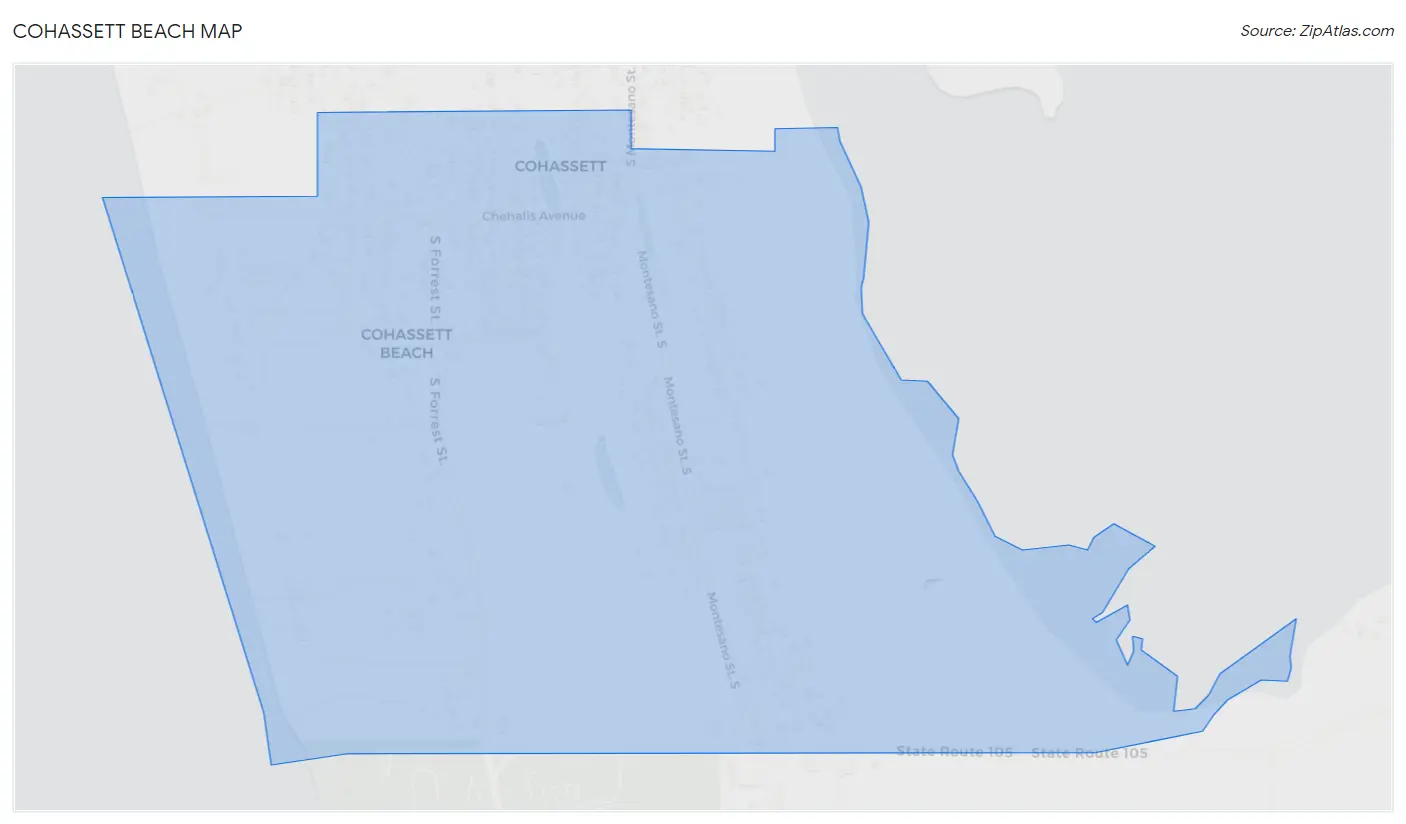
Cohassett Beach Map
Cohassett Beach Overview
$44,942
PER CAPITA INCOME
$100,506
AVG FAMILY INCOME
$81,797
AVG HOUSEHOLD INCOME
0.33
INEQUALITY / GINI INDEX
291
TOTAL POPULATION
166
MALE POPULATION
125
FEMALE POPULATION
132.80
MALES / 100 FEMALES
75.30
FEMALES / 100 MALES
64.2
MEDIAN AGE
2.1
AVG FAMILY SIZE
1.9
AVG HOUSEHOLD SIZE
174
LABOR FORCE [ PEOPLE ]
59.8%
PERCENT IN LABOR FORCE
Income in Cohassett Beach
Income Overview in Cohassett Beach
Per Capita Income in Cohassett Beach is $44,942, while median incomes of families and households are $100,506 and $81,797 respectively.
| Characteristic | Number | Measure |
| Per Capita Income | 291 | $44,942 |
| Median Family Income | 119 | $100,506 |
| Mean Family Income | 119 | $103,778 |
| Median Household Income | 154 | $81,797 |
| Mean Household Income | 154 | $81,840 |
| Income Deficit | 119 | $0 |
| Wage / Income Gap (%) | 291 | 0.00% |
| Wage / Income Gap ($) | 291 | 100.00¢ per $1 |
| Gini / Inequality Index | 291 | 0.33 |
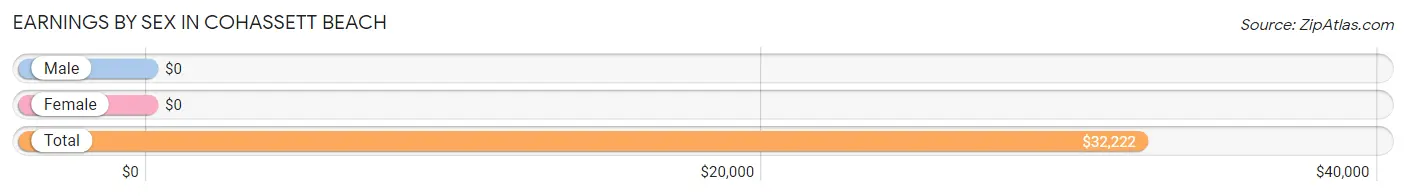
Earnings by Sex in Cohassett Beach
| Sex | Number | Average Earnings |
| Male | 106 (55.2%) | $0 |
| Female | 86 (44.8%) | $0 |
| Total | 192 (100.0%) | $32,222 |
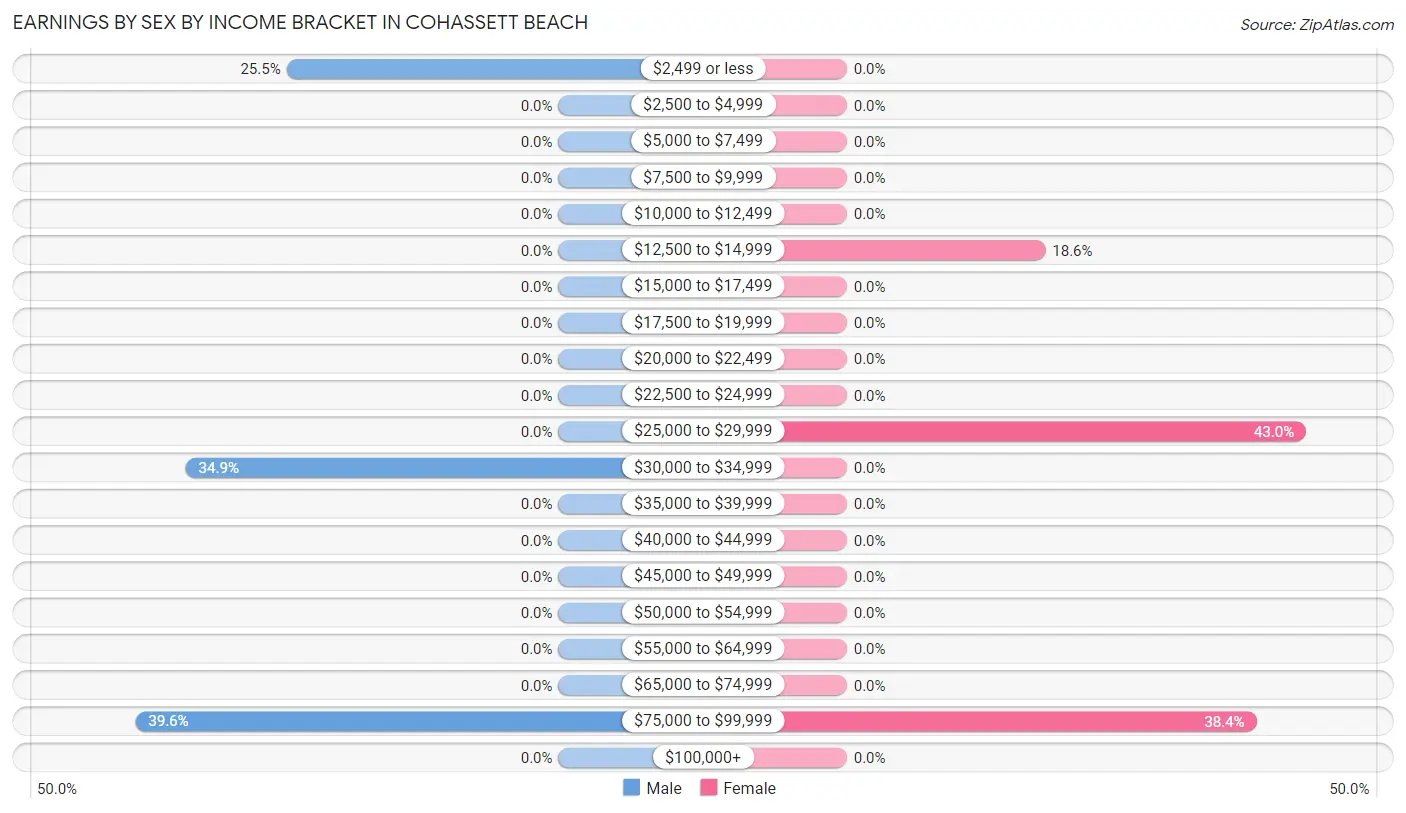
Earnings by Sex by Income Bracket in Cohassett Beach
The most common earnings brackets in Cohassett Beach are $75,000 to $99,999 for men (42 | 39.6%) and $25,000 to $29,999 for women (37 | 43.0%).
| Income | Male | Female |
| $2,499 or less | 27 (25.5%) | 0 (0.0%) |
| $2,500 to $4,999 | 0 (0.0%) | 0 (0.0%) |
| $5,000 to $7,499 | 0 (0.0%) | 0 (0.0%) |
| $7,500 to $9,999 | 0 (0.0%) | 0 (0.0%) |
| $10,000 to $12,499 | 0 (0.0%) | 0 (0.0%) |
| $12,500 to $14,999 | 0 (0.0%) | 16 (18.6%) |
| $15,000 to $17,499 | 0 (0.0%) | 0 (0.0%) |
| $17,500 to $19,999 | 0 (0.0%) | 0 (0.0%) |
| $20,000 to $22,499 | 0 (0.0%) | 0 (0.0%) |
| $22,500 to $24,999 | 0 (0.0%) | 0 (0.0%) |
| $25,000 to $29,999 | 0 (0.0%) | 37 (43.0%) |
| $30,000 to $34,999 | 37 (34.9%) | 0 (0.0%) |
| $35,000 to $39,999 | 0 (0.0%) | 0 (0.0%) |
| $40,000 to $44,999 | 0 (0.0%) | 0 (0.0%) |
| $45,000 to $49,999 | 0 (0.0%) | 0 (0.0%) |
| $50,000 to $54,999 | 0 (0.0%) | 0 (0.0%) |
| $55,000 to $64,999 | 0 (0.0%) | 0 (0.0%) |
| $65,000 to $74,999 | 0 (0.0%) | 0 (0.0%) |
| $75,000 to $99,999 | 42 (39.6%) | 33 (38.4%) |
| $100,000+ | 0 (0.0%) | 0 (0.0%) |
| Total | 106 (100.0%) | 86 (100.0%) |
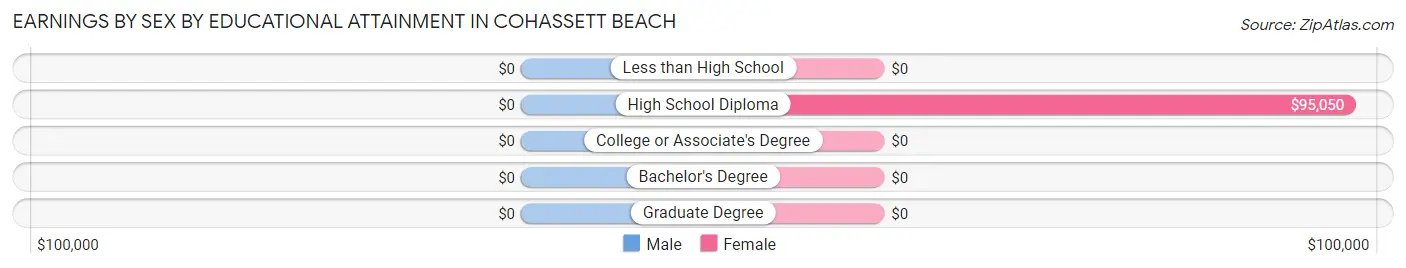
Earnings by Sex by Educational Attainment in Cohassett Beach
| Educational Attainment | Male Income | Female Income |
| Less than High School | - | - |
| High School Diploma | - | - |
| College or Associate's Degree | - | - |
| Bachelor's Degree | - | - |
| Graduate Degree | - | - |
| Total | - | - |
Family Income in Cohassett Beach
Family Income Brackets in Cohassett Beach
According to the Cohassett Beach family income data, there are 42 families falling into the $100,000 to $149,999 income range, which is the most common income bracket and makes up 35.3% of all families.
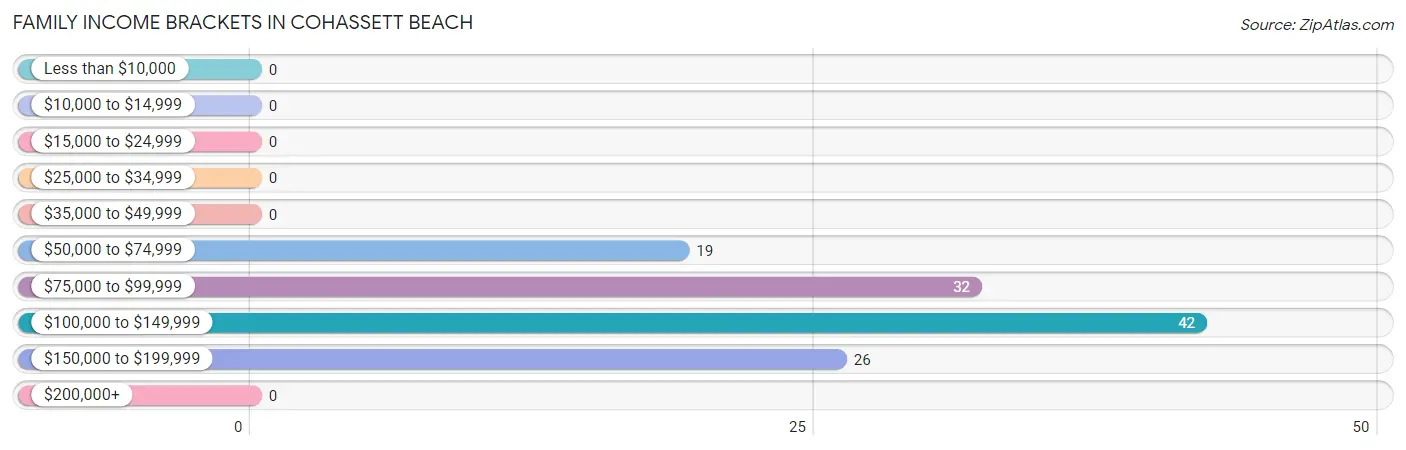
| Income Bracket | # Families | % Families |
| Less than $10,000 | 0 | 0.0% |
| $10,000 to $14,999 | 0 | 0.0% |
| $15,000 to $24,999 | 0 | 0.0% |
| $25,000 to $34,999 | 0 | 0.0% |
| $35,000 to $49,999 | 0 | 0.0% |
| $50,000 to $74,999 | 19 | 16.0% |
| $75,000 to $99,999 | 32 | 26.9% |
| $100,000 to $149,999 | 42 | 35.3% |
| $150,000 to $199,999 | 26 | 21.8% |
| $200,000+ | 0 | 0.0% |
Family Income by Famaliy Size in Cohassett Beach
2-person families (100 | 84.0%) account for the highest median family income in Cohassett Beach with $101,071 per family, while 2-person families (100 | 84.0%) have the highest median income of $50,536 per family member.
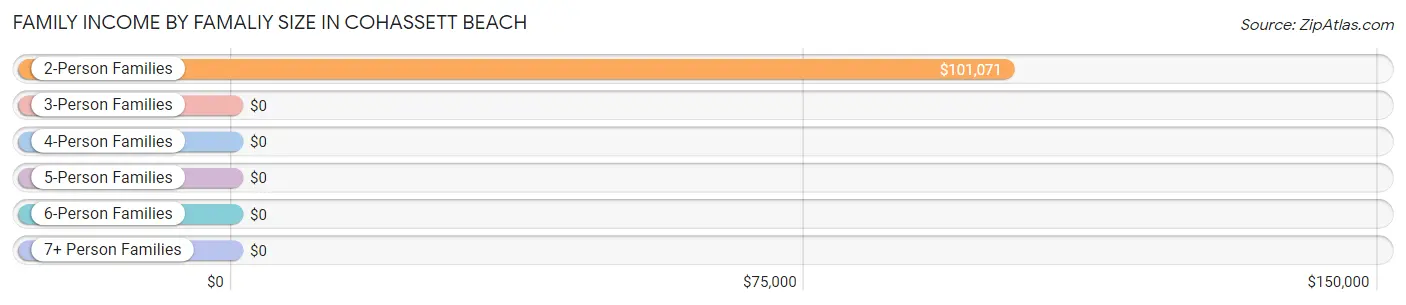
| Income Bracket | # Families | Median Income |
| 2-Person Families | 100 (84.0%) | $101,071 |
| 3-Person Families | 19 (16.0%) | $0 |
| 4-Person Families | 0 (0.0%) | $0 |
| 5-Person Families | 0 (0.0%) | $0 |
| 6-Person Families | 0 (0.0%) | $0 |
| 7+ Person Families | 0 (0.0%) | $0 |
| Total | 119 (100.0%) | $100,506 |
Family Income by Number of Earners in Cohassett Beach
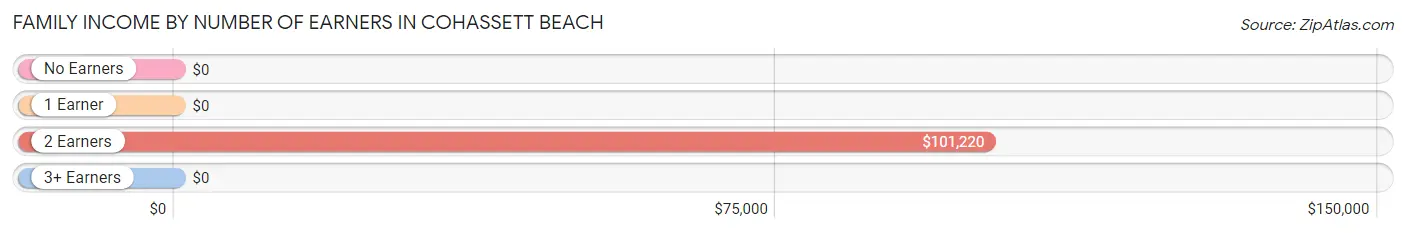
| Number of Earners | # Families | Median Income |
| No Earners | 32 (26.9%) | $0 |
| 1 Earner | 8 (6.7%) | $0 |
| 2 Earners | 79 (66.4%) | $101,220 |
| 3+ Earners | 0 (0.0%) | $0 |
| Total | 119 (100.0%) | $100,506 |
Household Income in Cohassett Beach
Household Income Brackets in Cohassett Beach
With 42 households falling in the category, the $100,000 to $149,999 income range is the most frequent in Cohassett Beach, accounting for 27.3% of all households.
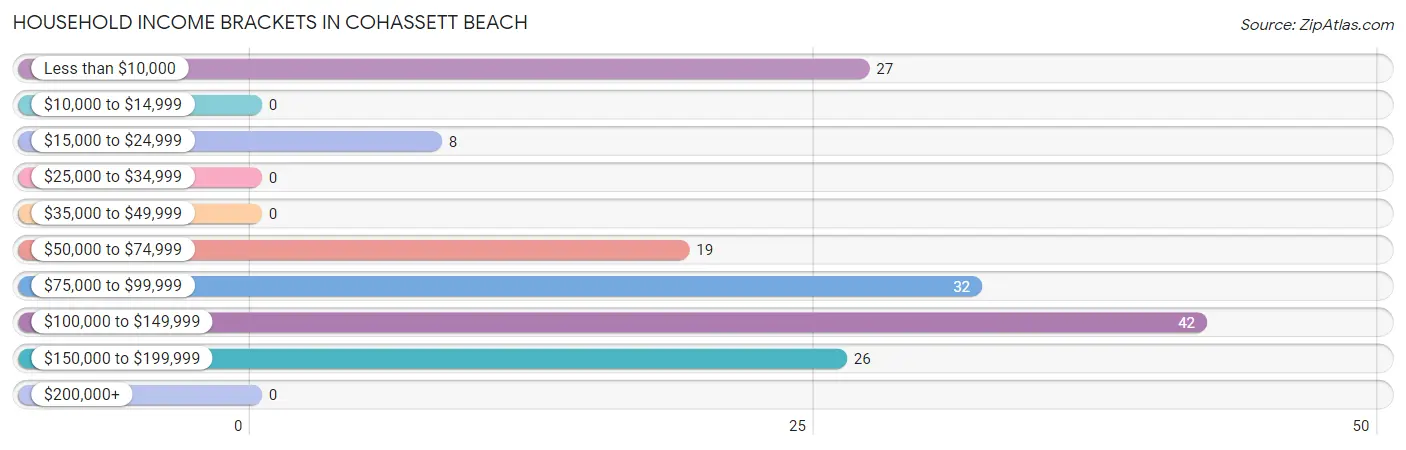
| Income Bracket | # Households | % Households |
| Less than $10,000 | 27 | 17.5% |
| $10,000 to $14,999 | 0 | 0.0% |
| $15,000 to $24,999 | 8 | 5.2% |
| $25,000 to $34,999 | 0 | 0.0% |
| $35,000 to $49,999 | 0 | 0.0% |
| $50,000 to $74,999 | 19 | 12.3% |
| $75,000 to $99,999 | 32 | 20.8% |
| $100,000 to $149,999 | 42 | 27.3% |
| $150,000 to $199,999 | 26 | 16.9% |
| $200,000+ | 0 | 0.0% |
Household Income by Householder Age in Cohassett Beach
The median household income in Cohassett Beach is $81,797, with the highest median household income of $101,458 found in the 45 to 64 years age bracket for the primary householder. A total of 87 households (56.5%) fall into this category.
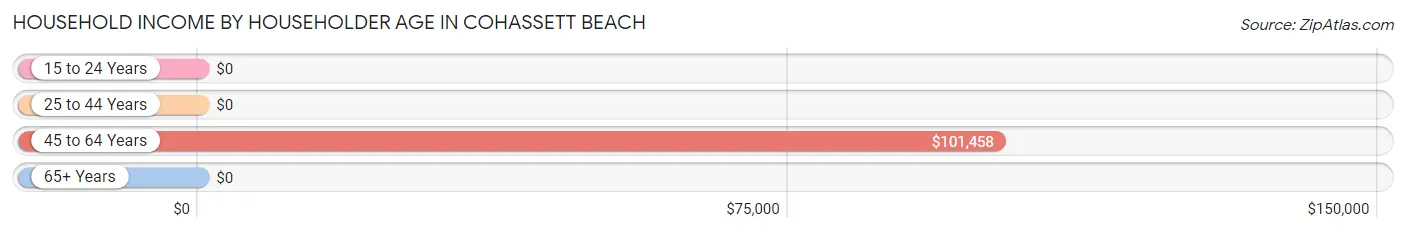
| Income Bracket | # Households | Median Income |
| 15 to 24 Years | 0 (0.0%) | $0 |
| 25 to 44 Years | 27 (17.5%) | $0 |
| 45 to 64 Years | 87 (56.5%) | $101,458 |
| 65+ Years | 40 (26.0%) | $0 |
| Total | 154 (100.0%) | $81,797 |
Poverty in Cohassett Beach
Income Below Poverty by Sex and Age in Cohassett Beach
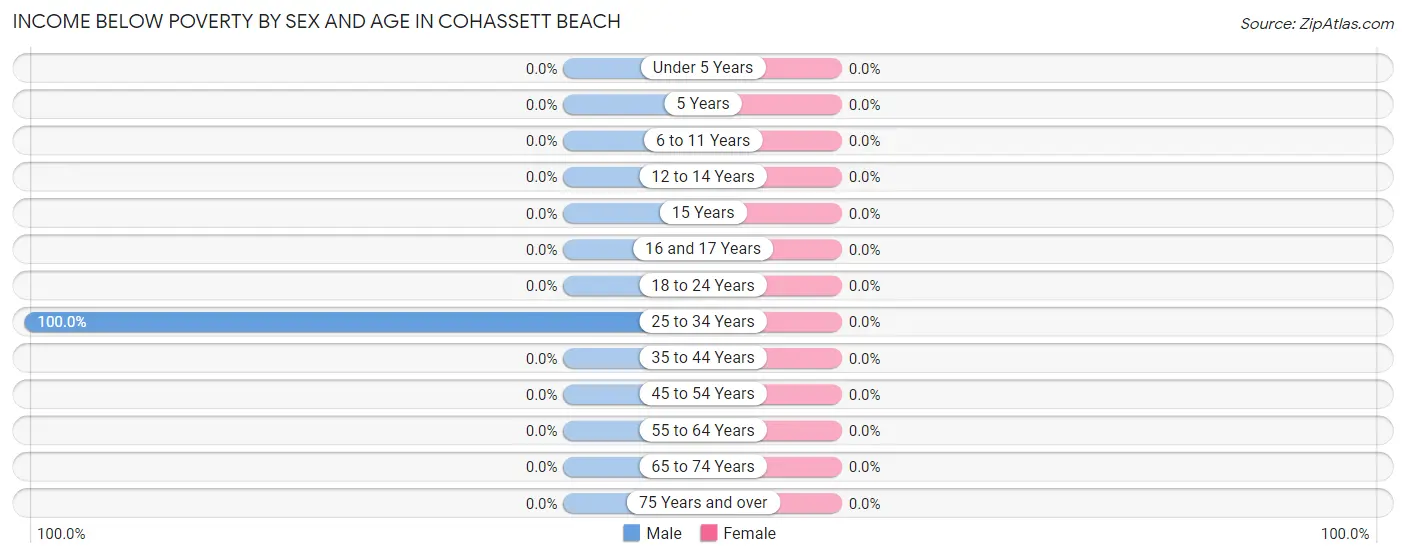
| Age Bracket | Male | Female |
| Under 5 Years | 0 (0.0%) | 0 (0.0%) |
| 5 Years | 0 (0.0%) | 0 (0.0%) |
| 6 to 11 Years | 0 (0.0%) | 0 (0.0%) |
| 12 to 14 Years | 0 (0.0%) | 0 (0.0%) |
| 15 Years | 0 (0.0%) | 0 (0.0%) |
| 16 and 17 Years | 0 (0.0%) | 0 (0.0%) |
| 18 to 24 Years | 0 (0.0%) | 0 (0.0%) |
| 25 to 34 Years | 27 (100.0%) | 0 (0.0%) |
| 35 to 44 Years | 0 (0.0%) | 0 (0.0%) |
| 45 to 54 Years | 0 (0.0%) | 0 (0.0%) |
| 55 to 64 Years | 0 (0.0%) | 0 (0.0%) |
| 65 to 74 Years | 0 (0.0%) | 0 (0.0%) |
| 75 Years and over | 0 (0.0%) | 0 (0.0%) |
| Total | 27 (16.3%) | 0 (0.0%) |
Income Above Poverty by Sex and Age in Cohassett Beach
According to the poverty statistics in Cohassett Beach, males aged 45 to 54 years and females aged 45 to 54 years are the age groups that are most secure financially, with 100.0% of males and 100.0% of females in these age groups living above the poverty line.
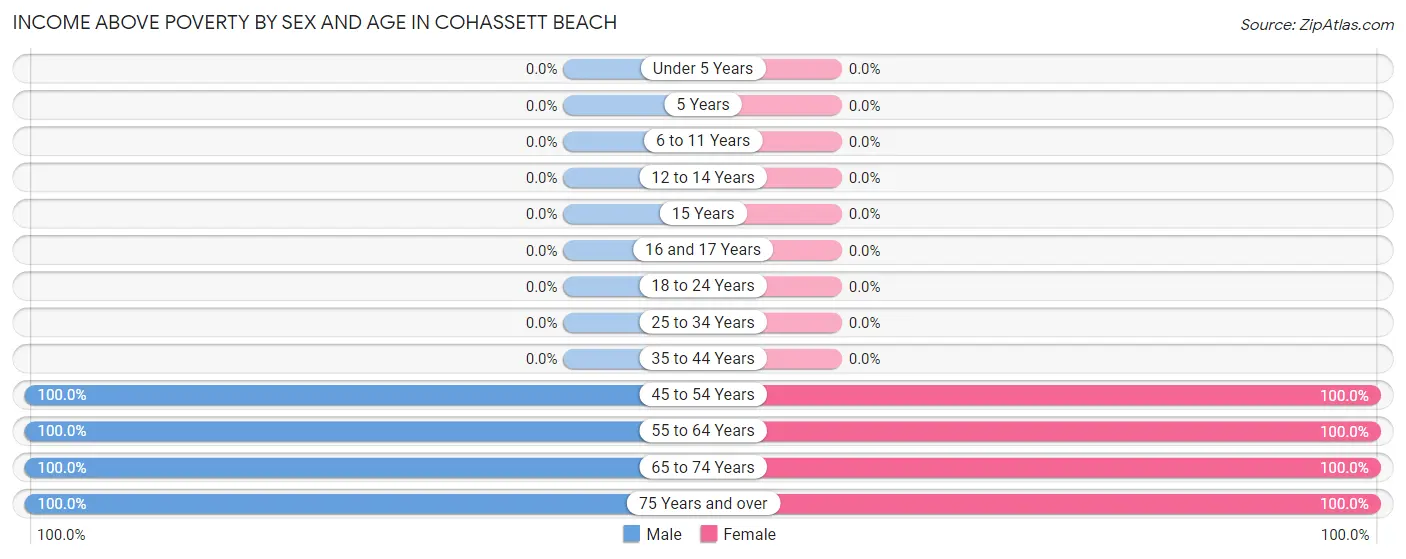
| Age Bracket | Male | Female |
| Under 5 Years | 0 (0.0%) | 0 (0.0%) |
| 5 Years | 0 (0.0%) | 0 (0.0%) |
| 6 to 11 Years | 0 (0.0%) | 0 (0.0%) |
| 12 to 14 Years | 0 (0.0%) | 0 (0.0%) |
| 15 Years | 0 (0.0%) | 0 (0.0%) |
| 16 and 17 Years | 0 (0.0%) | 0 (0.0%) |
| 18 to 24 Years | 0 (0.0%) | 0 (0.0%) |
| 25 to 34 Years | 0 (0.0%) | 0 (0.0%) |
| 35 to 44 Years | 0 (0.0%) | 0 (0.0%) |
| 45 to 54 Years | 19 (100.0%) | 16 (100.0%) |
| 55 to 64 Years | 80 (100.0%) | 70 (100.0%) |
| 65 to 74 Years | 8 (100.0%) | 31 (100.0%) |
| 75 Years and over | 32 (100.0%) | 8 (100.0%) |
| Total | 139 (83.7%) | 125 (100.0%) |
Income Below Poverty Among Married-Couple Families in Cohassett Beach
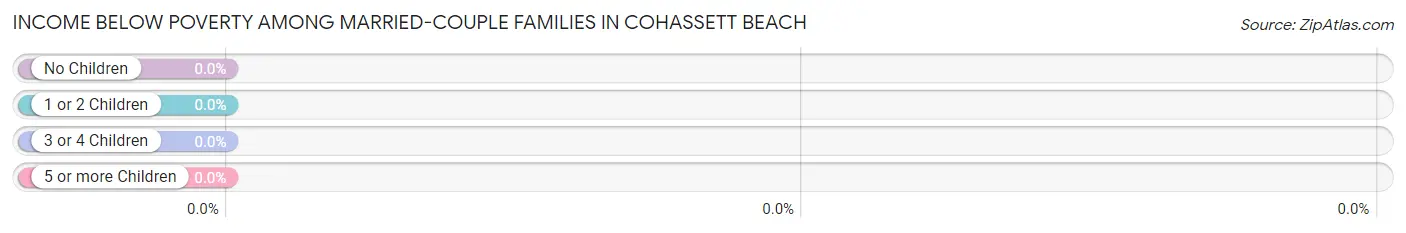
| Children | Above Poverty | Below Poverty |
| No Children | 119 (100.0%) | 0 (0.0%) |
| 1 or 2 Children | 0 (0.0%) | 0 (0.0%) |
| 3 or 4 Children | 0 (0.0%) | 0 (0.0%) |
| 5 or more Children | 0 (0.0%) | 0 (0.0%) |
| Total | 119 (100.0%) | 0 (0.0%) |
Income Below Poverty Among Single-Parent Households in Cohassett Beach
| Children | Single Father | Single Mother |
| No Children | 0 (0.0%) | 0 (0.0%) |
| 1 or 2 Children | 0 (0.0%) | 0 (0.0%) |
| 3 or 4 Children | 0 (0.0%) | 0 (0.0%) |
| 5 or more Children | 0 (0.0%) | 0 (0.0%) |
| Total | 0 (0.0%) | 0 (0.0%) |
Income Below Poverty Among Married-Couple vs Single-Parent Households in Cohassett Beach
| Children | Married-Couple Families | Single-Parent Households |
| No Children | 0 (0.0%) | 0 (0.0%) |
| 1 or 2 Children | 0 (0.0%) | 0 (0.0%) |
| 3 or 4 Children | 0 (0.0%) | 0 (0.0%) |
| 5 or more Children | 0 (0.0%) | 0 (0.0%) |
| Total | 0 (0.0%) | 0 (0.0%) |
Race in Cohassett Beach
The most populous races in Cohassett Beach are White / Caucasian (266 | 91.4%), and Two or more Races (25 | 8.6%).
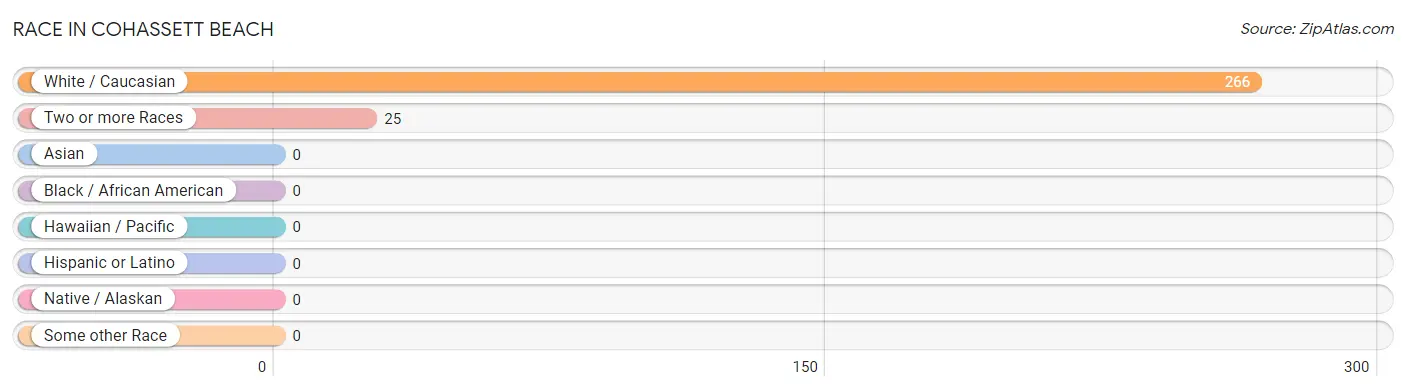
| Race | # Population | % Population |
| Asian | 0 | 0.0% |
| Black / African American | 0 | 0.0% |
| Hawaiian / Pacific | 0 | 0.0% |
| Hispanic or Latino | 0 | 0.0% |
| Native / Alaskan | 0 | 0.0% |
| White / Caucasian | 266 | 91.4% |
| Two or more Races | 25 | 8.6% |
| Some other Race | 0 | 0.0% |
| Total | 291 | 100.0% |
Ancestry in Cohassett Beach
The most populous ancestries reported in Cohassett Beach are Norwegian (142 | 48.8%), German (100 | 34.4%), Irish (37 | 12.7%), Hungarian (27 | 9.3%), and Cherokee (25 | 8.6%), together accounting for 113.7% of all Cohassett Beach residents.
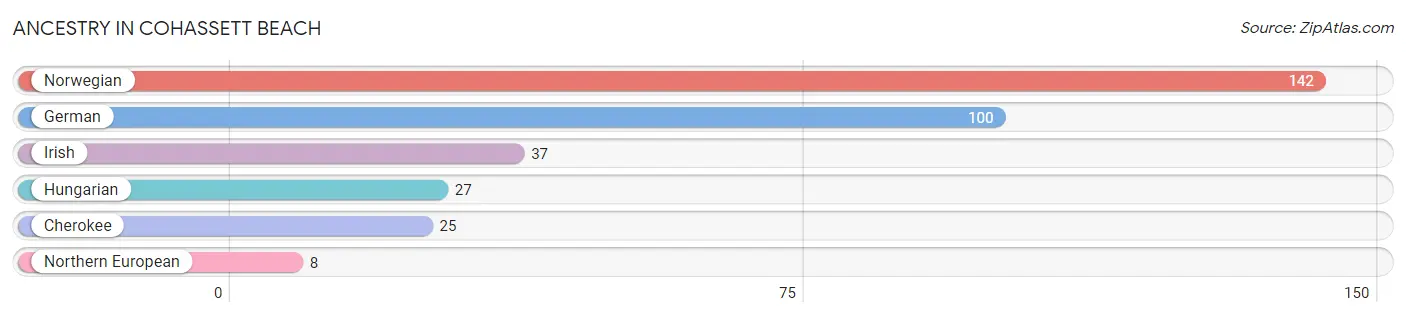
| Ancestry | # Population | % Population |
| Cherokee | 25 | 8.6% |
| German | 100 | 34.4% |
| Hungarian | 27 | 9.3% |
| Irish | 37 | 12.7% |
| Northern European | 8 | 2.8% |
| Norwegian | 142 | 48.8% | View All 6 Rows |
Immigrants in Cohassett Beach

| Immigration Origin | # Population | % Population | View All 0 Rows |
Sex and Age in Cohassett Beach
Sex and Age in Cohassett Beach
The most populous age groups in Cohassett Beach are 60 to 64 Years (60 | 36.1%) for men and 60 to 64 Years (70 | 56.0%) for women.
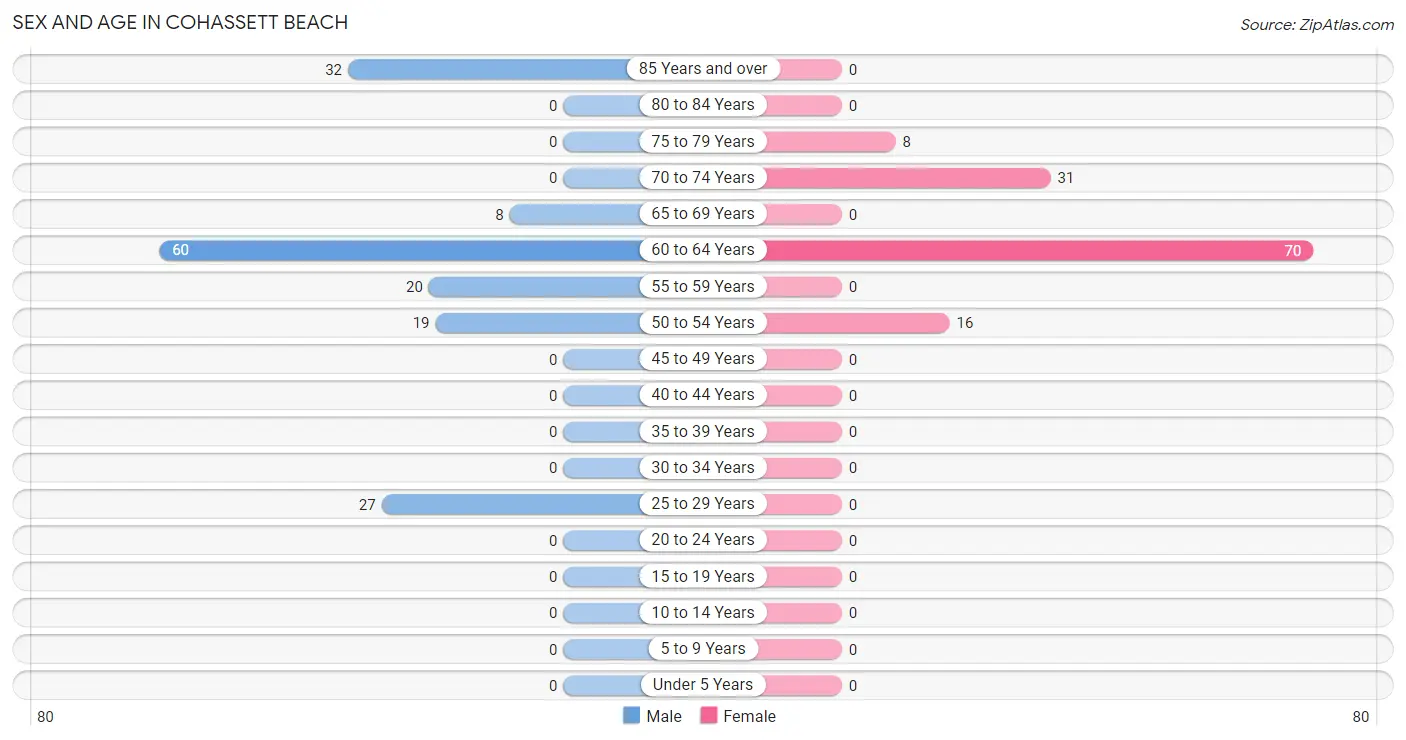
| Age Bracket | Male | Female |
| Under 5 Years | 0 (0.0%) | 0 (0.0%) |
| 5 to 9 Years | 0 (0.0%) | 0 (0.0%) |
| 10 to 14 Years | 0 (0.0%) | 0 (0.0%) |
| 15 to 19 Years | 0 (0.0%) | 0 (0.0%) |
| 20 to 24 Years | 0 (0.0%) | 0 (0.0%) |
| 25 to 29 Years | 27 (16.3%) | 0 (0.0%) |
| 30 to 34 Years | 0 (0.0%) | 0 (0.0%) |
| 35 to 39 Years | 0 (0.0%) | 0 (0.0%) |
| 40 to 44 Years | 0 (0.0%) | 0 (0.0%) |
| 45 to 49 Years | 0 (0.0%) | 0 (0.0%) |
| 50 to 54 Years | 19 (11.5%) | 16 (12.8%) |
| 55 to 59 Years | 20 (12.0%) | 0 (0.0%) |
| 60 to 64 Years | 60 (36.1%) | 70 (56.0%) |
| 65 to 69 Years | 8 (4.8%) | 0 (0.0%) |
| 70 to 74 Years | 0 (0.0%) | 31 (24.8%) |
| 75 to 79 Years | 0 (0.0%) | 8 (6.4%) |
| 80 to 84 Years | 0 (0.0%) | 0 (0.0%) |
| 85 Years and over | 32 (19.3%) | 0 (0.0%) |
| Total | 166 (100.0%) | 125 (100.0%) |
Families and Households in Cohassett Beach
Median Family Size in Cohassett Beach
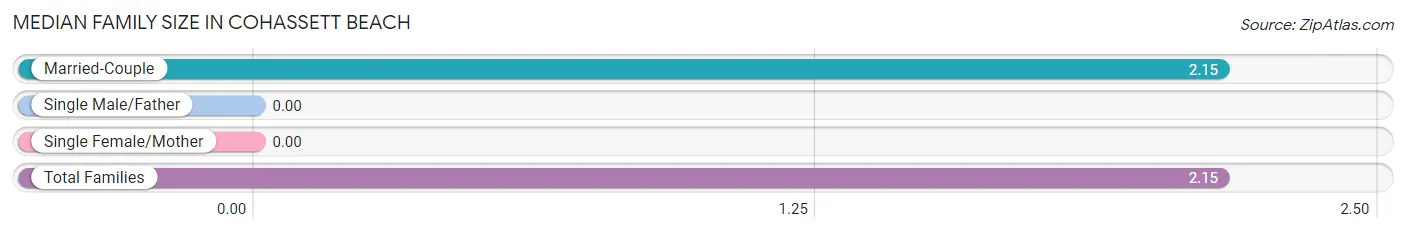
| Family Type | # Families | Family Size |
| Married-Couple | 119 (100.0%) | 2.15 |
| Single Male/Father | 0 (0.0%) | - |
| Single Female/Mother | 0 (0.0%) | - |
| Total Families | 119 (100.0%) | 2.15 |
Median Household Size in Cohassett Beach
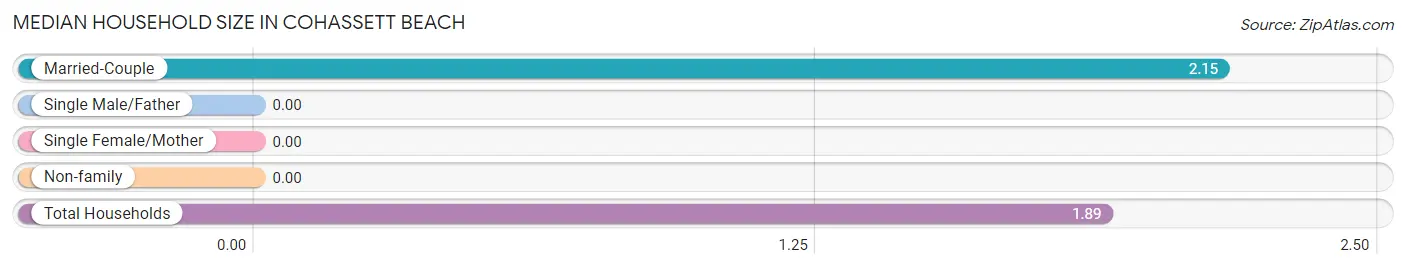
| Household Type | # Households | Household Size |
| Married-Couple | 119 (77.3%) | 2.15 |
| Single Male/Father | 0 (0.0%) | - |
| Single Female/Mother | 0 (0.0%) | - |
| Non-family | 35 (22.7%) | - |
| Total Households | 154 (100.0%) | 1.89 |
Household Size by Marriage Status in Cohassett Beach
Out of a total of 154 households in Cohassett Beach, 119 (77.3%) are family households, while 35 (22.7%) are nonfamily households. The most numerous type of family households are 2-person households, comprising 100, and the most common type of nonfamily households are 1-person households, comprising 35.
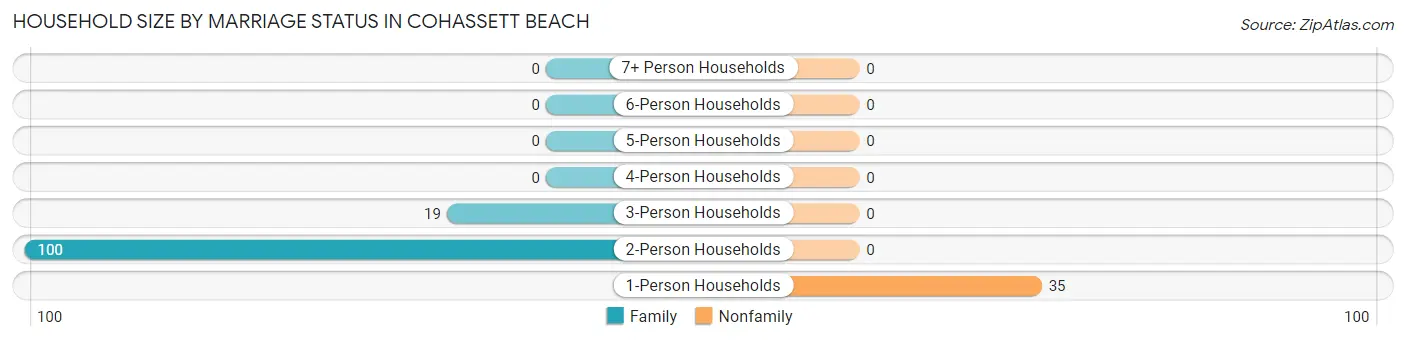
| Household Size | Family Households | Nonfamily Households |
| 1-Person Households | - | 35 (22.7%) |
| 2-Person Households | 100 (64.9%) | 0 (0.0%) |
| 3-Person Households | 19 (12.3%) | 0 (0.0%) |
| 4-Person Households | 0 (0.0%) | 0 (0.0%) |
| 5-Person Households | 0 (0.0%) | 0 (0.0%) |
| 6-Person Households | 0 (0.0%) | 0 (0.0%) |
| 7+ Person Households | 0 (0.0%) | 0 (0.0%) |
| Total | 119 (77.3%) | 35 (22.7%) |
Female Fertility in Cohassett Beach
Fertility by Age in Cohassett Beach
| Age Bracket | Women with Births | Births / 1,000 Women |
| 15 to 19 years | 0 (0.0%) | 0.0 |
| 20 to 34 years | 0 (0.0%) | 0.0 |
| 35 to 50 years | 0 (0.0%) | 0.0 |
| Total | 0 (0.0%) | 0.0 |
Fertility by Age by Marriage Status in Cohassett Beach

| Age Bracket | Married | Unmarried |
| 15 to 19 years | 0 (0.0%) | 0 (0.0%) |
| 20 to 34 years | 0 (0.0%) | 0 (0.0%) |
| 35 to 50 years | 0 (0.0%) | 0 (0.0%) |
| Total | 0 (0.0%) | 0 (0.0%) |
Fertility by Education in Cohassett Beach
| Educational Attainment | Women with Births | Births / 1,000 Women |
| Less than High School | 0 (0.0%) | 0.0 |
| High School Diploma | 0 (0.0%) | 0.0 |
| College or Associate's Degree | 0 (0.0%) | 0.0 |
| Bachelor's Degree | 0 (0.0%) | 0.0 |
| Graduate Degree | 0 (0.0%) | 0.0 |
| Total | 0 (0.0%) | 0.0 |
Fertility by Education by Marriage Status in Cohassett Beach
| Educational Attainment | Married | Unmarried |
| Less than High School | 0 (0.0%) | 0 (0.0%) |
| High School Diploma | 0 (0.0%) | 0 (0.0%) |
| College or Associate's Degree | 0 (0.0%) | 0 (0.0%) |
| Bachelor's Degree | 0 (0.0%) | 0 (0.0%) |
| Graduate Degree | 0 (0.0%) | 0 (0.0%) |
| Total | 0 (0.0%) | 0 (0.0%) |
Employment Characteristics in Cohassett Beach
Employment by Class of Employer in Cohassett Beach
Among the 174 employed individuals in Cohassett Beach, not-for-profit organizations (106 | 60.9%), private company employees (60 | 34.5%), and local government employees (8 | 4.6%) make up the most common classes of employment.
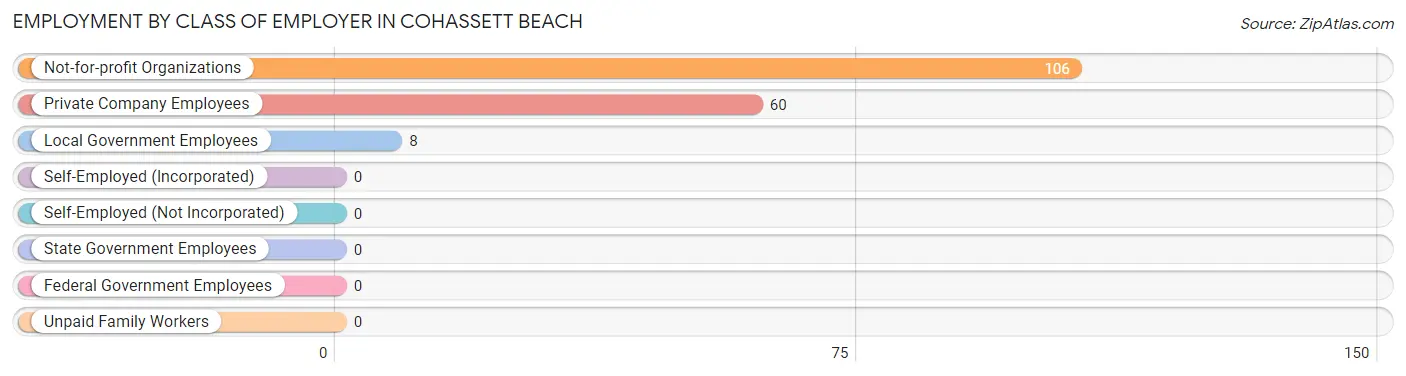
| Employer Class | # Employees | % Employees |
| Private Company Employees | 60 | 34.5% |
| Self-Employed (Incorporated) | 0 | 0.0% |
| Self-Employed (Not Incorporated) | 0 | 0.0% |
| Not-for-profit Organizations | 106 | 60.9% |
| Local Government Employees | 8 | 4.6% |
| State Government Employees | 0 | 0.0% |
| Federal Government Employees | 0 | 0.0% |
| Unpaid Family Workers | 0 | 0.0% |
| Total | 174 | 100.0% |
Employment Status by Age in Cohassett Beach
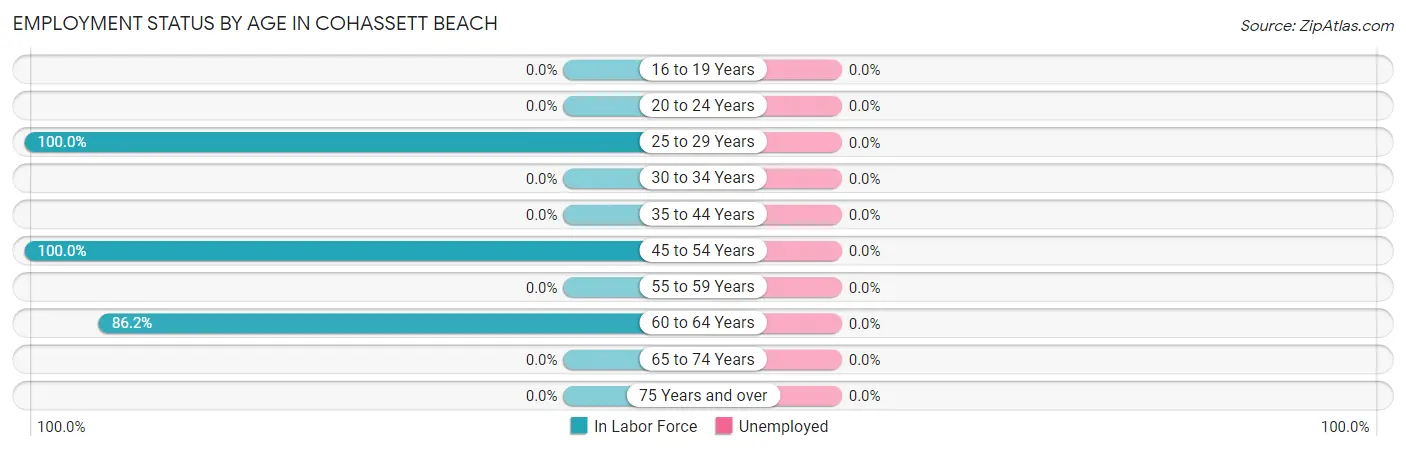
| Age Bracket | In Labor Force | Unemployed |
| 16 to 19 Years | 0 (0.0%) | 0 (0.0%) |
| 20 to 24 Years | 0 (0.0%) | 0 (0.0%) |
| 25 to 29 Years | 27 (100.0%) | 0 (0.0%) |
| 30 to 34 Years | 0 (0.0%) | 0 (0.0%) |
| 35 to 44 Years | 0 (0.0%) | 0 (0.0%) |
| 45 to 54 Years | 35 (100.0%) | 0 (0.0%) |
| 55 to 59 Years | 0 (0.0%) | 0 (0.0%) |
| 60 to 64 Years | 112 (86.2%) | 0 (0.0%) |
| 65 to 74 Years | 0 (0.0%) | 0 (0.0%) |
| 75 Years and over | 0 (0.0%) | 0 (0.0%) |
| Total | 174 (59.8%) | 0 (0.0%) |
Employment Status by Educational Attainment in Cohassett Beach
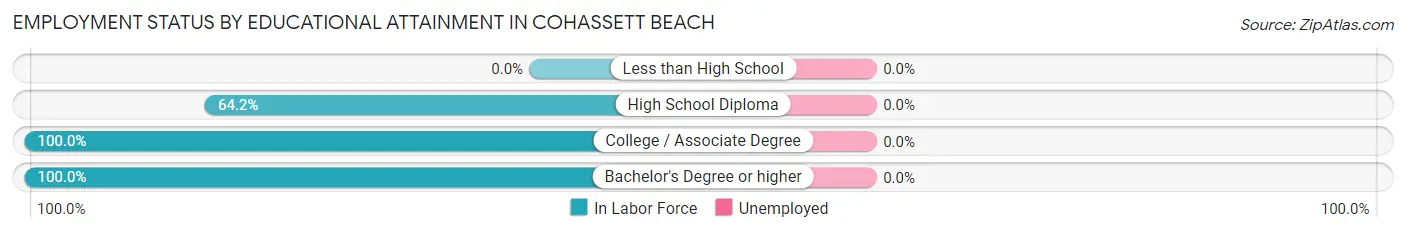
| Educational Attainment | In Labor Force | Unemployed |
| Less than High School | 0 (0.0%) | 0 (0.0%) |
| High School Diploma | 68 (64.2%) | 0 (0.0%) |
| College / Associate Degree | 37 (100.0%) | 0 (0.0%) |
| Bachelor's Degree or higher | 69 (100.0%) | 0 (0.0%) |
| Total | 174 (82.1%) | 0 (0.0%) |
Employment Occupations by Sex in Cohassett Beach
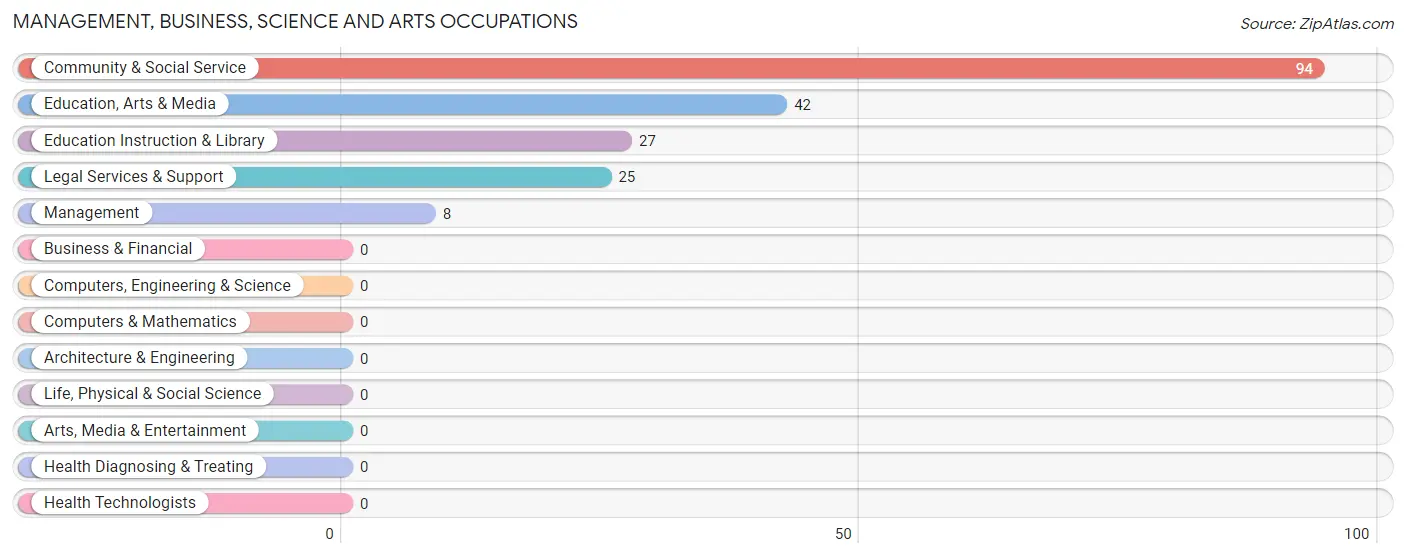
Management, Business, Science and Arts Occupations
The most common Management, Business, Science and Arts occupations in Cohassett Beach are Community & Social Service (94 | 54.0%), Education, Arts & Media (42 | 24.1%), Education Instruction & Library (27 | 15.5%), Legal Services & Support (25 | 14.4%), and Management (8 | 4.6%).
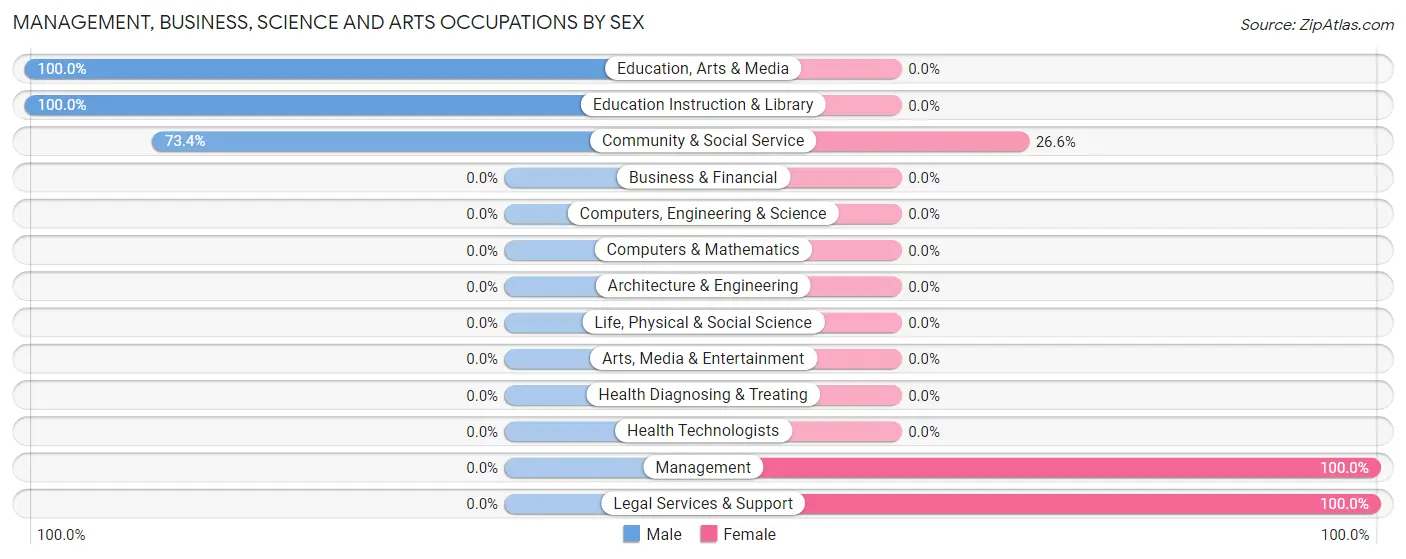
Management, Business, Science and Arts Occupations by Sex
Within the Management, Business, Science and Arts occupations in Cohassett Beach, the most male-oriented occupations are Education, Arts & Media (100.0%), Education Instruction & Library (100.0%), and Community & Social Service (73.4%), while the most female-oriented occupations are Management (100.0%), Legal Services & Support (100.0%), and Community & Social Service (26.6%).
| Occupation | Male | Female |
| Management | 0 (0.0%) | 8 (100.0%) |
| Business & Financial | 0 (0.0%) | 0 (0.0%) |
| Computers, Engineering & Science | 0 (0.0%) | 0 (0.0%) |
| Computers & Mathematics | 0 (0.0%) | 0 (0.0%) |
| Architecture & Engineering | 0 (0.0%) | 0 (0.0%) |
| Life, Physical & Social Science | 0 (0.0%) | 0 (0.0%) |
| Community & Social Service | 69 (73.4%) | 25 (26.6%) |
| Education, Arts & Media | 42 (100.0%) | 0 (0.0%) |
| Legal Services & Support | 0 (0.0%) | 25 (100.0%) |
| Education Instruction & Library | 27 (100.0%) | 0 (0.0%) |
| Arts, Media & Entertainment | 0 (0.0%) | 0 (0.0%) |
| Health Diagnosing & Treating | 0 (0.0%) | 0 (0.0%) |
| Health Technologists | 0 (0.0%) | 0 (0.0%) |
| Total (Category) | 69 (67.6%) | 33 (32.4%) |
| Total (Overall) | 88 (50.6%) | 86 (49.4%) |
Services Occupations
The most common Services occupations in Cohassett Beach are , and Personal Care & Service (37 | 21.3%).
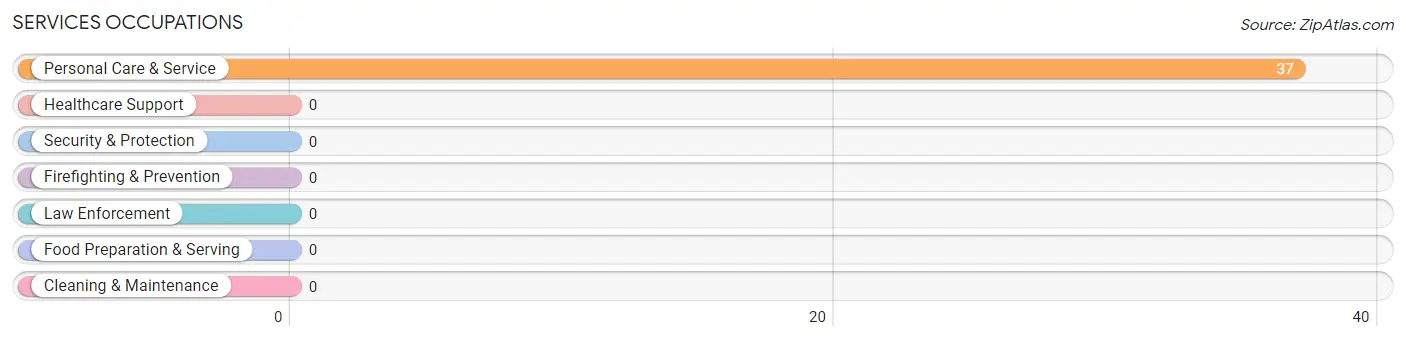
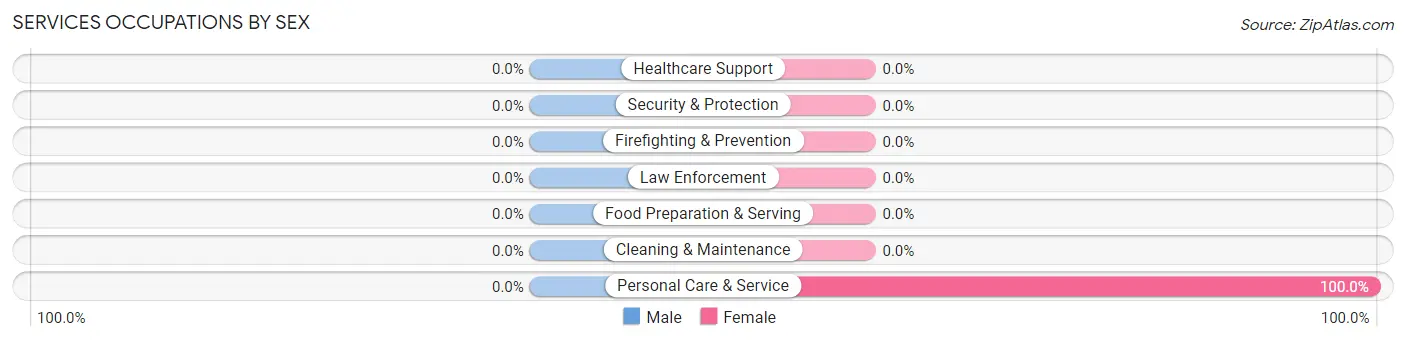
Services Occupations by Sex
| Occupation | Male | Female |
| Healthcare Support | 0 (0.0%) | 0 (0.0%) |
| Security & Protection | 0 (0.0%) | 0 (0.0%) |
| Firefighting & Prevention | 0 (0.0%) | 0 (0.0%) |
| Law Enforcement | 0 (0.0%) | 0 (0.0%) |
| Food Preparation & Serving | 0 (0.0%) | 0 (0.0%) |
| Cleaning & Maintenance | 0 (0.0%) | 0 (0.0%) |
| Personal Care & Service | 0 (0.0%) | 37 (100.0%) |
| Total (Category) | 0 (0.0%) | 37 (100.0%) |
| Total (Overall) | 88 (50.6%) | 86 (49.4%) |
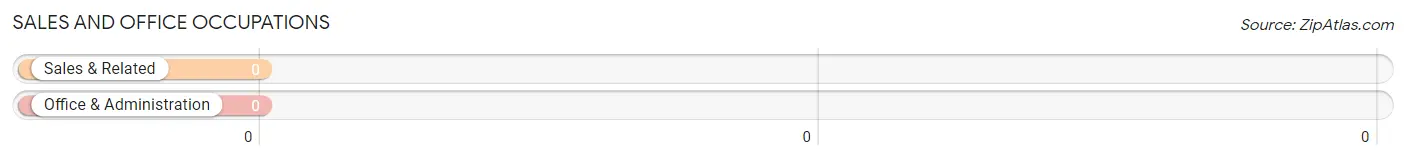
Sales and Office Occupations
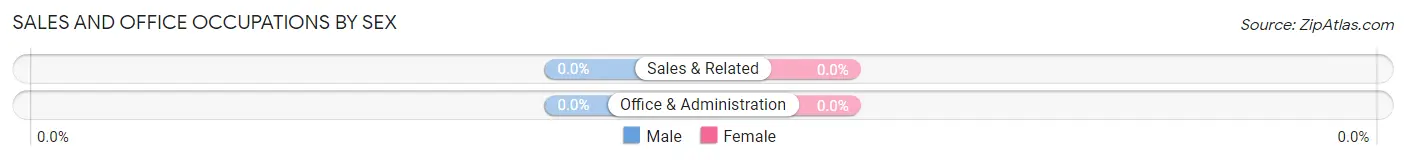
Sales and Office Occupations by Sex
| Occupation | Male | Female |
| Sales & Related | 0 (0.0%) | 0 (0.0%) |
| Office & Administration | 0 (0.0%) | 0 (0.0%) |
| Total (Category) | 0 (0.0%) | 0 (0.0%) |
| Total (Overall) | 88 (50.6%) | 86 (49.4%) |
Natural Resources, Construction and Maintenance Occupations
The most common Natural Resources, Construction and Maintenance occupations in Cohassett Beach are , and Construction & Extraction (19 | 10.9%).
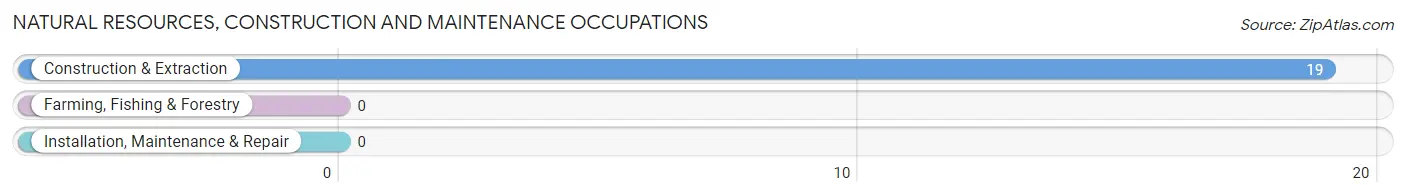
Natural Resources, Construction and Maintenance Occupations by Sex
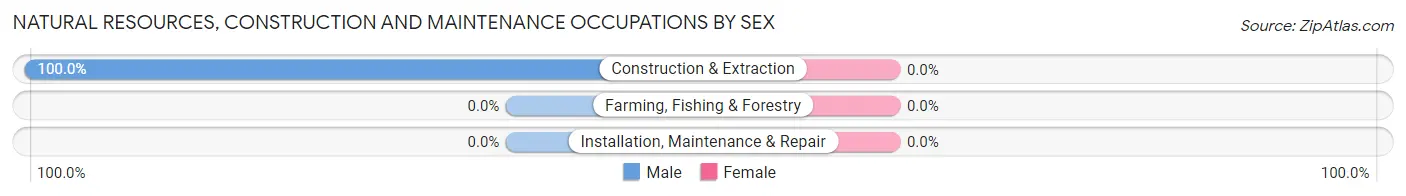
| Occupation | Male | Female |
| Farming, Fishing & Forestry | 0 (0.0%) | 0 (0.0%) |
| Construction & Extraction | 19 (100.0%) | 0 (0.0%) |
| Installation, Maintenance & Repair | 0 (0.0%) | 0 (0.0%) |
| Total (Category) | 19 (100.0%) | 0 (0.0%) |
| Total (Overall) | 88 (50.6%) | 86 (49.4%) |
Production, Transportation and Moving Occupations
The most common Production, Transportation and Moving occupations in Cohassett Beach are , and Transportation (16 | 9.2%).
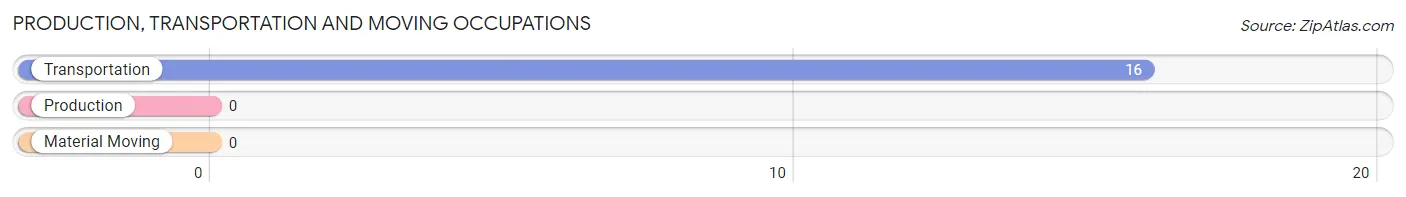
Production, Transportation and Moving Occupations by Sex
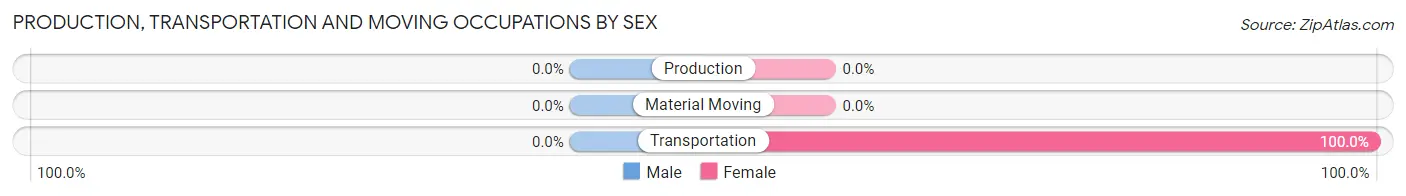
| Occupation | Male | Female |
| Production | 0 (0.0%) | 0 (0.0%) |
| Transportation | 0 (0.0%) | 16 (100.0%) |
| Material Moving | 0 (0.0%) | 0 (0.0%) |
| Total (Category) | 0 (0.0%) | 16 (100.0%) |
| Total (Overall) | 88 (50.6%) | 86 (49.4%) |
Employment Industries by Sex in Cohassett Beach
Employment Industries in Cohassett Beach
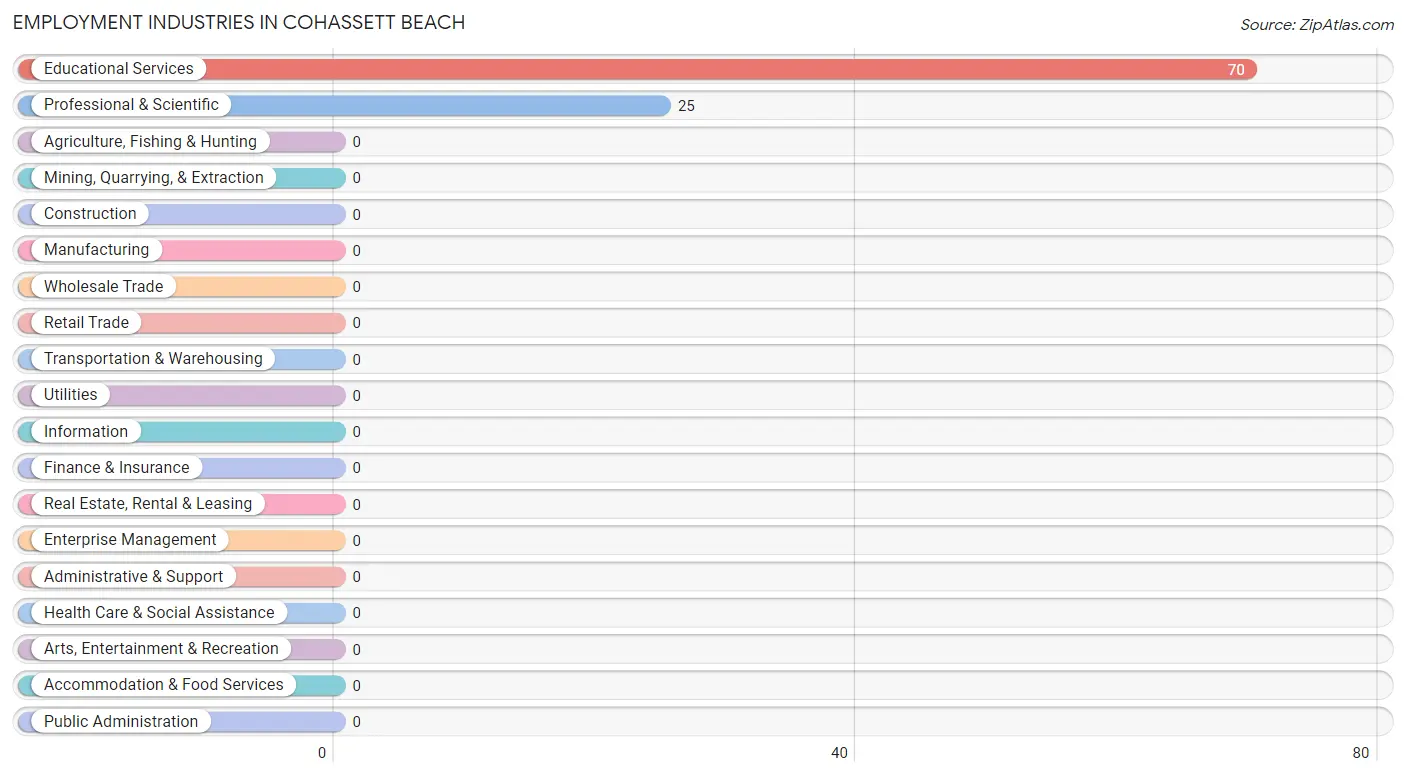
The major employment industries in Cohassett Beach include Educational Services (70 | 40.2%), and Professional & Scientific (25 | 14.4%).
Employment Industries by Sex in Cohassett Beach
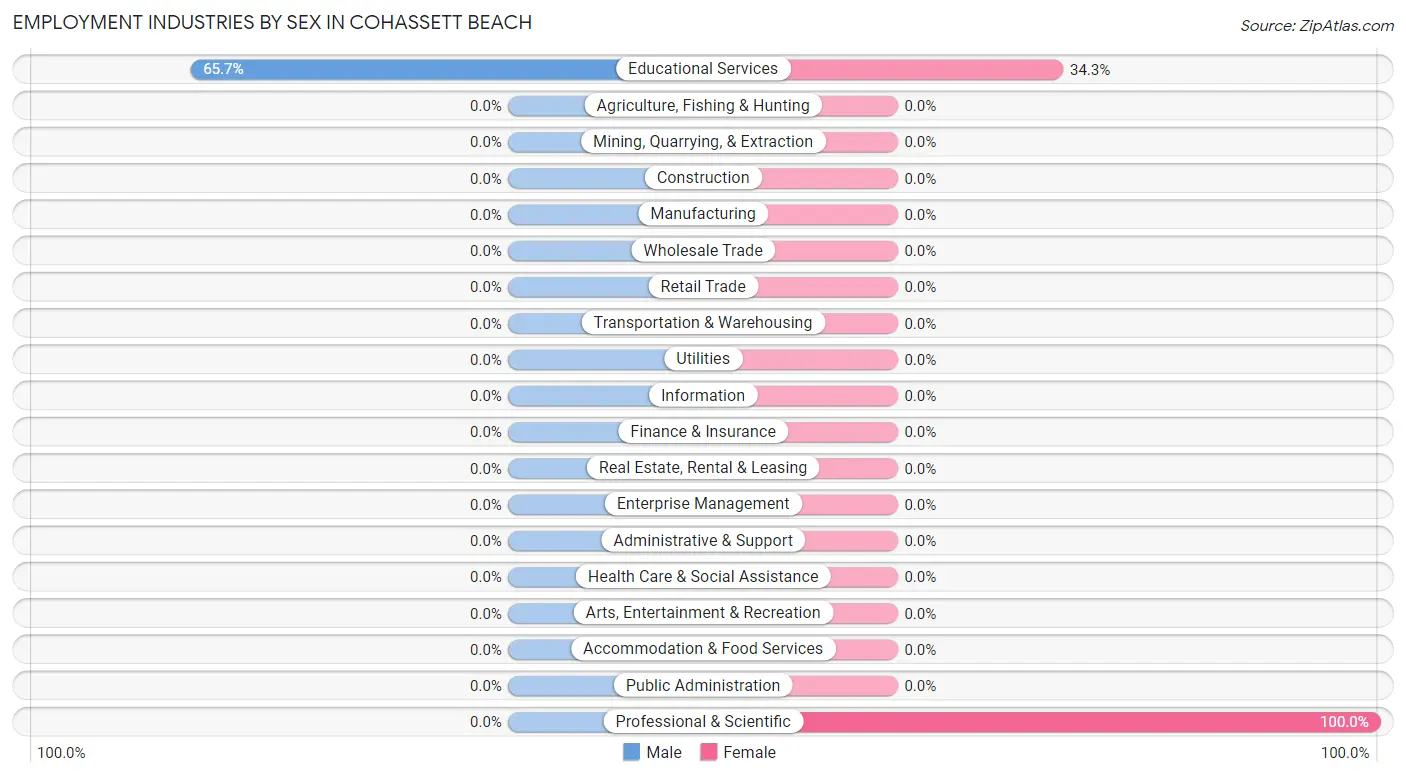
| Industry | Male | Female |
| Agriculture, Fishing & Hunting | 0 (0.0%) | 0 (0.0%) |
| Mining, Quarrying, & Extraction | 0 (0.0%) | 0 (0.0%) |
| Construction | 0 (0.0%) | 0 (0.0%) |
| Manufacturing | 0 (0.0%) | 0 (0.0%) |
| Wholesale Trade | 0 (0.0%) | 0 (0.0%) |
| Retail Trade | 0 (0.0%) | 0 (0.0%) |
| Transportation & Warehousing | 0 (0.0%) | 0 (0.0%) |
| Utilities | 0 (0.0%) | 0 (0.0%) |
| Information | 0 (0.0%) | 0 (0.0%) |
| Finance & Insurance | 0 (0.0%) | 0 (0.0%) |
| Real Estate, Rental & Leasing | 0 (0.0%) | 0 (0.0%) |
| Professional & Scientific | 0 (0.0%) | 25 (100.0%) |
| Enterprise Management | 0 (0.0%) | 0 (0.0%) |
| Administrative & Support | 0 (0.0%) | 0 (0.0%) |
| Educational Services | 46 (65.7%) | 24 (34.3%) |
| Health Care & Social Assistance | 0 (0.0%) | 0 (0.0%) |
| Arts, Entertainment & Recreation | 0 (0.0%) | 0 (0.0%) |
| Accommodation & Food Services | 0 (0.0%) | 0 (0.0%) |
| Public Administration | 0 (0.0%) | 0 (0.0%) |
| Total | 88 (50.6%) | 86 (49.4%) |
Education in Cohassett Beach
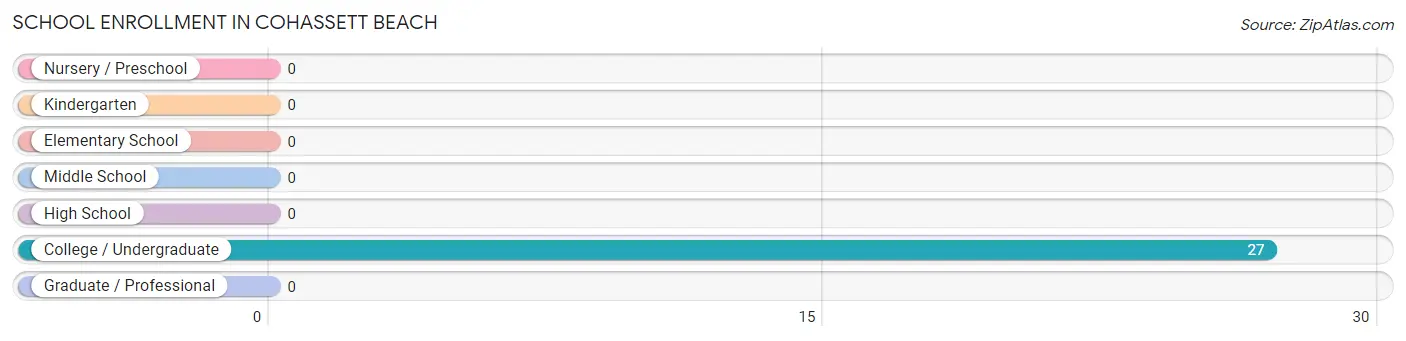
School Enrollment in Cohassett Beach
| School Level | # Students | % Students |
| Nursery / Preschool | 0 | 0.0% |
| Kindergarten | 0 | 0.0% |
| Elementary School | 0 | 0.0% |
| Middle School | 0 | 0.0% |
| High School | 0 | 0.0% |
| College / Undergraduate | 27 | 100.0% |
| Graduate / Professional | 0 | 0.0% |
| Total | 27 | 100.0% |
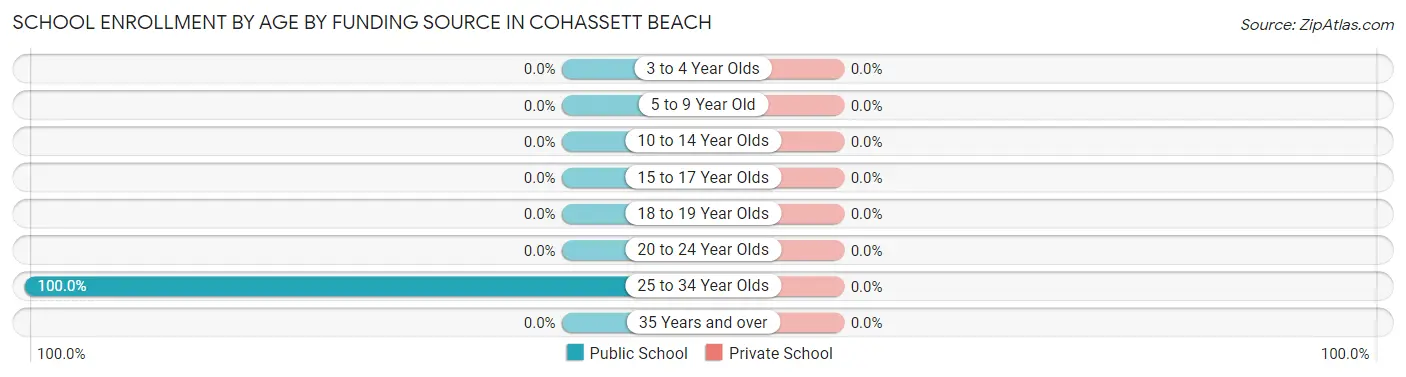
School Enrollment by Age by Funding Source in Cohassett Beach
| Age Bracket | Public School | Private School |
| 3 to 4 Year Olds | 0 (0.0%) | 0 (0.0%) |
| 5 to 9 Year Old | 0 (0.0%) | 0 (0.0%) |
| 10 to 14 Year Olds | 0 (0.0%) | 0 (0.0%) |
| 15 to 17 Year Olds | 0 (0.0%) | 0 (0.0%) |
| 18 to 19 Year Olds | 0 (0.0%) | 0 (0.0%) |
| 20 to 24 Year Olds | 0 (0.0%) | 0 (0.0%) |
| 25 to 34 Year Olds | 27 (100.0%) | 0 (0.0%) |
| 35 Years and over | 0 (0.0%) | 0 (0.0%) |
| Total | 27 (100.0%) | 0 (0.0%) |
Educational Attainment by Field of Study in Cohassett Beach
Literature & languages (42 | 45.2%), computers & mathematics (27 | 29.0%), physical & health sciences (8 | 8.6%), psychology (8 | 8.6%), and science & technology (8 | 8.6%) are the most common fields of study among 93 individuals in Cohassett Beach who have obtained a bachelor's degree or higher.
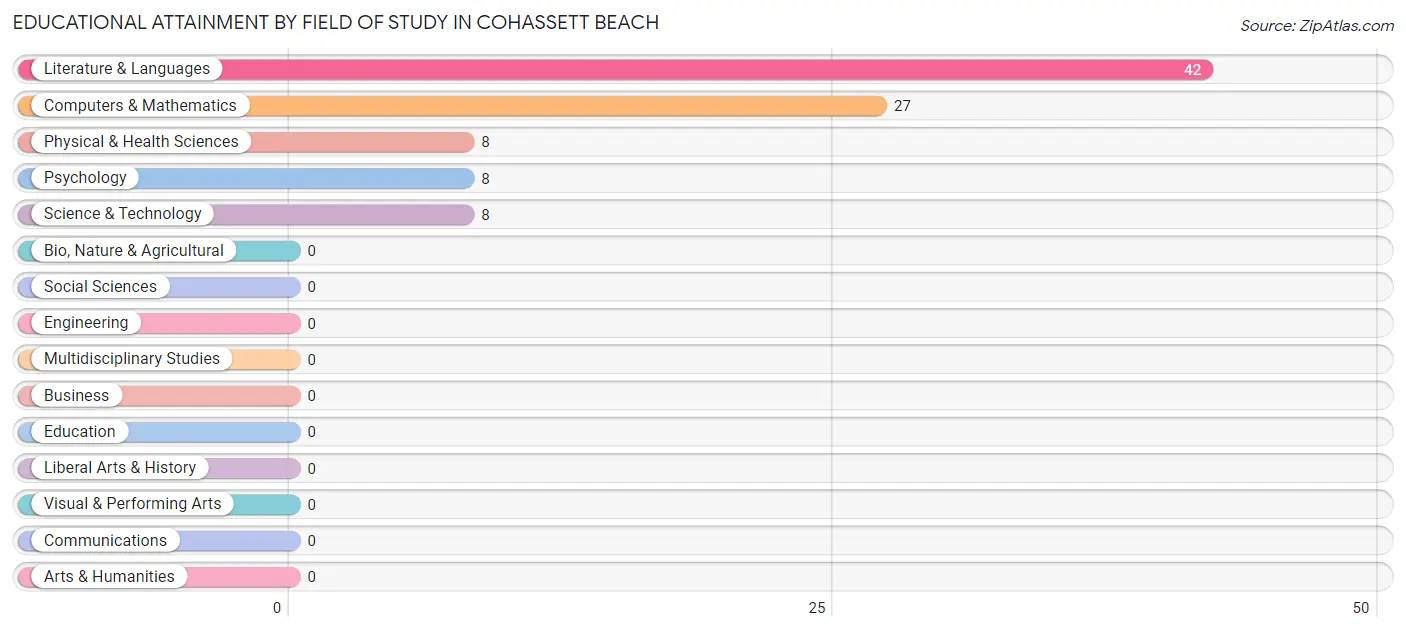
| Field of Study | # Graduates | % Graduates |
| Computers & Mathematics | 27 | 29.0% |
| Bio, Nature & Agricultural | 0 | 0.0% |
| Physical & Health Sciences | 8 | 8.6% |
| Psychology | 8 | 8.6% |
| Social Sciences | 0 | 0.0% |
| Engineering | 0 | 0.0% |
| Multidisciplinary Studies | 0 | 0.0% |
| Science & Technology | 8 | 8.6% |
| Business | 0 | 0.0% |
| Education | 0 | 0.0% |
| Literature & Languages | 42 | 45.2% |
| Liberal Arts & History | 0 | 0.0% |
| Visual & Performing Arts | 0 | 0.0% |
| Communications | 0 | 0.0% |
| Arts & Humanities | 0 | 0.0% |
| Total | 93 | 100.0% |
Transportation & Commute in Cohassett Beach
Vehicle Availability by Sex in Cohassett Beach
The most prevalent vehicle ownership categories in Cohassett Beach are males with 2 vehicles (42, accounting for 47.7%) and females with 2 vehicles (37, making up 48.8%).
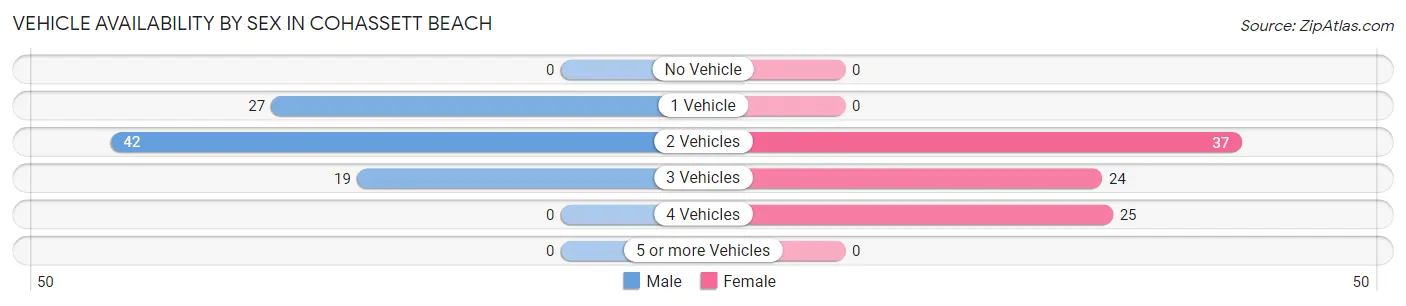
| Vehicles Available | Male | Female |
| No Vehicle | 0 (0.0%) | 0 (0.0%) |
| 1 Vehicle | 27 (30.7%) | 0 (0.0%) |
| 2 Vehicles | 42 (47.7%) | 37 (43.0%) |
| 3 Vehicles | 19 (21.6%) | 24 (27.9%) |
| 4 Vehicles | 0 (0.0%) | 25 (29.1%) |
| 5 or more Vehicles | 0 (0.0%) | 0 (0.0%) |
| Total | 88 (100.0%) | 86 (100.0%) |
Commute Time in Cohassett Beach
The most frequently occuring commute durations in Cohassett Beach are 5 to 9 minutes (95 commuters, 64.6%), 40 to 44 minutes (25 commuters, 17.0%), and 90 or more minutes (19 commuters, 12.9%).
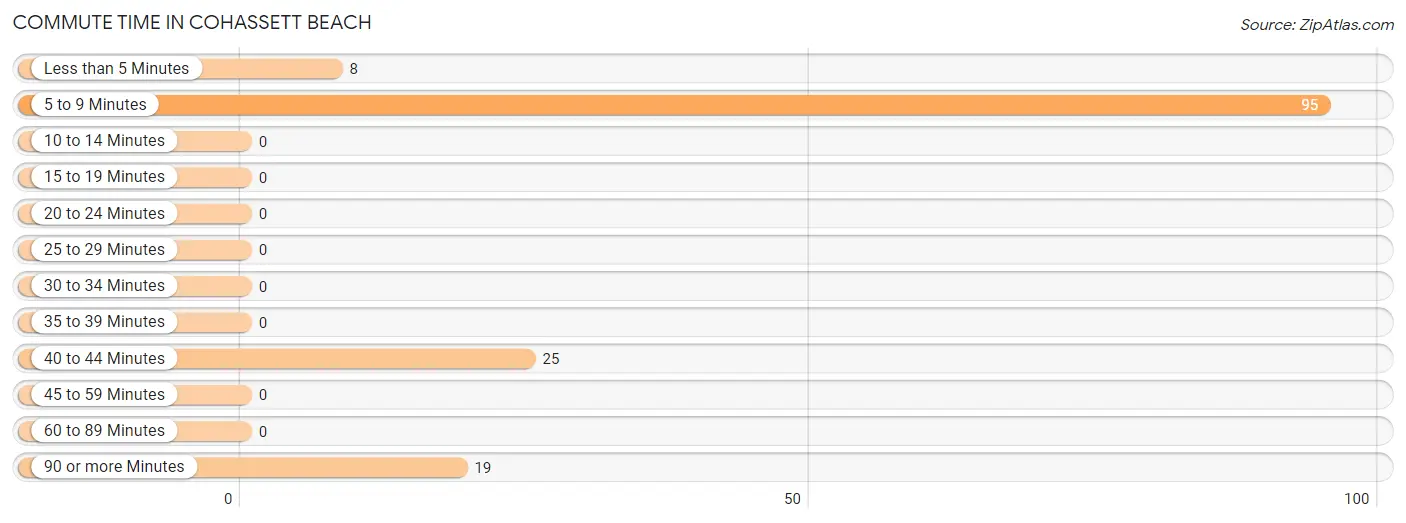
| Commute Time | # Commuters | % Commuters |
| Less than 5 Minutes | 8 | 5.4% |
| 5 to 9 Minutes | 95 | 64.6% |
| 10 to 14 Minutes | 0 | 0.0% |
| 15 to 19 Minutes | 0 | 0.0% |
| 20 to 24 Minutes | 0 | 0.0% |
| 25 to 29 Minutes | 0 | 0.0% |
| 30 to 34 Minutes | 0 | 0.0% |
| 35 to 39 Minutes | 0 | 0.0% |
| 40 to 44 Minutes | 25 | 17.0% |
| 45 to 59 Minutes | 0 | 0.0% |
| 60 to 89 Minutes | 0 | 0.0% |
| 90 or more Minutes | 19 | 12.9% |
Commute Time by Sex in Cohassett Beach
The most common commute times in Cohassett Beach are 5 to 9 minutes (42 commuters, 68.9%) for males and 5 to 9 minutes (53 commuters, 61.6%) for females.
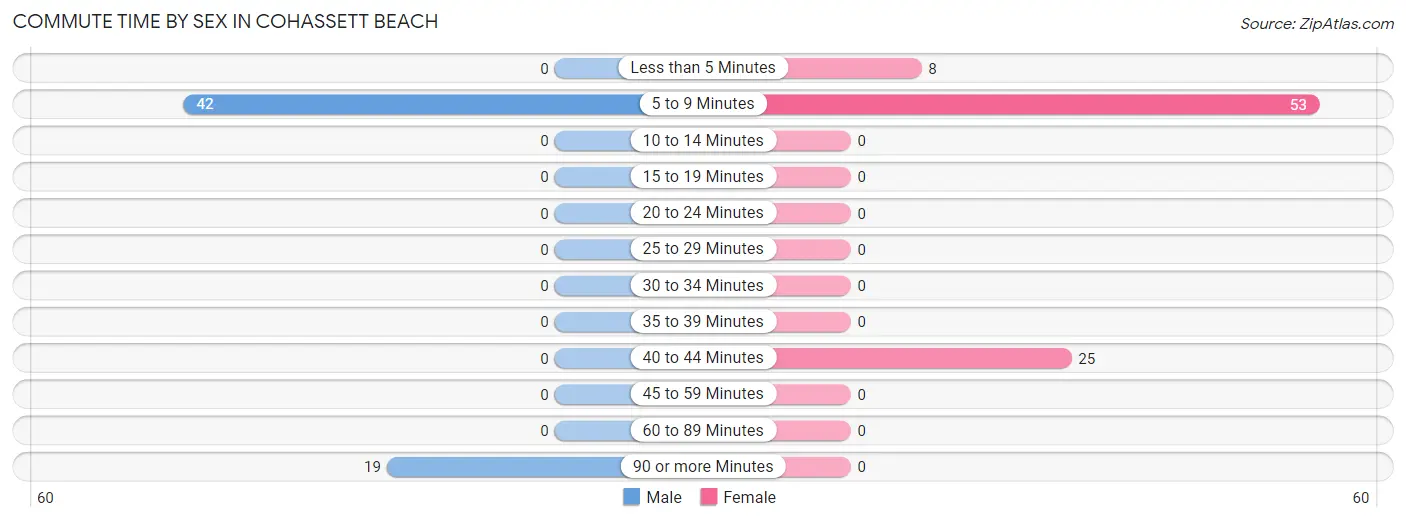
| Commute Time | Male | Female |
| Less than 5 Minutes | 0 (0.0%) | 8 (9.3%) |
| 5 to 9 Minutes | 42 (68.9%) | 53 (61.6%) |
| 10 to 14 Minutes | 0 (0.0%) | 0 (0.0%) |
| 15 to 19 Minutes | 0 (0.0%) | 0 (0.0%) |
| 20 to 24 Minutes | 0 (0.0%) | 0 (0.0%) |
| 25 to 29 Minutes | 0 (0.0%) | 0 (0.0%) |
| 30 to 34 Minutes | 0 (0.0%) | 0 (0.0%) |
| 35 to 39 Minutes | 0 (0.0%) | 0 (0.0%) |
| 40 to 44 Minutes | 0 (0.0%) | 25 (29.1%) |
| 45 to 59 Minutes | 0 (0.0%) | 0 (0.0%) |
| 60 to 89 Minutes | 0 (0.0%) | 0 (0.0%) |
| 90 or more Minutes | 19 (31.1%) | 0 (0.0%) |
Time of Departure to Work by Sex in Cohassett Beach
The most frequent times of departure to work in Cohassett Beach are 8:30 AM to 8:59 AM (61, 100.0%) for males and 7:00 AM to 7:29 AM (37, 43.0%) for females.
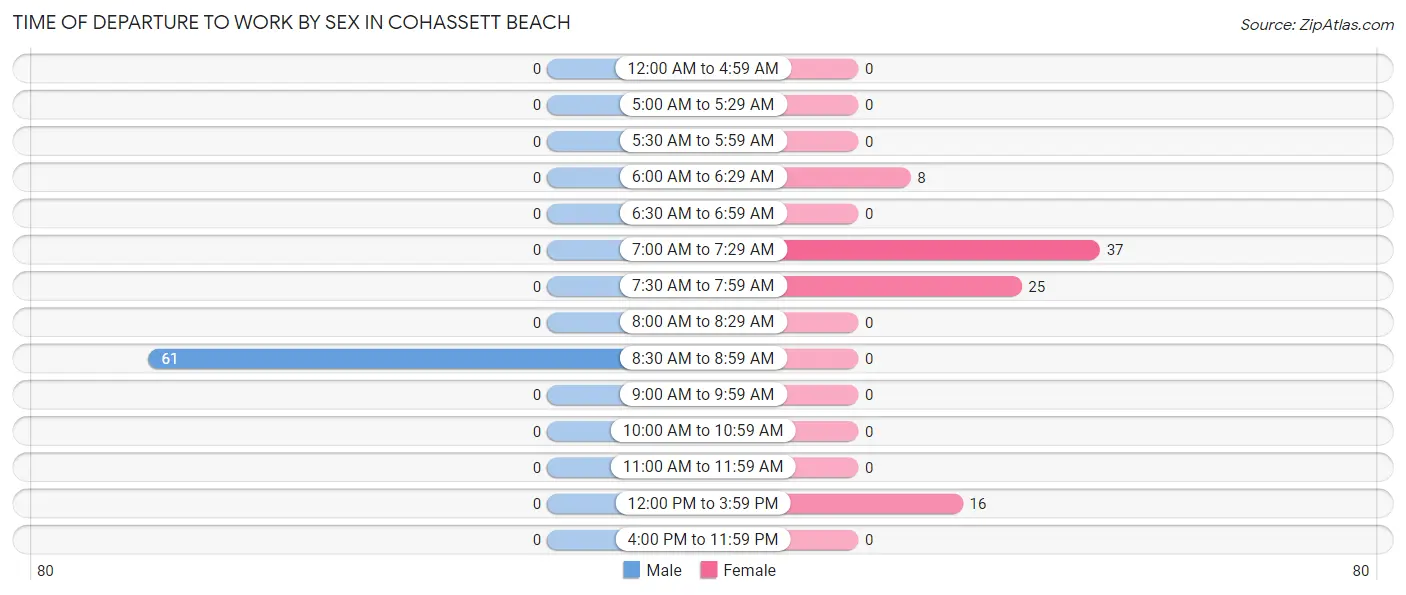
| Time of Departure | Male | Female |
| 12:00 AM to 4:59 AM | 0 (0.0%) | 0 (0.0%) |
| 5:00 AM to 5:29 AM | 0 (0.0%) | 0 (0.0%) |
| 5:30 AM to 5:59 AM | 0 (0.0%) | 0 (0.0%) |
| 6:00 AM to 6:29 AM | 0 (0.0%) | 8 (9.3%) |
| 6:30 AM to 6:59 AM | 0 (0.0%) | 0 (0.0%) |
| 7:00 AM to 7:29 AM | 0 (0.0%) | 37 (43.0%) |
| 7:30 AM to 7:59 AM | 0 (0.0%) | 25 (29.1%) |
| 8:00 AM to 8:29 AM | 0 (0.0%) | 0 (0.0%) |
| 8:30 AM to 8:59 AM | 61 (100.0%) | 0 (0.0%) |
| 9:00 AM to 9:59 AM | 0 (0.0%) | 0 (0.0%) |
| 10:00 AM to 10:59 AM | 0 (0.0%) | 0 (0.0%) |
| 11:00 AM to 11:59 AM | 0 (0.0%) | 0 (0.0%) |
| 12:00 PM to 3:59 PM | 0 (0.0%) | 16 (18.6%) |
| 4:00 PM to 11:59 PM | 0 (0.0%) | 0 (0.0%) |
| Total | 61 (100.0%) | 86 (100.0%) |
Housing Occupancy in Cohassett Beach
Occupancy by Ownership in Cohassett Beach
Of the total 154 dwellings in Cohassett Beach, owner-occupied units account for 154 (100.0%), while renter-occupied units make up 0 (0.0%).
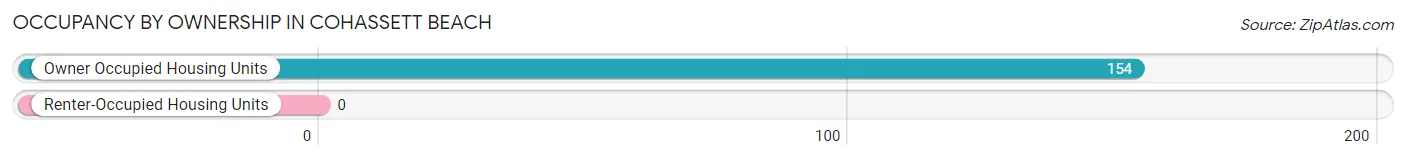
| Occupancy | # Housing Units | % Housing Units |
| Owner Occupied Housing Units | 154 | 100.0% |
| Renter-Occupied Housing Units | 0 | 0.0% |
| Total Occupied Housing Units | 154 | 100.0% |
Occupancy by Household Size in Cohassett Beach
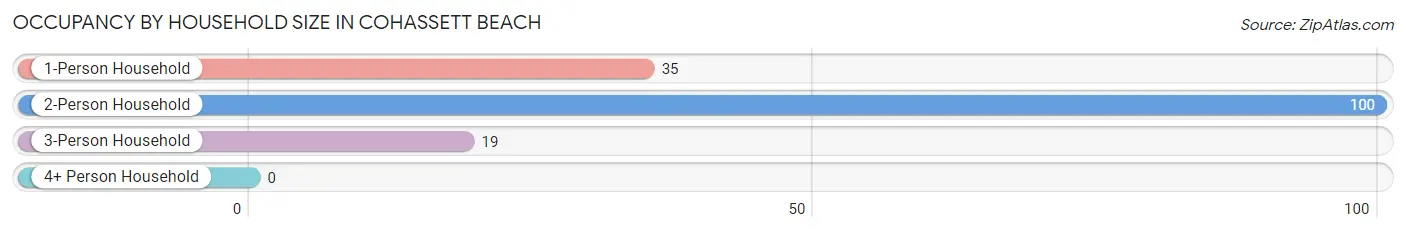
| Household Size | # Housing Units | % Housing Units |
| 1-Person Household | 35 | 22.7% |
| 2-Person Household | 100 | 64.9% |
| 3-Person Household | 19 | 12.3% |
| 4+ Person Household | 0 | 0.0% |
| Total Housing Units | 154 | 100.0% |
Occupancy by Ownership by Household Size in Cohassett Beach
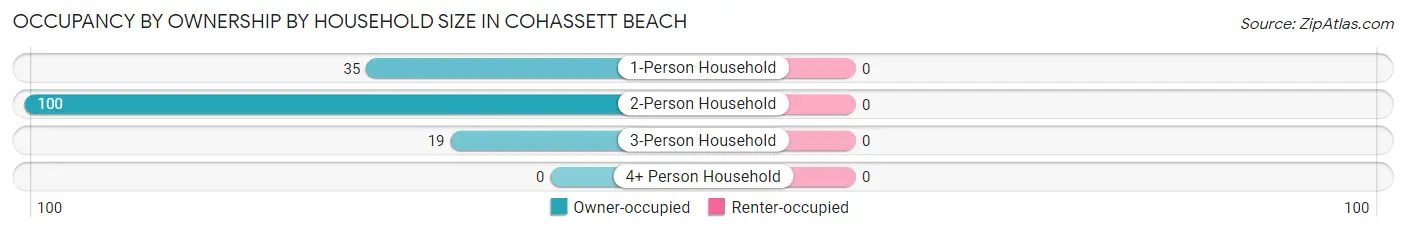
| Household Size | Owner-occupied | Renter-occupied |
| 1-Person Household | 35 (100.0%) | 0 (0.0%) |
| 2-Person Household | 100 (100.0%) | 0 (0.0%) |
| 3-Person Household | 19 (100.0%) | 0 (0.0%) |
| 4+ Person Household | 0 (0.0%) | 0 (0.0%) |
| Total Housing Units | 154 (100.0%) | 0 (0.0%) |
Occupancy by Educational Attainment in Cohassett Beach
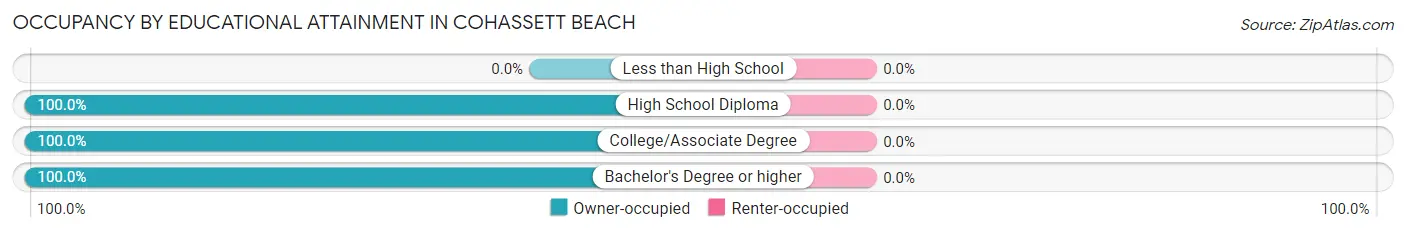
| Household Size | Owner-occupied | Renter-occupied |
| Less than High School | 0 (0.0%) | 0 (0.0%) |
| High School Diploma | 45 (100.0%) | 0 (0.0%) |
| College/Associate Degree | 32 (100.0%) | 0 (0.0%) |
| Bachelor's Degree or higher | 77 (100.0%) | 0 (0.0%) |
Occupancy by Age of Householder in Cohassett Beach
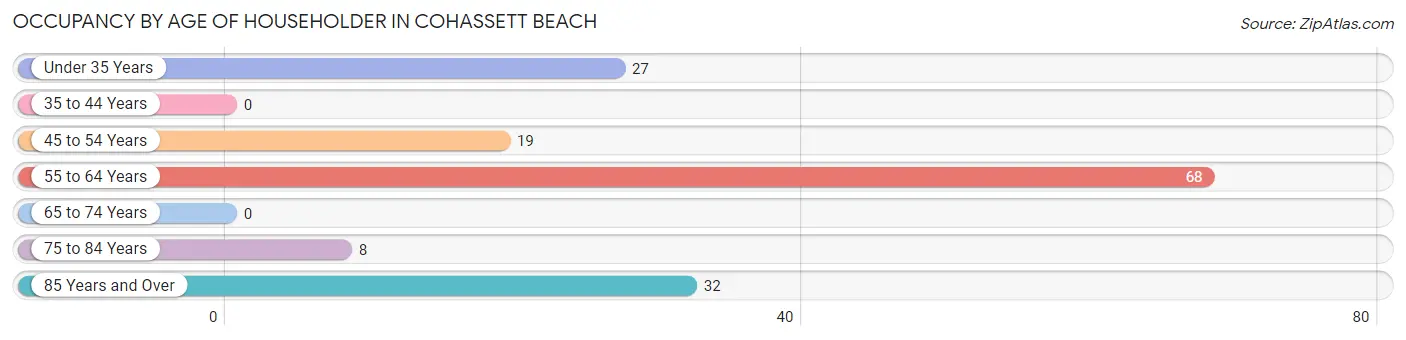
| Age Bracket | # Households | % Households |
| Under 35 Years | 27 | 17.5% |
| 35 to 44 Years | 0 | 0.0% |
| 45 to 54 Years | 19 | 12.3% |
| 55 to 64 Years | 68 | 44.2% |
| 65 to 74 Years | 0 | 0.0% |
| 75 to 84 Years | 8 | 5.2% |
| 85 Years and Over | 32 | 20.8% |
| Total | 154 | 100.0% |
Housing Finances in Cohassett Beach
Median Income by Occupancy in Cohassett Beach
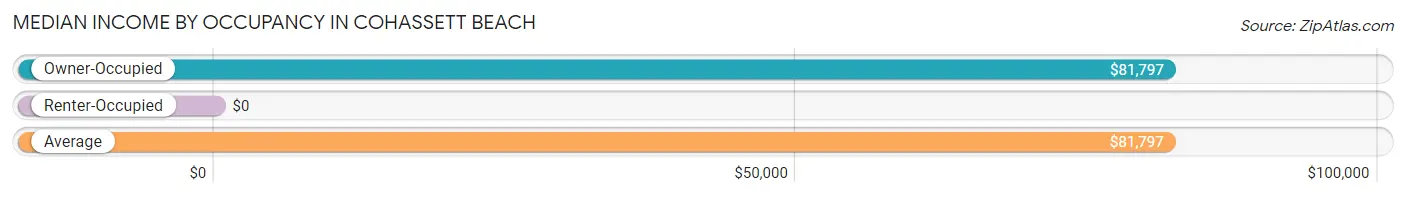
| Occupancy Type | # Households | Median Income |
| Owner-Occupied | 154 (100.0%) | $81,797 |
| Renter-Occupied | 0 (0.0%) | $0 |
| Average | 154 (100.0%) | $81,797 |
Occupancy by Householder Income Bracket in Cohassett Beach
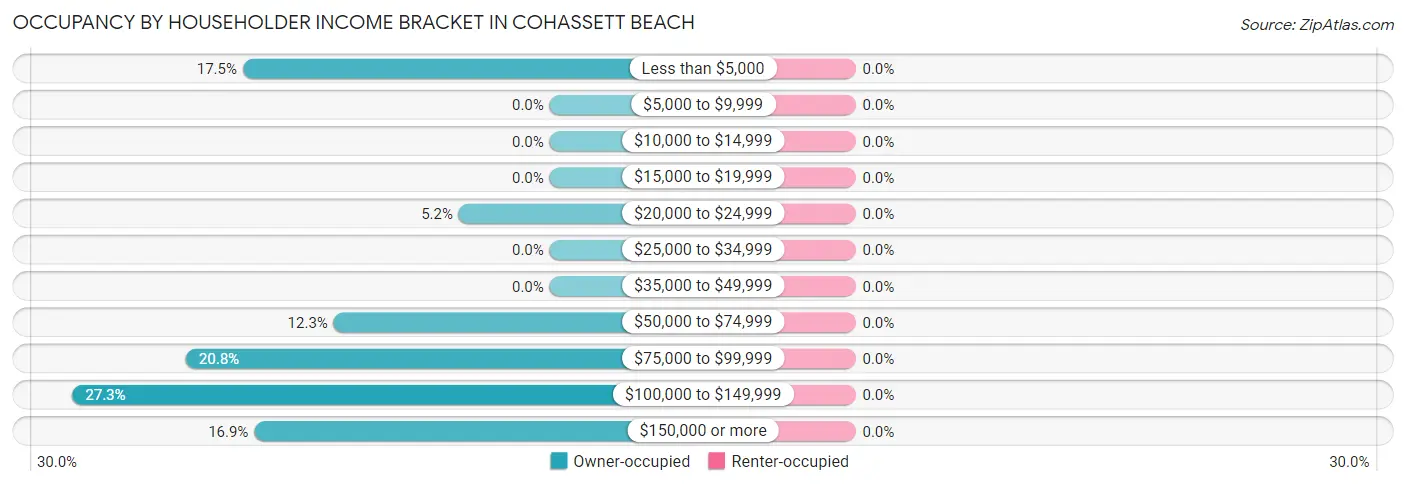
| Income Bracket | Owner-occupied | Renter-occupied |
| Less than $5,000 | 27 (17.5%) | 0 (0.0%) |
| $5,000 to $9,999 | 0 (0.0%) | 0 (0.0%) |
| $10,000 to $14,999 | 0 (0.0%) | 0 (0.0%) |
| $15,000 to $19,999 | 0 (0.0%) | 0 (0.0%) |
| $20,000 to $24,999 | 8 (5.2%) | 0 (0.0%) |
| $25,000 to $34,999 | 0 (0.0%) | 0 (0.0%) |
| $35,000 to $49,999 | 0 (0.0%) | 0 (0.0%) |
| $50,000 to $74,999 | 19 (12.3%) | 0 (0.0%) |
| $75,000 to $99,999 | 32 (20.8%) | 0 (0.0%) |
| $100,000 to $149,999 | 42 (27.3%) | 0 (0.0%) |
| $150,000 or more | 26 (16.9%) | 0 (0.0%) |
| Total | 154 (100.0%) | 0 (0.0%) |
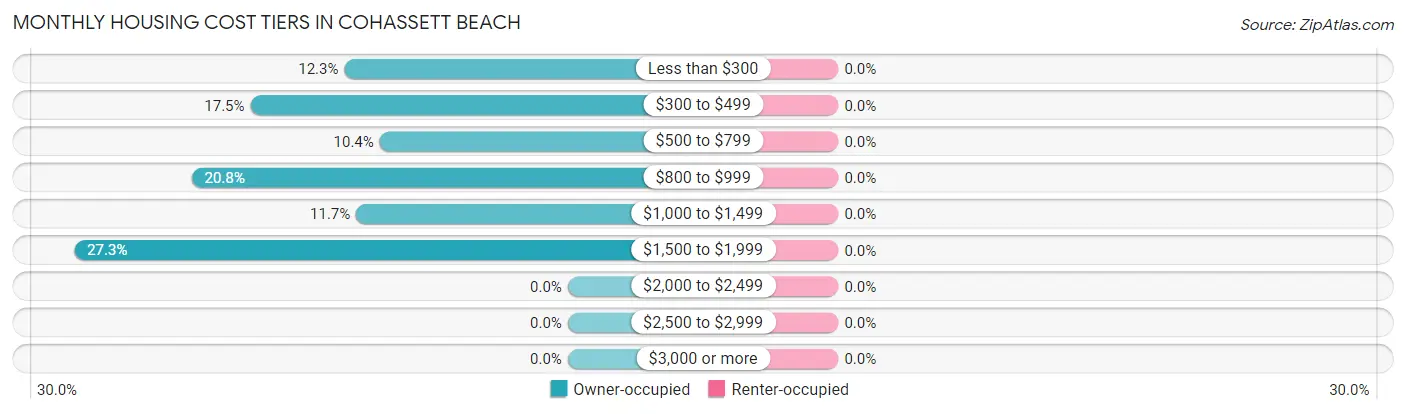
Monthly Housing Cost Tiers in Cohassett Beach
| Monthly Cost | Owner-occupied | Renter-occupied |
| Less than $300 | 19 (12.3%) | 0 (0.0%) |
| $300 to $499 | 27 (17.5%) | 0 (0.0%) |
| $500 to $799 | 16 (10.4%) | 0 (0.0%) |
| $800 to $999 | 32 (20.8%) | 0 (0.0%) |
| $1,000 to $1,499 | 18 (11.7%) | 0 (0.0%) |
| $1,500 to $1,999 | 42 (27.3%) | 0 (0.0%) |
| $2,000 to $2,499 | 0 (0.0%) | 0 (0.0%) |
| $2,500 to $2,999 | 0 (0.0%) | 0 (0.0%) |
| $3,000 or more | 0 (0.0%) | 0 (0.0%) |
| Total | 154 (100.0%) | 0 (0.0%) |
Physical Housing Characteristics in Cohassett Beach
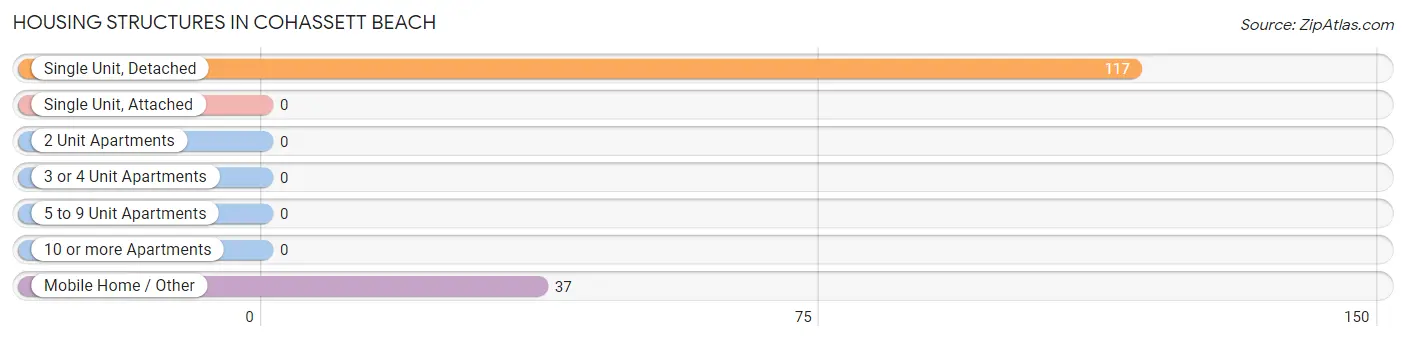
Housing Structures in Cohassett Beach
| Structure Type | # Housing Units | % Housing Units |
| Single Unit, Detached | 117 | 76.0% |
| Single Unit, Attached | 0 | 0.0% |
| 2 Unit Apartments | 0 | 0.0% |
| 3 or 4 Unit Apartments | 0 | 0.0% |
| 5 to 9 Unit Apartments | 0 | 0.0% |
| 10 or more Apartments | 0 | 0.0% |
| Mobile Home / Other | 37 | 24.0% |
| Total | 154 | 100.0% |
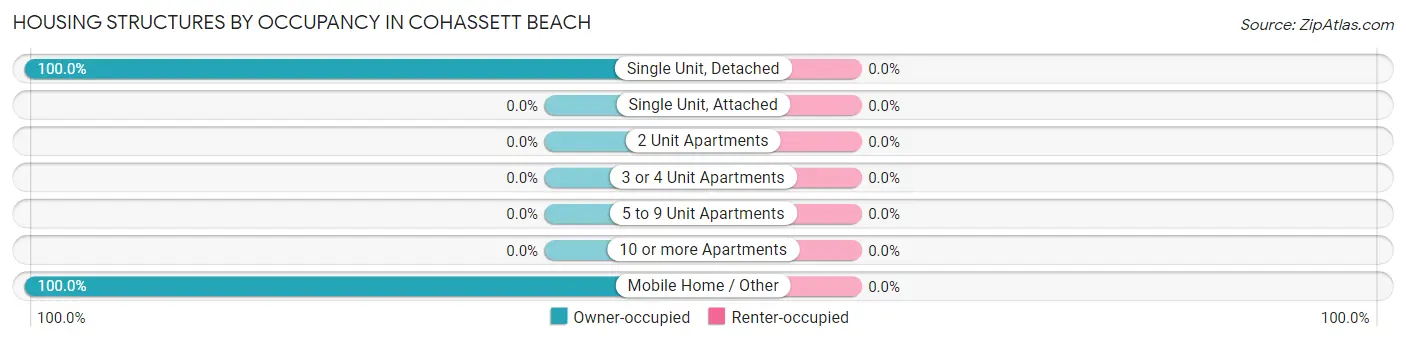
Housing Structures by Occupancy in Cohassett Beach
| Structure Type | Owner-occupied | Renter-occupied |
| Single Unit, Detached | 117 (100.0%) | 0 (0.0%) |
| Single Unit, Attached | 0 (0.0%) | 0 (0.0%) |
| 2 Unit Apartments | 0 (0.0%) | 0 (0.0%) |
| 3 or 4 Unit Apartments | 0 (0.0%) | 0 (0.0%) |
| 5 to 9 Unit Apartments | 0 (0.0%) | 0 (0.0%) |
| 10 or more Apartments | 0 (0.0%) | 0 (0.0%) |
| Mobile Home / Other | 37 (100.0%) | 0 (0.0%) |
| Total | 154 (100.0%) | 0 (0.0%) |
Housing Structures by Number of Rooms in Cohassett Beach

| Number of Rooms | Owner-occupied | Renter-occupied |
| 1 Room | 0 (0.0%) | 0 (0.0%) |
| 2 or 3 Rooms | 0 (0.0%) | 0 (0.0%) |
| 4 or 5 Rooms | 0 (0.0%) | 0 (0.0%) |
| 6 or 7 Rooms | 85 (55.2%) | 0 (0.0%) |
| 8 or more Rooms | 69 (44.8%) | 0 (0.0%) |
| Total | 154 (100.0%) | 0 (0.0%) |
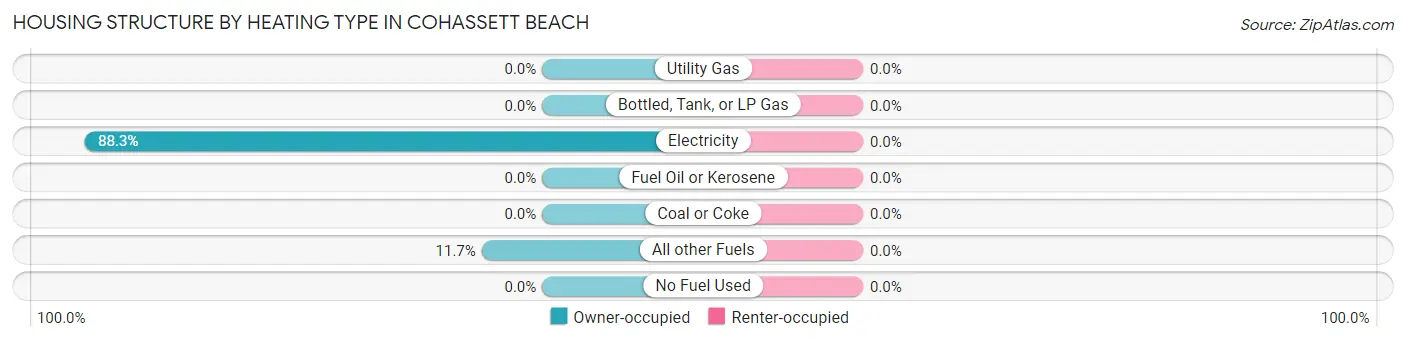
Housing Structure by Heating Type in Cohassett Beach
| Heating Type | Owner-occupied | Renter-occupied |
| Utility Gas | 0 (0.0%) | 0 (0.0%) |
| Bottled, Tank, or LP Gas | 0 (0.0%) | 0 (0.0%) |
| Electricity | 136 (88.3%) | 0 (0.0%) |
| Fuel Oil or Kerosene | 0 (0.0%) | 0 (0.0%) |
| Coal or Coke | 0 (0.0%) | 0 (0.0%) |
| All other Fuels | 18 (11.7%) | 0 (0.0%) |
| No Fuel Used | 0 (0.0%) | 0 (0.0%) |
| Total | 154 (100.0%) | 0 (0.0%) |
Household Vehicle Usage in Cohassett Beach
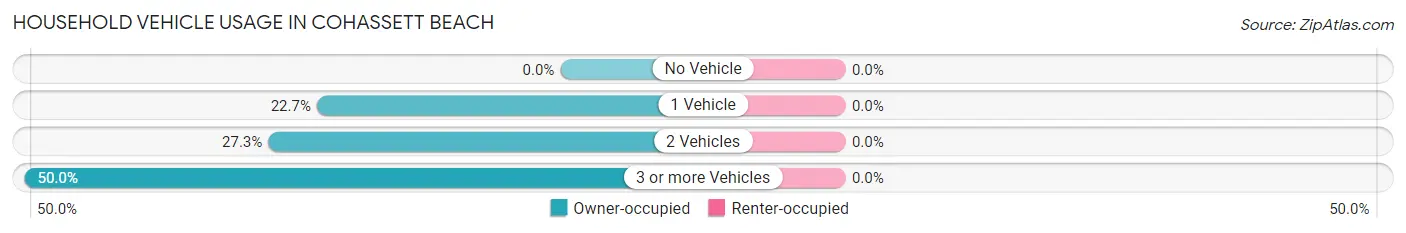
| Vehicles per Household | Owner-occupied | Renter-occupied |
| No Vehicle | 0 (0.0%) | 0 (0.0%) |
| 1 Vehicle | 35 (22.7%) | 0 (0.0%) |
| 2 Vehicles | 42 (27.3%) | 0 (0.0%) |
| 3 or more Vehicles | 77 (50.0%) | 0 (0.0%) |
| Total | 154 (100.0%) | 0 (0.0%) |
Real Estate & Mortgages in Cohassett Beach
Real Estate and Mortgage Overview in Cohassett Beach
| Characteristic | Without Mortgage | With Mortgage |
| Housing Units | 86 | 68 |
| Median Property Value | - | - |
| Median Household Income | $74,605 | $18 |
| Monthly Housing Costs | - | - |
| Real Estate Taxes | - | - |
Property Value by Mortgage Status in Cohassett Beach
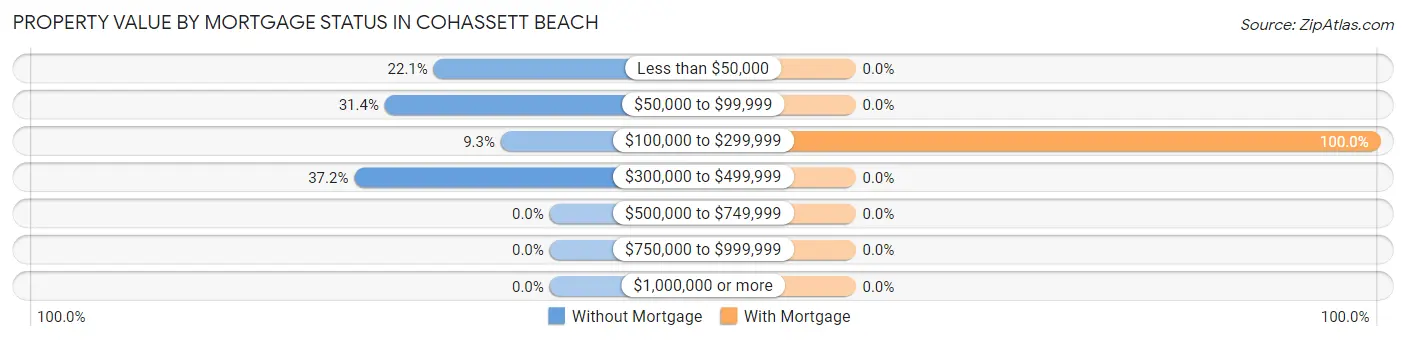
| Property Value | Without Mortgage | With Mortgage |
| Less than $50,000 | 19 (22.1%) | 0 (0.0%) |
| $50,000 to $99,999 | 27 (31.4%) | 0 (0.0%) |
| $100,000 to $299,999 | 8 (9.3%) | 68 (100.0%) |
| $300,000 to $499,999 | 32 (37.2%) | 0 (0.0%) |
| $500,000 to $749,999 | 0 (0.0%) | 0 (0.0%) |
| $750,000 to $999,999 | 0 (0.0%) | 0 (0.0%) |
| $1,000,000 or more | 0 (0.0%) | 0 (0.0%) |
| Total | 86 (100.0%) | 68 (100.0%) |
Household Income by Mortgage Status in Cohassett Beach
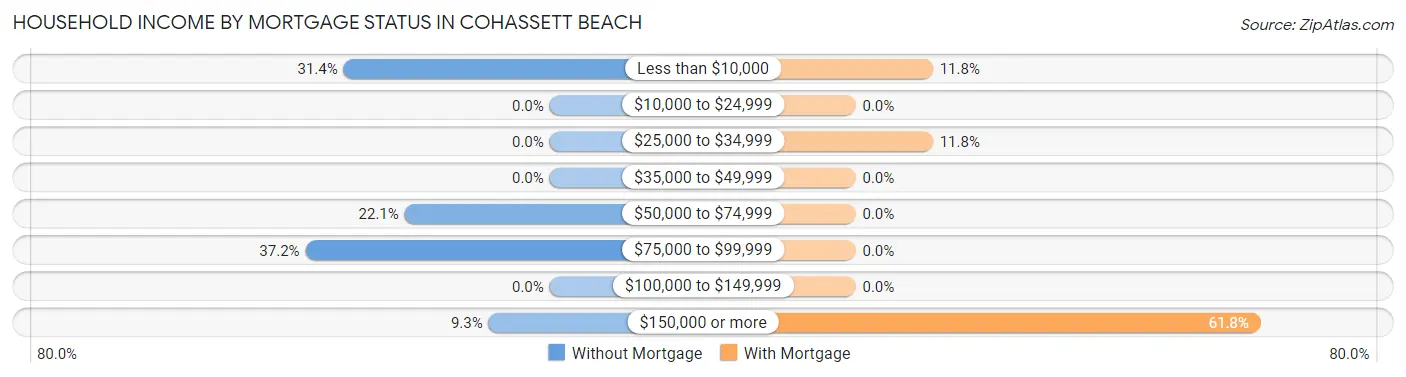
| Household Income | Without Mortgage | With Mortgage |
| Less than $10,000 | 27 (31.4%) | 8 (11.8%) |
| $10,000 to $24,999 | 0 (0.0%) | 0 (0.0%) |
| $25,000 to $34,999 | 0 (0.0%) | 8 (11.8%) |
| $35,000 to $49,999 | 0 (0.0%) | 0 (0.0%) |
| $50,000 to $74,999 | 19 (22.1%) | 0 (0.0%) |
| $75,000 to $99,999 | 32 (37.2%) | 0 (0.0%) |
| $100,000 to $149,999 | 0 (0.0%) | 0 (0.0%) |
| $150,000 or more | 8 (9.3%) | 42 (61.8%) |
| Total | 86 (100.0%) | 68 (100.0%) |
Property Value to Household Income Ratio in Cohassett Beach
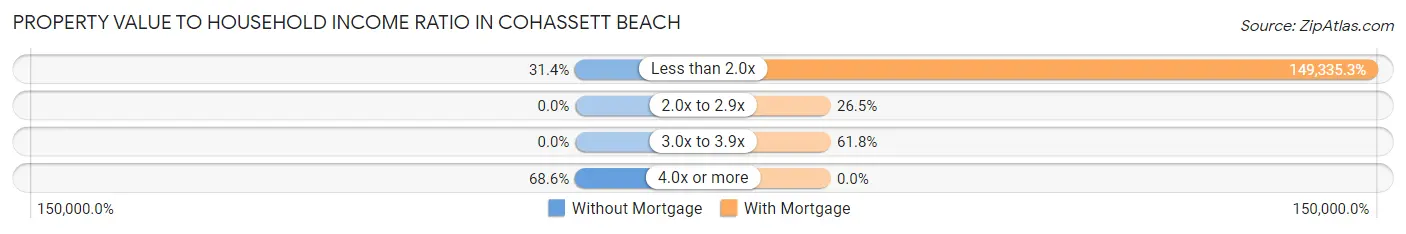
| Value-to-Income Ratio | Without Mortgage | With Mortgage |
| Less than 2.0x | 27 (31.4%) | 101,548 (149,335.3%) |
| 2.0x to 2.9x | 0 (0.0%) | 18 (26.5%) |
| 3.0x to 3.9x | 0 (0.0%) | 42 (61.8%) |
| 4.0x or more | 59 (68.6%) | 0 (0.0%) |
| Total | 86 (100.0%) | 68 (100.0%) |
Real Estate Taxes by Mortgage Status in Cohassett Beach
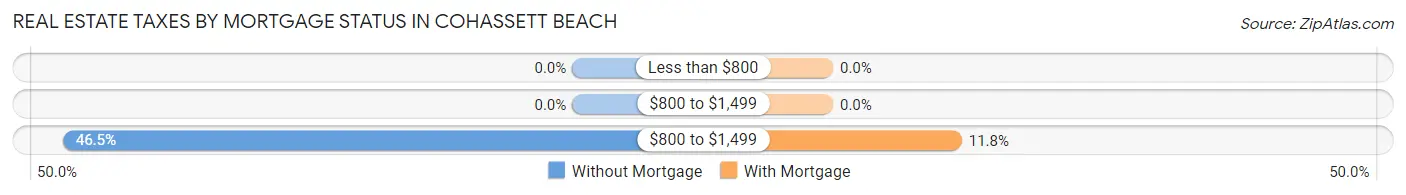
| Property Taxes | Without Mortgage | With Mortgage |
| Less than $800 | 0 (0.0%) | 0 (0.0%) |
| $800 to $1,499 | 0 (0.0%) | 0 (0.0%) |
| $800 to $1,499 | 40 (46.5%) | 8 (11.8%) |
| Total | 86 (100.0%) | 68 (100.0%) |
Health & Disability in Cohassett Beach
Health Insurance Coverage by Age in Cohassett Beach
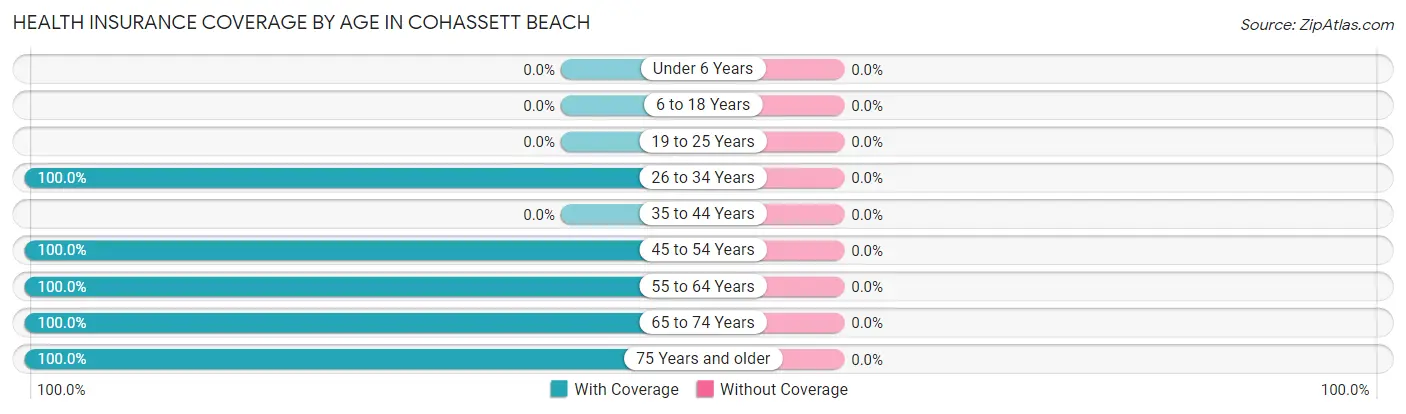
| Age Bracket | With Coverage | Without Coverage |
| Under 6 Years | 0 (0.0%) | 0 (0.0%) |
| 6 to 18 Years | 0 (0.0%) | 0 (0.0%) |
| 19 to 25 Years | 0 (0.0%) | 0 (0.0%) |
| 26 to 34 Years | 27 (100.0%) | 0 (0.0%) |
| 35 to 44 Years | 0 (0.0%) | 0 (0.0%) |
| 45 to 54 Years | 35 (100.0%) | 0 (0.0%) |
| 55 to 64 Years | 150 (100.0%) | 0 (0.0%) |
| 65 to 74 Years | 39 (100.0%) | 0 (0.0%) |
| 75 Years and older | 40 (100.0%) | 0 (0.0%) |
| Total | 291 (100.0%) | 0 (0.0%) |
Health Insurance Coverage by Citizenship Status in Cohassett Beach
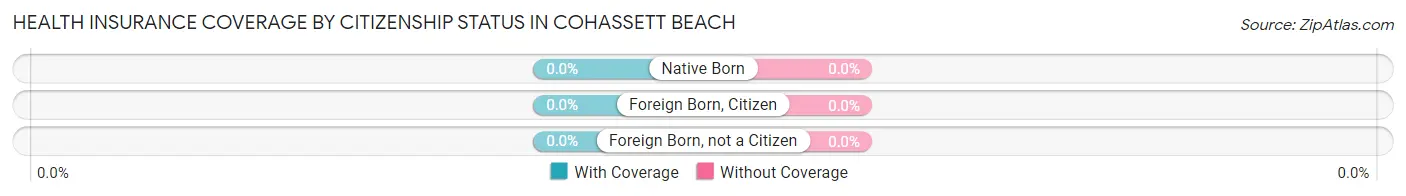
| Citizenship Status | With Coverage | Without Coverage |
| Native Born | 0 (0.0%) | 0 (0.0%) |
| Foreign Born, Citizen | 0 (0.0%) | 0 (0.0%) |
| Foreign Born, not a Citizen | 0 (0.0%) | 0 (0.0%) |
Health Insurance Coverage by Household Income in Cohassett Beach
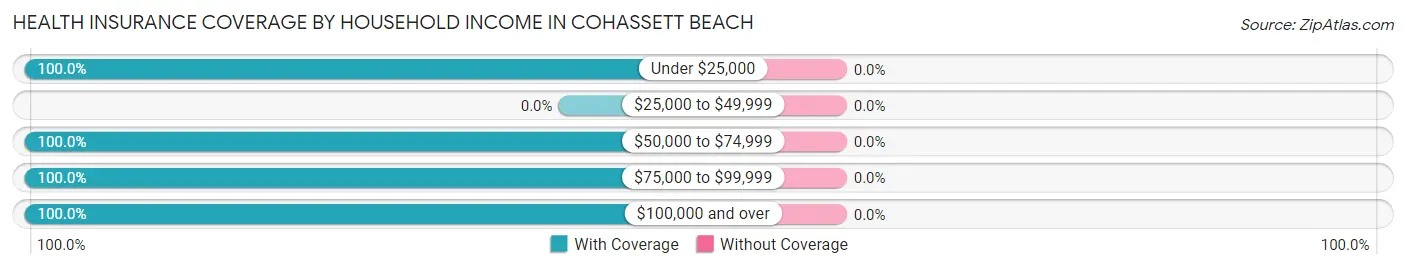
| Household Income | With Coverage | Without Coverage |
| Under $25,000 | 35 (100.0%) | 0 (0.0%) |
| $25,000 to $49,999 | 0 (0.0%) | 0 (0.0%) |
| $50,000 to $74,999 | 55 (100.0%) | 0 (0.0%) |
| $75,000 to $99,999 | 63 (100.0%) | 0 (0.0%) |
| $100,000 and over | 138 (100.0%) | 0 (0.0%) |
Public vs Private Health Insurance Coverage by Age in Cohassett Beach
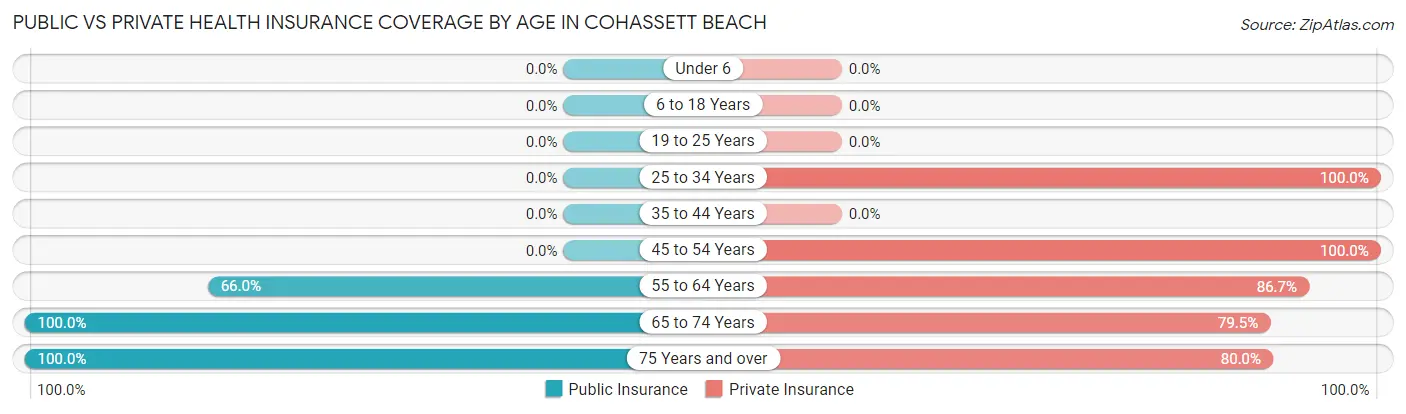
| Age Bracket | Public Insurance | Private Insurance |
| Under 6 | 0 (0.0%) | 0 (0.0%) |
| 6 to 18 Years | 0 (0.0%) | 0 (0.0%) |
| 19 to 25 Years | 0 (0.0%) | 0 (0.0%) |
| 25 to 34 Years | 0 (0.0%) | 27 (100.0%) |
| 35 to 44 Years | 0 (0.0%) | 0 (0.0%) |
| 45 to 54 Years | 0 (0.0%) | 35 (100.0%) |
| 55 to 64 Years | 99 (66.0%) | 130 (86.7%) |
| 65 to 74 Years | 39 (100.0%) | 31 (79.5%) |
| 75 Years and over | 40 (100.0%) | 32 (80.0%) |
| Total | 178 (61.2%) | 255 (87.6%) |
Disability Status by Sex by Age in Cohassett Beach
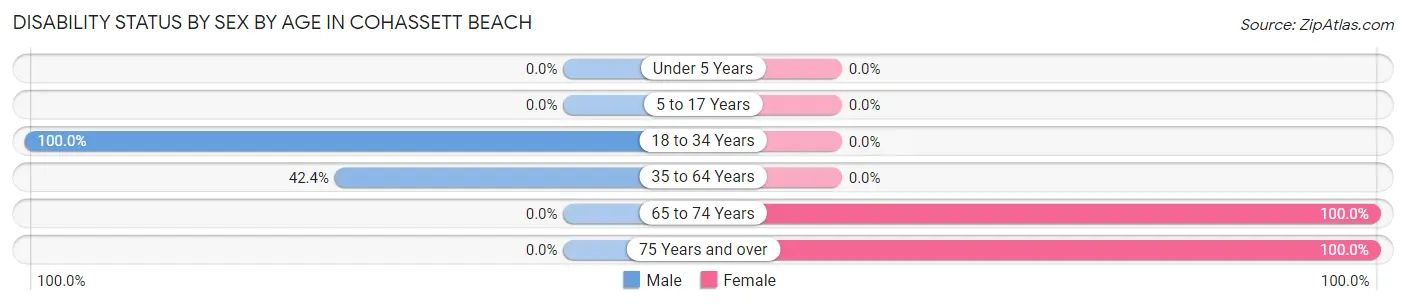
| Age Bracket | Male | Female |
| Under 5 Years | 0 (0.0%) | 0 (0.0%) |
| 5 to 17 Years | 0 (0.0%) | 0 (0.0%) |
| 18 to 34 Years | 27 (100.0%) | 0 (0.0%) |
| 35 to 64 Years | 42 (42.4%) | 0 (0.0%) |
| 65 to 74 Years | 0 (0.0%) | 31 (100.0%) |
| 75 Years and over | 0 (0.0%) | 8 (100.0%) |
Disability Class by Sex by Age in Cohassett Beach
Disability Class: Hearing Difficulty
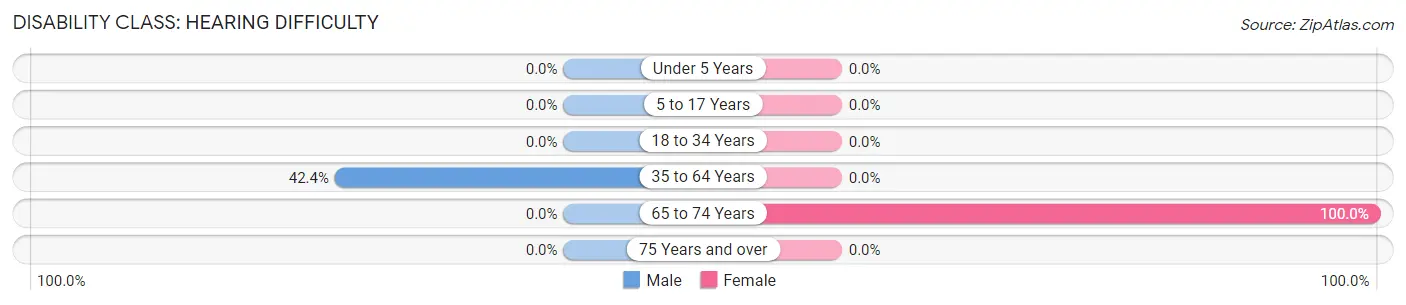
| Age Bracket | Male | Female |
| Under 5 Years | 0 (0.0%) | 0 (0.0%) |
| 5 to 17 Years | 0 (0.0%) | 0 (0.0%) |
| 18 to 34 Years | 0 (0.0%) | 0 (0.0%) |
| 35 to 64 Years | 42 (42.4%) | 0 (0.0%) |
| 65 to 74 Years | 0 (0.0%) | 31 (100.0%) |
| 75 Years and over | 0 (0.0%) | 0 (0.0%) |
Disability Class: Vision Difficulty
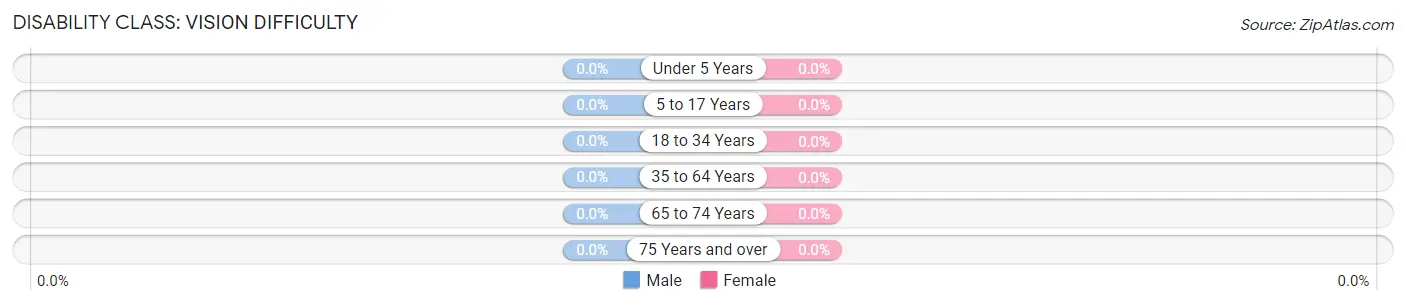
| Age Bracket | Male | Female |
| Under 5 Years | 0 (0.0%) | 0 (0.0%) |
| 5 to 17 Years | 0 (0.0%) | 0 (0.0%) |
| 18 to 34 Years | 0 (0.0%) | 0 (0.0%) |
| 35 to 64 Years | 0 (0.0%) | 0 (0.0%) |
| 65 to 74 Years | 0 (0.0%) | 0 (0.0%) |
| 75 Years and over | 0 (0.0%) | 0 (0.0%) |
Disability Class: Cognitive Difficulty
| Age Bracket | Male | Female |
| 5 to 17 Years | 0 (0.0%) | 0 (0.0%) |
| 18 to 34 Years | 0 (0.0%) | 0 (0.0%) |
| 35 to 64 Years | 0 (0.0%) | 0 (0.0%) |
| 65 to 74 Years | 0 (0.0%) | 0 (0.0%) |
| 75 Years and over | 0 (0.0%) | 0 (0.0%) |
Disability Class: Ambulatory Difficulty
| Age Bracket | Male | Female |
| 5 to 17 Years | 0 (0.0%) | 0 (0.0%) |
| 18 to 34 Years | 0 (0.0%) | 0 (0.0%) |
| 35 to 64 Years | 0 (0.0%) | 0 (0.0%) |
| 65 to 74 Years | 0 (0.0%) | 0 (0.0%) |
| 75 Years and over | 0 (0.0%) | 8 (100.0%) |
Disability Class: Self-Care Difficulty
| Age Bracket | Male | Female |
| 5 to 17 Years | 0 (0.0%) | 0 (0.0%) |
| 18 to 34 Years | 0 (0.0%) | 0 (0.0%) |
| 35 to 64 Years | 0 (0.0%) | 0 (0.0%) |
| 65 to 74 Years | 0 (0.0%) | 0 (0.0%) |
| 75 Years and over | 0 (0.0%) | 8 (100.0%) |
Technology Access in Cohassett Beach
Computing Device Access in Cohassett Beach
| Device Type | # Households | % Households |
| Desktop or Laptop | 154 | 100.0% |
| Smartphone | 154 | 100.0% |
| Tablet | 154 | 100.0% |
| No Computing Device | 0 | 0.0% |
| Total | 154 | 100.0% |
Internet Access in Cohassett Beach
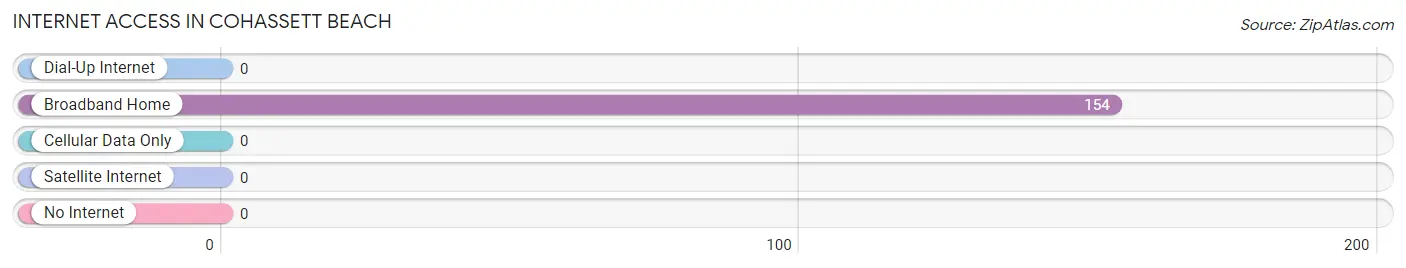
| Internet Type | # Households | % Households |
| Dial-Up Internet | 0 | 0.0% |
| Broadband Home | 154 | 100.0% |
| Cellular Data Only | 0 | 0.0% |
| Satellite Internet | 0 | 0.0% |
| No Internet | 0 | 0.0% |
| Total | 154 | 100.0% |
Cohassett Beach Summary
Cohassett Beach is a small unincorporated community located in Pacific County, Washington, United States. It is situated on the Long Beach Peninsula, a narrow strip of land that separates the Pacific Ocean from Willapa Bay. The community is located approximately two miles south of the city of Long Beach and is bordered by the Pacific Ocean to the west and Willapa Bay to the east.
History
Cohassett Beach was first settled in the late 19th century by a group of settlers from the Midwest. The settlers were attracted to the area by its natural beauty and abundant resources. The first settlers built a small fishing village and named it Cohassett Beach after the nearby Cohassett Creek. The village grew slowly over the years and by the early 20th century, it had become a popular summer destination for tourists from Seattle and other nearby cities.
In the 1920s, the area was developed as a resort community. Several large hotels were built, including the Cohassett Beach Hotel, which was the largest hotel in the area. The hotel was a popular destination for tourists and was known for its luxurious amenities and beautiful views of the ocean.
In the 1950s, the area began to decline as tourists began to flock to other beach destinations. The hotel was eventually closed and the area became a quiet residential community.
Geography
Cohassett Beach is located on the Long Beach Peninsula, a narrow strip of land that separates the Pacific Ocean from Willapa Bay. The community is located approximately two miles south of the city of Long Beach and is bordered by the Pacific Ocean to the west and Willapa Bay to the east.
The area is characterized by its flat terrain and sandy beaches. The climate is mild and humid, with temperatures ranging from the mid-50s in the winter to the mid-70s in the summer.
Economy
The economy of Cohassett Beach is largely based on tourism. The area is a popular destination for beachgoers, and there are several hotels, restaurants, and other businesses catering to tourists. The area is also home to several marinas, which provide services to boaters and fishermen.
In addition to tourism, the area is also home to several small businesses, including a grocery store, a hardware store, and a few other retail establishments.
Demographics
As of the 2010 census, the population of Cohassett Beach was 1,093. The racial makeup of the community was 94.3% White, 0.7% African American, 0.3% Native American, 0.7% Asian, 0.1% Pacific Islander, 0.7% from other races, and 2.7% from two or more races. Hispanic or Latino of any race were 2.7% of the population.
The median household income in Cohassett Beach was $45,000, and the median family income was $50,000. The per capita income was $20,000. About 8.3% of families and 10.3% of the population were below the poverty line, including 14.3% of those under age 18 and 5.3% of those age 65 or over.
Common Questions
What is Per Capita Income in Cohassett Beach?
Per Capita income in Cohassett Beach is $44,942.
What is the Median Family Income in Cohassett Beach?
Median Family Income in Cohassett Beach is $100,506.
What is the Median Household income in Cohassett Beach?
Median Household Income in Cohassett Beach is $81,797.
What is Inequality or Gini Index in Cohassett Beach?
Inequality or Gini Index in Cohassett Beach is 0.33.
What is the Total Population of Cohassett Beach?
Total Population of Cohassett Beach is 291.
What is the Total Male Population of Cohassett Beach?
Total Male Population of Cohassett Beach is 166.
What is the Total Female Population of Cohassett Beach?
Total Female Population of Cohassett Beach is 125.
What is the Ratio of Males per 100 Females in Cohassett Beach?
There are 132.80 Males per 100 Females in Cohassett Beach.
What is the Ratio of Females per 100 Males in Cohassett Beach?
There are 75.30 Females per 100 Males in Cohassett Beach.
What is the Median Population Age in Cohassett Beach?
Median Population Age in Cohassett Beach is 64.2 Years.
What is the Average Family Size in Cohassett Beach
Average Family Size in Cohassett Beach is 2.1 People.
What is the Average Household Size in Cohassett Beach
Average Household Size in Cohassett Beach is 1.9 People.
How Large is the Labor Force in Cohassett Beach?
There are 174 People in the Labor Forcein in Cohassett Beach.
What is the Percentage of People in the Labor Force in Cohassett Beach?
59.8% of People are in the Labor Force in Cohassett Beach.