Curlew Lake, WA Map & Demographics
Curlew Lake Map
Curlew Lake Overview
$48,125
PER CAPITA INCOME
$101,964
AVG FAMILY INCOME
$64,167
AVG HOUSEHOLD INCOME
0.55
INEQUALITY / GINI INDEX
585
TOTAL POPULATION
236
MALE POPULATION
349
FEMALE POPULATION
67.62
MALES / 100 FEMALES
147.88
FEMALES / 100 MALES
56.9
MEDIAN AGE
2.8
AVG FAMILY SIZE
2.1
AVG HOUSEHOLD SIZE
234
LABOR FORCE [ PEOPLE ]
47.0%
PERCENT IN LABOR FORCE
Income in Curlew Lake
Income Overview in Curlew Lake
Per Capita Income in Curlew Lake is $48,125, while median incomes of families and households are $101,964 and $64,167 respectively.
| Characteristic | Number | Measure |
| Per Capita Income | 585 | $48,125 |
| Median Family Income | 159 | $101,964 |
| Mean Family Income | 159 | $162,593 |
| Median Household Income | 276 | $64,167 |
| Mean Household Income | 276 | $108,255 |
| Income Deficit | 159 | $0 |
| Wage / Income Gap (%) | 585 | 0.00% |
| Wage / Income Gap ($) | 585 | 100.00¢ per $1 |
| Gini / Inequality Index | 585 | 0.55 |
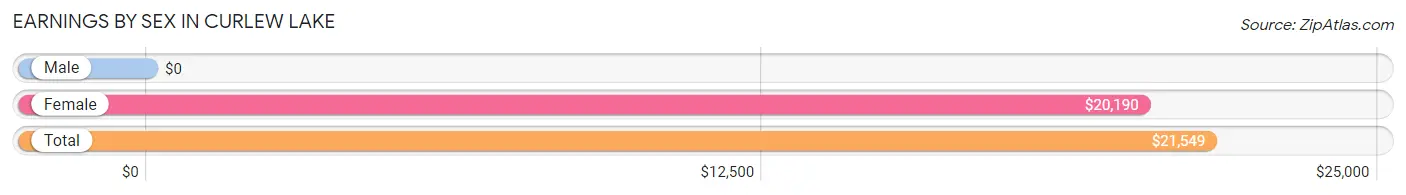
Earnings by Sex in Curlew Lake
| Sex | Number | Average Earnings |
| Male | 134 (45.7%) | $0 |
| Female | 159 (54.3%) | $20,190 |
| Total | 293 (100.0%) | $21,549 |
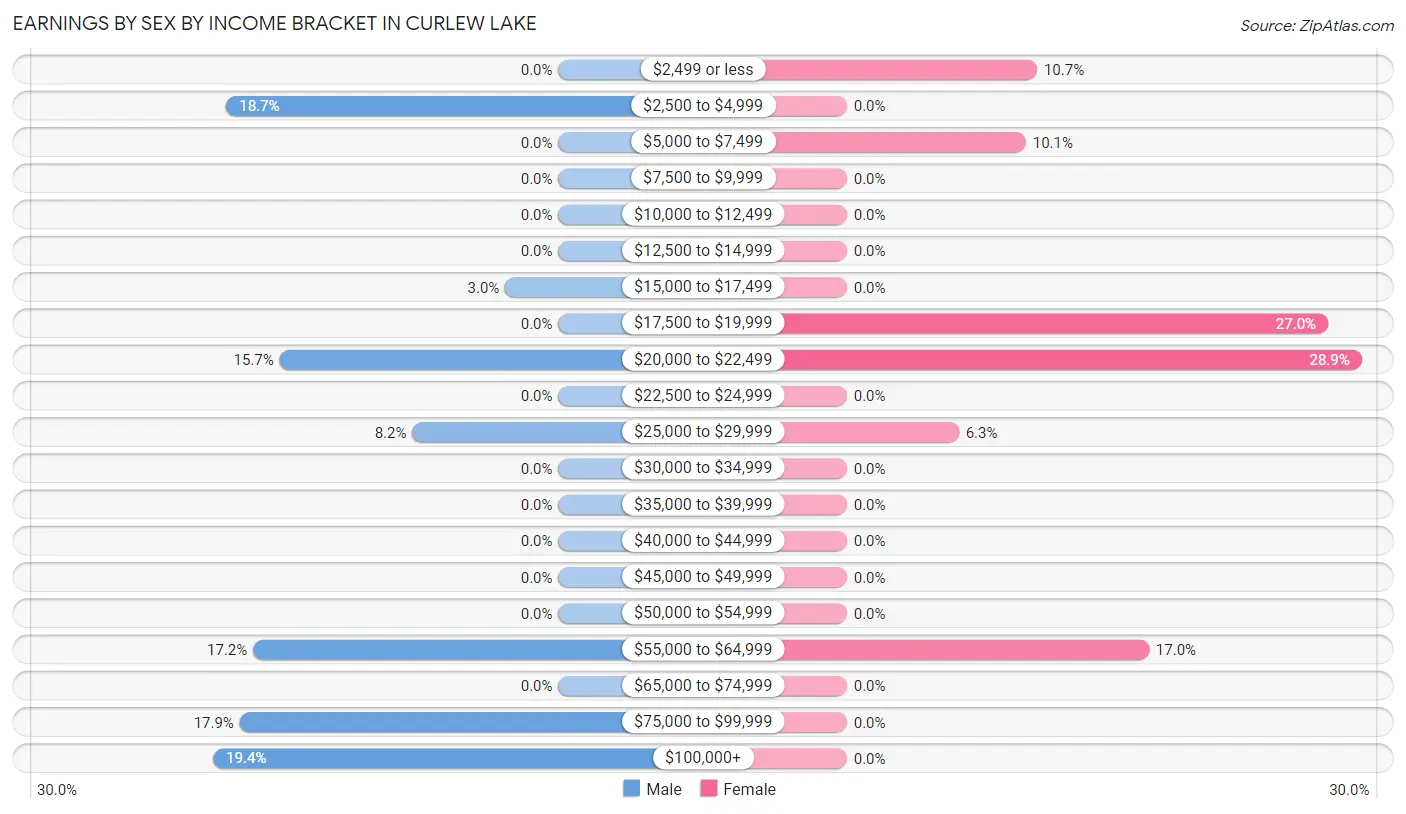
Earnings by Sex by Income Bracket in Curlew Lake
The most common earnings brackets in Curlew Lake are $100,000+ for men (26 | 19.4%) and $20,000 to $22,499 for women (46 | 28.9%).
| Income | Male | Female |
| $2,499 or less | 0 (0.0%) | 17 (10.7%) |
| $2,500 to $4,999 | 25 (18.7%) | 0 (0.0%) |
| $5,000 to $7,499 | 0 (0.0%) | 16 (10.1%) |
| $7,500 to $9,999 | 0 (0.0%) | 0 (0.0%) |
| $10,000 to $12,499 | 0 (0.0%) | 0 (0.0%) |
| $12,500 to $14,999 | 0 (0.0%) | 0 (0.0%) |
| $15,000 to $17,499 | 4 (3.0%) | 0 (0.0%) |
| $17,500 to $19,999 | 0 (0.0%) | 43 (27.0%) |
| $20,000 to $22,499 | 21 (15.7%) | 46 (28.9%) |
| $22,500 to $24,999 | 0 (0.0%) | 0 (0.0%) |
| $25,000 to $29,999 | 11 (8.2%) | 10 (6.3%) |
| $30,000 to $34,999 | 0 (0.0%) | 0 (0.0%) |
| $35,000 to $39,999 | 0 (0.0%) | 0 (0.0%) |
| $40,000 to $44,999 | 0 (0.0%) | 0 (0.0%) |
| $45,000 to $49,999 | 0 (0.0%) | 0 (0.0%) |
| $50,000 to $54,999 | 0 (0.0%) | 0 (0.0%) |
| $55,000 to $64,999 | 23 (17.2%) | 27 (17.0%) |
| $65,000 to $74,999 | 0 (0.0%) | 0 (0.0%) |
| $75,000 to $99,999 | 24 (17.9%) | 0 (0.0%) |
| $100,000+ | 26 (19.4%) | 0 (0.0%) |
| Total | 134 (100.0%) | 159 (100.0%) |
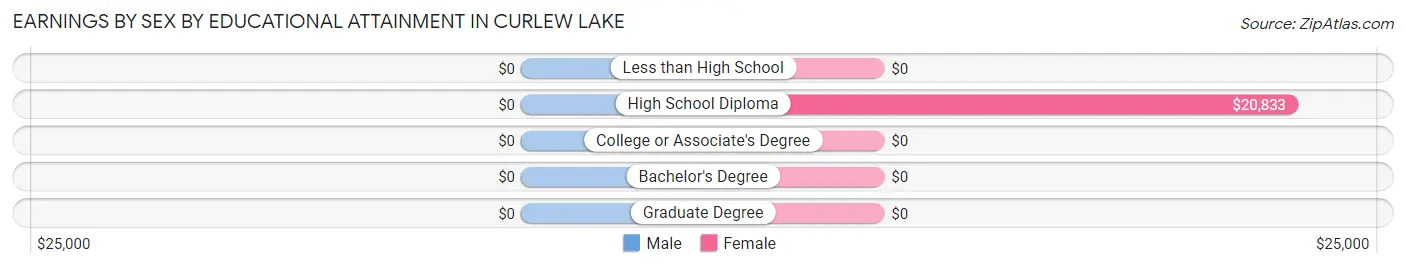
Earnings by Sex by Educational Attainment in Curlew Lake
| Educational Attainment | Male Income | Female Income |
| Less than High School | - | - |
| High School Diploma | - | - |
| College or Associate's Degree | - | - |
| Bachelor's Degree | - | - |
| Graduate Degree | - | - |
| Total | - | - |
Family Income in Curlew Lake
Family Income Brackets in Curlew Lake
According to the Curlew Lake family income data, there are 48 families falling into the $50,000 to $74,999 income range, which is the most common income bracket and makes up 30.2% of all families.
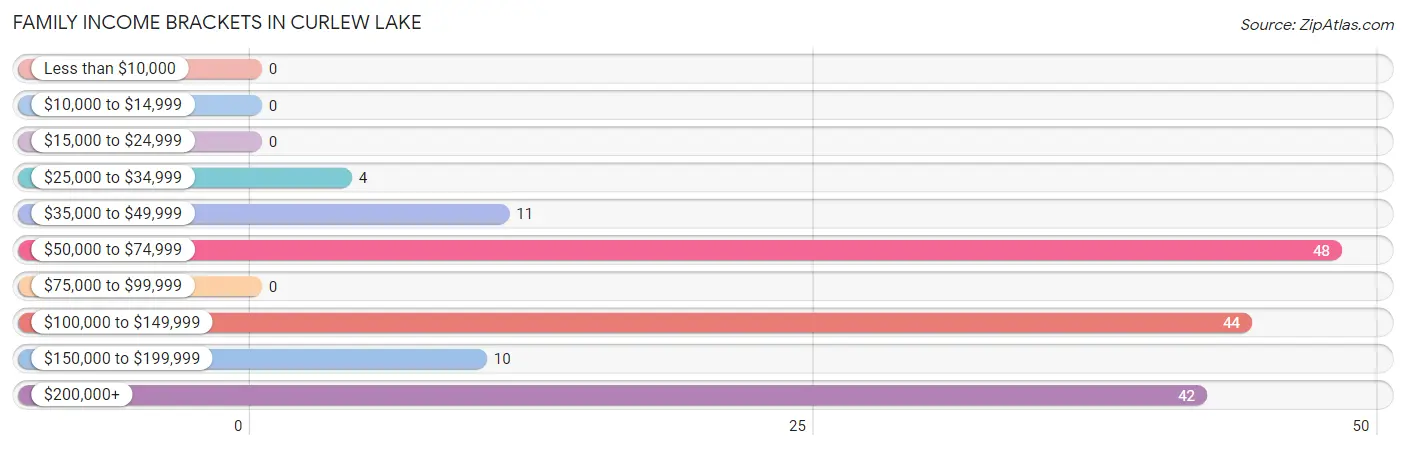
| Income Bracket | # Families | % Families |
| Less than $10,000 | 0 | 0.0% |
| $10,000 to $14,999 | 0 | 0.0% |
| $15,000 to $24,999 | 0 | 0.0% |
| $25,000 to $34,999 | 4 | 2.5% |
| $35,000 to $49,999 | 11 | 6.9% |
| $50,000 to $74,999 | 48 | 30.2% |
| $75,000 to $99,999 | 0 | 0.0% |
| $100,000 to $149,999 | 44 | 27.7% |
| $150,000 to $199,999 | 10 | 6.3% |
| $200,000+ | 42 | 26.4% |
Family Income by Famaliy Size in Curlew Lake
2-person families (125 | 78.6%) account for the highest median family income in Curlew Lake with $112,663 per family, while 2-person families (125 | 78.6%) have the highest median income of $56,332 per family member.
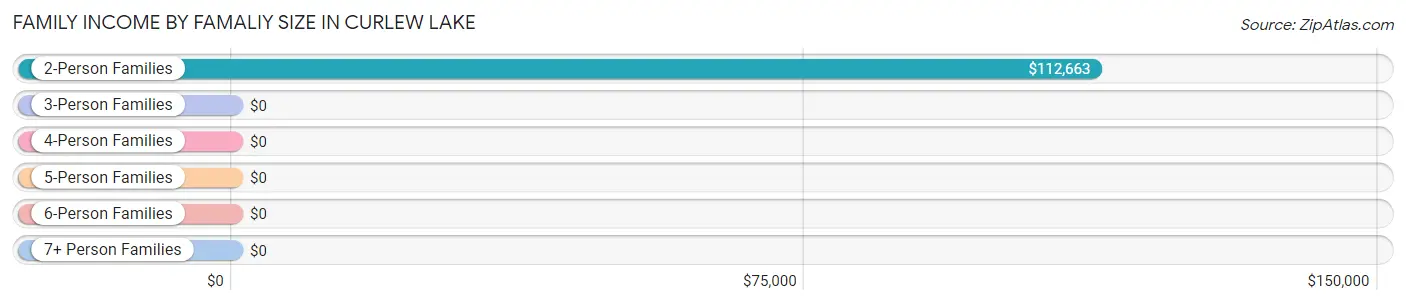
| Income Bracket | # Families | Median Income |
| 2-Person Families | 125 (78.6%) | $112,663 |
| 3-Person Families | 12 (7.5%) | $0 |
| 4-Person Families | 11 (6.9%) | $0 |
| 5-Person Families | 0 (0.0%) | $0 |
| 6-Person Families | 0 (0.0%) | $0 |
| 7+ Person Families | 11 (6.9%) | $0 |
| Total | 159 (100.0%) | $101,964 |
Family Income by Number of Earners in Curlew Lake
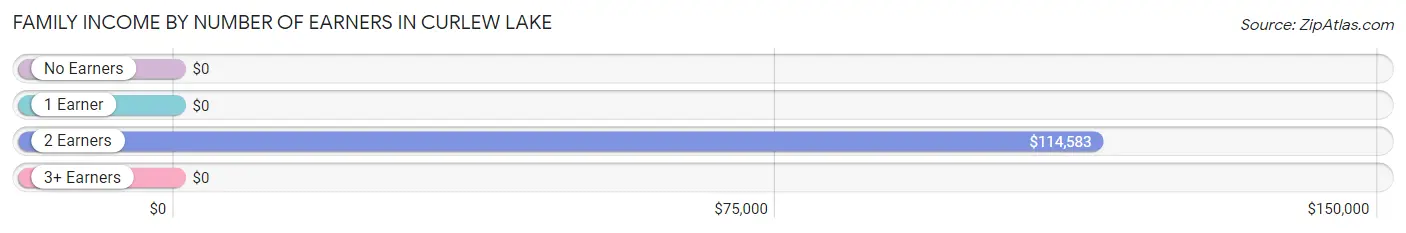
| Number of Earners | # Families | Median Income |
| No Earners | 32 (20.1%) | $0 |
| 1 Earner | 74 (46.5%) | $0 |
| 2 Earners | 42 (26.4%) | $114,583 |
| 3+ Earners | 11 (6.9%) | $0 |
| Total | 159 (100.0%) | $101,964 |
Household Income in Curlew Lake
Household Income Brackets in Curlew Lake
With 75 households falling in the category, the $50,000 to $74,999 income range is the most frequent in Curlew Lake, accounting for 27.2% of all households.
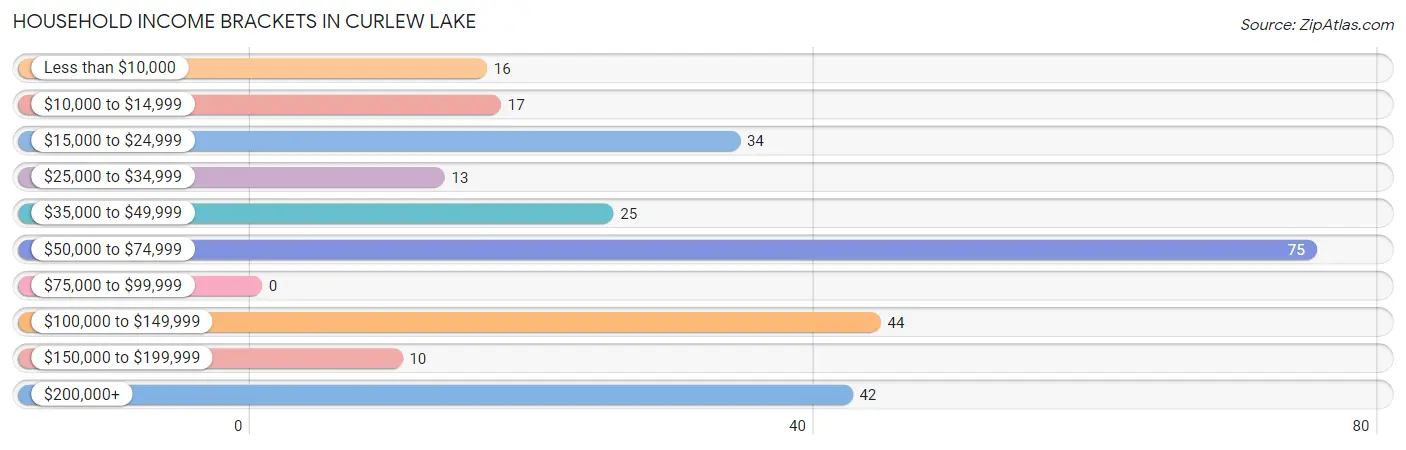
| Income Bracket | # Households | % Households |
| Less than $10,000 | 16 | 5.8% |
| $10,000 to $14,999 | 17 | 6.2% |
| $15,000 to $24,999 | 34 | 12.3% |
| $25,000 to $34,999 | 13 | 4.7% |
| $35,000 to $49,999 | 25 | 9.1% |
| $50,000 to $74,999 | 75 | 27.2% |
| $75,000 to $99,999 | 0 | 0.0% |
| $100,000 to $149,999 | 44 | 15.9% |
| $150,000 to $199,999 | 10 | 3.6% |
| $200,000+ | 42 | 15.2% |
Household Income by Householder Age in Curlew Lake
The median household income in Curlew Lake is $64,167, with the highest median household income of $72,778 found in the 45 to 64 years age bracket for the primary householder. A total of 130 households (47.1%) fall into this category.
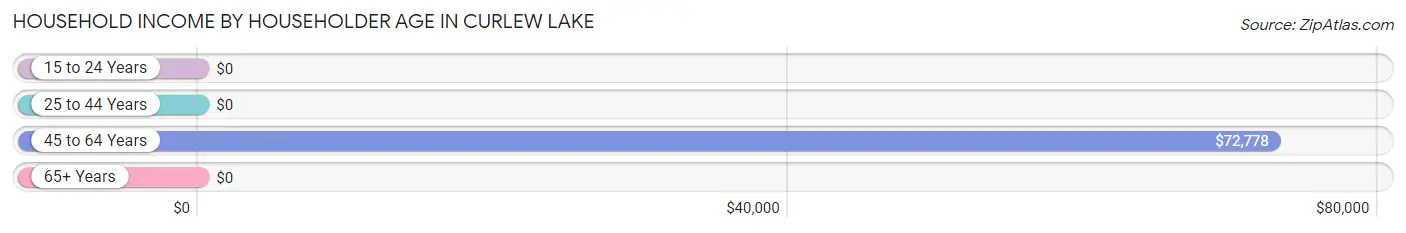
| Income Bracket | # Households | Median Income |
| 15 to 24 Years | 0 (0.0%) | $0 |
| 25 to 44 Years | 0 (0.0%) | $0 |
| 45 to 64 Years | 130 (47.1%) | $72,778 |
| 65+ Years | 146 (52.9%) | $0 |
| Total | 276 (100.0%) | $64,167 |
Poverty in Curlew Lake
Income Below Poverty by Sex and Age in Curlew Lake
With 7.6% poverty level for males and 7.4% for females among the residents of Curlew Lake, 35 to 44 year old males and 55 to 64 year old females are the most vulnerable to poverty, with 18 males (64.3%) and 16 females (24.2%) in their respective age groups living below the poverty level.
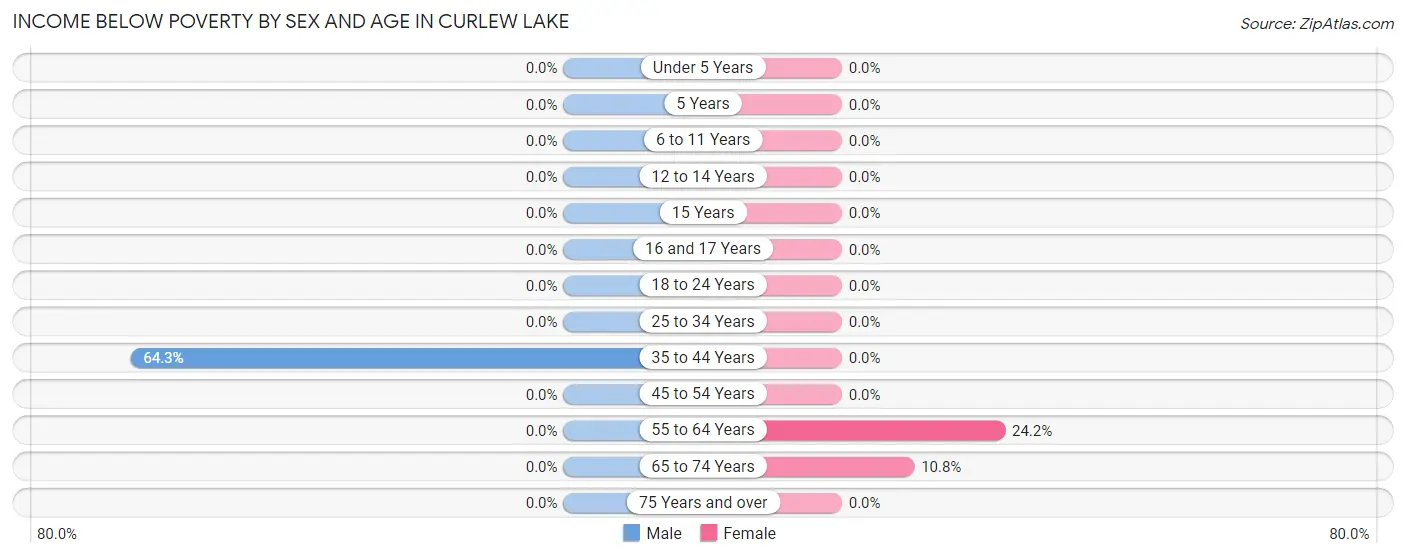
| Age Bracket | Male | Female |
| Under 5 Years | 0 (0.0%) | 0 (0.0%) |
| 5 Years | 0 (0.0%) | 0 (0.0%) |
| 6 to 11 Years | 0 (0.0%) | 0 (0.0%) |
| 12 to 14 Years | 0 (0.0%) | 0 (0.0%) |
| 15 Years | 0 (0.0%) | 0 (0.0%) |
| 16 and 17 Years | 0 (0.0%) | 0 (0.0%) |
| 18 to 24 Years | 0 (0.0%) | 0 (0.0%) |
| 25 to 34 Years | 0 (0.0%) | 0 (0.0%) |
| 35 to 44 Years | 18 (64.3%) | 0 (0.0%) |
| 45 to 54 Years | 0 (0.0%) | 0 (0.0%) |
| 55 to 64 Years | 0 (0.0%) | 16 (24.2%) |
| 65 to 74 Years | 0 (0.0%) | 10 (10.7%) |
| 75 Years and over | 0 (0.0%) | 0 (0.0%) |
| Total | 18 (7.6%) | 26 (7.4%) |
Income Above Poverty by Sex and Age in Curlew Lake
According to the poverty statistics in Curlew Lake, males aged 12 to 14 years and females aged under 5 years are the age groups that are most secure financially, with 100.0% of males and 100.0% of females in these age groups living above the poverty line.
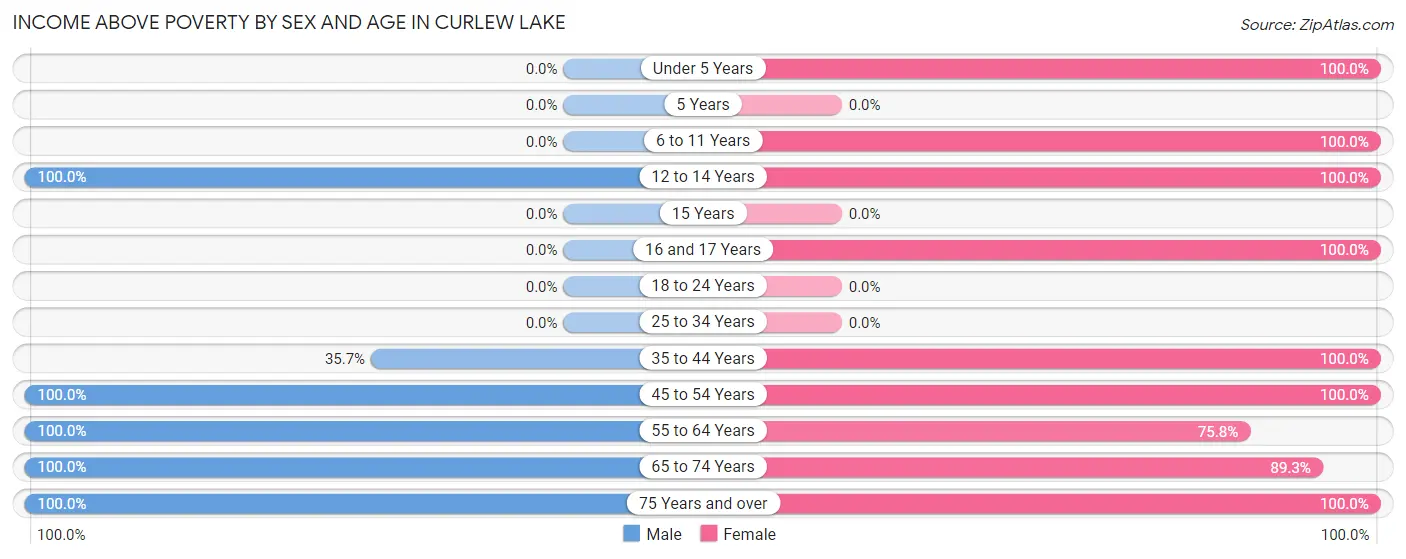
| Age Bracket | Male | Female |
| Under 5 Years | 0 (0.0%) | 11 (100.0%) |
| 5 Years | 0 (0.0%) | 0 (0.0%) |
| 6 to 11 Years | 0 (0.0%) | 33 (100.0%) |
| 12 to 14 Years | 31 (100.0%) | 12 (100.0%) |
| 15 Years | 0 (0.0%) | 0 (0.0%) |
| 16 and 17 Years | 0 (0.0%) | 7 (100.0%) |
| 18 to 24 Years | 0 (0.0%) | 0 (0.0%) |
| 25 to 34 Years | 0 (0.0%) | 0 (0.0%) |
| 35 to 44 Years | 10 (35.7%) | 15 (100.0%) |
| 45 to 54 Years | 42 (100.0%) | 77 (100.0%) |
| 55 to 64 Years | 19 (100.0%) | 50 (75.8%) |
| 65 to 74 Years | 72 (100.0%) | 83 (89.2%) |
| 75 Years and over | 44 (100.0%) | 35 (100.0%) |
| Total | 218 (92.4%) | 323 (92.5%) |
Income Below Poverty Among Married-Couple Families in Curlew Lake
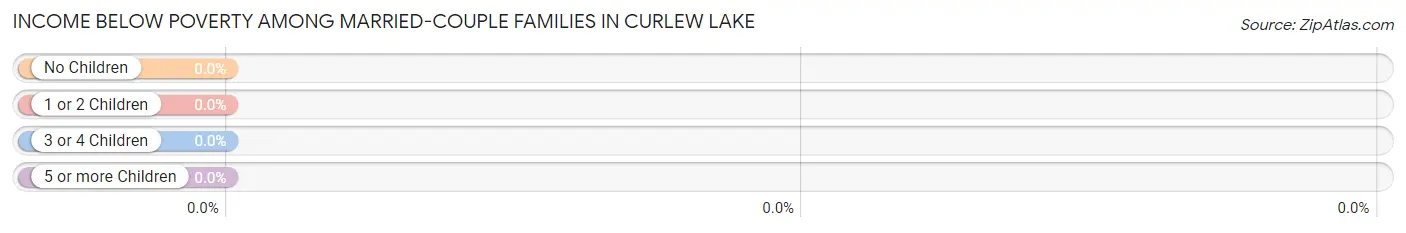
| Children | Above Poverty | Below Poverty |
| No Children | 125 (100.0%) | 0 (0.0%) |
| 1 or 2 Children | 22 (100.0%) | 0 (0.0%) |
| 3 or 4 Children | 0 (0.0%) | 0 (0.0%) |
| 5 or more Children | 0 (0.0%) | 0 (0.0%) |
| Total | 147 (100.0%) | 0 (0.0%) |
Income Below Poverty Among Single-Parent Households in Curlew Lake
| Children | Single Father | Single Mother |
| No Children | 0 (0.0%) | 0 (0.0%) |
| 1 or 2 Children | 0 (0.0%) | 0 (0.0%) |
| 3 or 4 Children | 0 (0.0%) | 0 (0.0%) |
| 5 or more Children | 0 (0.0%) | 0 (0.0%) |
| Total | 0 (0.0%) | 0 (0.0%) |
Income Below Poverty Among Married-Couple vs Single-Parent Households in Curlew Lake
| Children | Married-Couple Families | Single-Parent Households |
| No Children | 0 (0.0%) | 0 (0.0%) |
| 1 or 2 Children | 0 (0.0%) | 0 (0.0%) |
| 3 or 4 Children | 0 (0.0%) | 0 (0.0%) |
| 5 or more Children | 0 (0.0%) | 0 (0.0%) |
| Total | 0 (0.0%) | 0 (0.0%) |
Race in Curlew Lake
The most populous races in Curlew Lake are White / Caucasian (563 | 96.2%), Two or more Races (22 | 3.8%), and Hispanic or Latino (17 | 2.9%).
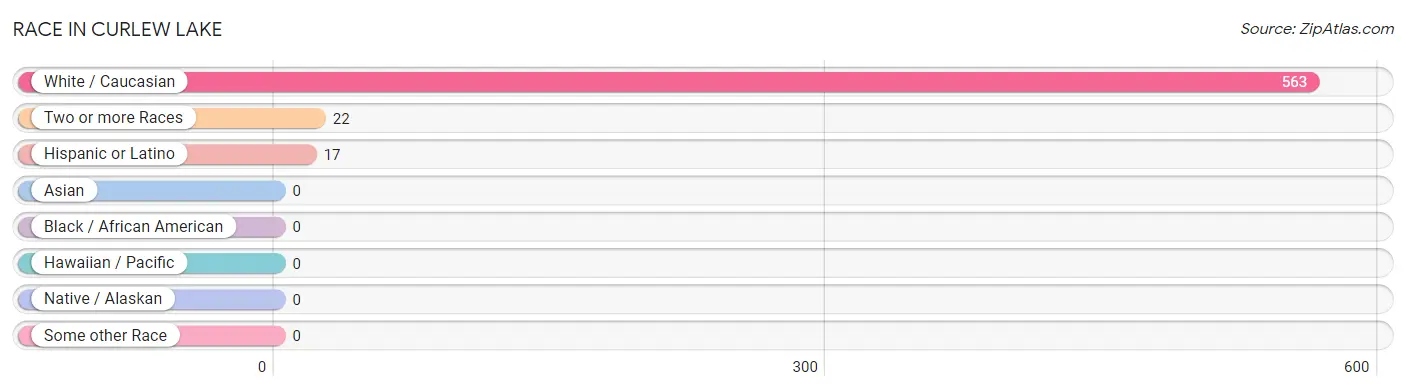
| Race | # Population | % Population |
| Asian | 0 | 0.0% |
| Black / African American | 0 | 0.0% |
| Hawaiian / Pacific | 0 | 0.0% |
| Hispanic or Latino | 17 | 2.9% |
| Native / Alaskan | 0 | 0.0% |
| White / Caucasian | 563 | 96.2% |
| Two or more Races | 22 | 3.8% |
| Some other Race | 0 | 0.0% |
| Total | 585 | 100.0% |
Ancestry in Curlew Lake
The most populous ancestries reported in Curlew Lake are Irish (144 | 24.6%), German (139 | 23.8%), English (97 | 16.6%), Polish (71 | 12.1%), and Norwegian (50 | 8.6%), together accounting for 85.6% of all Curlew Lake residents.
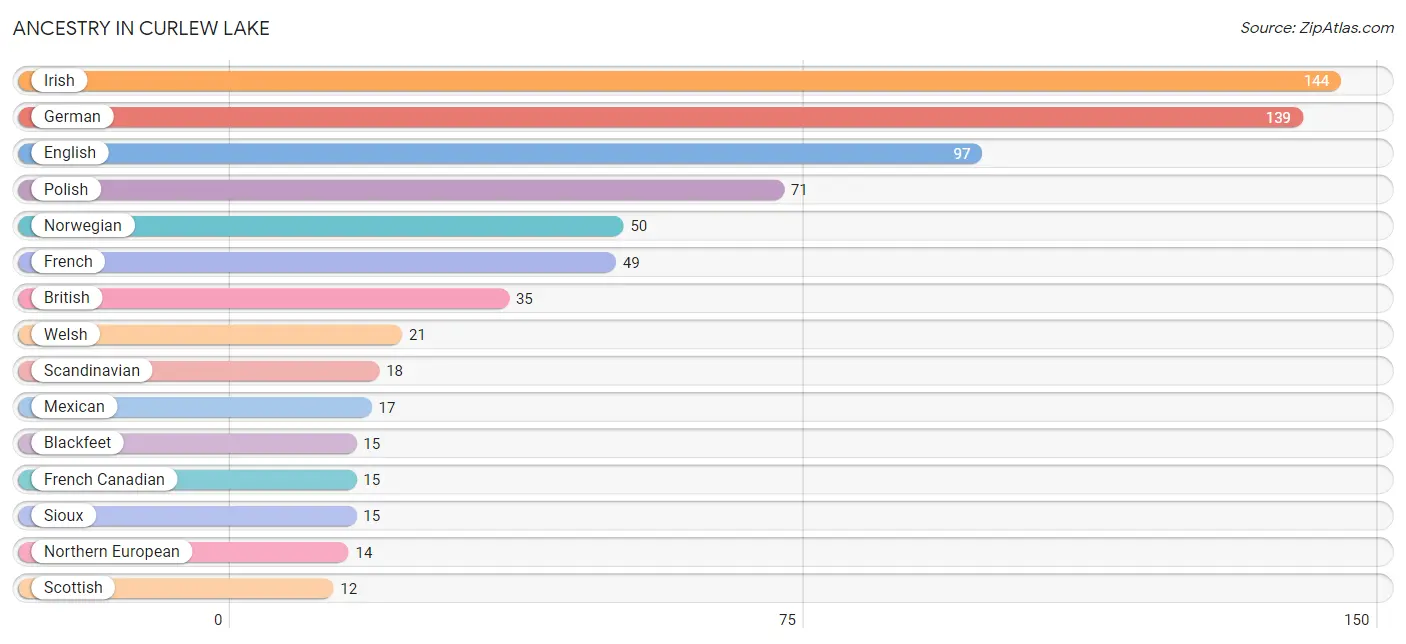
| Ancestry | # Population | % Population |
| Blackfeet | 15 | 2.6% |
| British | 35 | 6.0% |
| Chippewa | 7 | 1.2% |
| Danish | 11 | 1.9% |
| English | 97 | 16.6% |
| French | 49 | 8.4% |
| French Canadian | 15 | 2.6% |
| German | 139 | 23.8% |
| Greek | 9 | 1.5% |
| Irish | 144 | 24.6% |
| Lithuanian | 11 | 1.9% |
| Mexican | 17 | 2.9% |
| Northern European | 14 | 2.4% |
| Norwegian | 50 | 8.6% |
| Polish | 71 | 12.1% |
| Scandinavian | 18 | 3.1% |
| Scotch-Irish | 9 | 1.5% |
| Scottish | 12 | 2.1% |
| Sioux | 15 | 2.6% |
| Welsh | 21 | 3.6% | View All 20 Rows |
Immigrants in Curlew Lake
The most numerous immigrant groups reported in Curlew Lake came from Eastern Europe (10 | 1.7%), Europe (10 | 1.7%), and Poland (10 | 1.7%), together accounting for 5.1% of all Curlew Lake residents.
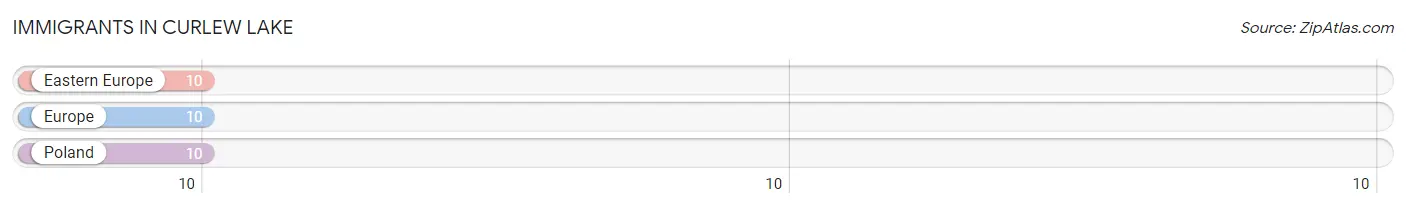
| Immigration Origin | # Population | % Population |
| Eastern Europe | 10 | 1.7% |
| Europe | 10 | 1.7% |
| Poland | 10 | 1.7% | View All 3 Rows |
Sex and Age in Curlew Lake
Sex and Age in Curlew Lake
The most populous age groups in Curlew Lake are 70 to 74 Years (37 | 15.7%) for men and 70 to 74 Years (75 | 21.5%) for women.
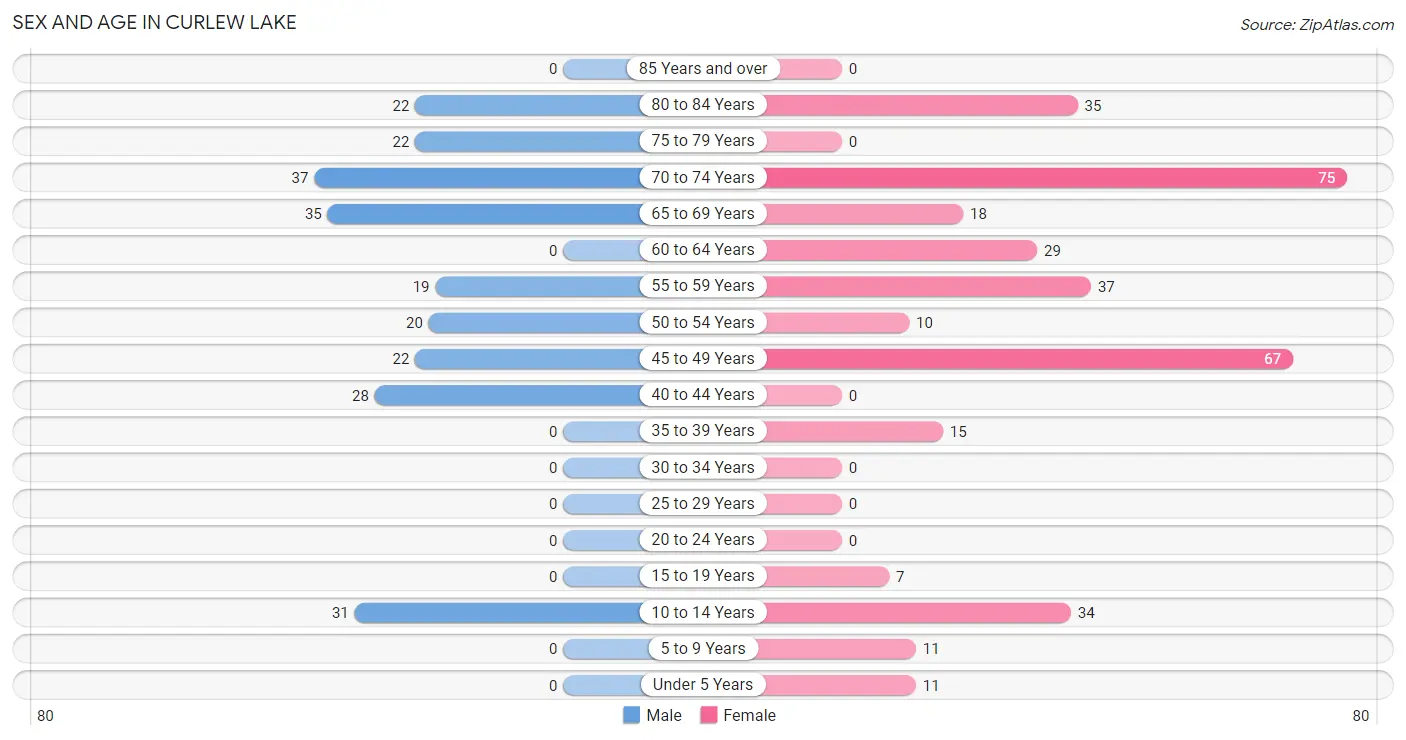
| Age Bracket | Male | Female |
| Under 5 Years | 0 (0.0%) | 11 (3.2%) |
| 5 to 9 Years | 0 (0.0%) | 11 (3.2%) |
| 10 to 14 Years | 31 (13.1%) | 34 (9.7%) |
| 15 to 19 Years | 0 (0.0%) | 7 (2.0%) |
| 20 to 24 Years | 0 (0.0%) | 0 (0.0%) |
| 25 to 29 Years | 0 (0.0%) | 0 (0.0%) |
| 30 to 34 Years | 0 (0.0%) | 0 (0.0%) |
| 35 to 39 Years | 0 (0.0%) | 15 (4.3%) |
| 40 to 44 Years | 28 (11.9%) | 0 (0.0%) |
| 45 to 49 Years | 22 (9.3%) | 67 (19.2%) |
| 50 to 54 Years | 20 (8.5%) | 10 (2.9%) |
| 55 to 59 Years | 19 (8.1%) | 37 (10.6%) |
| 60 to 64 Years | 0 (0.0%) | 29 (8.3%) |
| 65 to 69 Years | 35 (14.8%) | 18 (5.2%) |
| 70 to 74 Years | 37 (15.7%) | 75 (21.5%) |
| 75 to 79 Years | 22 (9.3%) | 0 (0.0%) |
| 80 to 84 Years | 22 (9.3%) | 35 (10.0%) |
| 85 Years and over | 0 (0.0%) | 0 (0.0%) |
| Total | 236 (100.0%) | 349 (100.0%) |
Families and Households in Curlew Lake
Median Family Size in Curlew Lake
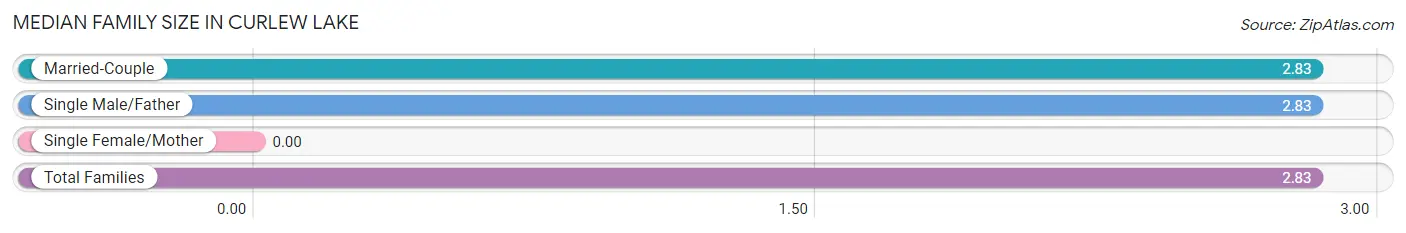
| Family Type | # Families | Family Size |
| Married-Couple | 147 (92.4%) | 2.83 |
| Single Male/Father | 12 (7.5%) | 2.83 |
| Single Female/Mother | 0 (0.0%) | - |
| Total Families | 159 (100.0%) | 2.83 |
Median Household Size in Curlew Lake
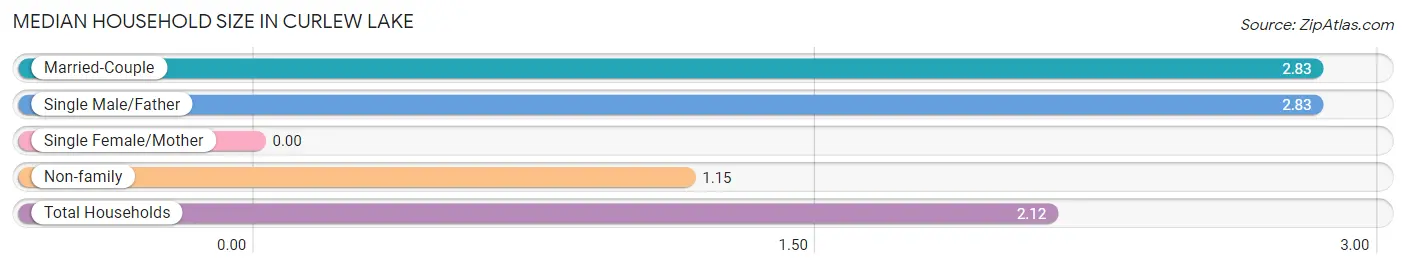
| Household Type | # Households | Household Size |
| Married-Couple | 147 (53.3%) | 2.83 |
| Single Male/Father | 12 (4.3%) | 2.83 |
| Single Female/Mother | 0 (0.0%) | - |
| Non-family | 117 (42.4%) | 1.15 |
| Total Households | 276 (100.0%) | 2.12 |
Household Size by Marriage Status in Curlew Lake
Out of a total of 276 households in Curlew Lake, 159 (57.6%) are family households, while 117 (42.4%) are nonfamily households. The most numerous type of family households are 2-person households, comprising 125, and the most common type of nonfamily households are 1-person households, comprising 90.
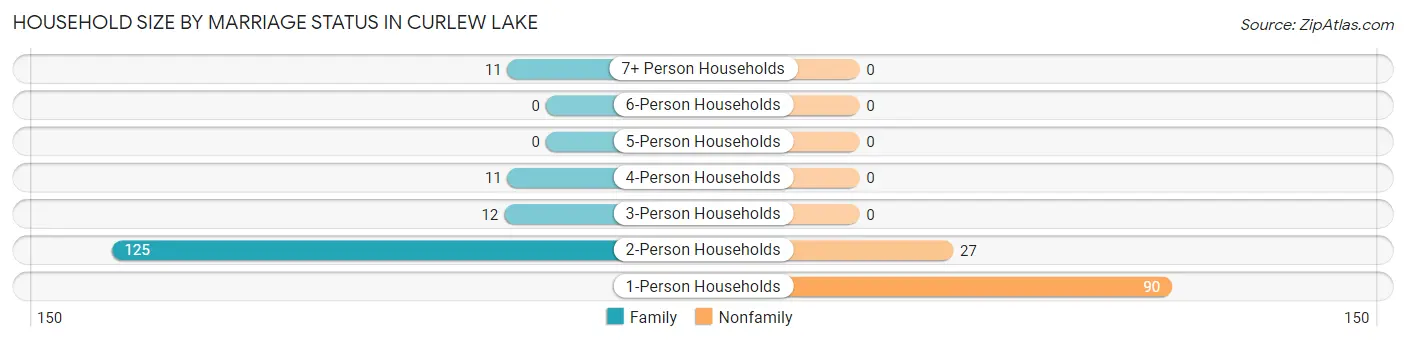
| Household Size | Family Households | Nonfamily Households |
| 1-Person Households | - | 90 (32.6%) |
| 2-Person Households | 125 (45.3%) | 27 (9.8%) |
| 3-Person Households | 12 (4.3%) | 0 (0.0%) |
| 4-Person Households | 11 (4.0%) | 0 (0.0%) |
| 5-Person Households | 0 (0.0%) | 0 (0.0%) |
| 6-Person Households | 0 (0.0%) | 0 (0.0%) |
| 7+ Person Households | 11 (4.0%) | 0 (0.0%) |
| Total | 159 (57.6%) | 117 (42.4%) |
Female Fertility in Curlew Lake
Fertility by Age in Curlew Lake
| Age Bracket | Women with Births | Births / 1,000 Women |
| 15 to 19 years | 0 (0.0%) | 0.0 |
| 20 to 34 years | 0 (0.0%) | 0.0 |
| 35 to 50 years | 0 (0.0%) | 0.0 |
| Total | 0 (0.0%) | 0.0 |
Fertility by Age by Marriage Status in Curlew Lake
| Age Bracket | Married | Unmarried |
| 15 to 19 years | 0 (0.0%) | 0 (0.0%) |
| 20 to 34 years | 0 (0.0%) | 0 (0.0%) |
| 35 to 50 years | 0 (0.0%) | 0 (0.0%) |
| Total | 0 (0.0%) | 0 (0.0%) |
Fertility by Education in Curlew Lake
| Educational Attainment | Women with Births | Births / 1,000 Women |
| Less than High School | 0 (0.0%) | 0.0 |
| High School Diploma | 0 (0.0%) | 0.0 |
| College or Associate's Degree | 0 (0.0%) | 0.0 |
| Bachelor's Degree | 0 (0.0%) | 0.0 |
| Graduate Degree | 0 (0.0%) | 0.0 |
| Total | 0 (0.0%) | 0.0 |
Fertility by Education by Marriage Status in Curlew Lake
| Educational Attainment | Married | Unmarried |
| Less than High School | 0 (0.0%) | 0 (0.0%) |
| High School Diploma | 0 (0.0%) | 0 (0.0%) |
| College or Associate's Degree | 0 (0.0%) | 0 (0.0%) |
| Bachelor's Degree | 0 (0.0%) | 0 (0.0%) |
| Graduate Degree | 0 (0.0%) | 0 (0.0%) |
| Total | 0 (0.0%) | 0 (0.0%) |
Employment Characteristics in Curlew Lake
Employment by Class of Employer in Curlew Lake
Among the 234 employed individuals in Curlew Lake, private company employees (70 | 29.9%), local government employees (54 | 23.1%), and self-employed (incorporated) (52 | 22.2%) make up the most common classes of employment.
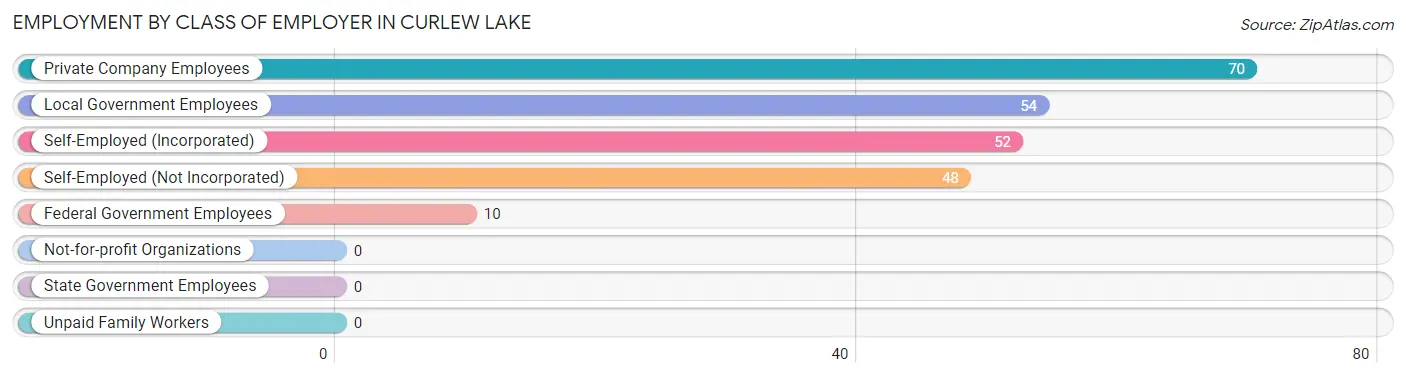
| Employer Class | # Employees | % Employees |
| Private Company Employees | 70 | 29.9% |
| Self-Employed (Incorporated) | 52 | 22.2% |
| Self-Employed (Not Incorporated) | 48 | 20.5% |
| Not-for-profit Organizations | 0 | 0.0% |
| Local Government Employees | 54 | 23.1% |
| State Government Employees | 0 | 0.0% |
| Federal Government Employees | 10 | 4.3% |
| Unpaid Family Workers | 0 | 0.0% |
| Total | 234 | 100.0% |
Employment Status by Age in Curlew Lake
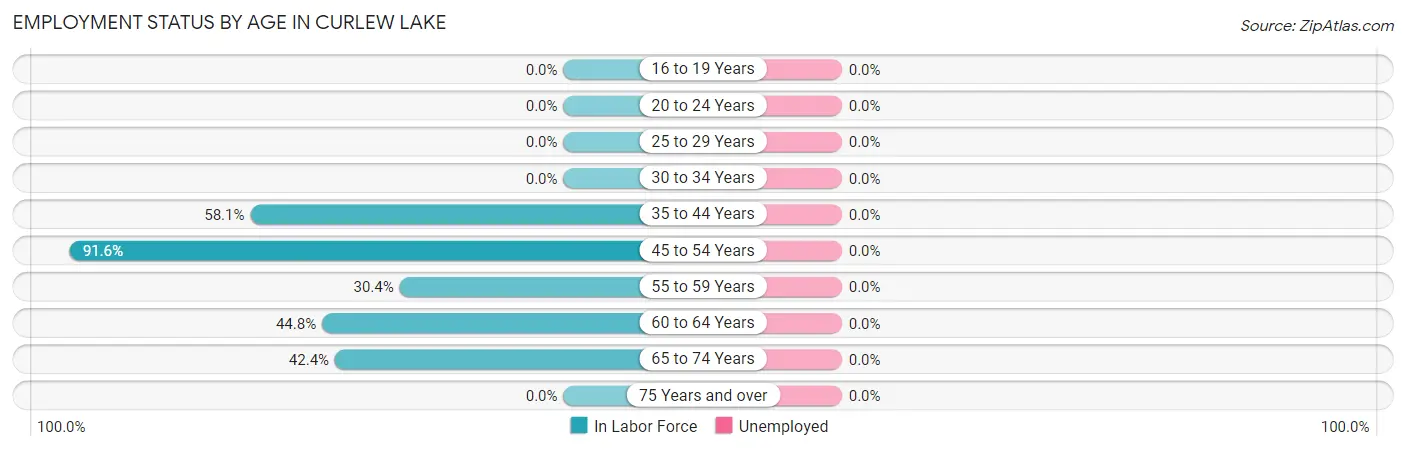
| Age Bracket | In Labor Force | Unemployed |
| 16 to 19 Years | 0 (0.0%) | 0 (0.0%) |
| 20 to 24 Years | 0 (0.0%) | 0 (0.0%) |
| 25 to 29 Years | 0 (0.0%) | 0 (0.0%) |
| 30 to 34 Years | 0 (0.0%) | 0 (0.0%) |
| 35 to 44 Years | 25 (58.1%) | 0 (0.0%) |
| 45 to 54 Years | 109 (91.6%) | 0 (0.0%) |
| 55 to 59 Years | 17 (30.4%) | 0 (0.0%) |
| 60 to 64 Years | 13 (44.8%) | 0 (0.0%) |
| 65 to 74 Years | 70 (42.4%) | 0 (0.0%) |
| 75 Years and over | 0 (0.0%) | 0 (0.0%) |
| Total | 234 (47.0%) | 0 (0.0%) |
Employment Status by Educational Attainment in Curlew Lake
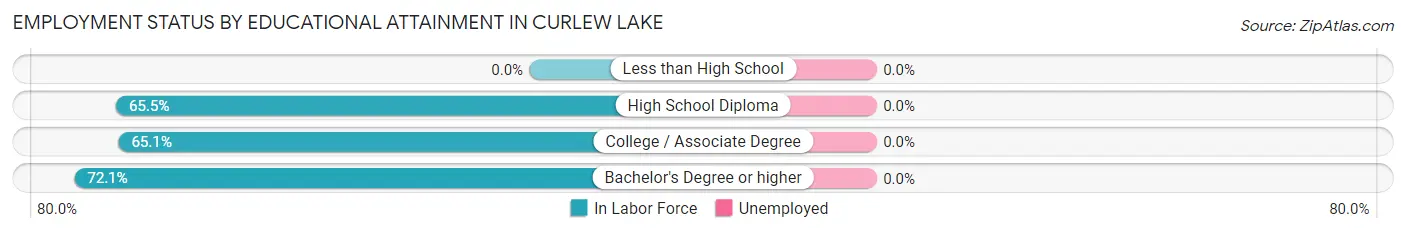
| Educational Attainment | In Labor Force | Unemployed |
| Less than High School | 0 (0.0%) | 0 (0.0%) |
| High School Diploma | 38 (65.5%) | 0 (0.0%) |
| College / Associate Degree | 95 (65.1%) | 0 (0.0%) |
| Bachelor's Degree or higher | 31 (72.1%) | 0 (0.0%) |
| Total | 164 (66.4%) | 0 (0.0%) |
Employment Occupations by Sex in Curlew Lake
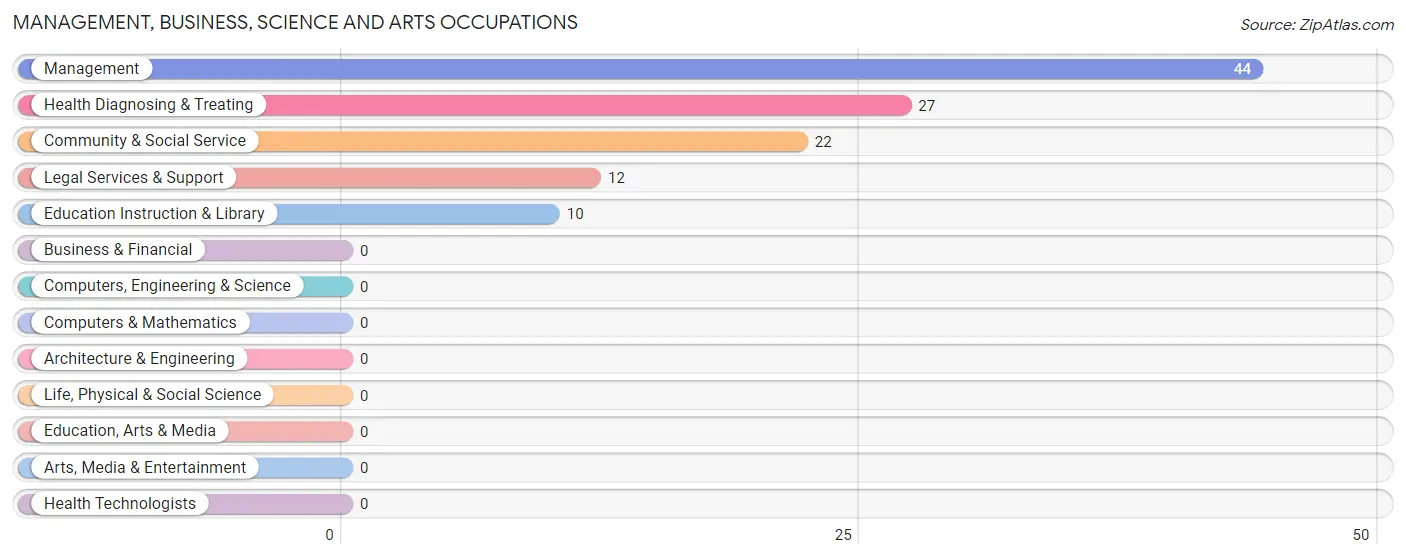
Management, Business, Science and Arts Occupations
The most common Management, Business, Science and Arts occupations in Curlew Lake are Management (44 | 18.8%), Health Diagnosing & Treating (27 | 11.5%), Community & Social Service (22 | 9.4%), Legal Services & Support (12 | 5.1%), and Education Instruction & Library (10 | 4.3%).
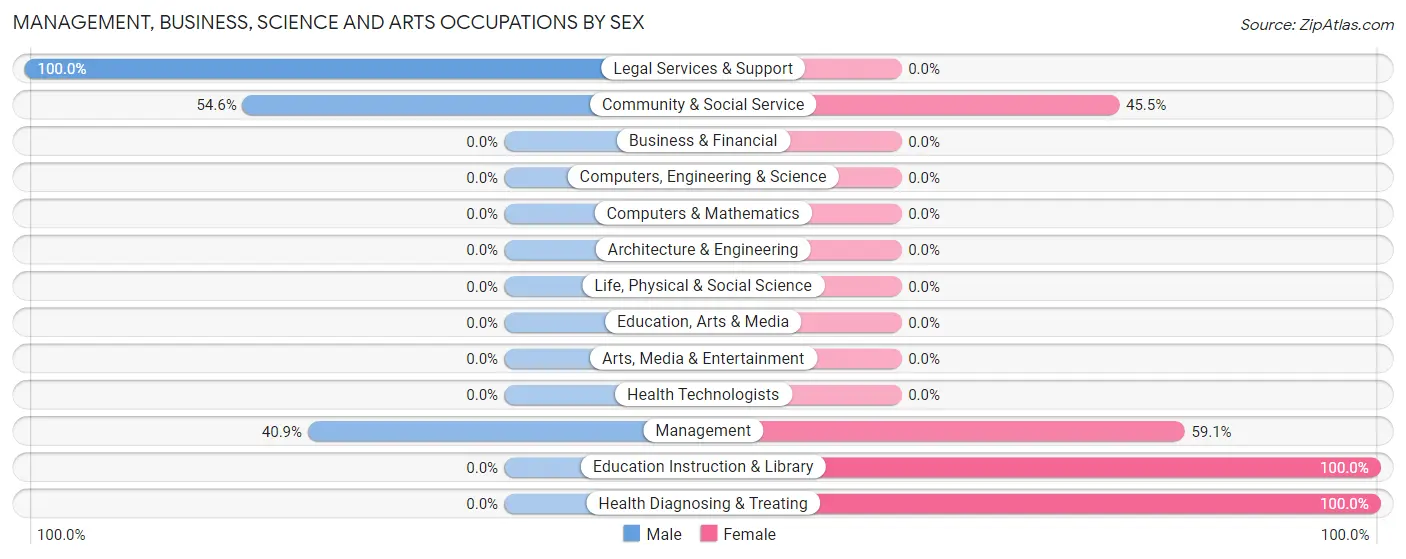
Management, Business, Science and Arts Occupations by Sex
Within the Management, Business, Science and Arts occupations in Curlew Lake, the most male-oriented occupations are Legal Services & Support (100.0%), Community & Social Service (54.5%), and Management (40.9%), while the most female-oriented occupations are Education Instruction & Library (100.0%), Health Diagnosing & Treating (100.0%), and Management (59.1%).
| Occupation | Male | Female |
| Management | 18 (40.9%) | 26 (59.1%) |
| Business & Financial | 0 (0.0%) | 0 (0.0%) |
| Computers, Engineering & Science | 0 (0.0%) | 0 (0.0%) |
| Computers & Mathematics | 0 (0.0%) | 0 (0.0%) |
| Architecture & Engineering | 0 (0.0%) | 0 (0.0%) |
| Life, Physical & Social Science | 0 (0.0%) | 0 (0.0%) |
| Community & Social Service | 12 (54.5%) | 10 (45.5%) |
| Education, Arts & Media | 0 (0.0%) | 0 (0.0%) |
| Legal Services & Support | 12 (100.0%) | 0 (0.0%) |
| Education Instruction & Library | 0 (0.0%) | 10 (100.0%) |
| Arts, Media & Entertainment | 0 (0.0%) | 0 (0.0%) |
| Health Diagnosing & Treating | 0 (0.0%) | 27 (100.0%) |
| Health Technologists | 0 (0.0%) | 0 (0.0%) |
| Total (Category) | 30 (32.3%) | 63 (67.7%) |
| Total (Overall) | 118 (50.4%) | 116 (49.6%) |
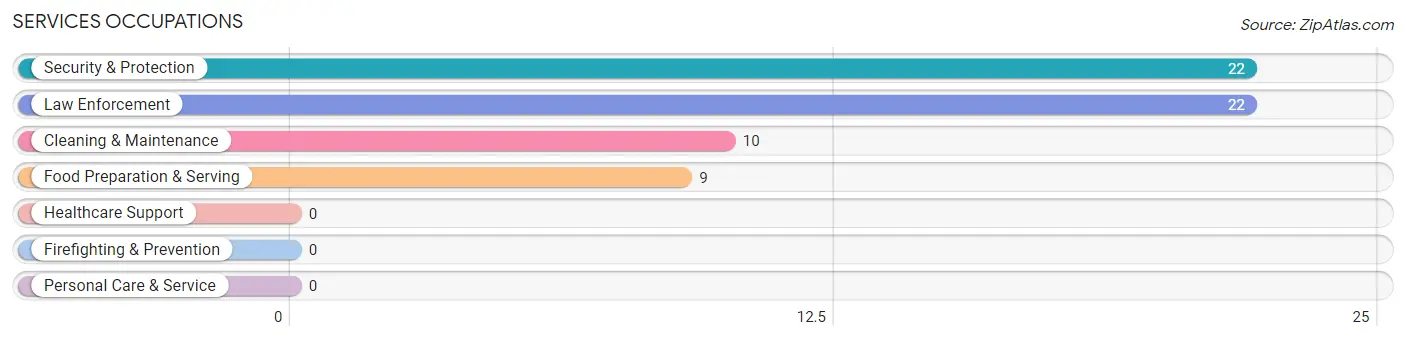
Services Occupations
The most common Services occupations in Curlew Lake are Security & Protection (22 | 9.4%), Law Enforcement (22 | 9.4%), Cleaning & Maintenance (10 | 4.3%), and Food Preparation & Serving (9 | 3.8%).
Services Occupations by Sex
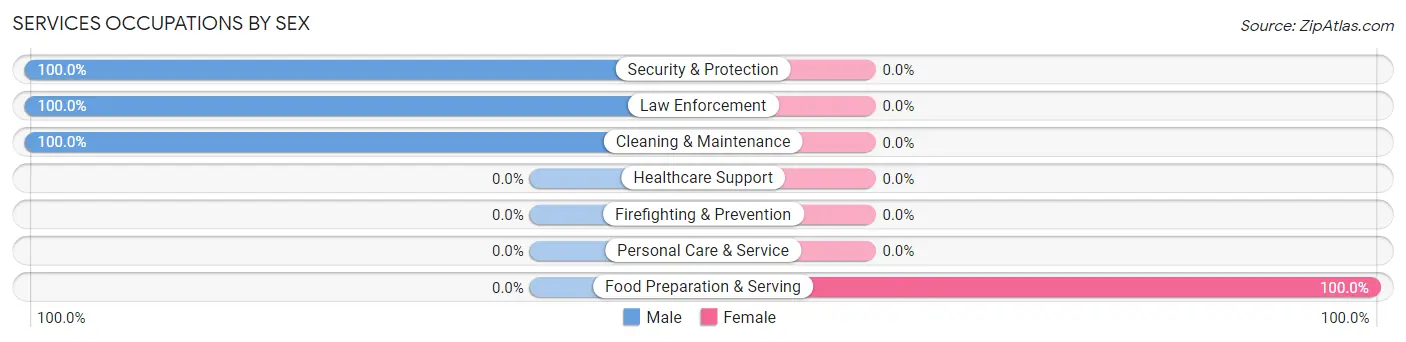
| Occupation | Male | Female |
| Healthcare Support | 0 (0.0%) | 0 (0.0%) |
| Security & Protection | 22 (100.0%) | 0 (0.0%) |
| Firefighting & Prevention | 0 (0.0%) | 0 (0.0%) |
| Law Enforcement | 22 (100.0%) | 0 (0.0%) |
| Food Preparation & Serving | 0 (0.0%) | 9 (100.0%) |
| Cleaning & Maintenance | 10 (100.0%) | 0 (0.0%) |
| Personal Care & Service | 0 (0.0%) | 0 (0.0%) |
| Total (Category) | 32 (78.0%) | 9 (22.0%) |
| Total (Overall) | 118 (50.4%) | 116 (49.6%) |
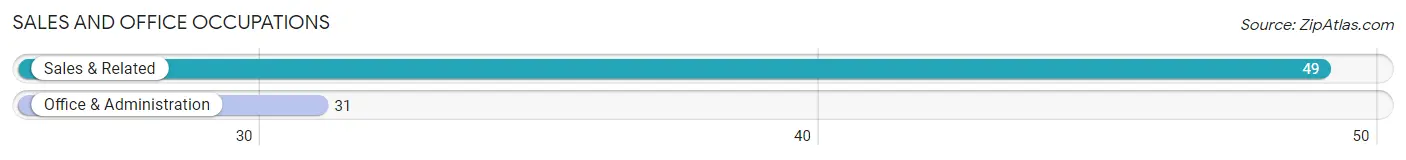
Sales and Office Occupations
The most common Sales and Office occupations in Curlew Lake are Sales & Related (49 | 20.9%), and Office & Administration (31 | 13.3%).
Sales and Office Occupations by Sex
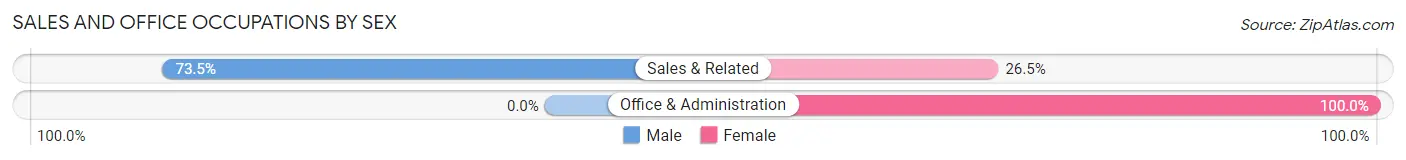
| Occupation | Male | Female |
| Sales & Related | 36 (73.5%) | 13 (26.5%) |
| Office & Administration | 0 (0.0%) | 31 (100.0%) |
| Total (Category) | 36 (45.0%) | 44 (55.0%) |
| Total (Overall) | 118 (50.4%) | 116 (49.6%) |
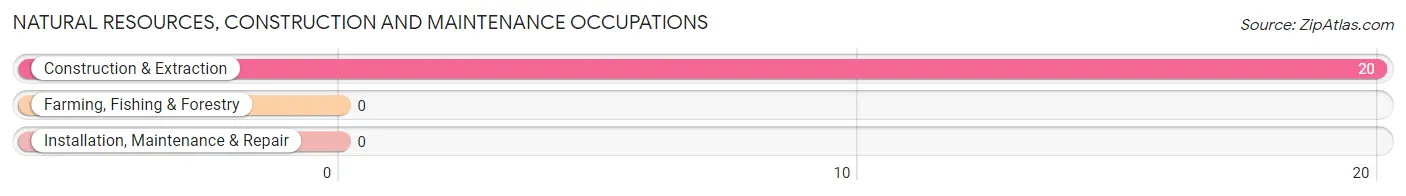
Natural Resources, Construction and Maintenance Occupations
The most common Natural Resources, Construction and Maintenance occupations in Curlew Lake are , and Construction & Extraction (20 | 8.6%).
Natural Resources, Construction and Maintenance Occupations by Sex
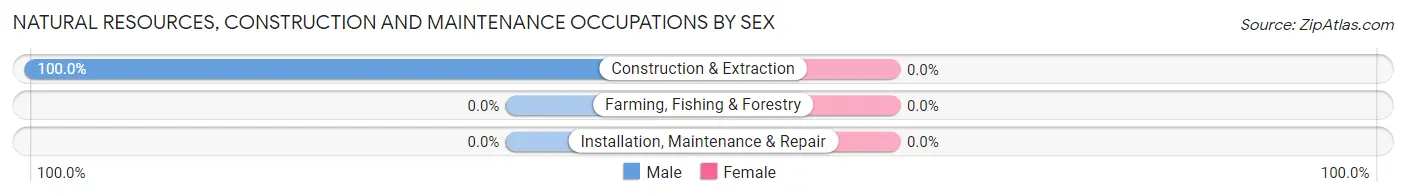
| Occupation | Male | Female |
| Farming, Fishing & Forestry | 0 (0.0%) | 0 (0.0%) |
| Construction & Extraction | 20 (100.0%) | 0 (0.0%) |
| Installation, Maintenance & Repair | 0 (0.0%) | 0 (0.0%) |
| Total (Category) | 20 (100.0%) | 0 (0.0%) |
| Total (Overall) | 118 (50.4%) | 116 (49.6%) |
Production, Transportation and Moving Occupations
Production, Transportation and Moving Occupations by Sex
| Occupation | Male | Female |
| Production | 0 (0.0%) | 0 (0.0%) |
| Transportation | 0 (0.0%) | 0 (0.0%) |
| Material Moving | 0 (0.0%) | 0 (0.0%) |
| Total (Category) | 0 (0.0%) | 0 (0.0%) |
| Total (Overall) | 118 (50.4%) | 116 (49.6%) |
Employment Industries by Sex in Curlew Lake
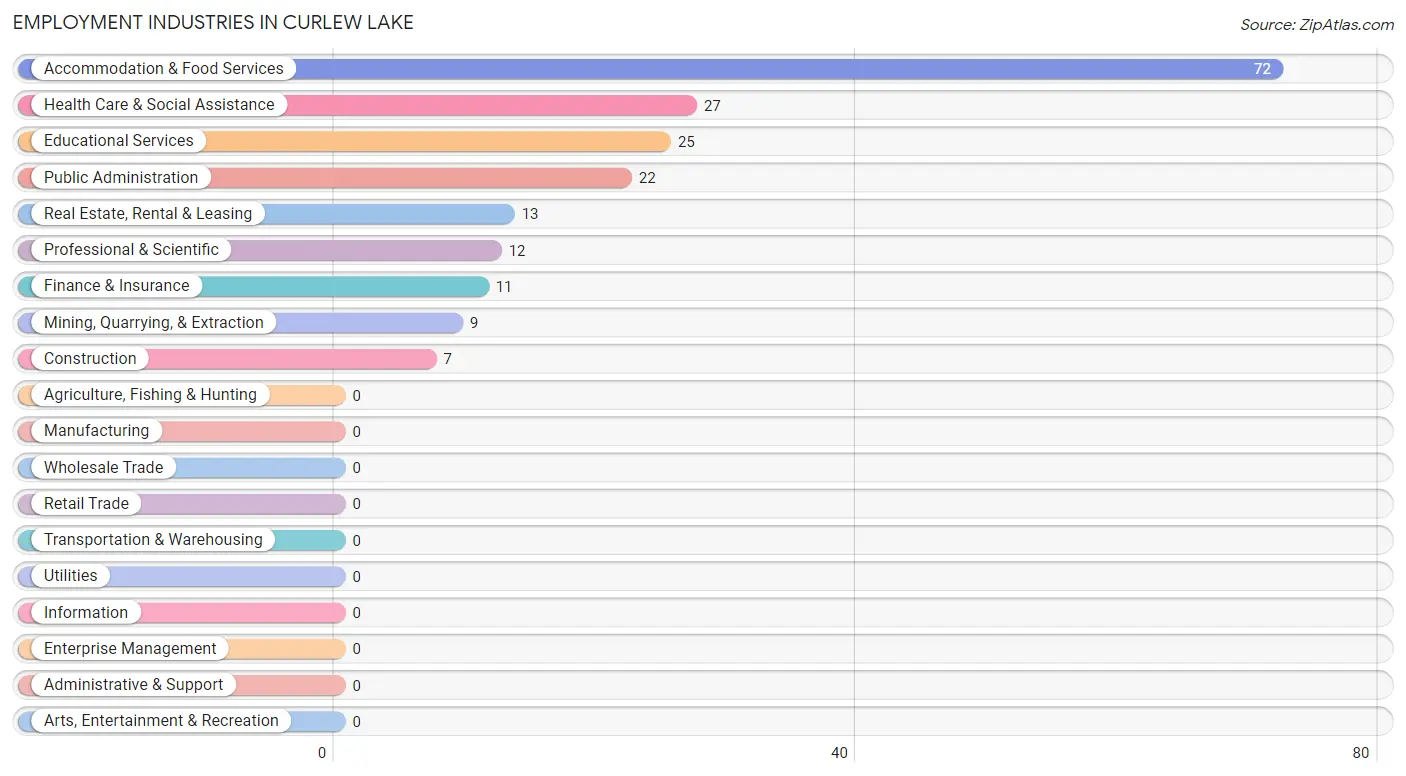
Employment Industries in Curlew Lake
The major employment industries in Curlew Lake include Accommodation & Food Services (72 | 30.8%), Health Care & Social Assistance (27 | 11.5%), Educational Services (25 | 10.7%), Public Administration (22 | 9.4%), and Real Estate, Rental & Leasing (13 | 5.6%).
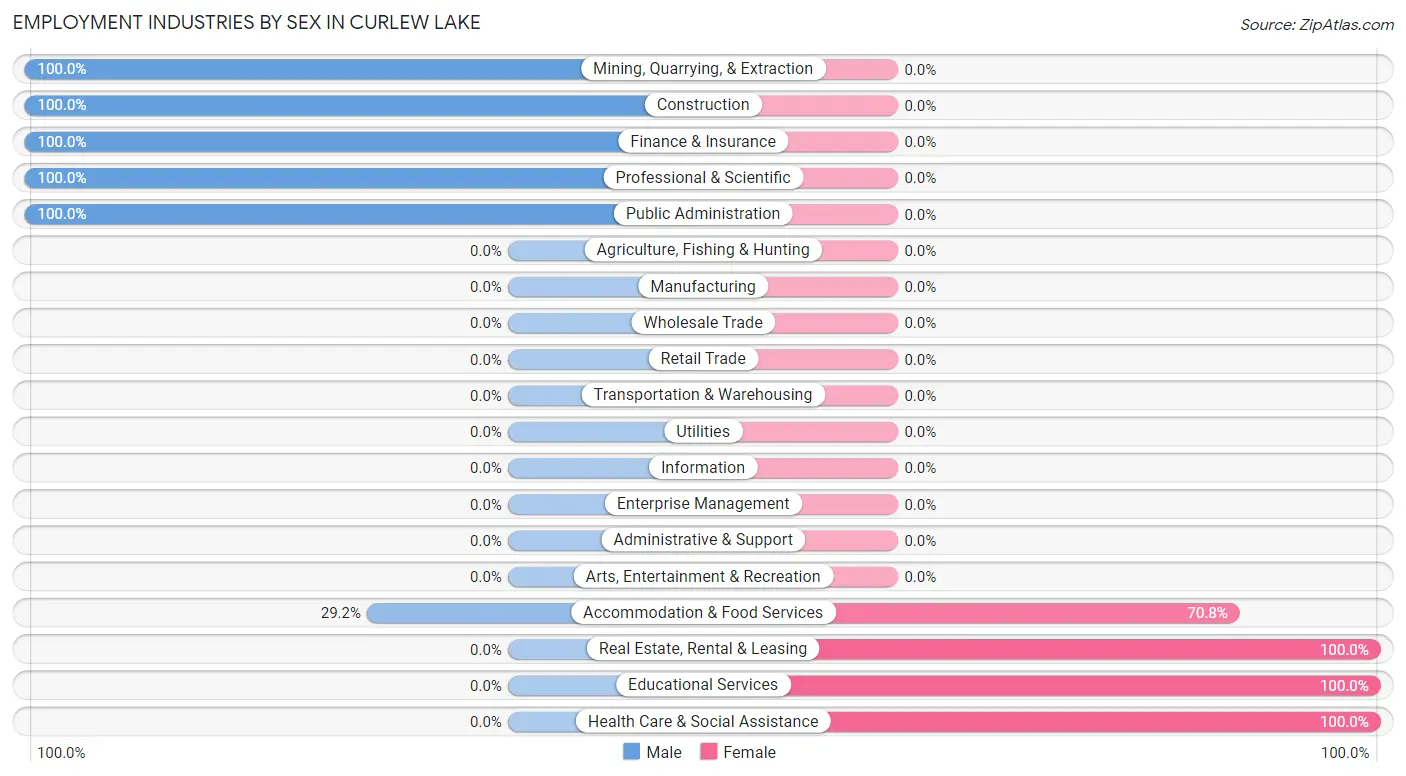
Employment Industries by Sex in Curlew Lake
The Curlew Lake industries that see more men than women are Mining, Quarrying, & Extraction (100.0%), Construction (100.0%), and Finance & Insurance (100.0%), whereas the industries that tend to have a higher number of women are Real Estate, Rental & Leasing (100.0%), Educational Services (100.0%), and Health Care & Social Assistance (100.0%).
| Industry | Male | Female |
| Agriculture, Fishing & Hunting | 0 (0.0%) | 0 (0.0%) |
| Mining, Quarrying, & Extraction | 9 (100.0%) | 0 (0.0%) |
| Construction | 7 (100.0%) | 0 (0.0%) |
| Manufacturing | 0 (0.0%) | 0 (0.0%) |
| Wholesale Trade | 0 (0.0%) | 0 (0.0%) |
| Retail Trade | 0 (0.0%) | 0 (0.0%) |
| Transportation & Warehousing | 0 (0.0%) | 0 (0.0%) |
| Utilities | 0 (0.0%) | 0 (0.0%) |
| Information | 0 (0.0%) | 0 (0.0%) |
| Finance & Insurance | 11 (100.0%) | 0 (0.0%) |
| Real Estate, Rental & Leasing | 0 (0.0%) | 13 (100.0%) |
| Professional & Scientific | 12 (100.0%) | 0 (0.0%) |
| Enterprise Management | 0 (0.0%) | 0 (0.0%) |
| Administrative & Support | 0 (0.0%) | 0 (0.0%) |
| Educational Services | 0 (0.0%) | 25 (100.0%) |
| Health Care & Social Assistance | 0 (0.0%) | 27 (100.0%) |
| Arts, Entertainment & Recreation | 0 (0.0%) | 0 (0.0%) |
| Accommodation & Food Services | 21 (29.2%) | 51 (70.8%) |
| Public Administration | 22 (100.0%) | 0 (0.0%) |
| Total | 118 (50.4%) | 116 (49.6%) |
Education in Curlew Lake
School Enrollment in Curlew Lake
The most common levels of schooling among the 83 students in Curlew Lake are high school (50 | 60.2%), middle school (22 | 26.5%), and elementary school (11 | 13.3%).
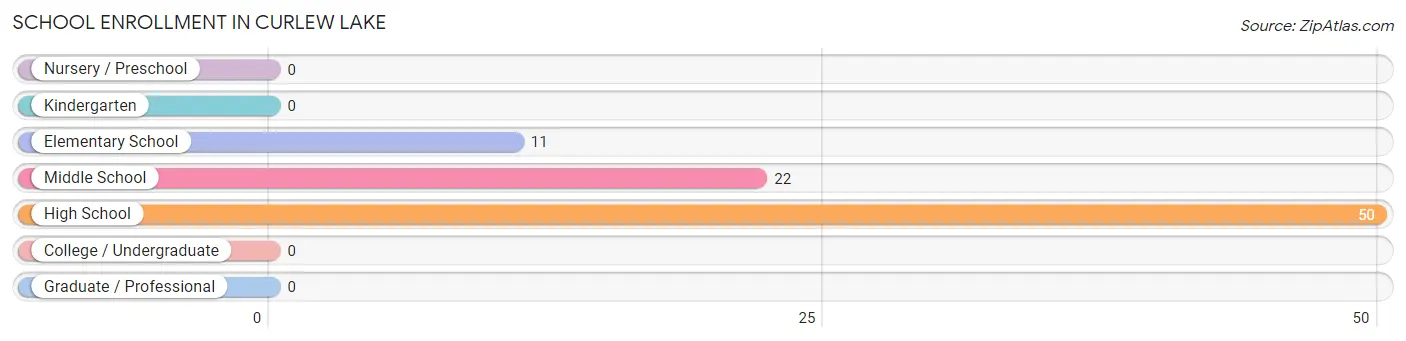
| School Level | # Students | % Students |
| Nursery / Preschool | 0 | 0.0% |
| Kindergarten | 0 | 0.0% |
| Elementary School | 11 | 13.3% |
| Middle School | 22 | 26.5% |
| High School | 50 | 60.2% |
| College / Undergraduate | 0 | 0.0% |
| Graduate / Professional | 0 | 0.0% |
| Total | 83 | 100.0% |
School Enrollment by Age by Funding Source in Curlew Lake
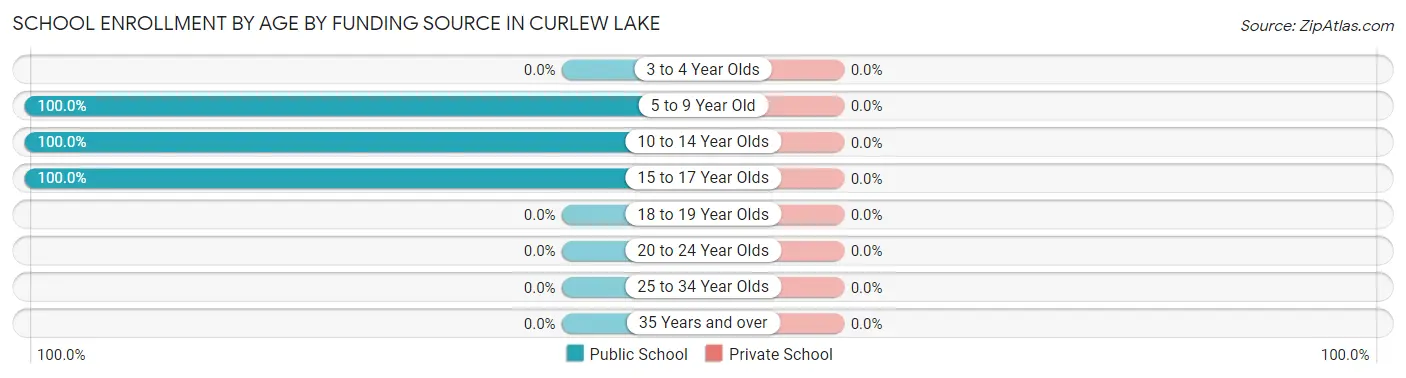
| Age Bracket | Public School | Private School |
| 3 to 4 Year Olds | 0 (0.0%) | 0 (0.0%) |
| 5 to 9 Year Old | 11 (100.0%) | 0 (0.0%) |
| 10 to 14 Year Olds | 65 (100.0%) | 0 (0.0%) |
| 15 to 17 Year Olds | 7 (100.0%) | 0 (0.0%) |
| 18 to 19 Year Olds | 0 (0.0%) | 0 (0.0%) |
| 20 to 24 Year Olds | 0 (0.0%) | 0 (0.0%) |
| 25 to 34 Year Olds | 0 (0.0%) | 0 (0.0%) |
| 35 Years and over | 0 (0.0%) | 0 (0.0%) |
| Total | 83 (100.0%) | 0 (0.0%) |
Educational Attainment by Field of Study in Curlew Lake
Business (39 | 32.5%), communications (27 | 22.5%), engineering (23 | 19.2%), psychology (15 | 12.5%), and education (12 | 10.0%) are the most common fields of study among 120 individuals in Curlew Lake who have obtained a bachelor's degree or higher.
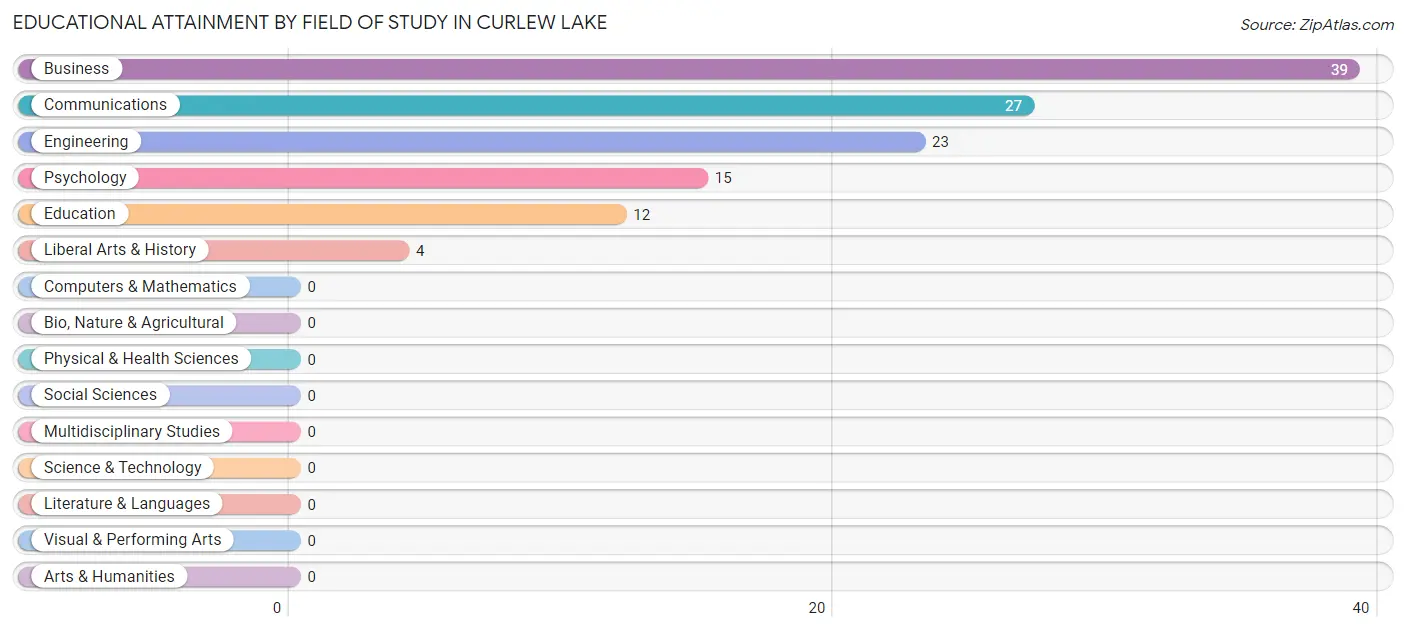
| Field of Study | # Graduates | % Graduates |
| Computers & Mathematics | 0 | 0.0% |
| Bio, Nature & Agricultural | 0 | 0.0% |
| Physical & Health Sciences | 0 | 0.0% |
| Psychology | 15 | 12.5% |
| Social Sciences | 0 | 0.0% |
| Engineering | 23 | 19.2% |
| Multidisciplinary Studies | 0 | 0.0% |
| Science & Technology | 0 | 0.0% |
| Business | 39 | 32.5% |
| Education | 12 | 10.0% |
| Literature & Languages | 0 | 0.0% |
| Liberal Arts & History | 4 | 3.3% |
| Visual & Performing Arts | 0 | 0.0% |
| Communications | 27 | 22.5% |
| Arts & Humanities | 0 | 0.0% |
| Total | 120 | 100.0% |
Transportation & Commute in Curlew Lake
Vehicle Availability by Sex in Curlew Lake
The most prevalent vehicle ownership categories in Curlew Lake are males with 1 vehicle (36, accounting for 30.5%) and females with 1 vehicle (50, making up 31.0%).
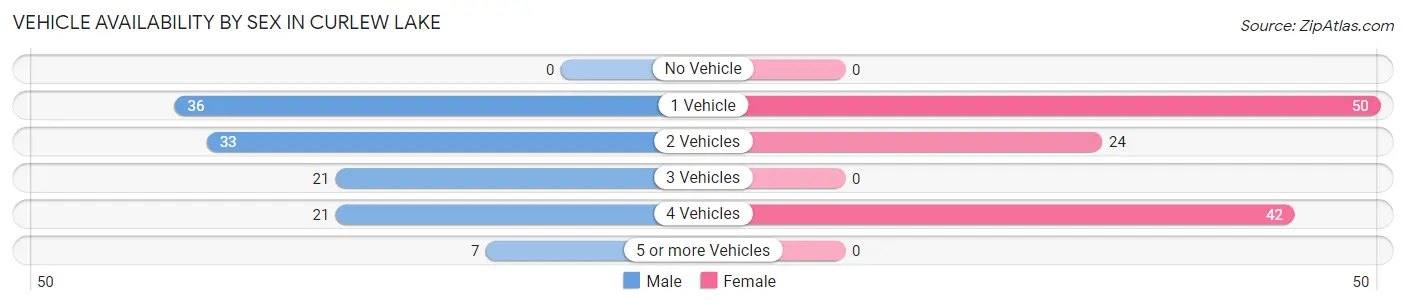
| Vehicles Available | Male | Female |
| No Vehicle | 0 (0.0%) | 0 (0.0%) |
| 1 Vehicle | 36 (30.5%) | 50 (43.1%) |
| 2 Vehicles | 33 (28.0%) | 24 (20.7%) |
| 3 Vehicles | 21 (17.8%) | 0 (0.0%) |
| 4 Vehicles | 21 (17.8%) | 42 (36.2%) |
| 5 or more Vehicles | 7 (5.9%) | 0 (0.0%) |
| Total | 118 (100.0%) | 116 (100.0%) |
Commute Time in Curlew Lake
The most frequently occuring commute durations in Curlew Lake are 5 to 9 minutes (36 commuters, 28.6%), 15 to 19 minutes (32 commuters, 25.4%), and 25 to 29 minutes (15 commuters, 11.9%).
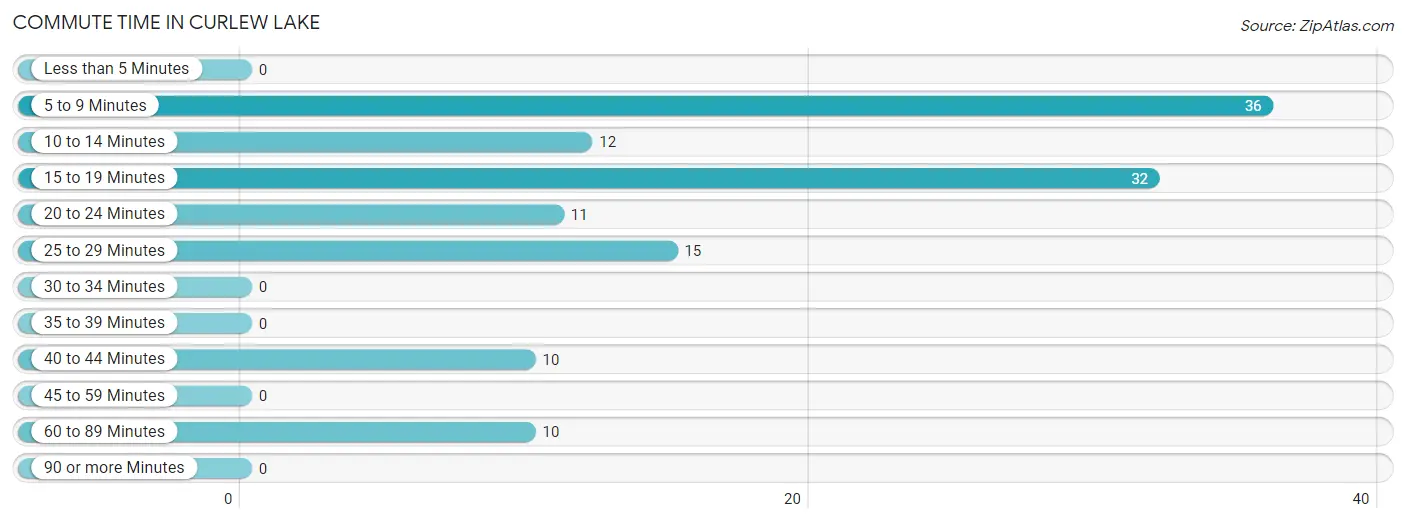
| Commute Time | # Commuters | % Commuters |
| Less than 5 Minutes | 0 | 0.0% |
| 5 to 9 Minutes | 36 | 28.6% |
| 10 to 14 Minutes | 12 | 9.5% |
| 15 to 19 Minutes | 32 | 25.4% |
| 20 to 24 Minutes | 11 | 8.7% |
| 25 to 29 Minutes | 15 | 11.9% |
| 30 to 34 Minutes | 0 | 0.0% |
| 35 to 39 Minutes | 0 | 0.0% |
| 40 to 44 Minutes | 10 | 7.9% |
| 45 to 59 Minutes | 0 | 0.0% |
| 60 to 89 Minutes | 10 | 7.9% |
| 90 or more Minutes | 0 | 0.0% |
Commute Time by Sex in Curlew Lake
The most common commute times in Curlew Lake are 15 to 19 minutes (23 commuters, 35.4%) for males and 5 to 9 minutes (27 commuters, 44.3%) for females.
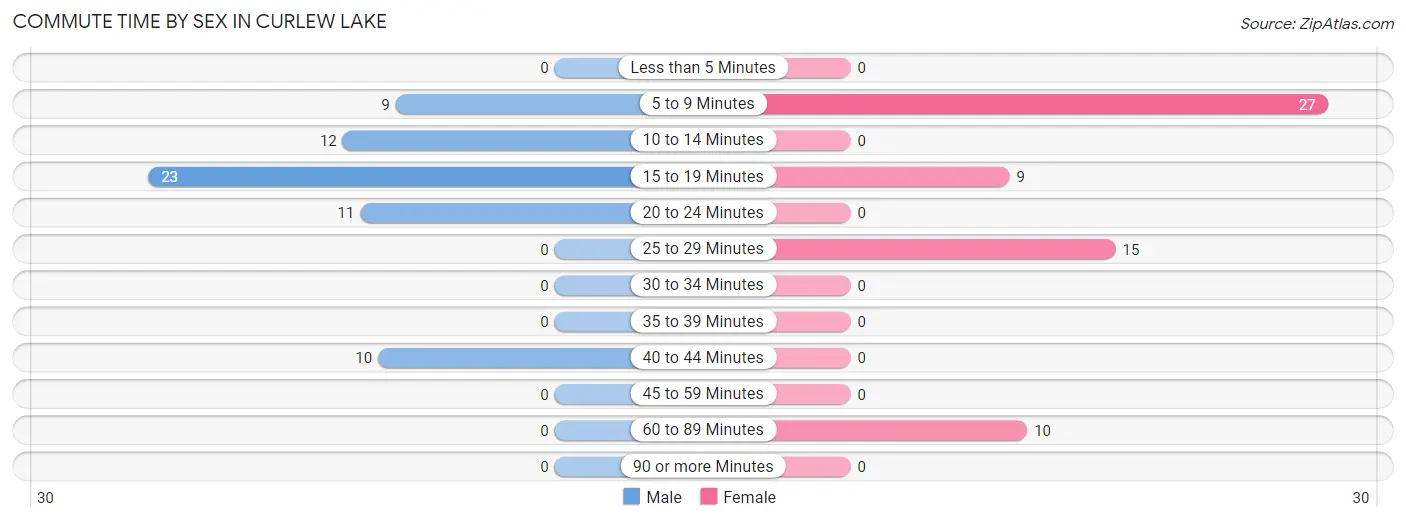
| Commute Time | Male | Female |
| Less than 5 Minutes | 0 (0.0%) | 0 (0.0%) |
| 5 to 9 Minutes | 9 (13.9%) | 27 (44.3%) |
| 10 to 14 Minutes | 12 (18.5%) | 0 (0.0%) |
| 15 to 19 Minutes | 23 (35.4%) | 9 (14.7%) |
| 20 to 24 Minutes | 11 (16.9%) | 0 (0.0%) |
| 25 to 29 Minutes | 0 (0.0%) | 15 (24.6%) |
| 30 to 34 Minutes | 0 (0.0%) | 0 (0.0%) |
| 35 to 39 Minutes | 0 (0.0%) | 0 (0.0%) |
| 40 to 44 Minutes | 10 (15.4%) | 0 (0.0%) |
| 45 to 59 Minutes | 0 (0.0%) | 0 (0.0%) |
| 60 to 89 Minutes | 0 (0.0%) | 10 (16.4%) |
| 90 or more Minutes | 0 (0.0%) | 0 (0.0%) |
Time of Departure to Work by Sex in Curlew Lake
The most frequent times of departure to work in Curlew Lake are 12:00 PM to 3:59 PM (12, 18.5%) for males and 7:30 AM to 7:59 AM (27, 44.3%) for females.
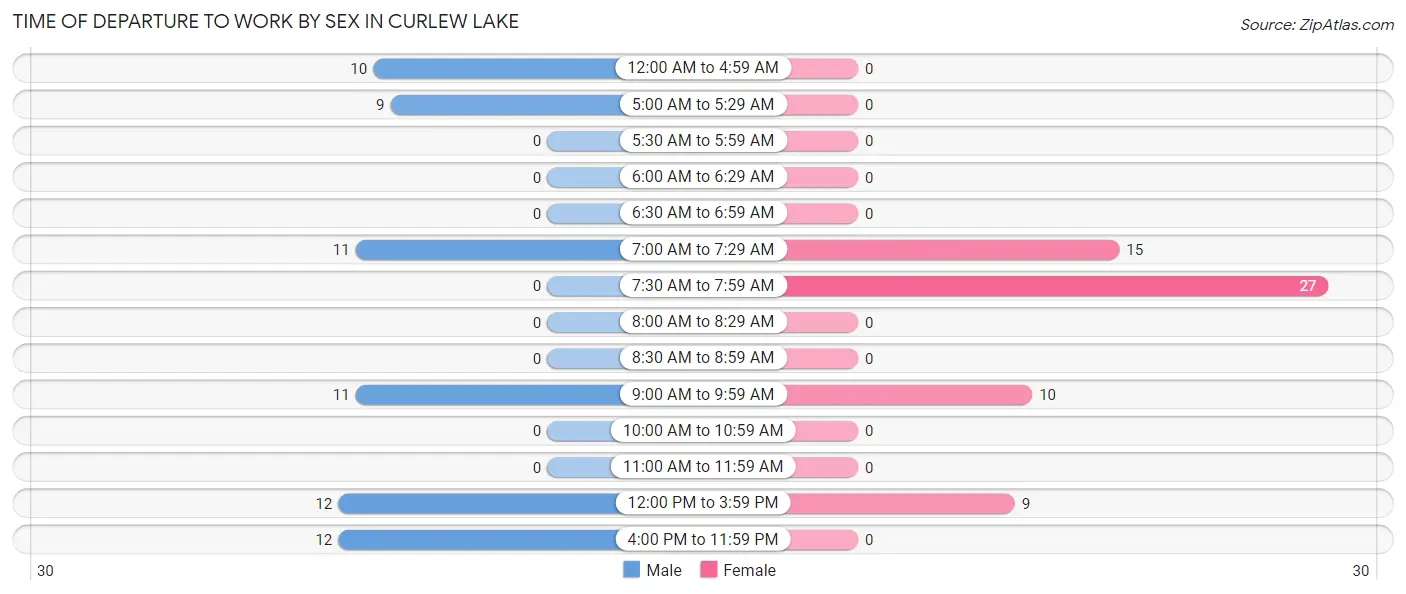
| Time of Departure | Male | Female |
| 12:00 AM to 4:59 AM | 10 (15.4%) | 0 (0.0%) |
| 5:00 AM to 5:29 AM | 9 (13.9%) | 0 (0.0%) |
| 5:30 AM to 5:59 AM | 0 (0.0%) | 0 (0.0%) |
| 6:00 AM to 6:29 AM | 0 (0.0%) | 0 (0.0%) |
| 6:30 AM to 6:59 AM | 0 (0.0%) | 0 (0.0%) |
| 7:00 AM to 7:29 AM | 11 (16.9%) | 15 (24.6%) |
| 7:30 AM to 7:59 AM | 0 (0.0%) | 27 (44.3%) |
| 8:00 AM to 8:29 AM | 0 (0.0%) | 0 (0.0%) |
| 8:30 AM to 8:59 AM | 0 (0.0%) | 0 (0.0%) |
| 9:00 AM to 9:59 AM | 11 (16.9%) | 10 (16.4%) |
| 10:00 AM to 10:59 AM | 0 (0.0%) | 0 (0.0%) |
| 11:00 AM to 11:59 AM | 0 (0.0%) | 0 (0.0%) |
| 12:00 PM to 3:59 PM | 12 (18.5%) | 9 (14.7%) |
| 4:00 PM to 11:59 PM | 12 (18.5%) | 0 (0.0%) |
| Total | 65 (100.0%) | 61 (100.0%) |
Housing Occupancy in Curlew Lake
Occupancy by Ownership in Curlew Lake
Of the total 276 dwellings in Curlew Lake, owner-occupied units account for 239 (86.6%), while renter-occupied units make up 37 (13.4%).
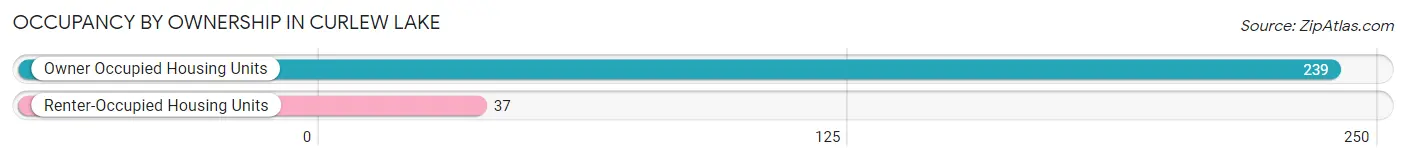
| Occupancy | # Housing Units | % Housing Units |
| Owner Occupied Housing Units | 239 | 86.6% |
| Renter-Occupied Housing Units | 37 | 13.4% |
| Total Occupied Housing Units | 276 | 100.0% |
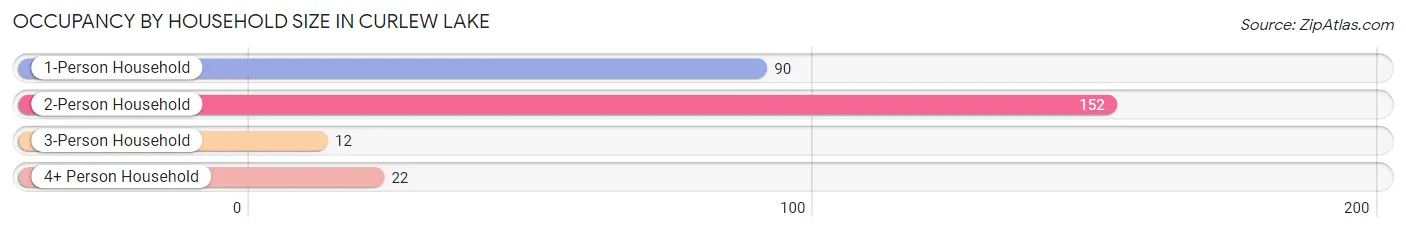
Occupancy by Household Size in Curlew Lake
| Household Size | # Housing Units | % Housing Units |
| 1-Person Household | 90 | 32.6% |
| 2-Person Household | 152 | 55.1% |
| 3-Person Household | 12 | 4.3% |
| 4+ Person Household | 22 | 8.0% |
| Total Housing Units | 276 | 100.0% |
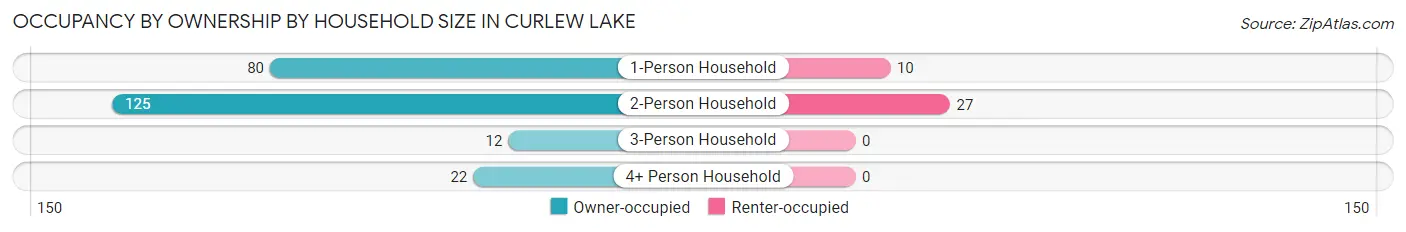
Occupancy by Ownership by Household Size in Curlew Lake
| Household Size | Owner-occupied | Renter-occupied |
| 1-Person Household | 80 (88.9%) | 10 (11.1%) |
| 2-Person Household | 125 (82.2%) | 27 (17.8%) |
| 3-Person Household | 12 (100.0%) | 0 (0.0%) |
| 4+ Person Household | 22 (100.0%) | 0 (0.0%) |
| Total Housing Units | 239 (86.6%) | 37 (13.4%) |
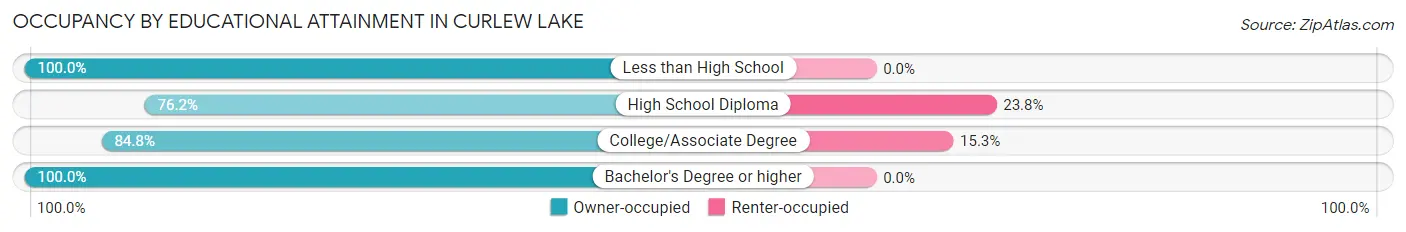
Occupancy by Educational Attainment in Curlew Lake
| Household Size | Owner-occupied | Renter-occupied |
| Less than High School | 7 (100.0%) | 0 (0.0%) |
| High School Diploma | 32 (76.2%) | 10 (23.8%) |
| College/Associate Degree | 150 (84.8%) | 27 (15.2%) |
| Bachelor's Degree or higher | 50 (100.0%) | 0 (0.0%) |
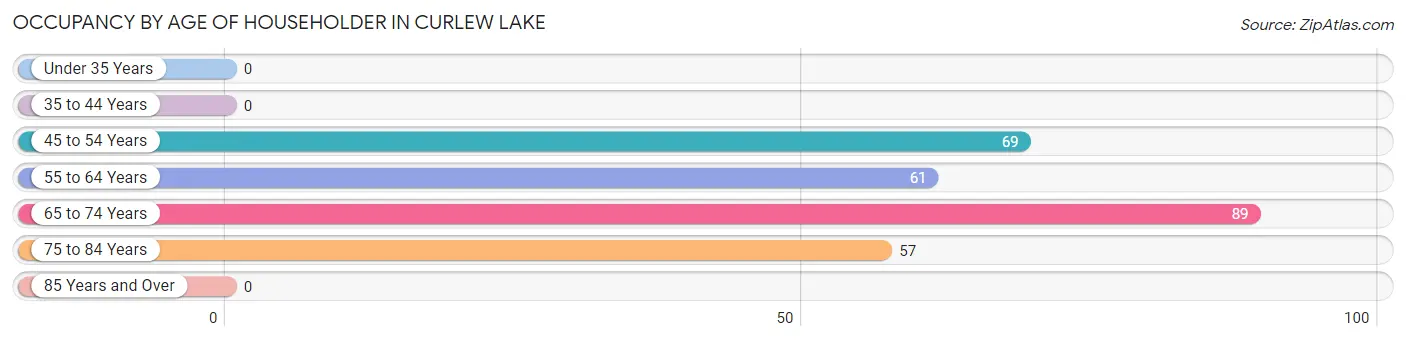
Occupancy by Age of Householder in Curlew Lake
| Age Bracket | # Households | % Households |
| Under 35 Years | 0 | 0.0% |
| 35 to 44 Years | 0 | 0.0% |
| 45 to 54 Years | 69 | 25.0% |
| 55 to 64 Years | 61 | 22.1% |
| 65 to 74 Years | 89 | 32.3% |
| 75 to 84 Years | 57 | 20.6% |
| 85 Years and Over | 0 | 0.0% |
| Total | 276 | 100.0% |
Housing Finances in Curlew Lake
Median Income by Occupancy in Curlew Lake
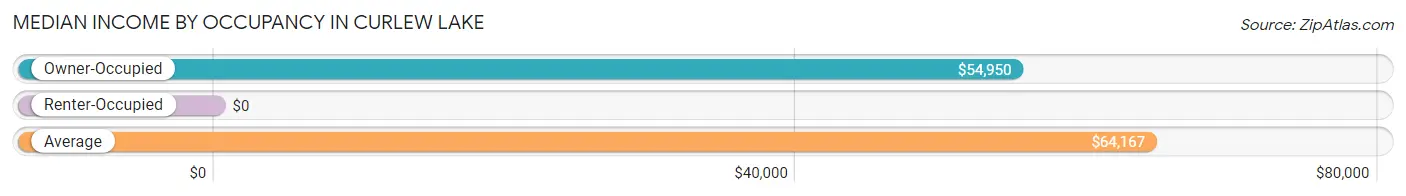
| Occupancy Type | # Households | Median Income |
| Owner-Occupied | 239 (86.6%) | $54,950 |
| Renter-Occupied | 37 (13.4%) | $0 |
| Average | 276 (100.0%) | $64,167 |
Occupancy by Householder Income Bracket in Curlew Lake
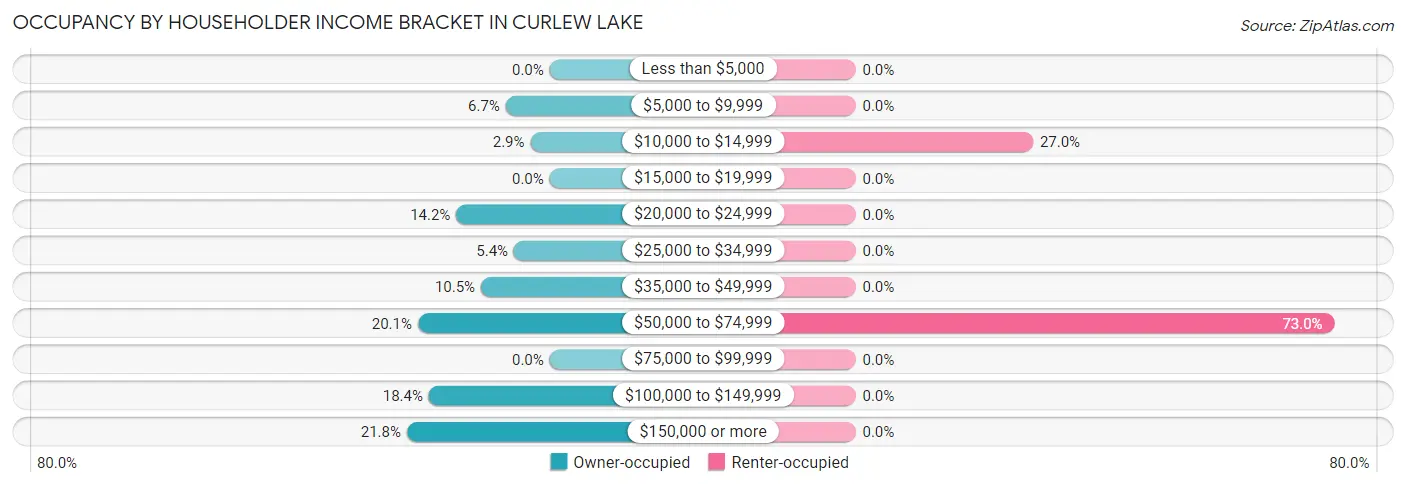
| Income Bracket | Owner-occupied | Renter-occupied |
| Less than $5,000 | 0 (0.0%) | 0 (0.0%) |
| $5,000 to $9,999 | 16 (6.7%) | 0 (0.0%) |
| $10,000 to $14,999 | 7 (2.9%) | 10 (27.0%) |
| $15,000 to $19,999 | 0 (0.0%) | 0 (0.0%) |
| $20,000 to $24,999 | 34 (14.2%) | 0 (0.0%) |
| $25,000 to $34,999 | 13 (5.4%) | 0 (0.0%) |
| $35,000 to $49,999 | 25 (10.5%) | 0 (0.0%) |
| $50,000 to $74,999 | 48 (20.1%) | 27 (73.0%) |
| $75,000 to $99,999 | 0 (0.0%) | 0 (0.0%) |
| $100,000 to $149,999 | 44 (18.4%) | 0 (0.0%) |
| $150,000 or more | 52 (21.8%) | 0 (0.0%) |
| Total | 239 (100.0%) | 37 (100.0%) |
Monthly Housing Cost Tiers in Curlew Lake
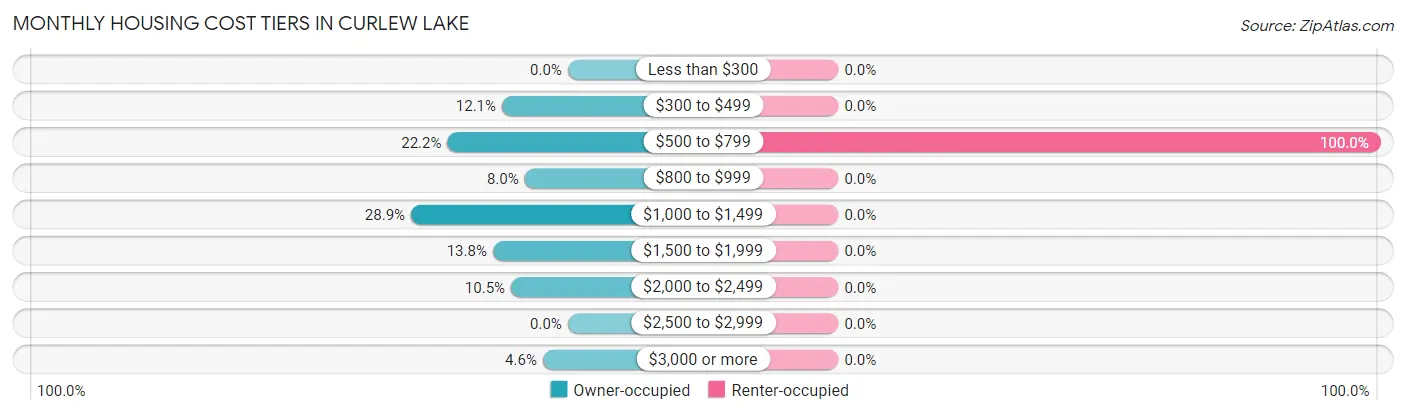
| Monthly Cost | Owner-occupied | Renter-occupied |
| Less than $300 | 0 (0.0%) | 0 (0.0%) |
| $300 to $499 | 29 (12.1%) | 0 (0.0%) |
| $500 to $799 | 53 (22.2%) | 37 (100.0%) |
| $800 to $999 | 19 (8.0%) | 0 (0.0%) |
| $1,000 to $1,499 | 69 (28.9%) | 0 (0.0%) |
| $1,500 to $1,999 | 33 (13.8%) | 0 (0.0%) |
| $2,000 to $2,499 | 25 (10.5%) | 0 (0.0%) |
| $2,500 to $2,999 | 0 (0.0%) | 0 (0.0%) |
| $3,000 or more | 11 (4.6%) | 0 (0.0%) |
| Total | 239 (100.0%) | 37 (100.0%) |
Physical Housing Characteristics in Curlew Lake
Housing Structures in Curlew Lake
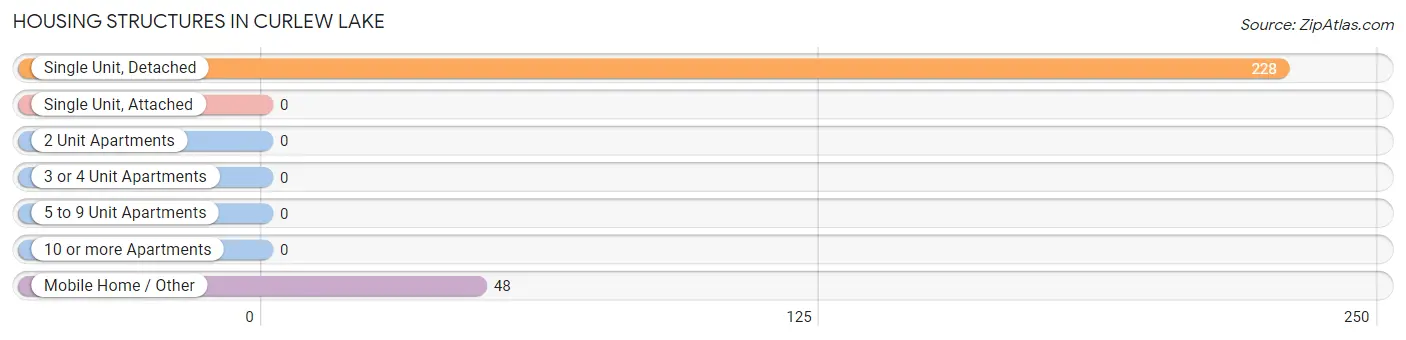
| Structure Type | # Housing Units | % Housing Units |
| Single Unit, Detached | 228 | 82.6% |
| Single Unit, Attached | 0 | 0.0% |
| 2 Unit Apartments | 0 | 0.0% |
| 3 or 4 Unit Apartments | 0 | 0.0% |
| 5 to 9 Unit Apartments | 0 | 0.0% |
| 10 or more Apartments | 0 | 0.0% |
| Mobile Home / Other | 48 | 17.4% |
| Total | 276 | 100.0% |
Housing Structures by Occupancy in Curlew Lake
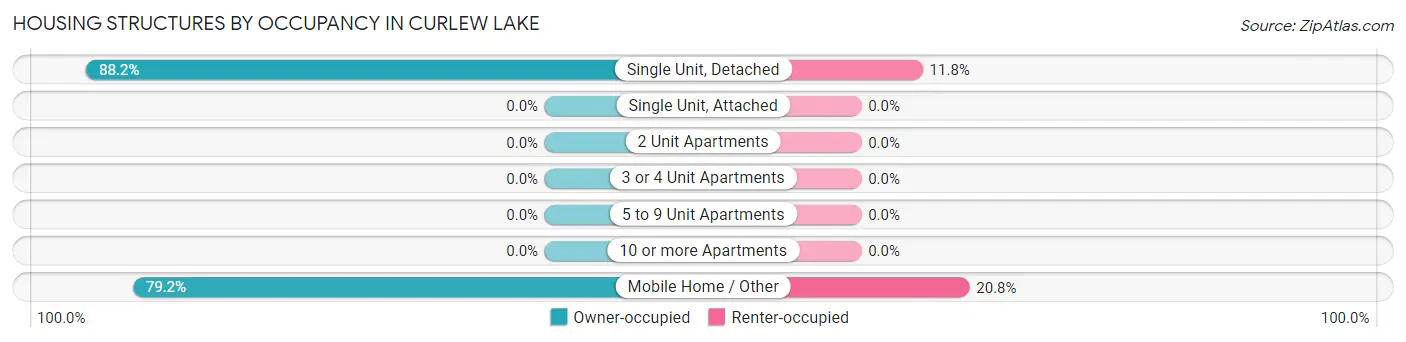
| Structure Type | Owner-occupied | Renter-occupied |
| Single Unit, Detached | 201 (88.2%) | 27 (11.8%) |
| Single Unit, Attached | 0 (0.0%) | 0 (0.0%) |
| 2 Unit Apartments | 0 (0.0%) | 0 (0.0%) |
| 3 or 4 Unit Apartments | 0 (0.0%) | 0 (0.0%) |
| 5 to 9 Unit Apartments | 0 (0.0%) | 0 (0.0%) |
| 10 or more Apartments | 0 (0.0%) | 0 (0.0%) |
| Mobile Home / Other | 38 (79.2%) | 10 (20.8%) |
| Total | 239 (86.6%) | 37 (13.4%) |
Housing Structures by Number of Rooms in Curlew Lake
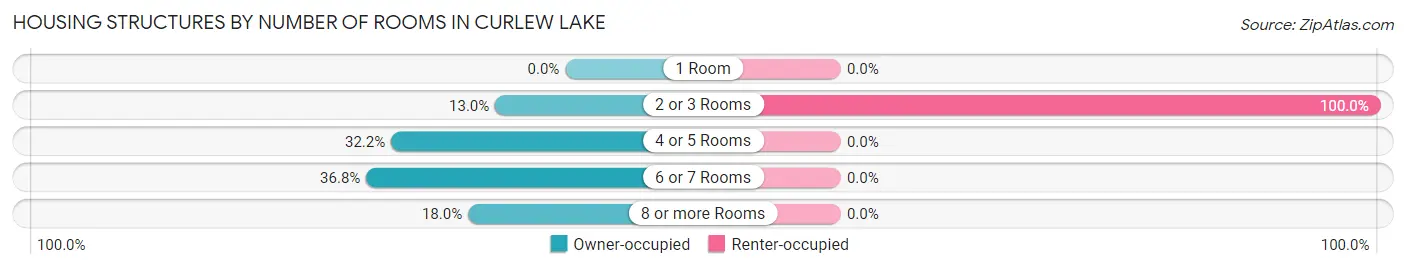
| Number of Rooms | Owner-occupied | Renter-occupied |
| 1 Room | 0 (0.0%) | 0 (0.0%) |
| 2 or 3 Rooms | 31 (13.0%) | 37 (100.0%) |
| 4 or 5 Rooms | 77 (32.2%) | 0 (0.0%) |
| 6 or 7 Rooms | 88 (36.8%) | 0 (0.0%) |
| 8 or more Rooms | 43 (18.0%) | 0 (0.0%) |
| Total | 239 (100.0%) | 37 (100.0%) |
Housing Structure by Heating Type in Curlew Lake
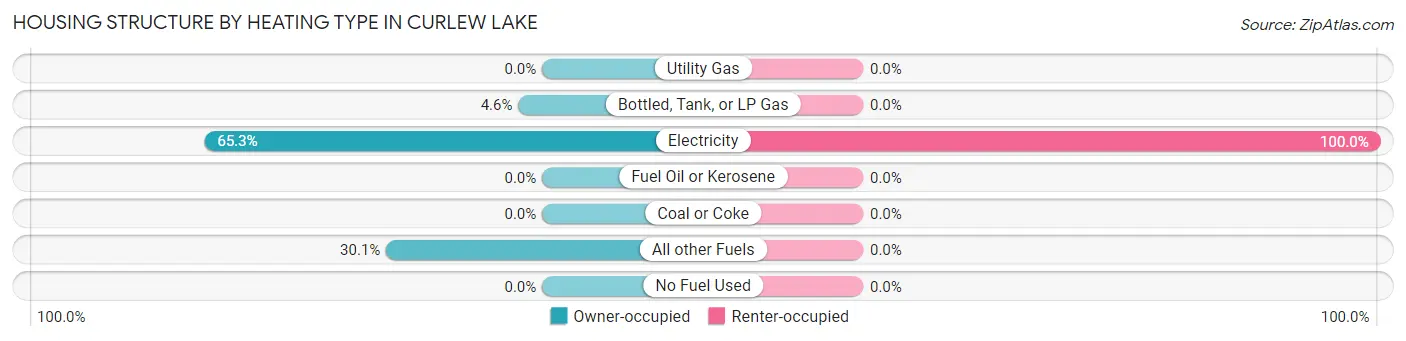
| Heating Type | Owner-occupied | Renter-occupied |
| Utility Gas | 0 (0.0%) | 0 (0.0%) |
| Bottled, Tank, or LP Gas | 11 (4.6%) | 0 (0.0%) |
| Electricity | 156 (65.3%) | 37 (100.0%) |
| Fuel Oil or Kerosene | 0 (0.0%) | 0 (0.0%) |
| Coal or Coke | 0 (0.0%) | 0 (0.0%) |
| All other Fuels | 72 (30.1%) | 0 (0.0%) |
| No Fuel Used | 0 (0.0%) | 0 (0.0%) |
| Total | 239 (100.0%) | 37 (100.0%) |
Household Vehicle Usage in Curlew Lake
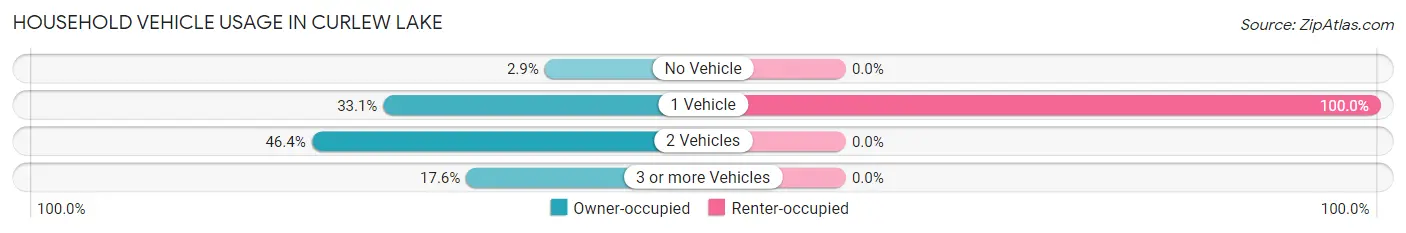
| Vehicles per Household | Owner-occupied | Renter-occupied |
| No Vehicle | 7 (2.9%) | 0 (0.0%) |
| 1 Vehicle | 79 (33.1%) | 37 (100.0%) |
| 2 Vehicles | 111 (46.4%) | 0 (0.0%) |
| 3 or more Vehicles | 42 (17.6%) | 0 (0.0%) |
| Total | 239 (100.0%) | 37 (100.0%) |
Real Estate & Mortgages in Curlew Lake
Real Estate and Mortgage Overview in Curlew Lake
| Characteristic | Without Mortgage | With Mortgage |
| Housing Units | 81 | 158 |
| Median Property Value | - | - |
| Median Household Income | - | - |
| Monthly Housing Costs | $632 | $11 |
| Real Estate Taxes | $3,114 | $0 |
Property Value by Mortgage Status in Curlew Lake
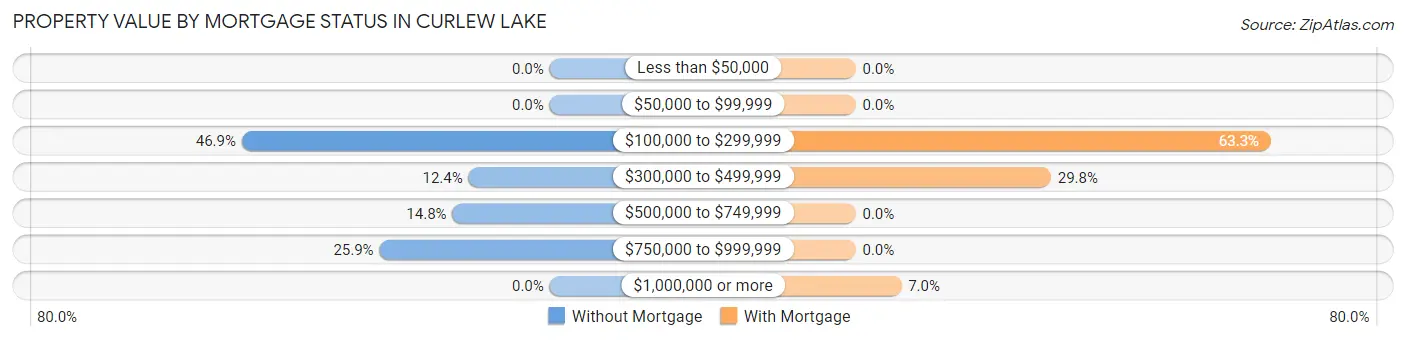
| Property Value | Without Mortgage | With Mortgage |
| Less than $50,000 | 0 (0.0%) | 0 (0.0%) |
| $50,000 to $99,999 | 0 (0.0%) | 0 (0.0%) |
| $100,000 to $299,999 | 38 (46.9%) | 100 (63.3%) |
| $300,000 to $499,999 | 10 (12.3%) | 47 (29.7%) |
| $500,000 to $749,999 | 12 (14.8%) | 0 (0.0%) |
| $750,000 to $999,999 | 21 (25.9%) | 0 (0.0%) |
| $1,000,000 or more | 0 (0.0%) | 11 (7.0%) |
| Total | 81 (100.0%) | 158 (100.0%) |
Household Income by Mortgage Status in Curlew Lake
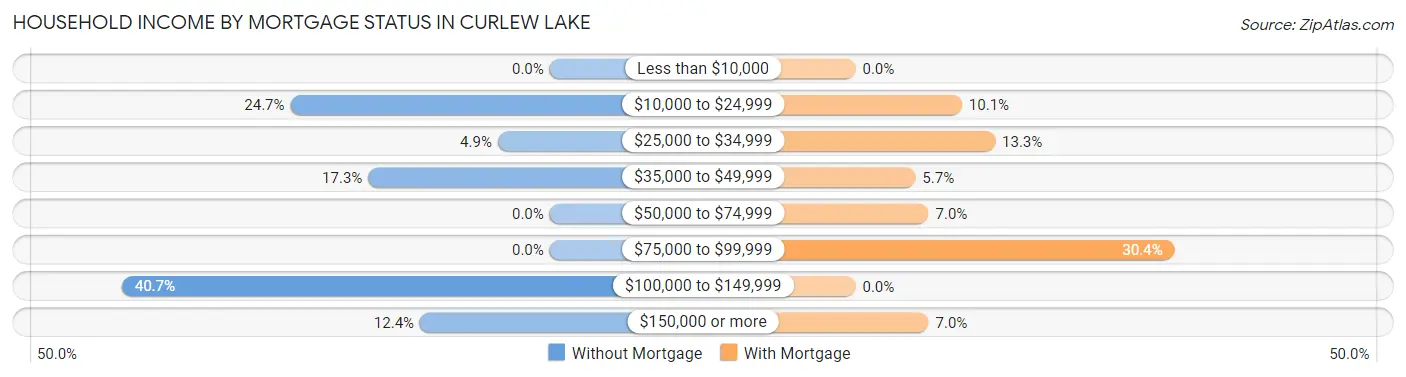
| Household Income | Without Mortgage | With Mortgage |
| Less than $10,000 | 0 (0.0%) | 0 (0.0%) |
| $10,000 to $24,999 | 20 (24.7%) | 16 (10.1%) |
| $25,000 to $34,999 | 4 (4.9%) | 21 (13.3%) |
| $35,000 to $49,999 | 14 (17.3%) | 9 (5.7%) |
| $50,000 to $74,999 | 0 (0.0%) | 11 (7.0%) |
| $75,000 to $99,999 | 0 (0.0%) | 48 (30.4%) |
| $100,000 to $149,999 | 33 (40.7%) | 0 (0.0%) |
| $150,000 or more | 10 (12.3%) | 11 (7.0%) |
| Total | 81 (100.0%) | 158 (100.0%) |
Property Value to Household Income Ratio in Curlew Lake
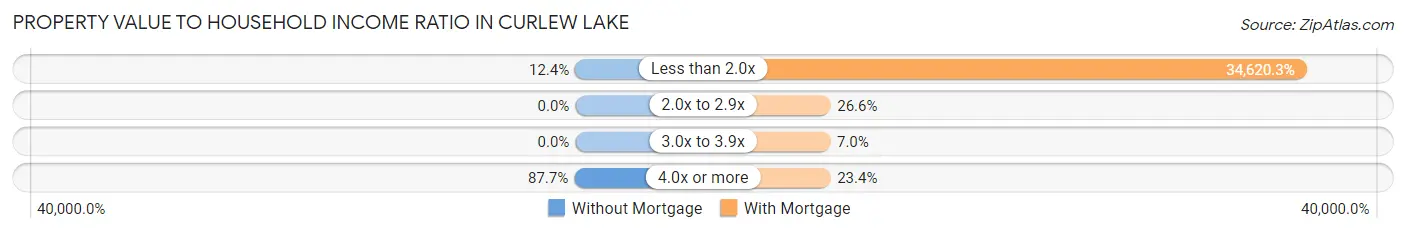
| Value-to-Income Ratio | Without Mortgage | With Mortgage |
| Less than 2.0x | 10 (12.3%) | 54,700 (34,620.2%) |
| 2.0x to 2.9x | 0 (0.0%) | 42 (26.6%) |
| 3.0x to 3.9x | 0 (0.0%) | 11 (7.0%) |
| 4.0x or more | 71 (87.6%) | 37 (23.4%) |
| Total | 81 (100.0%) | 158 (100.0%) |
Real Estate Taxes by Mortgage Status in Curlew Lake
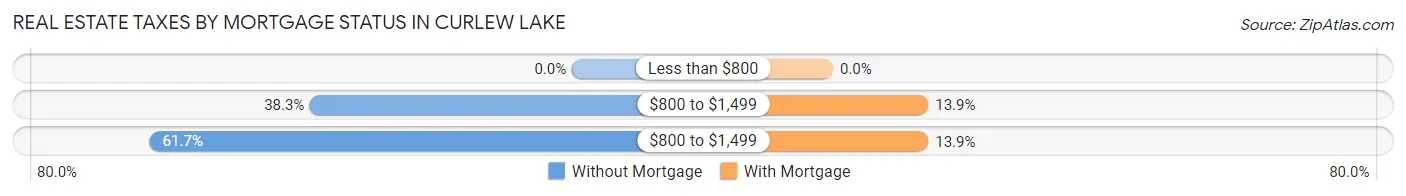
| Property Taxes | Without Mortgage | With Mortgage |
| Less than $800 | 0 (0.0%) | 0 (0.0%) |
| $800 to $1,499 | 31 (38.3%) | 22 (13.9%) |
| $800 to $1,499 | 50 (61.7%) | 22 (13.9%) |
| Total | 81 (100.0%) | 158 (100.0%) |
Health & Disability in Curlew Lake
Health Insurance Coverage by Age in Curlew Lake
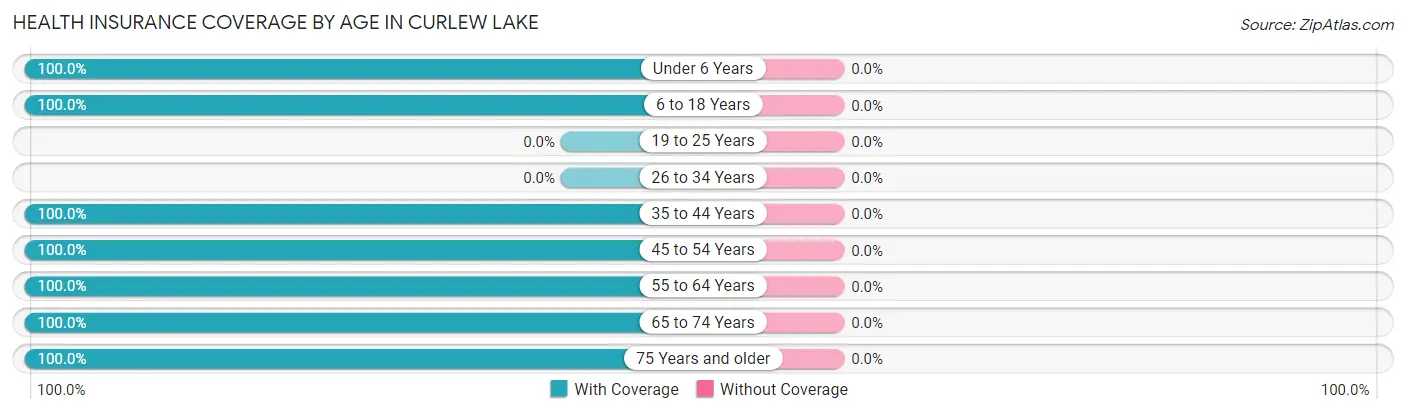
| Age Bracket | With Coverage | Without Coverage |
| Under 6 Years | 11 (100.0%) | 0 (0.0%) |
| 6 to 18 Years | 83 (100.0%) | 0 (0.0%) |
| 19 to 25 Years | 0 (0.0%) | 0 (0.0%) |
| 26 to 34 Years | 0 (0.0%) | 0 (0.0%) |
| 35 to 44 Years | 43 (100.0%) | 0 (0.0%) |
| 45 to 54 Years | 119 (100.0%) | 0 (0.0%) |
| 55 to 64 Years | 85 (100.0%) | 0 (0.0%) |
| 65 to 74 Years | 165 (100.0%) | 0 (0.0%) |
| 75 Years and older | 79 (100.0%) | 0 (0.0%) |
| Total | 585 (100.0%) | 0 (0.0%) |
Health Insurance Coverage by Citizenship Status in Curlew Lake
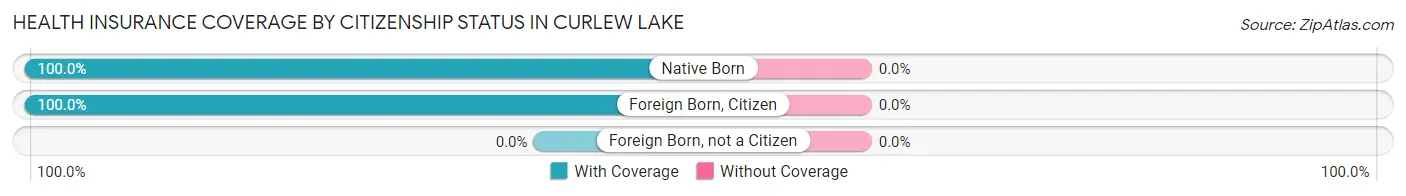
| Citizenship Status | With Coverage | Without Coverage |
| Native Born | 11 (100.0%) | 0 (0.0%) |
| Foreign Born, Citizen | 83 (100.0%) | 0 (0.0%) |
| Foreign Born, not a Citizen | 0 (0.0%) | 0 (0.0%) |
Health Insurance Coverage by Household Income in Curlew Lake
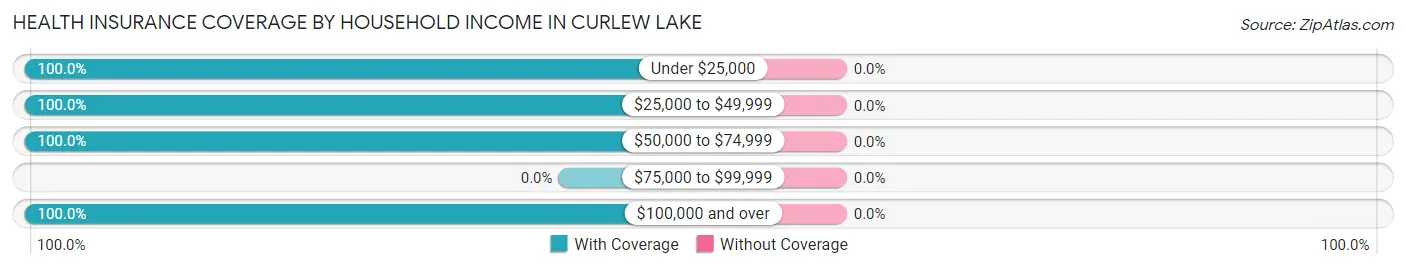
| Household Income | With Coverage | Without Coverage |
| Under $25,000 | 67 (100.0%) | 0 (0.0%) |
| $25,000 to $49,999 | 112 (100.0%) | 0 (0.0%) |
| $50,000 to $74,999 | 150 (100.0%) | 0 (0.0%) |
| $75,000 to $99,999 | 0 (0.0%) | 0 (0.0%) |
| $100,000 and over | 256 (100.0%) | 0 (0.0%) |
Public vs Private Health Insurance Coverage by Age in Curlew Lake
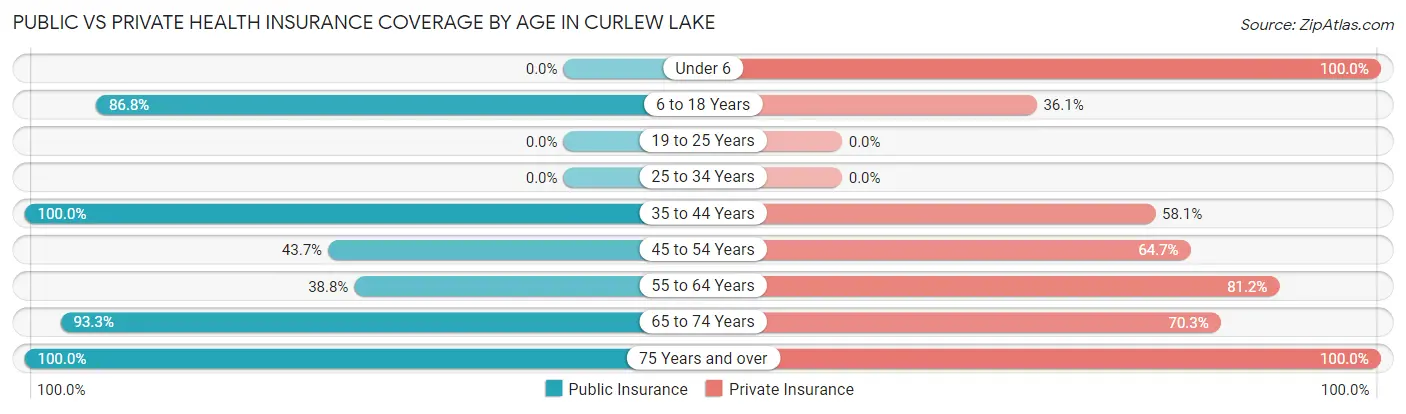
| Age Bracket | Public Insurance | Private Insurance |
| Under 6 | 0 (0.0%) | 11 (100.0%) |
| 6 to 18 Years | 72 (86.8%) | 30 (36.1%) |
| 19 to 25 Years | 0 (0.0%) | 0 (0.0%) |
| 25 to 34 Years | 0 (0.0%) | 0 (0.0%) |
| 35 to 44 Years | 43 (100.0%) | 25 (58.1%) |
| 45 to 54 Years | 52 (43.7%) | 77 (64.7%) |
| 55 to 64 Years | 33 (38.8%) | 69 (81.2%) |
| 65 to 74 Years | 154 (93.3%) | 116 (70.3%) |
| 75 Years and over | 79 (100.0%) | 79 (100.0%) |
| Total | 433 (74.0%) | 407 (69.6%) |
Disability Status by Sex by Age in Curlew Lake
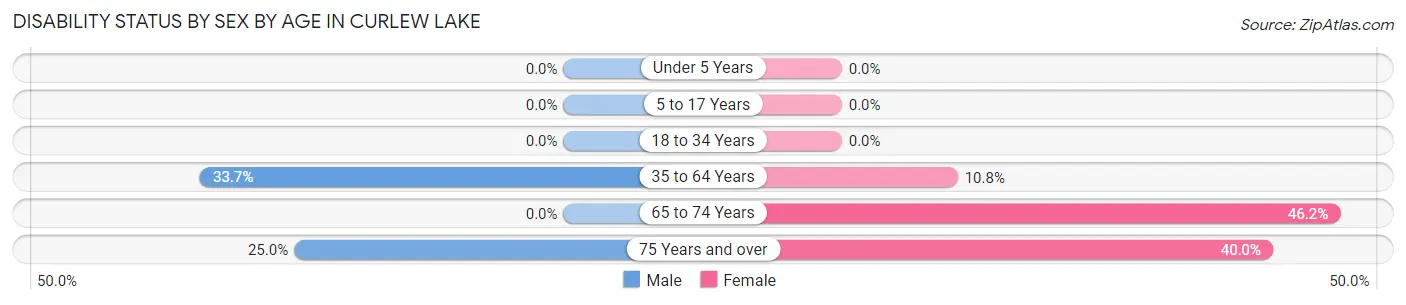
| Age Bracket | Male | Female |
| Under 5 Years | 0 (0.0%) | 0 (0.0%) |
| 5 to 17 Years | 0 (0.0%) | 0 (0.0%) |
| 18 to 34 Years | 0 (0.0%) | 0 (0.0%) |
| 35 to 64 Years | 30 (33.7%) | 17 (10.8%) |
| 65 to 74 Years | 0 (0.0%) | 43 (46.2%) |
| 75 Years and over | 11 (25.0%) | 14 (40.0%) |
Disability Class by Sex by Age in Curlew Lake
Disability Class: Hearing Difficulty
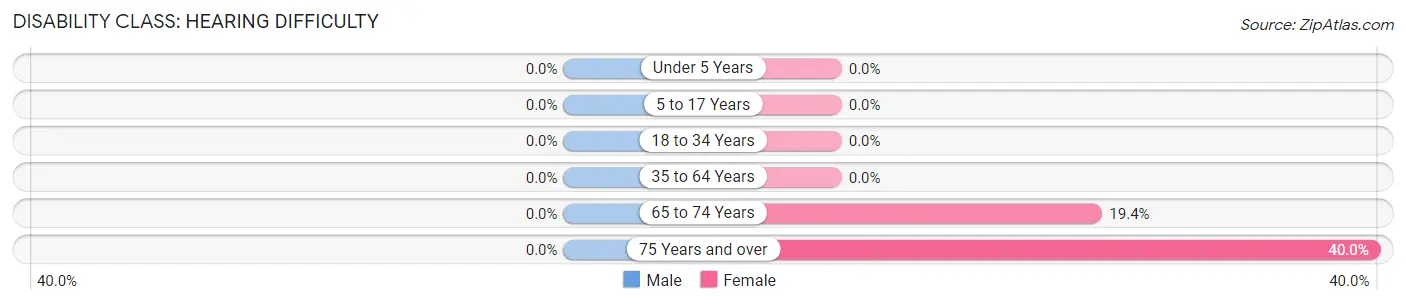
| Age Bracket | Male | Female |
| Under 5 Years | 0 (0.0%) | 0 (0.0%) |
| 5 to 17 Years | 0 (0.0%) | 0 (0.0%) |
| 18 to 34 Years | 0 (0.0%) | 0 (0.0%) |
| 35 to 64 Years | 0 (0.0%) | 0 (0.0%) |
| 65 to 74 Years | 0 (0.0%) | 18 (19.4%) |
| 75 Years and over | 0 (0.0%) | 14 (40.0%) |
Disability Class: Vision Difficulty
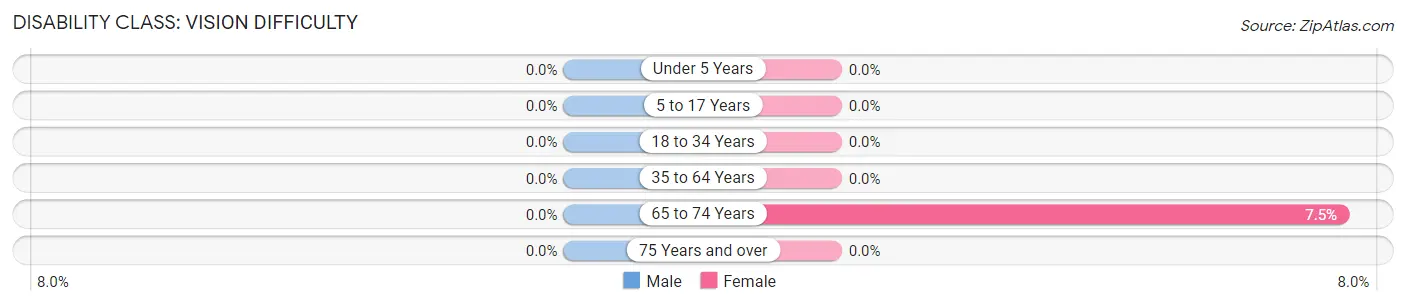
| Age Bracket | Male | Female |
| Under 5 Years | 0 (0.0%) | 0 (0.0%) |
| 5 to 17 Years | 0 (0.0%) | 0 (0.0%) |
| 18 to 34 Years | 0 (0.0%) | 0 (0.0%) |
| 35 to 64 Years | 0 (0.0%) | 0 (0.0%) |
| 65 to 74 Years | 0 (0.0%) | 7 (7.5%) |
| 75 Years and over | 0 (0.0%) | 0 (0.0%) |
Disability Class: Cognitive Difficulty
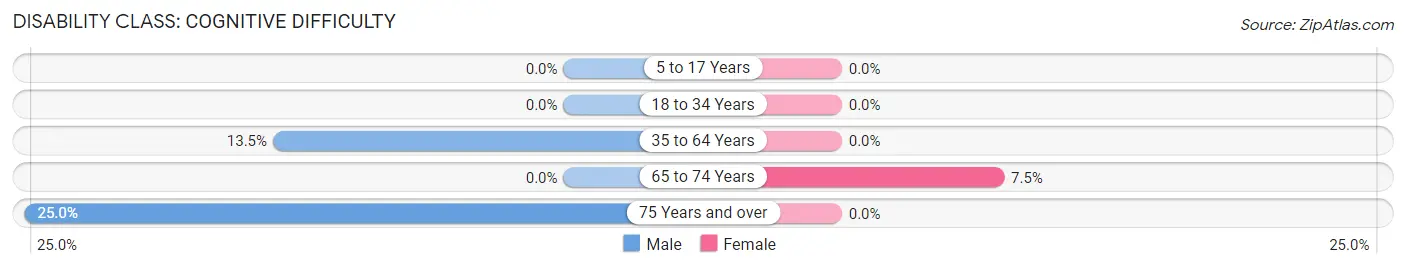
| Age Bracket | Male | Female |
| 5 to 17 Years | 0 (0.0%) | 0 (0.0%) |
| 18 to 34 Years | 0 (0.0%) | 0 (0.0%) |
| 35 to 64 Years | 12 (13.5%) | 0 (0.0%) |
| 65 to 74 Years | 0 (0.0%) | 7 (7.5%) |
| 75 Years and over | 11 (25.0%) | 0 (0.0%) |
Disability Class: Ambulatory Difficulty
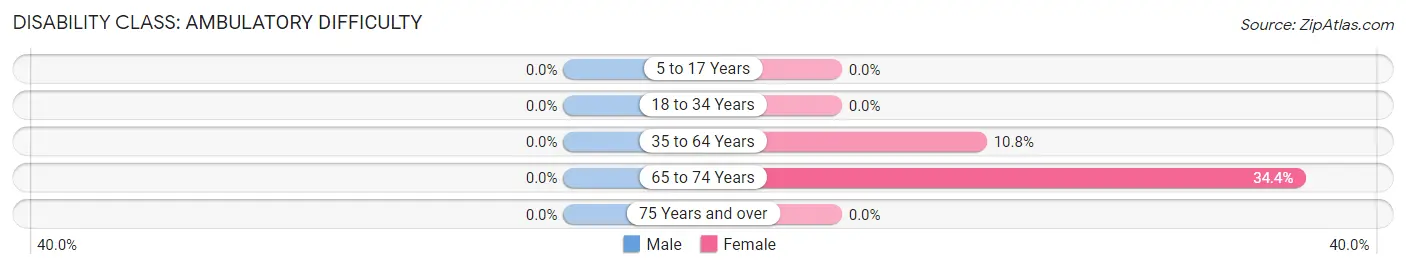
| Age Bracket | Male | Female |
| 5 to 17 Years | 0 (0.0%) | 0 (0.0%) |
| 18 to 34 Years | 0 (0.0%) | 0 (0.0%) |
| 35 to 64 Years | 0 (0.0%) | 17 (10.8%) |
| 65 to 74 Years | 0 (0.0%) | 32 (34.4%) |
| 75 Years and over | 0 (0.0%) | 0 (0.0%) |
Disability Class: Self-Care Difficulty
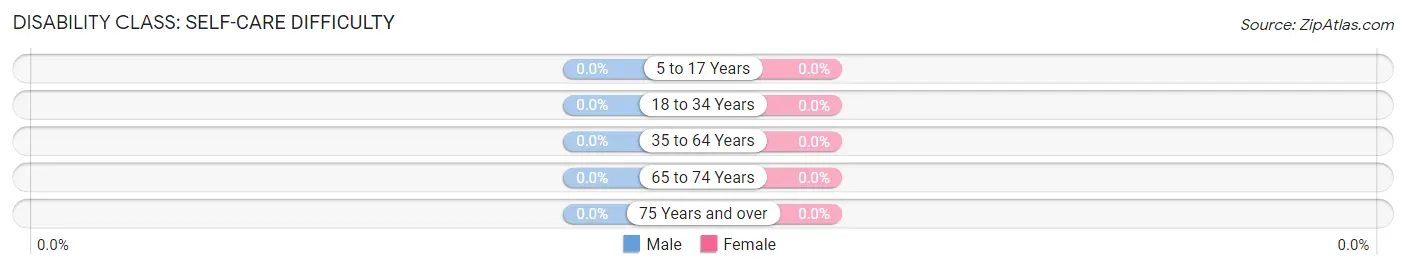
| Age Bracket | Male | Female |
| 5 to 17 Years | 0 (0.0%) | 0 (0.0%) |
| 18 to 34 Years | 0 (0.0%) | 0 (0.0%) |
| 35 to 64 Years | 0 (0.0%) | 0 (0.0%) |
| 65 to 74 Years | 0 (0.0%) | 0 (0.0%) |
| 75 Years and over | 0 (0.0%) | 0 (0.0%) |
Technology Access in Curlew Lake
Computing Device Access in Curlew Lake
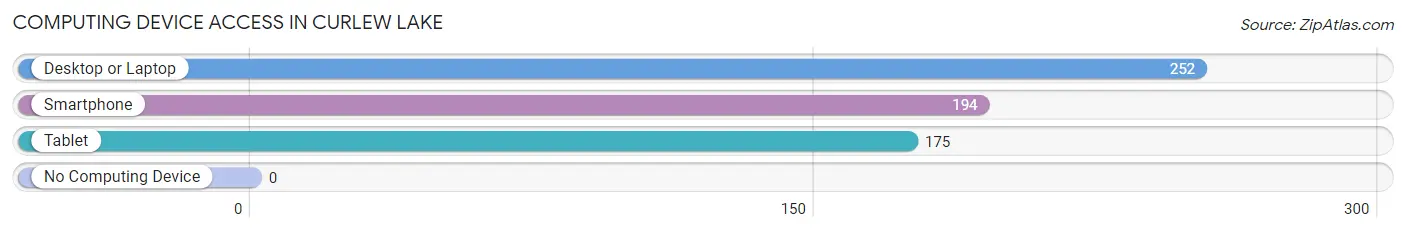
| Device Type | # Households | % Households |
| Desktop or Laptop | 252 | 91.3% |
| Smartphone | 194 | 70.3% |
| Tablet | 175 | 63.4% |
| No Computing Device | 0 | 0.0% |
| Total | 276 | 100.0% |
Internet Access in Curlew Lake
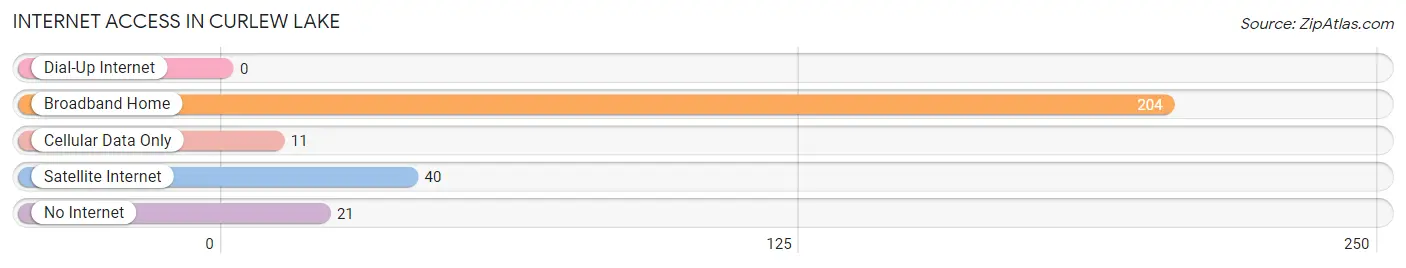
| Internet Type | # Households | % Households |
| Dial-Up Internet | 0 | 0.0% |
| Broadband Home | 204 | 73.9% |
| Cellular Data Only | 11 | 4.0% |
| Satellite Internet | 40 | 14.5% |
| No Internet | 21 | 7.6% |
| Total | 276 | 100.0% |
Curlew Lake Summary
Curlew Lake is a small lake located in Ferry County, Washington, United States. It is located in the northeastern part of the state, near the Canadian border. The lake is approximately 4 miles long and 1 mile wide, and is surrounded by the Colville National Forest. The lake is a popular destination for fishing, camping, and other outdoor activities.
History
The area around Curlew Lake has been inhabited for thousands of years by Native American tribes, including the Spokane, Coeur d'Alene, and Kalispel. The lake was first documented by European settlers in the late 1800s, when the area was part of the Washington Territory. The lake was named after the curlew, a type of wading bird that is native to the area.
In the early 1900s, the lake became a popular destination for fishing and camping. The lake was stocked with trout, and the surrounding area was logged for timber. In the 1950s, the lake was dammed to create a reservoir for irrigation and hydroelectric power.
Geography
Curlew Lake is located in the northeastern part of Washington State, near the Canadian border. The lake is approximately 4 miles long and 1 mile wide, and is surrounded by the Colville National Forest. The lake is fed by several small streams, and is drained by the Curlew River. The lake is located at an elevation of 2,400 feet, and has a maximum depth of 40 feet.
The lake is surrounded by rolling hills and forests, and is home to a variety of wildlife, including deer, elk, bear, and bald eagles. The lake is a popular destination for fishing, camping, and other outdoor activities.
Economy
The economy of Curlew Lake is largely based on tourism and recreation. The lake is a popular destination for fishing, camping, and other outdoor activities. The surrounding area is home to several resorts and campgrounds, as well as a variety of restaurants and other businesses.
The lake is also a popular destination for boating and water sports. The lake is home to several marinas, as well as boat rentals and other services. The lake is also a popular destination for swimming, kayaking, and other water activities.
Demographics
The population of Curlew Lake is small, with an estimated population of just over 500 people. The population is largely white, with a small percentage of Native American and Hispanic residents. The median household income is approximately $50,000, and the median home value is around $200,000.
The area around Curlew Lake is largely rural, with a few small towns and villages. The nearest major city is Spokane, which is located approximately 90 miles away. The area is served by several small airports, as well as a few bus and train lines.
Conclusion
Curlew Lake is a small lake located in Ferry County, Washington, United States. It is located in the northeastern part of the state, near the Canadian border. The lake is a popular destination for fishing, camping, and other outdoor activities. The economy of Curlew Lake is largely based on tourism and recreation, and the population is small, with an estimated population of just over 500 people. The area around Curlew Lake is largely rural, with a few small towns and villages. The lake is a popular destination for fishing, camping, and other outdoor activities, and is home to several marinas, as well as boat rentals and other services.
Common Questions
What is Per Capita Income in Curlew Lake?
Per Capita income in Curlew Lake is $48,125.
What is the Median Family Income in Curlew Lake?
Median Family Income in Curlew Lake is $101,964.
What is the Median Household income in Curlew Lake?
Median Household Income in Curlew Lake is $64,167.
What is Inequality or Gini Index in Curlew Lake?
Inequality or Gini Index in Curlew Lake is 0.55.
What is the Total Population of Curlew Lake?
Total Population of Curlew Lake is 585.
What is the Total Male Population of Curlew Lake?
Total Male Population of Curlew Lake is 236.
What is the Total Female Population of Curlew Lake?
Total Female Population of Curlew Lake is 349.
What is the Ratio of Males per 100 Females in Curlew Lake?
There are 67.62 Males per 100 Females in Curlew Lake.
What is the Ratio of Females per 100 Males in Curlew Lake?
There are 147.88 Females per 100 Males in Curlew Lake.
What is the Median Population Age in Curlew Lake?
Median Population Age in Curlew Lake is 56.9 Years.
What is the Average Family Size in Curlew Lake
Average Family Size in Curlew Lake is 2.8 People.
What is the Average Household Size in Curlew Lake
Average Household Size in Curlew Lake is 2.1 People.
How Large is the Labor Force in Curlew Lake?
There are 234 People in the Labor Forcein in Curlew Lake.
What is the Percentage of People in the Labor Force in Curlew Lake?
47.0% of People are in the Labor Force in Curlew Lake.