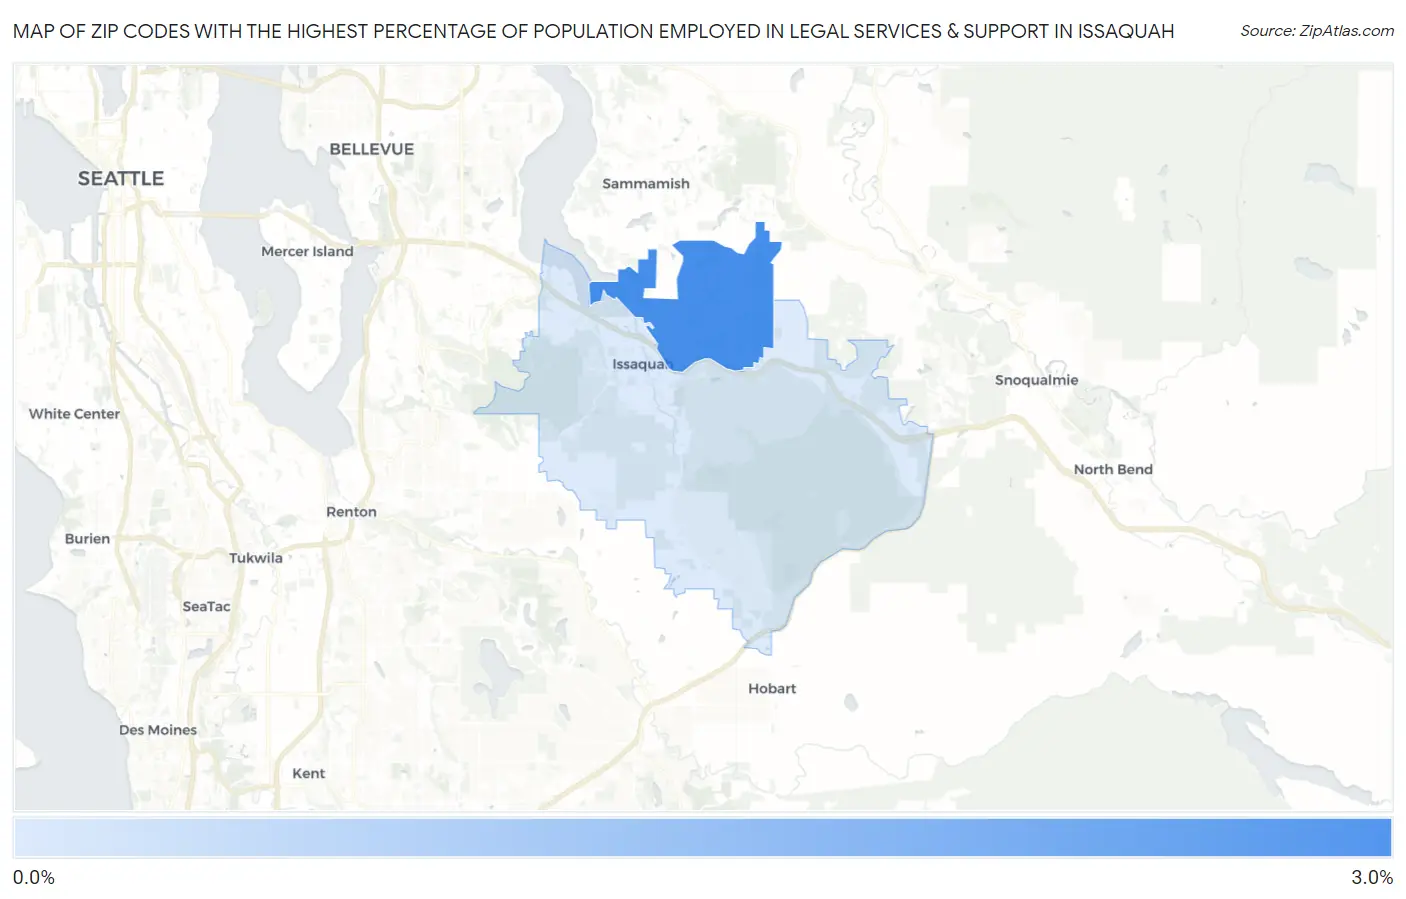
Zip Codes with the Highest Percentage of Population Employed in Legal Services & Support in Issaquah, WA
RELATED REPORTS & OPTIONS
Legal Services & Support
Issaquah
Compare Zip Codes
Map of Zip Codes with the Highest Percentage of Population Employed in Legal Services & Support in Issaquah
0.59%
2.6%
Zip Codes with the Highest Percentage of Population Employed in Legal Services & Support in Issaquah, WA
| Zip Code | % Employed | vs State | vs National | |
| 1. | 98029 | 2.6% | 1.1%(+1.52)#40 | 1.2%(+1.42)#2,356 |
| 2. | 98027 | 0.59% | 1.1%(-0.487)#275 | 1.2%(-0.597)#11,590 |
1
Common Questions
What are the Top Zip Codes with the Highest Percentage of Population Employed in Legal Services & Support in Issaquah, WA?
Top Zip Codes with the Highest Percentage of Population Employed in Legal Services & Support in Issaquah, WA are:
What zip code has the Highest Percentage of Population Employed in Legal Services & Support in Issaquah, WA?
98029 has the Highest Percentage of Population Employed in Legal Services & Support in Issaquah, WA with 2.6%.
What is the Percentage of Population Employed in Legal Services & Support in Issaquah, WA?
Percentage of Population Employed in Legal Services & Support in Issaquah is 1.3%.
What is the Percentage of Population Employed in Legal Services & Support in Washington?
Percentage of Population Employed in Legal Services & Support in Washington is 1.1%.
What is the Percentage of Population Employed in Legal Services & Support in the United States?
Percentage of Population Employed in Legal Services & Support in the United States is 1.2%.