Des Moines, WA Map & Demographics
Des Moines Map
Des Moines Overview
$42,528
PER CAPITA INCOME
$94,972
AVG FAMILY INCOME
$81,362
AVG HOUSEHOLD INCOME
21.5%
WAGE / INCOME GAP [ % ]
78.5¢/ $1
WAGE / INCOME GAP [ $ ]
0.42
INEQUALITY / GINI INDEX
32,667
TOTAL POPULATION
15,732
MALE POPULATION
16,935
FEMALE POPULATION
92.90
MALES / 100 FEMALES
107.65
FEMALES / 100 MALES
38.2
MEDIAN AGE
3.1
AVG FAMILY SIZE
2.6
AVG HOUSEHOLD SIZE
16,716
LABOR FORCE [ PEOPLE ]
63.3%
PERCENT IN LABOR FORCE
8.2%
UNEMPLOYMENT RATE
Income in Des Moines
Income Overview in Des Moines
Per Capita Income in Des Moines is $42,528, while median incomes of families and households are $94,972 and $81,362 respectively.
| Characteristic | Number | Measure |
| Per Capita Income | 32,667 | $42,528 |
| Median Family Income | 7,643 | $94,972 |
| Mean Family Income | 7,643 | $120,144 |
| Median Household Income | 12,369 | $81,362 |
| Mean Household Income | 12,369 | $106,820 |
| Income Deficit | 7,643 | $0 |
| Wage / Income Gap (%) | 32,667 | 21.48% |
| Wage / Income Gap ($) | 32,667 | 78.52¢ per $1 |
| Gini / Inequality Index | 32,667 | 0.42 |
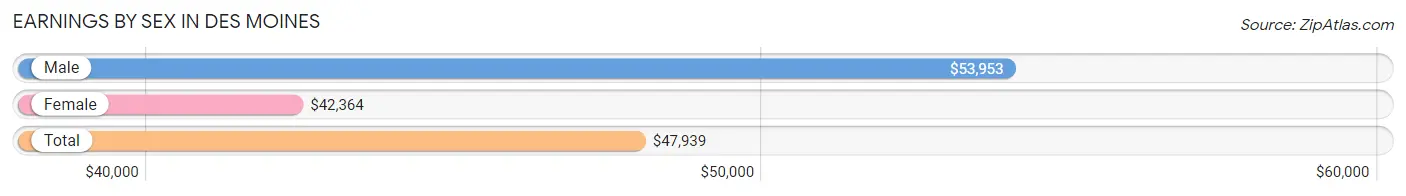
Earnings by Sex in Des Moines
Average Earnings in Des Moines are $47,939, $53,953 for men and $42,364 for women, a difference of 21.5%.
| Sex | Number | Average Earnings |
| Male | 9,255 (53.5%) | $53,953 |
| Female | 8,044 (46.5%) | $42,364 |
| Total | 17,299 (100.0%) | $47,939 |
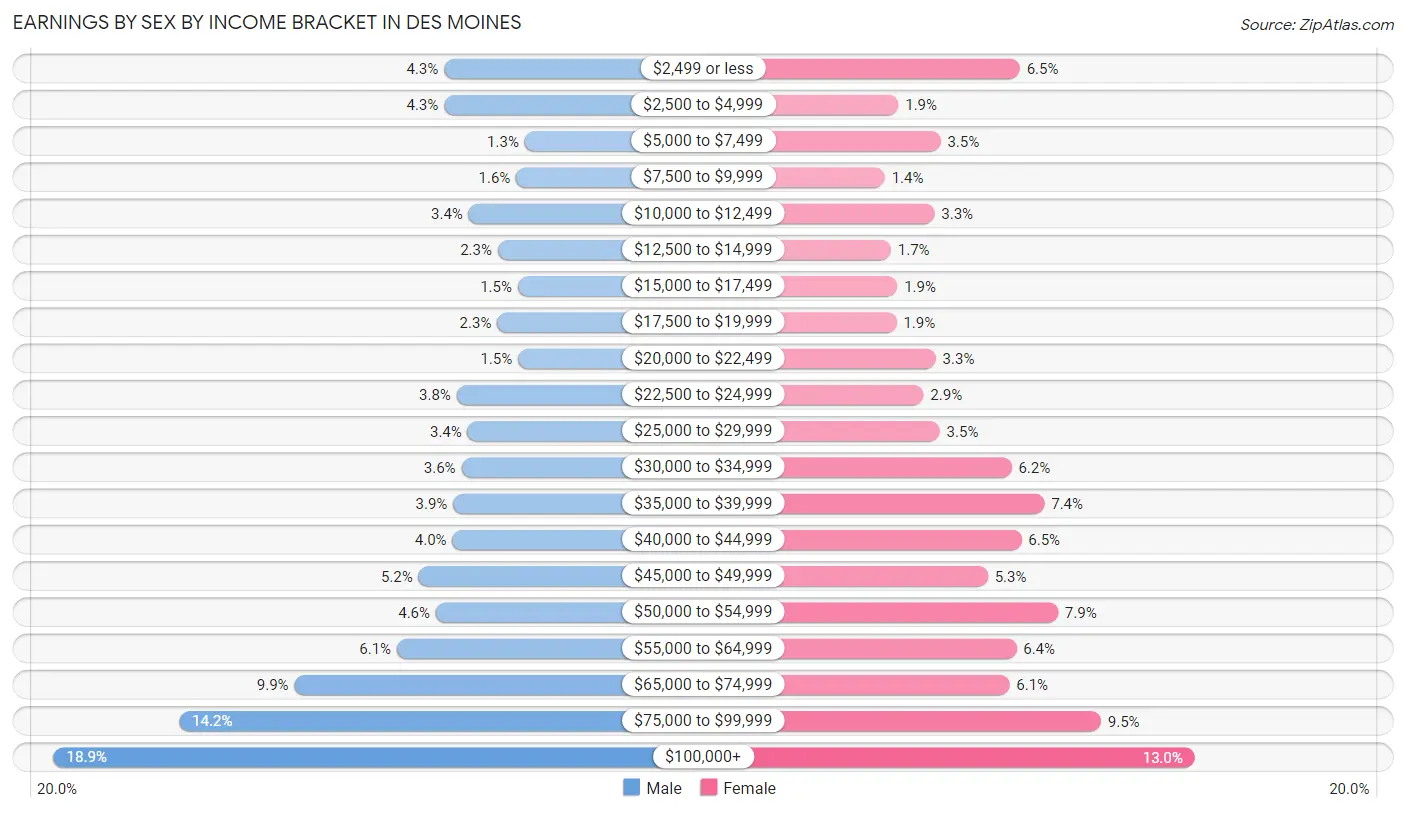
Earnings by Sex by Income Bracket in Des Moines
The most common earnings brackets in Des Moines are $100,000+ for men (1,750 | 18.9%) and $100,000+ for women (1,049 | 13.0%).
| Income | Male | Female |
| $2,499 or less | 396 (4.3%) | 521 (6.5%) |
| $2,500 to $4,999 | 396 (4.3%) | 155 (1.9%) |
| $5,000 to $7,499 | 117 (1.3%) | 282 (3.5%) |
| $7,500 to $9,999 | 146 (1.6%) | 114 (1.4%) |
| $10,000 to $12,499 | 311 (3.4%) | 264 (3.3%) |
| $12,500 to $14,999 | 210 (2.3%) | 133 (1.7%) |
| $15,000 to $17,499 | 141 (1.5%) | 152 (1.9%) |
| $17,500 to $19,999 | 212 (2.3%) | 150 (1.9%) |
| $20,000 to $22,499 | 140 (1.5%) | 268 (3.3%) |
| $22,500 to $24,999 | 353 (3.8%) | 231 (2.9%) |
| $25,000 to $29,999 | 315 (3.4%) | 280 (3.5%) |
| $30,000 to $34,999 | 336 (3.6%) | 496 (6.2%) |
| $35,000 to $39,999 | 365 (3.9%) | 595 (7.4%) |
| $40,000 to $44,999 | 367 (4.0%) | 526 (6.5%) |
| $45,000 to $49,999 | 485 (5.2%) | 425 (5.3%) |
| $50,000 to $54,999 | 425 (4.6%) | 636 (7.9%) |
| $55,000 to $64,999 | 560 (6.0%) | 511 (6.4%) |
| $65,000 to $74,999 | 915 (9.9%) | 490 (6.1%) |
| $75,000 to $99,999 | 1,315 (14.2%) | 766 (9.5%) |
| $100,000+ | 1,750 (18.9%) | 1,049 (13.0%) |
| Total | 9,255 (100.0%) | 8,044 (100.0%) |
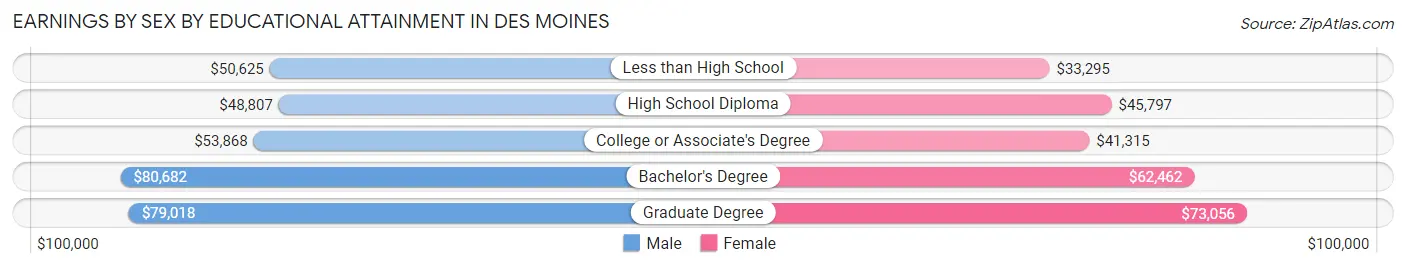
Earnings by Sex by Educational Attainment in Des Moines
Average earnings in Des Moines are $59,709 for men and $49,531 for women, a difference of 17.1%. Men with an educational attainment of bachelor's degree enjoy the highest average annual earnings of $80,682, while those with high school diploma education earn the least with $48,807. Women with an educational attainment of graduate degree earn the most with the average annual earnings of $73,056, while those with less than high school education have the smallest earnings of $33,295.
| Educational Attainment | Male Income | Female Income |
| Less than High School | $50,625 | $33,295 |
| High School Diploma | $48,807 | $45,797 |
| College or Associate's Degree | $53,868 | $41,315 |
| Bachelor's Degree | $80,682 | $62,462 |
| Graduate Degree | $79,018 | $73,056 |
| Total | $59,709 | $49,531 |
Family Income in Des Moines
Family Income Brackets in Des Moines
According to the Des Moines family income data, there are 1,727 families falling into the $100,000 to $149,999 income range, which is the most common income bracket and makes up 22.6% of all families. Conversely, the $10,000 to $14,999 income bracket is the least frequent group with only 31 families (0.4%) belonging to this category.
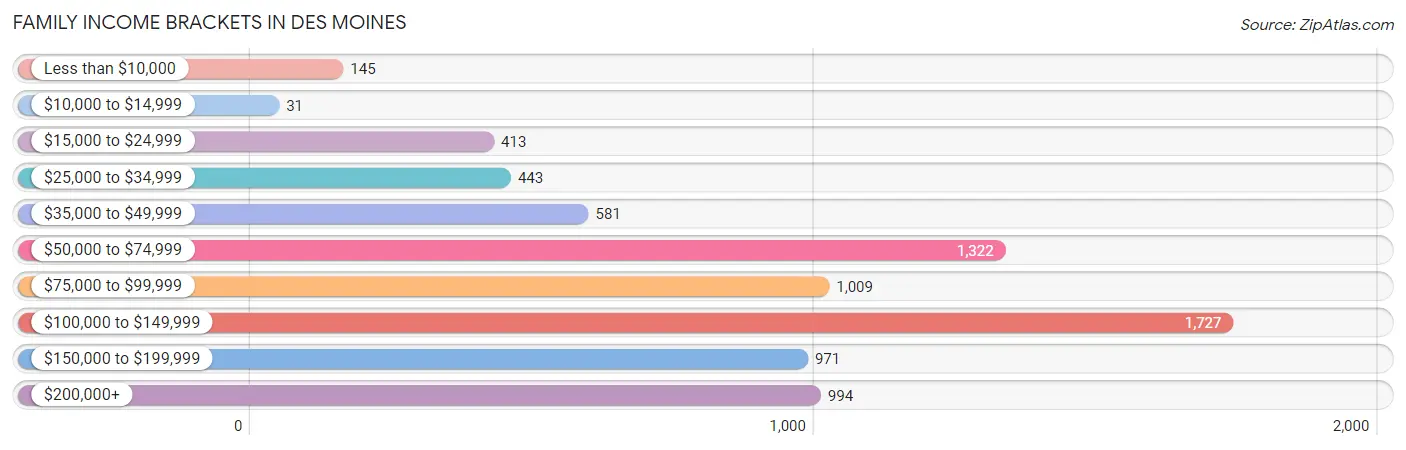
| Income Bracket | # Families | % Families |
| Less than $10,000 | 145 | 1.9% |
| $10,000 to $14,999 | 31 | 0.4% |
| $15,000 to $24,999 | 413 | 5.4% |
| $25,000 to $34,999 | 443 | 5.8% |
| $35,000 to $49,999 | 581 | 7.6% |
| $50,000 to $74,999 | 1,322 | 17.3% |
| $75,000 to $99,999 | 1,009 | 13.2% |
| $100,000 to $149,999 | 1,727 | 22.6% |
| $150,000 to $199,999 | 971 | 12.7% |
| $200,000+ | 994 | 13.0% |
Family Income by Famaliy Size in Des Moines
7+ person families (195 | 2.5%) account for the highest median family income in Des Moines with $137,768 per family, while 2-person families (3,523 | 46.1%) have the highest median income of $47,964 per family member.
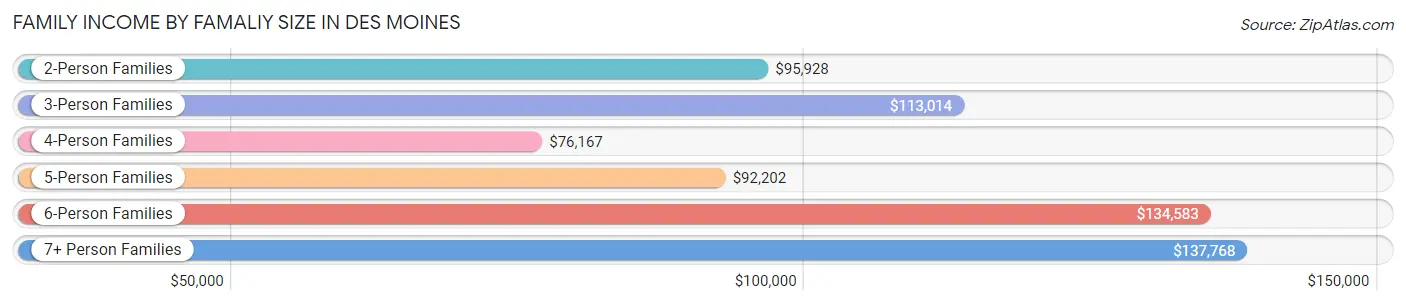
| Income Bracket | # Families | Median Income |
| 2-Person Families | 3,523 (46.1%) | $95,928 |
| 3-Person Families | 1,783 (23.3%) | $113,014 |
| 4-Person Families | 1,458 (19.1%) | $76,167 |
| 5-Person Families | 555 (7.3%) | $92,202 |
| 6-Person Families | 129 (1.7%) | $134,583 |
| 7+ Person Families | 195 (2.5%) | $137,768 |
| Total | 7,643 (100.0%) | $94,972 |
Family Income by Number of Earners in Des Moines
The median family income in Des Moines is $94,972, with families comprising 3+ earners (825) having the highest median family income of $162,599, while families with 1 earner (2,891) have the lowest median family income of $62,192, accounting for 10.8% and 37.8% of families, respectively.
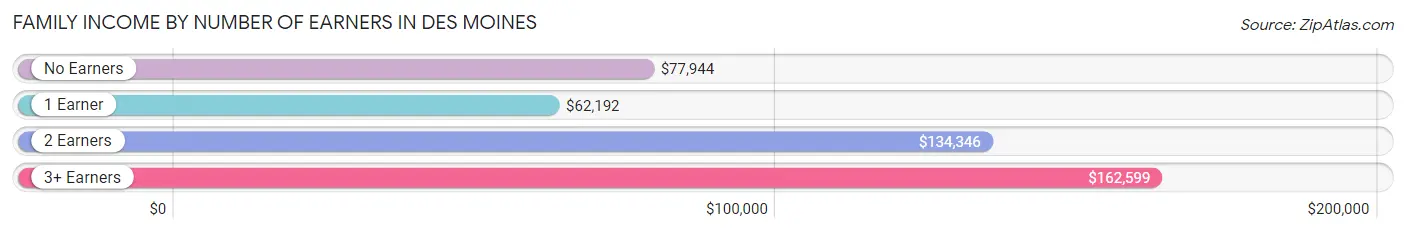
| Number of Earners | # Families | Median Income |
| No Earners | 1,073 (14.0%) | $77,944 |
| 1 Earner | 2,891 (37.8%) | $62,192 |
| 2 Earners | 2,854 (37.3%) | $134,346 |
| 3+ Earners | 825 (10.8%) | $162,599 |
| Total | 7,643 (100.0%) | $94,972 |
Household Income in Des Moines
Household Income Brackets in Des Moines
With 2,523 households falling in the category, the $100,000 to $149,999 income range is the most frequent in Des Moines, accounting for 20.4% of all households. In contrast, only 136 households (1.1%) fall into the $10,000 to $14,999 income bracket, making it the least populous group.
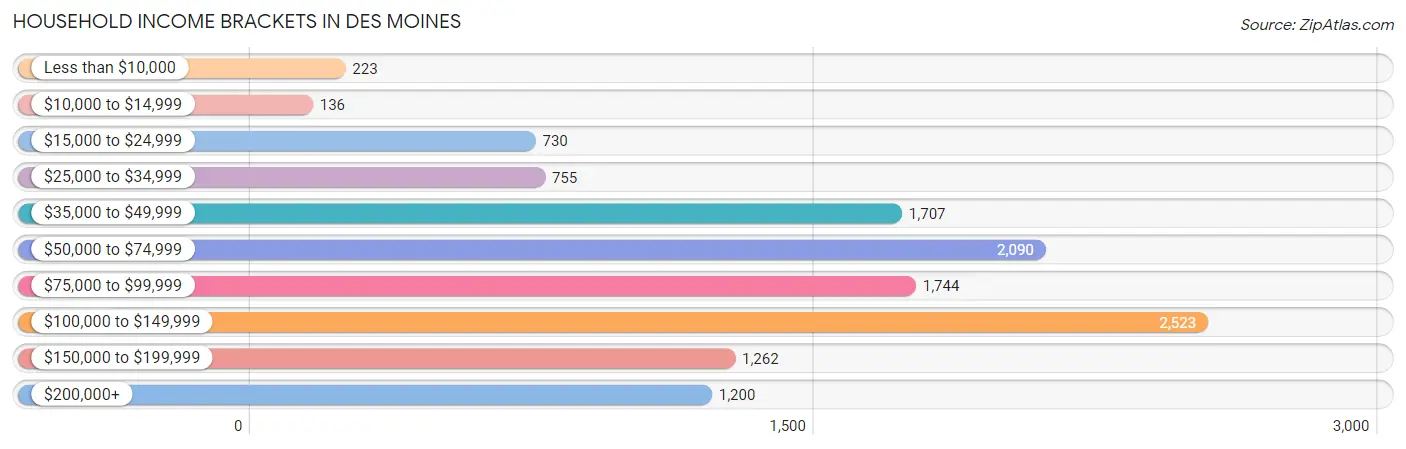
| Income Bracket | # Households | % Households |
| Less than $10,000 | 223 | 1.8% |
| $10,000 to $14,999 | 136 | 1.1% |
| $15,000 to $24,999 | 730 | 5.9% |
| $25,000 to $34,999 | 755 | 6.1% |
| $35,000 to $49,999 | 1,707 | 13.8% |
| $50,000 to $74,999 | 2,090 | 16.9% |
| $75,000 to $99,999 | 1,744 | 14.1% |
| $100,000 to $149,999 | 2,523 | 20.4% |
| $150,000 to $199,999 | 1,262 | 10.2% |
| $200,000+ | 1,200 | 9.7% |
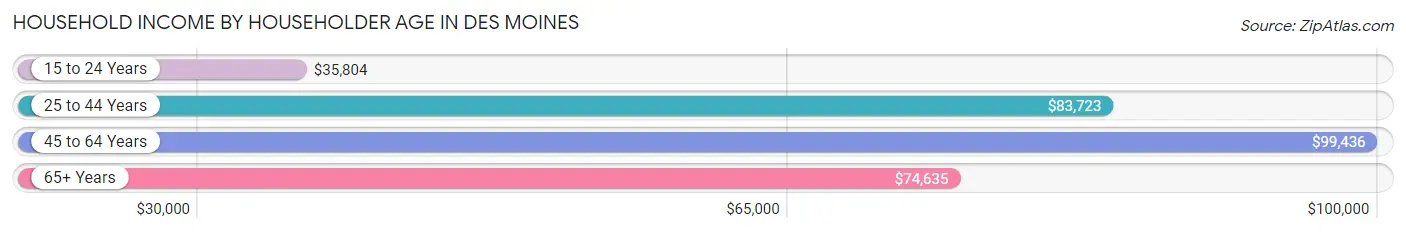
Household Income by Householder Age in Des Moines
The median household income in Des Moines is $81,362, with the highest median household income of $99,436 found in the 45 to 64 years age bracket for the primary householder. A total of 4,165 households (33.7%) fall into this category. Meanwhile, the 15 to 24 years age bracket for the primary householder has the lowest median household income of $35,804, with 276 households (2.2%) in this group.
| Income Bracket | # Households | Median Income |
| 15 to 24 Years | 276 (2.2%) | $35,804 |
| 25 to 44 Years | 4,554 (36.8%) | $83,723 |
| 45 to 64 Years | 4,165 (33.7%) | $99,436 |
| 65+ Years | 3,374 (27.3%) | $74,635 |
| Total | 12,369 (100.0%) | $81,362 |
Poverty in Des Moines
Income Below Poverty by Sex and Age in Des Moines
With 11.7% poverty level for males and 11.9% for females among the residents of Des Moines, 18 to 24 year old males and 18 to 24 year old females are the most vulnerable to poverty, with 334 males (27.7%) and 381 females (29.7%) in their respective age groups living below the poverty level.
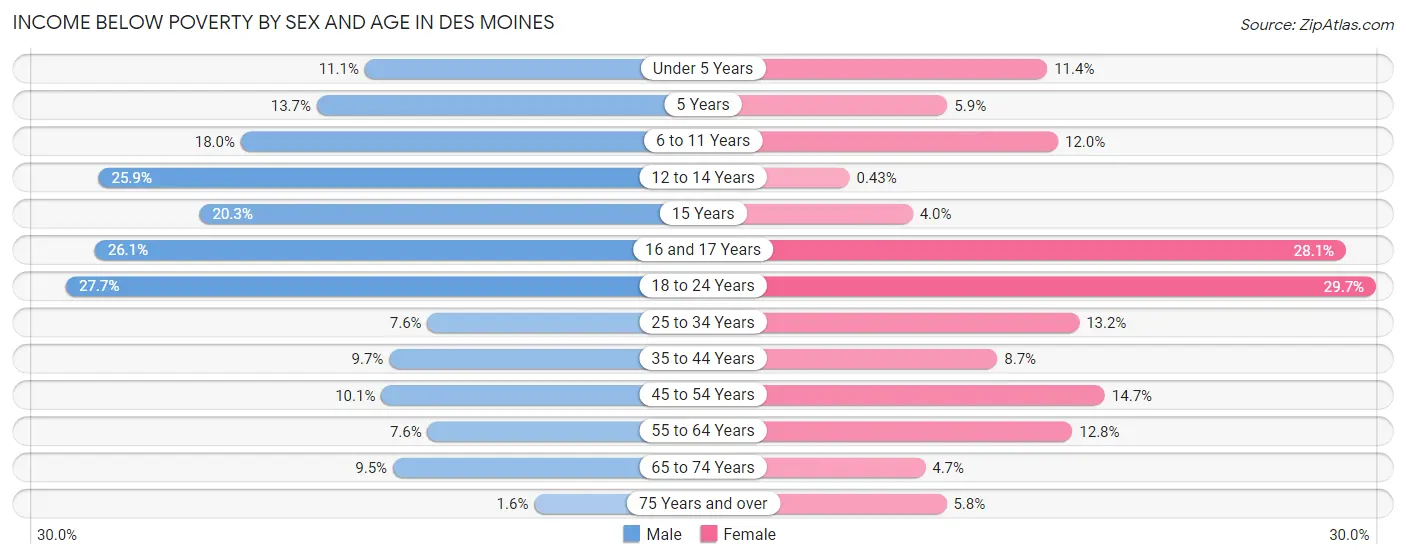
| Age Bracket | Male | Female |
| Under 5 Years | 90 (11.1%) | 164 (11.4%) |
| 5 Years | 46 (13.7%) | 6 (5.9%) |
| 6 to 11 Years | 206 (18.0%) | 101 (12.0%) |
| 12 to 14 Years | 125 (25.9%) | 3 (0.4%) |
| 15 Years | 31 (20.3%) | 9 (4.0%) |
| 16 and 17 Years | 66 (26.1%) | 112 (28.1%) |
| 18 to 24 Years | 334 (27.7%) | 381 (29.7%) |
| 25 to 34 Years | 175 (7.6%) | 343 (13.2%) |
| 35 to 44 Years | 245 (9.7%) | 200 (8.7%) |
| 45 to 54 Years | 210 (10.1%) | 299 (14.6%) |
| 55 to 64 Years | 145 (7.6%) | 211 (12.8%) |
| 65 to 74 Years | 107 (9.5%) | 74 (4.6%) |
| 75 Years and over | 17 (1.6%) | 87 (5.8%) |
| Total | 1,797 (11.7%) | 1,990 (11.9%) |
Income Above Poverty by Sex and Age in Des Moines
According to the poverty statistics in Des Moines, males aged 75 years and over and females aged 12 to 14 years are the age groups that are most secure financially, with 98.4% of males and 99.6% of females in these age groups living above the poverty line.
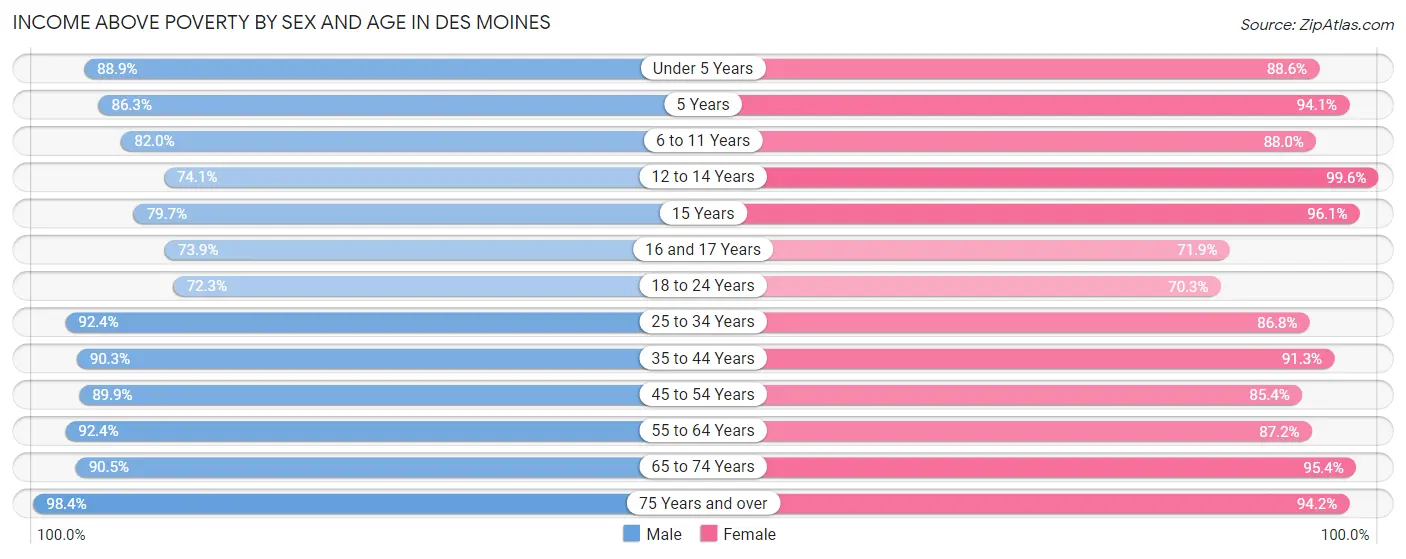
| Age Bracket | Male | Female |
| Under 5 Years | 724 (88.9%) | 1,269 (88.6%) |
| 5 Years | 289 (86.3%) | 96 (94.1%) |
| 6 to 11 Years | 941 (82.0%) | 738 (88.0%) |
| 12 to 14 Years | 358 (74.1%) | 702 (99.6%) |
| 15 Years | 122 (79.7%) | 219 (96.1%) |
| 16 and 17 Years | 187 (73.9%) | 287 (71.9%) |
| 18 to 24 Years | 872 (72.3%) | 900 (70.3%) |
| 25 to 34 Years | 2,138 (92.4%) | 2,252 (86.8%) |
| 35 to 44 Years | 2,280 (90.3%) | 2,110 (91.3%) |
| 45 to 54 Years | 1,860 (89.9%) | 1,742 (85.4%) |
| 55 to 64 Years | 1,772 (92.4%) | 1,432 (87.2%) |
| 65 to 74 Years | 1,021 (90.5%) | 1,519 (95.4%) |
| 75 Years and over | 1,034 (98.4%) | 1,405 (94.2%) |
| Total | 13,598 (88.3%) | 14,671 (88.1%) |
Income Below Poverty Among Married-Couple Families in Des Moines
The poverty statistics for married-couple families in Des Moines show that 3.9% or 203 of the total 5,205 families live below the poverty line. Families with 5 or more children have the highest poverty rate of 18.9%, comprising of 7 families. On the other hand, families with no children have the lowest poverty rate of 1.4%, which includes 40 families.
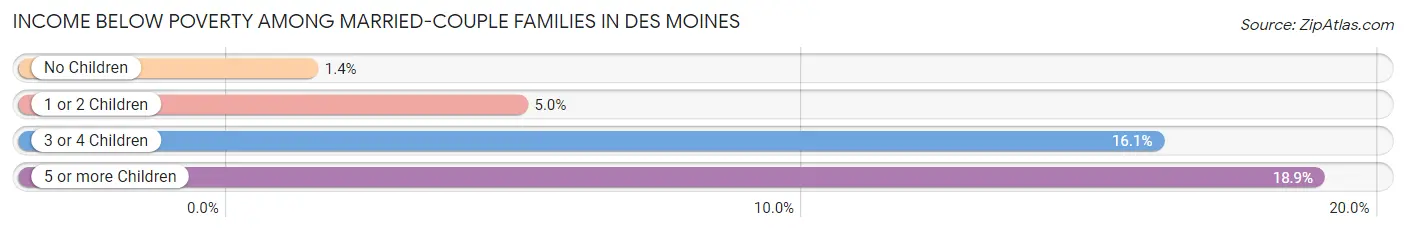
| Children | Above Poverty | Below Poverty |
| No Children | 2,839 (98.6%) | 40 (1.4%) |
| 1 or 2 Children | 1,826 (95.0%) | 97 (5.0%) |
| 3 or 4 Children | 307 (83.9%) | 59 (16.1%) |
| 5 or more Children | 30 (81.1%) | 7 (18.9%) |
| Total | 5,002 (96.1%) | 203 (3.9%) |
Income Below Poverty Among Single-Parent Households in Des Moines
According to the poverty data in Des Moines, 5.8% or 46 single-father households and 15.3% or 253 single-mother households are living below the poverty line. Among single-father households, those with no children have the highest poverty rate, with 46 households (11.4%) experiencing poverty. Likewise, among single-mother households, those with 5 or more children have the highest poverty rate, with 8 households (100.0%) falling below the poverty line.
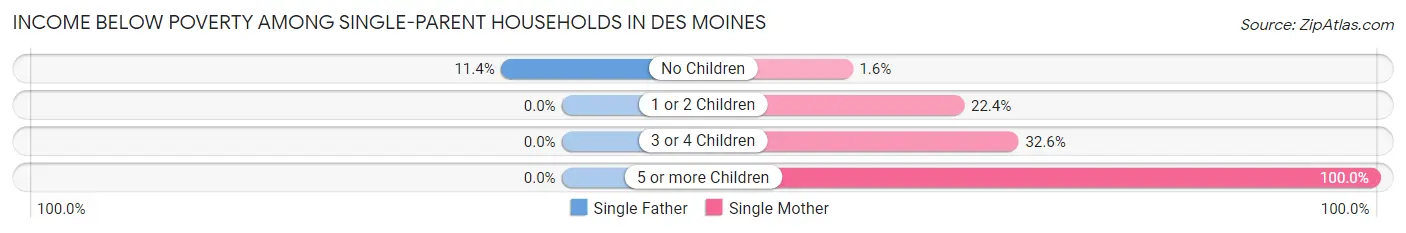
| Children | Single Father | Single Mother |
| No Children | 46 (11.4%) | 11 (1.6%) |
| 1 or 2 Children | 0 (0.0%) | 178 (22.4%) |
| 3 or 4 Children | 0 (0.0%) | 56 (32.6%) |
| 5 or more Children | 0 (0.0%) | 8 (100.0%) |
| Total | 46 (5.8%) | 253 (15.3%) |
Income Below Poverty Among Married-Couple vs Single-Parent Households in Des Moines
The poverty data for Des Moines shows that 203 of the married-couple family households (3.9%) and 299 of the single-parent households (12.3%) are living below the poverty level. Within the married-couple family households, those with 5 or more children have the highest poverty rate, with 7 households (18.9%) falling below the poverty line. Among the single-parent households, those with 5 or more children have the highest poverty rate, with 8 household (36.4%) living below poverty.
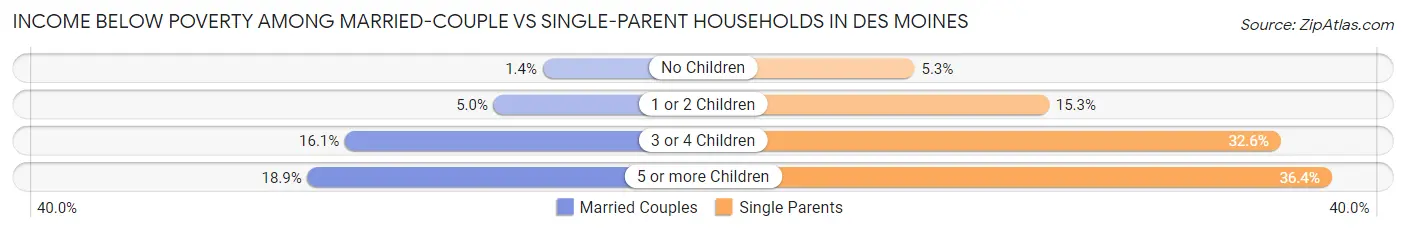
| Children | Married-Couple Families | Single-Parent Households |
| No Children | 40 (1.4%) | 57 (5.3%) |
| 1 or 2 Children | 97 (5.0%) | 178 (15.3%) |
| 3 or 4 Children | 59 (16.1%) | 56 (32.6%) |
| 5 or more Children | 7 (18.9%) | 8 (36.4%) |
| Total | 203 (3.9%) | 299 (12.3%) |
Race in Des Moines
The most populous races in Des Moines are White / Caucasian (17,351 | 53.1%), Hispanic or Latino (5,948 | 18.2%), and Asian (3,941 | 12.1%).
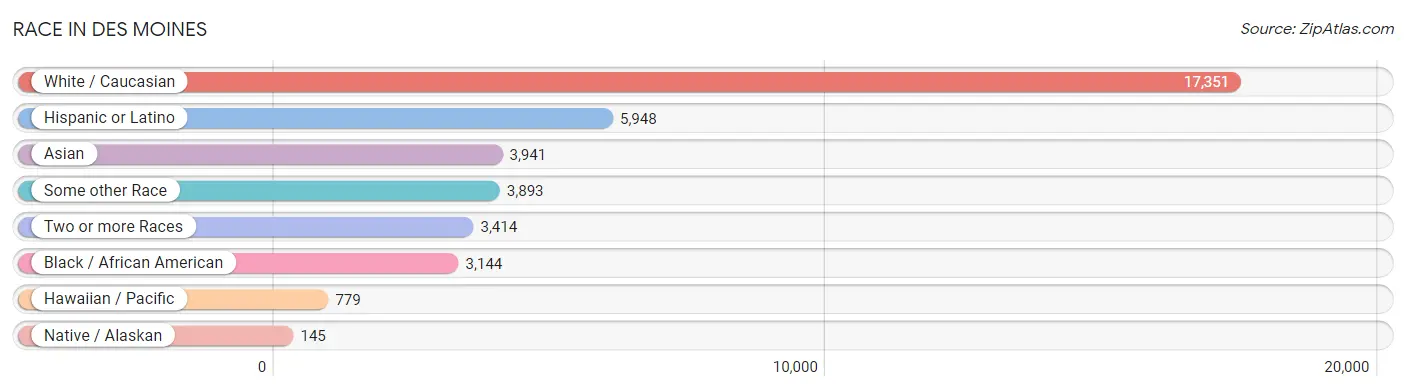
| Race | # Population | % Population |
| Asian | 3,941 | 12.1% |
| Black / African American | 3,144 | 9.6% |
| Hawaiian / Pacific | 779 | 2.4% |
| Hispanic or Latino | 5,948 | 18.2% |
| Native / Alaskan | 145 | 0.4% |
| White / Caucasian | 17,351 | 53.1% |
| Two or more Races | 3,414 | 10.4% |
| Some other Race | 3,893 | 11.9% |
| Total | 32,667 | 100.0% |
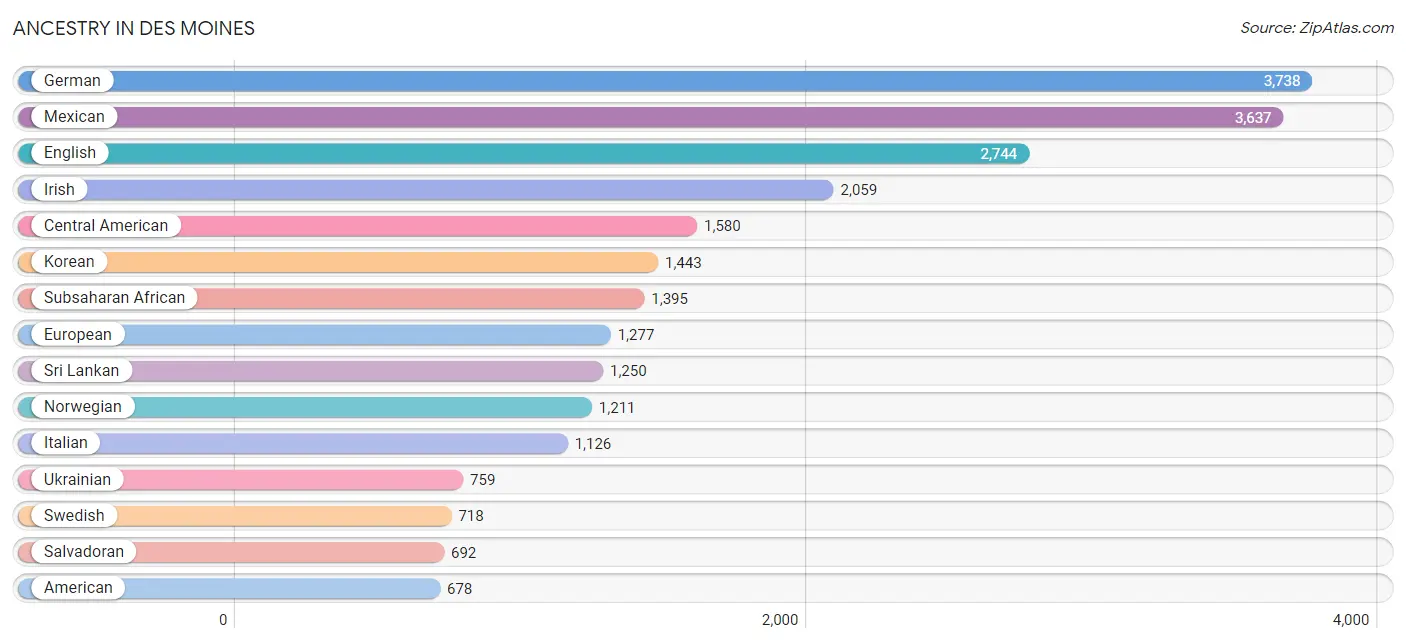
Ancestry in Des Moines
The most populous ancestries reported in Des Moines are German (3,738 | 11.4%), Mexican (3,637 | 11.1%), English (2,744 | 8.4%), Irish (2,059 | 6.3%), and Central American (1,580 | 4.8%), together accounting for 42.1% of all Des Moines residents.
| Ancestry | # Population | % Population |
| Afghan | 260 | 0.8% |
| African | 480 | 1.5% |
| Aleut | 124 | 0.4% |
| American | 678 | 2.1% |
| Apache | 72 | 0.2% |
| Arab | 483 | 1.5% |
| Argentinean | 38 | 0.1% |
| Australian | 4 | 0.0% |
| Austrian | 82 | 0.3% |
| Bangladeshi | 117 | 0.4% |
| Belgian | 32 | 0.1% |
| Bhutanese | 308 | 0.9% |
| Blackfeet | 147 | 0.4% |
| Brazilian | 41 | 0.1% |
| British | 174 | 0.5% |
| Bulgarian | 44 | 0.1% |
| Burmese | 228 | 0.7% |
| Canadian | 105 | 0.3% |
| Celtic | 11 | 0.0% |
| Central American | 1,580 | 4.8% |
| Cherokee | 140 | 0.4% |
| Cheyenne | 2 | 0.0% |
| Chilean | 71 | 0.2% |
| Chippewa | 10 | 0.0% |
| Colombian | 7 | 0.0% |
| Costa Rican | 23 | 0.1% |
| Croatian | 36 | 0.1% |
| Crow | 9 | 0.0% |
| Cuban | 204 | 0.6% |
| Czech | 80 | 0.2% |
| Czechoslovakian | 8 | 0.0% |
| Danish | 341 | 1.0% |
| Dominican | 10 | 0.0% |
| Dutch | 224 | 0.7% |
| Eastern European | 46 | 0.1% |
| Ecuadorian | 15 | 0.1% |
| English | 2,744 | 8.4% |
| Estonian | 53 | 0.2% |
| Ethiopian | 416 | 1.3% |
| European | 1,277 | 3.9% |
| Filipino | 190 | 0.6% |
| Finnish | 92 | 0.3% |
| French | 508 | 1.6% |
| French American Indian | 12 | 0.0% |
| French Canadian | 37 | 0.1% |
| German | 3,738 | 11.4% |
| Greek | 59 | 0.2% |
| Guamanian / Chamorro | 6 | 0.0% |
| Guatemalan | 371 | 1.1% |
| Honduran | 494 | 1.5% |
| Hungarian | 56 | 0.2% |
| Icelander | 30 | 0.1% |
| Indian (Asian) | 346 | 1.1% |
| Iranian | 15 | 0.1% |
| Iraqi | 436 | 1.3% |
| Irish | 2,059 | 6.3% |
| Iroquois | 23 | 0.1% |
| Italian | 1,126 | 3.5% |
| Jamaican | 10 | 0.0% |
| Japanese | 305 | 0.9% |
| Kenyan | 155 | 0.5% |
| Korean | 1,443 | 4.4% |
| Latvian | 29 | 0.1% |
| Lithuanian | 16 | 0.1% |
| Malaysian | 198 | 0.6% |
| Mexican | 3,637 | 11.1% |
| Mexican American Indian | 109 | 0.3% |
| Native Hawaiian | 99 | 0.3% |
| Northern European | 84 | 0.3% |
| Norwegian | 1,211 | 3.7% |
| Pakistani | 59 | 0.2% |
| Peruvian | 63 | 0.2% |
| Polish | 607 | 1.9% |
| Portuguese | 31 | 0.1% |
| Puerto Rican | 13 | 0.0% |
| Puget Sound Salish | 68 | 0.2% |
| Romanian | 31 | 0.1% |
| Russian | 227 | 0.7% |
| Salvadoran | 692 | 2.1% |
| Samoan | 420 | 1.3% |
| Scandinavian | 235 | 0.7% |
| Scotch-Irish | 417 | 1.3% |
| Scottish | 593 | 1.8% |
| Sioux | 7 | 0.0% |
| Slavic | 45 | 0.1% |
| Slovak | 5 | 0.0% |
| Slovene | 28 | 0.1% |
| Somali | 257 | 0.8% |
| South American | 239 | 0.7% |
| Spaniard | 43 | 0.1% |
| Spanish | 148 | 0.4% |
| Sri Lankan | 1,250 | 3.8% |
| Subsaharan African | 1,395 | 4.3% |
| Swedish | 718 | 2.2% |
| Swiss | 130 | 0.4% |
| Thai | 624 | 1.9% |
| Tlingit-Haida | 17 | 0.1% |
| Tongan | 6 | 0.0% |
| Tsimshian | 84 | 0.3% |
| Turkish | 7 | 0.0% |
| Ukrainian | 759 | 2.3% |
| Venezuelan | 45 | 0.1% |
| Welsh | 256 | 0.8% |
| Yakama | 6 | 0.0% |
| Yugoslavian | 27 | 0.1% | View All 105 Rows |
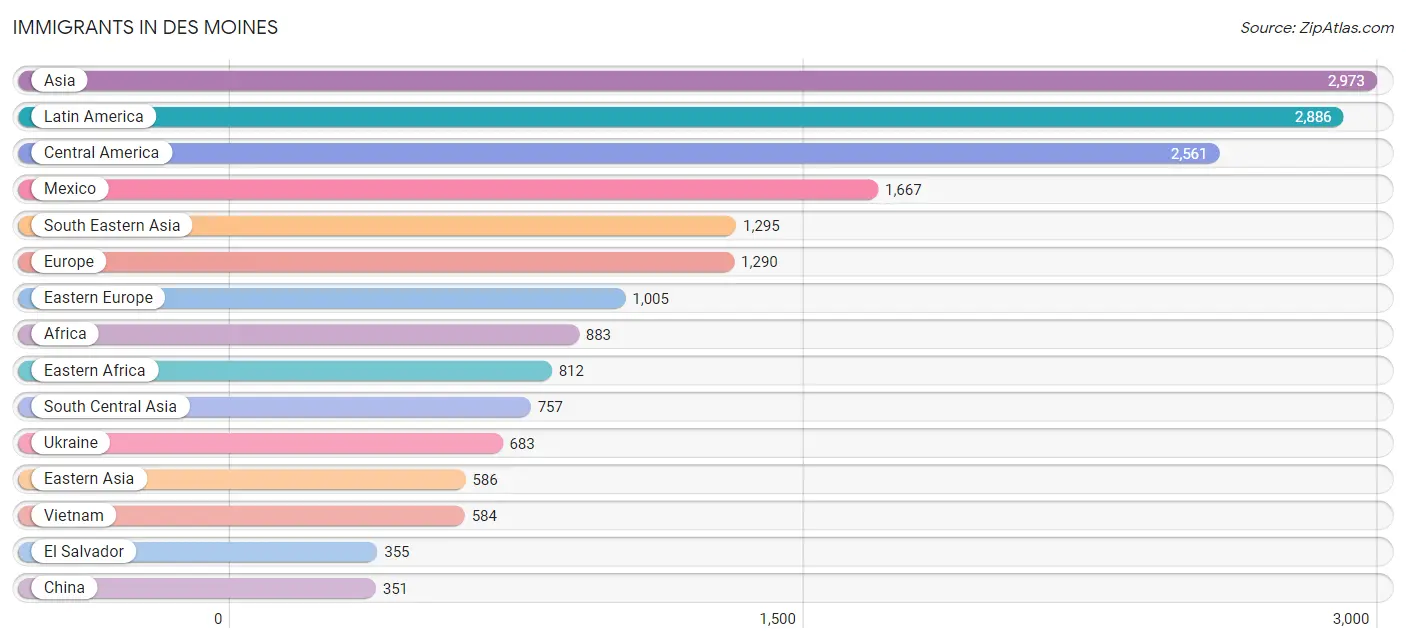
Immigrants in Des Moines
The most numerous immigrant groups reported in Des Moines came from Asia (2,973 | 9.1%), Latin America (2,886 | 8.8%), Central America (2,561 | 7.8%), Mexico (1,667 | 5.1%), and South Eastern Asia (1,295 | 4.0%), together accounting for 34.8% of all Des Moines residents.
| Immigration Origin | # Population | % Population |
| Afghanistan | 260 | 0.8% |
| Africa | 883 | 2.7% |
| Argentina | 20 | 0.1% |
| Asia | 2,973 | 9.1% |
| Bosnia and Herzegovina | 18 | 0.1% |
| Brazil | 41 | 0.1% |
| Bulgaria | 75 | 0.2% |
| Cambodia | 127 | 0.4% |
| Canada | 91 | 0.3% |
| Caribbean | 108 | 0.3% |
| Central America | 2,561 | 7.8% |
| Chile | 60 | 0.2% |
| China | 351 | 1.1% |
| Colombia | 7 | 0.0% |
| Congo | 29 | 0.1% |
| Costa Rica | 23 | 0.1% |
| Cuba | 108 | 0.3% |
| Eastern Africa | 812 | 2.5% |
| Eastern Asia | 586 | 1.8% |
| Eastern Europe | 1,005 | 3.1% |
| El Salvador | 355 | 1.1% |
| England | 9 | 0.0% |
| Ethiopia | 286 | 0.9% |
| Europe | 1,290 | 4.0% |
| Fiji | 45 | 0.1% |
| Germany | 58 | 0.2% |
| Guatemala | 265 | 0.8% |
| Honduras | 251 | 0.8% |
| Hong Kong | 29 | 0.1% |
| India | 228 | 0.7% |
| Indonesia | 15 | 0.1% |
| Iran | 15 | 0.1% |
| Iraq | 335 | 1.0% |
| Italy | 75 | 0.2% |
| Japan | 95 | 0.3% |
| Kazakhstan | 34 | 0.1% |
| Kenya | 200 | 0.6% |
| Korea | 140 | 0.4% |
| Laos | 87 | 0.3% |
| Latin America | 2,886 | 8.8% |
| Latvia | 13 | 0.0% |
| Lithuania | 14 | 0.0% |
| Malaysia | 92 | 0.3% |
| Mexico | 1,667 | 5.1% |
| Micronesia | 28 | 0.1% |
| Middle Africa | 29 | 0.1% |
| Nigeria | 22 | 0.1% |
| Northern Europe | 39 | 0.1% |
| Oceania | 319 | 1.0% |
| Pakistan | 213 | 0.6% |
| Peru | 44 | 0.1% |
| Philippines | 301 | 0.9% |
| Poland | 116 | 0.4% |
| Portugal | 17 | 0.1% |
| Romania | 30 | 0.1% |
| Russia | 28 | 0.1% |
| Somalia | 252 | 0.8% |
| South America | 217 | 0.7% |
| South Central Asia | 757 | 2.3% |
| South Eastern Asia | 1,295 | 4.0% |
| Southern Europe | 141 | 0.4% |
| Spain | 49 | 0.2% |
| Sri Lanka | 7 | 0.0% |
| Sweden | 9 | 0.0% |
| Switzerland | 47 | 0.1% |
| Taiwan | 179 | 0.5% |
| Thailand | 89 | 0.3% |
| Uganda | 74 | 0.2% |
| Ukraine | 683 | 2.1% |
| Venezuela | 45 | 0.1% |
| Vietnam | 584 | 1.8% |
| Western Africa | 22 | 0.1% |
| Western Asia | 335 | 1.0% |
| Western Europe | 105 | 0.3% | View All 74 Rows |
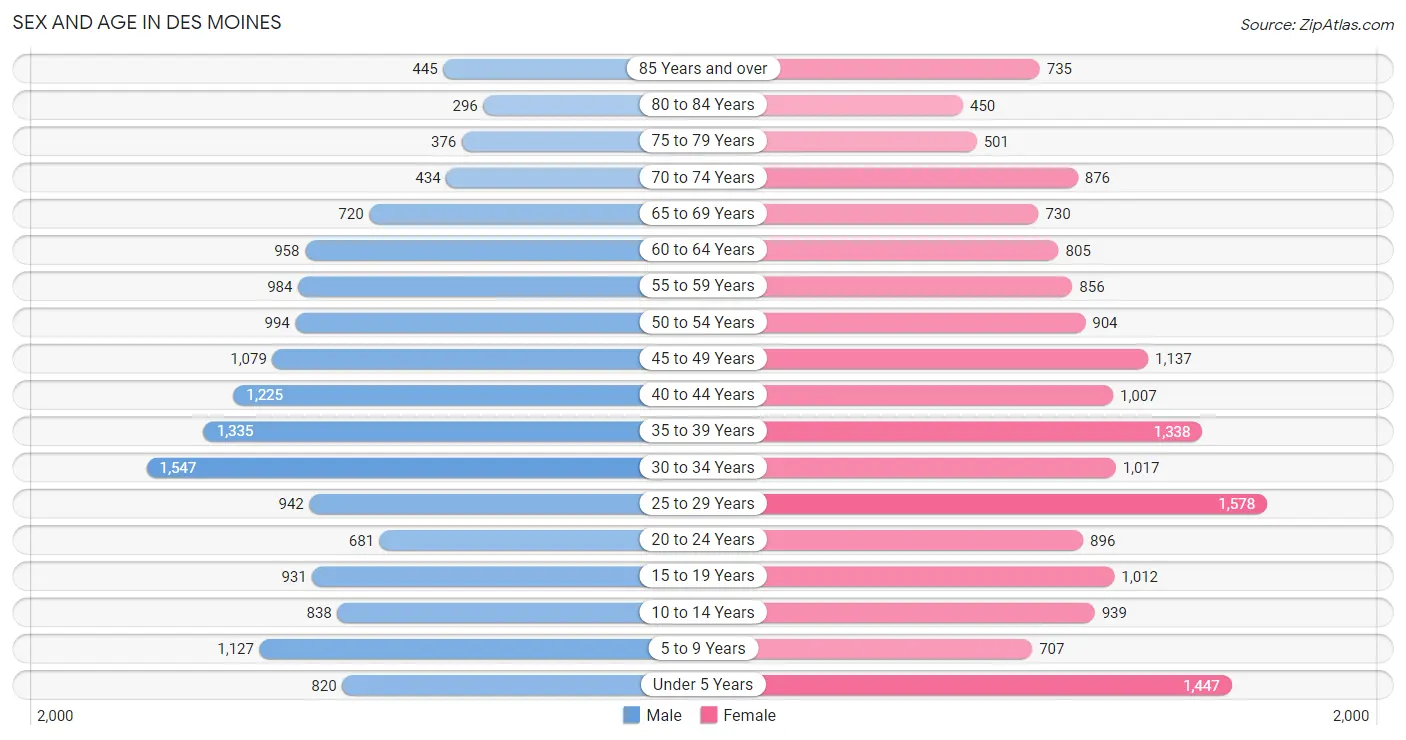
Sex and Age in Des Moines
Sex and Age in Des Moines
The most populous age groups in Des Moines are 30 to 34 Years (1,547 | 9.8%) for men and 25 to 29 Years (1,578 | 9.3%) for women.
| Age Bracket | Male | Female |
| Under 5 Years | 820 (5.2%) | 1,447 (8.5%) |
| 5 to 9 Years | 1,127 (7.2%) | 707 (4.2%) |
| 10 to 14 Years | 838 (5.3%) | 939 (5.5%) |
| 15 to 19 Years | 931 (5.9%) | 1,012 (6.0%) |
| 20 to 24 Years | 681 (4.3%) | 896 (5.3%) |
| 25 to 29 Years | 942 (6.0%) | 1,578 (9.3%) |
| 30 to 34 Years | 1,547 (9.8%) | 1,017 (6.0%) |
| 35 to 39 Years | 1,335 (8.5%) | 1,338 (7.9%) |
| 40 to 44 Years | 1,225 (7.8%) | 1,007 (5.9%) |
| 45 to 49 Years | 1,079 (6.9%) | 1,137 (6.7%) |
| 50 to 54 Years | 994 (6.3%) | 904 (5.3%) |
| 55 to 59 Years | 984 (6.2%) | 856 (5.1%) |
| 60 to 64 Years | 958 (6.1%) | 805 (4.8%) |
| 65 to 69 Years | 720 (4.6%) | 730 (4.3%) |
| 70 to 74 Years | 434 (2.8%) | 876 (5.2%) |
| 75 to 79 Years | 376 (2.4%) | 501 (3.0%) |
| 80 to 84 Years | 296 (1.9%) | 450 (2.7%) |
| 85 Years and over | 445 (2.8%) | 735 (4.3%) |
| Total | 15,732 (100.0%) | 16,935 (100.0%) |
Families and Households in Des Moines
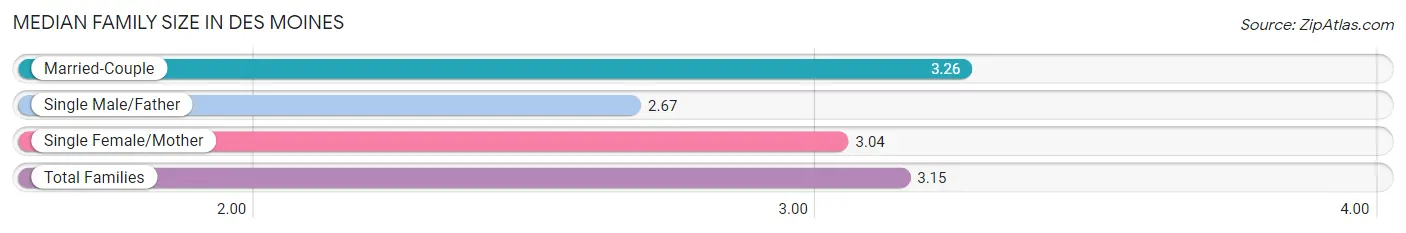
Median Family Size in Des Moines
The median family size in Des Moines is 3.15 persons per family, with married-couple families (5,205 | 68.1%) accounting for the largest median family size of 3.26 persons per family. On the other hand, single male/father families (790 | 10.3%) represent the smallest median family size with 2.67 persons per family.
| Family Type | # Families | Family Size |
| Married-Couple | 5,205 (68.1%) | 3.26 |
| Single Male/Father | 790 (10.3%) | 2.67 |
| Single Female/Mother | 1,648 (21.6%) | 3.04 |
| Total Families | 7,643 (100.0%) | 3.15 |
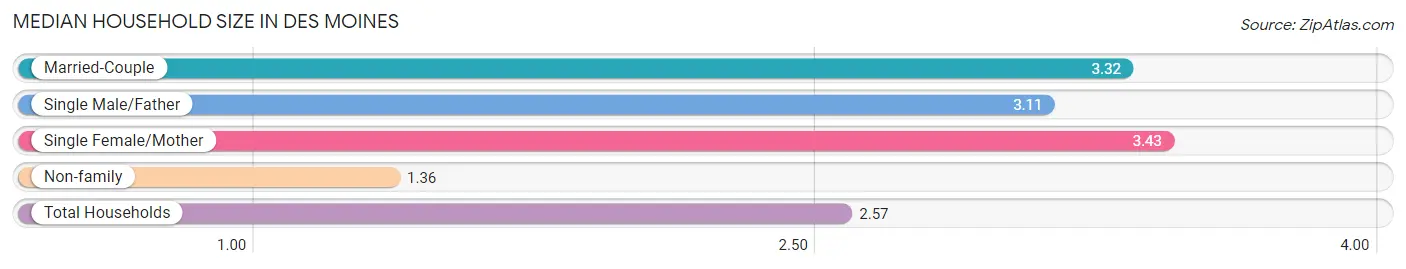
Median Household Size in Des Moines
The median household size in Des Moines is 2.57 persons per household, with single female/mother households (1,648 | 13.3%) accounting for the largest median household size of 3.43 persons per household. non-family households (4,726 | 38.2%) represent the smallest median household size with 1.36 persons per household.
| Household Type | # Households | Household Size |
| Married-Couple | 5,205 (42.1%) | 3.32 |
| Single Male/Father | 790 (6.4%) | 3.11 |
| Single Female/Mother | 1,648 (13.3%) | 3.43 |
| Non-family | 4,726 (38.2%) | 1.36 |
| Total Households | 12,369 (100.0%) | 2.57 |
Household Size by Marriage Status in Des Moines
Out of a total of 12,369 households in Des Moines, 7,643 (61.8%) are family households, while 4,726 (38.2%) are nonfamily households. The most numerous type of family households are 2-person households, comprising 3,021, and the most common type of nonfamily households are 1-person households, comprising 3,555.
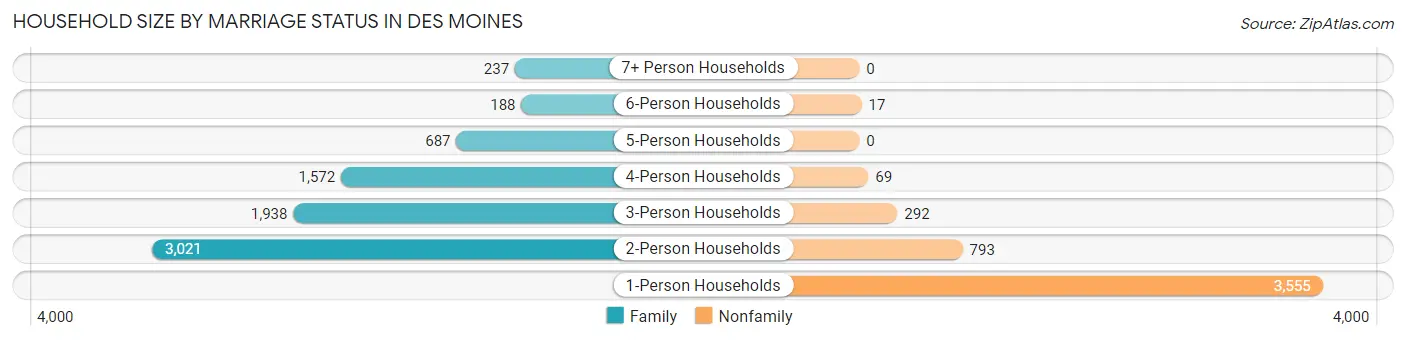
| Household Size | Family Households | Nonfamily Households |
| 1-Person Households | - | 3,555 (28.7%) |
| 2-Person Households | 3,021 (24.4%) | 793 (6.4%) |
| 3-Person Households | 1,938 (15.7%) | 292 (2.4%) |
| 4-Person Households | 1,572 (12.7%) | 69 (0.6%) |
| 5-Person Households | 687 (5.6%) | 0 (0.0%) |
| 6-Person Households | 188 (1.5%) | 17 (0.1%) |
| 7+ Person Households | 237 (1.9%) | 0 (0.0%) |
| Total | 7,643 (61.8%) | 4,726 (38.2%) |
Female Fertility in Des Moines
Fertility by Age in Des Moines
Average fertility rate in Des Moines is 62.0 births per 1,000 women. Women in the age bracket of 20 to 34 years have the highest fertility rate with 115.0 births per 1,000 women. Women in the age bracket of 20 to 34 years acount for 80.1% of all women with births.
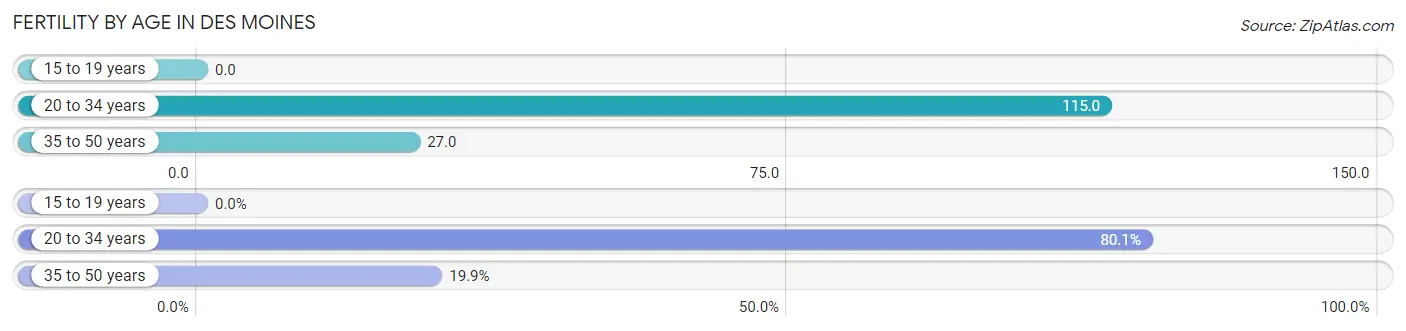
| Age Bracket | Women with Births | Births / 1,000 Women |
| 15 to 19 years | 0 (0.0%) | 0.0 |
| 20 to 34 years | 403 (80.1%) | 115.0 |
| 35 to 50 years | 100 (19.9%) | 27.0 |
| Total | 503 (100.0%) | 62.0 |
Fertility by Age by Marriage Status in Des Moines
57.5% of women with births (503) in Des Moines are married. The highest percentage of unmarried women with births falls into 20 to 34 years age bracket with 44.4% of them unmarried at the time of birth, while the lowest percentage of unmarried women with births belong to 35 to 50 years age bracket with 35.0% of them unmarried.
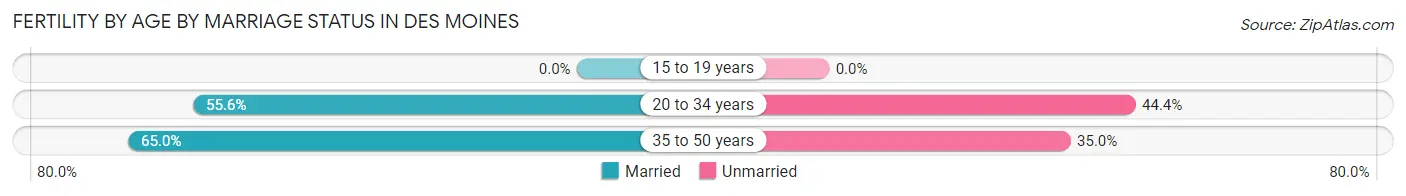
| Age Bracket | Married | Unmarried |
| 15 to 19 years | 0 (0.0%) | 0 (0.0%) |
| 20 to 34 years | 224 (55.6%) | 179 (44.4%) |
| 35 to 50 years | 65 (65.0%) | 35 (35.0%) |
| Total | 289 (57.5%) | 214 (42.5%) |
Fertility by Education in Des Moines
Average fertility rate in Des Moines is 62.0 births per 1,000 women. Women with the education attainment of high school diploma have the highest fertility rate of 88.0 births per 1,000 women, while women with the education attainment of less than high school have the lowest fertility at 32.0 births per 1,000 women. Women with the education attainment of high school diploma represent 33.2% of all women with births.
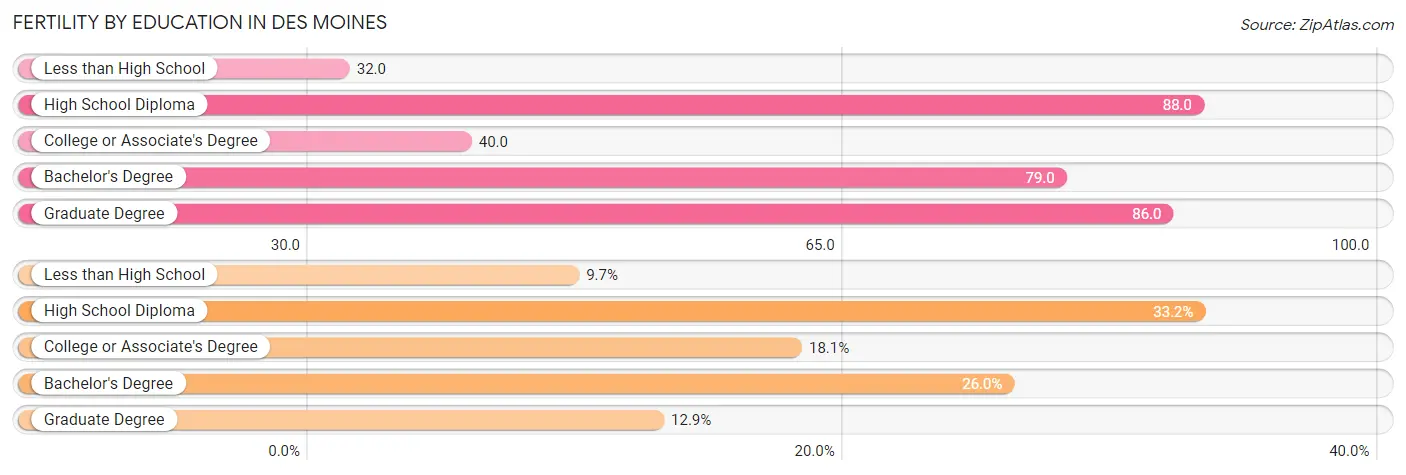
| Educational Attainment | Women with Births | Births / 1,000 Women |
| Less than High School | 49 (9.7%) | 32.0 |
| High School Diploma | 167 (33.2%) | 88.0 |
| College or Associate's Degree | 91 (18.1%) | 40.0 |
| Bachelor's Degree | 131 (26.0%) | 79.0 |
| Graduate Degree | 65 (12.9%) | 86.0 |
| Total | 503 (100.0%) | 62.0 |
Fertility by Education by Marriage Status in Des Moines
42.5% of women with births in Des Moines are unmarried. Women with the educational attainment of bachelor's degree are most likely to be married with 100.0% of them married at childbirth, while women with the educational attainment of less than high school are least likely to be married with 83.7% of them unmarried at childbirth.
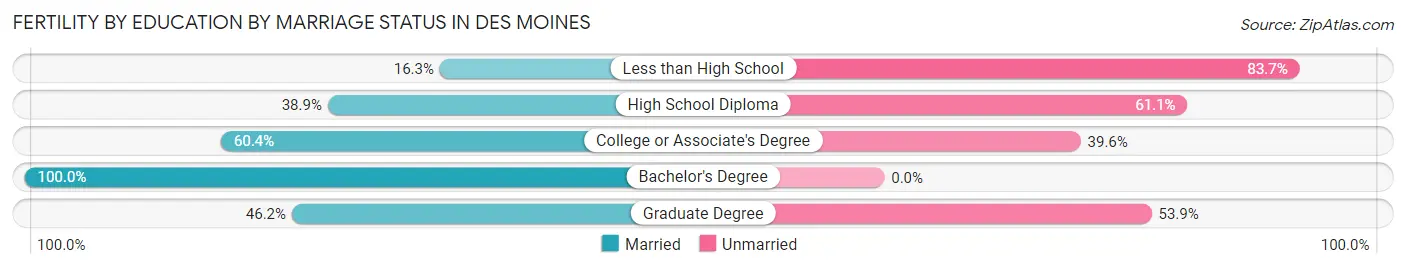
| Educational Attainment | Married | Unmarried |
| Less than High School | 8 (16.3%) | 41 (83.7%) |
| High School Diploma | 65 (38.9%) | 102 (61.1%) |
| College or Associate's Degree | 55 (60.4%) | 36 (39.6%) |
| Bachelor's Degree | 131 (100.0%) | 0 (0.0%) |
| Graduate Degree | 30 (46.2%) | 35 (53.8%) |
| Total | 289 (57.5%) | 214 (42.5%) |
Employment Characteristics in Des Moines
Employment by Class of Employer in Des Moines
Among the 14,927 employed individuals in Des Moines, private company employees (10,437 | 69.9%), not-for-profit organizations (1,414 | 9.5%), and self-employed (not incorporated) (938 | 6.3%) make up the most common classes of employment.
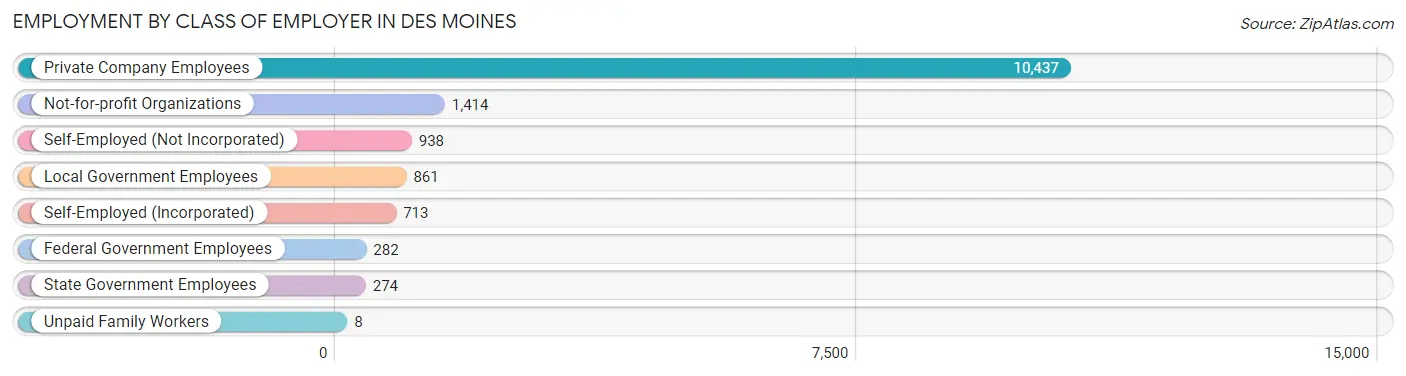
| Employer Class | # Employees | % Employees |
| Private Company Employees | 10,437 | 69.9% |
| Self-Employed (Incorporated) | 713 | 4.8% |
| Self-Employed (Not Incorporated) | 938 | 6.3% |
| Not-for-profit Organizations | 1,414 | 9.5% |
| Local Government Employees | 861 | 5.8% |
| State Government Employees | 274 | 1.8% |
| Federal Government Employees | 282 | 1.9% |
| Unpaid Family Workers | 8 | 0.1% |
| Total | 14,927 | 100.0% |
Employment Status by Age in Des Moines
According to the labor force statistics for Des Moines, out of the total population over 16 years of age (26,408), 63.3% or 16,716 individuals are in the labor force, with 8.2% or 1,371 of them unemployed. The age group with the highest labor force participation rate is 35 to 44 years, with 87.7% or 4,302 individuals in the labor force. Within the labor force, the 16 to 19 years age range has the highest percentage of unemployed individuals, with 26.9% or 186 of them being unemployed.
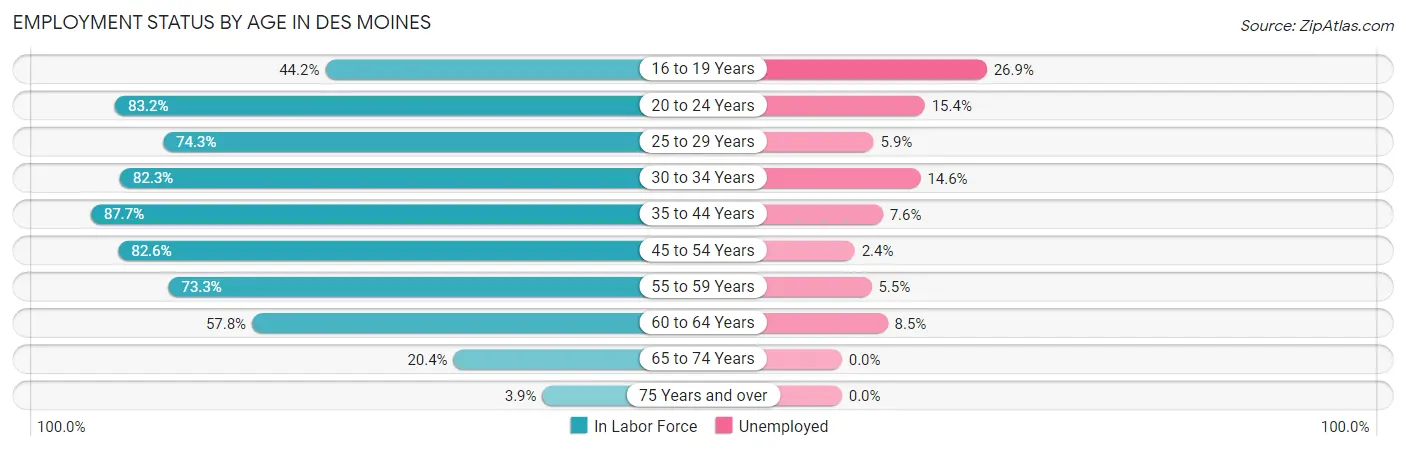
| Age Bracket | In Labor Force | Unemployed |
| 16 to 19 Years | 690 (44.2%) | 186 (26.9%) |
| 20 to 24 Years | 1,312 (83.2%) | 202 (15.4%) |
| 25 to 29 Years | 1,872 (74.3%) | 110 (5.9%) |
| 30 to 34 Years | 2,110 (82.3%) | 308 (14.6%) |
| 35 to 44 Years | 4,302 (87.7%) | 327 (7.6%) |
| 45 to 54 Years | 3,398 (82.6%) | 82 (2.4%) |
| 55 to 59 Years | 1,349 (73.3%) | 74 (5.5%) |
| 60 to 64 Years | 1,019 (57.8%) | 87 (8.5%) |
| 65 to 74 Years | 563 (20.4%) | 0 (0.0%) |
| 75 Years and over | 109 (3.9%) | 0 (0.0%) |
| Total | 16,716 (63.3%) | 1,371 (8.2%) |
Employment Status by Educational Attainment in Des Moines
According to labor force statistics for Des Moines, 79.4% of individuals (14,059) out of the total population between 25 and 64 years of age (17,706) are in the labor force, with 7.0% or 984 of them being unemployed. The group with the highest labor force participation rate are those with the educational attainment of bachelor's degree or higher, with 88.5% or 4,693 individuals in the labor force. Within the labor force, individuals with less than high school education have the highest percentage of unemployment, with 14.8% or 212 of them being unemployed.
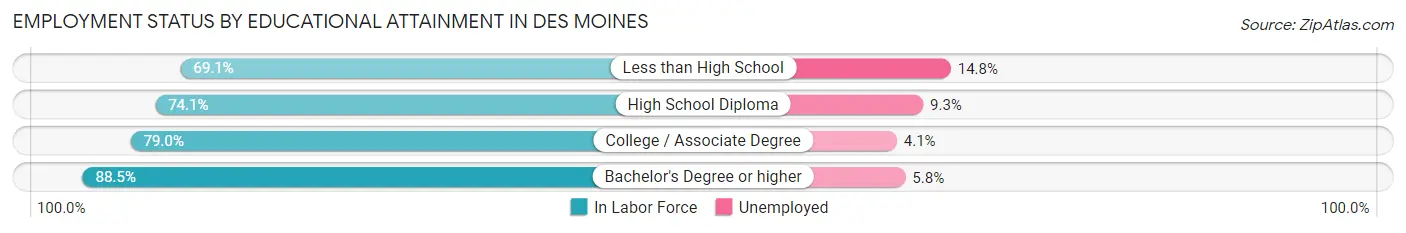
| Educational Attainment | In Labor Force | Unemployed |
| Less than High School | 1,432 (69.1%) | 307 (14.8%) |
| High School Diploma | 3,461 (74.1%) | 434 (9.3%) |
| College / Associate Degree | 4,471 (79.0%) | 232 (4.1%) |
| Bachelor's Degree or higher | 4,693 (88.5%) | 308 (5.8%) |
| Total | 14,059 (79.4%) | 1,239 (7.0%) |
Employment Occupations by Sex in Des Moines
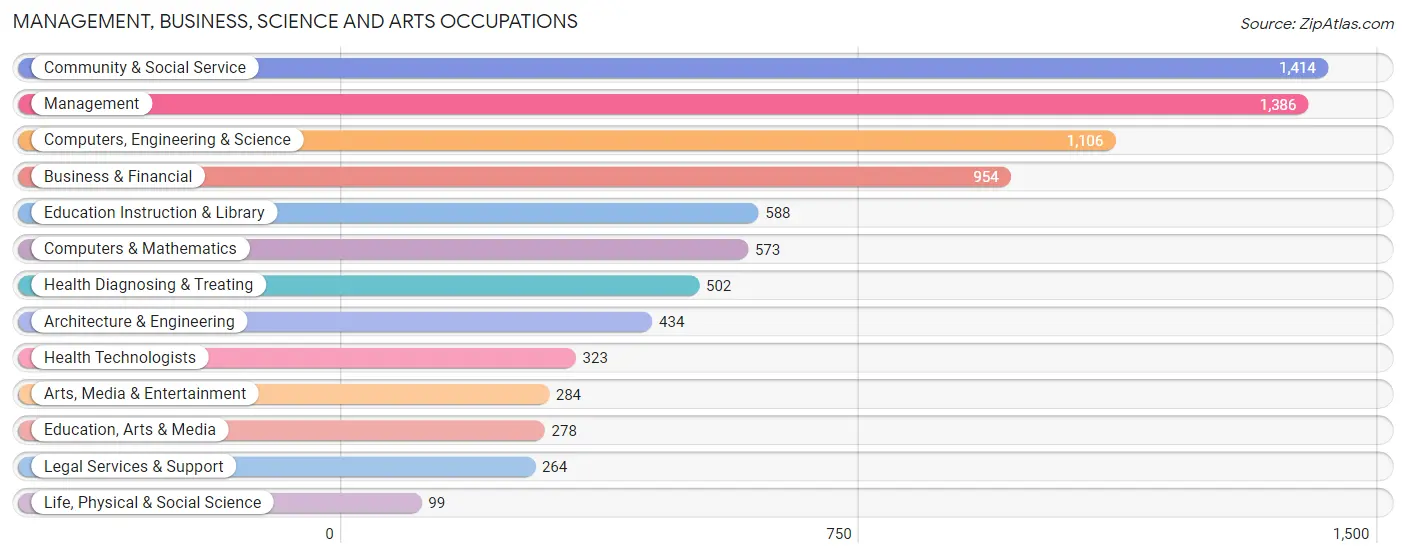
Management, Business, Science and Arts Occupations
The most common Management, Business, Science and Arts occupations in Des Moines are Community & Social Service (1,414 | 9.2%), Management (1,386 | 9.0%), Computers, Engineering & Science (1,106 | 7.2%), Business & Financial (954 | 6.2%), and Education Instruction & Library (588 | 3.8%).
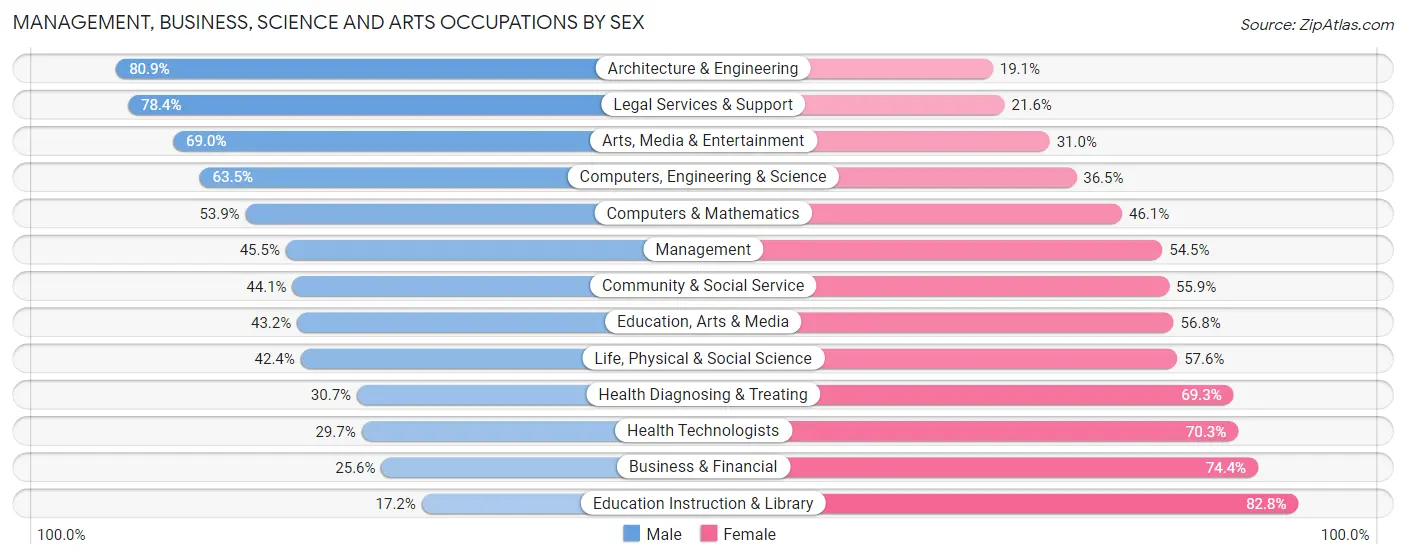
Management, Business, Science and Arts Occupations by Sex
Within the Management, Business, Science and Arts occupations in Des Moines, the most male-oriented occupations are Architecture & Engineering (80.9%), Legal Services & Support (78.4%), and Arts, Media & Entertainment (69.0%), while the most female-oriented occupations are Education Instruction & Library (82.8%), Business & Financial (74.4%), and Health Technologists (70.3%).
| Occupation | Male | Female |
| Management | 631 (45.5%) | 755 (54.5%) |
| Business & Financial | 244 (25.6%) | 710 (74.4%) |
| Computers, Engineering & Science | 702 (63.5%) | 404 (36.5%) |
| Computers & Mathematics | 309 (53.9%) | 264 (46.1%) |
| Architecture & Engineering | 351 (80.9%) | 83 (19.1%) |
| Life, Physical & Social Science | 42 (42.4%) | 57 (57.6%) |
| Community & Social Service | 624 (44.1%) | 790 (55.9%) |
| Education, Arts & Media | 120 (43.2%) | 158 (56.8%) |
| Legal Services & Support | 207 (78.4%) | 57 (21.6%) |
| Education Instruction & Library | 101 (17.2%) | 487 (82.8%) |
| Arts, Media & Entertainment | 196 (69.0%) | 88 (31.0%) |
| Health Diagnosing & Treating | 154 (30.7%) | 348 (69.3%) |
| Health Technologists | 96 (29.7%) | 227 (70.3%) |
| Total (Category) | 2,355 (43.9%) | 3,007 (56.1%) |
| Total (Overall) | 8,038 (52.4%) | 7,303 (47.6%) |
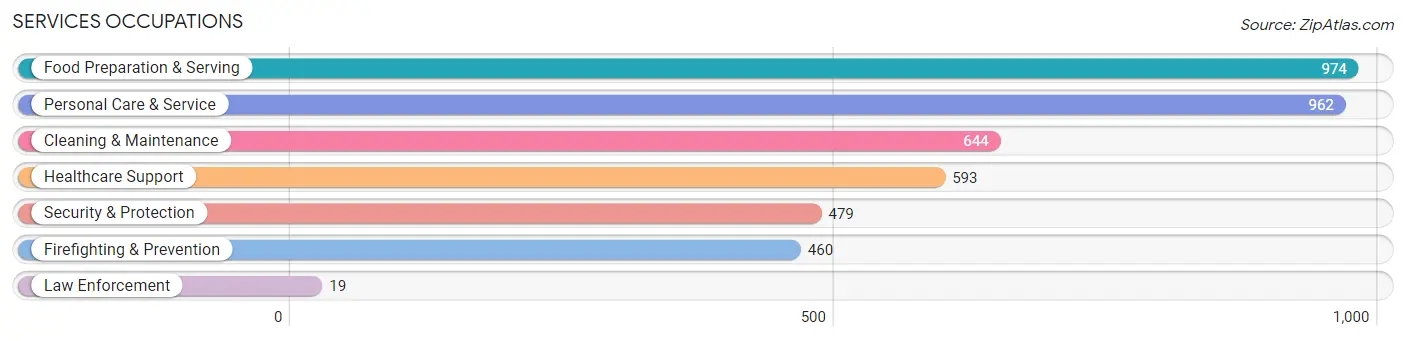
Services Occupations
The most common Services occupations in Des Moines are Food Preparation & Serving (974 | 6.4%), Personal Care & Service (962 | 6.3%), Cleaning & Maintenance (644 | 4.2%), Healthcare Support (593 | 3.9%), and Security & Protection (479 | 3.1%).
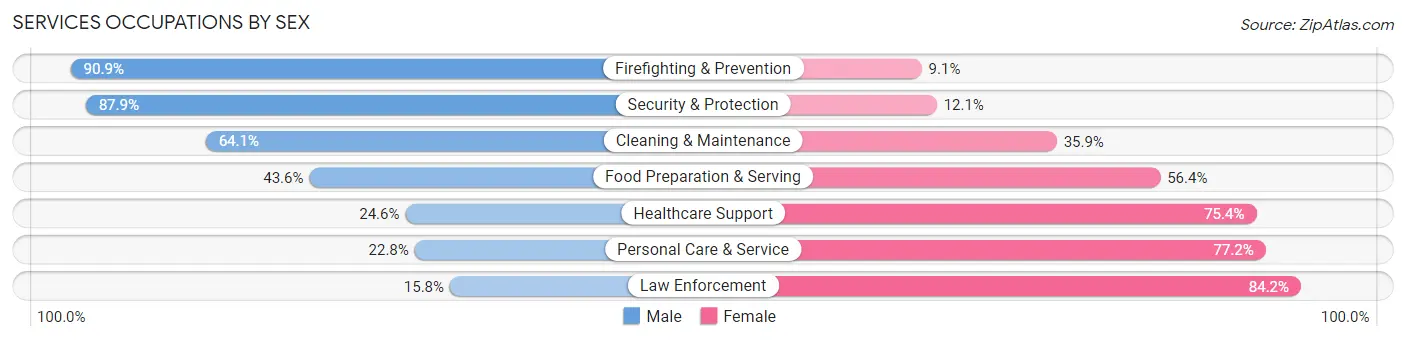
Services Occupations by Sex
Within the Services occupations in Des Moines, the most male-oriented occupations are Firefighting & Prevention (90.9%), Security & Protection (87.9%), and Cleaning & Maintenance (64.1%), while the most female-oriented occupations are Law Enforcement (84.2%), Personal Care & Service (77.2%), and Healthcare Support (75.4%).
| Occupation | Male | Female |
| Healthcare Support | 146 (24.6%) | 447 (75.4%) |
| Security & Protection | 421 (87.9%) | 58 (12.1%) |
| Firefighting & Prevention | 418 (90.9%) | 42 (9.1%) |
| Law Enforcement | 3 (15.8%) | 16 (84.2%) |
| Food Preparation & Serving | 425 (43.6%) | 549 (56.4%) |
| Cleaning & Maintenance | 413 (64.1%) | 231 (35.9%) |
| Personal Care & Service | 219 (22.8%) | 743 (77.2%) |
| Total (Category) | 1,624 (44.5%) | 2,028 (55.5%) |
| Total (Overall) | 8,038 (52.4%) | 7,303 (47.6%) |
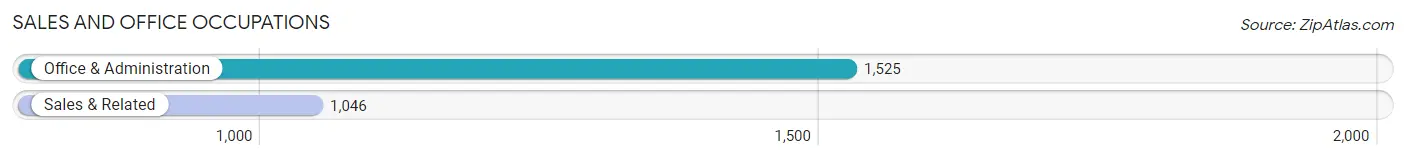
Sales and Office Occupations
The most common Sales and Office occupations in Des Moines are Office & Administration (1,525 | 9.9%), and Sales & Related (1,046 | 6.8%).
Sales and Office Occupations by Sex
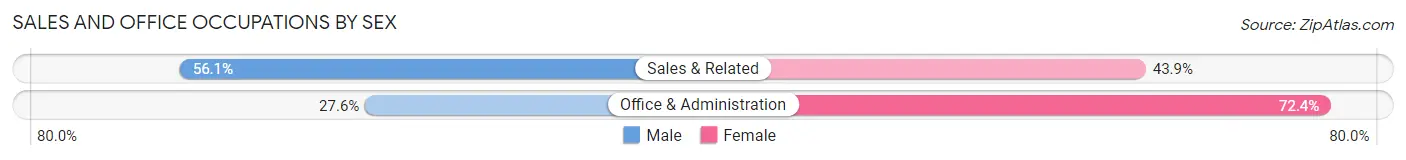
| Occupation | Male | Female |
| Sales & Related | 587 (56.1%) | 459 (43.9%) |
| Office & Administration | 421 (27.6%) | 1,104 (72.4%) |
| Total (Category) | 1,008 (39.2%) | 1,563 (60.8%) |
| Total (Overall) | 8,038 (52.4%) | 7,303 (47.6%) |
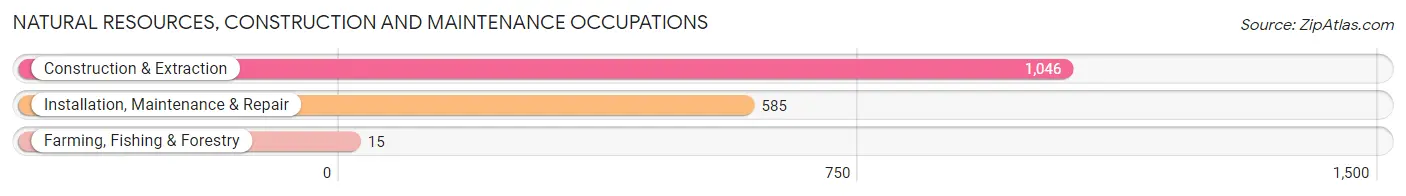
Natural Resources, Construction and Maintenance Occupations
The most common Natural Resources, Construction and Maintenance occupations in Des Moines are Construction & Extraction (1,046 | 6.8%), Installation, Maintenance & Repair (585 | 3.8%), and Farming, Fishing & Forestry (15 | 0.1%).
Natural Resources, Construction and Maintenance Occupations by Sex
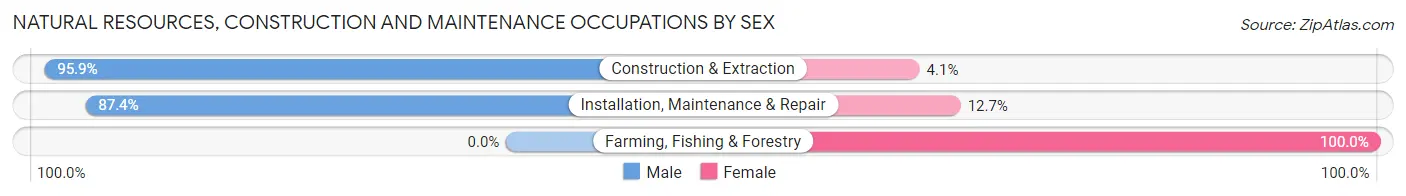
| Occupation | Male | Female |
| Farming, Fishing & Forestry | 0 (0.0%) | 15 (100.0%) |
| Construction & Extraction | 1,003 (95.9%) | 43 (4.1%) |
| Installation, Maintenance & Repair | 511 (87.4%) | 74 (12.7%) |
| Total (Category) | 1,514 (92.0%) | 132 (8.0%) |
| Total (Overall) | 8,038 (52.4%) | 7,303 (47.6%) |
Production, Transportation and Moving Occupations
The most common Production, Transportation and Moving occupations in Des Moines are Transportation (814 | 5.3%), Material Moving (811 | 5.3%), and Production (485 | 3.2%).
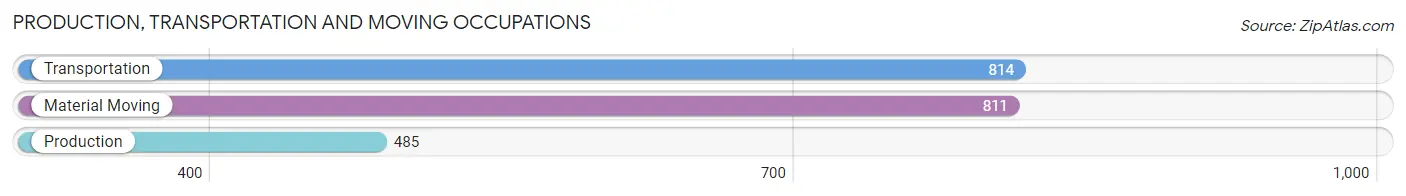
Production, Transportation and Moving Occupations by Sex
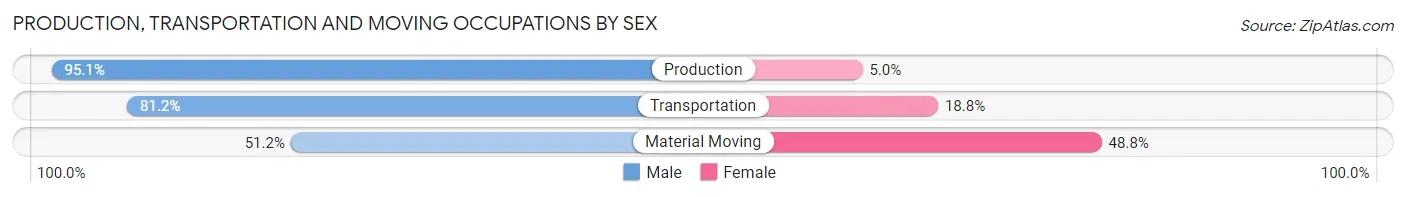
| Occupation | Male | Female |
| Production | 461 (95.1%) | 24 (5.0%) |
| Transportation | 661 (81.2%) | 153 (18.8%) |
| Material Moving | 415 (51.2%) | 396 (48.8%) |
| Total (Category) | 1,537 (72.8%) | 573 (27.2%) |
| Total (Overall) | 8,038 (52.4%) | 7,303 (47.6%) |
Employment Industries by Sex in Des Moines
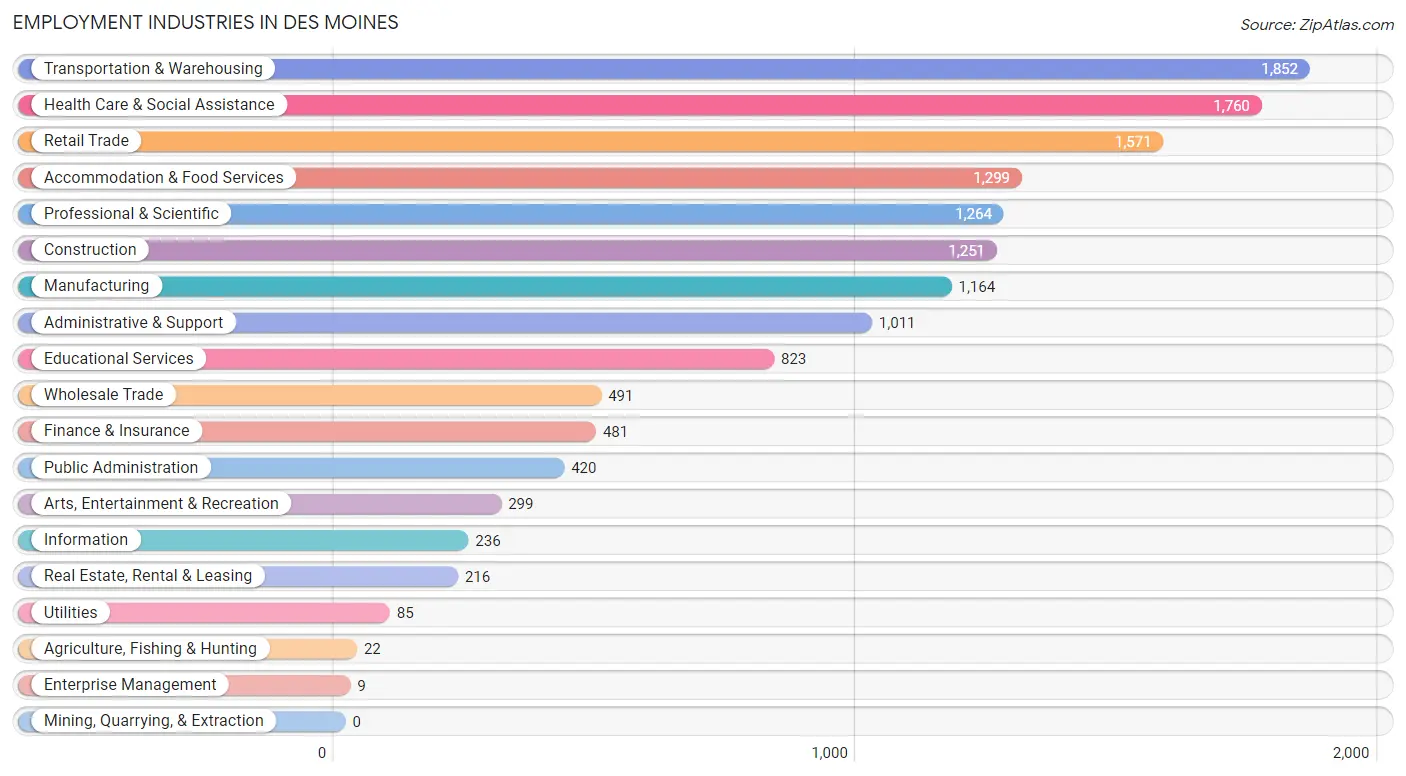
Employment Industries in Des Moines
The major employment industries in Des Moines include Transportation & Warehousing (1,852 | 12.1%), Health Care & Social Assistance (1,760 | 11.5%), Retail Trade (1,571 | 10.2%), Accommodation & Food Services (1,299 | 8.5%), and Professional & Scientific (1,264 | 8.2%).
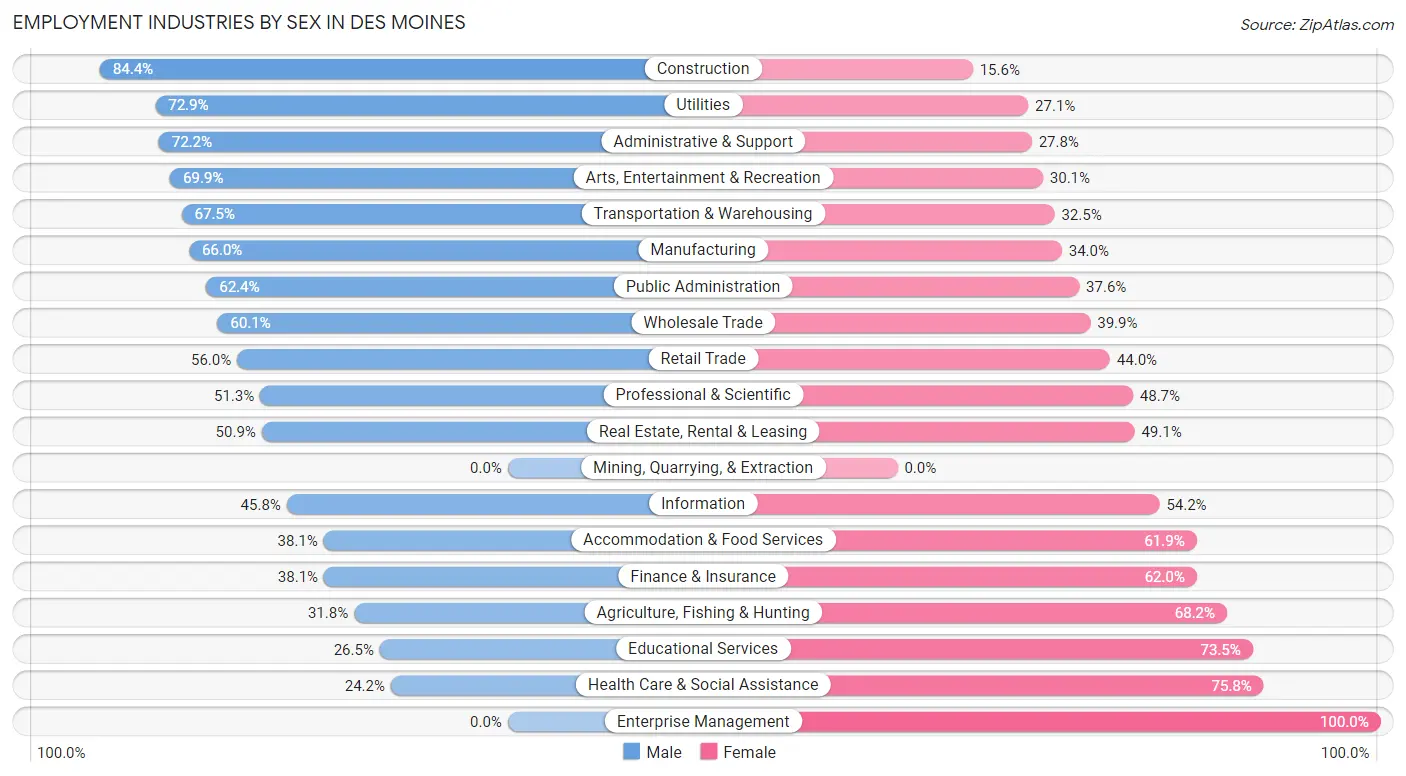
Employment Industries by Sex in Des Moines
The Des Moines industries that see more men than women are Construction (84.4%), Utilities (72.9%), and Administrative & Support (72.2%), whereas the industries that tend to have a higher number of women are Enterprise Management (100.0%), Health Care & Social Assistance (75.8%), and Educational Services (73.5%).
| Industry | Male | Female |
| Agriculture, Fishing & Hunting | 7 (31.8%) | 15 (68.2%) |
| Mining, Quarrying, & Extraction | 0 (0.0%) | 0 (0.0%) |
| Construction | 1,056 (84.4%) | 195 (15.6%) |
| Manufacturing | 768 (66.0%) | 396 (34.0%) |
| Wholesale Trade | 295 (60.1%) | 196 (39.9%) |
| Retail Trade | 880 (56.0%) | 691 (44.0%) |
| Transportation & Warehousing | 1,250 (67.5%) | 602 (32.5%) |
| Utilities | 62 (72.9%) | 23 (27.1%) |
| Information | 108 (45.8%) | 128 (54.2%) |
| Finance & Insurance | 183 (38.1%) | 298 (62.0%) |
| Real Estate, Rental & Leasing | 110 (50.9%) | 106 (49.1%) |
| Professional & Scientific | 648 (51.3%) | 616 (48.7%) |
| Enterprise Management | 0 (0.0%) | 9 (100.0%) |
| Administrative & Support | 730 (72.2%) | 281 (27.8%) |
| Educational Services | 218 (26.5%) | 605 (73.5%) |
| Health Care & Social Assistance | 426 (24.2%) | 1,334 (75.8%) |
| Arts, Entertainment & Recreation | 209 (69.9%) | 90 (30.1%) |
| Accommodation & Food Services | 495 (38.1%) | 804 (61.9%) |
| Public Administration | 262 (62.4%) | 158 (37.6%) |
| Total | 8,038 (52.4%) | 7,303 (47.6%) |
Education in Des Moines
School Enrollment in Des Moines
The most common levels of schooling among the 6,511 students in Des Moines are high school (1,500 | 23.0%), middle school (1,355 | 20.8%), and elementary school (1,341 | 20.6%).
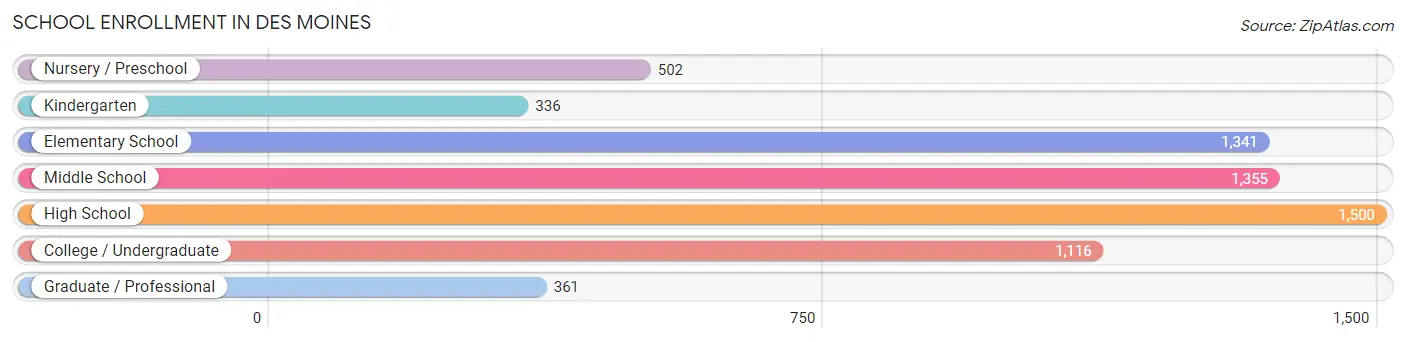
| School Level | # Students | % Students |
| Nursery / Preschool | 502 | 7.7% |
| Kindergarten | 336 | 5.2% |
| Elementary School | 1,341 | 20.6% |
| Middle School | 1,355 | 20.8% |
| High School | 1,500 | 23.0% |
| College / Undergraduate | 1,116 | 17.1% |
| Graduate / Professional | 361 | 5.5% |
| Total | 6,511 | 100.0% |
School Enrollment by Age by Funding Source in Des Moines
Out of a total of 6,511 students who are enrolled in schools in Des Moines, 833 (12.8%) attend a private institution, while the remaining 5,678 (87.2%) are enrolled in public schools. The age group of 3 to 4 year olds has the highest likelihood of being enrolled in private schools, with 124 (28.2% in the age bracket) enrolled. Conversely, the age group of 15 to 17 year olds has the lowest likelihood of being enrolled in a private school, with 927 (95.0% in the age bracket) attending a public institution.
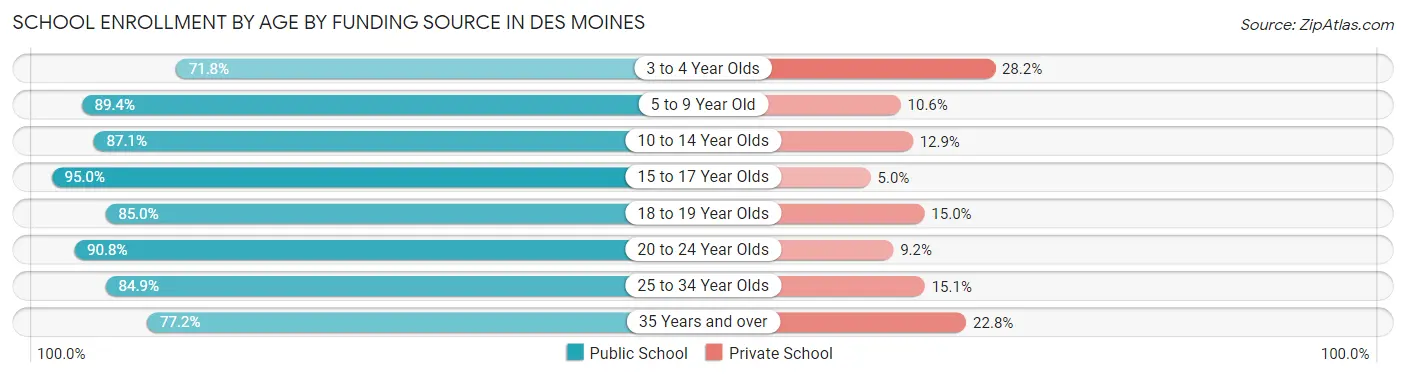
| Age Bracket | Public School | Private School |
| 3 to 4 Year Olds | 316 (71.8%) | 124 (28.2%) |
| 5 to 9 Year Old | 1,356 (89.4%) | 161 (10.6%) |
| 10 to 14 Year Olds | 1,545 (87.1%) | 228 (12.9%) |
| 15 to 17 Year Olds | 927 (95.0%) | 49 (5.0%) |
| 18 to 19 Year Olds | 469 (85.0%) | 83 (15.0%) |
| 20 to 24 Year Olds | 354 (90.8%) | 36 (9.2%) |
| 25 to 34 Year Olds | 461 (84.9%) | 82 (15.1%) |
| 35 Years and over | 247 (77.2%) | 73 (22.8%) |
| Total | 5,678 (87.2%) | 833 (12.8%) |
Educational Attainment by Field of Study in Des Moines
Business (1,679 | 21.8%), education (959 | 12.5%), social sciences (779 | 10.1%), engineering (778 | 10.1%), and science & technology (767 | 10.0%) are the most common fields of study among 7,696 individuals in Des Moines who have obtained a bachelor's degree or higher.
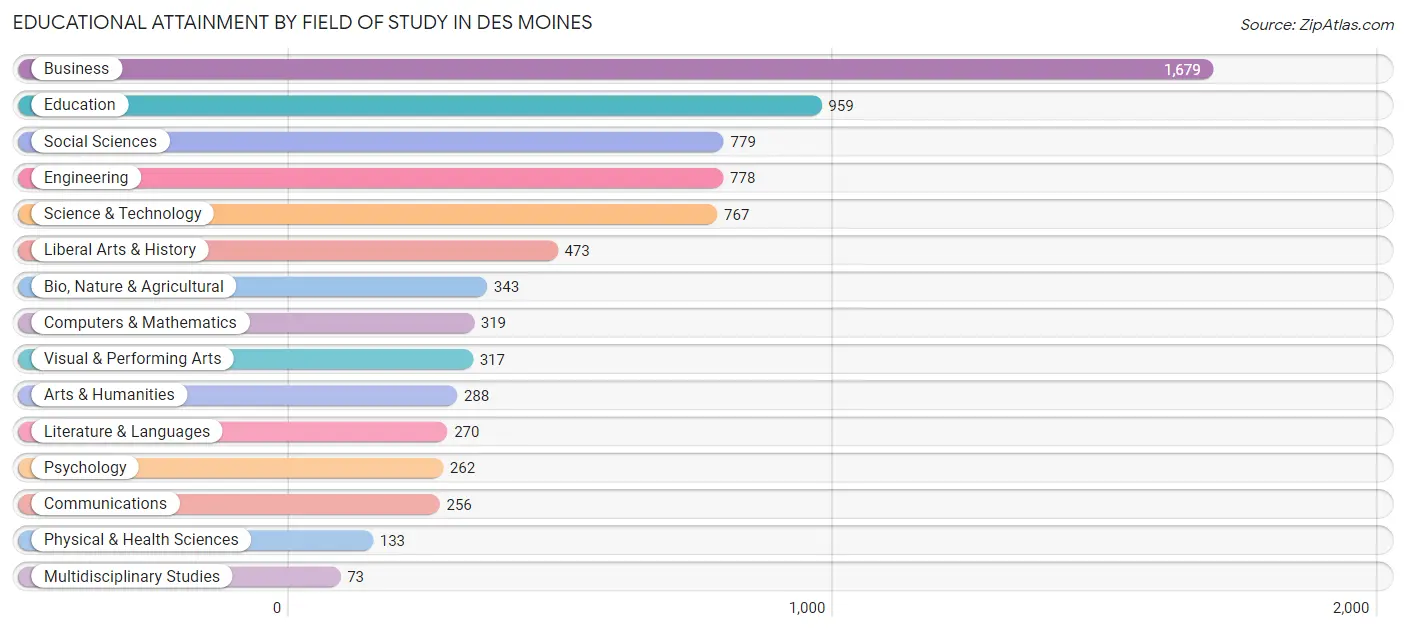
| Field of Study | # Graduates | % Graduates |
| Computers & Mathematics | 319 | 4.2% |
| Bio, Nature & Agricultural | 343 | 4.5% |
| Physical & Health Sciences | 133 | 1.7% |
| Psychology | 262 | 3.4% |
| Social Sciences | 779 | 10.1% |
| Engineering | 778 | 10.1% |
| Multidisciplinary Studies | 73 | 0.9% |
| Science & Technology | 767 | 10.0% |
| Business | 1,679 | 21.8% |
| Education | 959 | 12.5% |
| Literature & Languages | 270 | 3.5% |
| Liberal Arts & History | 473 | 6.1% |
| Visual & Performing Arts | 317 | 4.1% |
| Communications | 256 | 3.3% |
| Arts & Humanities | 288 | 3.7% |
| Total | 7,696 | 100.0% |
Transportation & Commute in Des Moines
Vehicle Availability by Sex in Des Moines
The most prevalent vehicle ownership categories in Des Moines are males with 2 vehicles (3,040, accounting for 38.6%) and females with 2 vehicles (2,722, making up 43.2%).
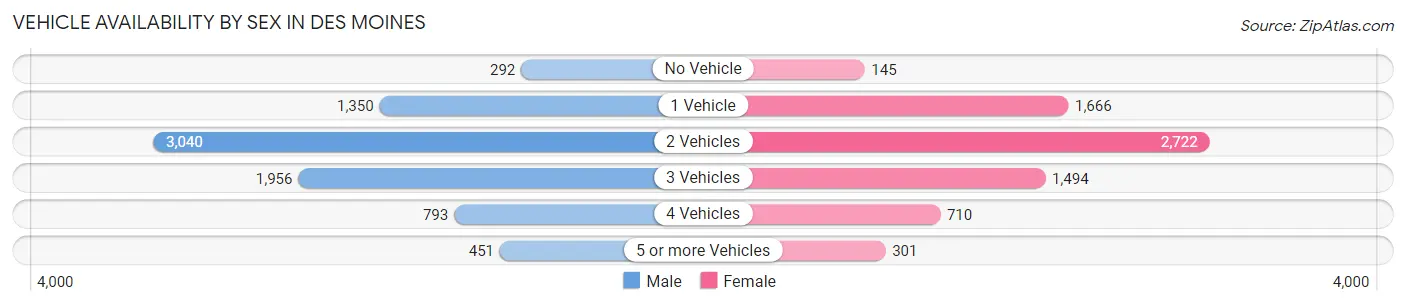
| Vehicles Available | Male | Female |
| No Vehicle | 292 (3.7%) | 145 (2.1%) |
| 1 Vehicle | 1,350 (17.1%) | 1,666 (23.7%) |
| 2 Vehicles | 3,040 (38.6%) | 2,722 (38.7%) |
| 3 Vehicles | 1,956 (24.8%) | 1,494 (21.2%) |
| 4 Vehicles | 793 (10.1%) | 710 (10.1%) |
| 5 or more Vehicles | 451 (5.7%) | 301 (4.3%) |
| Total | 7,882 (100.0%) | 7,038 (100.0%) |
Commute Time in Des Moines
The most frequently occuring commute durations in Des Moines are 20 to 24 minutes (2,414 commuters, 18.2%), 30 to 34 minutes (2,285 commuters, 17.2%), and 15 to 19 minutes (1,808 commuters, 13.7%).
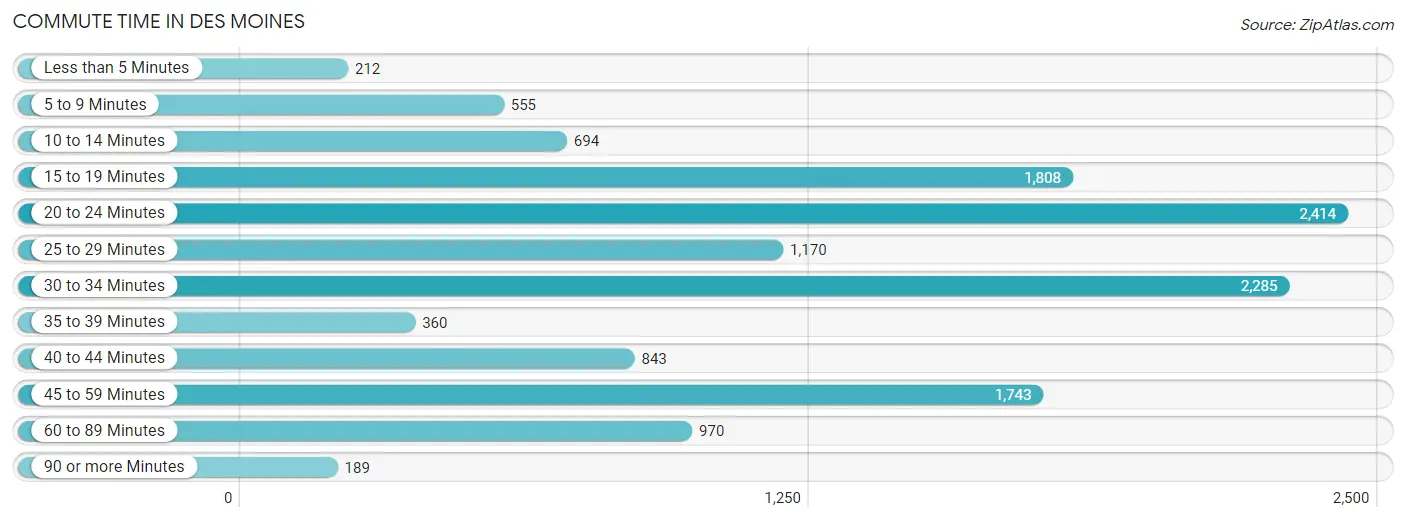
| Commute Time | # Commuters | % Commuters |
| Less than 5 Minutes | 212 | 1.6% |
| 5 to 9 Minutes | 555 | 4.2% |
| 10 to 14 Minutes | 694 | 5.2% |
| 15 to 19 Minutes | 1,808 | 13.7% |
| 20 to 24 Minutes | 2,414 | 18.2% |
| 25 to 29 Minutes | 1,170 | 8.8% |
| 30 to 34 Minutes | 2,285 | 17.2% |
| 35 to 39 Minutes | 360 | 2.7% |
| 40 to 44 Minutes | 843 | 6.4% |
| 45 to 59 Minutes | 1,743 | 13.2% |
| 60 to 89 Minutes | 970 | 7.3% |
| 90 or more Minutes | 189 | 1.4% |
Commute Time by Sex in Des Moines
The most common commute times in Des Moines are 30 to 34 minutes (1,308 commuters, 18.4%) for males and 20 to 24 minutes (1,131 commuters, 18.4%) for females.
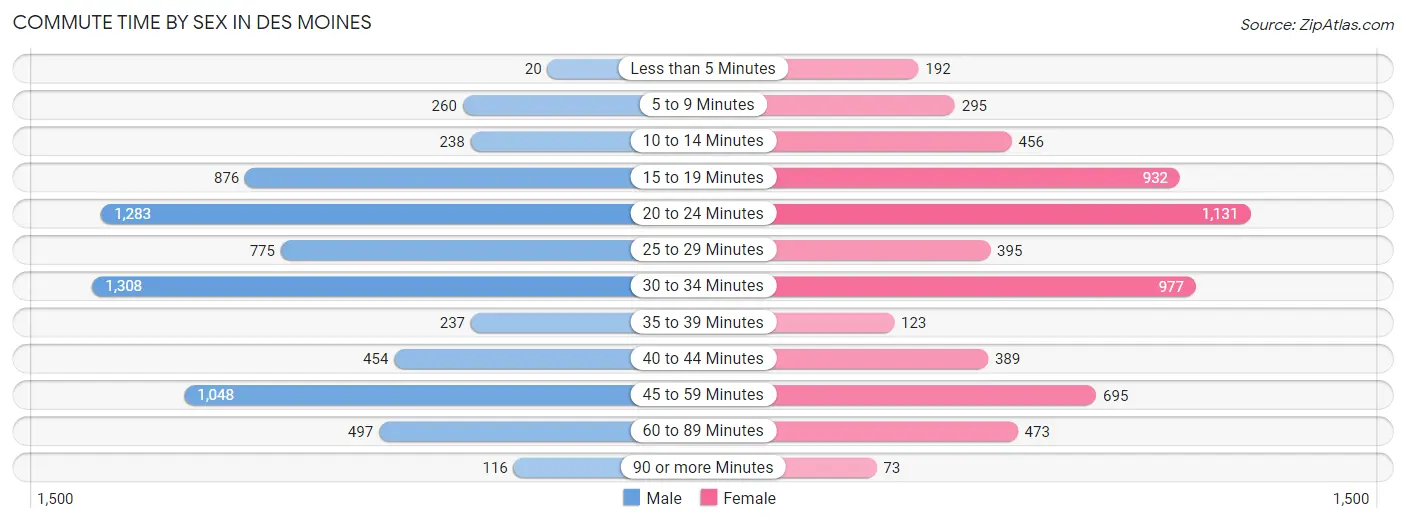
| Commute Time | Male | Female |
| Less than 5 Minutes | 20 (0.3%) | 192 (3.1%) |
| 5 to 9 Minutes | 260 (3.7%) | 295 (4.8%) |
| 10 to 14 Minutes | 238 (3.4%) | 456 (7.4%) |
| 15 to 19 Minutes | 876 (12.3%) | 932 (15.2%) |
| 20 to 24 Minutes | 1,283 (18.0%) | 1,131 (18.4%) |
| 25 to 29 Minutes | 775 (10.9%) | 395 (6.4%) |
| 30 to 34 Minutes | 1,308 (18.4%) | 977 (15.9%) |
| 35 to 39 Minutes | 237 (3.3%) | 123 (2.0%) |
| 40 to 44 Minutes | 454 (6.4%) | 389 (6.3%) |
| 45 to 59 Minutes | 1,048 (14.7%) | 695 (11.3%) |
| 60 to 89 Minutes | 497 (7.0%) | 473 (7.7%) |
| 90 or more Minutes | 116 (1.6%) | 73 (1.2%) |
Time of Departure to Work by Sex in Des Moines
The most frequent times of departure to work in Des Moines are 6:00 AM to 6:29 AM (896, 12.6%) for males and 7:00 AM to 7:29 AM (896, 14.6%) for females.
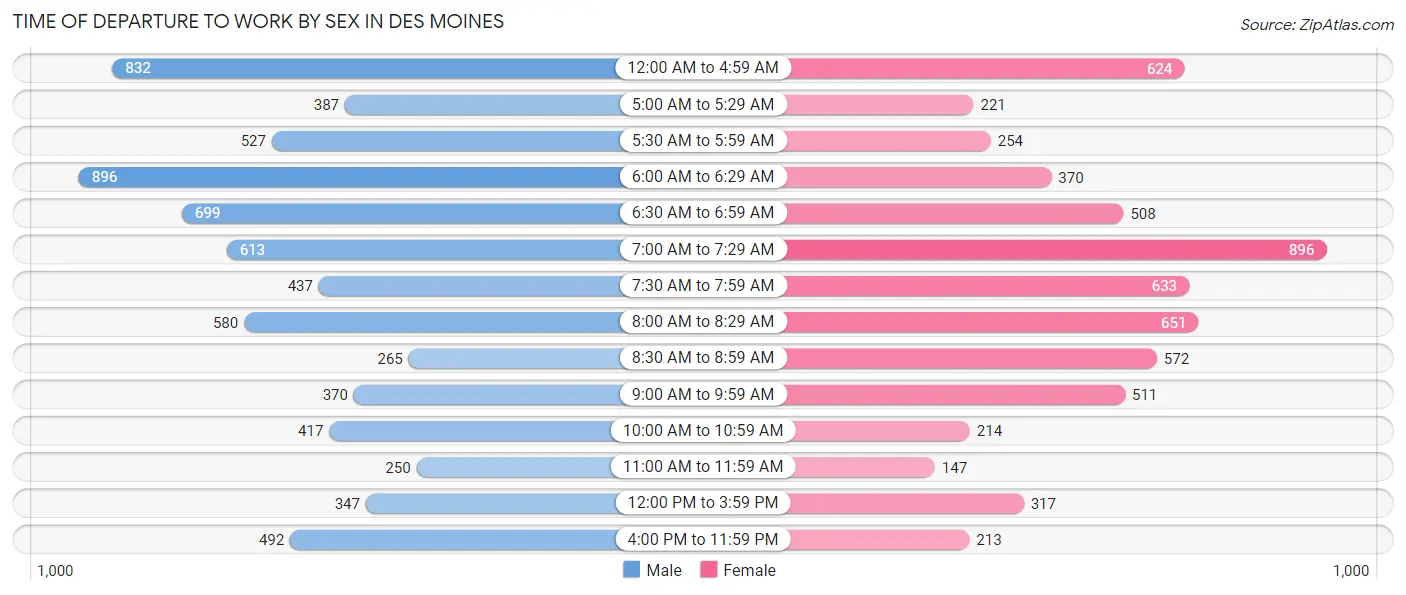
| Time of Departure | Male | Female |
| 12:00 AM to 4:59 AM | 832 (11.7%) | 624 (10.2%) |
| 5:00 AM to 5:29 AM | 387 (5.4%) | 221 (3.6%) |
| 5:30 AM to 5:59 AM | 527 (7.4%) | 254 (4.1%) |
| 6:00 AM to 6:29 AM | 896 (12.6%) | 370 (6.0%) |
| 6:30 AM to 6:59 AM | 699 (9.8%) | 508 (8.3%) |
| 7:00 AM to 7:29 AM | 613 (8.6%) | 896 (14.6%) |
| 7:30 AM to 7:59 AM | 437 (6.1%) | 633 (10.3%) |
| 8:00 AM to 8:29 AM | 580 (8.2%) | 651 (10.6%) |
| 8:30 AM to 8:59 AM | 265 (3.7%) | 572 (9.3%) |
| 9:00 AM to 9:59 AM | 370 (5.2%) | 511 (8.3%) |
| 10:00 AM to 10:59 AM | 417 (5.9%) | 214 (3.5%) |
| 11:00 AM to 11:59 AM | 250 (3.5%) | 147 (2.4%) |
| 12:00 PM to 3:59 PM | 347 (4.9%) | 317 (5.2%) |
| 4:00 PM to 11:59 PM | 492 (6.9%) | 213 (3.5%) |
| Total | 7,112 (100.0%) | 6,131 (100.0%) |
Housing Occupancy in Des Moines
Occupancy by Ownership in Des Moines
Of the total 12,369 dwellings in Des Moines, owner-occupied units account for 7,343 (59.4%), while renter-occupied units make up 5,026 (40.6%).
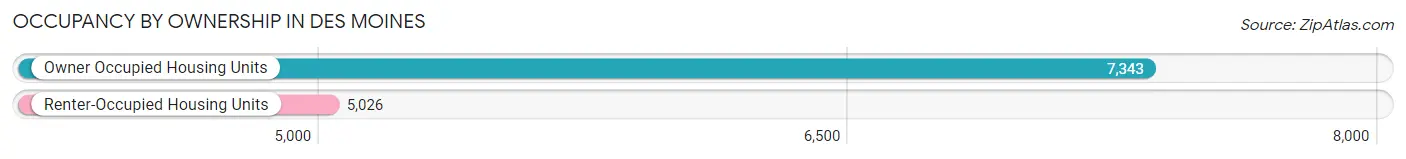
| Occupancy | # Housing Units | % Housing Units |
| Owner Occupied Housing Units | 7,343 | 59.4% |
| Renter-Occupied Housing Units | 5,026 | 40.6% |
| Total Occupied Housing Units | 12,369 | 100.0% |
Occupancy by Household Size in Des Moines
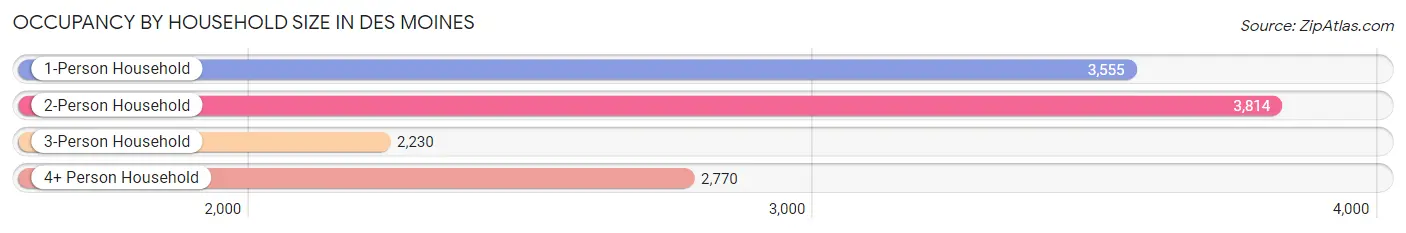
| Household Size | # Housing Units | % Housing Units |
| 1-Person Household | 3,555 | 28.7% |
| 2-Person Household | 3,814 | 30.8% |
| 3-Person Household | 2,230 | 18.0% |
| 4+ Person Household | 2,770 | 22.4% |
| Total Housing Units | 12,369 | 100.0% |
Occupancy by Ownership by Household Size in Des Moines
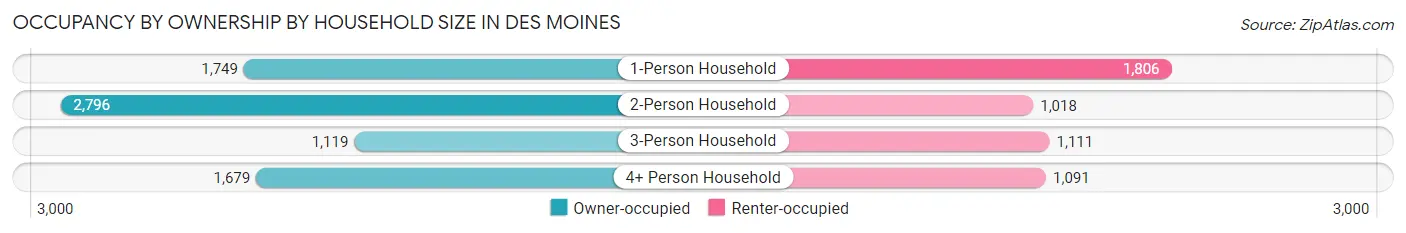
| Household Size | Owner-occupied | Renter-occupied |
| 1-Person Household | 1,749 (49.2%) | 1,806 (50.8%) |
| 2-Person Household | 2,796 (73.3%) | 1,018 (26.7%) |
| 3-Person Household | 1,119 (50.2%) | 1,111 (49.8%) |
| 4+ Person Household | 1,679 (60.6%) | 1,091 (39.4%) |
| Total Housing Units | 7,343 (59.4%) | 5,026 (40.6%) |
Occupancy by Educational Attainment in Des Moines
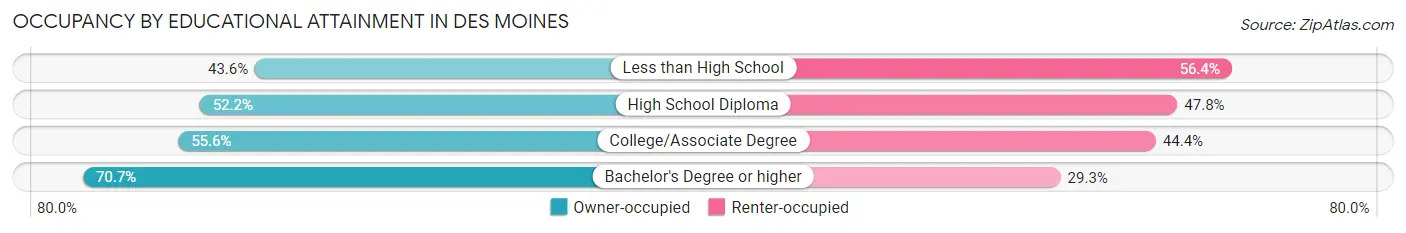
| Household Size | Owner-occupied | Renter-occupied |
| Less than High School | 457 (43.6%) | 591 (56.4%) |
| High School Diploma | 1,316 (52.2%) | 1,204 (47.8%) |
| College/Associate Degree | 2,415 (55.6%) | 1,926 (44.4%) |
| Bachelor's Degree or higher | 3,155 (70.7%) | 1,305 (29.3%) |
Occupancy by Age of Householder in Des Moines
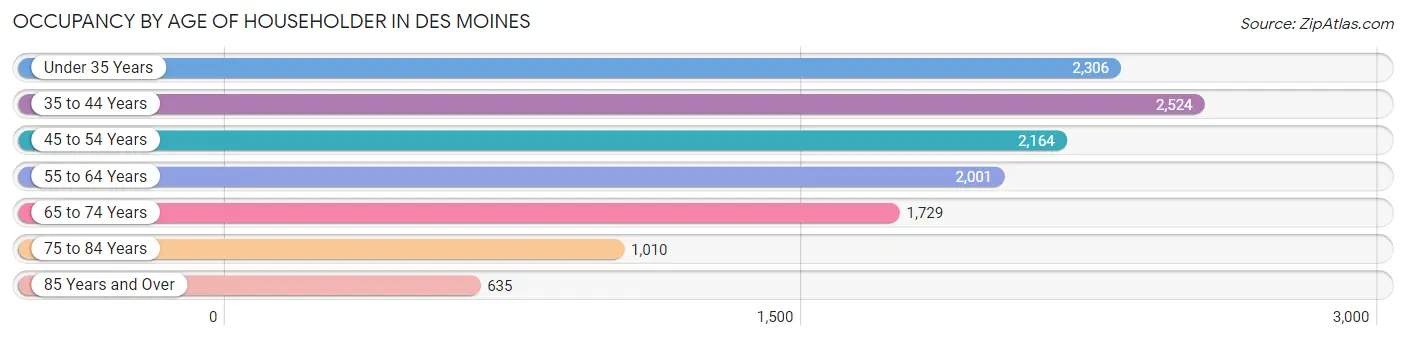
| Age Bracket | # Households | % Households |
| Under 35 Years | 2,306 | 18.6% |
| 35 to 44 Years | 2,524 | 20.4% |
| 45 to 54 Years | 2,164 | 17.5% |
| 55 to 64 Years | 2,001 | 16.2% |
| 65 to 74 Years | 1,729 | 14.0% |
| 75 to 84 Years | 1,010 | 8.2% |
| 85 Years and Over | 635 | 5.1% |
| Total | 12,369 | 100.0% |
Housing Finances in Des Moines
Median Income by Occupancy in Des Moines
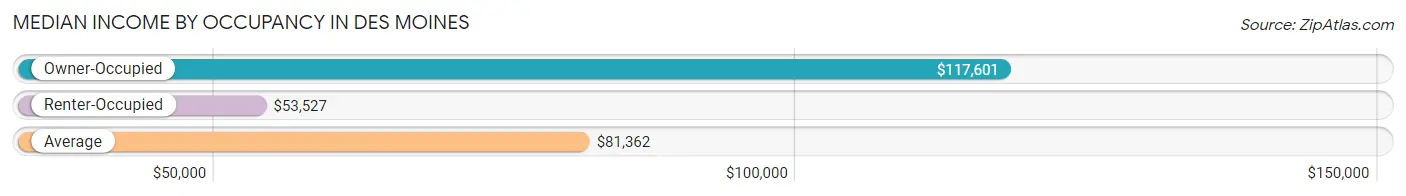
| Occupancy Type | # Households | Median Income |
| Owner-Occupied | 7,343 (59.4%) | $117,601 |
| Renter-Occupied | 5,026 (40.6%) | $53,527 |
| Average | 12,369 (100.0%) | $81,362 |
Occupancy by Householder Income Bracket in Des Moines
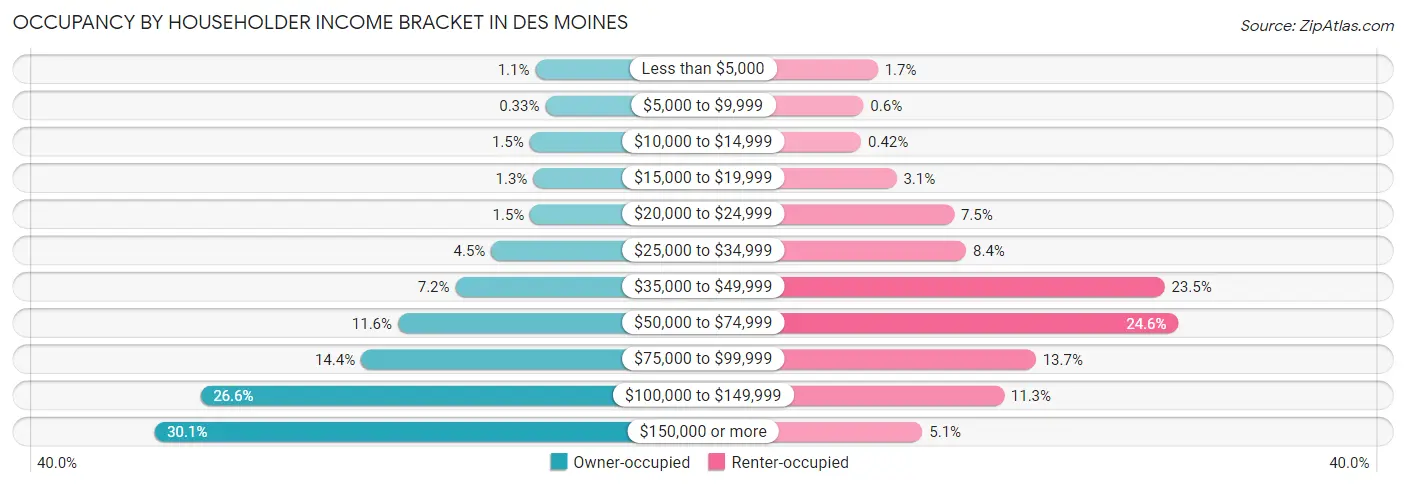
| Income Bracket | Owner-occupied | Renter-occupied |
| Less than $5,000 | 80 (1.1%) | 85 (1.7%) |
| $5,000 to $9,999 | 24 (0.3%) | 30 (0.6%) |
| $10,000 to $14,999 | 112 (1.5%) | 21 (0.4%) |
| $15,000 to $19,999 | 92 (1.3%) | 157 (3.1%) |
| $20,000 to $24,999 | 109 (1.5%) | 377 (7.5%) |
| $25,000 to $34,999 | 327 (4.4%) | 423 (8.4%) |
| $35,000 to $49,999 | 527 (7.2%) | 1,183 (23.5%) |
| $50,000 to $74,999 | 849 (11.6%) | 1,236 (24.6%) |
| $75,000 to $99,999 | 1,055 (14.4%) | 690 (13.7%) |
| $100,000 to $149,999 | 1,955 (26.6%) | 568 (11.3%) |
| $150,000 or more | 2,213 (30.1%) | 256 (5.1%) |
| Total | 7,343 (100.0%) | 5,026 (100.0%) |
Monthly Housing Cost Tiers in Des Moines
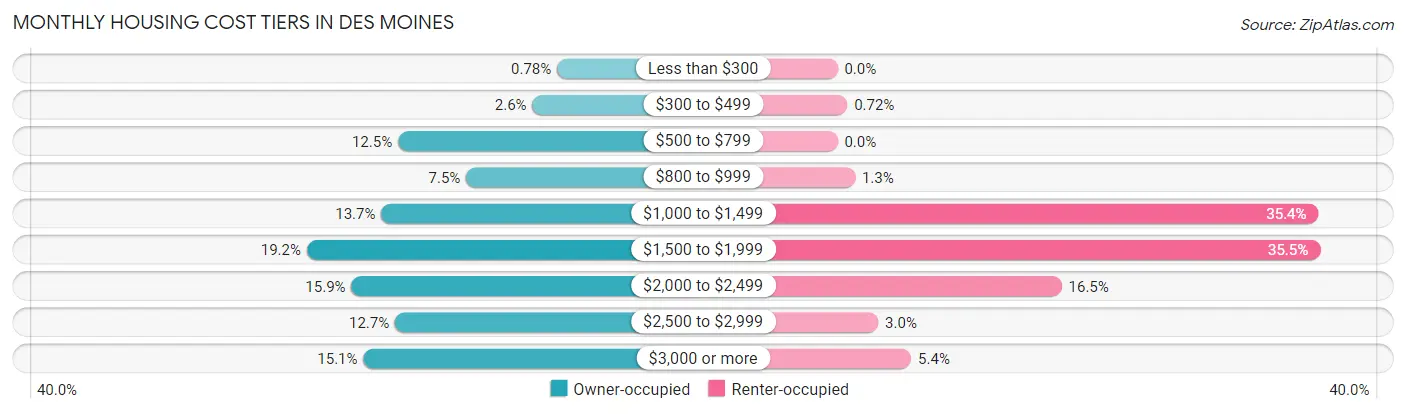
| Monthly Cost | Owner-occupied | Renter-occupied |
| Less than $300 | 57 (0.8%) | 0 (0.0%) |
| $300 to $499 | 191 (2.6%) | 36 (0.7%) |
| $500 to $799 | 918 (12.5%) | 0 (0.0%) |
| $800 to $999 | 549 (7.5%) | 65 (1.3%) |
| $1,000 to $1,499 | 1,008 (13.7%) | 1,780 (35.4%) |
| $1,500 to $1,999 | 1,411 (19.2%) | 1,786 (35.5%) |
| $2,000 to $2,499 | 1,170 (15.9%) | 830 (16.5%) |
| $2,500 to $2,999 | 934 (12.7%) | 151 (3.0%) |
| $3,000 or more | 1,105 (15.0%) | 273 (5.4%) |
| Total | 7,343 (100.0%) | 5,026 (100.0%) |
Physical Housing Characteristics in Des Moines
Housing Structures in Des Moines
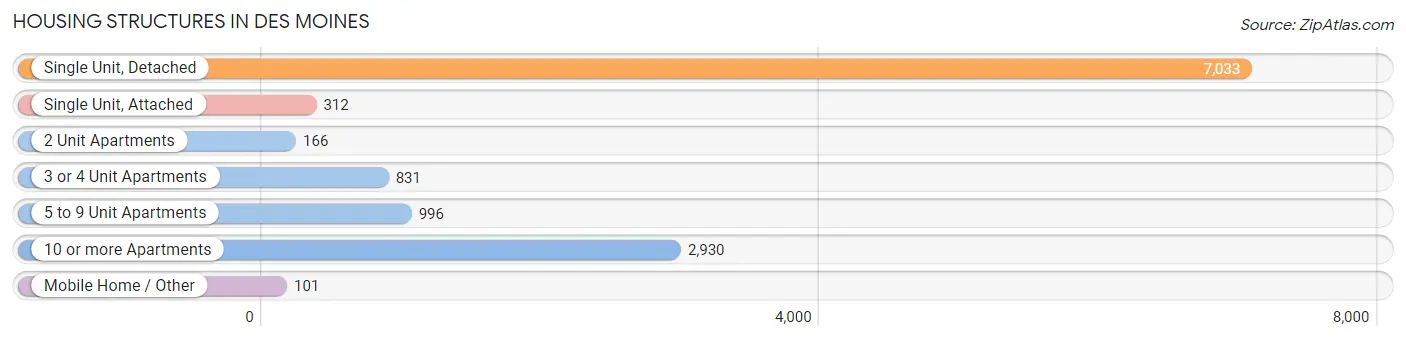
| Structure Type | # Housing Units | % Housing Units |
| Single Unit, Detached | 7,033 | 56.9% |
| Single Unit, Attached | 312 | 2.5% |
| 2 Unit Apartments | 166 | 1.3% |
| 3 or 4 Unit Apartments | 831 | 6.7% |
| 5 to 9 Unit Apartments | 996 | 8.1% |
| 10 or more Apartments | 2,930 | 23.7% |
| Mobile Home / Other | 101 | 0.8% |
| Total | 12,369 | 100.0% |
Housing Structures by Occupancy in Des Moines
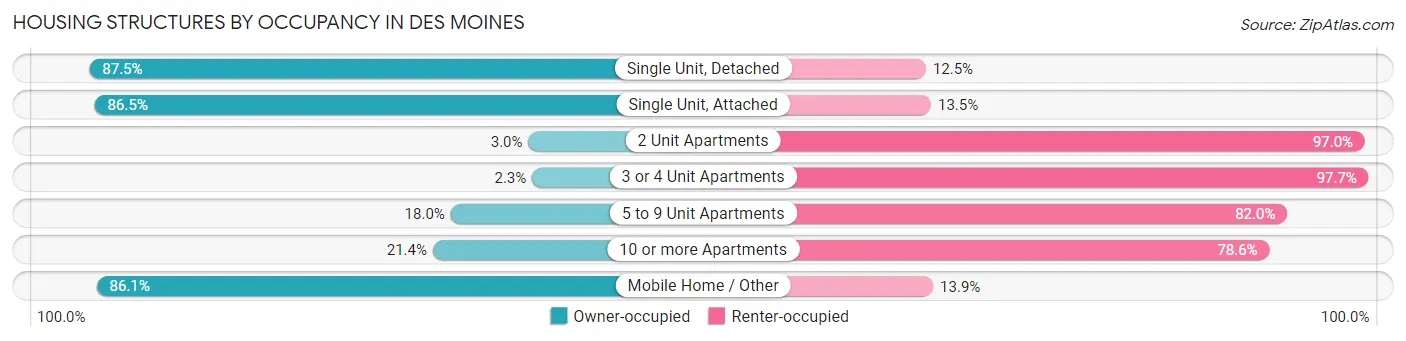
| Structure Type | Owner-occupied | Renter-occupied |
| Single Unit, Detached | 6,156 (87.5%) | 877 (12.5%) |
| Single Unit, Attached | 270 (86.5%) | 42 (13.5%) |
| 2 Unit Apartments | 5 (3.0%) | 161 (97.0%) |
| 3 or 4 Unit Apartments | 19 (2.3%) | 812 (97.7%) |
| 5 to 9 Unit Apartments | 179 (18.0%) | 817 (82.0%) |
| 10 or more Apartments | 627 (21.4%) | 2,303 (78.6%) |
| Mobile Home / Other | 87 (86.1%) | 14 (13.9%) |
| Total | 7,343 (59.4%) | 5,026 (40.6%) |
Housing Structures by Number of Rooms in Des Moines
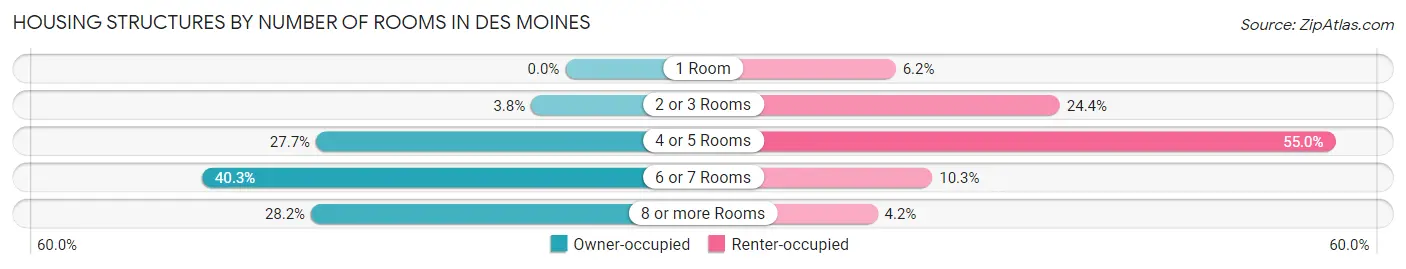
| Number of Rooms | Owner-occupied | Renter-occupied |
| 1 Room | 0 (0.0%) | 311 (6.2%) |
| 2 or 3 Rooms | 278 (3.8%) | 1,227 (24.4%) |
| 4 or 5 Rooms | 2,032 (27.7%) | 2,763 (55.0%) |
| 6 or 7 Rooms | 2,961 (40.3%) | 515 (10.2%) |
| 8 or more Rooms | 2,072 (28.2%) | 210 (4.2%) |
| Total | 7,343 (100.0%) | 5,026 (100.0%) |
Housing Structure by Heating Type in Des Moines
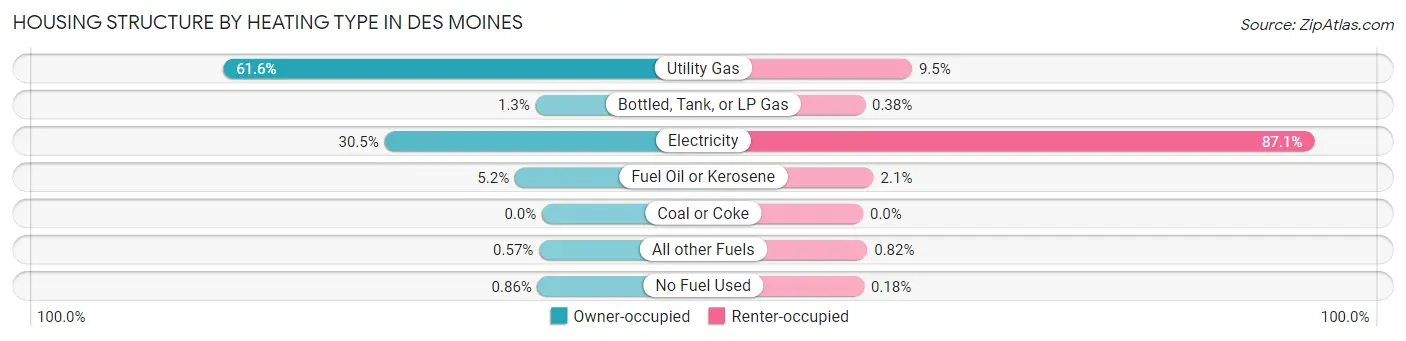
| Heating Type | Owner-occupied | Renter-occupied |
| Utility Gas | 4,525 (61.6%) | 475 (9.5%) |
| Bottled, Tank, or LP Gas | 92 (1.3%) | 19 (0.4%) |
| Electricity | 2,236 (30.4%) | 4,379 (87.1%) |
| Fuel Oil or Kerosene | 385 (5.2%) | 103 (2.1%) |
| Coal or Coke | 0 (0.0%) | 0 (0.0%) |
| All other Fuels | 42 (0.6%) | 41 (0.8%) |
| No Fuel Used | 63 (0.9%) | 9 (0.2%) |
| Total | 7,343 (100.0%) | 5,026 (100.0%) |
Household Vehicle Usage in Des Moines
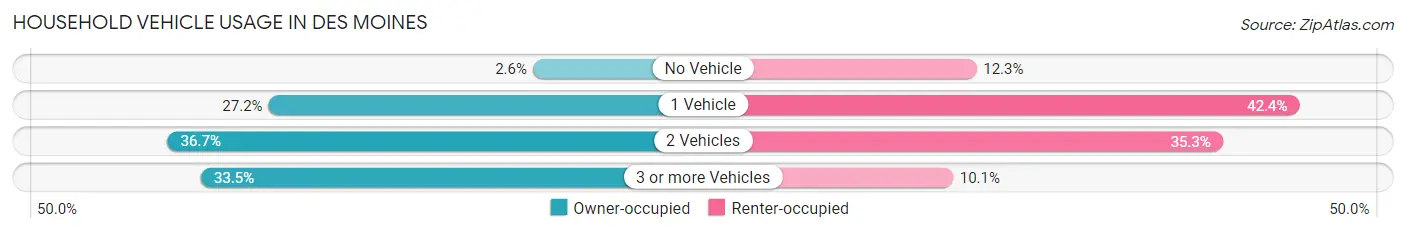
| Vehicles per Household | Owner-occupied | Renter-occupied |
| No Vehicle | 188 (2.6%) | 616 (12.3%) |
| 1 Vehicle | 2,000 (27.2%) | 2,132 (42.4%) |
| 2 Vehicles | 2,692 (36.7%) | 1,772 (35.3%) |
| 3 or more Vehicles | 2,463 (33.5%) | 506 (10.1%) |
| Total | 7,343 (100.0%) | 5,026 (100.0%) |
Real Estate & Mortgages in Des Moines
Real Estate and Mortgage Overview in Des Moines
| Characteristic | Without Mortgage | With Mortgage |
| Housing Units | 2,164 | 5,179 |
| Median Property Value | $473,600 | $487,900 |
| Median Household Income | $76,340 | $1,828 |
| Monthly Housing Costs | $814 | $1,105 |
| Real Estate Taxes | $5,239 | $108 |
Property Value by Mortgage Status in Des Moines
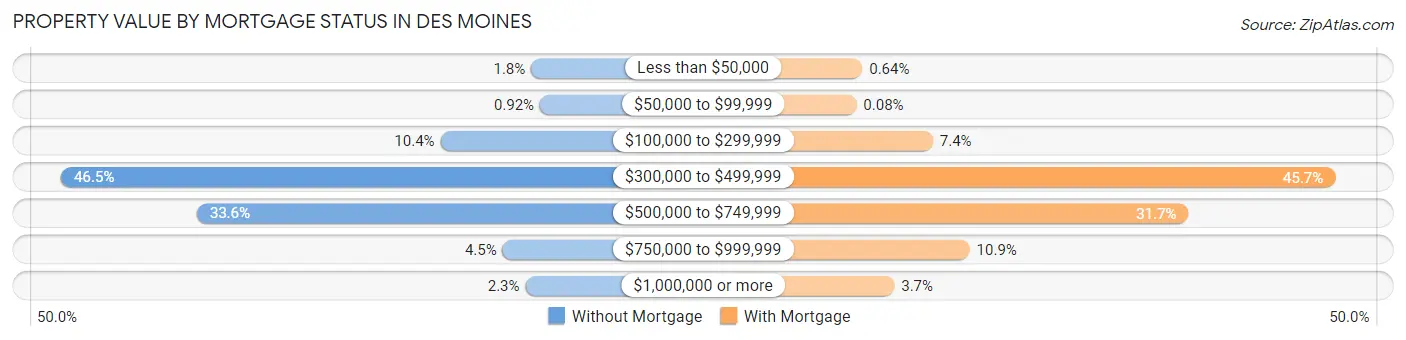
| Property Value | Without Mortgage | With Mortgage |
| Less than $50,000 | 38 (1.8%) | 33 (0.6%) |
| $50,000 to $99,999 | 20 (0.9%) | 4 (0.1%) |
| $100,000 to $299,999 | 225 (10.4%) | 381 (7.4%) |
| $300,000 to $499,999 | 1,007 (46.5%) | 2,365 (45.7%) |
| $500,000 to $749,999 | 727 (33.6%) | 1,642 (31.7%) |
| $750,000 to $999,999 | 97 (4.5%) | 563 (10.9%) |
| $1,000,000 or more | 50 (2.3%) | 191 (3.7%) |
| Total | 2,164 (100.0%) | 5,179 (100.0%) |
Household Income by Mortgage Status in Des Moines
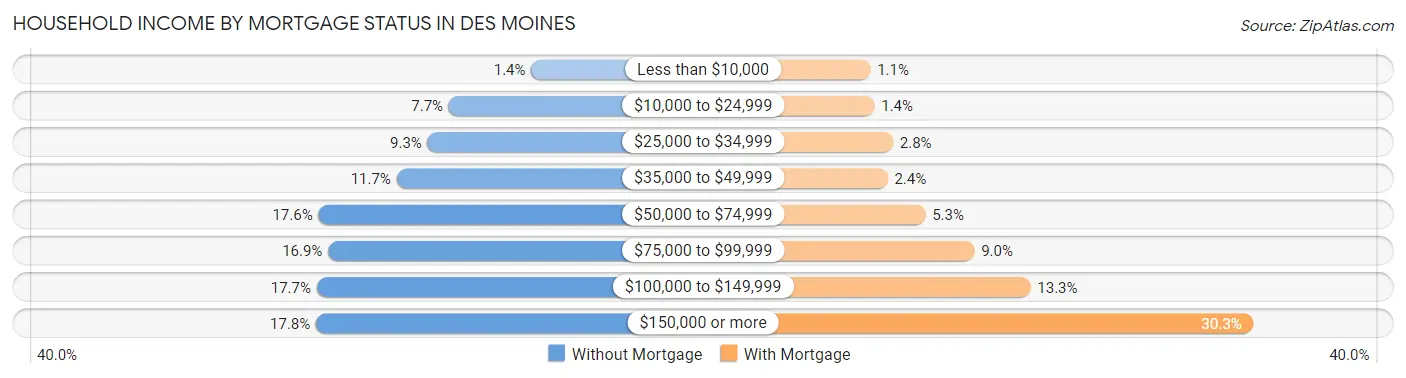
| Household Income | Without Mortgage | With Mortgage |
| Less than $10,000 | 30 (1.4%) | 58 (1.1%) |
| $10,000 to $24,999 | 166 (7.7%) | 74 (1.4%) |
| $25,000 to $34,999 | 201 (9.3%) | 147 (2.8%) |
| $35,000 to $49,999 | 252 (11.7%) | 126 (2.4%) |
| $50,000 to $74,999 | 381 (17.6%) | 275 (5.3%) |
| $75,000 to $99,999 | 365 (16.9%) | 468 (9.0%) |
| $100,000 to $149,999 | 384 (17.7%) | 690 (13.3%) |
| $150,000 or more | 385 (17.8%) | 1,571 (30.3%) |
| Total | 2,164 (100.0%) | 5,179 (100.0%) |
Property Value to Household Income Ratio in Des Moines
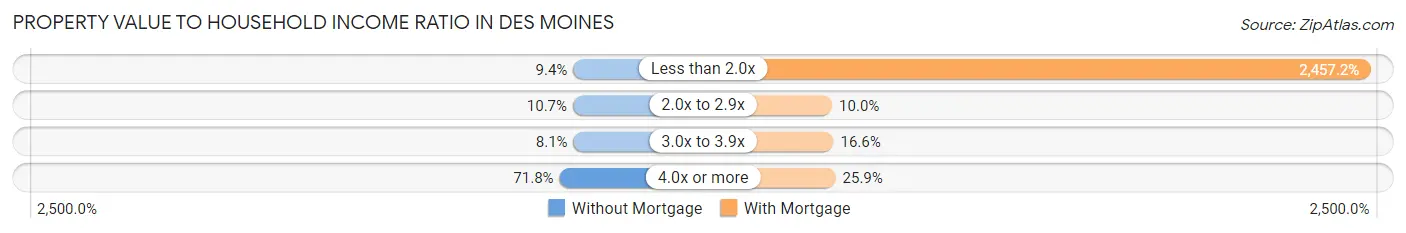
| Value-to-Income Ratio | Without Mortgage | With Mortgage |
| Less than 2.0x | 204 (9.4%) | 127,258 (2,457.2%) |
| 2.0x to 2.9x | 232 (10.7%) | 520 (10.0%) |
| 3.0x to 3.9x | 175 (8.1%) | 861 (16.6%) |
| 4.0x or more | 1,553 (71.8%) | 1,340 (25.9%) |
| Total | 2,164 (100.0%) | 5,179 (100.0%) |
Real Estate Taxes by Mortgage Status in Des Moines
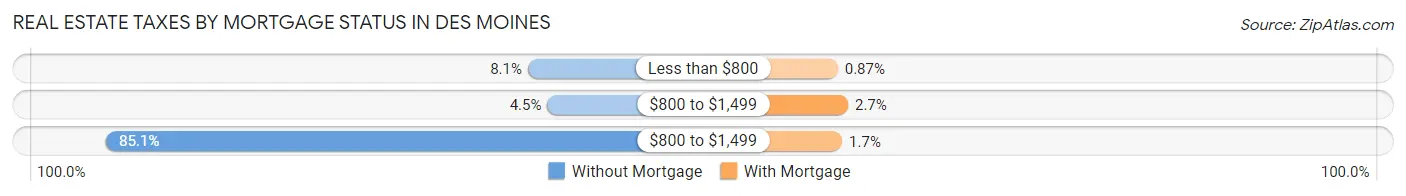
| Property Taxes | Without Mortgage | With Mortgage |
| Less than $800 | 175 (8.1%) | 45 (0.9%) |
| $800 to $1,499 | 98 (4.5%) | 142 (2.7%) |
| $800 to $1,499 | 1,842 (85.1%) | 86 (1.7%) |
| Total | 2,164 (100.0%) | 5,179 (100.0%) |
Health & Disability in Des Moines
Health Insurance Coverage by Age in Des Moines
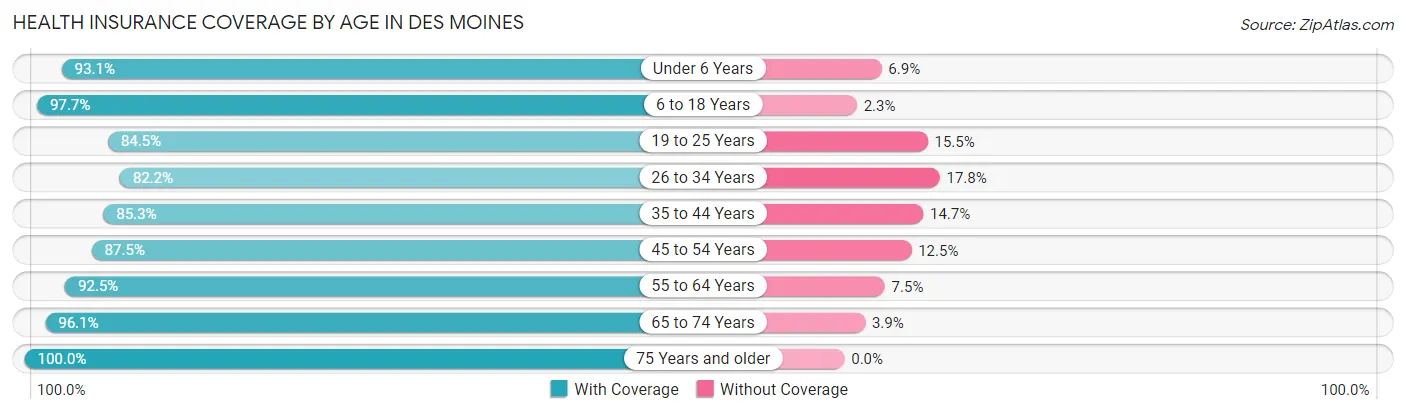
| Age Bracket | With Coverage | Without Coverage |
| Under 6 Years | 2,517 (93.1%) | 187 (6.9%) |
| 6 to 18 Years | 4,631 (97.7%) | 110 (2.3%) |
| 19 to 25 Years | 1,947 (84.5%) | 358 (15.5%) |
| 26 to 34 Years | 3,737 (82.2%) | 807 (17.8%) |
| 35 to 44 Years | 4,125 (85.3%) | 710 (14.7%) |
| 45 to 54 Years | 3,598 (87.5%) | 513 (12.5%) |
| 55 to 64 Years | 3,292 (92.5%) | 268 (7.5%) |
| 65 to 74 Years | 2,616 (96.1%) | 105 (3.9%) |
| 75 Years and older | 2,543 (100.0%) | 0 (0.0%) |
| Total | 29,006 (90.5%) | 3,058 (9.5%) |
Health Insurance Coverage by Citizenship Status in Des Moines
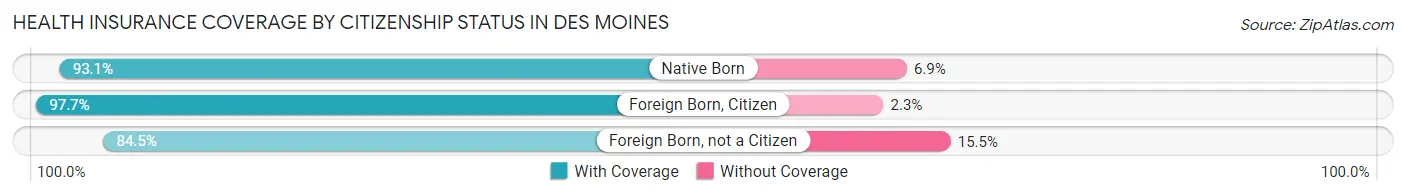
| Citizenship Status | With Coverage | Without Coverage |
| Native Born | 2,517 (93.1%) | 187 (6.9%) |
| Foreign Born, Citizen | 4,631 (97.7%) | 110 (2.3%) |
| Foreign Born, not a Citizen | 1,947 (84.5%) | 358 (15.5%) |
Health Insurance Coverage by Household Income in Des Moines
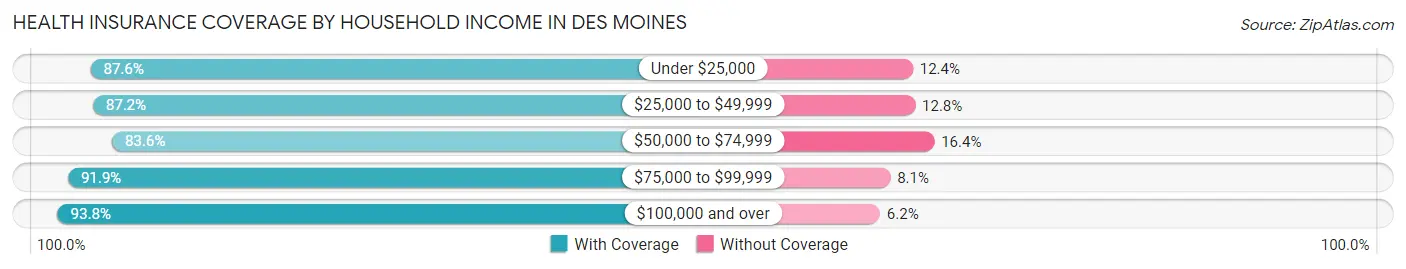
| Household Income | With Coverage | Without Coverage |
| Under $25,000 | 1,922 (87.6%) | 271 (12.4%) |
| $25,000 to $49,999 | 4,470 (87.2%) | 656 (12.8%) |
| $50,000 to $74,999 | 4,333 (83.6%) | 849 (16.4%) |
| $75,000 to $99,999 | 4,070 (91.9%) | 360 (8.1%) |
| $100,000 and over | 13,940 (93.8%) | 922 (6.2%) |
Public vs Private Health Insurance Coverage by Age in Des Moines
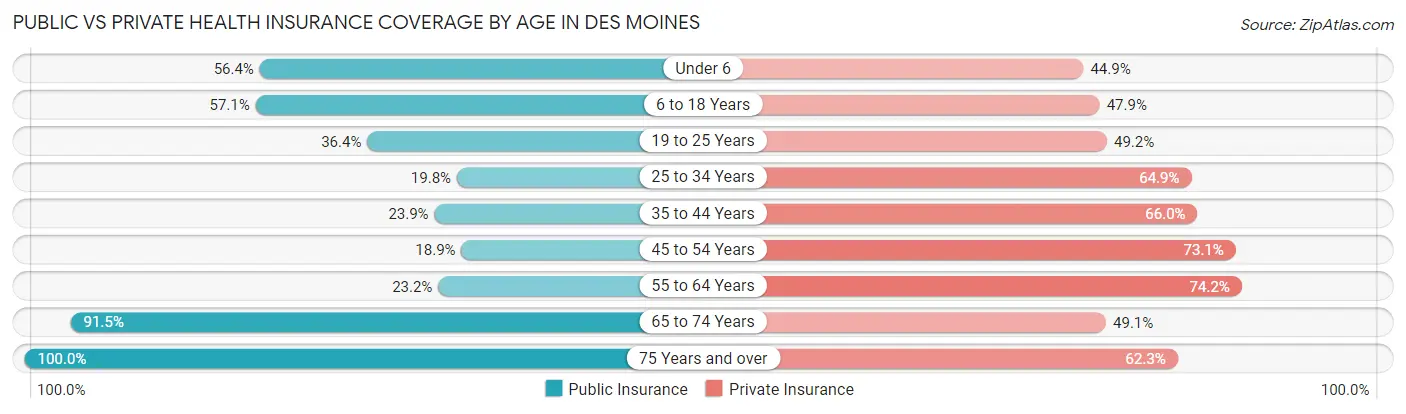
| Age Bracket | Public Insurance | Private Insurance |
| Under 6 | 1,524 (56.4%) | 1,213 (44.9%) |
| 6 to 18 Years | 2,709 (57.1%) | 2,270 (47.9%) |
| 19 to 25 Years | 839 (36.4%) | 1,135 (49.2%) |
| 25 to 34 Years | 898 (19.8%) | 2,948 (64.9%) |
| 35 to 44 Years | 1,157 (23.9%) | 3,191 (66.0%) |
| 45 to 54 Years | 778 (18.9%) | 3,005 (73.1%) |
| 55 to 64 Years | 827 (23.2%) | 2,642 (74.2%) |
| 65 to 74 Years | 2,489 (91.5%) | 1,335 (49.1%) |
| 75 Years and over | 2,543 (100.0%) | 1,585 (62.3%) |
| Total | 13,764 (42.9%) | 19,324 (60.3%) |
Disability Status by Sex by Age in Des Moines
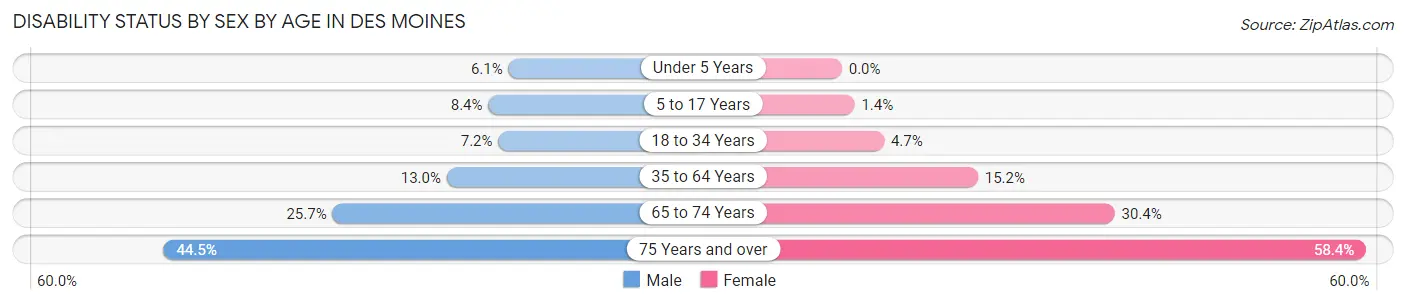
| Age Bracket | Male | Female |
| Under 5 Years | 50 (6.1%) | 0 (0.0%) |
| 5 to 17 Years | 198 (8.4%) | 32 (1.4%) |
| 18 to 34 Years | 254 (7.2%) | 182 (4.7%) |
| 35 to 64 Years | 845 (13.0%) | 908 (15.1%) |
| 65 to 74 Years | 290 (25.7%) | 484 (30.4%) |
| 75 Years and over | 468 (44.5%) | 871 (58.4%) |
Disability Class by Sex by Age in Des Moines
Disability Class: Hearing Difficulty
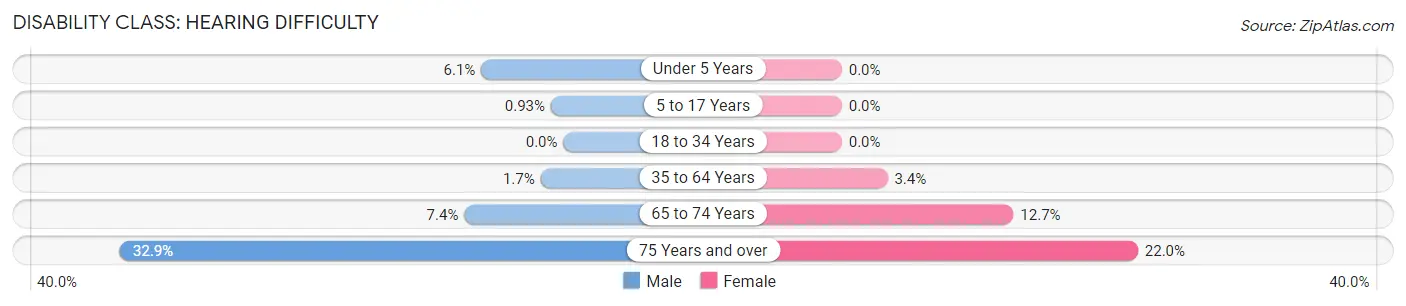
| Age Bracket | Male | Female |
| Under 5 Years | 50 (6.1%) | 0 (0.0%) |
| 5 to 17 Years | 22 (0.9%) | 0 (0.0%) |
| 18 to 34 Years | 0 (0.0%) | 0 (0.0%) |
| 35 to 64 Years | 110 (1.7%) | 203 (3.4%) |
| 65 to 74 Years | 83 (7.4%) | 203 (12.7%) |
| 75 Years and over | 346 (32.9%) | 328 (22.0%) |
Disability Class: Vision Difficulty
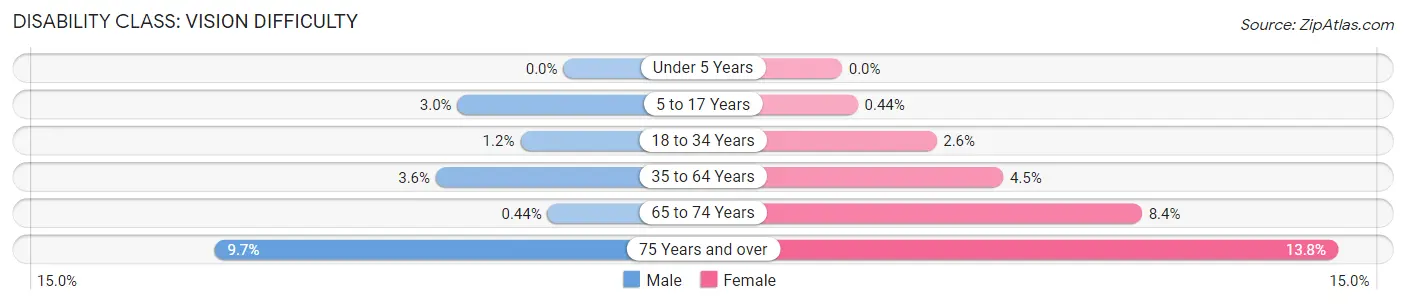
| Age Bracket | Male | Female |
| Under 5 Years | 0 (0.0%) | 0 (0.0%) |
| 5 to 17 Years | 70 (2.9%) | 10 (0.4%) |
| 18 to 34 Years | 42 (1.2%) | 102 (2.6%) |
| 35 to 64 Years | 231 (3.5%) | 269 (4.5%) |
| 65 to 74 Years | 5 (0.4%) | 133 (8.4%) |
| 75 Years and over | 102 (9.7%) | 206 (13.8%) |
Disability Class: Cognitive Difficulty
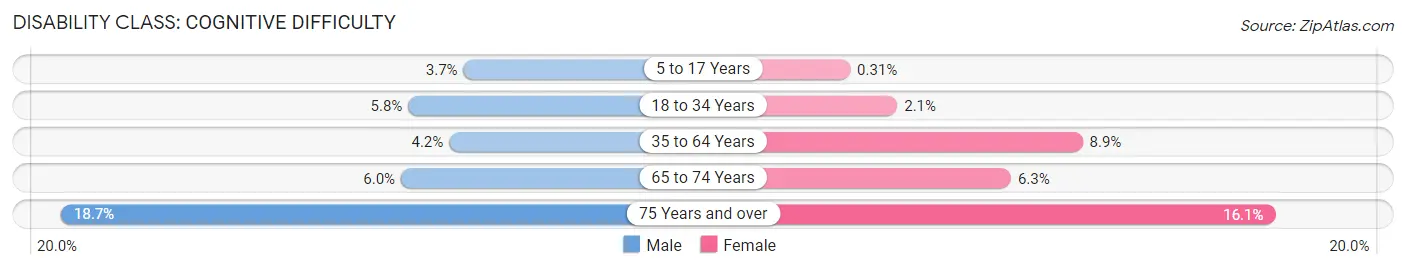
| Age Bracket | Male | Female |
| 5 to 17 Years | 88 (3.7%) | 7 (0.3%) |
| 18 to 34 Years | 202 (5.8%) | 80 (2.1%) |
| 35 to 64 Years | 276 (4.2%) | 536 (8.9%) |
| 65 to 74 Years | 68 (6.0%) | 100 (6.3%) |
| 75 Years and over | 196 (18.6%) | 240 (16.1%) |
Disability Class: Ambulatory Difficulty
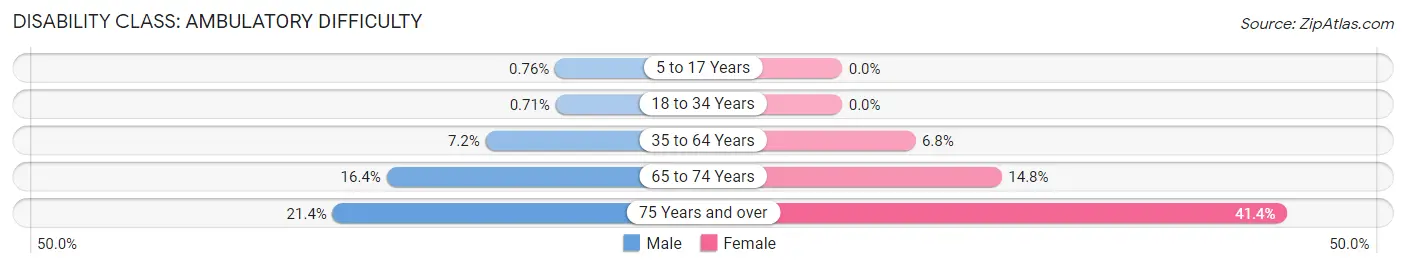
| Age Bracket | Male | Female |
| 5 to 17 Years | 18 (0.8%) | 0 (0.0%) |
| 18 to 34 Years | 25 (0.7%) | 0 (0.0%) |
| 35 to 64 Years | 470 (7.2%) | 407 (6.8%) |
| 65 to 74 Years | 185 (16.4%) | 236 (14.8%) |
| 75 Years and over | 225 (21.4%) | 617 (41.3%) |
Disability Class: Self-Care Difficulty
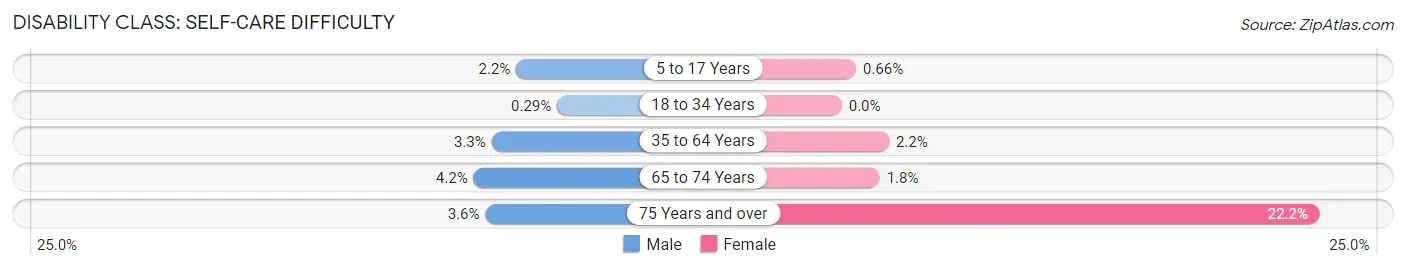
| Age Bracket | Male | Female |
| 5 to 17 Years | 52 (2.2%) | 15 (0.7%) |
| 18 to 34 Years | 10 (0.3%) | 0 (0.0%) |
| 35 to 64 Years | 217 (3.3%) | 131 (2.2%) |
| 65 to 74 Years | 47 (4.2%) | 28 (1.8%) |
| 75 Years and over | 38 (3.6%) | 331 (22.2%) |
Technology Access in Des Moines
Computing Device Access in Des Moines
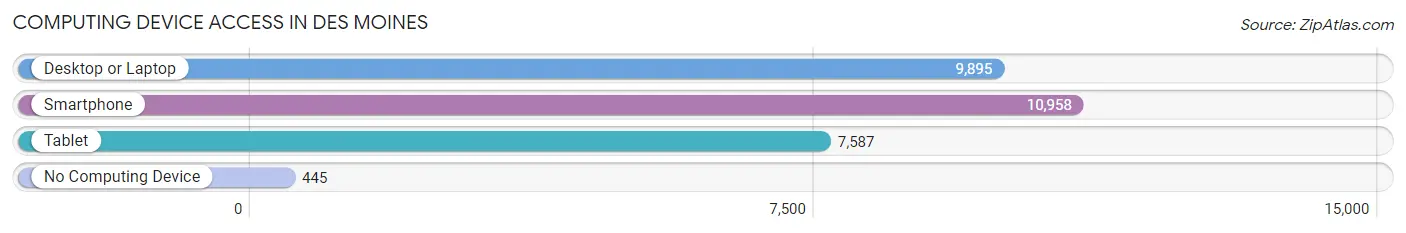
| Device Type | # Households | % Households |
| Desktop or Laptop | 9,895 | 80.0% |
| Smartphone | 10,958 | 88.6% |
| Tablet | 7,587 | 61.3% |
| No Computing Device | 445 | 3.6% |
| Total | 12,369 | 100.0% |
Internet Access in Des Moines
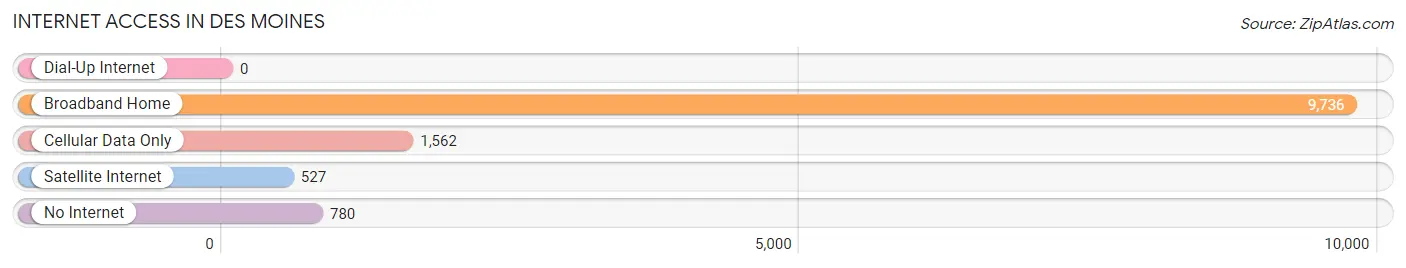
| Internet Type | # Households | % Households |
| Dial-Up Internet | 0 | 0.0% |
| Broadband Home | 9,736 | 78.7% |
| Cellular Data Only | 1,562 | 12.6% |
| Satellite Internet | 527 | 4.3% |
| No Internet | 780 | 6.3% |
| Total | 12,369 | 100.0% |
Des Moines Summary
Des Moines, Washington is a city located in King County, Washington, United States. It is located on the east side of Puget Sound, approximately 10 miles south of Seattle. The population was 29,673 at the 2010 census, making it the largest city in King County outside of Seattle.
History
The area now known as Des Moines was first inhabited by the Muckleshoot and Suquamish Native American tribes. The first European settlers arrived in the area in the late 1800s, and the town was officially incorporated in 1890. The town was named after Des Moines, Iowa, which was the hometown of one of the original settlers.
The early economy of Des Moines was based on logging and fishing, and the town quickly became a popular destination for tourists. In the early 1900s, the town was home to several resorts, including the Des Moines Beach Park, which was a popular destination for Seattleites looking to escape the city.
In the 1950s, the town began to experience rapid growth as the Seattle metropolitan area expanded. The population of Des Moines grew from 1,000 in 1950 to over 10,000 by 1970. This growth was largely due to the construction of Interstate 5, which made Des Moines a convenient suburb of Seattle.
Geography
Des Moines is located in King County, Washington, on the east side of Puget Sound. It is bordered by the cities of Federal Way to the north, Kent to the east, and SeaTac to the south. The city is located approximately 10 miles south of Seattle.
The city has a total area of 8.3 square miles, of which 8.2 square miles is land and 0.1 square miles is water. The city is located at an elevation of approximately 20 feet above sea level.
Economy
The economy of Des Moines is largely based on retail, tourism, and services. The city is home to several large retail stores, including Walmart, Target, and Home Depot. The city is also home to several restaurants, hotels, and other tourist attractions.
The city is also home to several large employers, including Boeing, Amazon, and Microsoft. The city is also home to several smaller businesses, including several tech startups.
Demographics
As of the 2010 census, the population of Des Moines was 29,673. The racial makeup of the city was 68.2% White, 11.2% Asian, 8.3% Hispanic or Latino, 6.2% African American, and 5.2% other.
The median household income in Des Moines was $60,945 in 2017. The median home value was $400,000 in 2017. The median age of the population was 37.7 years.
Conclusion
Des Moines, Washington is a city located in King County, Washington, United States. It is located on the east side of Puget Sound, approximately 10 miles south of Seattle. The population was 29,673 at the 2010 census, making it the largest city in King County outside of Seattle. The city has a long history, dating back to the late 1800s, and has experienced rapid growth in recent decades due to its proximity to Seattle. The economy of Des Moines is largely based on retail, tourism, and services, and the city is home to several large employers, including Boeing, Amazon, and Microsoft. The population of Des Moines is diverse, with a median household income of $60,945 and a median home value of $400,000.
Common Questions
What is Per Capita Income in Des Moines?
Per Capita income in Des Moines is $42,528.
What is the Median Family Income in Des Moines?
Median Family Income in Des Moines is $94,972.
What is the Median Household income in Des Moines?
Median Household Income in Des Moines is $81,362.
What is Income or Wage Gap in Des Moines?
Income or Wage Gap in Des Moines is 21.5%.
Women in Des Moines earn 78.5 cents for every dollar earned by a man.
What is Inequality or Gini Index in Des Moines?
Inequality or Gini Index in Des Moines is 0.42.
What is the Total Population of Des Moines?
Total Population of Des Moines is 32,667.
What is the Total Male Population of Des Moines?
Total Male Population of Des Moines is 15,732.
What is the Total Female Population of Des Moines?
Total Female Population of Des Moines is 16,935.
What is the Ratio of Males per 100 Females in Des Moines?
There are 92.90 Males per 100 Females in Des Moines.
What is the Ratio of Females per 100 Males in Des Moines?
There are 107.65 Females per 100 Males in Des Moines.
What is the Median Population Age in Des Moines?
Median Population Age in Des Moines is 38.2 Years.
What is the Average Family Size in Des Moines
Average Family Size in Des Moines is 3.1 People.
What is the Average Household Size in Des Moines
Average Household Size in Des Moines is 2.6 People.
How Large is the Labor Force in Des Moines?
There are 16,716 People in the Labor Forcein in Des Moines.
What is the Percentage of People in the Labor Force in Des Moines?
63.3% of People are in the Labor Force in Des Moines.
What is the Unemployment Rate in Des Moines?
Unemployment Rate in Des Moines is 8.2%.