Clear Lake CDP Skagit County, WA Map & Demographics
Clear Lake CDP Skagit County Overview
$30,912
PER CAPITA INCOME
$75,500
AVG FAMILY INCOME
$63,125
AVG HOUSEHOLD INCOME
65.3%
WAGE / INCOME GAP [ % ]
34.7¢/ $1
WAGE / INCOME GAP [ $ ]
0.40
INEQUALITY / GINI INDEX
1,121
TOTAL POPULATION
534
MALE POPULATION
587
FEMALE POPULATION
90.97
MALES / 100 FEMALES
109.93
FEMALES / 100 MALES
40.2
MEDIAN AGE
2.9
AVG FAMILY SIZE
2.8
AVG HOUSEHOLD SIZE
463
LABOR FORCE [ PEOPLE ]
54.1%
PERCENT IN LABOR FORCE
1.5%
UNEMPLOYMENT RATE
Income in Clear Lake CDP Skagit County
Income Overview in Clear Lake CDP Skagit County
Per Capita Income in Clear Lake CDP Skagit County is $30,912, while median incomes of families and households are $75,500 and $63,125 respectively.
| Characteristic | Number | Measure |
| Per Capita Income | 1,121 | $30,912 |
| Median Family Income | 286 | $75,500 |
| Mean Family Income | 286 | $91,087 |
| Median Household Income | 405 | $63,125 |
| Mean Household Income | 405 | $82,406 |
| Income Deficit | 286 | $0 |
| Wage / Income Gap (%) | 1,121 | 65.32% |
| Wage / Income Gap ($) | 1,121 | 34.68¢ per $1 |
| Gini / Inequality Index | 1,121 | 0.40 |
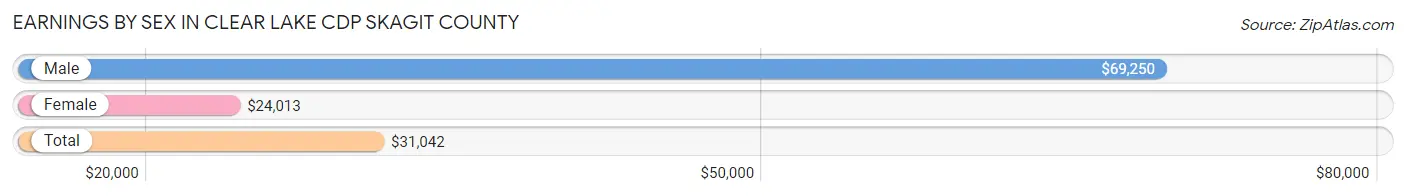
Earnings by Sex in Clear Lake CDP Skagit County
Average Earnings in Clear Lake CDP Skagit County are $31,042, $69,250 for men and $24,013 for women, a difference of 65.3%.
| Sex | Number | Average Earnings |
| Male | 182 (36.5%) | $69,250 |
| Female | 317 (63.5%) | $24,013 |
| Total | 499 (100.0%) | $31,042 |
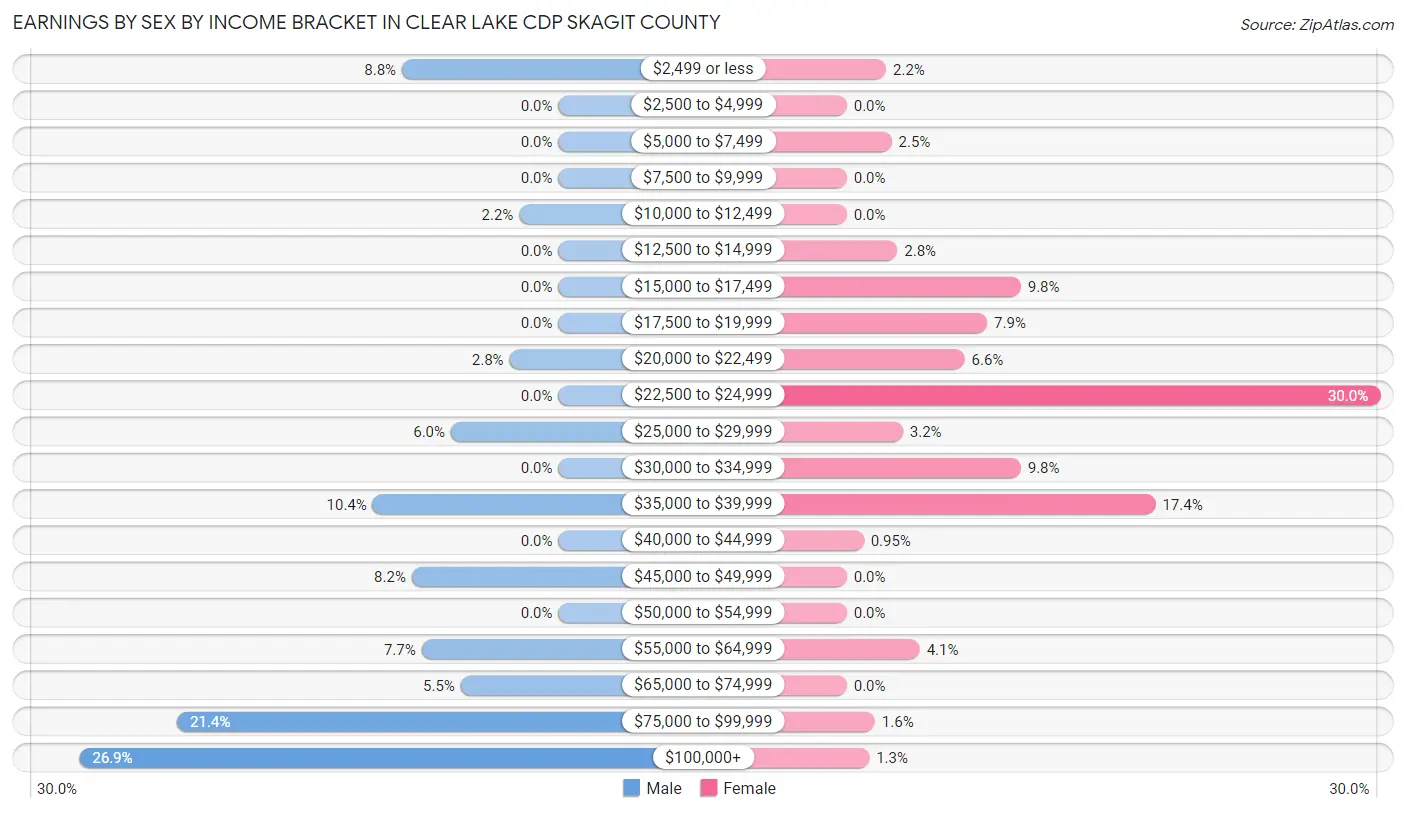
Earnings by Sex by Income Bracket in Clear Lake CDP Skagit County
The most common earnings brackets in Clear Lake CDP Skagit County are $100,000+ for men (49 | 26.9%) and $22,500 to $24,999 for women (95 | 30.0%).
| Income | Male | Female |
| $2,499 or less | 16 (8.8%) | 7 (2.2%) |
| $2,500 to $4,999 | 0 (0.0%) | 0 (0.0%) |
| $5,000 to $7,499 | 0 (0.0%) | 8 (2.5%) |
| $7,500 to $9,999 | 0 (0.0%) | 0 (0.0%) |
| $10,000 to $12,499 | 4 (2.2%) | 0 (0.0%) |
| $12,500 to $14,999 | 0 (0.0%) | 9 (2.8%) |
| $15,000 to $17,499 | 0 (0.0%) | 31 (9.8%) |
| $17,500 to $19,999 | 0 (0.0%) | 25 (7.9%) |
| $20,000 to $22,499 | 5 (2.8%) | 21 (6.6%) |
| $22,500 to $24,999 | 0 (0.0%) | 95 (30.0%) |
| $25,000 to $29,999 | 11 (6.0%) | 10 (3.2%) |
| $30,000 to $34,999 | 0 (0.0%) | 31 (9.8%) |
| $35,000 to $39,999 | 19 (10.4%) | 55 (17.3%) |
| $40,000 to $44,999 | 0 (0.0%) | 3 (0.9%) |
| $45,000 to $49,999 | 15 (8.2%) | 0 (0.0%) |
| $50,000 to $54,999 | 0 (0.0%) | 0 (0.0%) |
| $55,000 to $64,999 | 14 (7.7%) | 13 (4.1%) |
| $65,000 to $74,999 | 10 (5.5%) | 0 (0.0%) |
| $75,000 to $99,999 | 39 (21.4%) | 5 (1.6%) |
| $100,000+ | 49 (26.9%) | 4 (1.3%) |
| Total | 182 (100.0%) | 317 (100.0%) |
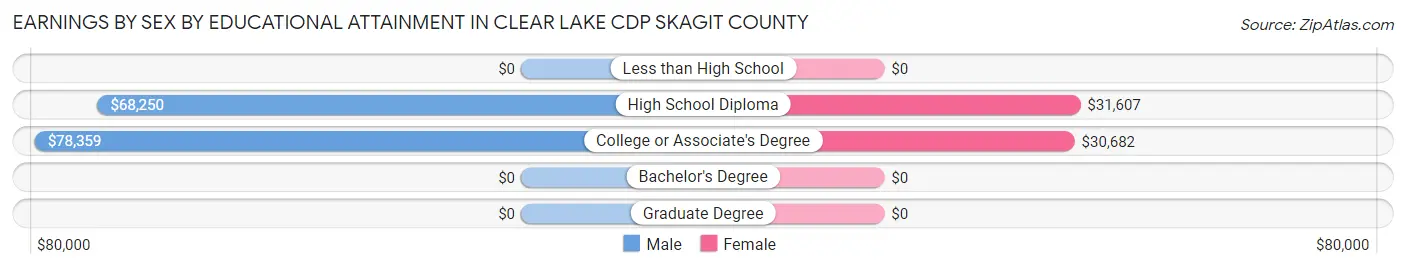
Earnings by Sex by Educational Attainment in Clear Lake CDP Skagit County
Average earnings in Clear Lake CDP Skagit County are $78,828 for men and $29,500 for women, a difference of 62.6%. Men with an educational attainment of college or associate's degree enjoy the highest average annual earnings of $78,359, while those with high school diploma education earn the least with $68,250. Women with an educational attainment of high school diploma earn the most with the average annual earnings of $31,607, while those with college or associate's degree education have the smallest earnings of $30,682.
| Educational Attainment | Male Income | Female Income |
| Less than High School | - | - |
| High School Diploma | $68,250 | $31,607 |
| College or Associate's Degree | $78,359 | $30,682 |
| Bachelor's Degree | - | - |
| Graduate Degree | - | - |
| Total | $78,828 | $29,500 |
Family Income in Clear Lake CDP Skagit County
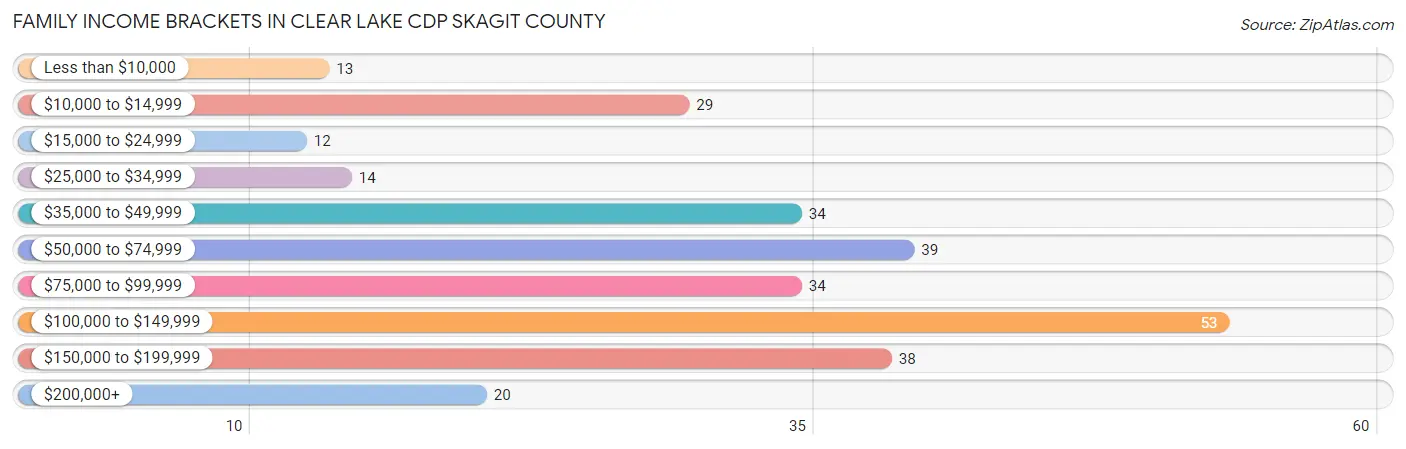
Family Income Brackets in Clear Lake CDP Skagit County
According to the Clear Lake CDP Skagit County family income data, there are 53 families falling into the $100,000 to $149,999 income range, which is the most common income bracket and makes up 18.5% of all families. Conversely, the $15,000 to $24,999 income bracket is the least frequent group with only 12 families (4.2%) belonging to this category.
| Income Bracket | # Families | % Families |
| Less than $10,000 | 13 | 4.5% |
| $10,000 to $14,999 | 29 | 10.1% |
| $15,000 to $24,999 | 12 | 4.2% |
| $25,000 to $34,999 | 14 | 4.9% |
| $35,000 to $49,999 | 34 | 11.9% |
| $50,000 to $74,999 | 39 | 13.6% |
| $75,000 to $99,999 | 34 | 11.9% |
| $100,000 to $149,999 | 53 | 18.5% |
| $150,000 to $199,999 | 38 | 13.3% |
| $200,000+ | 20 | 7.0% |
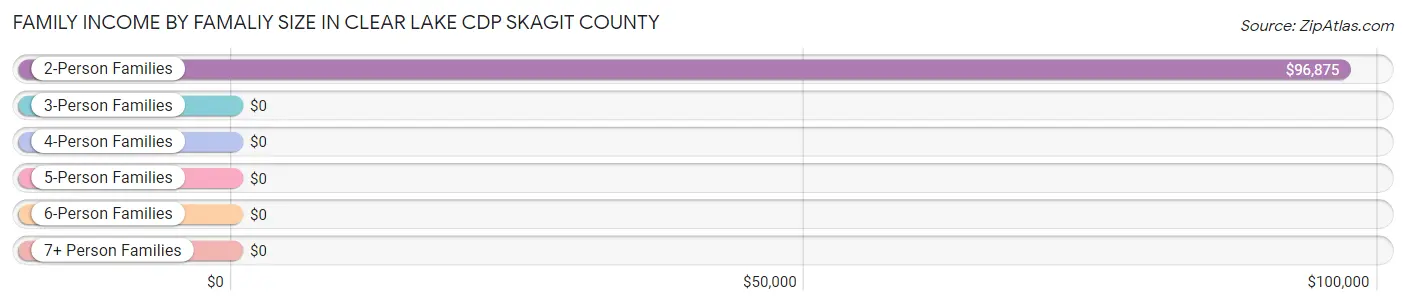
Family Income by Famaliy Size in Clear Lake CDP Skagit County
2-person families (134 | 46.9%) account for the highest median family income in Clear Lake CDP Skagit County with $96,875 per family, while 2-person families (134 | 46.9%) have the highest median income of $48,438 per family member.
| Income Bracket | # Families | Median Income |
| 2-Person Families | 134 (46.9%) | $96,875 |
| 3-Person Families | 72 (25.2%) | $0 |
| 4-Person Families | 45 (15.7%) | $0 |
| 5-Person Families | 15 (5.2%) | $0 |
| 6-Person Families | 19 (6.6%) | $0 |
| 7+ Person Families | 1 (0.4%) | $0 |
| Total | 286 (100.0%) | $75,500 |
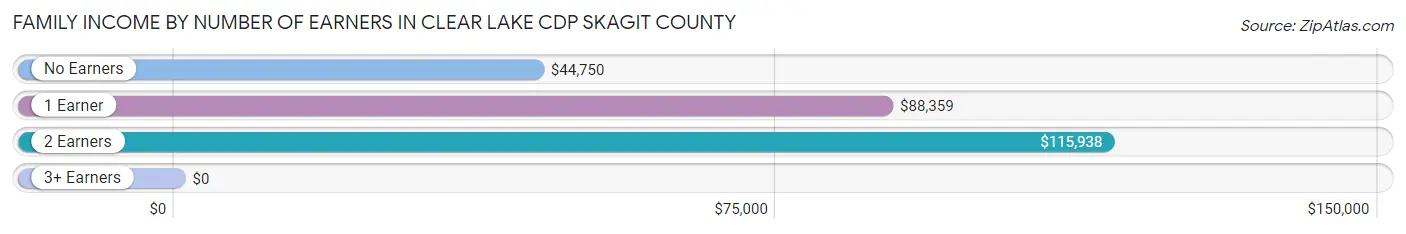
Family Income by Number of Earners in Clear Lake CDP Skagit County
| Number of Earners | # Families | Median Income |
| No Earners | 83 (29.0%) | $44,750 |
| 1 Earner | 137 (47.9%) | $88,359 |
| 2 Earners | 55 (19.2%) | $115,938 |
| 3+ Earners | 11 (3.8%) | $0 |
| Total | 286 (100.0%) | $75,500 |
Household Income in Clear Lake CDP Skagit County
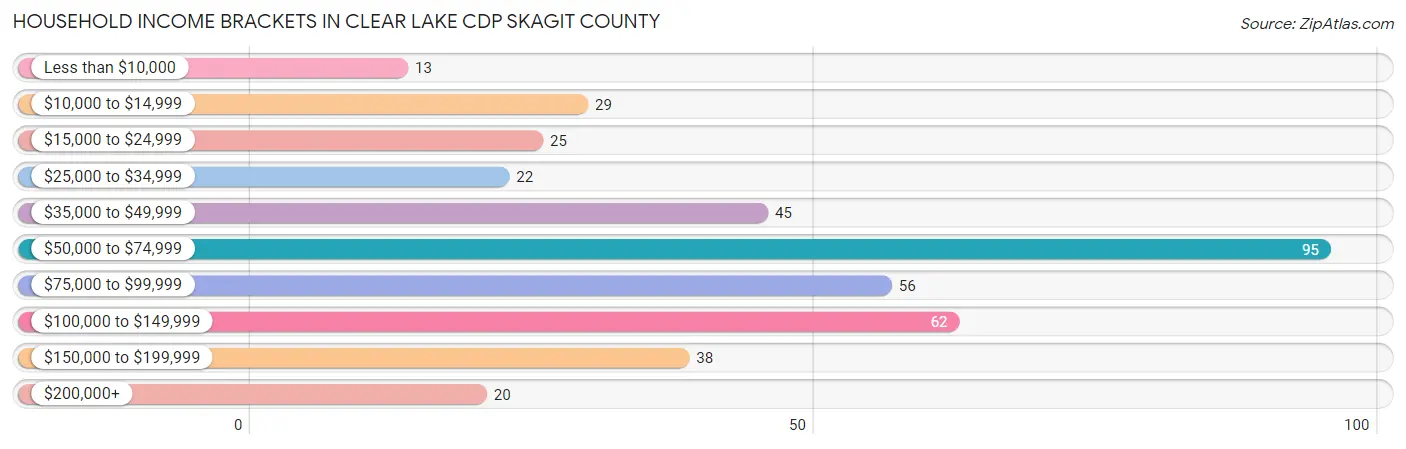
Household Income Brackets in Clear Lake CDP Skagit County
With 95 households falling in the category, the $50,000 to $74,999 income range is the most frequent in Clear Lake CDP Skagit County, accounting for 23.5% of all households. In contrast, only 13 households (3.2%) fall into the less than $10,000 income bracket, making it the least populous group.
| Income Bracket | # Households | % Households |
| Less than $10,000 | 13 | 3.2% |
| $10,000 to $14,999 | 29 | 7.2% |
| $15,000 to $24,999 | 25 | 6.2% |
| $25,000 to $34,999 | 22 | 5.4% |
| $35,000 to $49,999 | 45 | 11.1% |
| $50,000 to $74,999 | 95 | 23.5% |
| $75,000 to $99,999 | 56 | 13.8% |
| $100,000 to $149,999 | 62 | 15.3% |
| $150,000 to $199,999 | 38 | 9.4% |
| $200,000+ | 20 | 4.9% |
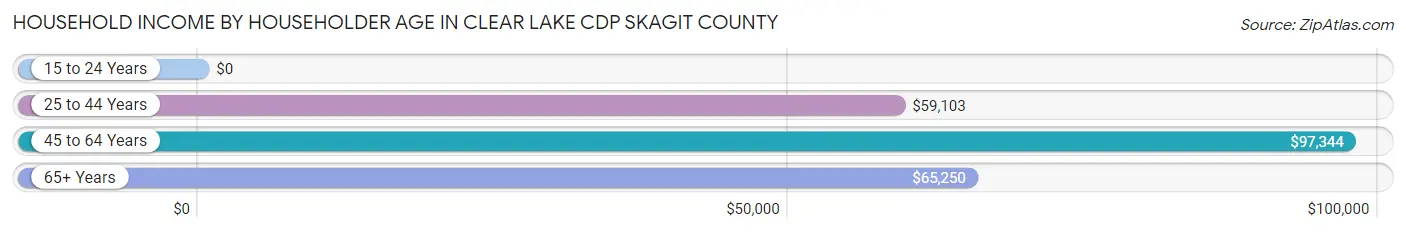
Household Income by Householder Age in Clear Lake CDP Skagit County
The median household income in Clear Lake CDP Skagit County is $63,125, with the highest median household income of $97,344 found in the 45 to 64 years age bracket for the primary householder. A total of 151 households (37.3%) fall into this category.
| Income Bracket | # Households | Median Income |
| 15 to 24 Years | 0 (0.0%) | $0 |
| 25 to 44 Years | 129 (31.9%) | $59,103 |
| 45 to 64 Years | 151 (37.3%) | $97,344 |
| 65+ Years | 125 (30.9%) | $65,250 |
| Total | 405 (100.0%) | $63,125 |
Poverty in Clear Lake CDP Skagit County
Income Below Poverty by Sex and Age in Clear Lake CDP Skagit County
With 22.7% poverty level for males and 15.6% for females among the residents of Clear Lake CDP Skagit County, 16 and 17 year old males and 6 to 11 year old females are the most vulnerable to poverty, with 12 males (80.0%) and 21 females (70.0%) in their respective age groups living below the poverty level.
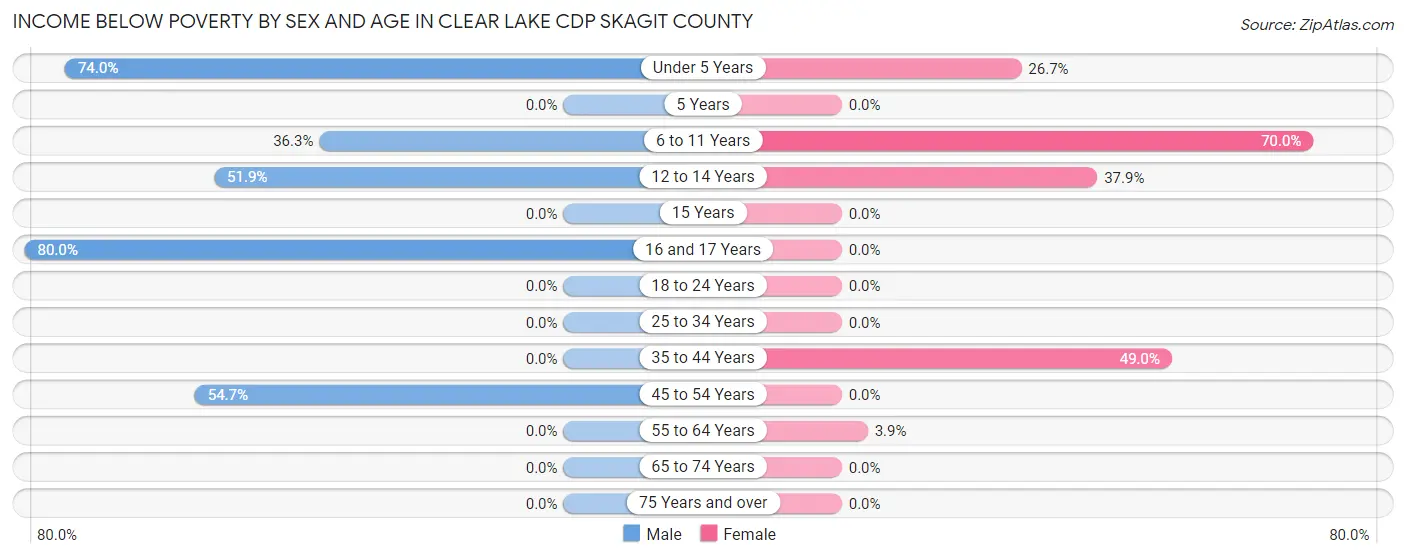
| Age Bracket | Male | Female |
| Under 5 Years | 37 (74.0%) | 4 (26.7%) |
| 5 Years | 0 (0.0%) | 0 (0.0%) |
| 6 to 11 Years | 29 (36.2%) | 21 (70.0%) |
| 12 to 14 Years | 14 (51.8%) | 11 (37.9%) |
| 15 Years | 0 (0.0%) | 0 (0.0%) |
| 16 and 17 Years | 12 (80.0%) | 0 (0.0%) |
| 18 to 24 Years | 0 (0.0%) | 0 (0.0%) |
| 25 to 34 Years | 0 (0.0%) | 0 (0.0%) |
| 35 to 44 Years | 0 (0.0%) | 49 (49.0%) |
| 45 to 54 Years | 29 (54.7%) | 0 (0.0%) |
| 55 to 64 Years | 0 (0.0%) | 4 (3.8%) |
| 65 to 74 Years | 0 (0.0%) | 0 (0.0%) |
| 75 Years and over | 0 (0.0%) | 0 (0.0%) |
| Total | 121 (22.7%) | 89 (15.6%) |
Income Above Poverty by Sex and Age in Clear Lake CDP Skagit County
According to the poverty statistics in Clear Lake CDP Skagit County, males aged 5 years and females aged 5 years are the age groups that are most secure financially, with 100.0% of males and 100.0% of females in these age groups living above the poverty line.
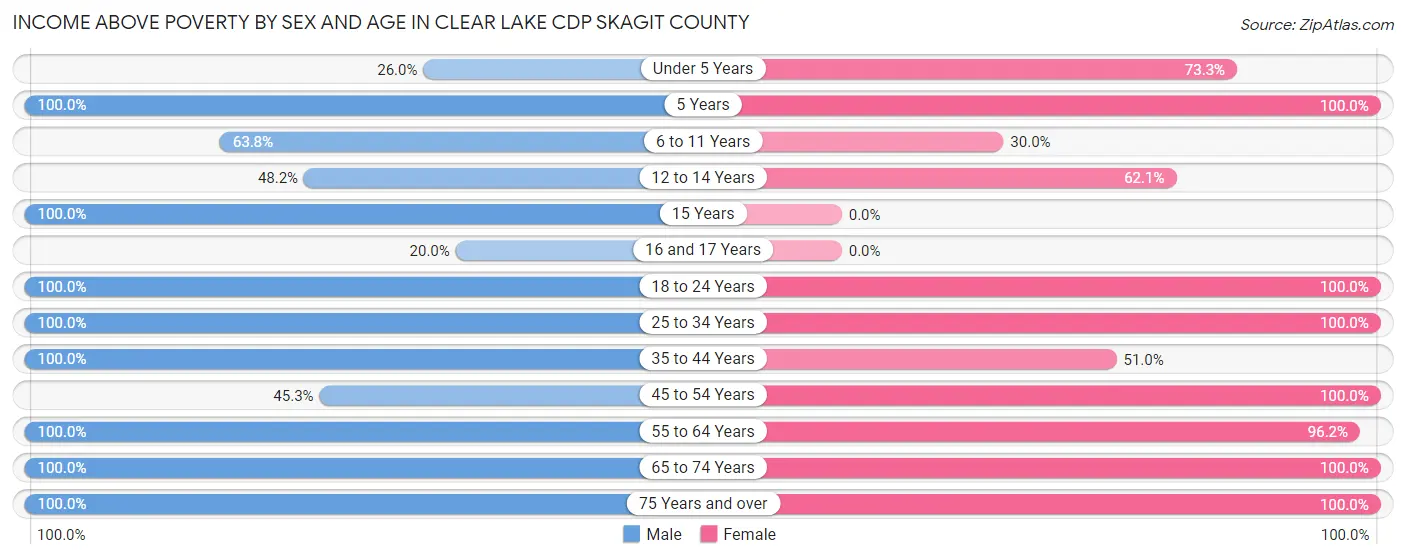
| Age Bracket | Male | Female |
| Under 5 Years | 13 (26.0%) | 11 (73.3%) |
| 5 Years | 8 (100.0%) | 8 (100.0%) |
| 6 to 11 Years | 51 (63.7%) | 9 (30.0%) |
| 12 to 14 Years | 13 (48.1%) | 18 (62.1%) |
| 15 Years | 1 (100.0%) | 0 (0.0%) |
| 16 and 17 Years | 3 (20.0%) | 0 (0.0%) |
| 18 to 24 Years | 11 (100.0%) | 95 (100.0%) |
| 25 to 34 Years | 15 (100.0%) | 68 (100.0%) |
| 35 to 44 Years | 58 (100.0%) | 51 (51.0%) |
| 45 to 54 Years | 24 (45.3%) | 18 (100.0%) |
| 55 to 64 Years | 92 (100.0%) | 100 (96.2%) |
| 65 to 74 Years | 87 (100.0%) | 63 (100.0%) |
| 75 Years and over | 37 (100.0%) | 40 (100.0%) |
| Total | 413 (77.3%) | 481 (84.4%) |
Income Below Poverty Among Married-Couple Families in Clear Lake CDP Skagit County
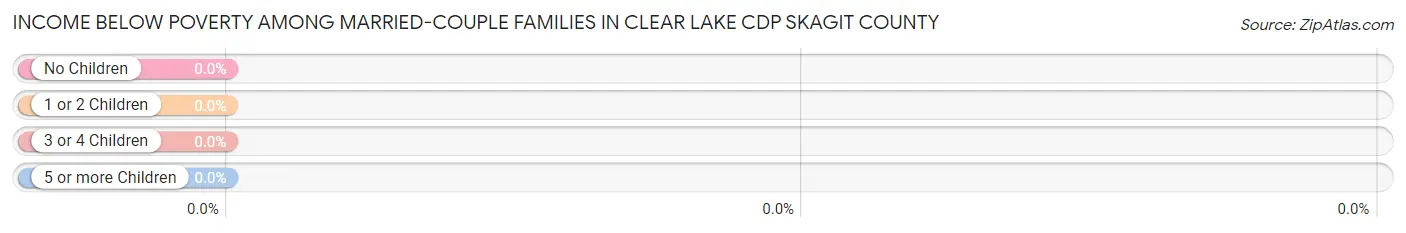
| Children | Above Poverty | Below Poverty |
| No Children | 144 (100.0%) | 0 (0.0%) |
| 1 or 2 Children | 36 (100.0%) | 0 (0.0%) |
| 3 or 4 Children | 12 (100.0%) | 0 (0.0%) |
| 5 or more Children | 0 (0.0%) | 0 (0.0%) |
| Total | 192 (100.0%) | 0 (0.0%) |
Income Below Poverty Among Single-Parent Households in Clear Lake CDP Skagit County
According to the poverty data in Clear Lake CDP Skagit County, 90.6% or 29 single-father households and 46.8% or 29 single-mother households are living below the poverty line. Among single-father households, those with 1 or 2 children have the highest poverty rate, with 29 households (90.6%) experiencing poverty. Likewise, among single-mother households, those with 3 or 4 children have the highest poverty rate, with 17 households (63.0%) falling below the poverty line.
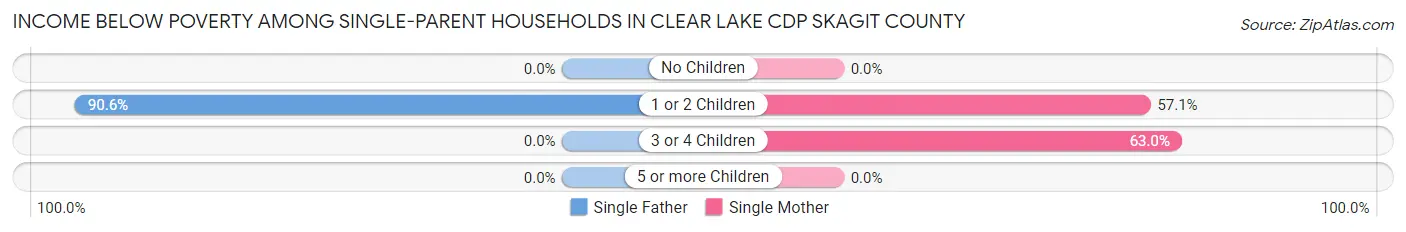
| Children | Single Father | Single Mother |
| No Children | 0 (0.0%) | 0 (0.0%) |
| 1 or 2 Children | 29 (90.6%) | 12 (57.1%) |
| 3 or 4 Children | 0 (0.0%) | 17 (63.0%) |
| 5 or more Children | 0 (0.0%) | 0 (0.0%) |
| Total | 29 (90.6%) | 29 (46.8%) |
Income Below Poverty Among Married-Couple vs Single-Parent Households in Clear Lake CDP Skagit County
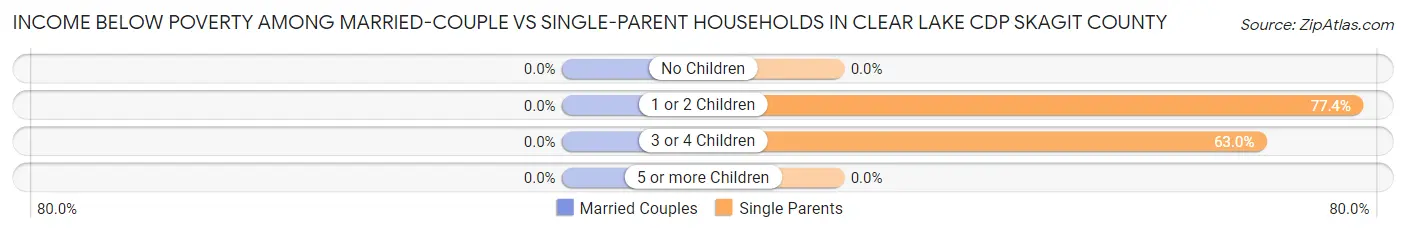
| Children | Married-Couple Families | Single-Parent Households |
| No Children | 0 (0.0%) | 0 (0.0%) |
| 1 or 2 Children | 0 (0.0%) | 41 (77.4%) |
| 3 or 4 Children | 0 (0.0%) | 17 (63.0%) |
| 5 or more Children | 0 (0.0%) | 0 (0.0%) |
| Total | 0 (0.0%) | 58 (61.7%) |
Race in Clear Lake CDP Skagit County
The most populous races in Clear Lake CDP Skagit County are White / Caucasian (860 | 76.7%), Two or more Races (180 | 16.1%), and Asian (53 | 4.7%).
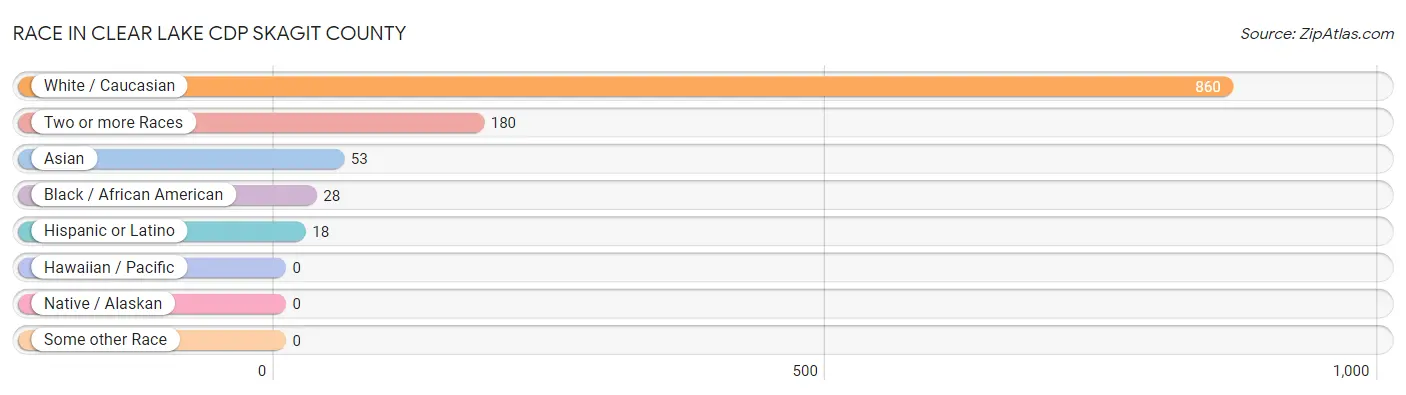
| Race | # Population | % Population |
| Asian | 53 | 4.7% |
| Black / African American | 28 | 2.5% |
| Hawaiian / Pacific | 0 | 0.0% |
| Hispanic or Latino | 18 | 1.6% |
| Native / Alaskan | 0 | 0.0% |
| White / Caucasian | 860 | 76.7% |
| Two or more Races | 180 | 16.1% |
| Some other Race | 0 | 0.0% |
| Total | 1,121 | 100.0% |
Ancestry in Clear Lake CDP Skagit County
The most populous ancestries reported in Clear Lake CDP Skagit County are German (323 | 28.8%), French (167 | 14.9%), Irish (153 | 13.7%), Cherokee (96 | 8.6%), and Norwegian (86 | 7.7%), together accounting for 73.6% of all Clear Lake CDP Skagit County residents.
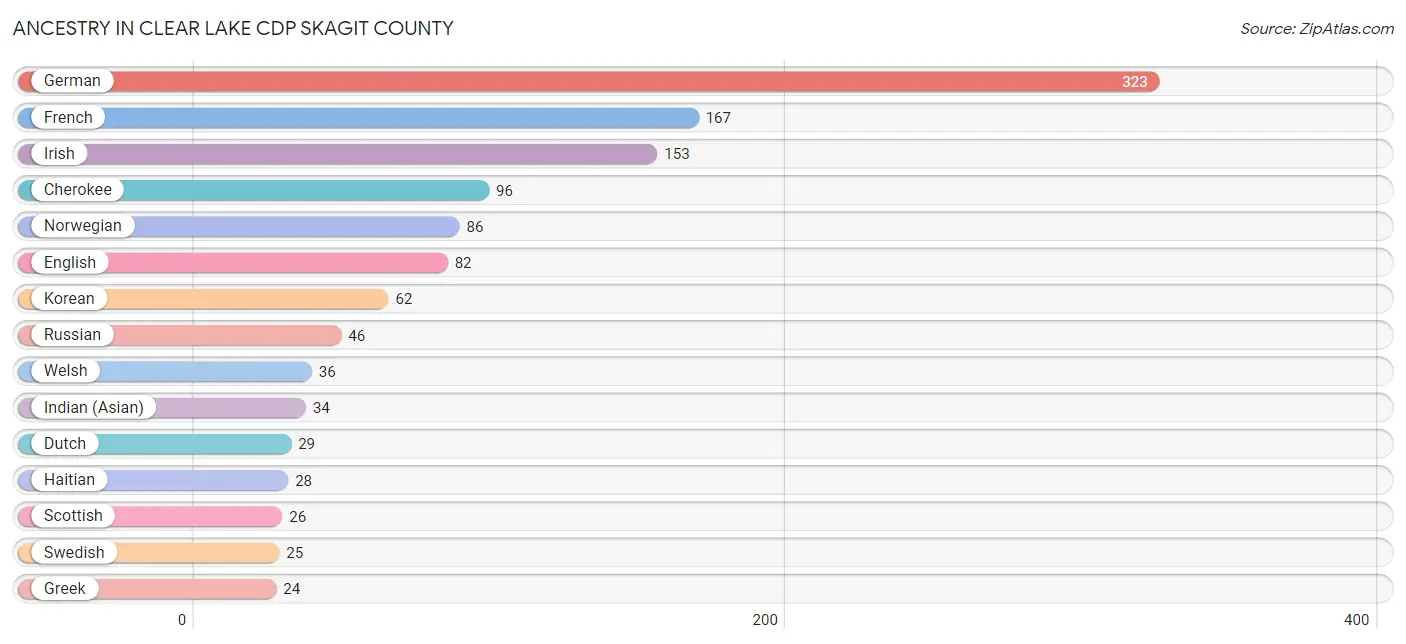
| Ancestry | # Population | % Population |
| American | 6 | 0.5% |
| Belgian | 3 | 0.3% |
| British | 7 | 0.6% |
| Cherokee | 96 | 8.6% |
| Czech | 3 | 0.3% |
| Dutch | 29 | 2.6% |
| English | 82 | 7.3% |
| European | 18 | 1.6% |
| Finnish | 7 | 0.6% |
| French | 167 | 14.9% |
| French Canadian | 18 | 1.6% |
| German | 323 | 28.8% |
| Greek | 24 | 2.1% |
| Haitian | 28 | 2.5% |
| Hungarian | 4 | 0.4% |
| Indian (Asian) | 34 | 3.0% |
| Irish | 153 | 13.7% |
| Italian | 15 | 1.3% |
| Korean | 62 | 5.5% |
| Mexican | 18 | 1.6% |
| Northern European | 15 | 1.3% |
| Norwegian | 86 | 7.7% |
| Polish | 12 | 1.1% |
| Portuguese | 10 | 0.9% |
| Romanian | 4 | 0.4% |
| Russian | 46 | 4.1% |
| Scandinavian | 18 | 1.6% |
| Scotch-Irish | 24 | 2.1% |
| Scottish | 26 | 2.3% |
| Sioux | 10 | 0.9% |
| Slovak | 4 | 0.4% |
| Swedish | 25 | 2.2% |
| Swiss | 3 | 0.3% |
| Welsh | 36 | 3.2% | View All 34 Rows |
Immigrants in Clear Lake CDP Skagit County
The most numerous immigrant groups reported in Clear Lake CDP Skagit County came from Europe (25 | 2.2%), Belarus (21 | 1.9%), Eastern Europe (21 | 1.9%), Asia (19 | 1.7%), and Canada (19 | 1.7%), together accounting for 9.3% of all Clear Lake CDP Skagit County residents.
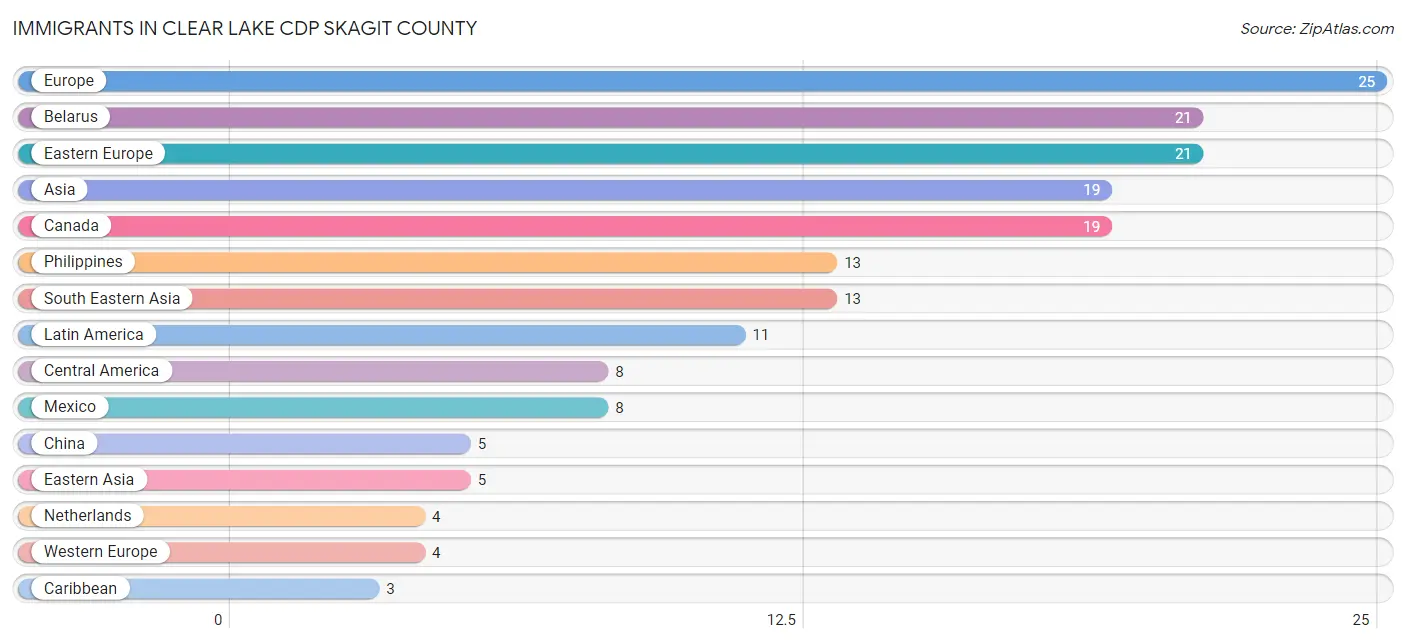
| Immigration Origin | # Population | % Population |
| Asia | 19 | 1.7% |
| Belarus | 21 | 1.9% |
| Canada | 19 | 1.7% |
| Caribbean | 3 | 0.3% |
| Central America | 8 | 0.7% |
| China | 5 | 0.4% |
| Eastern Asia | 5 | 0.4% |
| Eastern Europe | 21 | 1.9% |
| Europe | 25 | 2.2% |
| India | 1 | 0.1% |
| Latin America | 11 | 1.0% |
| Mexico | 8 | 0.7% |
| Netherlands | 4 | 0.4% |
| Philippines | 13 | 1.2% |
| South Central Asia | 1 | 0.1% |
| South Eastern Asia | 13 | 1.2% |
| Trinidad and Tobago | 3 | 0.3% |
| Western Europe | 4 | 0.4% | View All 18 Rows |
Sex and Age in Clear Lake CDP Skagit County
Sex and Age in Clear Lake CDP Skagit County
The most populous age groups in Clear Lake CDP Skagit County are 5 to 9 Years (65 | 12.2%) for men and 20 to 24 Years (95 | 16.2%) for women.
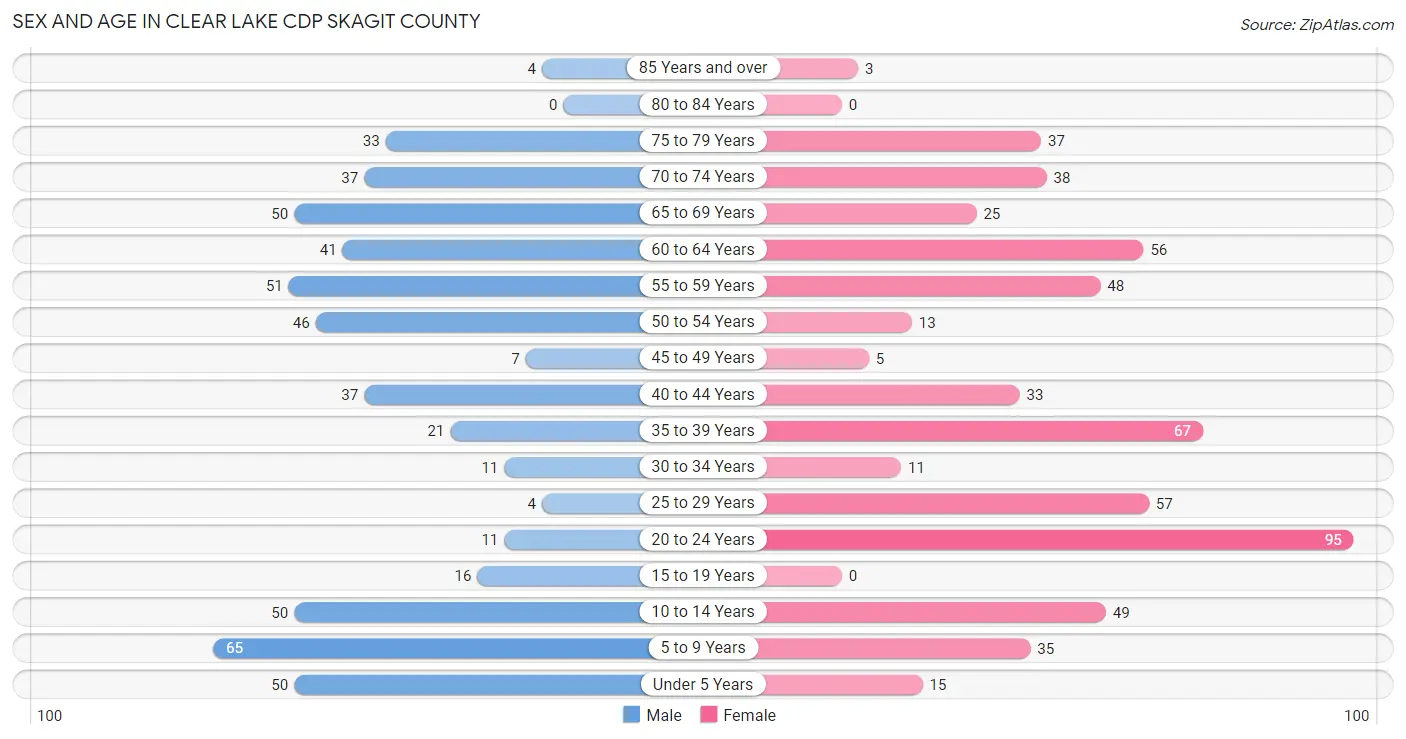
| Age Bracket | Male | Female |
| Under 5 Years | 50 (9.4%) | 15 (2.6%) |
| 5 to 9 Years | 65 (12.2%) | 35 (6.0%) |
| 10 to 14 Years | 50 (9.4%) | 49 (8.4%) |
| 15 to 19 Years | 16 (3.0%) | 0 (0.0%) |
| 20 to 24 Years | 11 (2.1%) | 95 (16.2%) |
| 25 to 29 Years | 4 (0.7%) | 57 (9.7%) |
| 30 to 34 Years | 11 (2.1%) | 11 (1.9%) |
| 35 to 39 Years | 21 (3.9%) | 67 (11.4%) |
| 40 to 44 Years | 37 (6.9%) | 33 (5.6%) |
| 45 to 49 Years | 7 (1.3%) | 5 (0.9%) |
| 50 to 54 Years | 46 (8.6%) | 13 (2.2%) |
| 55 to 59 Years | 51 (9.6%) | 48 (8.2%) |
| 60 to 64 Years | 41 (7.7%) | 56 (9.5%) |
| 65 to 69 Years | 50 (9.4%) | 25 (4.3%) |
| 70 to 74 Years | 37 (6.9%) | 38 (6.5%) |
| 75 to 79 Years | 33 (6.2%) | 37 (6.3%) |
| 80 to 84 Years | 0 (0.0%) | 0 (0.0%) |
| 85 Years and over | 4 (0.7%) | 3 (0.5%) |
| Total | 534 (100.0%) | 587 (100.0%) |
Families and Households in Clear Lake CDP Skagit County
Median Family Size in Clear Lake CDP Skagit County
The median family size in Clear Lake CDP Skagit County is 2.93 persons per family, with single female/mother families (62 | 21.7%) accounting for the largest median family size of 3.44 persons per family. On the other hand, single male/father families (32 | 11.2%) represent the smallest median family size with 2.66 persons per family.
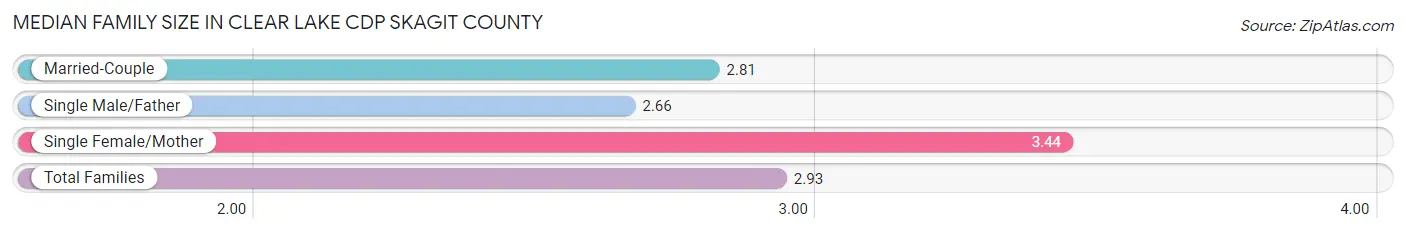
| Family Type | # Families | Family Size |
| Married-Couple | 192 (67.1%) | 2.81 |
| Single Male/Father | 32 (11.2%) | 2.66 |
| Single Female/Mother | 62 (21.7%) | 3.44 |
| Total Families | 286 (100.0%) | 2.93 |
Median Household Size in Clear Lake CDP Skagit County
The median household size in Clear Lake CDP Skagit County is 2.77 persons per household, with single male/father households (32 | 7.9%) accounting for the largest median household size of 3.81 persons per household. non-family households (119 | 29.4%) represent the smallest median household size with 2.00 persons per household.
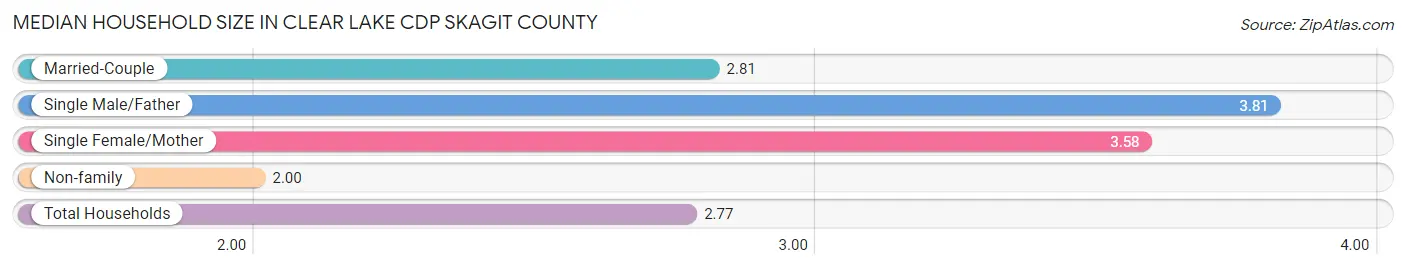
| Household Type | # Households | Household Size |
| Married-Couple | 192 (47.4%) | 2.81 |
| Single Male/Father | 32 (7.9%) | 3.81 |
| Single Female/Mother | 62 (15.3%) | 3.58 |
| Non-family | 119 (29.4%) | 2.00 |
| Total Households | 405 (100.0%) | 2.77 |
Household Size by Marriage Status in Clear Lake CDP Skagit County
Out of a total of 405 households in Clear Lake CDP Skagit County, 286 (70.6%) are family households, while 119 (29.4%) are nonfamily households. The most numerous type of family households are 2-person households, comprising 134, and the most common type of nonfamily households are 1-person households, comprising 57.
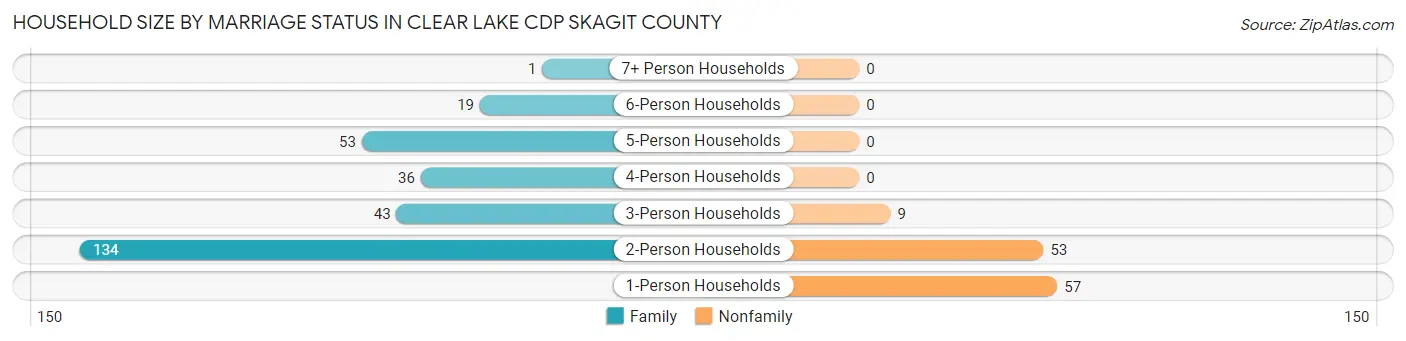
| Household Size | Family Households | Nonfamily Households |
| 1-Person Households | - | 57 (14.1%) |
| 2-Person Households | 134 (33.1%) | 53 (13.1%) |
| 3-Person Households | 43 (10.6%) | 9 (2.2%) |
| 4-Person Households | 36 (8.9%) | 0 (0.0%) |
| 5-Person Households | 53 (13.1%) | 0 (0.0%) |
| 6-Person Households | 19 (4.7%) | 0 (0.0%) |
| 7+ Person Households | 1 (0.3%) | 0 (0.0%) |
| Total | 286 (70.6%) | 119 (29.4%) |
Female Fertility in Clear Lake CDP Skagit County
Fertility by Age in Clear Lake CDP Skagit County
| Age Bracket | Women with Births | Births / 1,000 Women |
| 15 to 19 years | 0 (0.0%) | 0.0 |
| 20 to 34 years | 0 (0.0%) | 0.0 |
| 35 to 50 years | 0 (0.0%) | 0.0 |
| Total | 0 (0.0%) | 0.0 |
Fertility by Age by Marriage Status in Clear Lake CDP Skagit County
| Age Bracket | Married | Unmarried |
| 15 to 19 years | 0 (0.0%) | 0 (0.0%) |
| 20 to 34 years | 0 (0.0%) | 0 (0.0%) |
| 35 to 50 years | 0 (0.0%) | 0 (0.0%) |
| Total | 0 (0.0%) | 0 (0.0%) |
Fertility by Education in Clear Lake CDP Skagit County
| Educational Attainment | Women with Births | Births / 1,000 Women |
| Less than High School | 0 (0.0%) | 0.0 |
| High School Diploma | 0 (0.0%) | 0.0 |
| College or Associate's Degree | 0 (0.0%) | 0.0 |
| Bachelor's Degree | 0 (0.0%) | 0.0 |
| Graduate Degree | 0 (0.0%) | 0.0 |
| Total | 0 (0.0%) | 0.0 |
Fertility by Education by Marriage Status in Clear Lake CDP Skagit County
| Educational Attainment | Married | Unmarried |
| Less than High School | 0 (0.0%) | 0 (0.0%) |
| High School Diploma | 0 (0.0%) | 0 (0.0%) |
| College or Associate's Degree | 0 (0.0%) | 0 (0.0%) |
| Bachelor's Degree | 0 (0.0%) | 0 (0.0%) |
| Graduate Degree | 0 (0.0%) | 0 (0.0%) |
| Total | 0 (0.0%) | 0 (0.0%) |
Employment Characteristics in Clear Lake CDP Skagit County
Employment by Class of Employer in Clear Lake CDP Skagit County
Among the 431 employed individuals in Clear Lake CDP Skagit County, private company employees (315 | 73.1%), local government employees (70 | 16.2%), and not-for-profit organizations (20 | 4.6%) make up the most common classes of employment.
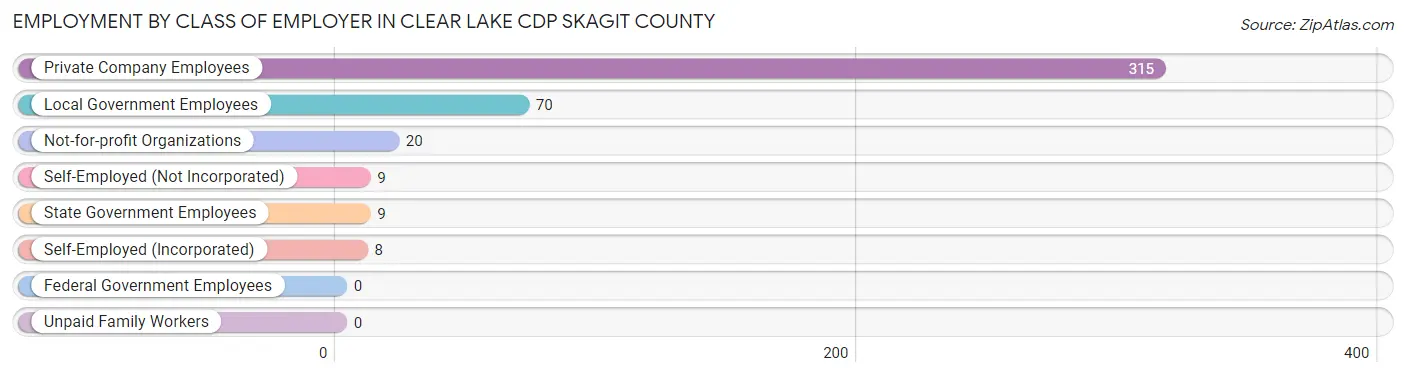
| Employer Class | # Employees | % Employees |
| Private Company Employees | 315 | 73.1% |
| Self-Employed (Incorporated) | 8 | 1.9% |
| Self-Employed (Not Incorporated) | 9 | 2.1% |
| Not-for-profit Organizations | 20 | 4.6% |
| Local Government Employees | 70 | 16.2% |
| State Government Employees | 9 | 2.1% |
| Federal Government Employees | 0 | 0.0% |
| Unpaid Family Workers | 0 | 0.0% |
| Total | 431 | 100.0% |
Employment Status by Age in Clear Lake CDP Skagit County
According to the labor force statistics for Clear Lake CDP Skagit County, out of the total population over 16 years of age (856), 54.1% or 463 individuals are in the labor force, with 1.5% or 7 of them unemployed. The age group with the highest labor force participation rate is 30 to 34 years, with 100.0% or 22 individuals in the labor force. Within the labor force, the 25 to 29 years age range has the highest percentage of unemployed individuals, with 8.0% or 4 of them being unemployed.
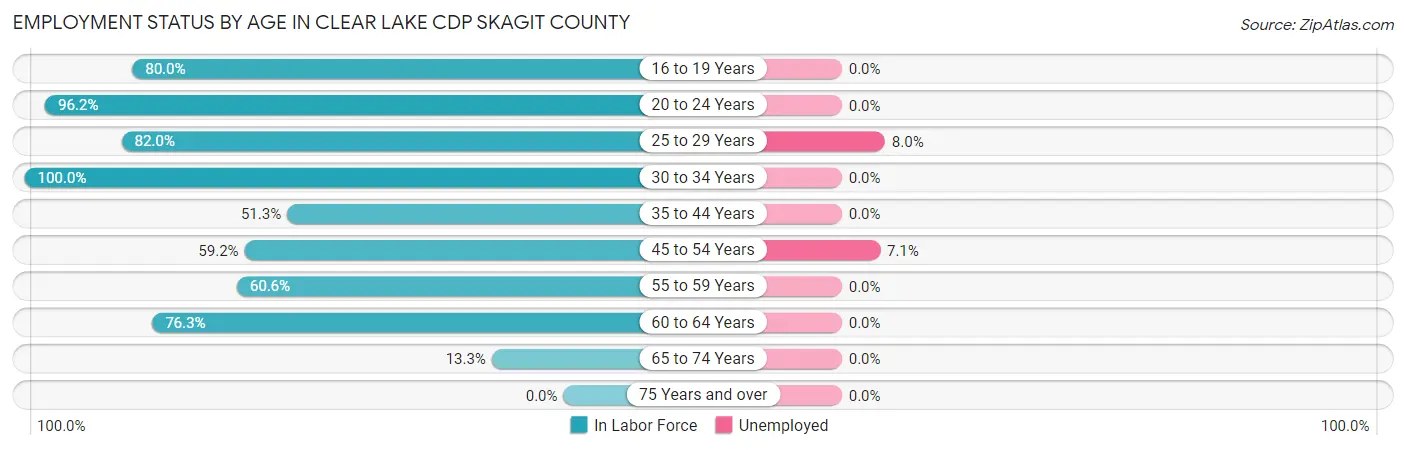
| Age Bracket | In Labor Force | Unemployed |
| 16 to 19 Years | 12 (80.0%) | 0 (0.0%) |
| 20 to 24 Years | 102 (96.2%) | 0 (0.0%) |
| 25 to 29 Years | 50 (82.0%) | 4 (8.0%) |
| 30 to 34 Years | 22 (100.0%) | 0 (0.0%) |
| 35 to 44 Years | 81 (51.3%) | 0 (0.0%) |
| 45 to 54 Years | 42 (59.2%) | 3 (7.1%) |
| 55 to 59 Years | 60 (60.6%) | 0 (0.0%) |
| 60 to 64 Years | 74 (76.3%) | 0 (0.0%) |
| 65 to 74 Years | 20 (13.3%) | 0 (0.0%) |
| 75 Years and over | 0 (0.0%) | 0 (0.0%) |
| Total | 463 (54.1%) | 7 (1.5%) |
Employment Status by Educational Attainment in Clear Lake CDP Skagit County
According to labor force statistics for Clear Lake CDP Skagit County, 64.8% of individuals (329) out of the total population between 25 and 64 years of age (508) are in the labor force, with 2.1% or 7 of them being unemployed. The group with the highest labor force participation rate are those with the educational attainment of high school diploma, with 73.5% or 86 individuals in the labor force. Within the labor force, individuals with high school diploma education have the highest percentage of unemployment, with 8.1% or 7 of them being unemployed.
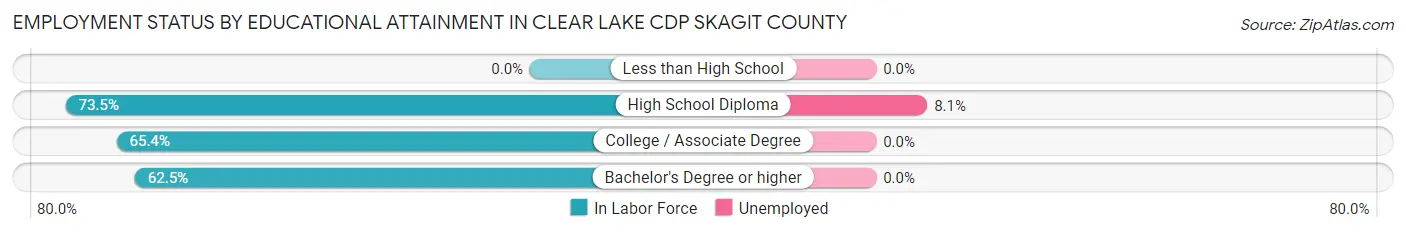
| Educational Attainment | In Labor Force | Unemployed |
| Less than High School | 0 (0.0%) | 0 (0.0%) |
| High School Diploma | 86 (73.5%) | 9 (8.1%) |
| College / Associate Degree | 183 (65.4%) | 0 (0.0%) |
| Bachelor's Degree or higher | 60 (62.5%) | 0 (0.0%) |
| Total | 329 (64.8%) | 11 (2.1%) |
Employment Occupations by Sex in Clear Lake CDP Skagit County
Management, Business, Science and Arts Occupations
The most common Management, Business, Science and Arts occupations in Clear Lake CDP Skagit County are Management (32 | 7.0%), Community & Social Service (30 | 6.6%), Education Instruction & Library (20 | 4.4%), Computers, Engineering & Science (19 | 4.2%), and Health Diagnosing & Treating (17 | 3.7%).
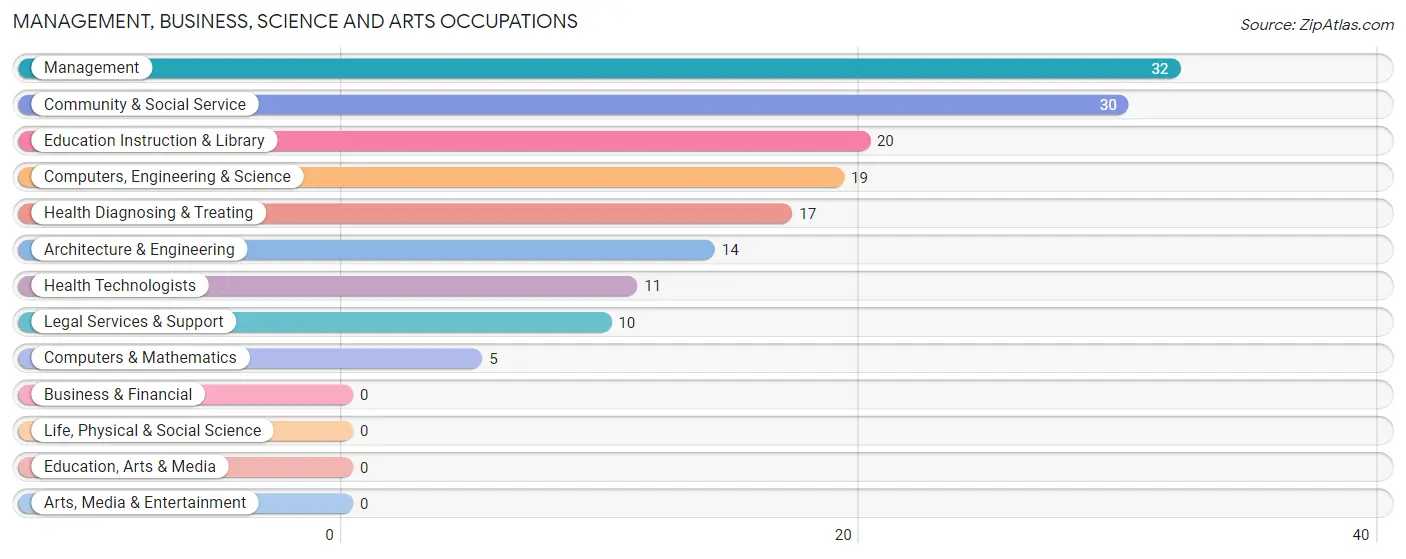
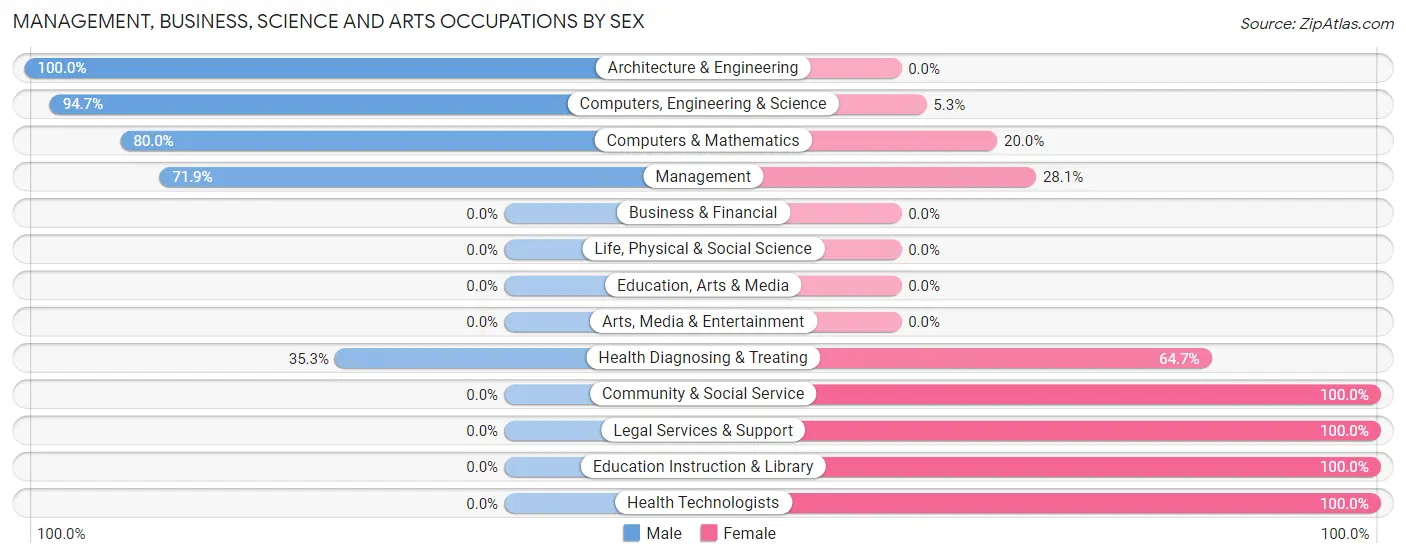
Management, Business, Science and Arts Occupations by Sex
Within the Management, Business, Science and Arts occupations in Clear Lake CDP Skagit County, the most male-oriented occupations are Architecture & Engineering (100.0%), Computers, Engineering & Science (94.7%), and Computers & Mathematics (80.0%), while the most female-oriented occupations are Community & Social Service (100.0%), Legal Services & Support (100.0%), and Education Instruction & Library (100.0%).
| Occupation | Male | Female |
| Management | 23 (71.9%) | 9 (28.1%) |
| Business & Financial | 0 (0.0%) | 0 (0.0%) |
| Computers, Engineering & Science | 18 (94.7%) | 1 (5.3%) |
| Computers & Mathematics | 4 (80.0%) | 1 (20.0%) |
| Architecture & Engineering | 14 (100.0%) | 0 (0.0%) |
| Life, Physical & Social Science | 0 (0.0%) | 0 (0.0%) |
| Community & Social Service | 0 (0.0%) | 30 (100.0%) |
| Education, Arts & Media | 0 (0.0%) | 0 (0.0%) |
| Legal Services & Support | 0 (0.0%) | 10 (100.0%) |
| Education Instruction & Library | 0 (0.0%) | 20 (100.0%) |
| Arts, Media & Entertainment | 0 (0.0%) | 0 (0.0%) |
| Health Diagnosing & Treating | 6 (35.3%) | 11 (64.7%) |
| Health Technologists | 0 (0.0%) | 11 (100.0%) |
| Total (Category) | 47 (48.0%) | 51 (52.0%) |
| Total (Overall) | 169 (37.1%) | 287 (62.9%) |
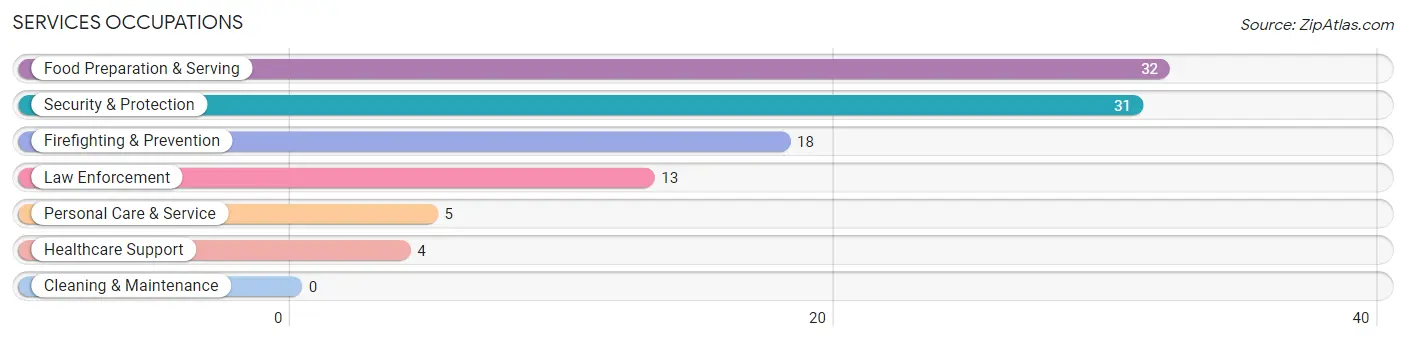
Services Occupations
The most common Services occupations in Clear Lake CDP Skagit County are Food Preparation & Serving (32 | 7.0%), Security & Protection (31 | 6.8%), Firefighting & Prevention (18 | 4.0%), Law Enforcement (13 | 2.9%), and Personal Care & Service (5 | 1.1%).
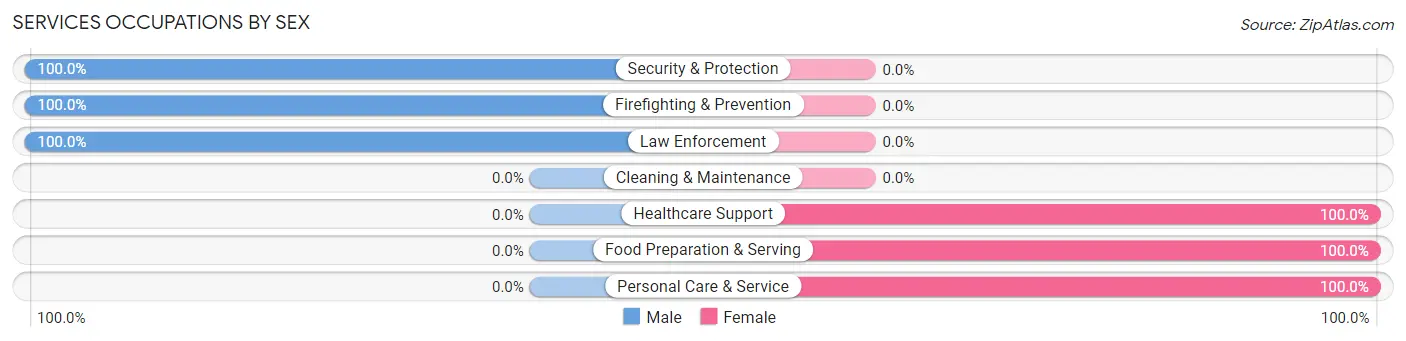
Services Occupations by Sex
Within the Services occupations in Clear Lake CDP Skagit County, the most male-oriented occupations are Security & Protection (100.0%), Firefighting & Prevention (100.0%), and Law Enforcement (100.0%), while the most female-oriented occupations are Healthcare Support (100.0%), Food Preparation & Serving (100.0%), and Personal Care & Service (100.0%).
| Occupation | Male | Female |
| Healthcare Support | 0 (0.0%) | 4 (100.0%) |
| Security & Protection | 31 (100.0%) | 0 (0.0%) |
| Firefighting & Prevention | 18 (100.0%) | 0 (0.0%) |
| Law Enforcement | 13 (100.0%) | 0 (0.0%) |
| Food Preparation & Serving | 0 (0.0%) | 32 (100.0%) |
| Cleaning & Maintenance | 0 (0.0%) | 0 (0.0%) |
| Personal Care & Service | 0 (0.0%) | 5 (100.0%) |
| Total (Category) | 31 (43.1%) | 41 (56.9%) |
| Total (Overall) | 169 (37.1%) | 287 (62.9%) |
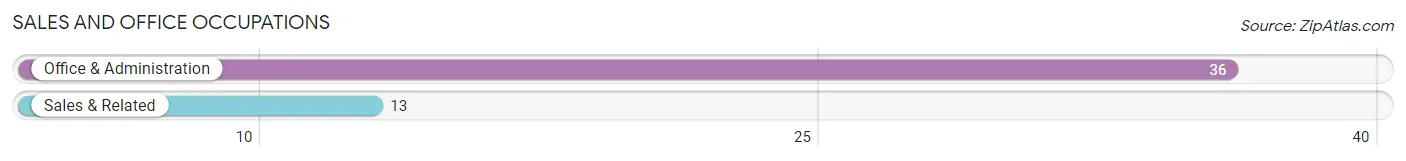
Sales and Office Occupations
The most common Sales and Office occupations in Clear Lake CDP Skagit County are Office & Administration (36 | 7.9%), and Sales & Related (13 | 2.9%).
Sales and Office Occupations by Sex
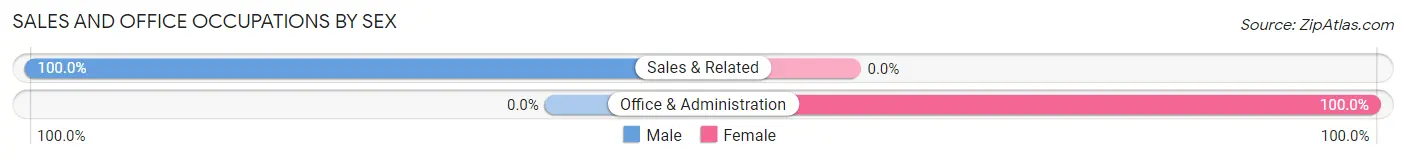
| Occupation | Male | Female |
| Sales & Related | 13 (100.0%) | 0 (0.0%) |
| Office & Administration | 0 (0.0%) | 36 (100.0%) |
| Total (Category) | 13 (26.5%) | 36 (73.5%) |
| Total (Overall) | 169 (37.1%) | 287 (62.9%) |
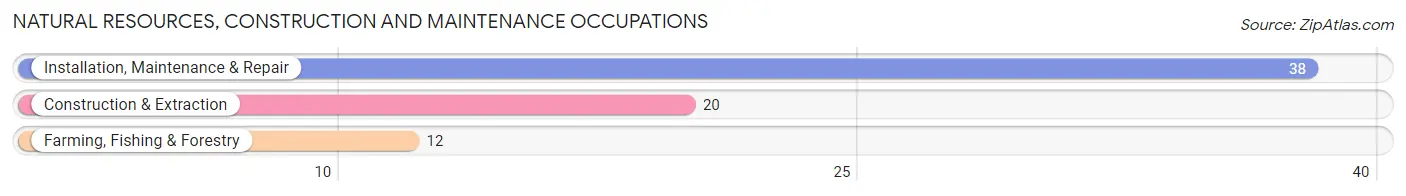
Natural Resources, Construction and Maintenance Occupations
The most common Natural Resources, Construction and Maintenance occupations in Clear Lake CDP Skagit County are Installation, Maintenance & Repair (38 | 8.3%), Construction & Extraction (20 | 4.4%), and Farming, Fishing & Forestry (12 | 2.6%).
Natural Resources, Construction and Maintenance Occupations by Sex
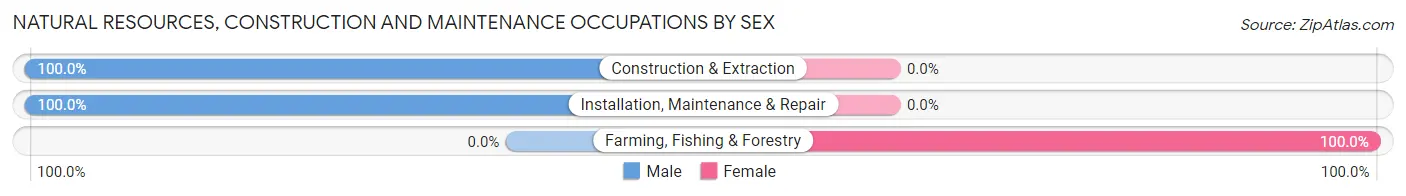
| Occupation | Male | Female |
| Farming, Fishing & Forestry | 0 (0.0%) | 12 (100.0%) |
| Construction & Extraction | 20 (100.0%) | 0 (0.0%) |
| Installation, Maintenance & Repair | 38 (100.0%) | 0 (0.0%) |
| Total (Category) | 58 (82.9%) | 12 (17.1%) |
| Total (Overall) | 169 (37.1%) | 287 (62.9%) |
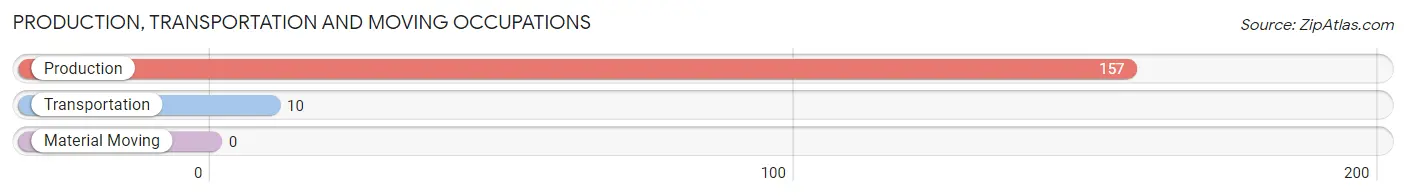
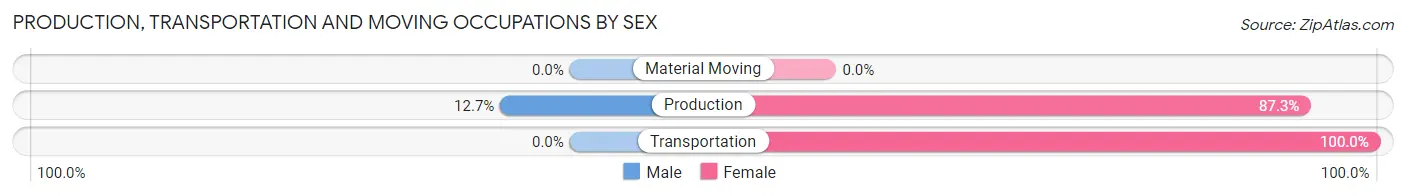
Production, Transportation and Moving Occupations
The most common Production, Transportation and Moving occupations in Clear Lake CDP Skagit County are Production (157 | 34.4%), and Transportation (10 | 2.2%).
Production, Transportation and Moving Occupations by Sex
| Occupation | Male | Female |
| Production | 20 (12.7%) | 137 (87.3%) |
| Transportation | 0 (0.0%) | 10 (100.0%) |
| Material Moving | 0 (0.0%) | 0 (0.0%) |
| Total (Category) | 20 (12.0%) | 147 (88.0%) |
| Total (Overall) | 169 (37.1%) | 287 (62.9%) |
Employment Industries by Sex in Clear Lake CDP Skagit County
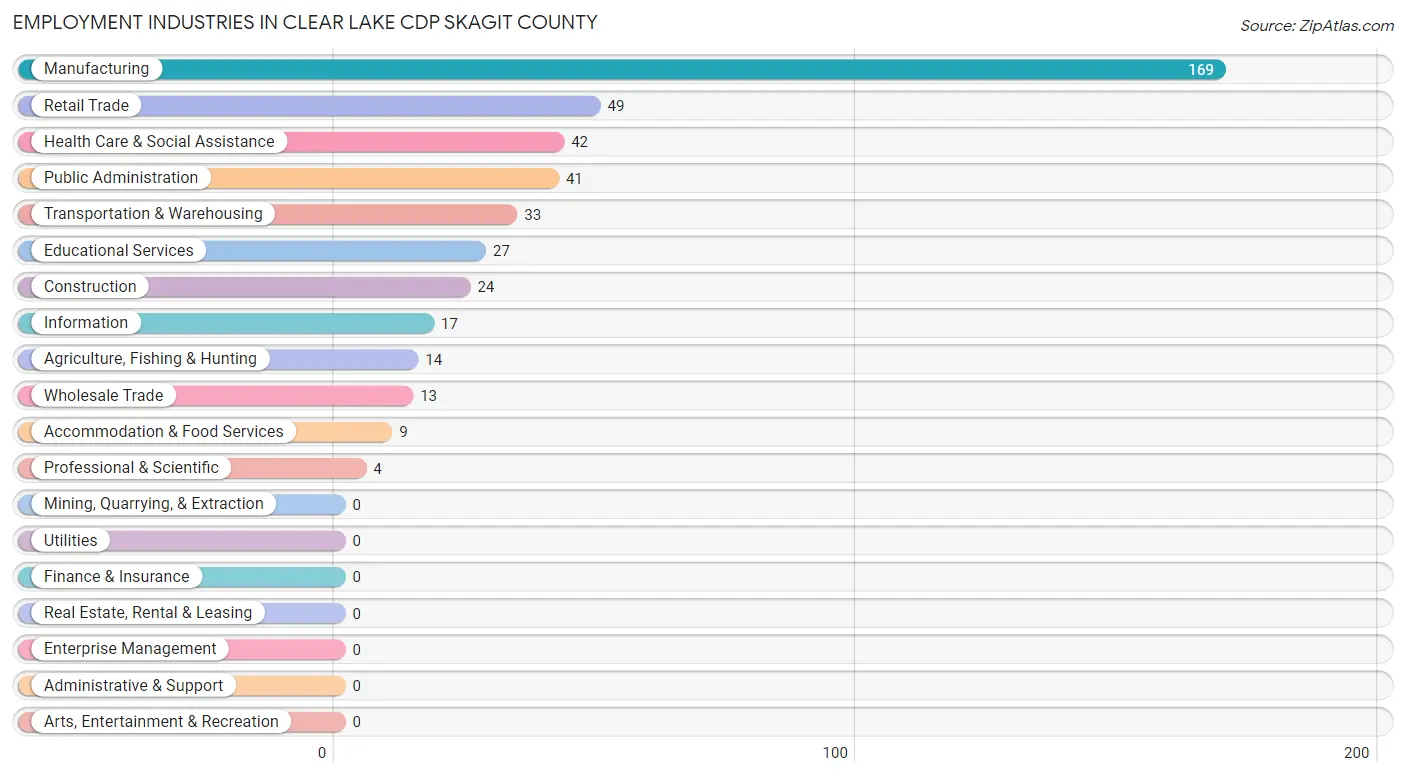
Employment Industries in Clear Lake CDP Skagit County
The major employment industries in Clear Lake CDP Skagit County include Manufacturing (169 | 37.1%), Retail Trade (49 | 10.7%), Health Care & Social Assistance (42 | 9.2%), Public Administration (41 | 9.0%), and Transportation & Warehousing (33 | 7.2%).
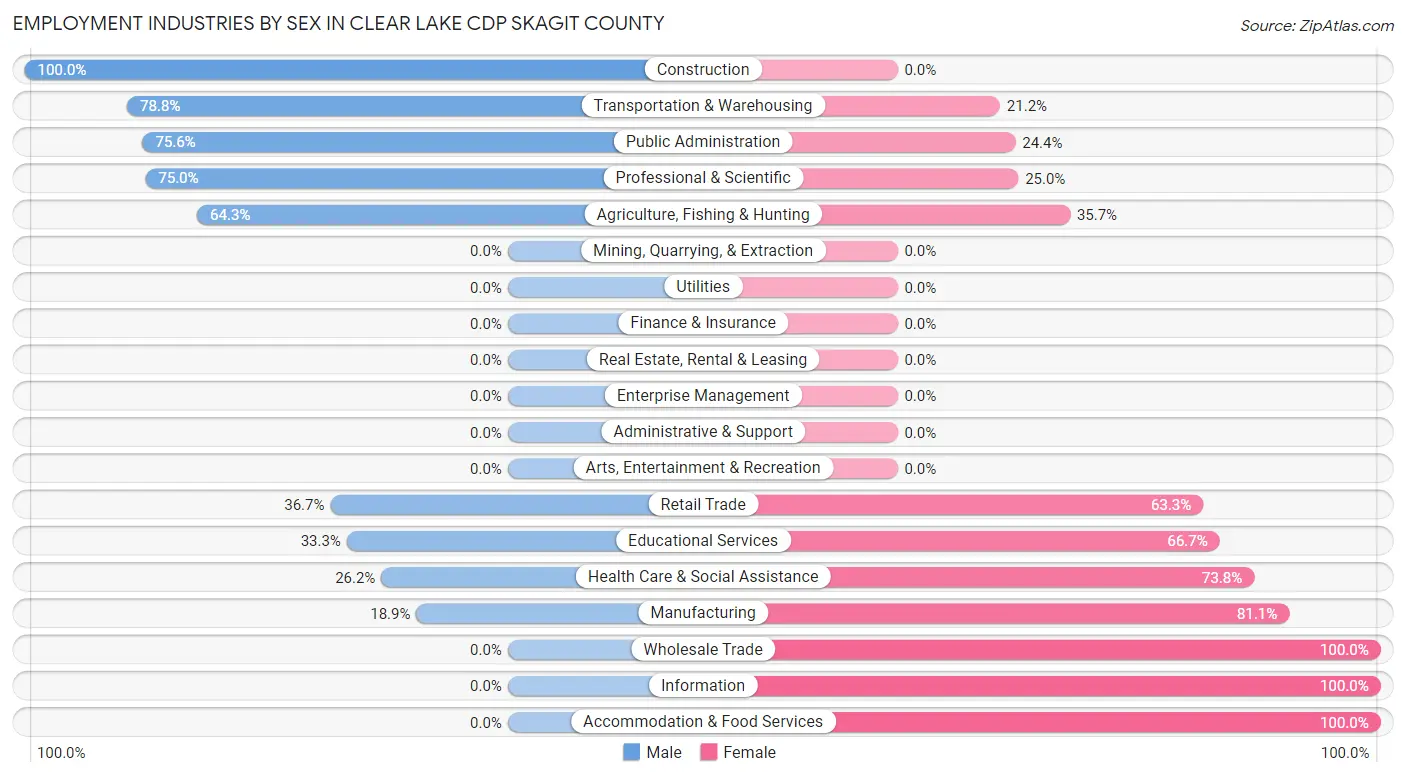
Employment Industries by Sex in Clear Lake CDP Skagit County
The Clear Lake CDP Skagit County industries that see more men than women are Construction (100.0%), Transportation & Warehousing (78.8%), and Public Administration (75.6%), whereas the industries that tend to have a higher number of women are Wholesale Trade (100.0%), Information (100.0%), and Accommodation & Food Services (100.0%).
| Industry | Male | Female |
| Agriculture, Fishing & Hunting | 9 (64.3%) | 5 (35.7%) |
| Mining, Quarrying, & Extraction | 0 (0.0%) | 0 (0.0%) |
| Construction | 24 (100.0%) | 0 (0.0%) |
| Manufacturing | 32 (18.9%) | 137 (81.1%) |
| Wholesale Trade | 0 (0.0%) | 13 (100.0%) |
| Retail Trade | 18 (36.7%) | 31 (63.3%) |
| Transportation & Warehousing | 26 (78.8%) | 7 (21.2%) |
| Utilities | 0 (0.0%) | 0 (0.0%) |
| Information | 0 (0.0%) | 17 (100.0%) |
| Finance & Insurance | 0 (0.0%) | 0 (0.0%) |
| Real Estate, Rental & Leasing | 0 (0.0%) | 0 (0.0%) |
| Professional & Scientific | 3 (75.0%) | 1 (25.0%) |
| Enterprise Management | 0 (0.0%) | 0 (0.0%) |
| Administrative & Support | 0 (0.0%) | 0 (0.0%) |
| Educational Services | 9 (33.3%) | 18 (66.7%) |
| Health Care & Social Assistance | 11 (26.2%) | 31 (73.8%) |
| Arts, Entertainment & Recreation | 0 (0.0%) | 0 (0.0%) |
| Accommodation & Food Services | 0 (0.0%) | 9 (100.0%) |
| Public Administration | 31 (75.6%) | 10 (24.4%) |
| Total | 169 (37.1%) | 287 (62.9%) |
Education in Clear Lake CDP Skagit County
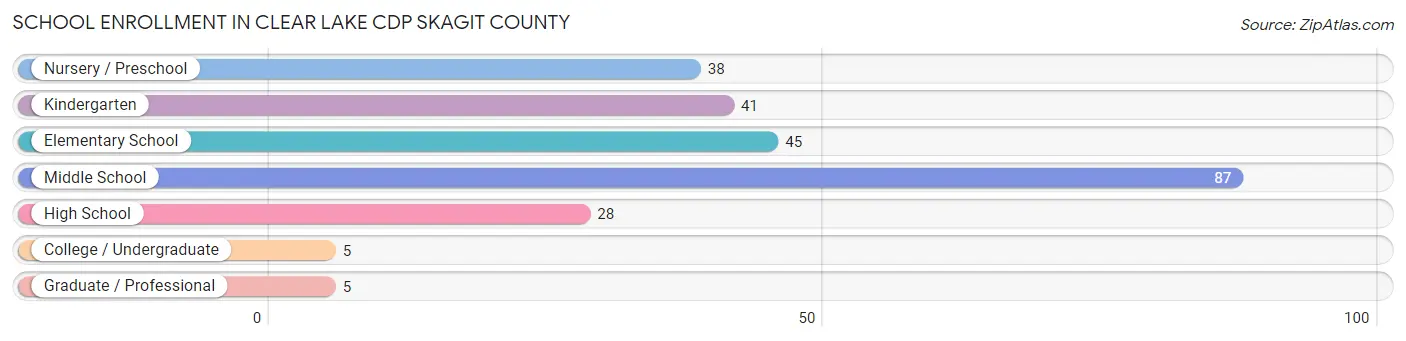
School Enrollment in Clear Lake CDP Skagit County
The most common levels of schooling among the 249 students in Clear Lake CDP Skagit County are middle school (87 | 34.9%), elementary school (45 | 18.1%), and kindergarten (41 | 16.5%).
| School Level | # Students | % Students |
| Nursery / Preschool | 38 | 15.3% |
| Kindergarten | 41 | 16.5% |
| Elementary School | 45 | 18.1% |
| Middle School | 87 | 34.9% |
| High School | 28 | 11.2% |
| College / Undergraduate | 5 | 2.0% |
| Graduate / Professional | 5 | 2.0% |
| Total | 249 | 100.0% |
School Enrollment by Age by Funding Source in Clear Lake CDP Skagit County
Out of a total of 249 students who are enrolled in schools in Clear Lake CDP Skagit County, 21 (8.4%) attend a private institution, while the remaining 228 (91.6%) are enrolled in public schools. The age group of 5 to 9 year old has the highest likelihood of being enrolled in private schools, with 16 (18.6% in the age bracket) enrolled. Conversely, the age group of 10 to 14 year olds has the lowest likelihood of being enrolled in a private school, with 99 (100.0% in the age bracket) attending a public institution.
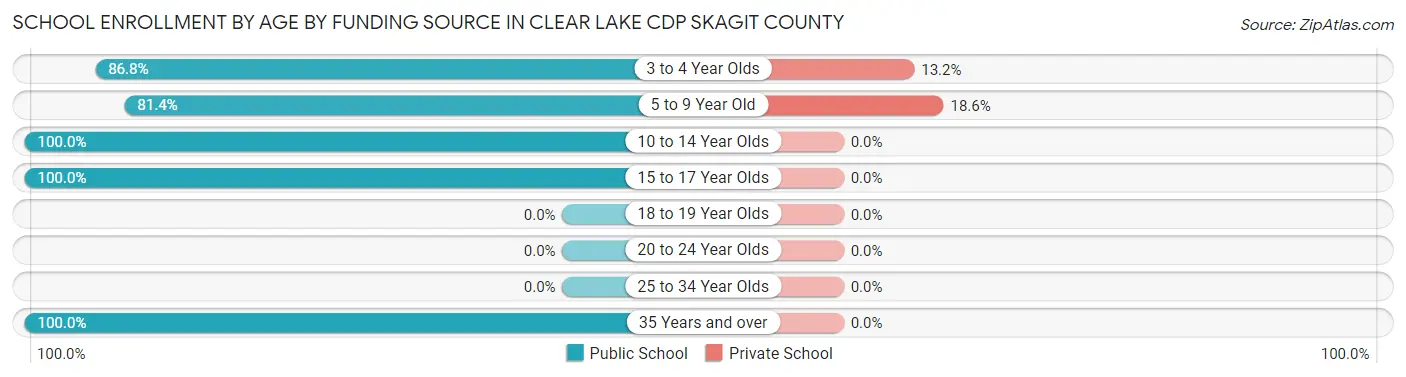
| Age Bracket | Public School | Private School |
| 3 to 4 Year Olds | 33 (86.8%) | 5 (13.2%) |
| 5 to 9 Year Old | 70 (81.4%) | 16 (18.6%) |
| 10 to 14 Year Olds | 99 (100.0%) | 0 (0.0%) |
| 15 to 17 Year Olds | 16 (100.0%) | 0 (0.0%) |
| 18 to 19 Year Olds | 0 (0.0%) | 0 (0.0%) |
| 20 to 24 Year Olds | 0 (0.0%) | 0 (0.0%) |
| 25 to 34 Year Olds | 0 (0.0%) | 0 (0.0%) |
| 35 Years and over | 10 (100.0%) | 0 (0.0%) |
| Total | 228 (91.6%) | 21 (8.4%) |
Educational Attainment by Field of Study in Clear Lake CDP Skagit County
Business (27 | 18.9%), education (24 | 16.8%), computers & mathematics (23 | 16.1%), science & technology (15 | 10.5%), and visual & performing arts (14 | 9.8%) are the most common fields of study among 143 individuals in Clear Lake CDP Skagit County who have obtained a bachelor's degree or higher.
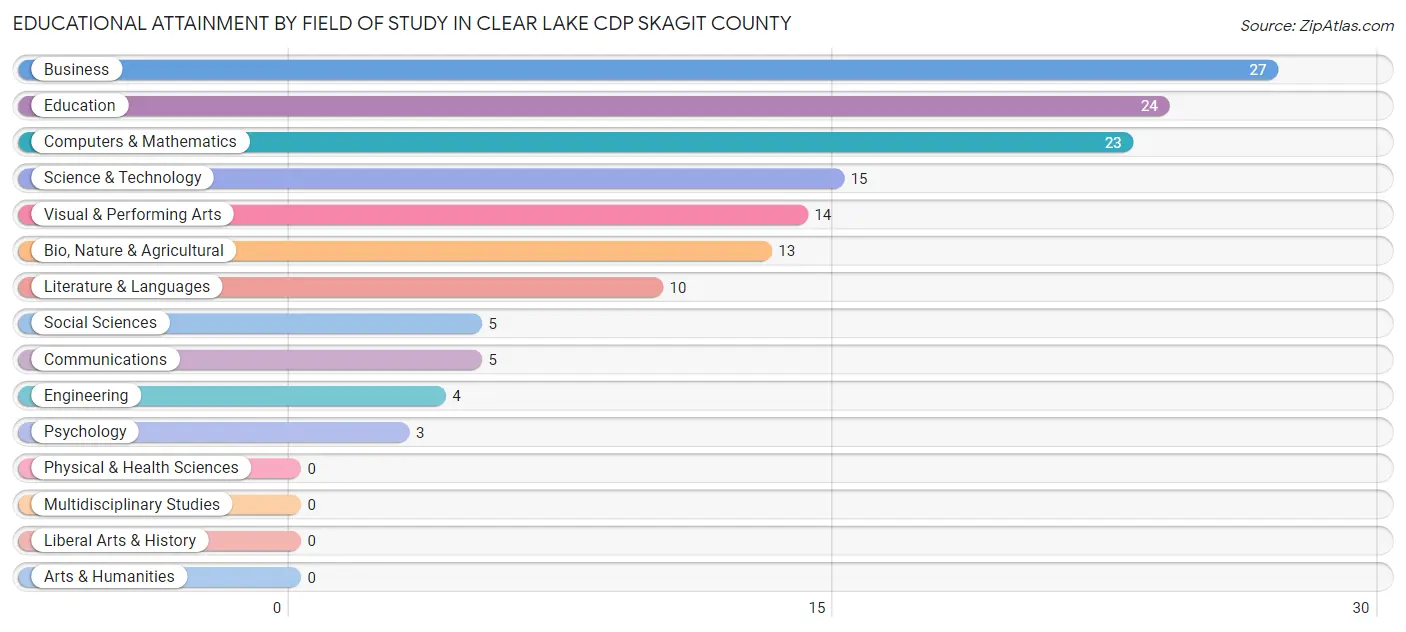
| Field of Study | # Graduates | % Graduates |
| Computers & Mathematics | 23 | 16.1% |
| Bio, Nature & Agricultural | 13 | 9.1% |
| Physical & Health Sciences | 0 | 0.0% |
| Psychology | 3 | 2.1% |
| Social Sciences | 5 | 3.5% |
| Engineering | 4 | 2.8% |
| Multidisciplinary Studies | 0 | 0.0% |
| Science & Technology | 15 | 10.5% |
| Business | 27 | 18.9% |
| Education | 24 | 16.8% |
| Literature & Languages | 10 | 7.0% |
| Liberal Arts & History | 0 | 0.0% |
| Visual & Performing Arts | 14 | 9.8% |
| Communications | 5 | 3.5% |
| Arts & Humanities | 0 | 0.0% |
| Total | 143 | 100.0% |
Transportation & Commute in Clear Lake CDP Skagit County
Vehicle Availability by Sex in Clear Lake CDP Skagit County
The most prevalent vehicle ownership categories in Clear Lake CDP Skagit County are males with 4 vehicles (39, accounting for 25.8%) and females with 4 vehicles (27, making up 13.9%).
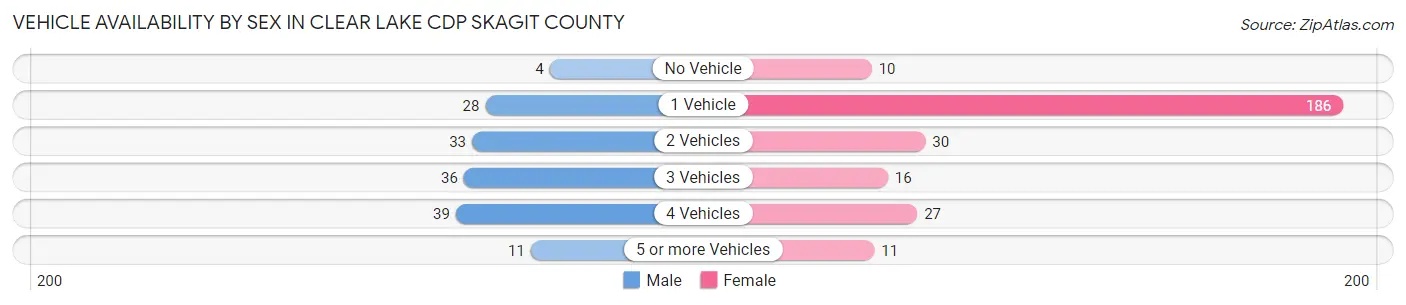
| Vehicles Available | Male | Female |
| No Vehicle | 4 (2.6%) | 10 (3.6%) |
| 1 Vehicle | 28 (18.5%) | 186 (66.4%) |
| 2 Vehicles | 33 (21.8%) | 30 (10.7%) |
| 3 Vehicles | 36 (23.8%) | 16 (5.7%) |
| 4 Vehicles | 39 (25.8%) | 27 (9.6%) |
| 5 or more Vehicles | 11 (7.3%) | 11 (3.9%) |
| Total | 151 (100.0%) | 280 (100.0%) |
Commute Time in Clear Lake CDP Skagit County
The most frequently occuring commute durations in Clear Lake CDP Skagit County are 40 to 44 minutes (152 commuters, 35.8%), 20 to 24 minutes (58 commuters, 13.7%), and 15 to 19 minutes (57 commuters, 13.4%).
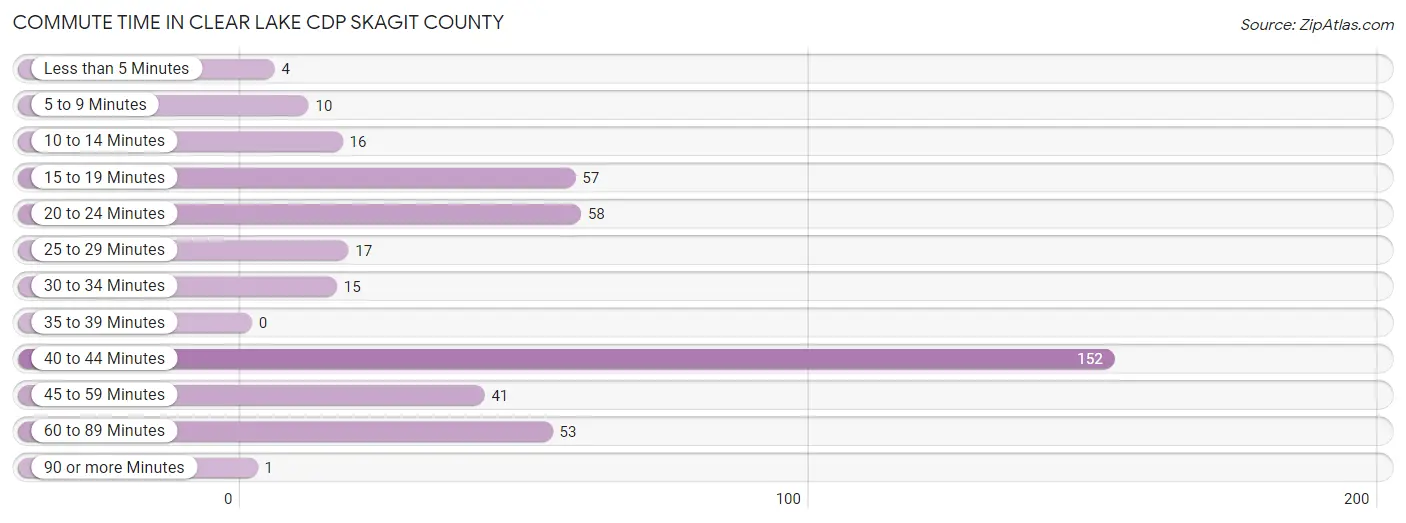
| Commute Time | # Commuters | % Commuters |
| Less than 5 Minutes | 4 | 0.9% |
| 5 to 9 Minutes | 10 | 2.4% |
| 10 to 14 Minutes | 16 | 3.8% |
| 15 to 19 Minutes | 57 | 13.4% |
| 20 to 24 Minutes | 58 | 13.7% |
| 25 to 29 Minutes | 17 | 4.0% |
| 30 to 34 Minutes | 15 | 3.5% |
| 35 to 39 Minutes | 0 | 0.0% |
| 40 to 44 Minutes | 152 | 35.8% |
| 45 to 59 Minutes | 41 | 9.7% |
| 60 to 89 Minutes | 53 | 12.5% |
| 90 or more Minutes | 1 | 0.2% |
Commute Time by Sex in Clear Lake CDP Skagit County
The most common commute times in Clear Lake CDP Skagit County are 45 to 59 minutes (41 commuters, 27.2%) for males and 40 to 44 minutes (152 commuters, 55.7%) for females.
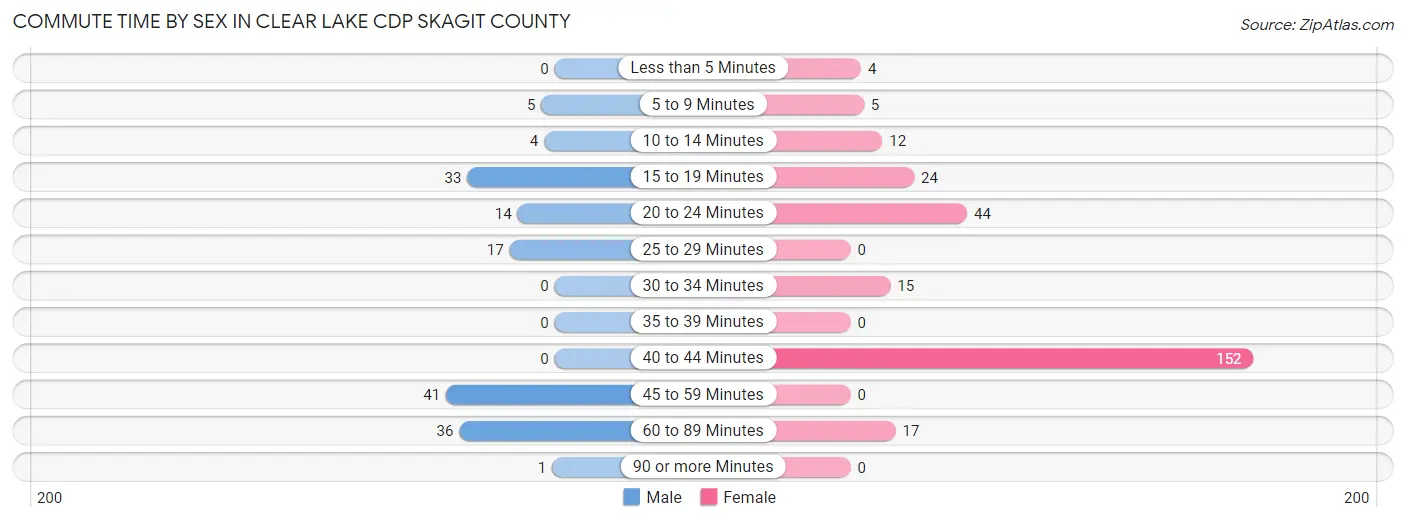
| Commute Time | Male | Female |
| Less than 5 Minutes | 0 (0.0%) | 4 (1.5%) |
| 5 to 9 Minutes | 5 (3.3%) | 5 (1.8%) |
| 10 to 14 Minutes | 4 (2.6%) | 12 (4.4%) |
| 15 to 19 Minutes | 33 (21.8%) | 24 (8.8%) |
| 20 to 24 Minutes | 14 (9.3%) | 44 (16.1%) |
| 25 to 29 Minutes | 17 (11.3%) | 0 (0.0%) |
| 30 to 34 Minutes | 0 (0.0%) | 15 (5.5%) |
| 35 to 39 Minutes | 0 (0.0%) | 0 (0.0%) |
| 40 to 44 Minutes | 0 (0.0%) | 152 (55.7%) |
| 45 to 59 Minutes | 41 (27.2%) | 0 (0.0%) |
| 60 to 89 Minutes | 36 (23.8%) | 17 (6.2%) |
| 90 or more Minutes | 1 (0.7%) | 0 (0.0%) |
Time of Departure to Work by Sex in Clear Lake CDP Skagit County
The most frequent times of departure to work in Clear Lake CDP Skagit County are 6:30 AM to 6:59 AM (31, 20.5%) for males and 5:00 AM to 5:29 AM (137, 50.2%) for females.
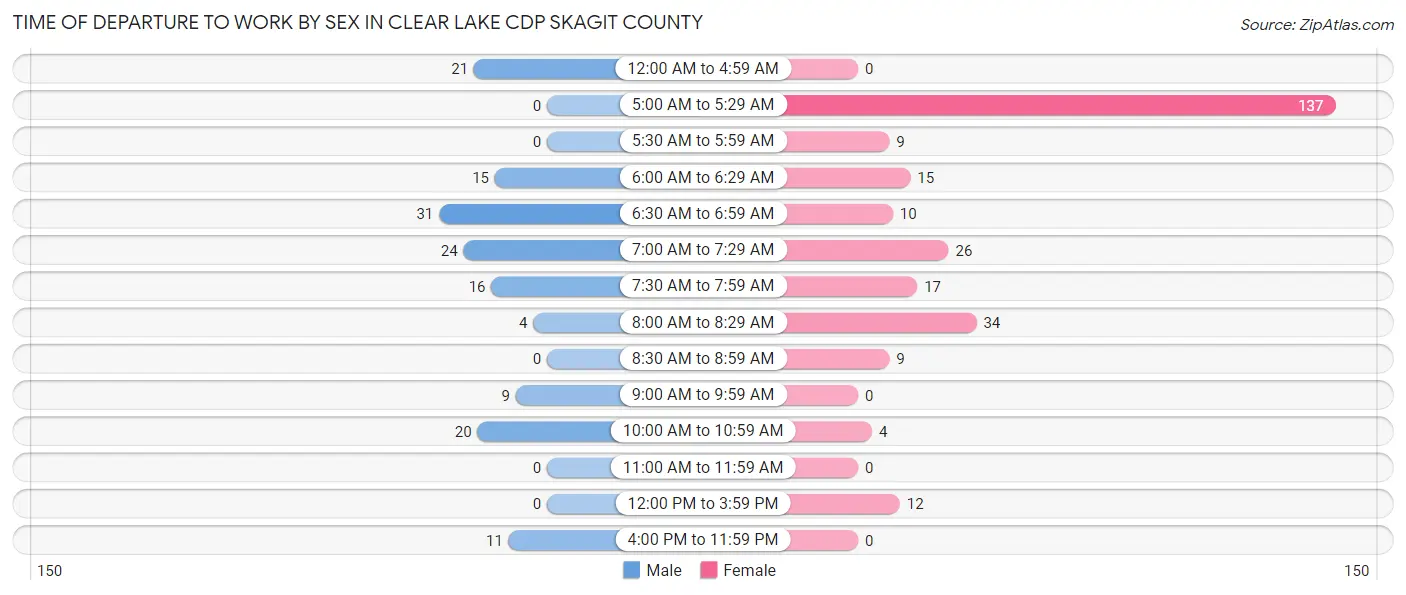
| Time of Departure | Male | Female |
| 12:00 AM to 4:59 AM | 21 (13.9%) | 0 (0.0%) |
| 5:00 AM to 5:29 AM | 0 (0.0%) | 137 (50.2%) |
| 5:30 AM to 5:59 AM | 0 (0.0%) | 9 (3.3%) |
| 6:00 AM to 6:29 AM | 15 (9.9%) | 15 (5.5%) |
| 6:30 AM to 6:59 AM | 31 (20.5%) | 10 (3.7%) |
| 7:00 AM to 7:29 AM | 24 (15.9%) | 26 (9.5%) |
| 7:30 AM to 7:59 AM | 16 (10.6%) | 17 (6.2%) |
| 8:00 AM to 8:29 AM | 4 (2.6%) | 34 (12.4%) |
| 8:30 AM to 8:59 AM | 0 (0.0%) | 9 (3.3%) |
| 9:00 AM to 9:59 AM | 9 (6.0%) | 0 (0.0%) |
| 10:00 AM to 10:59 AM | 20 (13.3%) | 4 (1.5%) |
| 11:00 AM to 11:59 AM | 0 (0.0%) | 0 (0.0%) |
| 12:00 PM to 3:59 PM | 0 (0.0%) | 12 (4.4%) |
| 4:00 PM to 11:59 PM | 11 (7.3%) | 0 (0.0%) |
| Total | 151 (100.0%) | 273 (100.0%) |
Housing Occupancy in Clear Lake CDP Skagit County
Occupancy by Ownership in Clear Lake CDP Skagit County
Of the total 405 dwellings in Clear Lake CDP Skagit County, owner-occupied units account for 311 (76.8%), while renter-occupied units make up 94 (23.2%).
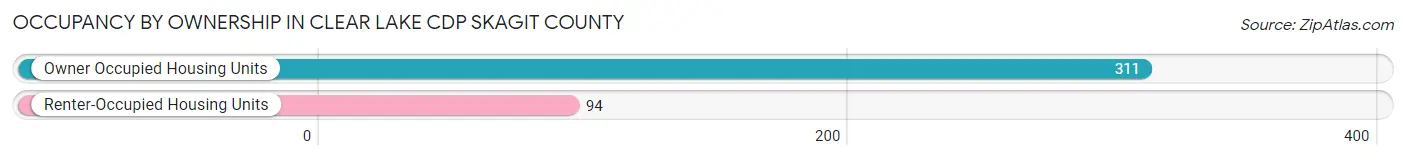
| Occupancy | # Housing Units | % Housing Units |
| Owner Occupied Housing Units | 311 | 76.8% |
| Renter-Occupied Housing Units | 94 | 23.2% |
| Total Occupied Housing Units | 405 | 100.0% |
Occupancy by Household Size in Clear Lake CDP Skagit County
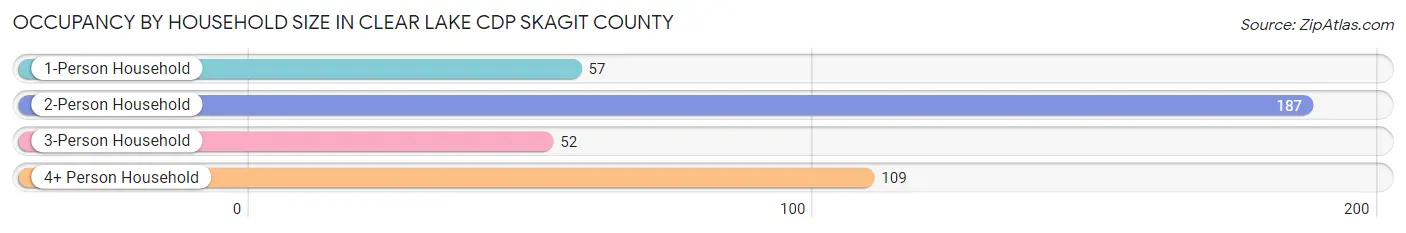
| Household Size | # Housing Units | % Housing Units |
| 1-Person Household | 57 | 14.1% |
| 2-Person Household | 187 | 46.2% |
| 3-Person Household | 52 | 12.8% |
| 4+ Person Household | 109 | 26.9% |
| Total Housing Units | 405 | 100.0% |
Occupancy by Ownership by Household Size in Clear Lake CDP Skagit County
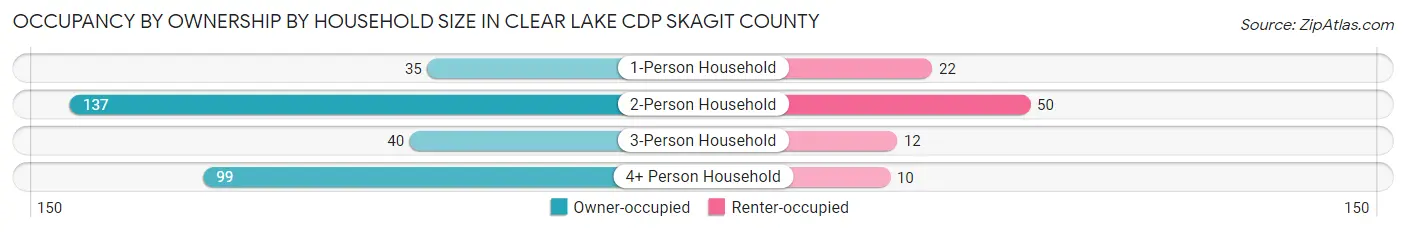
| Household Size | Owner-occupied | Renter-occupied |
| 1-Person Household | 35 (61.4%) | 22 (38.6%) |
| 2-Person Household | 137 (73.3%) | 50 (26.7%) |
| 3-Person Household | 40 (76.9%) | 12 (23.1%) |
| 4+ Person Household | 99 (90.8%) | 10 (9.2%) |
| Total Housing Units | 311 (76.8%) | 94 (23.2%) |
Occupancy by Educational Attainment in Clear Lake CDP Skagit County
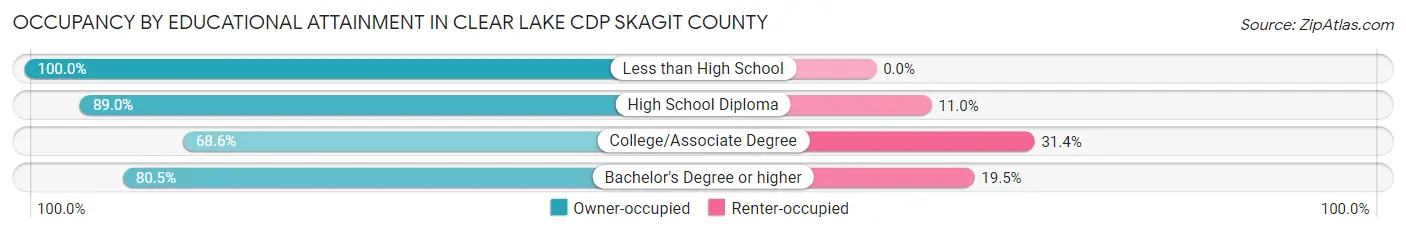
| Household Size | Owner-occupied | Renter-occupied |
| Less than High School | 23 (100.0%) | 0 (0.0%) |
| High School Diploma | 73 (89.0%) | 9 (11.0%) |
| College/Associate Degree | 153 (68.6%) | 70 (31.4%) |
| Bachelor's Degree or higher | 62 (80.5%) | 15 (19.5%) |
Occupancy by Age of Householder in Clear Lake CDP Skagit County
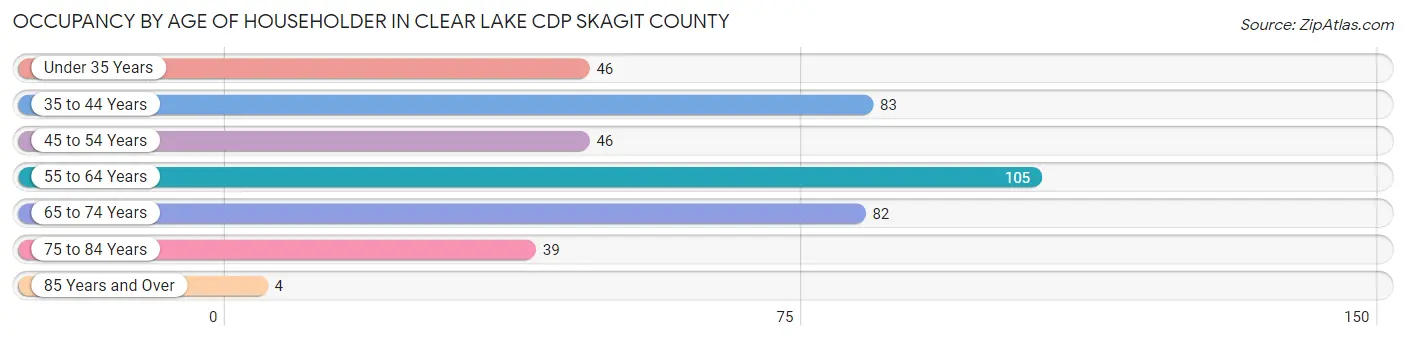
| Age Bracket | # Households | % Households |
| Under 35 Years | 46 | 11.4% |
| 35 to 44 Years | 83 | 20.5% |
| 45 to 54 Years | 46 | 11.4% |
| 55 to 64 Years | 105 | 25.9% |
| 65 to 74 Years | 82 | 20.3% |
| 75 to 84 Years | 39 | 9.6% |
| 85 Years and Over | 4 | 1.0% |
| Total | 405 | 100.0% |
Housing Finances in Clear Lake CDP Skagit County
Median Income by Occupancy in Clear Lake CDP Skagit County
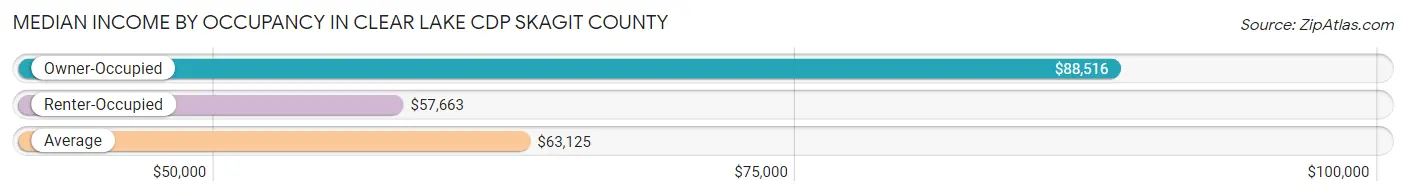
| Occupancy Type | # Households | Median Income |
| Owner-Occupied | 311 (76.8%) | $88,516 |
| Renter-Occupied | 94 (23.2%) | $57,663 |
| Average | 405 (100.0%) | $63,125 |
Occupancy by Householder Income Bracket in Clear Lake CDP Skagit County
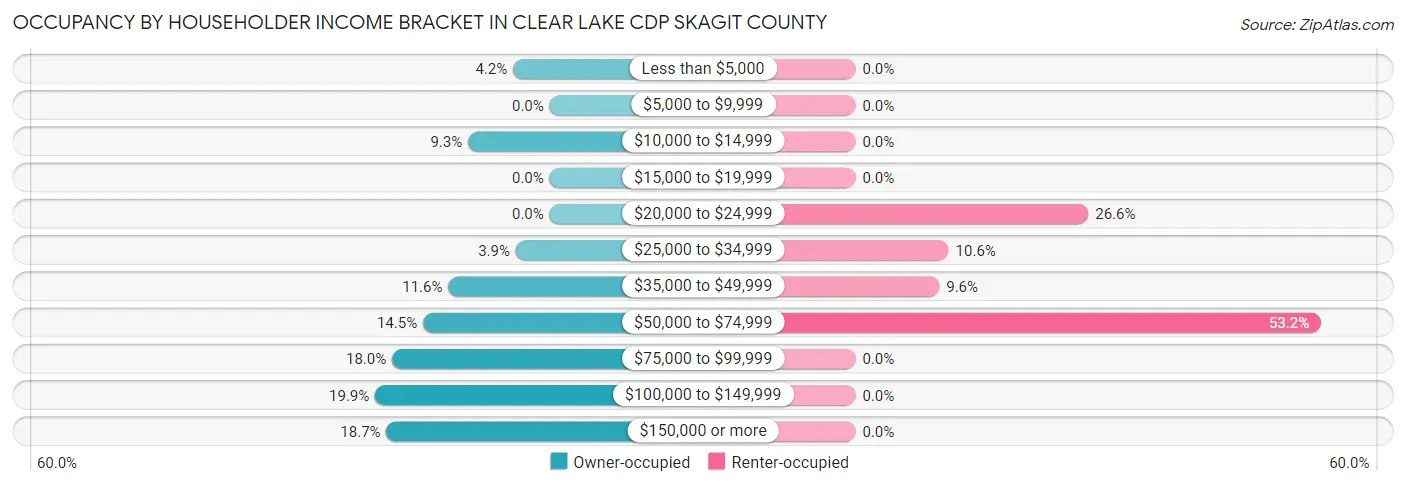
| Income Bracket | Owner-occupied | Renter-occupied |
| Less than $5,000 | 13 (4.2%) | 0 (0.0%) |
| $5,000 to $9,999 | 0 (0.0%) | 0 (0.0%) |
| $10,000 to $14,999 | 29 (9.3%) | 0 (0.0%) |
| $15,000 to $19,999 | 0 (0.0%) | 0 (0.0%) |
| $20,000 to $24,999 | 0 (0.0%) | 25 (26.6%) |
| $25,000 to $34,999 | 12 (3.9%) | 10 (10.6%) |
| $35,000 to $49,999 | 36 (11.6%) | 9 (9.6%) |
| $50,000 to $74,999 | 45 (14.5%) | 50 (53.2%) |
| $75,000 to $99,999 | 56 (18.0%) | 0 (0.0%) |
| $100,000 to $149,999 | 62 (19.9%) | 0 (0.0%) |
| $150,000 or more | 58 (18.6%) | 0 (0.0%) |
| Total | 311 (100.0%) | 94 (100.0%) |
Monthly Housing Cost Tiers in Clear Lake CDP Skagit County
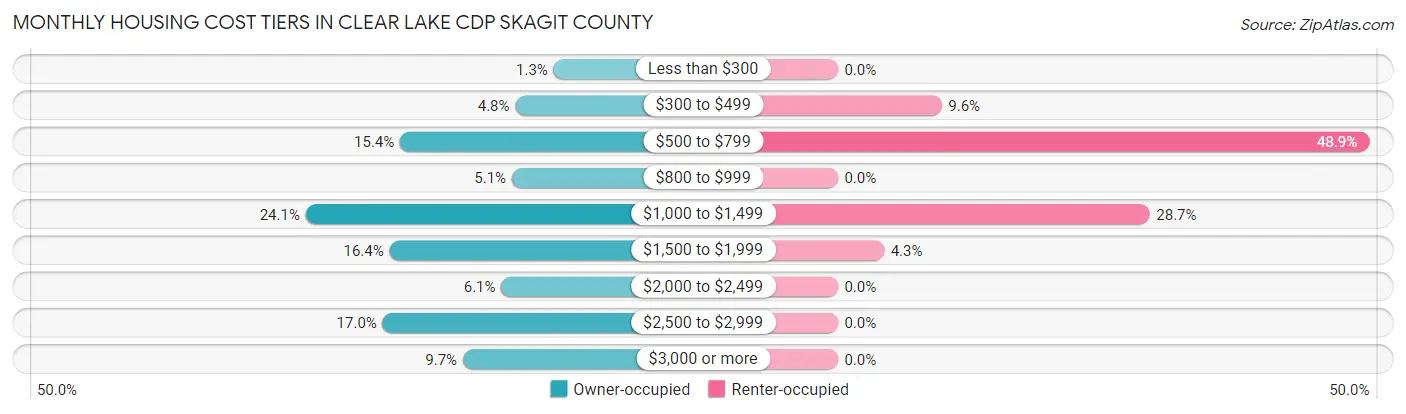
| Monthly Cost | Owner-occupied | Renter-occupied |
| Less than $300 | 4 (1.3%) | 0 (0.0%) |
| $300 to $499 | 15 (4.8%) | 9 (9.6%) |
| $500 to $799 | 48 (15.4%) | 46 (48.9%) |
| $800 to $999 | 16 (5.1%) | 0 (0.0%) |
| $1,000 to $1,499 | 75 (24.1%) | 27 (28.7%) |
| $1,500 to $1,999 | 51 (16.4%) | 4 (4.3%) |
| $2,000 to $2,499 | 19 (6.1%) | 0 (0.0%) |
| $2,500 to $2,999 | 53 (17.0%) | 0 (0.0%) |
| $3,000 or more | 30 (9.7%) | 0 (0.0%) |
| Total | 311 (100.0%) | 94 (100.0%) |
Physical Housing Characteristics in Clear Lake CDP Skagit County
Housing Structures in Clear Lake CDP Skagit County
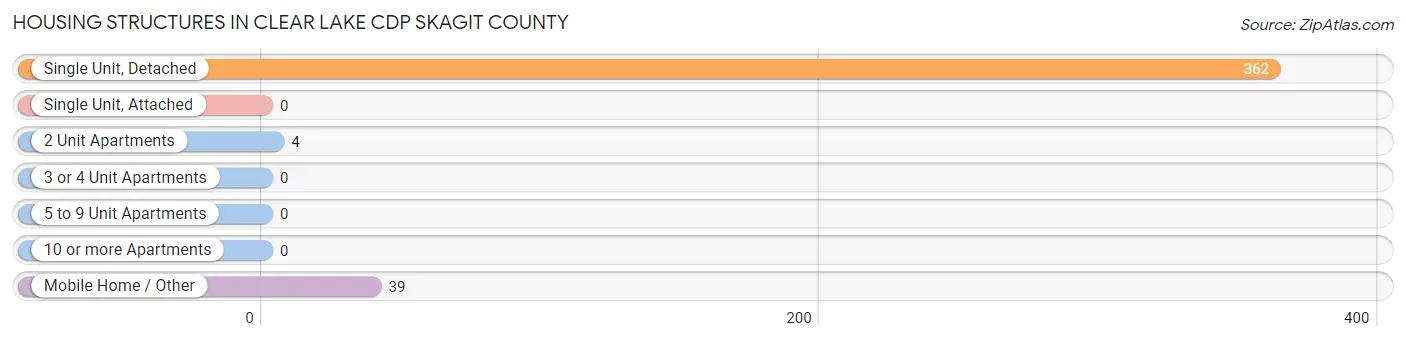
| Structure Type | # Housing Units | % Housing Units |
| Single Unit, Detached | 362 | 89.4% |
| Single Unit, Attached | 0 | 0.0% |
| 2 Unit Apartments | 4 | 1.0% |
| 3 or 4 Unit Apartments | 0 | 0.0% |
| 5 to 9 Unit Apartments | 0 | 0.0% |
| 10 or more Apartments | 0 | 0.0% |
| Mobile Home / Other | 39 | 9.6% |
| Total | 405 | 100.0% |
Housing Structures by Occupancy in Clear Lake CDP Skagit County
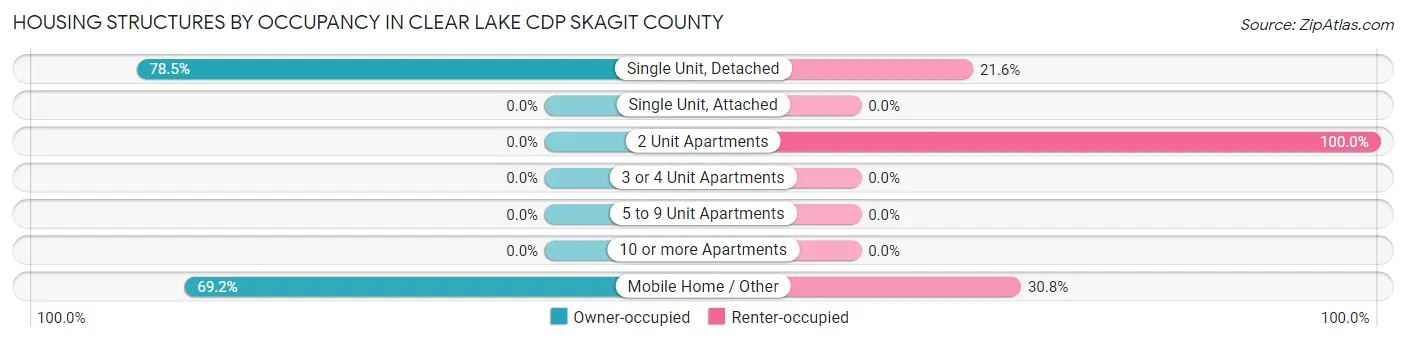
| Structure Type | Owner-occupied | Renter-occupied |
| Single Unit, Detached | 284 (78.4%) | 78 (21.5%) |
| Single Unit, Attached | 0 (0.0%) | 0 (0.0%) |
| 2 Unit Apartments | 0 (0.0%) | 4 (100.0%) |
| 3 or 4 Unit Apartments | 0 (0.0%) | 0 (0.0%) |
| 5 to 9 Unit Apartments | 0 (0.0%) | 0 (0.0%) |
| 10 or more Apartments | 0 (0.0%) | 0 (0.0%) |
| Mobile Home / Other | 27 (69.2%) | 12 (30.8%) |
| Total | 311 (76.8%) | 94 (23.2%) |
Housing Structures by Number of Rooms in Clear Lake CDP Skagit County
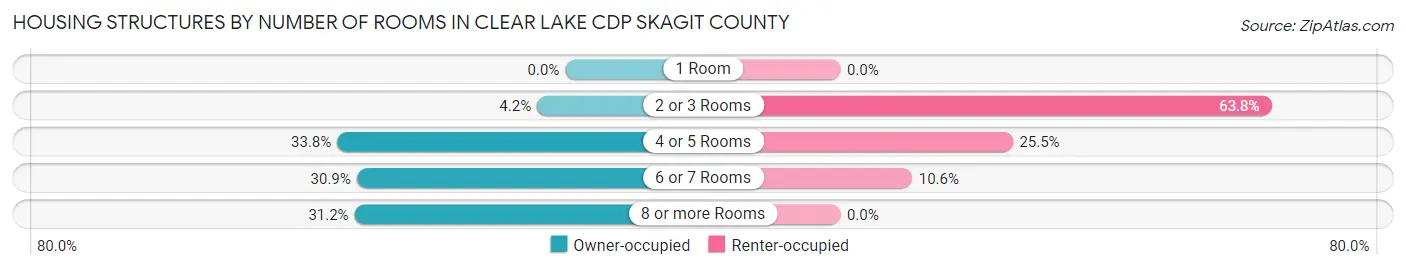
| Number of Rooms | Owner-occupied | Renter-occupied |
| 1 Room | 0 (0.0%) | 0 (0.0%) |
| 2 or 3 Rooms | 13 (4.2%) | 60 (63.8%) |
| 4 or 5 Rooms | 105 (33.8%) | 24 (25.5%) |
| 6 or 7 Rooms | 96 (30.9%) | 10 (10.6%) |
| 8 or more Rooms | 97 (31.2%) | 0 (0.0%) |
| Total | 311 (100.0%) | 94 (100.0%) |
Housing Structure by Heating Type in Clear Lake CDP Skagit County
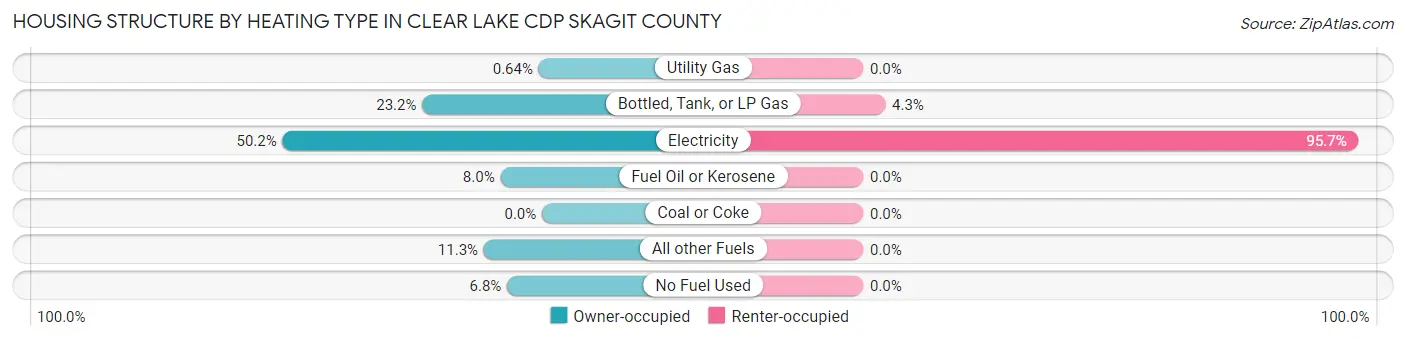
| Heating Type | Owner-occupied | Renter-occupied |
| Utility Gas | 2 (0.6%) | 0 (0.0%) |
| Bottled, Tank, or LP Gas | 72 (23.2%) | 4 (4.3%) |
| Electricity | 156 (50.2%) | 90 (95.7%) |
| Fuel Oil or Kerosene | 25 (8.0%) | 0 (0.0%) |
| Coal or Coke | 0 (0.0%) | 0 (0.0%) |
| All other Fuels | 35 (11.3%) | 0 (0.0%) |
| No Fuel Used | 21 (6.8%) | 0 (0.0%) |
| Total | 311 (100.0%) | 94 (100.0%) |
Household Vehicle Usage in Clear Lake CDP Skagit County
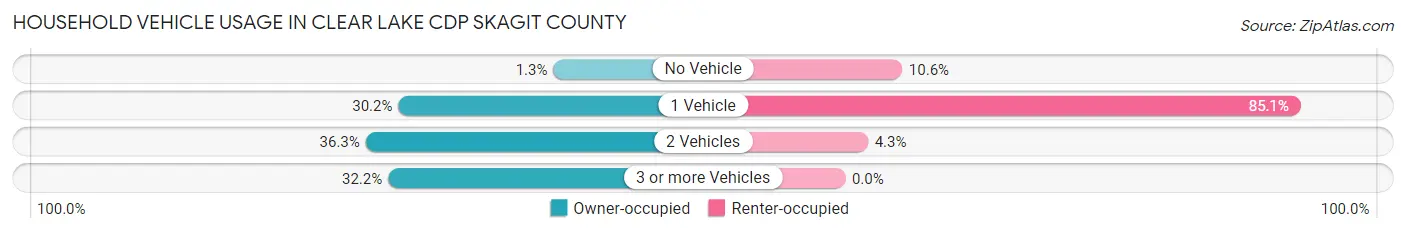
| Vehicles per Household | Owner-occupied | Renter-occupied |
| No Vehicle | 4 (1.3%) | 10 (10.6%) |
| 1 Vehicle | 94 (30.2%) | 80 (85.1%) |
| 2 Vehicles | 113 (36.3%) | 4 (4.3%) |
| 3 or more Vehicles | 100 (32.2%) | 0 (0.0%) |
| Total | 311 (100.0%) | 94 (100.0%) |
Real Estate & Mortgages in Clear Lake CDP Skagit County
Real Estate and Mortgage Overview in Clear Lake CDP Skagit County
| Characteristic | Without Mortgage | With Mortgage |
| Housing Units | 96 | 215 |
| Median Property Value | $583,300 | $456,000 |
| Median Household Income | $40,000 | $49 |
| Monthly Housing Costs | $747 | $30 |
| Real Estate Taxes | $4,467 | $0 |
Property Value by Mortgage Status in Clear Lake CDP Skagit County
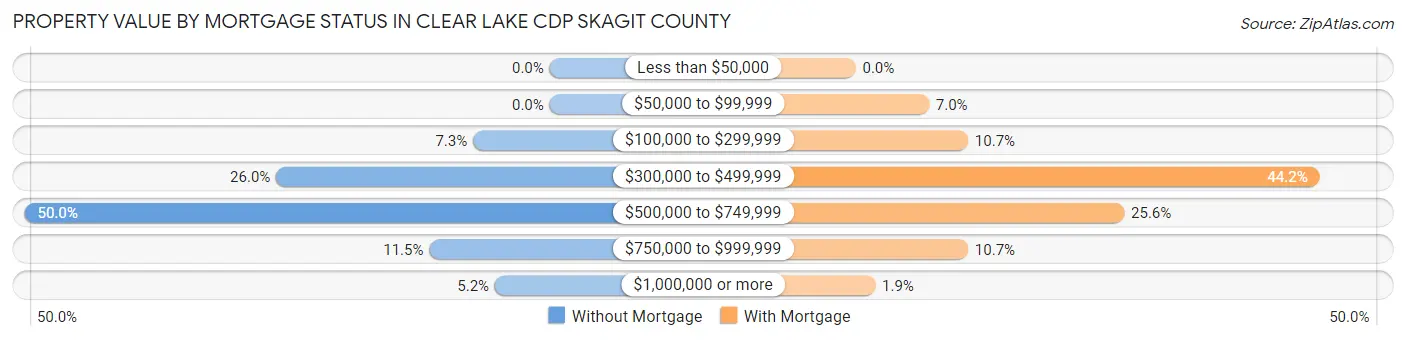
| Property Value | Without Mortgage | With Mortgage |
| Less than $50,000 | 0 (0.0%) | 0 (0.0%) |
| $50,000 to $99,999 | 0 (0.0%) | 15 (7.0%) |
| $100,000 to $299,999 | 7 (7.3%) | 23 (10.7%) |
| $300,000 to $499,999 | 25 (26.0%) | 95 (44.2%) |
| $500,000 to $749,999 | 48 (50.0%) | 55 (25.6%) |
| $750,000 to $999,999 | 11 (11.5%) | 23 (10.7%) |
| $1,000,000 or more | 5 (5.2%) | 4 (1.9%) |
| Total | 96 (100.0%) | 215 (100.0%) |
Household Income by Mortgage Status in Clear Lake CDP Skagit County
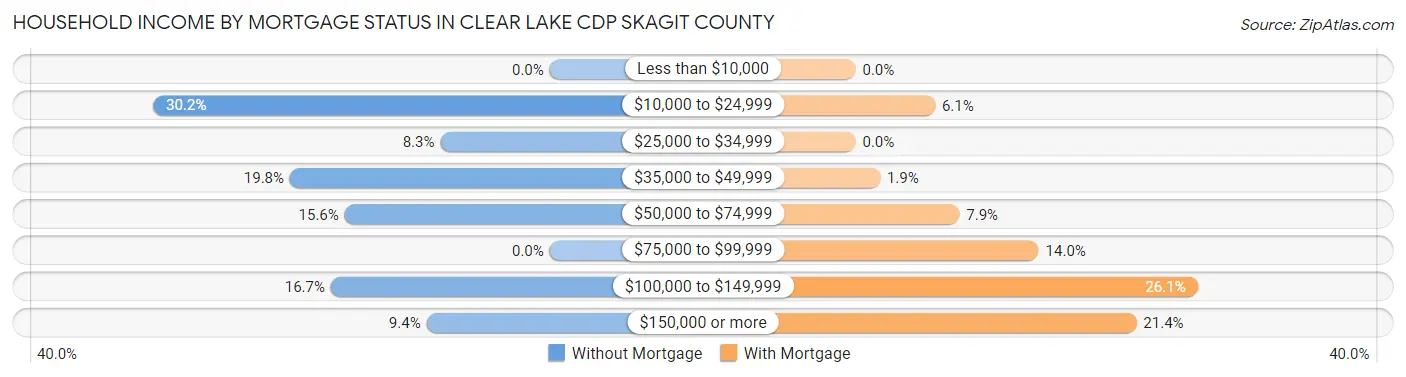
| Household Income | Without Mortgage | With Mortgage |
| Less than $10,000 | 0 (0.0%) | 0 (0.0%) |
| $10,000 to $24,999 | 29 (30.2%) | 13 (6.0%) |
| $25,000 to $34,999 | 8 (8.3%) | 0 (0.0%) |
| $35,000 to $49,999 | 19 (19.8%) | 4 (1.9%) |
| $50,000 to $74,999 | 15 (15.6%) | 17 (7.9%) |
| $75,000 to $99,999 | 0 (0.0%) | 30 (14.0%) |
| $100,000 to $149,999 | 16 (16.7%) | 56 (26.1%) |
| $150,000 or more | 9 (9.4%) | 46 (21.4%) |
| Total | 96 (100.0%) | 215 (100.0%) |
Property Value to Household Income Ratio in Clear Lake CDP Skagit County
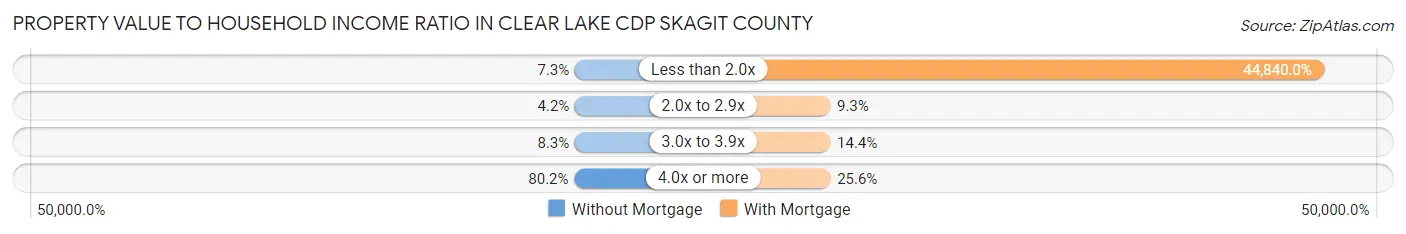
| Value-to-Income Ratio | Without Mortgage | With Mortgage |
| Less than 2.0x | 7 (7.3%) | 96,406 (44,840.0%) |
| 2.0x to 2.9x | 4 (4.2%) | 20 (9.3%) |
| 3.0x to 3.9x | 8 (8.3%) | 31 (14.4%) |
| 4.0x or more | 77 (80.2%) | 55 (25.6%) |
| Total | 96 (100.0%) | 215 (100.0%) |
Real Estate Taxes by Mortgage Status in Clear Lake CDP Skagit County
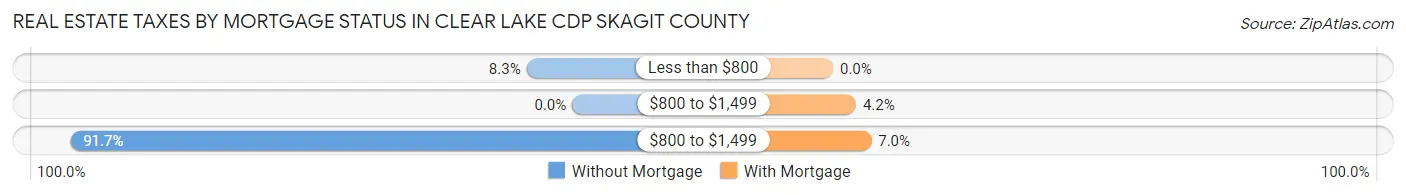
| Property Taxes | Without Mortgage | With Mortgage |
| Less than $800 | 8 (8.3%) | 0 (0.0%) |
| $800 to $1,499 | 0 (0.0%) | 9 (4.2%) |
| $800 to $1,499 | 88 (91.7%) | 15 (7.0%) |
| Total | 96 (100.0%) | 215 (100.0%) |
Health & Disability in Clear Lake CDP Skagit County
Health Insurance Coverage by Age in Clear Lake CDP Skagit County
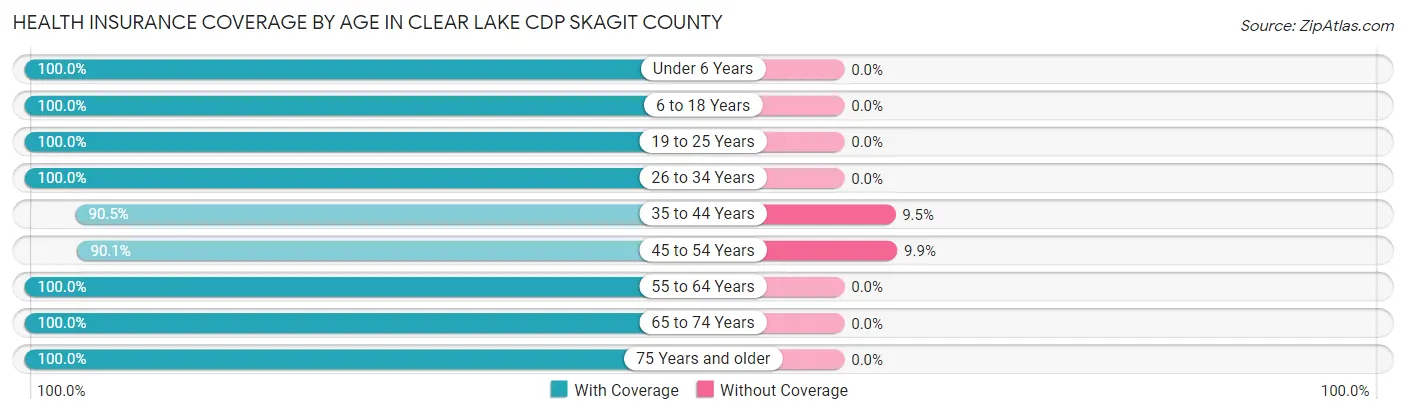
| Age Bracket | With Coverage | Without Coverage |
| Under 6 Years | 81 (100.0%) | 0 (0.0%) |
| 6 to 18 Years | 199 (100.0%) | 0 (0.0%) |
| 19 to 25 Years | 110 (100.0%) | 0 (0.0%) |
| 26 to 34 Years | 79 (100.0%) | 0 (0.0%) |
| 35 to 44 Years | 143 (90.5%) | 15 (9.5%) |
| 45 to 54 Years | 64 (90.1%) | 7 (9.9%) |
| 55 to 64 Years | 196 (100.0%) | 0 (0.0%) |
| 65 to 74 Years | 150 (100.0%) | 0 (0.0%) |
| 75 Years and older | 77 (100.0%) | 0 (0.0%) |
| Total | 1,099 (98.0%) | 22 (2.0%) |
Health Insurance Coverage by Citizenship Status in Clear Lake CDP Skagit County
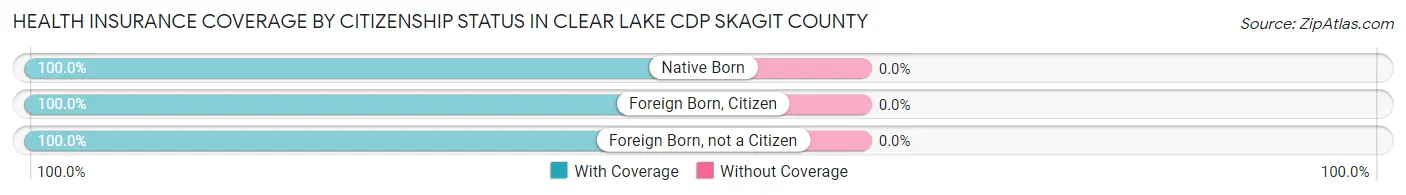
| Citizenship Status | With Coverage | Without Coverage |
| Native Born | 81 (100.0%) | 0 (0.0%) |
| Foreign Born, Citizen | 199 (100.0%) | 0 (0.0%) |
| Foreign Born, not a Citizen | 110 (100.0%) | 0 (0.0%) |
Health Insurance Coverage by Household Income in Clear Lake CDP Skagit County
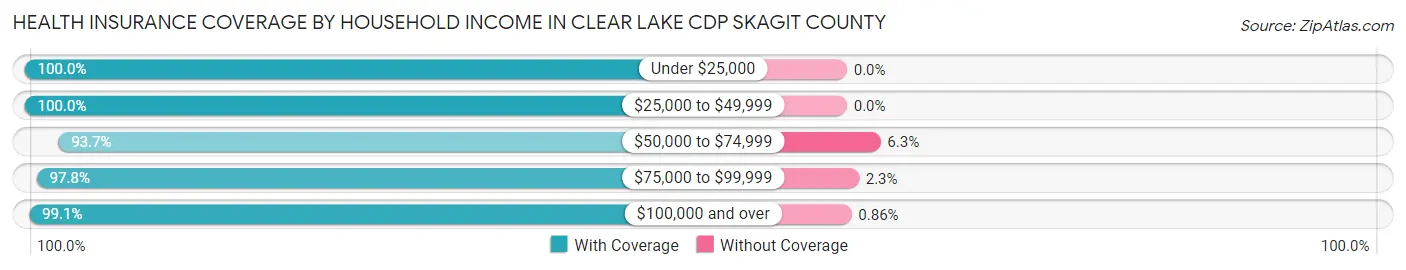
| Household Income | With Coverage | Without Coverage |
| Under $25,000 | 216 (100.0%) | 0 (0.0%) |
| $25,000 to $49,999 | 140 (100.0%) | 0 (0.0%) |
| $50,000 to $74,999 | 223 (93.7%) | 15 (6.3%) |
| $75,000 to $99,999 | 174 (97.8%) | 4 (2.2%) |
| $100,000 and over | 346 (99.1%) | 3 (0.9%) |
Public vs Private Health Insurance Coverage by Age in Clear Lake CDP Skagit County
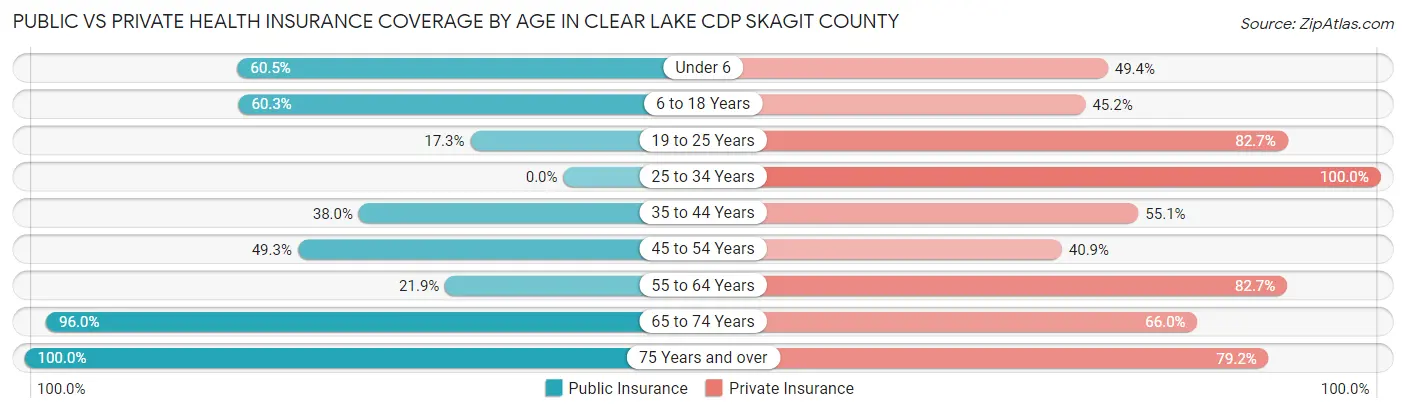
| Age Bracket | Public Insurance | Private Insurance |
| Under 6 | 49 (60.5%) | 40 (49.4%) |
| 6 to 18 Years | 120 (60.3%) | 90 (45.2%) |
| 19 to 25 Years | 19 (17.3%) | 91 (82.7%) |
| 25 to 34 Years | 0 (0.0%) | 79 (100.0%) |
| 35 to 44 Years | 60 (38.0%) | 87 (55.1%) |
| 45 to 54 Years | 35 (49.3%) | 29 (40.8%) |
| 55 to 64 Years | 43 (21.9%) | 162 (82.7%) |
| 65 to 74 Years | 144 (96.0%) | 99 (66.0%) |
| 75 Years and over | 77 (100.0%) | 61 (79.2%) |
| Total | 547 (48.8%) | 738 (65.8%) |
Disability Status by Sex by Age in Clear Lake CDP Skagit County
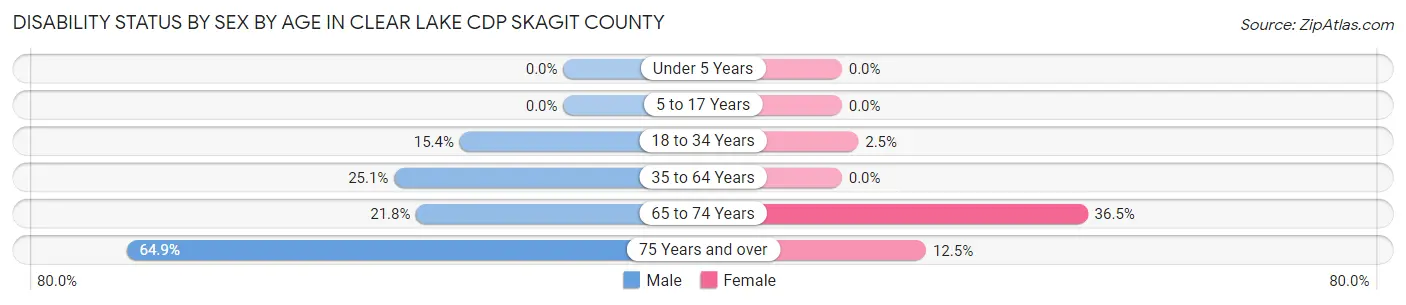
| Age Bracket | Male | Female |
| Under 5 Years | 0 (0.0%) | 0 (0.0%) |
| 5 to 17 Years | 0 (0.0%) | 0 (0.0%) |
| 18 to 34 Years | 4 (15.4%) | 4 (2.5%) |
| 35 to 64 Years | 51 (25.1%) | 0 (0.0%) |
| 65 to 74 Years | 19 (21.8%) | 23 (36.5%) |
| 75 Years and over | 24 (64.9%) | 5 (12.5%) |
Disability Class by Sex by Age in Clear Lake CDP Skagit County
Disability Class: Hearing Difficulty
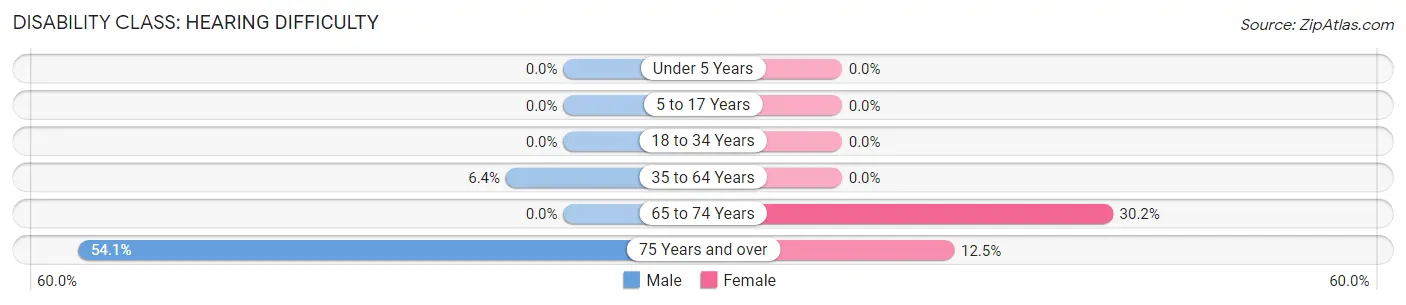
| Age Bracket | Male | Female |
| Under 5 Years | 0 (0.0%) | 0 (0.0%) |
| 5 to 17 Years | 0 (0.0%) | 0 (0.0%) |
| 18 to 34 Years | 0 (0.0%) | 0 (0.0%) |
| 35 to 64 Years | 13 (6.4%) | 0 (0.0%) |
| 65 to 74 Years | 0 (0.0%) | 19 (30.2%) |
| 75 Years and over | 20 (54.0%) | 5 (12.5%) |
Disability Class: Vision Difficulty
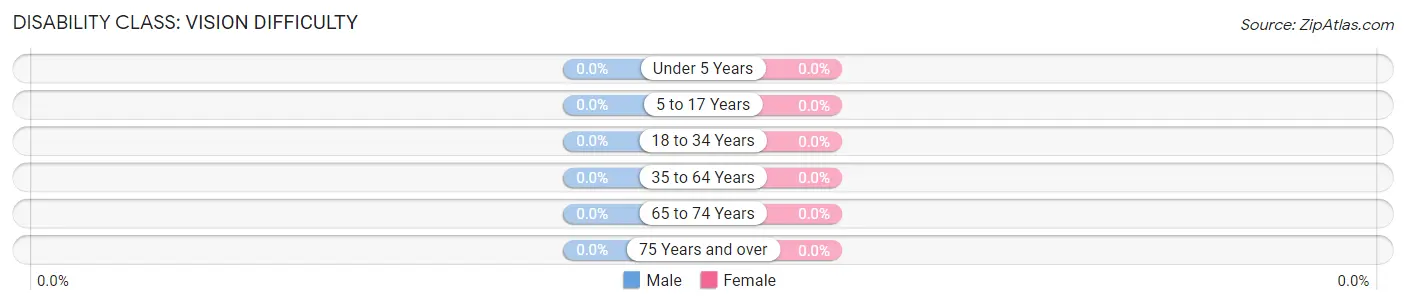
| Age Bracket | Male | Female |
| Under 5 Years | 0 (0.0%) | 0 (0.0%) |
| 5 to 17 Years | 0 (0.0%) | 0 (0.0%) |
| 18 to 34 Years | 0 (0.0%) | 0 (0.0%) |
| 35 to 64 Years | 0 (0.0%) | 0 (0.0%) |
| 65 to 74 Years | 0 (0.0%) | 0 (0.0%) |
| 75 Years and over | 0 (0.0%) | 0 (0.0%) |
Disability Class: Cognitive Difficulty
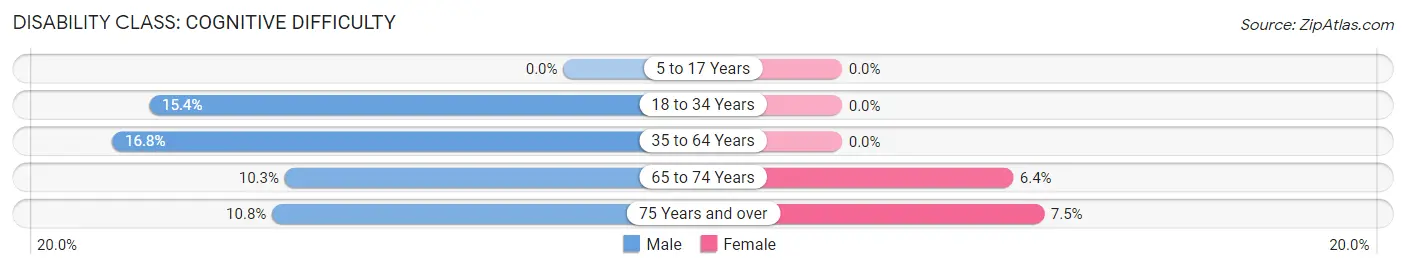
| Age Bracket | Male | Female |
| 5 to 17 Years | 0 (0.0%) | 0 (0.0%) |
| 18 to 34 Years | 4 (15.4%) | 0 (0.0%) |
| 35 to 64 Years | 34 (16.8%) | 0 (0.0%) |
| 65 to 74 Years | 9 (10.3%) | 4 (6.4%) |
| 75 Years and over | 4 (10.8%) | 3 (7.5%) |
Disability Class: Ambulatory Difficulty
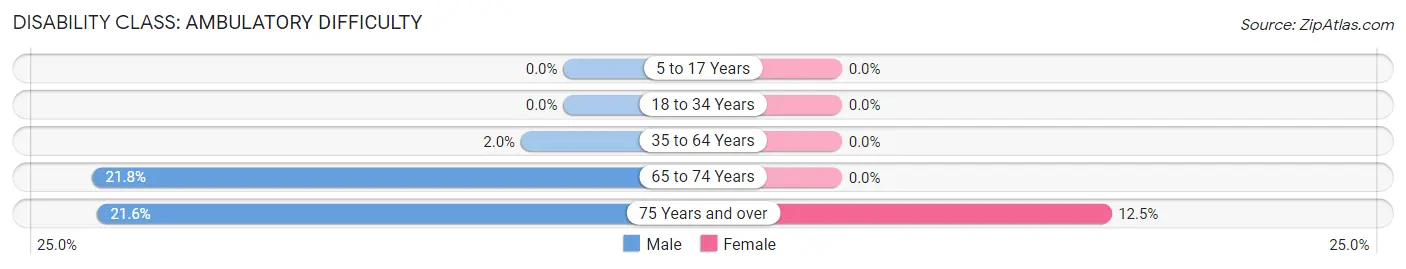
| Age Bracket | Male | Female |
| 5 to 17 Years | 0 (0.0%) | 0 (0.0%) |
| 18 to 34 Years | 0 (0.0%) | 0 (0.0%) |
| 35 to 64 Years | 4 (2.0%) | 0 (0.0%) |
| 65 to 74 Years | 19 (21.8%) | 0 (0.0%) |
| 75 Years and over | 8 (21.6%) | 5 (12.5%) |
Disability Class: Self-Care Difficulty
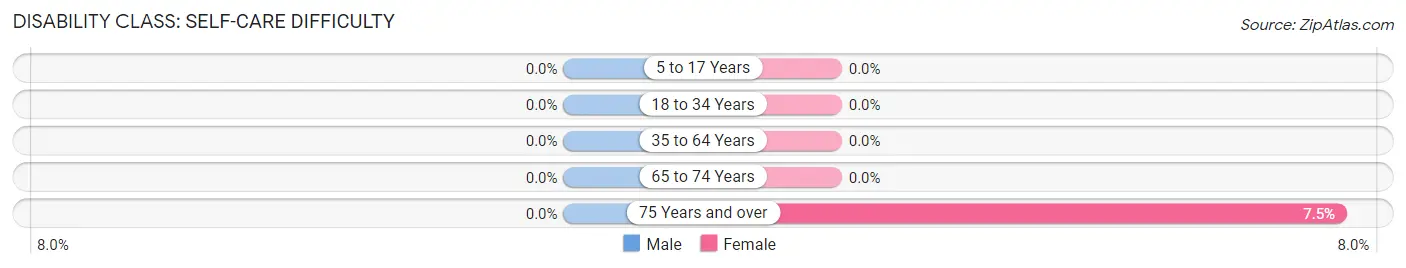
| Age Bracket | Male | Female |
| 5 to 17 Years | 0 (0.0%) | 0 (0.0%) |
| 18 to 34 Years | 0 (0.0%) | 0 (0.0%) |
| 35 to 64 Years | 0 (0.0%) | 0 (0.0%) |
| 65 to 74 Years | 0 (0.0%) | 0 (0.0%) |
| 75 Years and over | 0 (0.0%) | 3 (7.5%) |
Technology Access in Clear Lake CDP Skagit County
Computing Device Access in Clear Lake CDP Skagit County
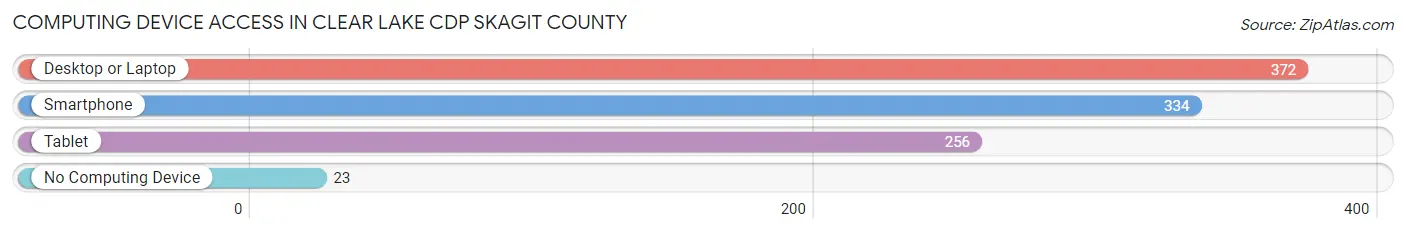
| Device Type | # Households | % Households |
| Desktop or Laptop | 372 | 91.8% |
| Smartphone | 334 | 82.5% |
| Tablet | 256 | 63.2% |
| No Computing Device | 23 | 5.7% |
| Total | 405 | 100.0% |
Internet Access in Clear Lake CDP Skagit County
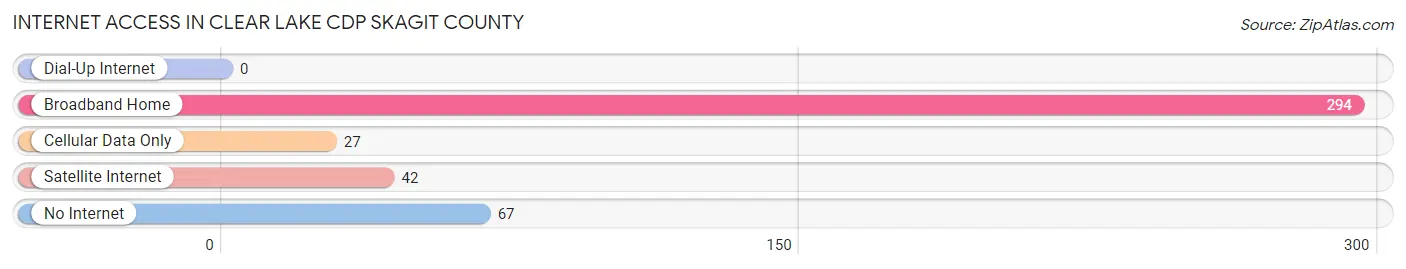
| Internet Type | # Households | % Households |
| Dial-Up Internet | 0 | 0.0% |
| Broadband Home | 294 | 72.6% |
| Cellular Data Only | 27 | 6.7% |
| Satellite Internet | 42 | 10.4% |
| No Internet | 67 | 16.5% |
| Total | 405 | 100.0% |
Clear Lake CDP Skagit County Summary
Introduction
Clear Lake Cdp is a census-designated place (CDP) located in Skagit County, Washington. It is situated in the northern part of the state, about 25 miles north of the city of Seattle. The population of Clear Lake Cdp was 1,845 at the time of the 2010 census. The CDP is located in the foothills of the Cascade Mountains and is surrounded by lush forests and rolling hills. The area is known for its recreational activities, including fishing, camping, hiking, and skiing.
History
The area now known as Clear Lake Cdp was first settled by Native Americans in the late 1700s. The first non-native settlers arrived in the area in the late 1800s, and the area was officially incorporated as a town in 1891. The town was named after Clear Lake, which is located nearby.
The town grew slowly over the next few decades, and by the mid-1900s, it had become a popular tourist destination. The area was known for its natural beauty and recreational activities, and it attracted many visitors from Seattle and other nearby cities.
In the late 1970s, the town was annexed by Skagit County, and it became a census-designated place (CDP). The population of Clear Lake Cdp has remained relatively stable since then, and it was 1,845 at the time of the 2010 census.
Geography
Clear Lake Cdp is located in Skagit County, Washington, about 25 miles north of Seattle. The CDP is situated in the foothills of the Cascade Mountains and is surrounded by lush forests and rolling hills. The area is known for its recreational activities, including fishing, camping, hiking, and skiing.
The CDP has a total area of 4.3 square miles, all of which is land. The elevation of the CDP is approximately 500 feet above sea level.
Economy
The economy of Clear Lake Cdp is largely based on tourism and recreation. The area is known for its natural beauty and recreational activities, and it attracts many visitors from Seattle and other nearby cities.
The CDP also has a few small businesses, including restaurants, shops, and lodging. The area is also home to a few small farms and ranches.
Demographics
At the time of the 2010 census, the population of Clear Lake Cdp was 1,845. The racial makeup of the CDP was 94.3% White, 0.7% African American, 0.7% Native American, 0.7% Asian, 0.2% Pacific Islander, 1.2% from other races, and 2.1% from two or more races. Hispanic or Latino of any race were 4.2% of the population.
The median household income in Clear Lake Cdp was $50,938, and the median family income was $54,844. The per capita income was $22,945. About 8.3% of families and 10.3% of the population were below the poverty line, including 14.2% of those under age 18 and 5.2% of those age 65 or over.
Conclusion
Clear Lake Cdp is a census-designated place (CDP) located in Skagit County, Washington. It is situated in the northern part of the state, about 25 miles north of the city of Seattle. The population of Clear Lake Cdp was 1,845 at the time of the 2010 census. The CDP is located in the foothills of the Cascade Mountains and is surrounded by lush forests and rolling hills. The area is known for its recreational activities, including fishing, camping, hiking, and skiing. The economy of Clear Lake Cdp is largely based on tourism and recreation, and the area is home to a few small businesses. The racial makeup of the CDP is predominantly White, with a small percentage of African American, Native American, Asian, and Pacific Islander residents. The median household income in Clear Lake Cdp was $50,938, and the median family income was $54,844.
Common Questions
What is Per Capita Income in Clear Lake CDP Skagit County?
Per Capita income in Clear Lake CDP Skagit County is $30,912.
What is the Median Family Income in Clear Lake CDP Skagit County?
Median Family Income in Clear Lake CDP Skagit County is $75,500.
What is the Median Household income in Clear Lake CDP Skagit County?
Median Household Income in Clear Lake CDP Skagit County is $63,125.
What is Income or Wage Gap in Clear Lake CDP Skagit County?
Income or Wage Gap in Clear Lake CDP Skagit County is 65.3%.
Women in Clear Lake CDP Skagit County earn 34.7 cents for every dollar earned by a man.
What is Inequality or Gini Index in Clear Lake CDP Skagit County?
Inequality or Gini Index in Clear Lake CDP Skagit County is 0.40.
What is the Total Population of Clear Lake CDP Skagit County?
Total Population of Clear Lake CDP Skagit County is 1,121.
What is the Total Male Population of Clear Lake CDP Skagit County?
Total Male Population of Clear Lake CDP Skagit County is 534.
What is the Total Female Population of Clear Lake CDP Skagit County?
Total Female Population of Clear Lake CDP Skagit County is 587.
What is the Ratio of Males per 100 Females in Clear Lake CDP Skagit County?
There are 90.97 Males per 100 Females in Clear Lake CDP Skagit County.
What is the Ratio of Females per 100 Males in Clear Lake CDP Skagit County?
There are 109.93 Females per 100 Males in Clear Lake CDP Skagit County.
What is the Median Population Age in Clear Lake CDP Skagit County?
Median Population Age in Clear Lake CDP Skagit County is 40.2 Years.
What is the Average Family Size in Clear Lake CDP Skagit County
Average Family Size in Clear Lake CDP Skagit County is 2.9 People.
What is the Average Household Size in Clear Lake CDP Skagit County
Average Household Size in Clear Lake CDP Skagit County is 2.8 People.
How Large is the Labor Force in Clear Lake CDP Skagit County?
There are 463 People in the Labor Forcein in Clear Lake CDP Skagit County.
What is the Percentage of People in the Labor Force in Clear Lake CDP Skagit County?
54.1% of People are in the Labor Force in Clear Lake CDP Skagit County.
What is the Unemployment Rate in Clear Lake CDP Skagit County?
Unemployment Rate in Clear Lake CDP Skagit County is 1.5%.