Fircrest, WA Map & Demographics
Fircrest Map
Fircrest Overview
$50,796
PER CAPITA INCOME
$115,405
AVG FAMILY INCOME
$99,032
AVG HOUSEHOLD INCOME
16.4%
WAGE / INCOME GAP [ % ]
83.6¢/ $1
WAGE / INCOME GAP [ $ ]
0.39
INEQUALITY / GINI INDEX
7,098
TOTAL POPULATION
3,199
MALE POPULATION
3,899
FEMALE POPULATION
82.05
MALES / 100 FEMALES
121.88
FEMALES / 100 MALES
43.3
MEDIAN AGE
3.0
AVG FAMILY SIZE
2.4
AVG HOUSEHOLD SIZE
3,951
LABOR FORCE [ PEOPLE ]
67.2%
PERCENT IN LABOR FORCE
8.1%
UNEMPLOYMENT RATE
Fircrest Area Codes
Income in Fircrest
Income Overview in Fircrest
Per Capita Income in Fircrest is $50,796, while median incomes of families and households are $115,405 and $99,032 respectively.
| Characteristic | Number | Measure |
| Per Capita Income | 7,098 | $50,796 |
| Median Family Income | 1,896 | $115,405 |
| Mean Family Income | 1,896 | $140,468 |
| Median Household Income | 2,898 | $99,032 |
| Mean Household Income | 2,898 | $122,449 |
| Income Deficit | 1,896 | $0 |
| Wage / Income Gap (%) | 7,098 | 16.44% |
| Wage / Income Gap ($) | 7,098 | 83.56¢ per $1 |
| Gini / Inequality Index | 7,098 | 0.39 |
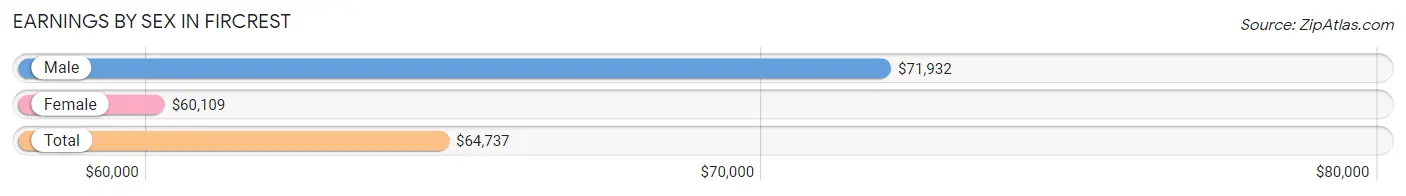
Earnings by Sex in Fircrest
Average Earnings in Fircrest are $64,737, $71,932 for men and $60,109 for women, a difference of 16.4%.
| Sex | Number | Average Earnings |
| Male | 1,664 (40.5%) | $71,932 |
| Female | 2,448 (59.5%) | $60,109 |
| Total | 4,112 (100.0%) | $64,737 |
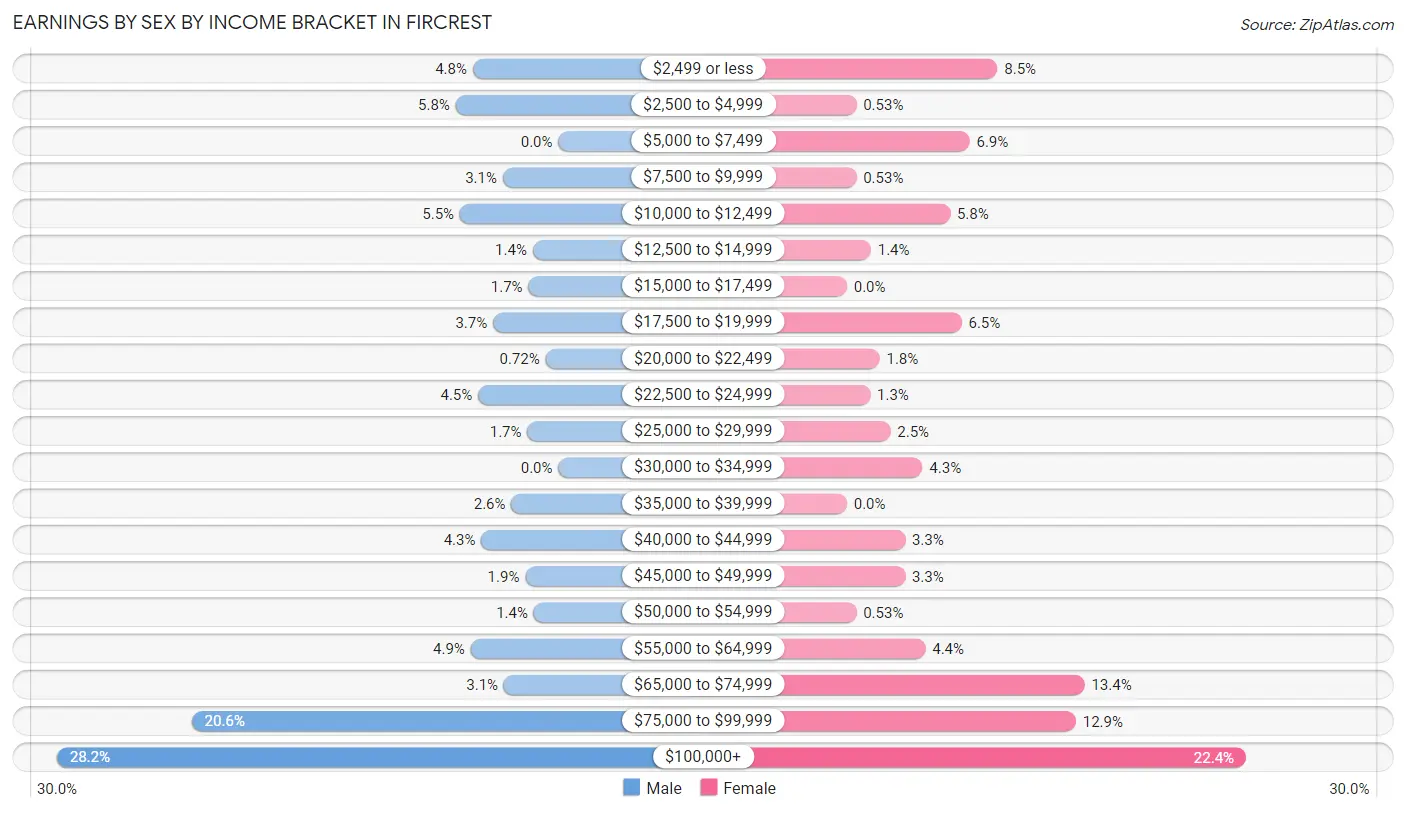
Earnings by Sex by Income Bracket in Fircrest
The most common earnings brackets in Fircrest are $100,000+ for men (469 | 28.2%) and $100,000+ for women (549 | 22.4%).
| Income | Male | Female |
| $2,499 or less | 80 (4.8%) | 207 (8.5%) |
| $2,500 to $4,999 | 96 (5.8%) | 13 (0.5%) |
| $5,000 to $7,499 | 0 (0.0%) | 169 (6.9%) |
| $7,500 to $9,999 | 52 (3.1%) | 13 (0.5%) |
| $10,000 to $12,499 | 92 (5.5%) | 142 (5.8%) |
| $12,500 to $14,999 | 24 (1.4%) | 33 (1.3%) |
| $15,000 to $17,499 | 28 (1.7%) | 0 (0.0%) |
| $17,500 to $19,999 | 61 (3.7%) | 158 (6.5%) |
| $20,000 to $22,499 | 12 (0.7%) | 45 (1.8%) |
| $22,500 to $24,999 | 75 (4.5%) | 32 (1.3%) |
| $25,000 to $29,999 | 29 (1.7%) | 60 (2.5%) |
| $30,000 to $34,999 | 0 (0.0%) | 104 (4.3%) |
| $35,000 to $39,999 | 44 (2.6%) | 0 (0.0%) |
| $40,000 to $44,999 | 72 (4.3%) | 80 (3.3%) |
| $45,000 to $49,999 | 31 (1.9%) | 80 (3.3%) |
| $50,000 to $54,999 | 23 (1.4%) | 13 (0.5%) |
| $55,000 to $64,999 | 82 (4.9%) | 108 (4.4%) |
| $65,000 to $74,999 | 51 (3.1%) | 327 (13.4%) |
| $75,000 to $99,999 | 343 (20.6%) | 315 (12.9%) |
| $100,000+ | 469 (28.2%) | 549 (22.4%) |
| Total | 1,664 (100.0%) | 2,448 (100.0%) |
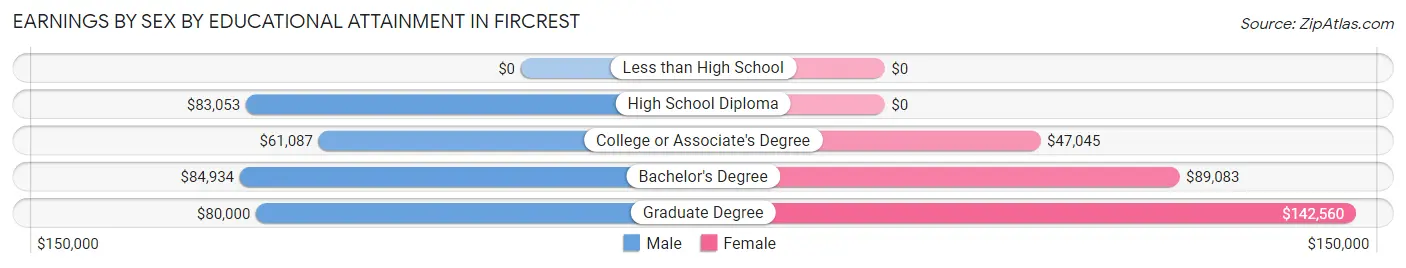
Earnings by Sex by Educational Attainment in Fircrest
Average earnings in Fircrest are $78,425 for men and $68,705 for women, a difference of 12.4%. Men with an educational attainment of bachelor's degree enjoy the highest average annual earnings of $84,934, while those with college or associate's degree education earn the least with $61,087. Women with an educational attainment of graduate degree earn the most with the average annual earnings of $142,560, while those with college or associate's degree education have the smallest earnings of $47,045.
| Educational Attainment | Male Income | Female Income |
| Less than High School | - | - |
| High School Diploma | $83,053 | $0 |
| College or Associate's Degree | $61,087 | $47,045 |
| Bachelor's Degree | $84,934 | $89,083 |
| Graduate Degree | $80,000 | $142,560 |
| Total | $78,425 | $68,705 |
Family Income in Fircrest
Family Income Brackets in Fircrest
According to the Fircrest family income data, there are 489 families falling into the $150,000 to $199,999 income range, which is the most common income bracket and makes up 25.8% of all families.
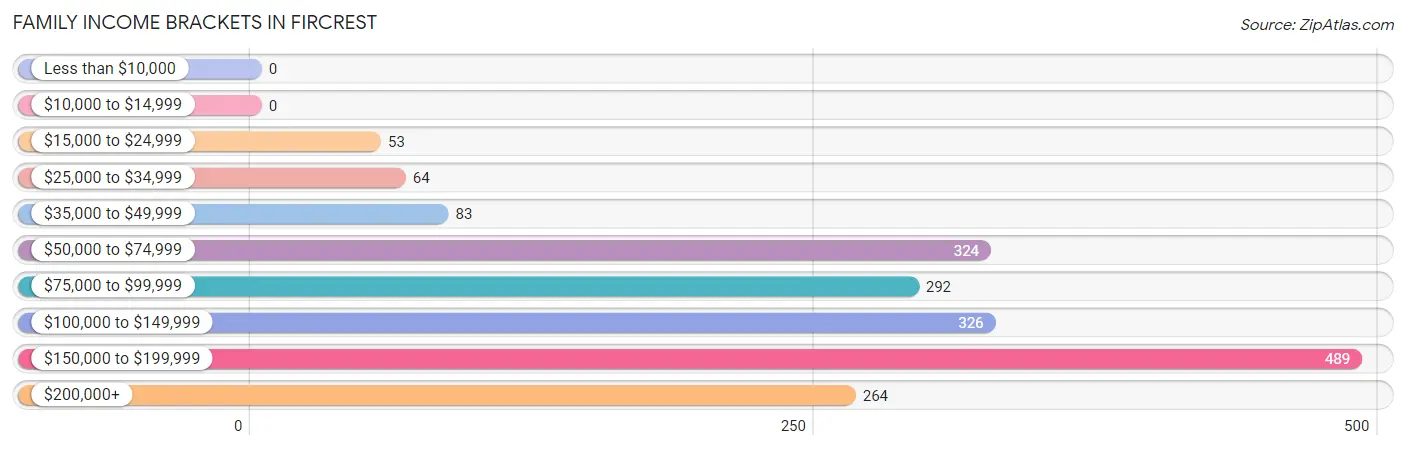
| Income Bracket | # Families | % Families |
| Less than $10,000 | 0 | 0.0% |
| $10,000 to $14,999 | 0 | 0.0% |
| $15,000 to $24,999 | 53 | 2.8% |
| $25,000 to $34,999 | 64 | 3.4% |
| $35,000 to $49,999 | 83 | 4.4% |
| $50,000 to $74,999 | 324 | 17.1% |
| $75,000 to $99,999 | 292 | 15.4% |
| $100,000 to $149,999 | 326 | 17.2% |
| $150,000 to $199,999 | 489 | 25.8% |
| $200,000+ | 264 | 13.9% |
Family Income by Famaliy Size in Fircrest
3-person families (426 | 22.5%) account for the highest median family income in Fircrest with $124,375 per family, while 2-person families (917 | 48.4%) have the highest median income of $61,188 per family member.
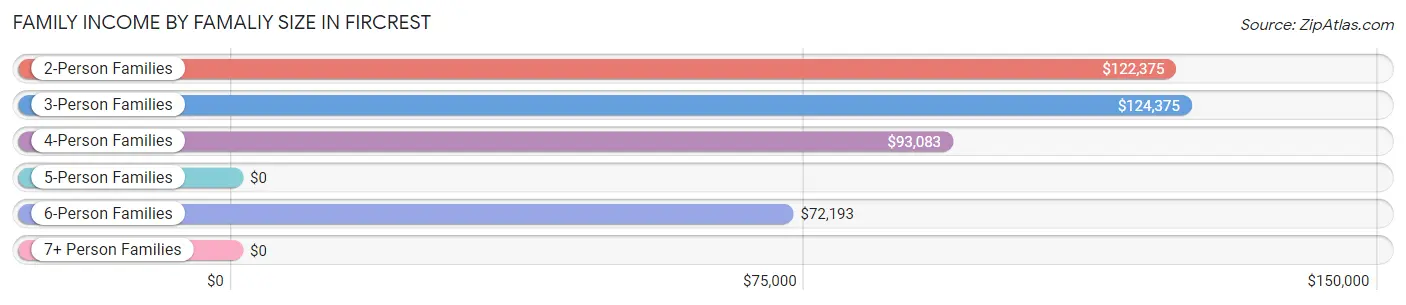
| Income Bracket | # Families | Median Income |
| 2-Person Families | 917 (48.4%) | $122,375 |
| 3-Person Families | 426 (22.5%) | $124,375 |
| 4-Person Families | 386 (20.4%) | $93,083 |
| 5-Person Families | 29 (1.5%) | $0 |
| 6-Person Families | 107 (5.6%) | $72,193 |
| 7+ Person Families | 31 (1.6%) | $0 |
| Total | 1,896 (100.0%) | $115,405 |
Family Income by Number of Earners in Fircrest
The median family income in Fircrest is $115,405, with families comprising 2 earners (914) having the highest median family income of $151,485, while families with no earners (213) have the lowest median family income of $58,417, accounting for 48.2% and 11.2% of families, respectively.
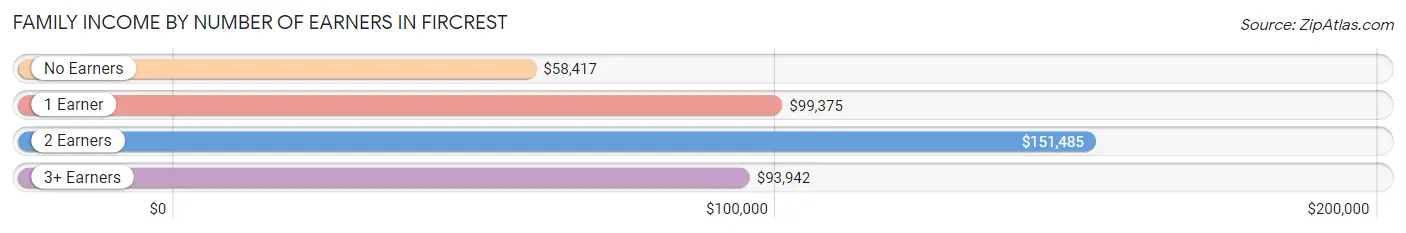
| Number of Earners | # Families | Median Income |
| No Earners | 213 (11.2%) | $58,417 |
| 1 Earner | 527 (27.8%) | $99,375 |
| 2 Earners | 914 (48.2%) | $151,485 |
| 3+ Earners | 242 (12.8%) | $93,942 |
| Total | 1,896 (100.0%) | $115,405 |
Household Income in Fircrest
Household Income Brackets in Fircrest
With 669 households falling in the category, the $150,000 to $199,999 income range is the most frequent in Fircrest, accounting for 23.1% of all households.
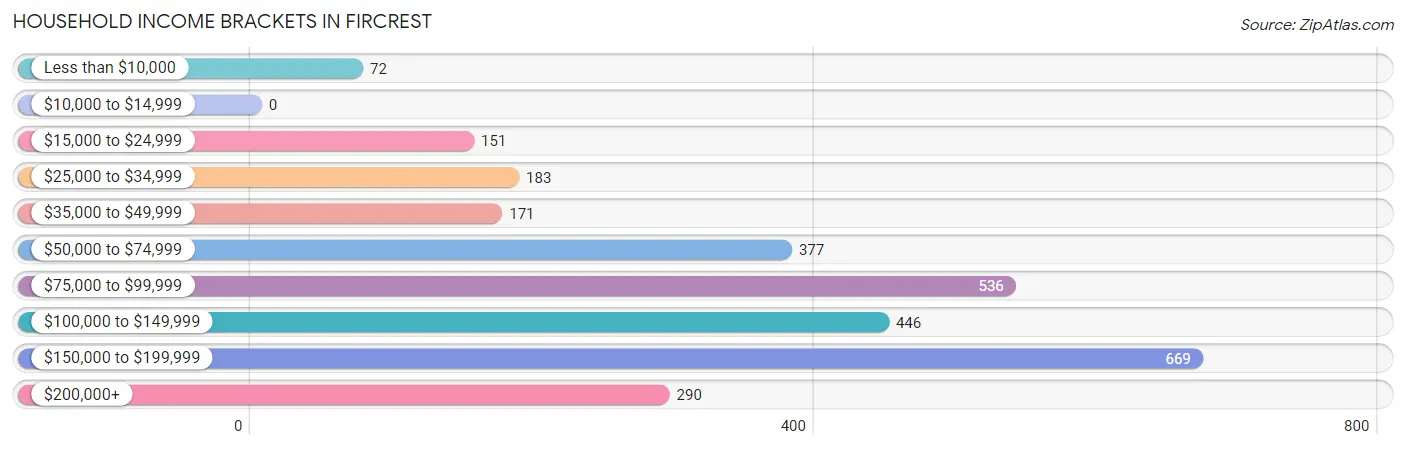
| Income Bracket | # Households | % Households |
| Less than $10,000 | 72 | 2.5% |
| $10,000 to $14,999 | 0 | 0.0% |
| $15,000 to $24,999 | 151 | 5.2% |
| $25,000 to $34,999 | 183 | 6.3% |
| $35,000 to $49,999 | 171 | 5.9% |
| $50,000 to $74,999 | 377 | 13.0% |
| $75,000 to $99,999 | 536 | 18.5% |
| $100,000 to $149,999 | 446 | 15.4% |
| $150,000 to $199,999 | 669 | 23.1% |
| $200,000+ | 290 | 10.0% |
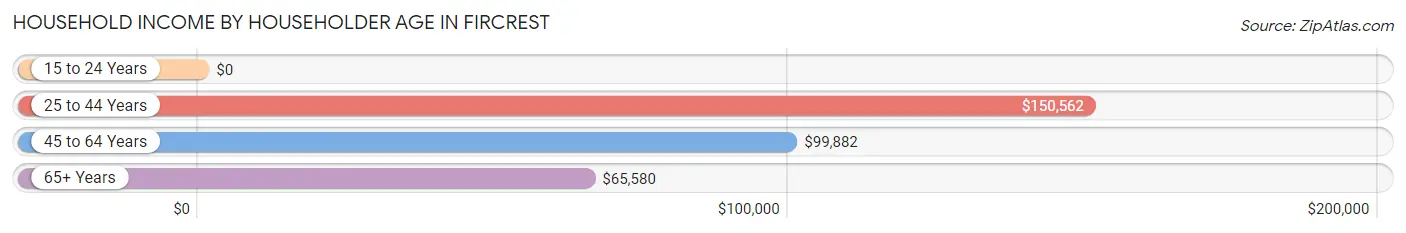
Household Income by Householder Age in Fircrest
The median household income in Fircrest is $99,032, with the highest median household income of $150,562 found in the 25 to 44 years age bracket for the primary householder. A total of 919 households (31.7%) fall into this category.
| Income Bracket | # Households | Median Income |
| 15 to 24 Years | 0 (0.0%) | $0 |
| 25 to 44 Years | 919 (31.7%) | $150,562 |
| 45 to 64 Years | 992 (34.2%) | $99,882 |
| 65+ Years | 987 (34.1%) | $65,580 |
| Total | 2,898 (100.0%) | $99,032 |
Poverty in Fircrest
Income Below Poverty by Sex and Age in Fircrest
With 5.1% poverty level for males and 4.0% for females among the residents of Fircrest, 55 to 64 year old males and 6 to 11 year old females are the most vulnerable to poverty, with 67 males (14.5%) and 84 females (44.9%) in their respective age groups living below the poverty level.
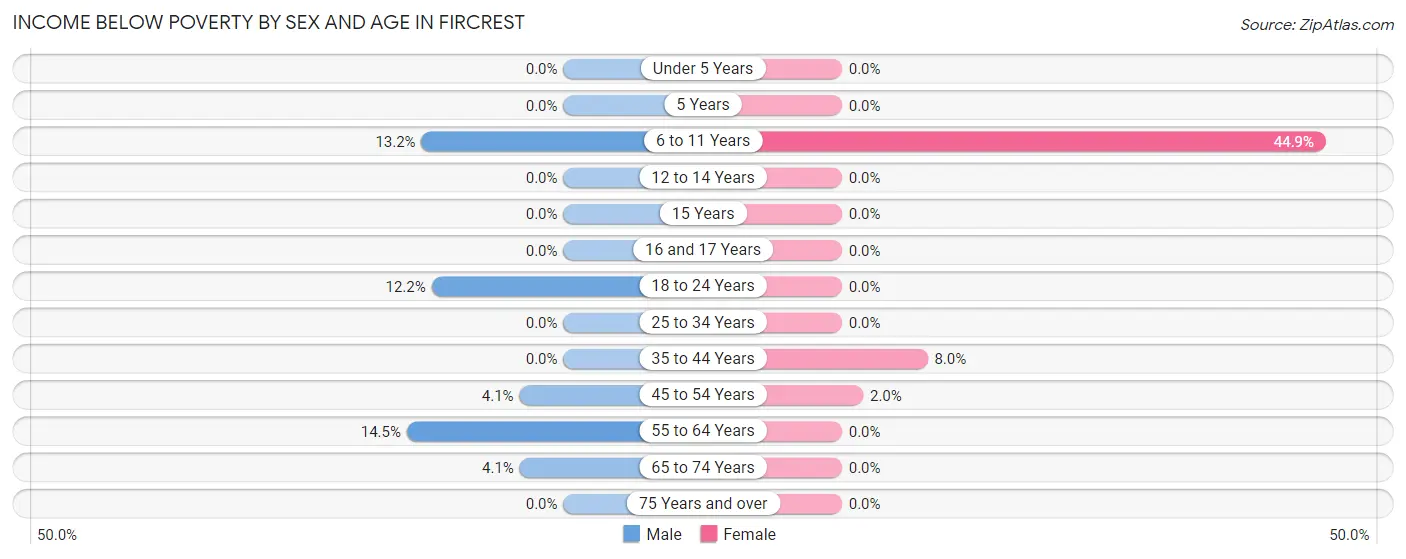
| Age Bracket | Male | Female |
| Under 5 Years | 0 (0.0%) | 0 (0.0%) |
| 5 Years | 0 (0.0%) | 0 (0.0%) |
| 6 to 11 Years | 42 (13.2%) | 84 (44.9%) |
| 12 to 14 Years | 0 (0.0%) | 0 (0.0%) |
| 15 Years | 0 (0.0%) | 0 (0.0%) |
| 16 and 17 Years | 0 (0.0%) | 0 (0.0%) |
| 18 to 24 Years | 23 (12.2%) | 0 (0.0%) |
| 25 to 34 Years | 0 (0.0%) | 0 (0.0%) |
| 35 to 44 Years | 0 (0.0%) | 58 (8.0%) |
| 45 to 54 Years | 16 (4.1%) | 12 (2.0%) |
| 55 to 64 Years | 67 (14.5%) | 0 (0.0%) |
| 65 to 74 Years | 14 (4.1%) | 0 (0.0%) |
| 75 Years and over | 0 (0.0%) | 0 (0.0%) |
| Total | 162 (5.1%) | 154 (4.0%) |
Income Above Poverty by Sex and Age in Fircrest
According to the poverty statistics in Fircrest, males aged under 5 years and females aged under 5 years are the age groups that are most secure financially, with 100.0% of males and 100.0% of females in these age groups living above the poverty line.
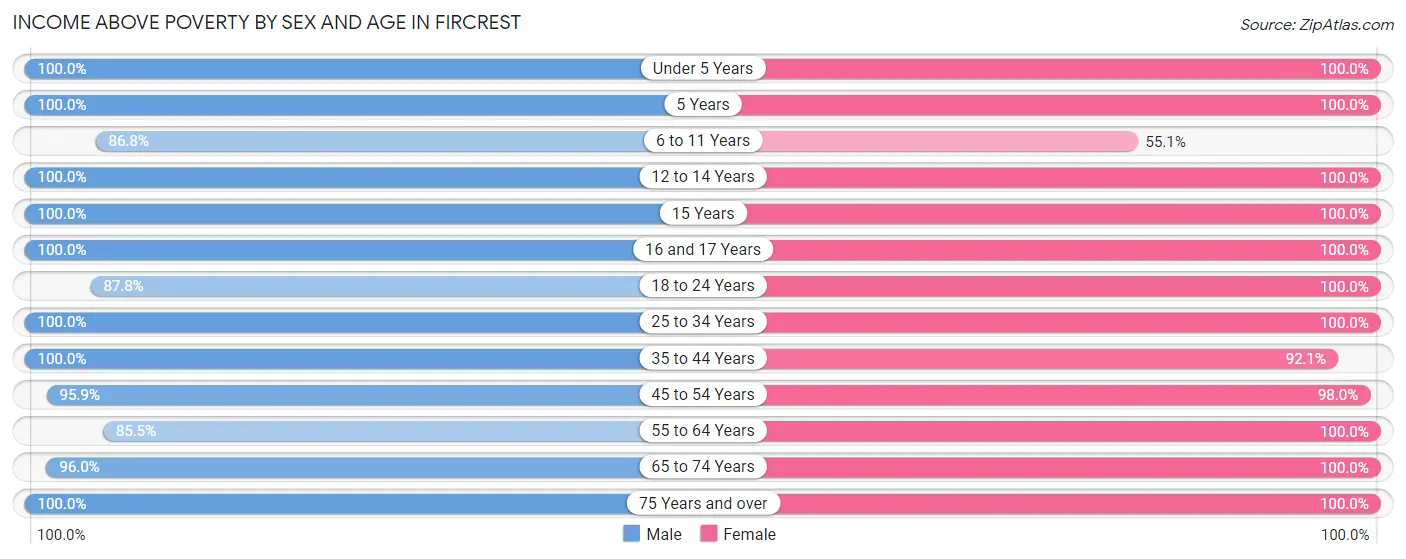
| Age Bracket | Male | Female |
| Under 5 Years | 188 (100.0%) | 125 (100.0%) |
| 5 Years | 38 (100.0%) | 66 (100.0%) |
| 6 to 11 Years | 277 (86.8%) | 103 (55.1%) |
| 12 to 14 Years | 111 (100.0%) | 50 (100.0%) |
| 15 Years | 88 (100.0%) | 32 (100.0%) |
| 16 and 17 Years | 106 (100.0%) | 50 (100.0%) |
| 18 to 24 Years | 165 (87.8%) | 457 (100.0%) |
| 25 to 34 Years | 250 (100.0%) | 294 (100.0%) |
| 35 to 44 Years | 404 (100.0%) | 672 (92.0%) |
| 45 to 54 Years | 376 (95.9%) | 596 (98.0%) |
| 55 to 64 Years | 394 (85.5%) | 448 (100.0%) |
| 65 to 74 Years | 332 (96.0%) | 405 (100.0%) |
| 75 Years and over | 308 (100.0%) | 432 (100.0%) |
| Total | 3,037 (94.9%) | 3,730 (96.0%) |
Income Below Poverty Among Married-Couple Families in Fircrest
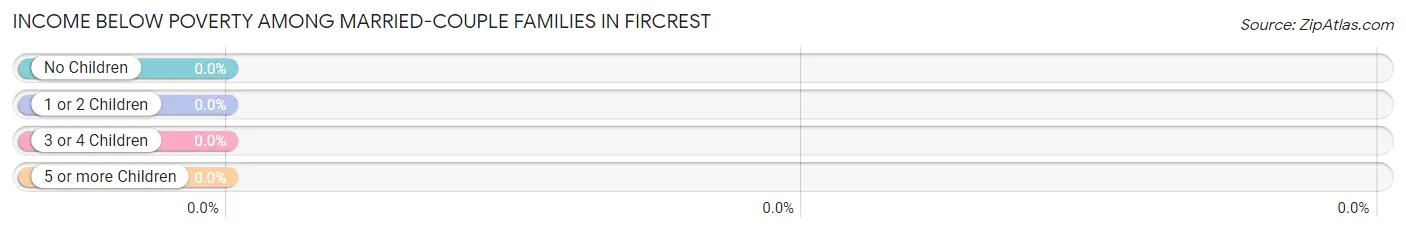
| Children | Above Poverty | Below Poverty |
| No Children | 679 (100.0%) | 0 (0.0%) |
| 1 or 2 Children | 501 (100.0%) | 0 (0.0%) |
| 3 or 4 Children | 49 (100.0%) | 0 (0.0%) |
| 5 or more Children | 19 (100.0%) | 0 (0.0%) |
| Total | 1,248 (100.0%) | 0 (0.0%) |
Income Below Poverty Among Single-Parent Households in Fircrest
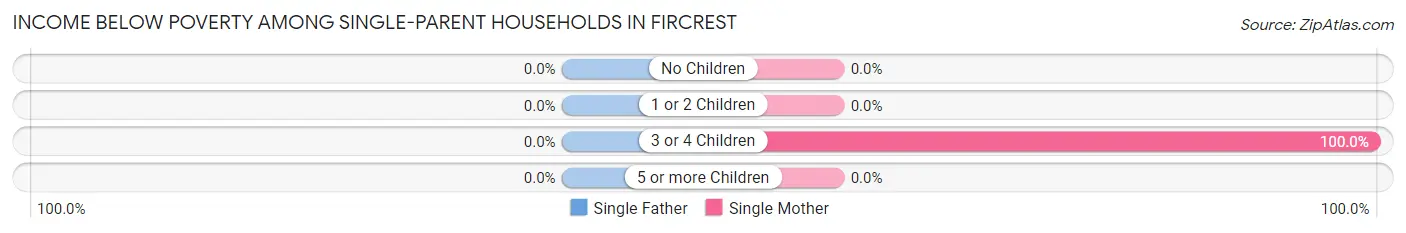
| Children | Single Father | Single Mother |
| No Children | 0 (0.0%) | 0 (0.0%) |
| 1 or 2 Children | 0 (0.0%) | 0 (0.0%) |
| 3 or 4 Children | 0 (0.0%) | 41 (100.0%) |
| 5 or more Children | 0 (0.0%) | 0 (0.0%) |
| Total | 0 (0.0%) | 41 (7.9%) |
Income Below Poverty Among Married-Couple vs Single-Parent Households in Fircrest
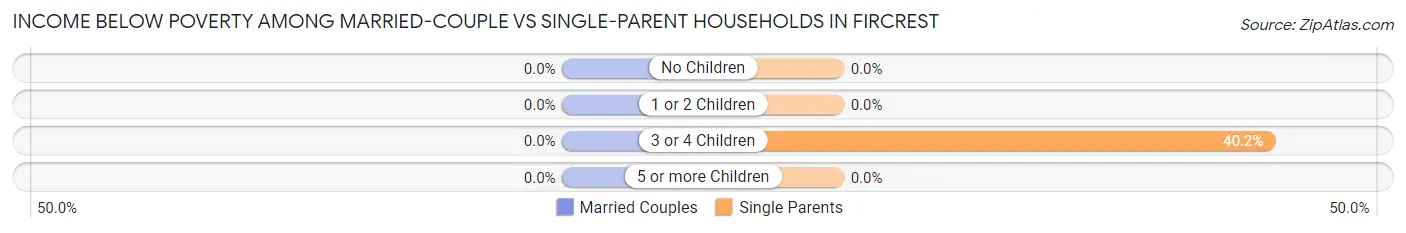
| Children | Married-Couple Families | Single-Parent Households |
| No Children | 0 (0.0%) | 0 (0.0%) |
| 1 or 2 Children | 0 (0.0%) | 0 (0.0%) |
| 3 or 4 Children | 0 (0.0%) | 41 (40.2%) |
| 5 or more Children | 0 (0.0%) | 0 (0.0%) |
| Total | 0 (0.0%) | 41 (6.3%) |
Race in Fircrest
The most populous races in Fircrest are White / Caucasian (5,125 | 72.2%), Two or more Races (846 | 11.9%), and Asian (566 | 8.0%).
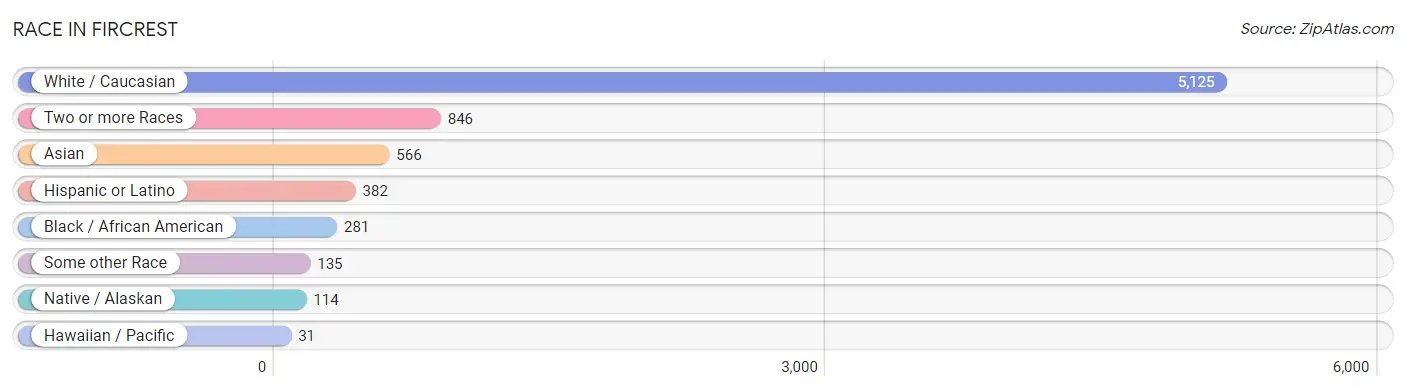
| Race | # Population | % Population |
| Asian | 566 | 8.0% |
| Black / African American | 281 | 4.0% |
| Hawaiian / Pacific | 31 | 0.4% |
| Hispanic or Latino | 382 | 5.4% |
| Native / Alaskan | 114 | 1.6% |
| White / Caucasian | 5,125 | 72.2% |
| Two or more Races | 846 | 11.9% |
| Some other Race | 135 | 1.9% |
| Total | 7,098 | 100.0% |
Ancestry in Fircrest
The most populous ancestries reported in Fircrest are German (2,024 | 28.5%), English (896 | 12.6%), Irish (806 | 11.4%), Burmese (468 | 6.6%), and Swedish (369 | 5.2%), together accounting for 64.3% of all Fircrest residents.
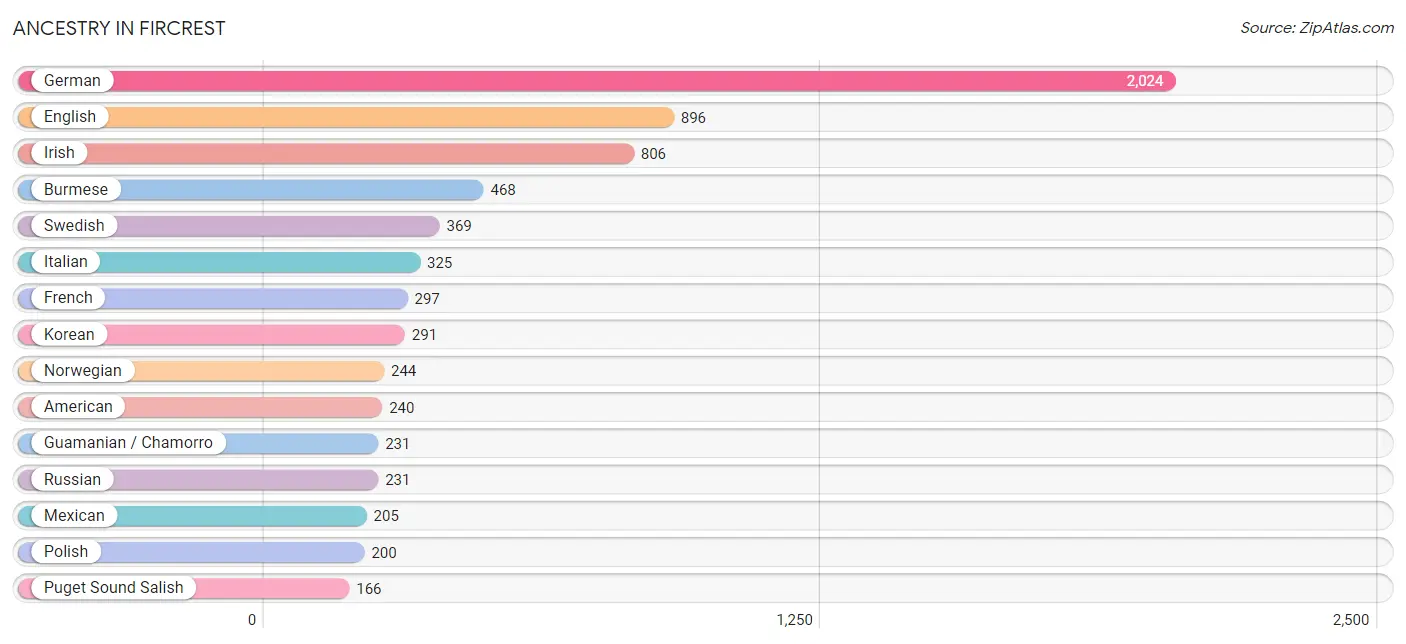
| Ancestry | # Population | % Population |
| American | 240 | 3.4% |
| Arab | 153 | 2.2% |
| Austrian | 12 | 0.2% |
| Bhutanese | 25 | 0.4% |
| Brazilian | 28 | 0.4% |
| British | 36 | 0.5% |
| Burmese | 468 | 6.6% |
| Canadian | 22 | 0.3% |
| Central American | 113 | 1.6% |
| Cherokee | 32 | 0.4% |
| Chippewa | 53 | 0.7% |
| Colombian | 29 | 0.4% |
| Croatian | 25 | 0.4% |
| Czech | 41 | 0.6% |
| Czechoslovakian | 12 | 0.2% |
| Danish | 109 | 1.5% |
| Delaware | 11 | 0.2% |
| Dutch | 98 | 1.4% |
| Eastern European | 14 | 0.2% |
| English | 896 | 12.6% |
| European | 165 | 2.3% |
| Filipino | 67 | 0.9% |
| Finnish | 49 | 0.7% |
| French | 297 | 4.2% |
| German | 2,024 | 28.5% |
| Guamanian / Chamorro | 231 | 3.3% |
| Guatemalan | 20 | 0.3% |
| Indian (Asian) | 66 | 0.9% |
| Irish | 806 | 11.4% |
| Italian | 325 | 4.6% |
| Korean | 291 | 4.1% |
| Mexican | 205 | 2.9% |
| Native Hawaiian | 22 | 0.3% |
| Northern European | 34 | 0.5% |
| Norwegian | 244 | 3.4% |
| Pakistani | 54 | 0.8% |
| Polish | 200 | 2.8% |
| Portuguese | 13 | 0.2% |
| Puerto Rican | 22 | 0.3% |
| Puget Sound Salish | 166 | 2.3% |
| Russian | 231 | 3.3% |
| Salvadoran | 93 | 1.3% |
| Scandinavian | 39 | 0.5% |
| Scotch-Irish | 17 | 0.2% |
| Scottish | 84 | 1.2% |
| Sioux | 11 | 0.2% |
| South American | 29 | 0.4% |
| Sri Lankan | 34 | 0.5% |
| Swedish | 369 | 5.2% |
| Thai | 12 | 0.2% |
| Ukrainian | 22 | 0.3% |
| Welsh | 53 | 0.7% |
| Yaqui | 31 | 0.4% |
| Yugoslavian | 19 | 0.3% | View All 54 Rows |
Immigrants in Fircrest
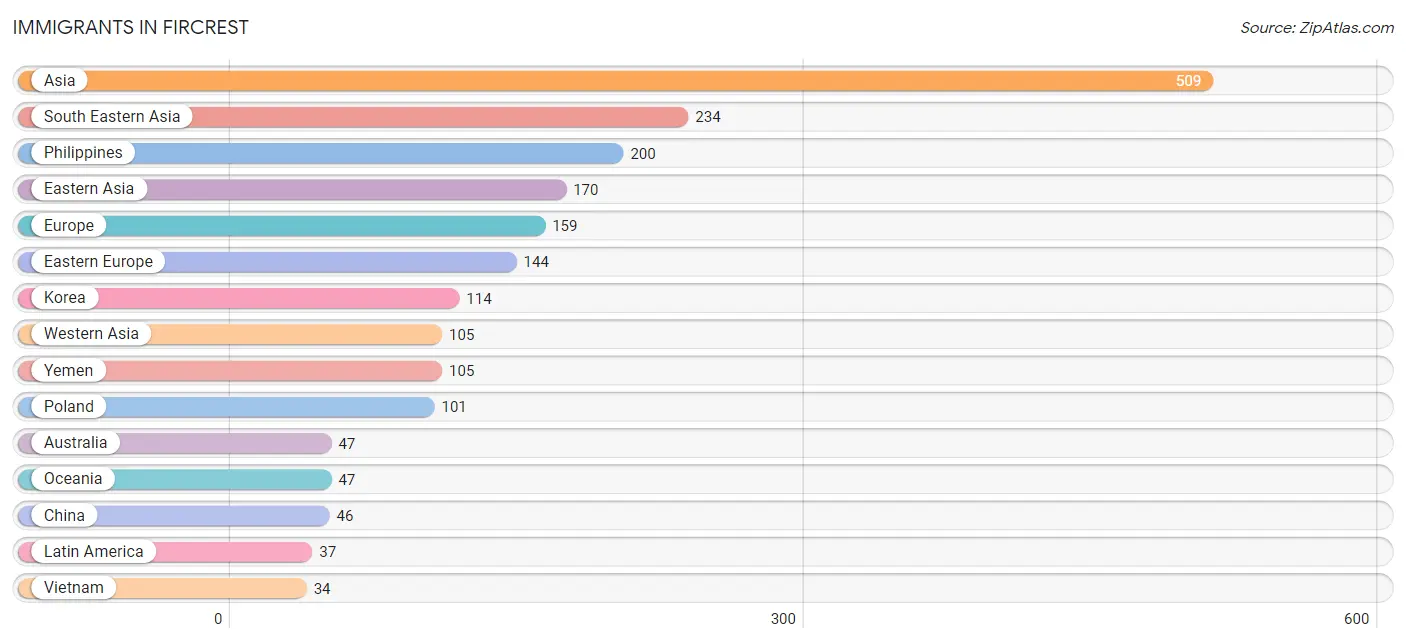
The most numerous immigrant groups reported in Fircrest came from Asia (509 | 7.2%), South Eastern Asia (234 | 3.3%), Philippines (200 | 2.8%), Eastern Asia (170 | 2.4%), and Europe (159 | 2.2%), together accounting for 17.9% of all Fircrest residents.
| Immigration Origin | # Population | % Population |
| Asia | 509 | 7.2% |
| Australia | 47 | 0.7% |
| Brazil | 28 | 0.4% |
| Canada | 32 | 0.4% |
| Central America | 9 | 0.1% |
| China | 46 | 0.6% |
| Eastern Asia | 170 | 2.4% |
| Eastern Europe | 144 | 2.0% |
| Europe | 159 | 2.2% |
| Hong Kong | 8 | 0.1% |
| Japan | 10 | 0.1% |
| Korea | 114 | 1.6% |
| Latin America | 37 | 0.5% |
| Lithuania | 18 | 0.3% |
| Mexico | 9 | 0.1% |
| Netherlands | 15 | 0.2% |
| Oceania | 47 | 0.7% |
| Philippines | 200 | 2.8% |
| Poland | 101 | 1.4% |
| Russia | 25 | 0.4% |
| South America | 28 | 0.4% |
| South Eastern Asia | 234 | 3.3% |
| Taiwan | 23 | 0.3% |
| Vietnam | 34 | 0.5% |
| Western Asia | 105 | 1.5% |
| Western Europe | 15 | 0.2% |
| Yemen | 105 | 1.5% | View All 27 Rows |
Sex and Age in Fircrest
Sex and Age in Fircrest
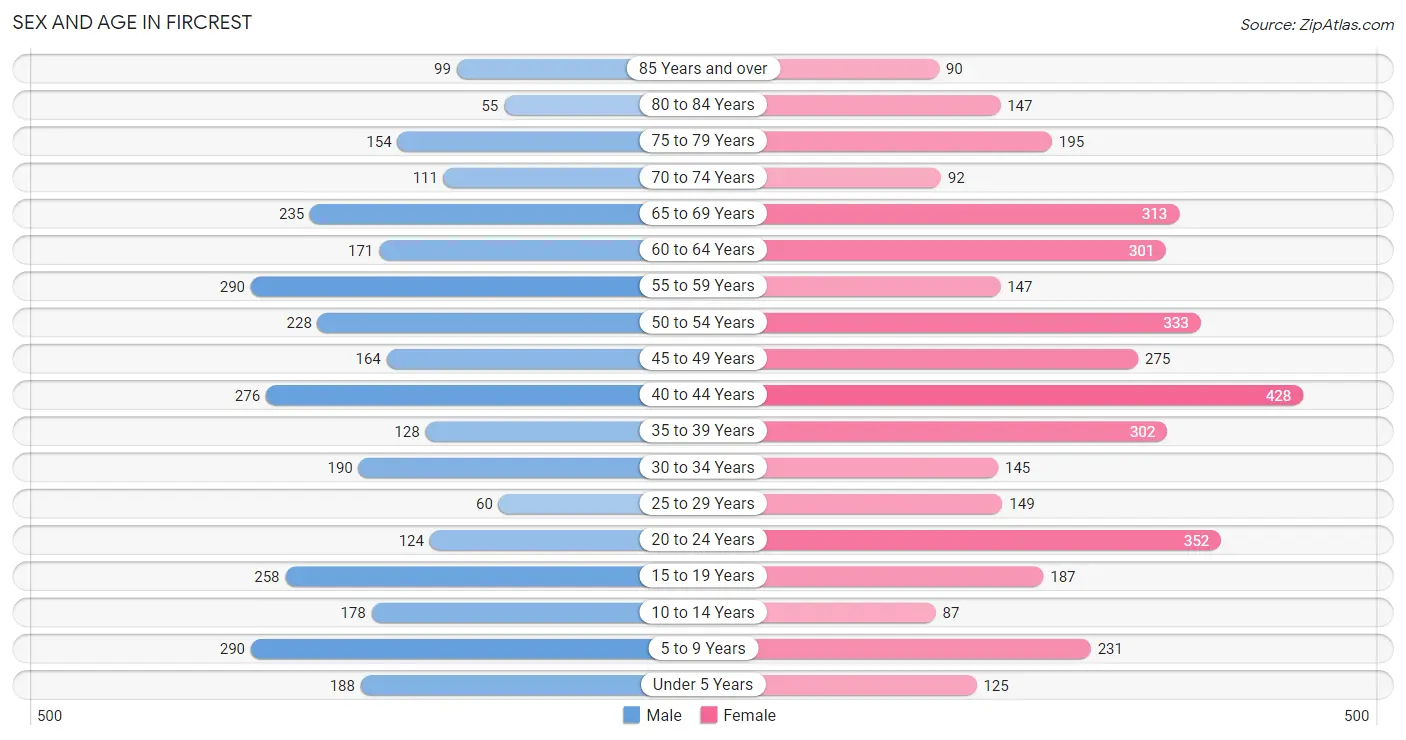
The most populous age groups in Fircrest are 5 to 9 Years (290 | 9.1%) for men and 40 to 44 Years (428 | 11.0%) for women.
| Age Bracket | Male | Female |
| Under 5 Years | 188 (5.9%) | 125 (3.2%) |
| 5 to 9 Years | 290 (9.1%) | 231 (5.9%) |
| 10 to 14 Years | 178 (5.6%) | 87 (2.2%) |
| 15 to 19 Years | 258 (8.1%) | 187 (4.8%) |
| 20 to 24 Years | 124 (3.9%) | 352 (9.0%) |
| 25 to 29 Years | 60 (1.9%) | 149 (3.8%) |
| 30 to 34 Years | 190 (5.9%) | 145 (3.7%) |
| 35 to 39 Years | 128 (4.0%) | 302 (7.7%) |
| 40 to 44 Years | 276 (8.6%) | 428 (11.0%) |
| 45 to 49 Years | 164 (5.1%) | 275 (7.0%) |
| 50 to 54 Years | 228 (7.1%) | 333 (8.5%) |
| 55 to 59 Years | 290 (9.1%) | 147 (3.8%) |
| 60 to 64 Years | 171 (5.3%) | 301 (7.7%) |
| 65 to 69 Years | 235 (7.3%) | 313 (8.0%) |
| 70 to 74 Years | 111 (3.5%) | 92 (2.4%) |
| 75 to 79 Years | 154 (4.8%) | 195 (5.0%) |
| 80 to 84 Years | 55 (1.7%) | 147 (3.8%) |
| 85 Years and over | 99 (3.1%) | 90 (2.3%) |
| Total | 3,199 (100.0%) | 3,899 (100.0%) |
Families and Households in Fircrest
Median Family Size in Fircrest
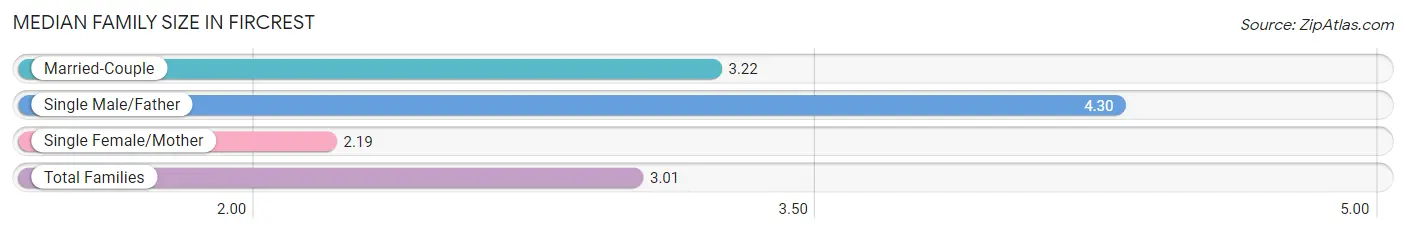
The median family size in Fircrest is 3.01 persons per family, with single male/father families (129 | 6.8%) accounting for the largest median family size of 4.3 persons per family. On the other hand, single female/mother families (519 | 27.4%) represent the smallest median family size with 2.19 persons per family.
| Family Type | # Families | Family Size |
| Married-Couple | 1,248 (65.8%) | 3.22 |
| Single Male/Father | 129 (6.8%) | 4.30 |
| Single Female/Mother | 519 (27.4%) | 2.19 |
| Total Families | 1,896 (100.0%) | 3.01 |
Median Household Size in Fircrest
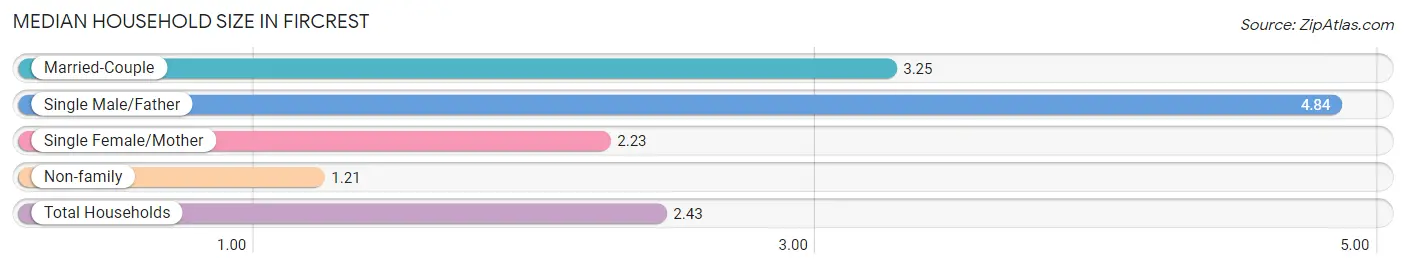
The median household size in Fircrest is 2.43 persons per household, with single male/father households (129 | 4.4%) accounting for the largest median household size of 4.84 persons per household. non-family households (1,002 | 34.6%) represent the smallest median household size with 1.21 persons per household.
| Household Type | # Households | Household Size |
| Married-Couple | 1,248 (43.1%) | 3.25 |
| Single Male/Father | 129 (4.4%) | 4.84 |
| Single Female/Mother | 519 (17.9%) | 2.23 |
| Non-family | 1,002 (34.6%) | 1.21 |
| Total Households | 2,898 (100.0%) | 2.43 |
Household Size by Marriage Status in Fircrest
Out of a total of 2,898 households in Fircrest, 1,896 (65.4%) are family households, while 1,002 (34.6%) are nonfamily households. The most numerous type of family households are 2-person households, comprising 878, and the most common type of nonfamily households are 1-person households, comprising 793.
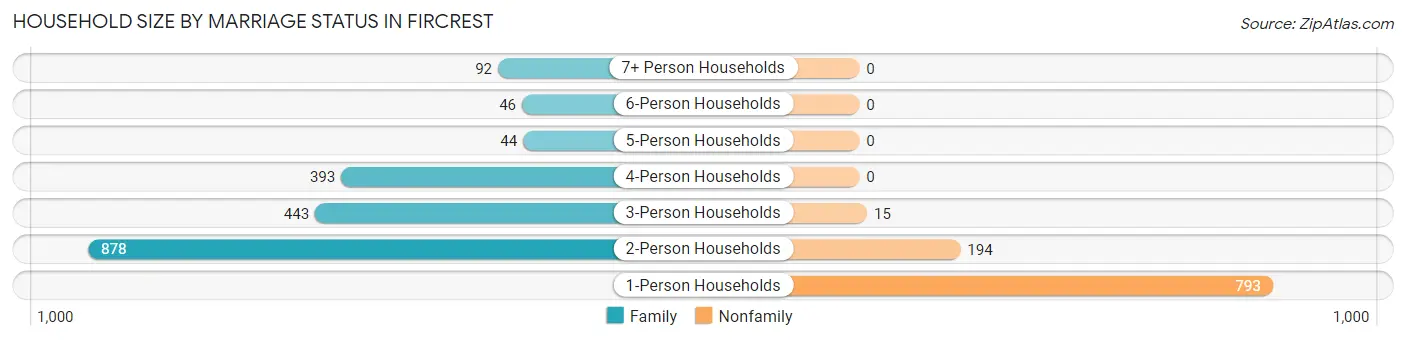
| Household Size | Family Households | Nonfamily Households |
| 1-Person Households | - | 793 (27.4%) |
| 2-Person Households | 878 (30.3%) | 194 (6.7%) |
| 3-Person Households | 443 (15.3%) | 15 (0.5%) |
| 4-Person Households | 393 (13.6%) | 0 (0.0%) |
| 5-Person Households | 44 (1.5%) | 0 (0.0%) |
| 6-Person Households | 46 (1.6%) | 0 (0.0%) |
| 7+ Person Households | 92 (3.2%) | 0 (0.0%) |
| Total | 1,896 (65.4%) | 1,002 (34.6%) |
Female Fertility in Fircrest
Fertility by Age in Fircrest
Average fertility rate in Fircrest is 33.0 births per 1,000 women. Women in the age bracket of 35 to 50 years have the highest fertility rate with 57.0 births per 1,000 women. Women in the age bracket of 35 to 50 years acount for 100.0% of all women with births.
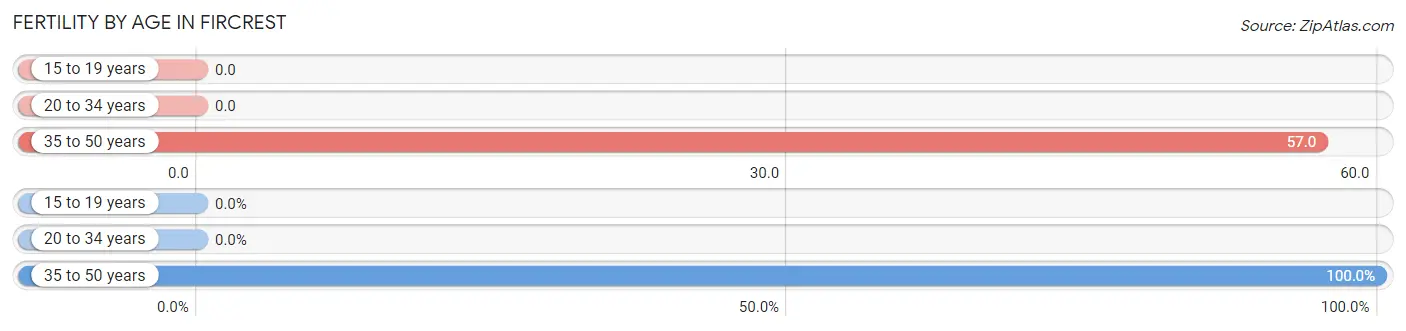
| Age Bracket | Women with Births | Births / 1,000 Women |
| 15 to 19 years | 0 (0.0%) | 0.0 |
| 20 to 34 years | 0 (0.0%) | 0.0 |
| 35 to 50 years | 64 (100.0%) | 57.0 |
| Total | 64 (100.0%) | 33.0 |
Fertility by Age by Marriage Status in Fircrest
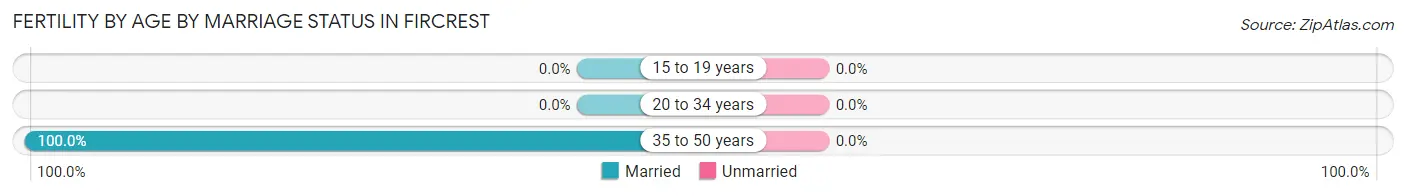
| Age Bracket | Married | Unmarried |
| 15 to 19 years | 0 (0.0%) | 0 (0.0%) |
| 20 to 34 years | 0 (0.0%) | 0 (0.0%) |
| 35 to 50 years | 64 (100.0%) | 0 (0.0%) |
| Total | 64 (100.0%) | 0 (0.0%) |
Fertility by Education in Fircrest
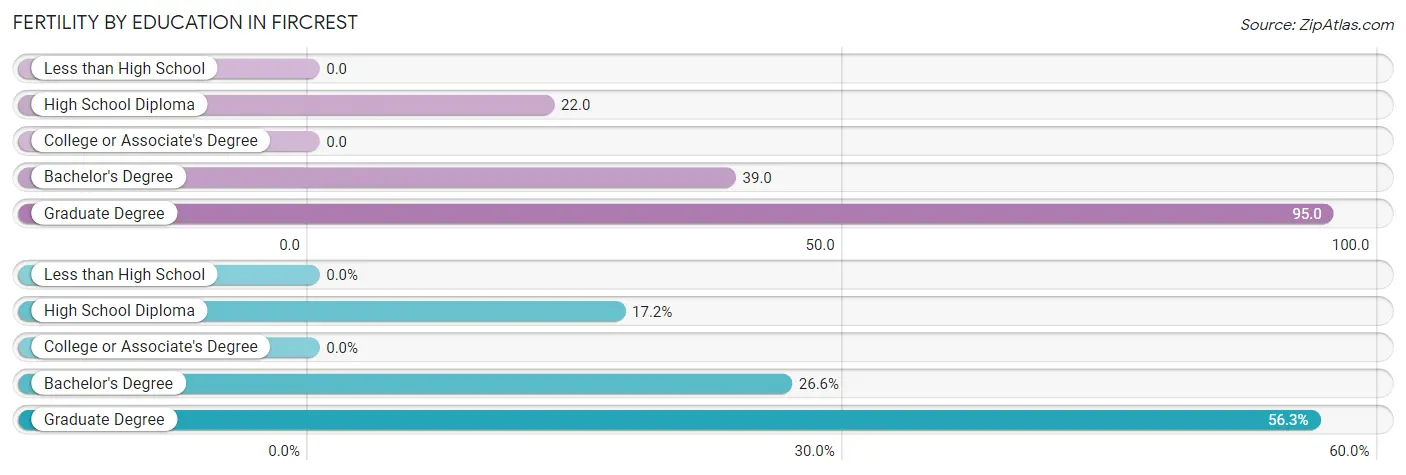
| Educational Attainment | Women with Births | Births / 1,000 Women |
| Less than High School | 0 (0.0%) | 0.0 |
| High School Diploma | 11 (17.2%) | 22.0 |
| College or Associate's Degree | 0 (0.0%) | 0.0 |
| Bachelor's Degree | 17 (26.6%) | 39.0 |
| Graduate Degree | 36 (56.2%) | 95.0 |
| Total | 64 (100.0%) | 33.0 |
Fertility by Education by Marriage Status in Fircrest
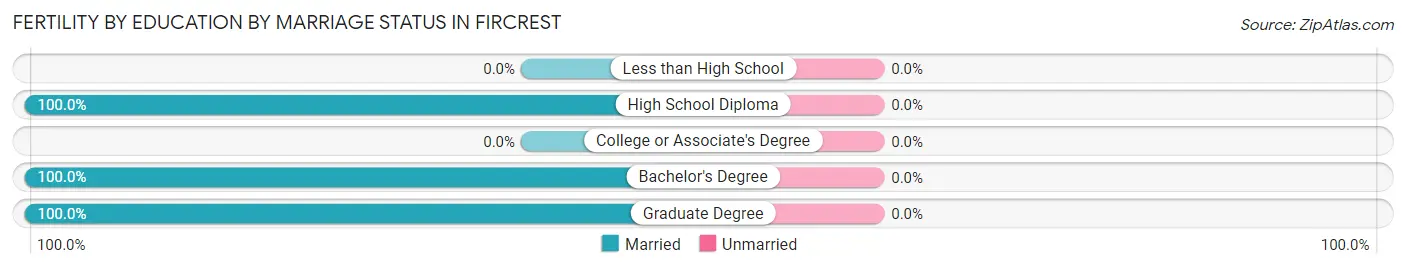
| Educational Attainment | Married | Unmarried |
| Less than High School | 0 (0.0%) | 0 (0.0%) |
| High School Diploma | 11 (100.0%) | 0 (0.0%) |
| College or Associate's Degree | 0 (0.0%) | 0 (0.0%) |
| Bachelor's Degree | 17 (100.0%) | 0 (0.0%) |
| Graduate Degree | 36 (100.0%) | 0 (0.0%) |
| Total | 64 (100.0%) | 0 (0.0%) |
Employment Characteristics in Fircrest
Employment by Class of Employer in Fircrest
Among the 3,576 employed individuals in Fircrest, private company employees (2,075 | 58.0%), not-for-profit organizations (435 | 12.2%), and local government employees (403 | 11.3%) make up the most common classes of employment.
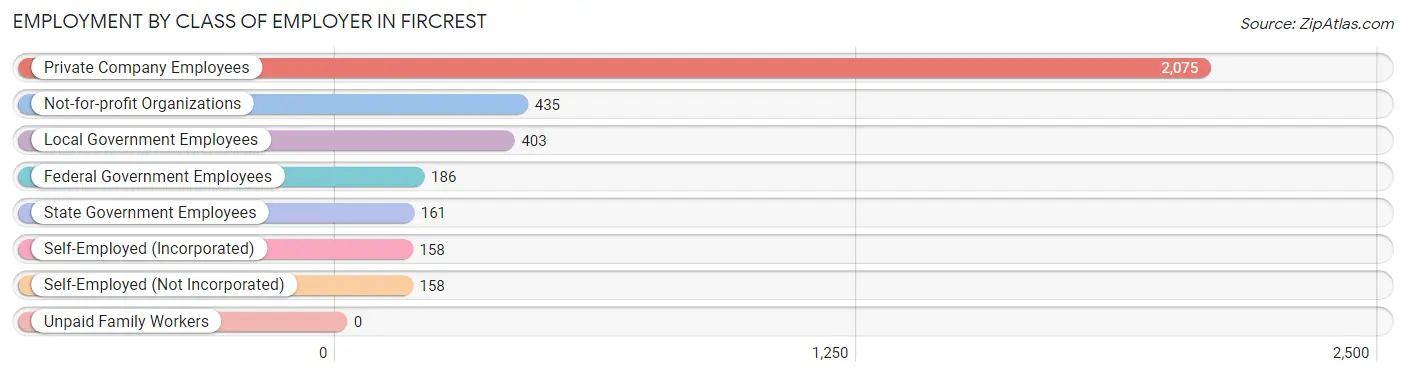
| Employer Class | # Employees | % Employees |
| Private Company Employees | 2,075 | 58.0% |
| Self-Employed (Incorporated) | 158 | 4.4% |
| Self-Employed (Not Incorporated) | 158 | 4.4% |
| Not-for-profit Organizations | 435 | 12.2% |
| Local Government Employees | 403 | 11.3% |
| State Government Employees | 161 | 4.5% |
| Federal Government Employees | 186 | 5.2% |
| Unpaid Family Workers | 0 | 0.0% |
| Total | 3,576 | 100.0% |
Employment Status by Age in Fircrest
According to the labor force statistics for Fircrest, out of the total population over 16 years of age (5,879), 67.2% or 3,951 individuals are in the labor force, with 8.1% or 320 of them unemployed. The age group with the highest labor force participation rate is 35 to 44 years, with 93.2% or 1,057 individuals in the labor force. Within the labor force, the 20 to 24 years age range has the highest percentage of unemployed individuals, with 42.3% or 150 of them being unemployed.
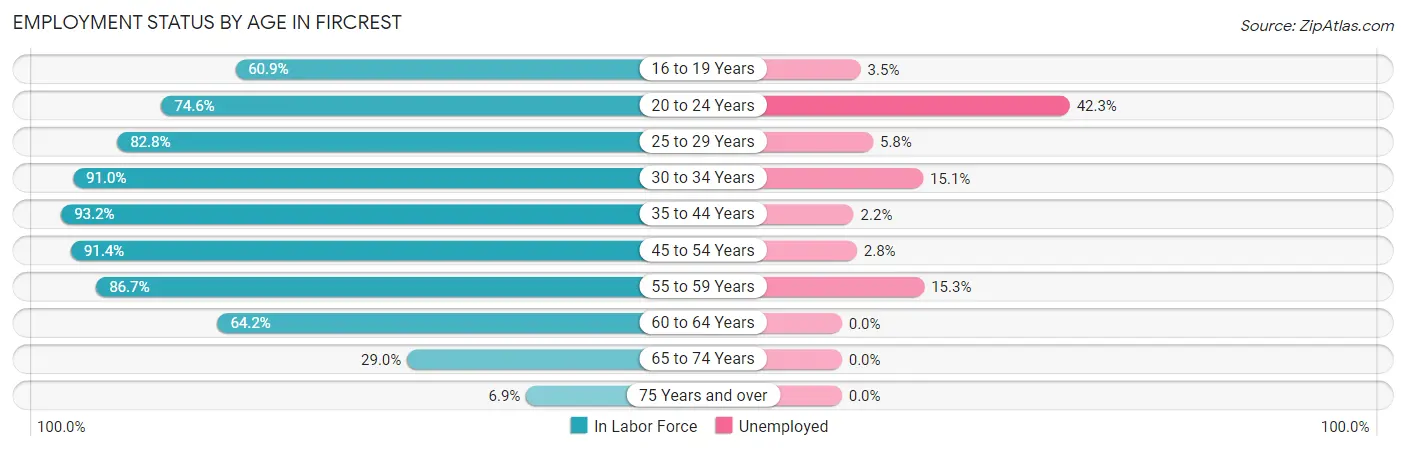
| Age Bracket | In Labor Force | Unemployed |
| 16 to 19 Years | 198 (60.9%) | 7 (3.5%) |
| 20 to 24 Years | 355 (74.6%) | 150 (42.3%) |
| 25 to 29 Years | 173 (82.8%) | 10 (5.8%) |
| 30 to 34 Years | 305 (91.0%) | 46 (15.1%) |
| 35 to 44 Years | 1,057 (93.2%) | 23 (2.2%) |
| 45 to 54 Years | 914 (91.4%) | 26 (2.8%) |
| 55 to 59 Years | 379 (86.7%) | 58 (15.3%) |
| 60 to 64 Years | 303 (64.2%) | 0 (0.0%) |
| 65 to 74 Years | 218 (29.0%) | 0 (0.0%) |
| 75 Years and over | 51 (6.9%) | 0 (0.0%) |
| Total | 3,951 (67.2%) | 320 (8.1%) |
Employment Status by Educational Attainment in Fircrest
According to labor force statistics for Fircrest, 87.3% of individuals (3,131) out of the total population between 25 and 64 years of age (3,587) are in the labor force, with 5.2% or 163 of them being unemployed. The group with the highest labor force participation rate are those with the educational attainment of bachelor's degree or higher, with 93.3% or 1,457 individuals in the labor force. Within the labor force, individuals with high school diploma education have the highest percentage of unemployment, with 15.3% or 104 of them being unemployed.
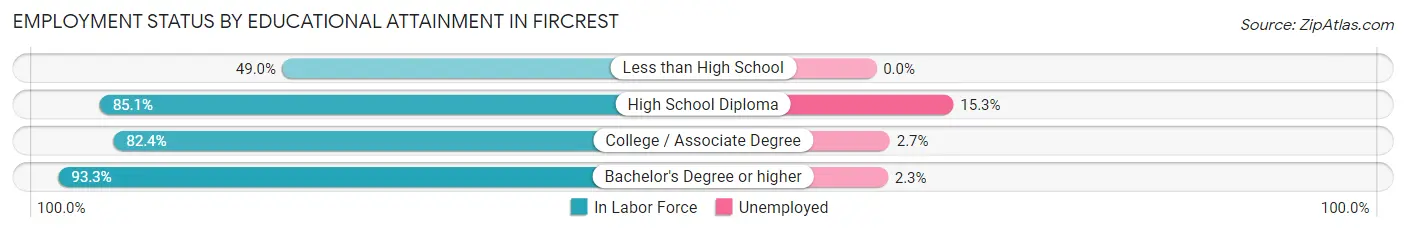
| Educational Attainment | In Labor Force | Unemployed |
| Less than High School | 25 (49.0%) | 0 (0.0%) |
| High School Diploma | 678 (85.1%) | 122 (15.3%) |
| College / Associate Degree | 970 (82.4%) | 32 (2.7%) |
| Bachelor's Degree or higher | 1,457 (93.3%) | 36 (2.3%) |
| Total | 3,131 (87.3%) | 187 (5.2%) |
Employment Occupations by Sex in Fircrest
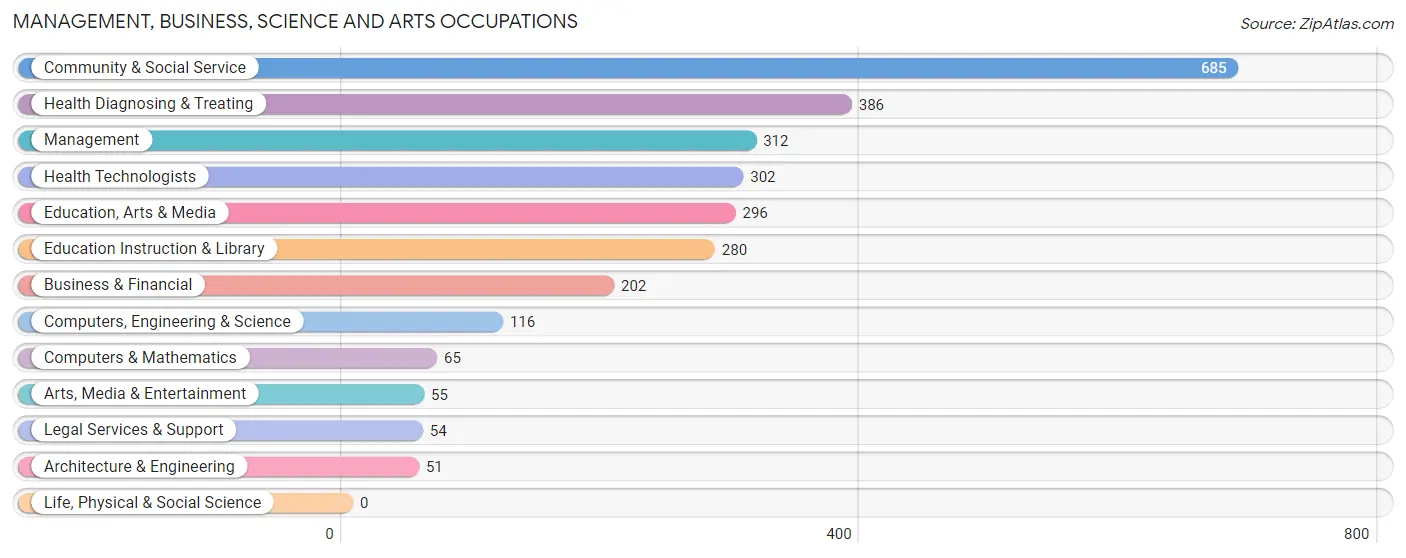
Management, Business, Science and Arts Occupations
The most common Management, Business, Science and Arts occupations in Fircrest are Community & Social Service (685 | 18.9%), Health Diagnosing & Treating (386 | 10.6%), Management (312 | 8.6%), Health Technologists (302 | 8.3%), and Education, Arts & Media (296 | 8.2%).
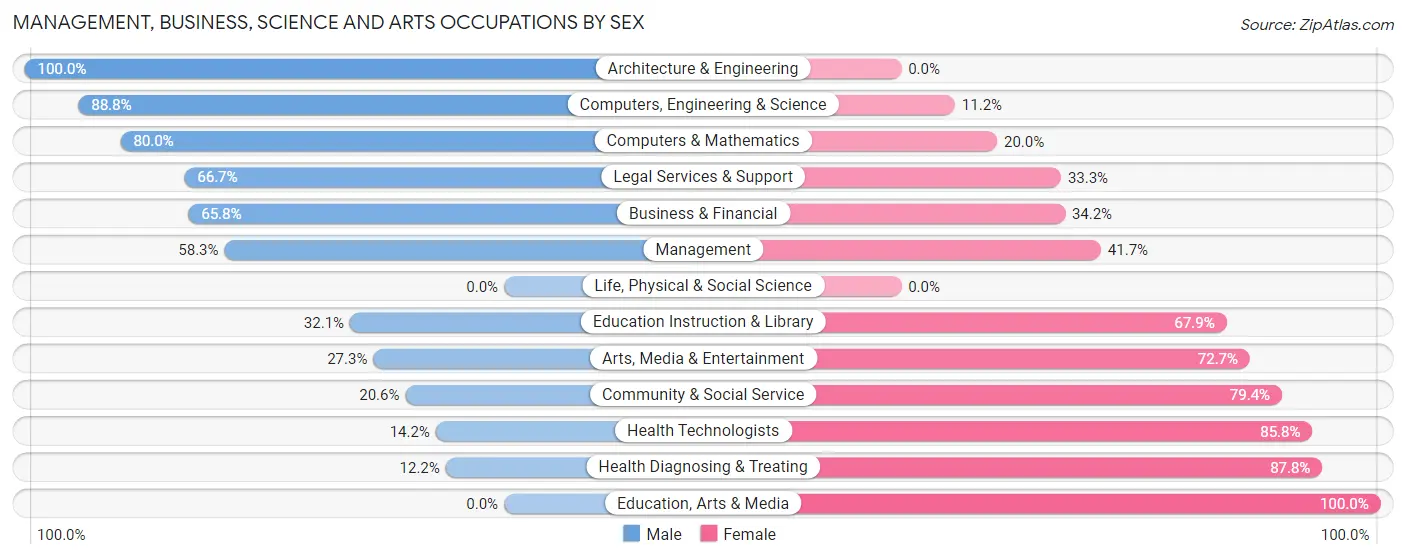
Management, Business, Science and Arts Occupations by Sex
Within the Management, Business, Science and Arts occupations in Fircrest, the most male-oriented occupations are Architecture & Engineering (100.0%), Computers, Engineering & Science (88.8%), and Computers & Mathematics (80.0%), while the most female-oriented occupations are Education, Arts & Media (100.0%), Health Diagnosing & Treating (87.8%), and Health Technologists (85.8%).
| Occupation | Male | Female |
| Management | 182 (58.3%) | 130 (41.7%) |
| Business & Financial | 133 (65.8%) | 69 (34.2%) |
| Computers, Engineering & Science | 103 (88.8%) | 13 (11.2%) |
| Computers & Mathematics | 52 (80.0%) | 13 (20.0%) |
| Architecture & Engineering | 51 (100.0%) | 0 (0.0%) |
| Life, Physical & Social Science | 0 (0.0%) | 0 (0.0%) |
| Community & Social Service | 141 (20.6%) | 544 (79.4%) |
| Education, Arts & Media | 0 (0.0%) | 296 (100.0%) |
| Legal Services & Support | 36 (66.7%) | 18 (33.3%) |
| Education Instruction & Library | 90 (32.1%) | 190 (67.9%) |
| Arts, Media & Entertainment | 15 (27.3%) | 40 (72.7%) |
| Health Diagnosing & Treating | 47 (12.2%) | 339 (87.8%) |
| Health Technologists | 43 (14.2%) | 259 (85.8%) |
| Total (Category) | 606 (35.6%) | 1,095 (64.4%) |
| Total (Overall) | 1,493 (41.1%) | 2,140 (58.9%) |
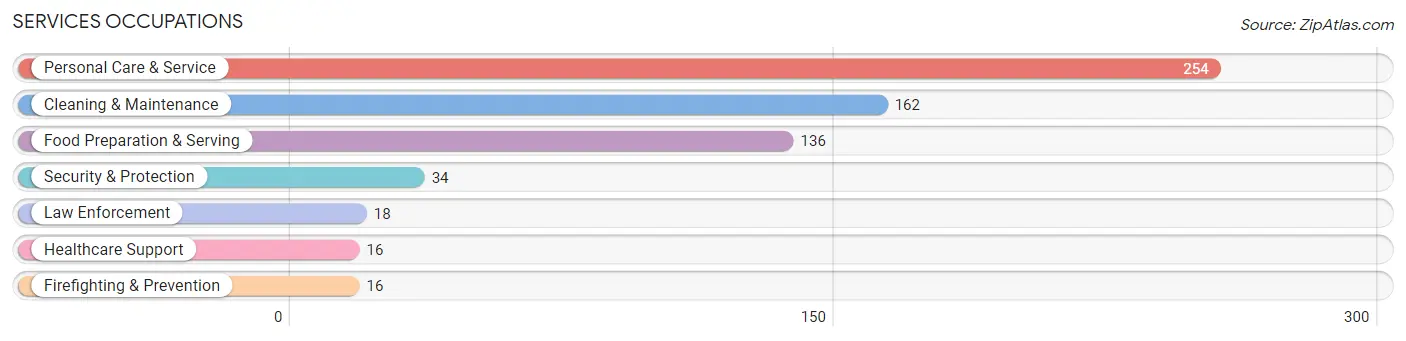
Services Occupations
The most common Services occupations in Fircrest are Personal Care & Service (254 | 7.0%), Cleaning & Maintenance (162 | 4.5%), Food Preparation & Serving (136 | 3.7%), Security & Protection (34 | 0.9%), and Law Enforcement (18 | 0.5%).
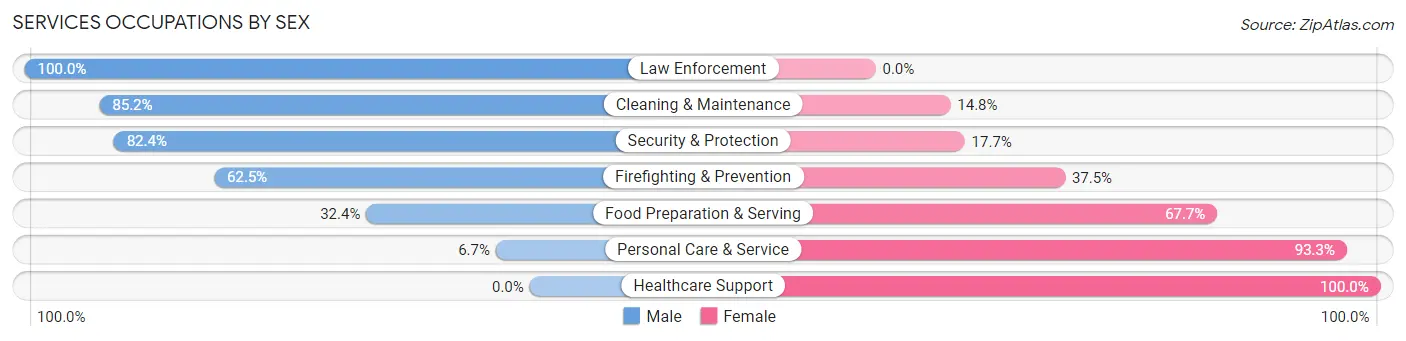
Services Occupations by Sex
Within the Services occupations in Fircrest, the most male-oriented occupations are Law Enforcement (100.0%), Cleaning & Maintenance (85.2%), and Security & Protection (82.4%), while the most female-oriented occupations are Healthcare Support (100.0%), Personal Care & Service (93.3%), and Food Preparation & Serving (67.6%).
| Occupation | Male | Female |
| Healthcare Support | 0 (0.0%) | 16 (100.0%) |
| Security & Protection | 28 (82.4%) | 6 (17.6%) |
| Firefighting & Prevention | 10 (62.5%) | 6 (37.5%) |
| Law Enforcement | 18 (100.0%) | 0 (0.0%) |
| Food Preparation & Serving | 44 (32.4%) | 92 (67.6%) |
| Cleaning & Maintenance | 138 (85.2%) | 24 (14.8%) |
| Personal Care & Service | 17 (6.7%) | 237 (93.3%) |
| Total (Category) | 227 (37.7%) | 375 (62.3%) |
| Total (Overall) | 1,493 (41.1%) | 2,140 (58.9%) |
Sales and Office Occupations
The most common Sales and Office occupations in Fircrest are Office & Administration (563 | 15.5%), and Sales & Related (196 | 5.4%).
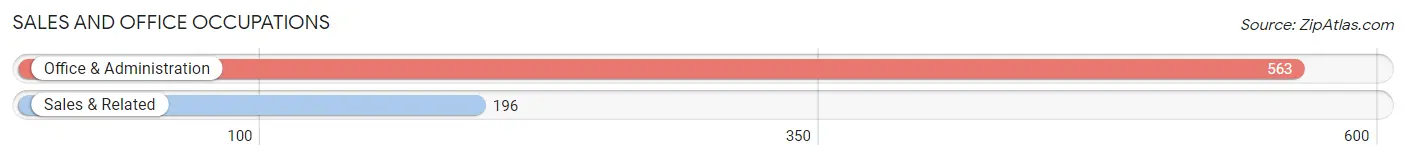
Sales and Office Occupations by Sex
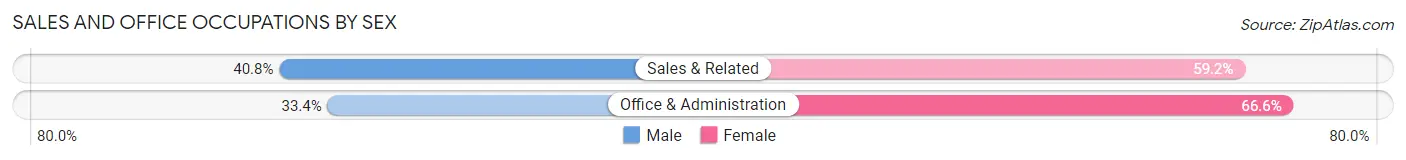
| Occupation | Male | Female |
| Sales & Related | 80 (40.8%) | 116 (59.2%) |
| Office & Administration | 188 (33.4%) | 375 (66.6%) |
| Total (Category) | 268 (35.3%) | 491 (64.7%) |
| Total (Overall) | 1,493 (41.1%) | 2,140 (58.9%) |
Natural Resources, Construction and Maintenance Occupations
The most common Natural Resources, Construction and Maintenance occupations in Fircrest are Construction & Extraction (100 | 2.8%), and Installation, Maintenance & Repair (38 | 1.1%).
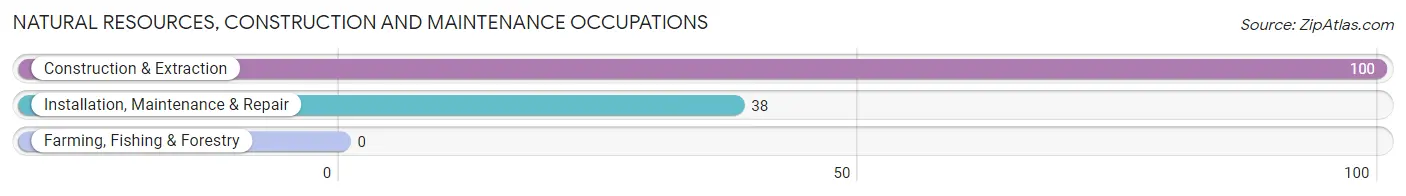
Natural Resources, Construction and Maintenance Occupations by Sex
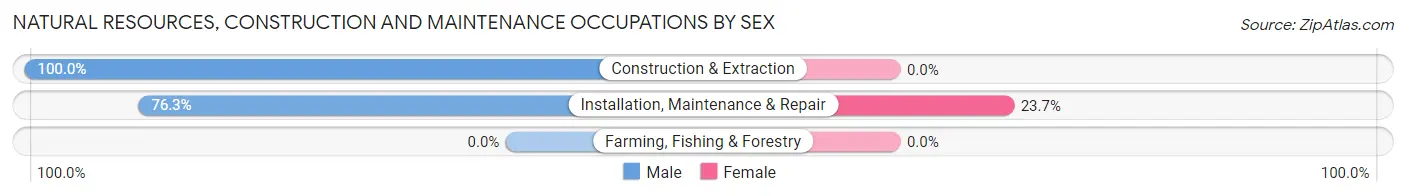
| Occupation | Male | Female |
| Farming, Fishing & Forestry | 0 (0.0%) | 0 (0.0%) |
| Construction & Extraction | 100 (100.0%) | 0 (0.0%) |
| Installation, Maintenance & Repair | 29 (76.3%) | 9 (23.7%) |
| Total (Category) | 129 (93.5%) | 9 (6.5%) |
| Total (Overall) | 1,493 (41.1%) | 2,140 (58.9%) |
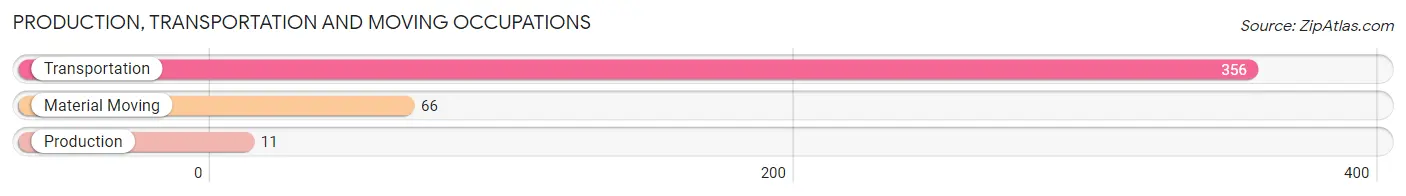
Production, Transportation and Moving Occupations
The most common Production, Transportation and Moving occupations in Fircrest are Transportation (356 | 9.8%), Material Moving (66 | 1.8%), and Production (11 | 0.3%).
Production, Transportation and Moving Occupations by Sex
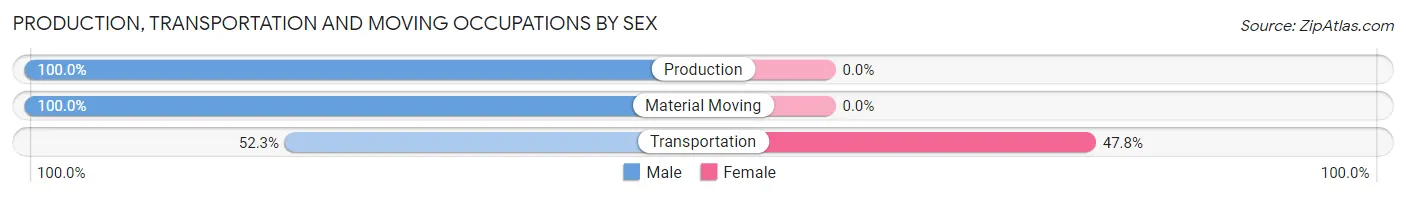
| Occupation | Male | Female |
| Production | 11 (100.0%) | 0 (0.0%) |
| Transportation | 186 (52.2%) | 170 (47.7%) |
| Material Moving | 66 (100.0%) | 0 (0.0%) |
| Total (Category) | 263 (60.7%) | 170 (39.3%) |
| Total (Overall) | 1,493 (41.1%) | 2,140 (58.9%) |
Employment Industries by Sex in Fircrest
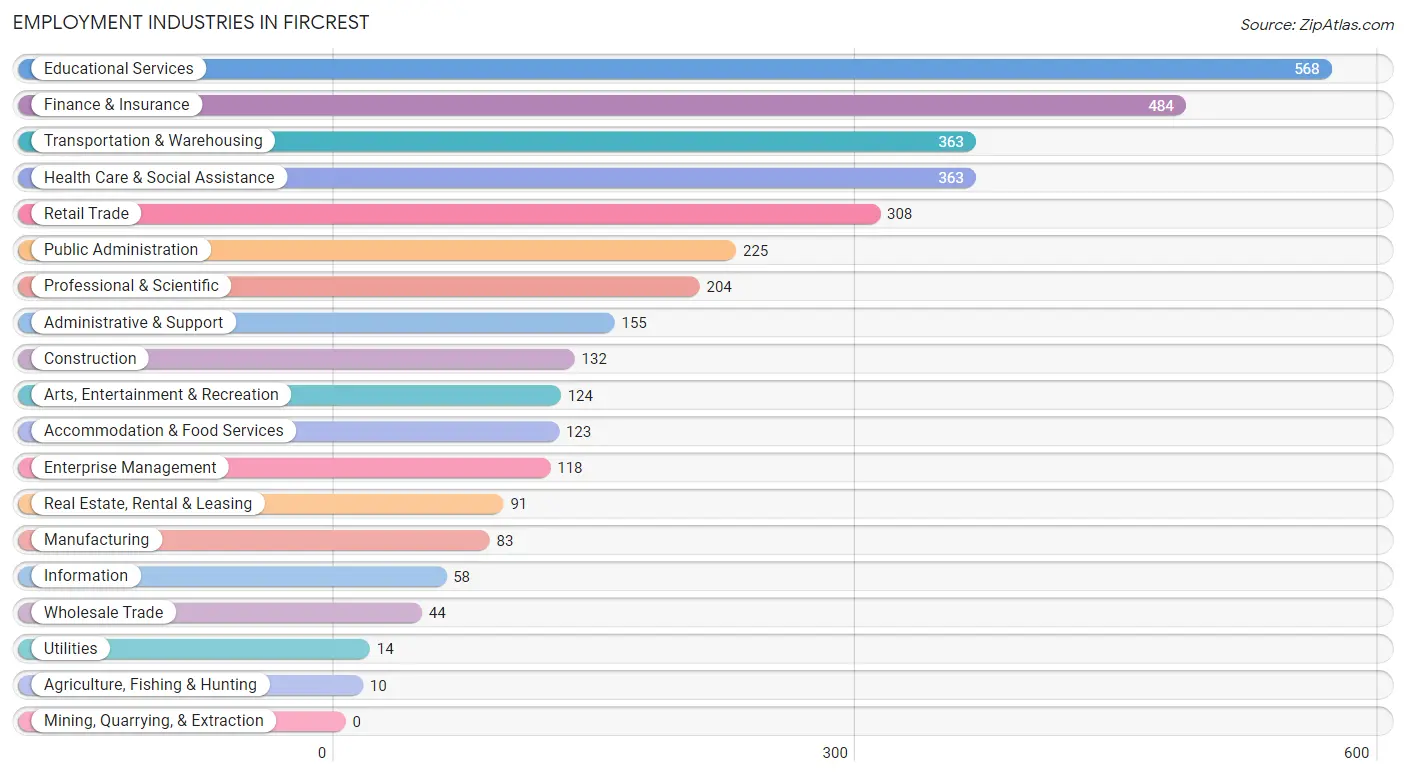
Employment Industries in Fircrest
The major employment industries in Fircrest include Educational Services (568 | 15.6%), Finance & Insurance (484 | 13.3%), Transportation & Warehousing (363 | 10.0%), Health Care & Social Assistance (363 | 10.0%), and Retail Trade (308 | 8.5%).
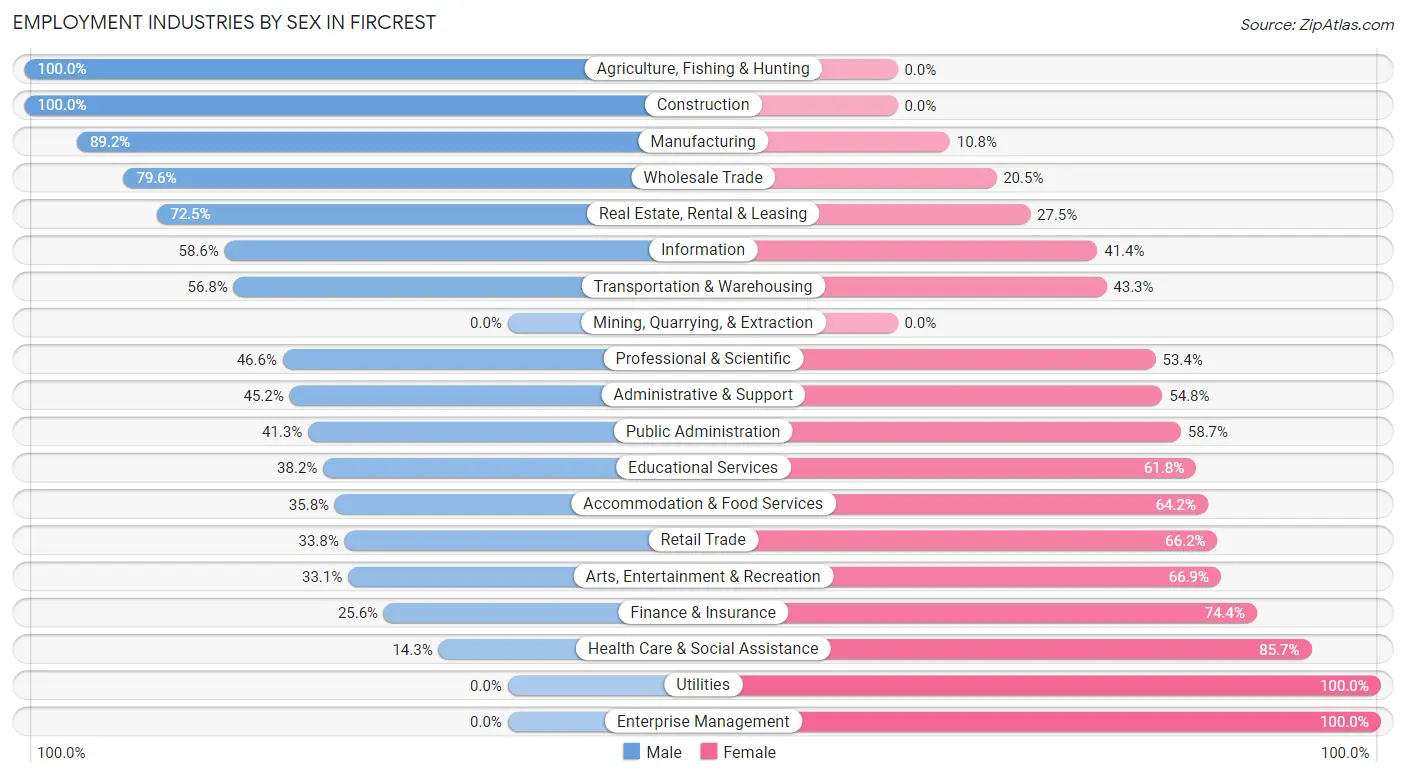
Employment Industries by Sex in Fircrest
The Fircrest industries that see more men than women are Agriculture, Fishing & Hunting (100.0%), Construction (100.0%), and Manufacturing (89.2%), whereas the industries that tend to have a higher number of women are Utilities (100.0%), Enterprise Management (100.0%), and Health Care & Social Assistance (85.7%).
| Industry | Male | Female |
| Agriculture, Fishing & Hunting | 10 (100.0%) | 0 (0.0%) |
| Mining, Quarrying, & Extraction | 0 (0.0%) | 0 (0.0%) |
| Construction | 132 (100.0%) | 0 (0.0%) |
| Manufacturing | 74 (89.2%) | 9 (10.8%) |
| Wholesale Trade | 35 (79.5%) | 9 (20.4%) |
| Retail Trade | 104 (33.8%) | 204 (66.2%) |
| Transportation & Warehousing | 206 (56.8%) | 157 (43.2%) |
| Utilities | 0 (0.0%) | 14 (100.0%) |
| Information | 34 (58.6%) | 24 (41.4%) |
| Finance & Insurance | 124 (25.6%) | 360 (74.4%) |
| Real Estate, Rental & Leasing | 66 (72.5%) | 25 (27.5%) |
| Professional & Scientific | 95 (46.6%) | 109 (53.4%) |
| Enterprise Management | 0 (0.0%) | 118 (100.0%) |
| Administrative & Support | 70 (45.2%) | 85 (54.8%) |
| Educational Services | 217 (38.2%) | 351 (61.8%) |
| Health Care & Social Assistance | 52 (14.3%) | 311 (85.7%) |
| Arts, Entertainment & Recreation | 41 (33.1%) | 83 (66.9%) |
| Accommodation & Food Services | 44 (35.8%) | 79 (64.2%) |
| Public Administration | 93 (41.3%) | 132 (58.7%) |
| Total | 1,493 (41.1%) | 2,140 (58.9%) |
Education in Fircrest
School Enrollment in Fircrest
The most common levels of schooling among the 1,576 students in Fircrest are college / undergraduate (389 | 24.7%), elementary school (382 | 24.2%), and high school (289 | 18.3%).
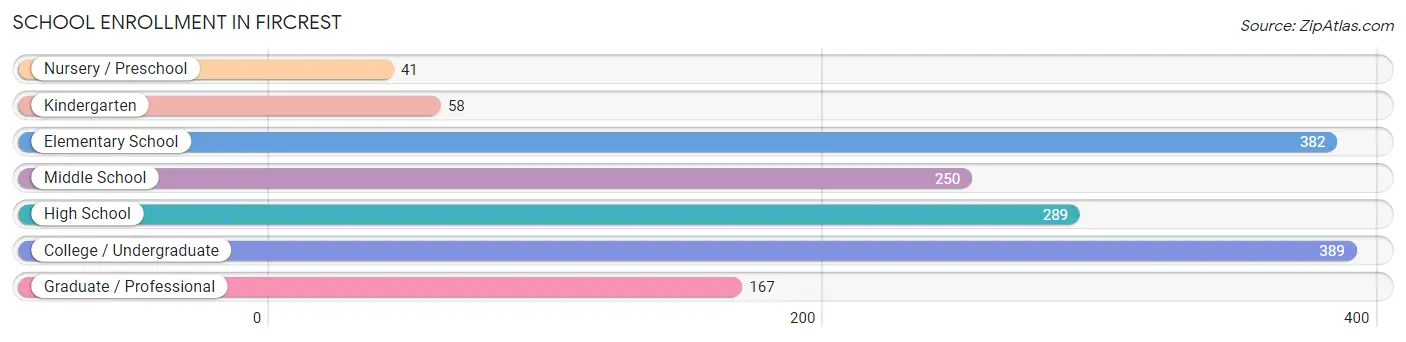
| School Level | # Students | % Students |
| Nursery / Preschool | 41 | 2.6% |
| Kindergarten | 58 | 3.7% |
| Elementary School | 382 | 24.2% |
| Middle School | 250 | 15.9% |
| High School | 289 | 18.3% |
| College / Undergraduate | 389 | 24.7% |
| Graduate / Professional | 167 | 10.6% |
| Total | 1,576 | 100.0% |
School Enrollment by Age by Funding Source in Fircrest
Out of a total of 1,576 students who are enrolled in schools in Fircrest, 320 (20.3%) attend a private institution, while the remaining 1,256 (79.7%) are enrolled in public schools. The age group of 3 to 4 year olds has the highest likelihood of being enrolled in private schools, with 34 (100.0% in the age bracket) enrolled. Conversely, the age group of 15 to 17 year olds has the lowest likelihood of being enrolled in a private school, with 230 (100.0% in the age bracket) attending a public institution.
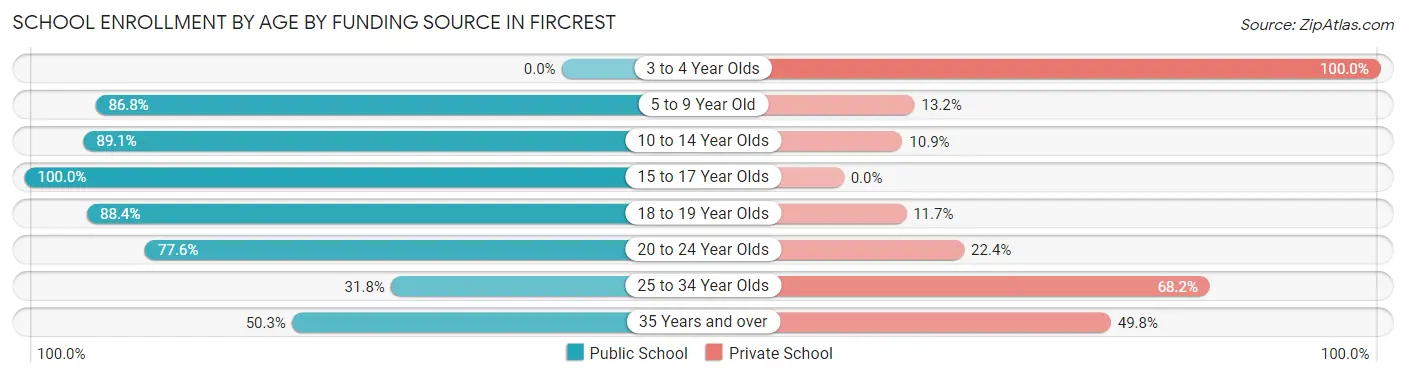
| Age Bracket | Public School | Private School |
| 3 to 4 Year Olds | 0 (0.0%) | 34 (100.0%) |
| 5 to 9 Year Old | 388 (86.8%) | 59 (13.2%) |
| 10 to 14 Year Olds | 236 (89.1%) | 29 (10.9%) |
| 15 to 17 Year Olds | 230 (100.0%) | 0 (0.0%) |
| 18 to 19 Year Olds | 91 (88.3%) | 12 (11.7%) |
| 20 to 24 Year Olds | 197 (77.6%) | 57 (22.4%) |
| 25 to 34 Year Olds | 14 (31.8%) | 30 (68.2%) |
| 35 Years and over | 100 (50.2%) | 99 (49.7%) |
| Total | 1,256 (79.7%) | 320 (20.3%) |
Educational Attainment by Field of Study in Fircrest
Education (546 | 22.4%), business (501 | 20.5%), science & technology (179 | 7.3%), liberal arts & history (169 | 6.9%), and communications (167 | 6.9%) are the most common fields of study among 2,439 individuals in Fircrest who have obtained a bachelor's degree or higher.
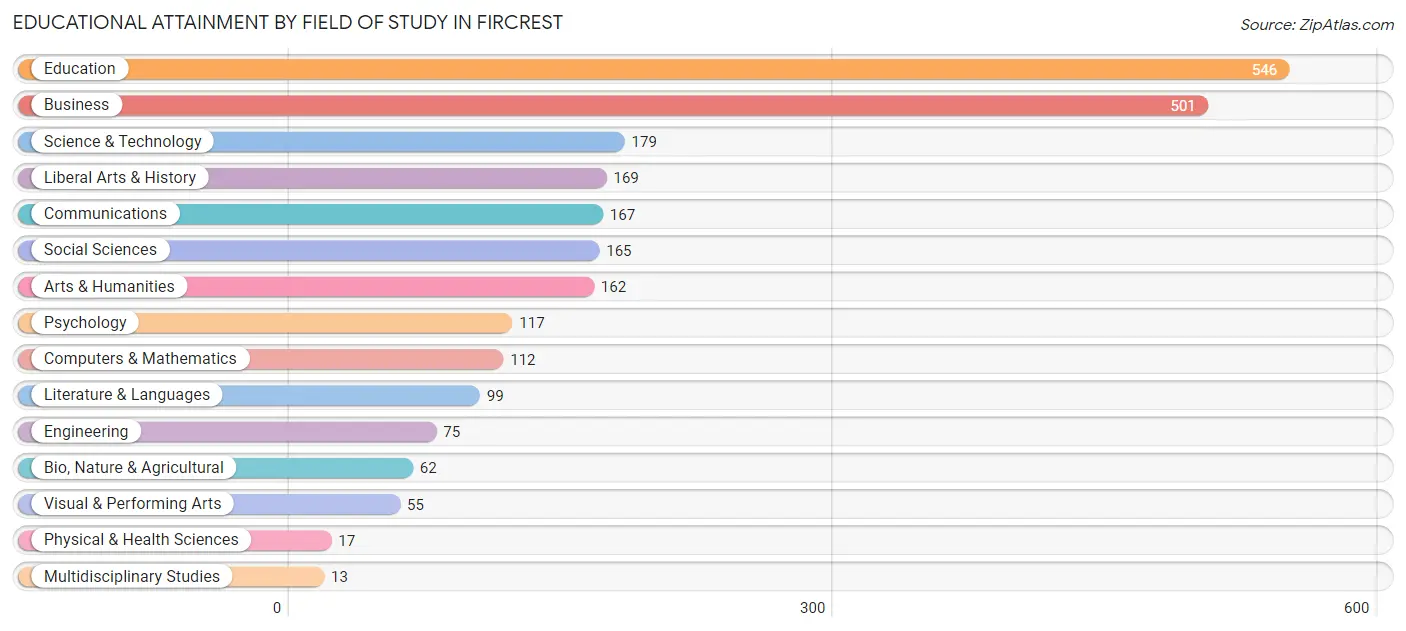
| Field of Study | # Graduates | % Graduates |
| Computers & Mathematics | 112 | 4.6% |
| Bio, Nature & Agricultural | 62 | 2.5% |
| Physical & Health Sciences | 17 | 0.7% |
| Psychology | 117 | 4.8% |
| Social Sciences | 165 | 6.8% |
| Engineering | 75 | 3.1% |
| Multidisciplinary Studies | 13 | 0.5% |
| Science & Technology | 179 | 7.3% |
| Business | 501 | 20.5% |
| Education | 546 | 22.4% |
| Literature & Languages | 99 | 4.1% |
| Liberal Arts & History | 169 | 6.9% |
| Visual & Performing Arts | 55 | 2.3% |
| Communications | 167 | 6.9% |
| Arts & Humanities | 162 | 6.6% |
| Total | 2,439 | 100.0% |
Transportation & Commute in Fircrest
Vehicle Availability by Sex in Fircrest
The most prevalent vehicle ownership categories in Fircrest are males with 2 vehicles (647, accounting for 43.7%) and females with 2 vehicles (1,027, making up 31.0%).
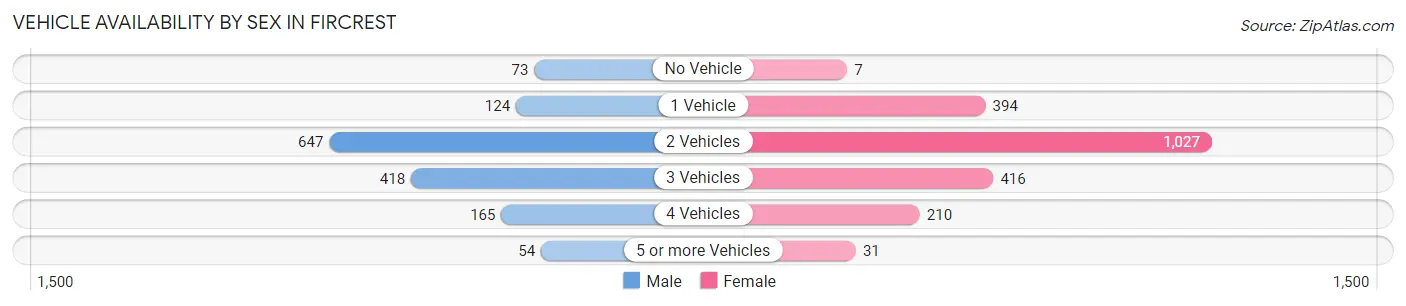
| Vehicles Available | Male | Female |
| No Vehicle | 73 (4.9%) | 7 (0.3%) |
| 1 Vehicle | 124 (8.4%) | 394 (18.9%) |
| 2 Vehicles | 647 (43.7%) | 1,027 (49.3%) |
| 3 Vehicles | 418 (28.2%) | 416 (20.0%) |
| 4 Vehicles | 165 (11.1%) | 210 (10.1%) |
| 5 or more Vehicles | 54 (3.6%) | 31 (1.5%) |
| Total | 1,481 (100.0%) | 2,085 (100.0%) |
Commute Time in Fircrest
The most frequently occuring commute durations in Fircrest are 15 to 19 minutes (720 commuters, 24.1%), 10 to 14 minutes (512 commuters, 17.1%), and 20 to 24 minutes (417 commuters, 13.9%).
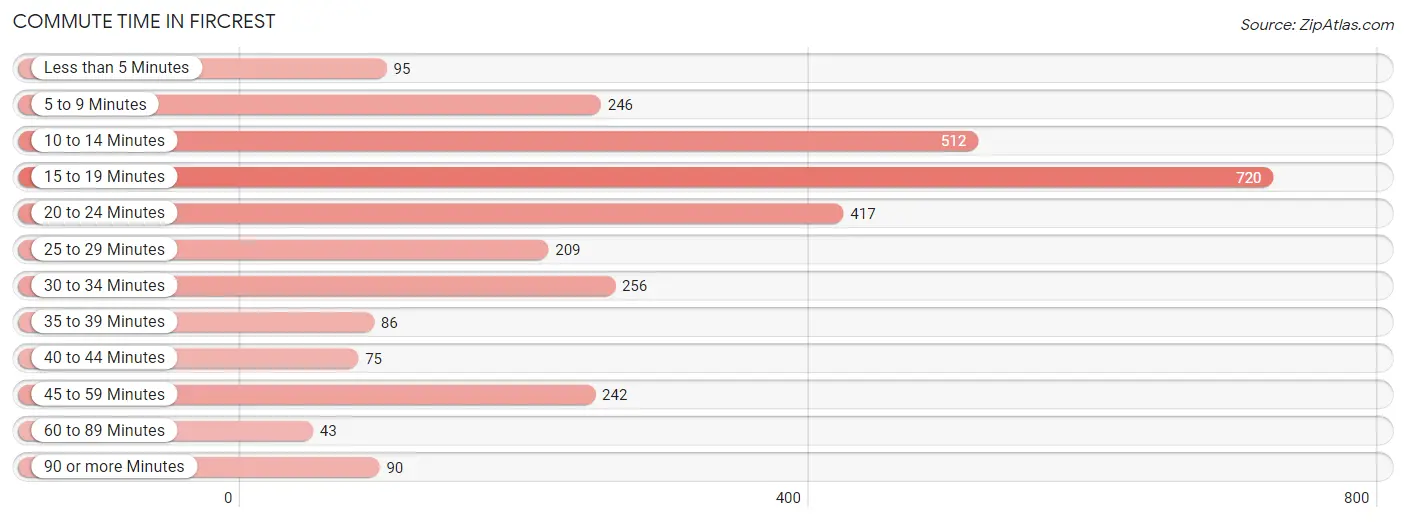
| Commute Time | # Commuters | % Commuters |
| Less than 5 Minutes | 95 | 3.2% |
| 5 to 9 Minutes | 246 | 8.2% |
| 10 to 14 Minutes | 512 | 17.1% |
| 15 to 19 Minutes | 720 | 24.1% |
| 20 to 24 Minutes | 417 | 13.9% |
| 25 to 29 Minutes | 209 | 7.0% |
| 30 to 34 Minutes | 256 | 8.6% |
| 35 to 39 Minutes | 86 | 2.9% |
| 40 to 44 Minutes | 75 | 2.5% |
| 45 to 59 Minutes | 242 | 8.1% |
| 60 to 89 Minutes | 43 | 1.4% |
| 90 or more Minutes | 90 | 3.0% |
Commute Time by Sex in Fircrest
The most common commute times in Fircrest are 10 to 14 minutes (284 commuters, 21.6%) for males and 15 to 19 minutes (514 commuters, 30.6%) for females.
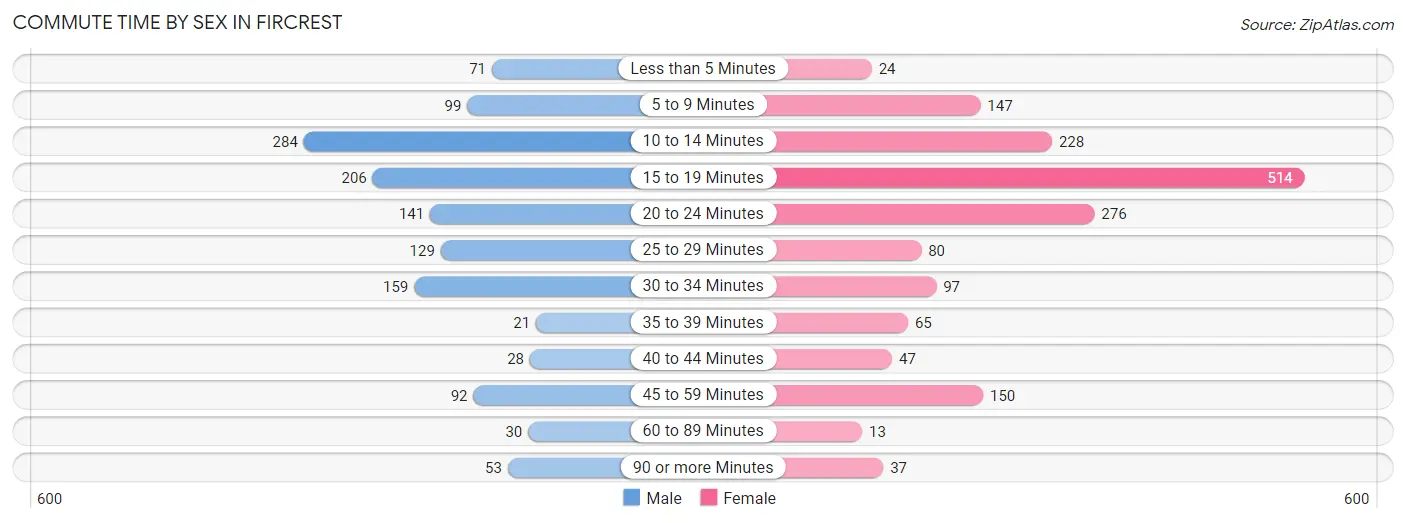
| Commute Time | Male | Female |
| Less than 5 Minutes | 71 (5.4%) | 24 (1.4%) |
| 5 to 9 Minutes | 99 (7.5%) | 147 (8.8%) |
| 10 to 14 Minutes | 284 (21.6%) | 228 (13.6%) |
| 15 to 19 Minutes | 206 (15.7%) | 514 (30.6%) |
| 20 to 24 Minutes | 141 (10.7%) | 276 (16.5%) |
| 25 to 29 Minutes | 129 (9.8%) | 80 (4.8%) |
| 30 to 34 Minutes | 159 (12.1%) | 97 (5.8%) |
| 35 to 39 Minutes | 21 (1.6%) | 65 (3.9%) |
| 40 to 44 Minutes | 28 (2.1%) | 47 (2.8%) |
| 45 to 59 Minutes | 92 (7.0%) | 150 (8.9%) |
| 60 to 89 Minutes | 30 (2.3%) | 13 (0.8%) |
| 90 or more Minutes | 53 (4.0%) | 37 (2.2%) |
Time of Departure to Work by Sex in Fircrest
The most frequent times of departure to work in Fircrest are 6:30 AM to 6:59 AM (295, 22.5%) for males and 12:00 PM to 3:59 PM (295, 17.6%) for females.
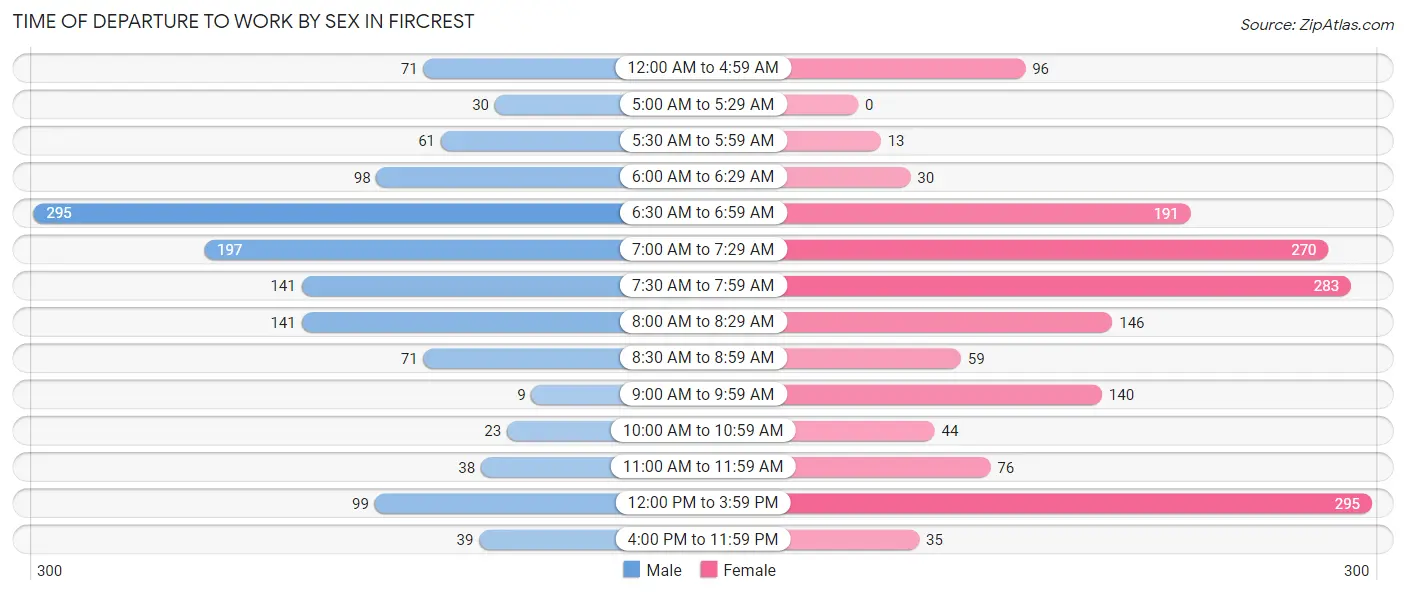
| Time of Departure | Male | Female |
| 12:00 AM to 4:59 AM | 71 (5.4%) | 96 (5.7%) |
| 5:00 AM to 5:29 AM | 30 (2.3%) | 0 (0.0%) |
| 5:30 AM to 5:59 AM | 61 (4.6%) | 13 (0.8%) |
| 6:00 AM to 6:29 AM | 98 (7.5%) | 30 (1.8%) |
| 6:30 AM to 6:59 AM | 295 (22.5%) | 191 (11.4%) |
| 7:00 AM to 7:29 AM | 197 (15.0%) | 270 (16.1%) |
| 7:30 AM to 7:59 AM | 141 (10.7%) | 283 (16.9%) |
| 8:00 AM to 8:29 AM | 141 (10.7%) | 146 (8.7%) |
| 8:30 AM to 8:59 AM | 71 (5.4%) | 59 (3.5%) |
| 9:00 AM to 9:59 AM | 9 (0.7%) | 140 (8.3%) |
| 10:00 AM to 10:59 AM | 23 (1.8%) | 44 (2.6%) |
| 11:00 AM to 11:59 AM | 38 (2.9%) | 76 (4.5%) |
| 12:00 PM to 3:59 PM | 99 (7.5%) | 295 (17.6%) |
| 4:00 PM to 11:59 PM | 39 (3.0%) | 35 (2.1%) |
| Total | 1,313 (100.0%) | 1,678 (100.0%) |
Housing Occupancy in Fircrest
Occupancy by Ownership in Fircrest
Of the total 2,898 dwellings in Fircrest, owner-occupied units account for 2,124 (73.3%), while renter-occupied units make up 774 (26.7%).
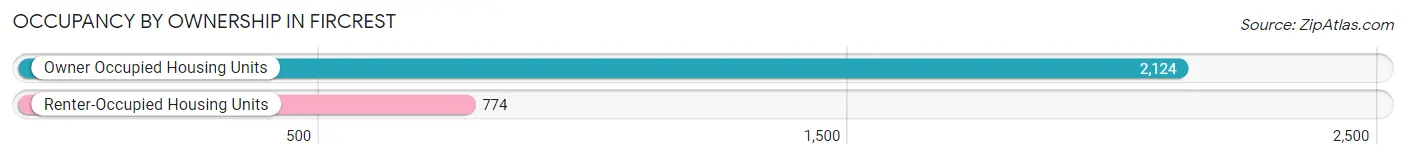
| Occupancy | # Housing Units | % Housing Units |
| Owner Occupied Housing Units | 2,124 | 73.3% |
| Renter-Occupied Housing Units | 774 | 26.7% |
| Total Occupied Housing Units | 2,898 | 100.0% |
Occupancy by Household Size in Fircrest
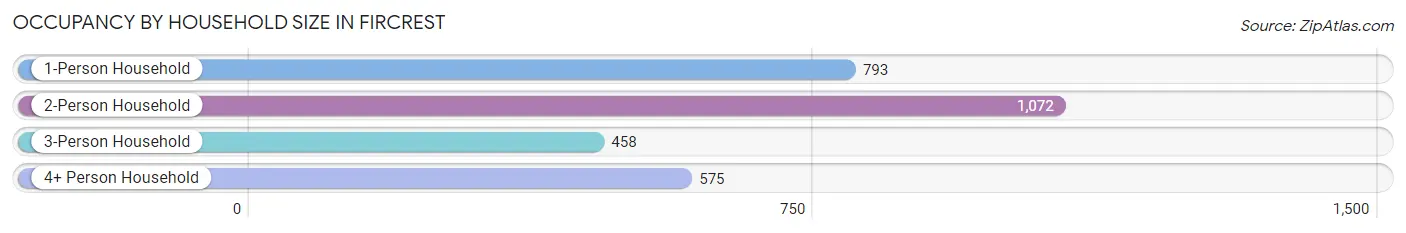
| Household Size | # Housing Units | % Housing Units |
| 1-Person Household | 793 | 27.4% |
| 2-Person Household | 1,072 | 37.0% |
| 3-Person Household | 458 | 15.8% |
| 4+ Person Household | 575 | 19.8% |
| Total Housing Units | 2,898 | 100.0% |
Occupancy by Ownership by Household Size in Fircrest
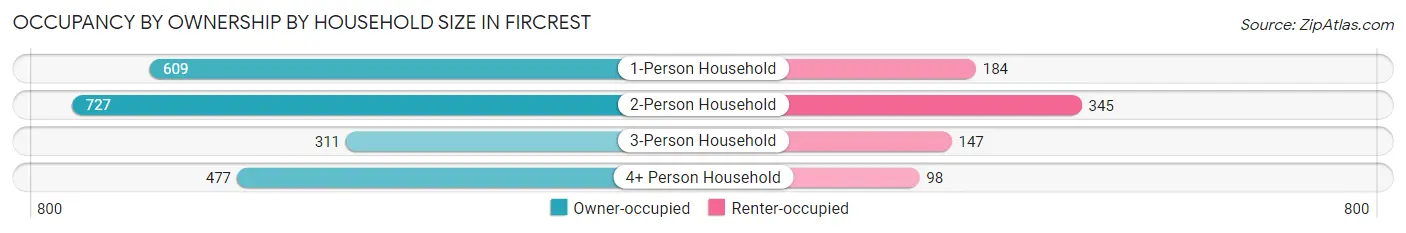
| Household Size | Owner-occupied | Renter-occupied |
| 1-Person Household | 609 (76.8%) | 184 (23.2%) |
| 2-Person Household | 727 (67.8%) | 345 (32.2%) |
| 3-Person Household | 311 (67.9%) | 147 (32.1%) |
| 4+ Person Household | 477 (83.0%) | 98 (17.0%) |
| Total Housing Units | 2,124 (73.3%) | 774 (26.7%) |
Occupancy by Educational Attainment in Fircrest
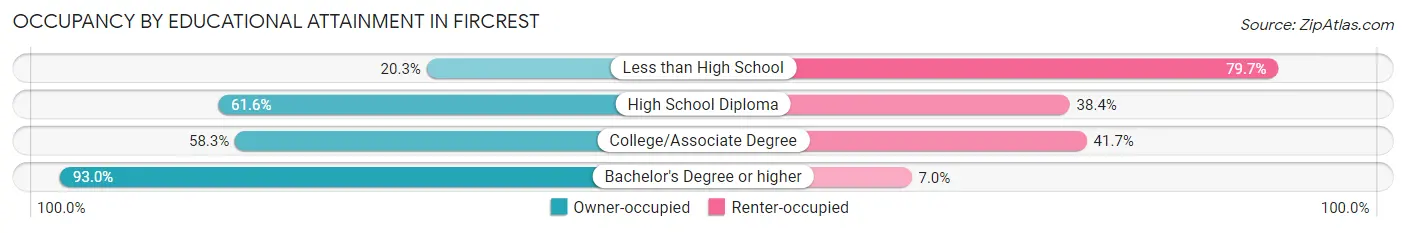
| Household Size | Owner-occupied | Renter-occupied |
| Less than High School | 14 (20.3%) | 55 (79.7%) |
| High School Diploma | 384 (61.6%) | 239 (38.4%) |
| College/Associate Degree | 546 (58.3%) | 391 (41.7%) |
| Bachelor's Degree or higher | 1,180 (93.0%) | 89 (7.0%) |
Occupancy by Age of Householder in Fircrest
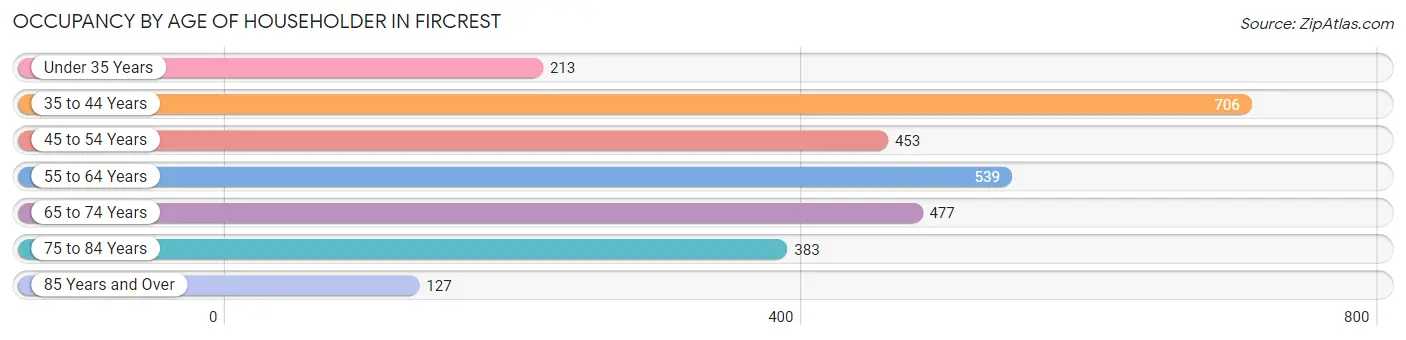
| Age Bracket | # Households | % Households |
| Under 35 Years | 213 | 7.3% |
| 35 to 44 Years | 706 | 24.4% |
| 45 to 54 Years | 453 | 15.6% |
| 55 to 64 Years | 539 | 18.6% |
| 65 to 74 Years | 477 | 16.5% |
| 75 to 84 Years | 383 | 13.2% |
| 85 Years and Over | 127 | 4.4% |
| Total | 2,898 | 100.0% |
Housing Finances in Fircrest
Median Income by Occupancy in Fircrest
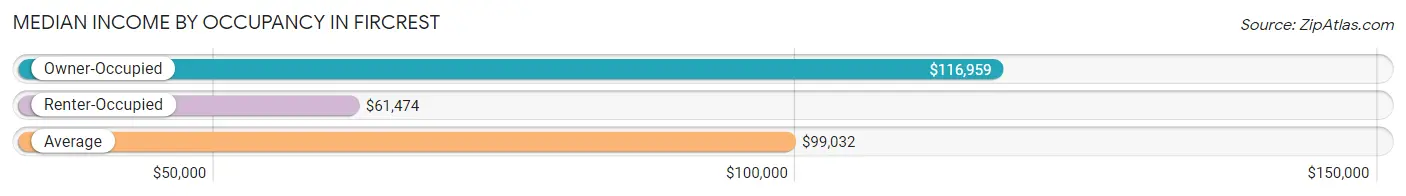
| Occupancy Type | # Households | Median Income |
| Owner-Occupied | 2,124 (73.3%) | $116,959 |
| Renter-Occupied | 774 (26.7%) | $61,474 |
| Average | 2,898 (100.0%) | $99,032 |
Occupancy by Householder Income Bracket in Fircrest
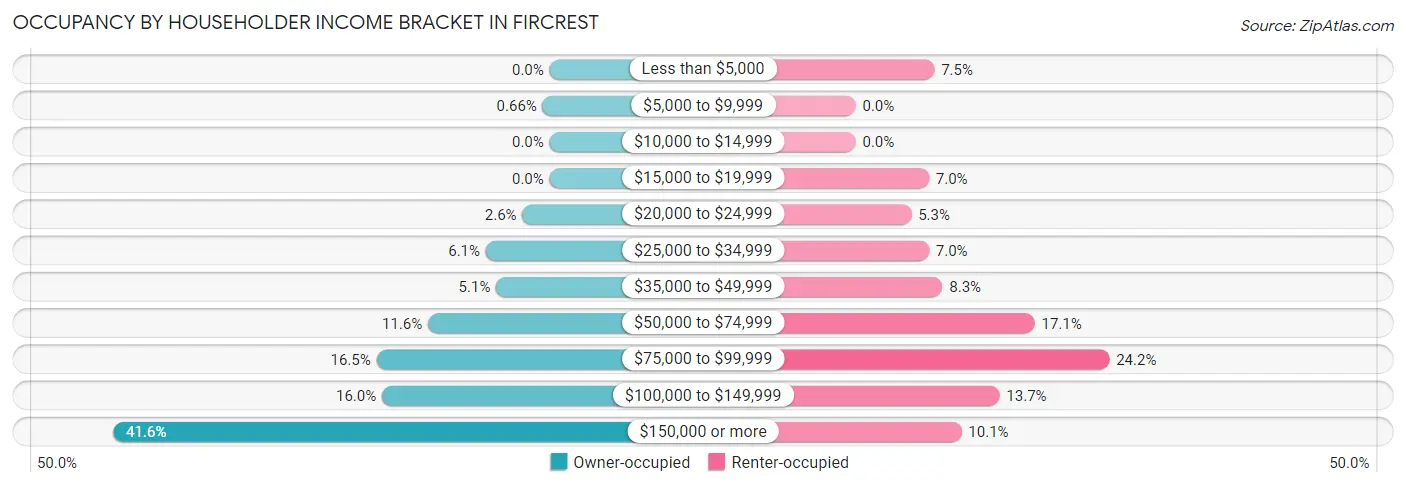
| Income Bracket | Owner-occupied | Renter-occupied |
| Less than $5,000 | 0 (0.0%) | 58 (7.5%) |
| $5,000 to $9,999 | 14 (0.7%) | 0 (0.0%) |
| $10,000 to $14,999 | 0 (0.0%) | 0 (0.0%) |
| $15,000 to $19,999 | 0 (0.0%) | 54 (7.0%) |
| $20,000 to $24,999 | 55 (2.6%) | 41 (5.3%) |
| $25,000 to $34,999 | 129 (6.1%) | 54 (7.0%) |
| $35,000 to $49,999 | 108 (5.1%) | 64 (8.3%) |
| $50,000 to $74,999 | 246 (11.6%) | 132 (17.1%) |
| $75,000 to $99,999 | 350 (16.5%) | 187 (24.2%) |
| $100,000 to $149,999 | 339 (16.0%) | 106 (13.7%) |
| $150,000 or more | 883 (41.6%) | 78 (10.1%) |
| Total | 2,124 (100.0%) | 774 (100.0%) |
Monthly Housing Cost Tiers in Fircrest
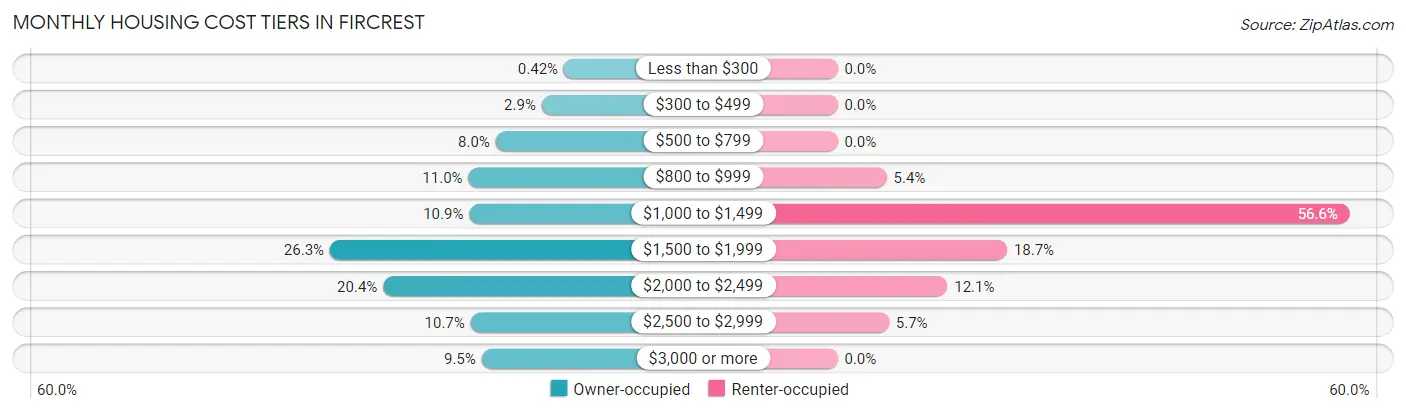
| Monthly Cost | Owner-occupied | Renter-occupied |
| Less than $300 | 9 (0.4%) | 0 (0.0%) |
| $300 to $499 | 61 (2.9%) | 0 (0.0%) |
| $500 to $799 | 169 (8.0%) | 0 (0.0%) |
| $800 to $999 | 233 (11.0%) | 42 (5.4%) |
| $1,000 to $1,499 | 231 (10.9%) | 438 (56.6%) |
| $1,500 to $1,999 | 558 (26.3%) | 145 (18.7%) |
| $2,000 to $2,499 | 433 (20.4%) | 94 (12.1%) |
| $2,500 to $2,999 | 228 (10.7%) | 44 (5.7%) |
| $3,000 or more | 202 (9.5%) | 0 (0.0%) |
| Total | 2,124 (100.0%) | 774 (100.0%) |
Physical Housing Characteristics in Fircrest
Housing Structures in Fircrest
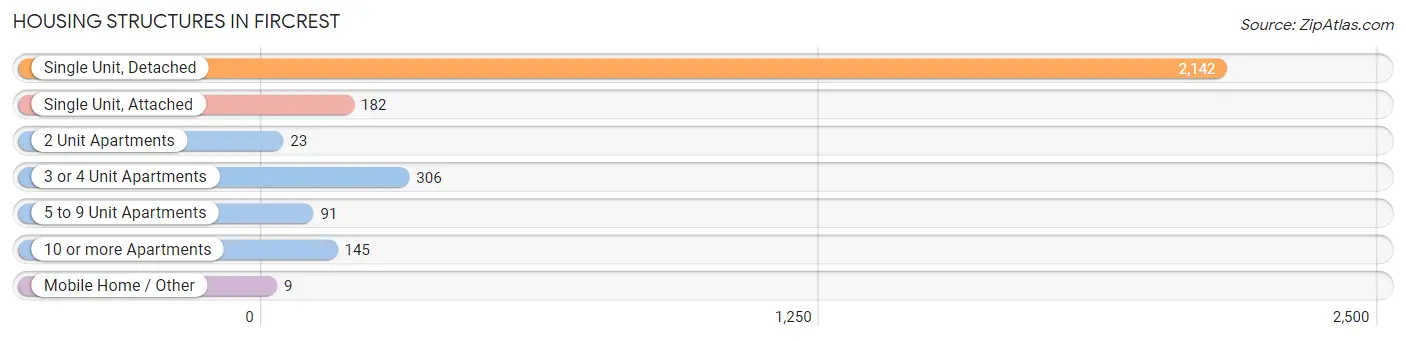
| Structure Type | # Housing Units | % Housing Units |
| Single Unit, Detached | 2,142 | 73.9% |
| Single Unit, Attached | 182 | 6.3% |
| 2 Unit Apartments | 23 | 0.8% |
| 3 or 4 Unit Apartments | 306 | 10.6% |
| 5 to 9 Unit Apartments | 91 | 3.1% |
| 10 or more Apartments | 145 | 5.0% |
| Mobile Home / Other | 9 | 0.3% |
| Total | 2,898 | 100.0% |
Housing Structures by Occupancy in Fircrest
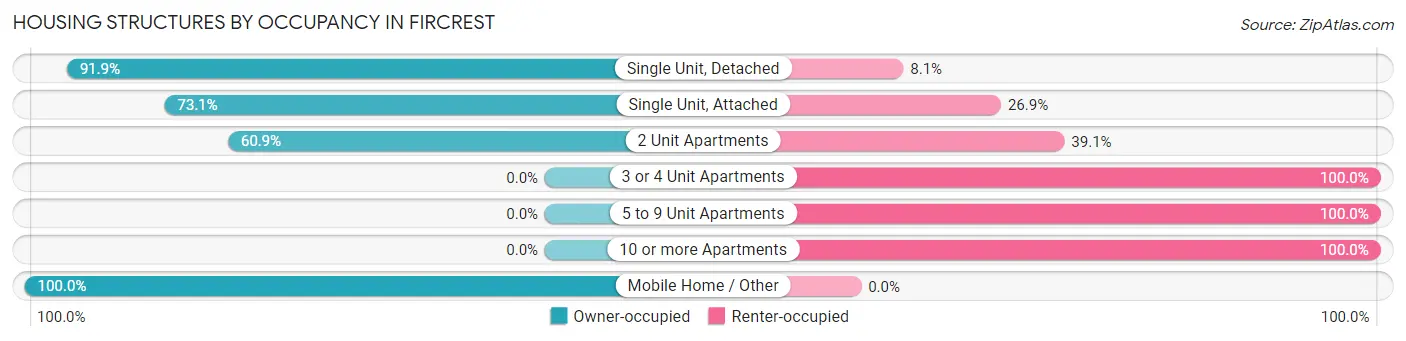
| Structure Type | Owner-occupied | Renter-occupied |
| Single Unit, Detached | 1,968 (91.9%) | 174 (8.1%) |
| Single Unit, Attached | 133 (73.1%) | 49 (26.9%) |
| 2 Unit Apartments | 14 (60.9%) | 9 (39.1%) |
| 3 or 4 Unit Apartments | 0 (0.0%) | 306 (100.0%) |
| 5 to 9 Unit Apartments | 0 (0.0%) | 91 (100.0%) |
| 10 or more Apartments | 0 (0.0%) | 145 (100.0%) |
| Mobile Home / Other | 9 (100.0%) | 0 (0.0%) |
| Total | 2,124 (73.3%) | 774 (26.7%) |
Housing Structures by Number of Rooms in Fircrest
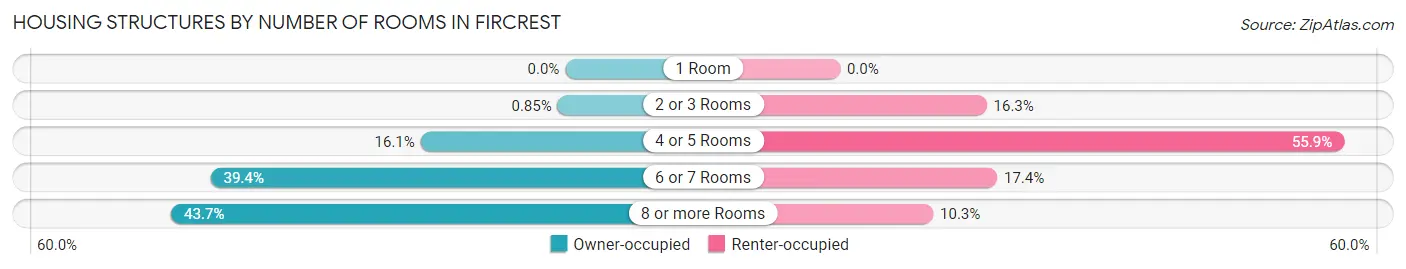
| Number of Rooms | Owner-occupied | Renter-occupied |
| 1 Room | 0 (0.0%) | 0 (0.0%) |
| 2 or 3 Rooms | 18 (0.9%) | 126 (16.3%) |
| 4 or 5 Rooms | 341 (16.1%) | 433 (55.9%) |
| 6 or 7 Rooms | 836 (39.4%) | 135 (17.4%) |
| 8 or more Rooms | 929 (43.7%) | 80 (10.3%) |
| Total | 2,124 (100.0%) | 774 (100.0%) |
Housing Structure by Heating Type in Fircrest
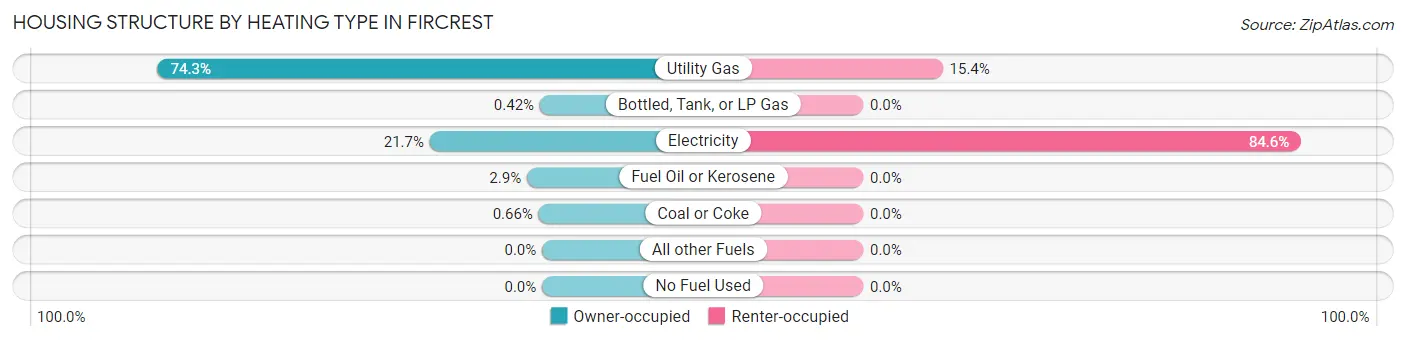
| Heating Type | Owner-occupied | Renter-occupied |
| Utility Gas | 1,578 (74.3%) | 119 (15.4%) |
| Bottled, Tank, or LP Gas | 9 (0.4%) | 0 (0.0%) |
| Electricity | 461 (21.7%) | 655 (84.6%) |
| Fuel Oil or Kerosene | 62 (2.9%) | 0 (0.0%) |
| Coal or Coke | 14 (0.7%) | 0 (0.0%) |
| All other Fuels | 0 (0.0%) | 0 (0.0%) |
| No Fuel Used | 0 (0.0%) | 0 (0.0%) |
| Total | 2,124 (100.0%) | 774 (100.0%) |
Household Vehicle Usage in Fircrest
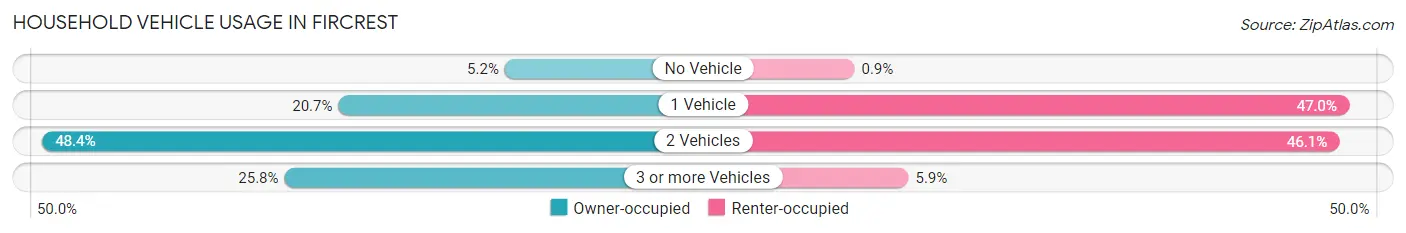
| Vehicles per Household | Owner-occupied | Renter-occupied |
| No Vehicle | 110 (5.2%) | 7 (0.9%) |
| 1 Vehicle | 440 (20.7%) | 364 (47.0%) |
| 2 Vehicles | 1,027 (48.3%) | 357 (46.1%) |
| 3 or more Vehicles | 547 (25.8%) | 46 (5.9%) |
| Total | 2,124 (100.0%) | 774 (100.0%) |
Real Estate & Mortgages in Fircrest
Real Estate and Mortgage Overview in Fircrest
| Characteristic | Without Mortgage | With Mortgage |
| Housing Units | 616 | 1,508 |
| Median Property Value | $536,600 | $464,500 |
| Median Household Income | $107,593 | $734 |
| Monthly Housing Costs | $876 | $202 |
| Real Estate Taxes | $5,116 | $32 |
Property Value by Mortgage Status in Fircrest
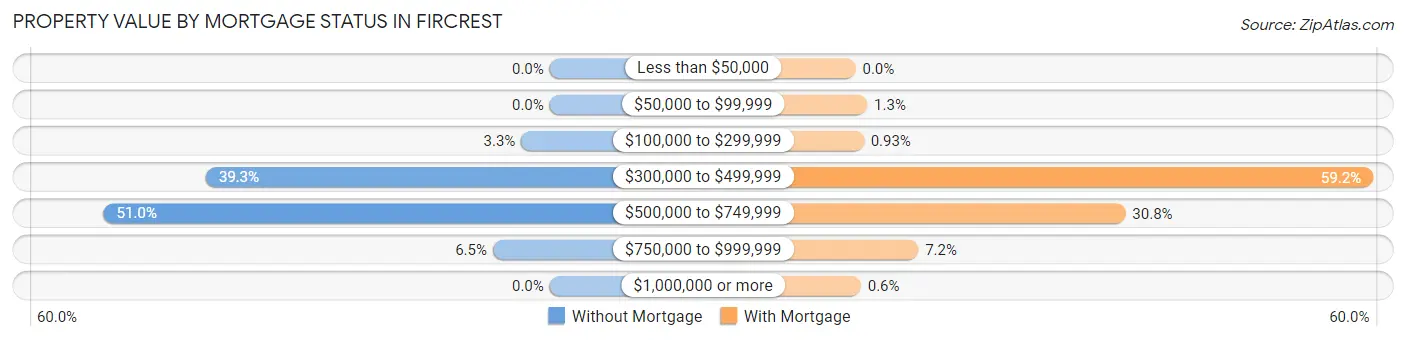
| Property Value | Without Mortgage | With Mortgage |
| Less than $50,000 | 0 (0.0%) | 0 (0.0%) |
| $50,000 to $99,999 | 0 (0.0%) | 20 (1.3%) |
| $100,000 to $299,999 | 20 (3.3%) | 14 (0.9%) |
| $300,000 to $499,999 | 242 (39.3%) | 892 (59.2%) |
| $500,000 to $749,999 | 314 (51.0%) | 465 (30.8%) |
| $750,000 to $999,999 | 40 (6.5%) | 108 (7.2%) |
| $1,000,000 or more | 0 (0.0%) | 9 (0.6%) |
| Total | 616 (100.0%) | 1,508 (100.0%) |
Household Income by Mortgage Status in Fircrest
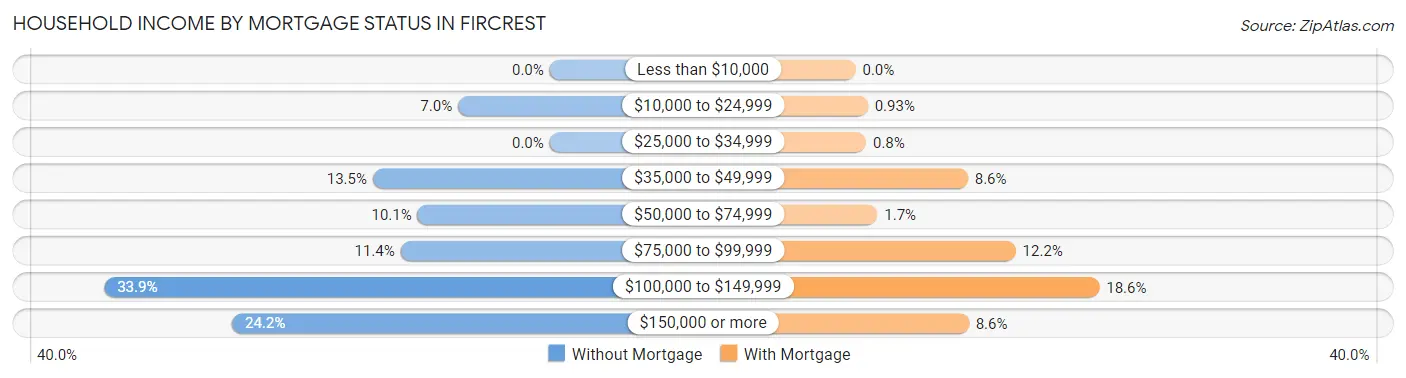
| Household Income | Without Mortgage | With Mortgage |
| Less than $10,000 | 0 (0.0%) | 0 (0.0%) |
| $10,000 to $24,999 | 43 (7.0%) | 14 (0.9%) |
| $25,000 to $34,999 | 0 (0.0%) | 12 (0.8%) |
| $35,000 to $49,999 | 83 (13.5%) | 129 (8.6%) |
| $50,000 to $74,999 | 62 (10.1%) | 25 (1.7%) |
| $75,000 to $99,999 | 70 (11.4%) | 184 (12.2%) |
| $100,000 to $149,999 | 209 (33.9%) | 280 (18.6%) |
| $150,000 or more | 149 (24.2%) | 130 (8.6%) |
| Total | 616 (100.0%) | 1,508 (100.0%) |
Property Value to Household Income Ratio in Fircrest
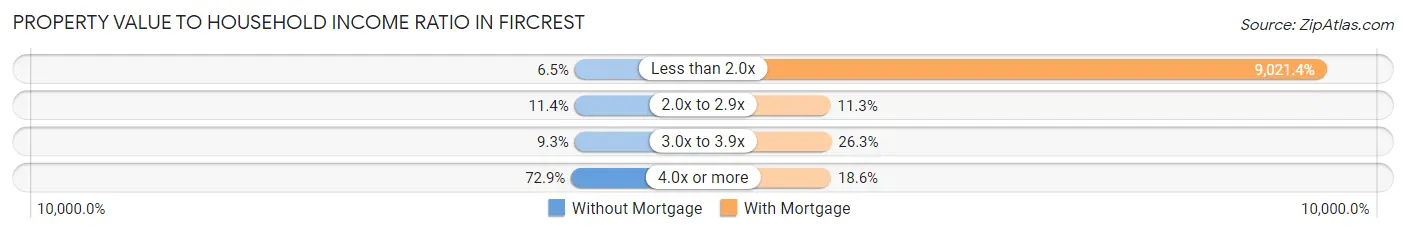
| Value-to-Income Ratio | Without Mortgage | With Mortgage |
| Less than 2.0x | 40 (6.5%) | 136,042 (9,021.3%) |
| 2.0x to 2.9x | 70 (11.4%) | 171 (11.3%) |
| 3.0x to 3.9x | 57 (9.2%) | 397 (26.3%) |
| 4.0x or more | 449 (72.9%) | 281 (18.6%) |
| Total | 616 (100.0%) | 1,508 (100.0%) |
Real Estate Taxes by Mortgage Status in Fircrest
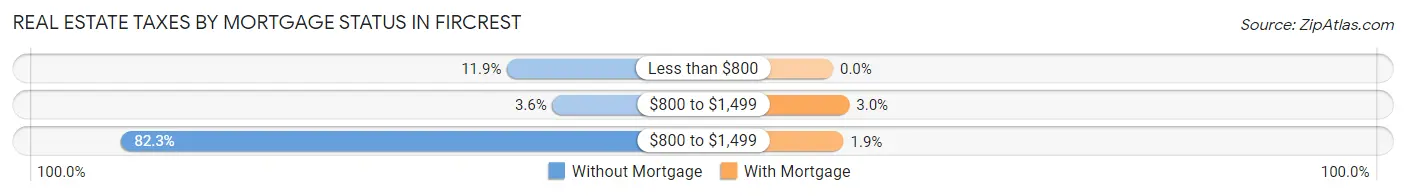
| Property Taxes | Without Mortgage | With Mortgage |
| Less than $800 | 73 (11.8%) | 0 (0.0%) |
| $800 to $1,499 | 22 (3.6%) | 45 (3.0%) |
| $800 to $1,499 | 507 (82.3%) | 29 (1.9%) |
| Total | 616 (100.0%) | 1,508 (100.0%) |
Health & Disability in Fircrest
Health Insurance Coverage by Age in Fircrest
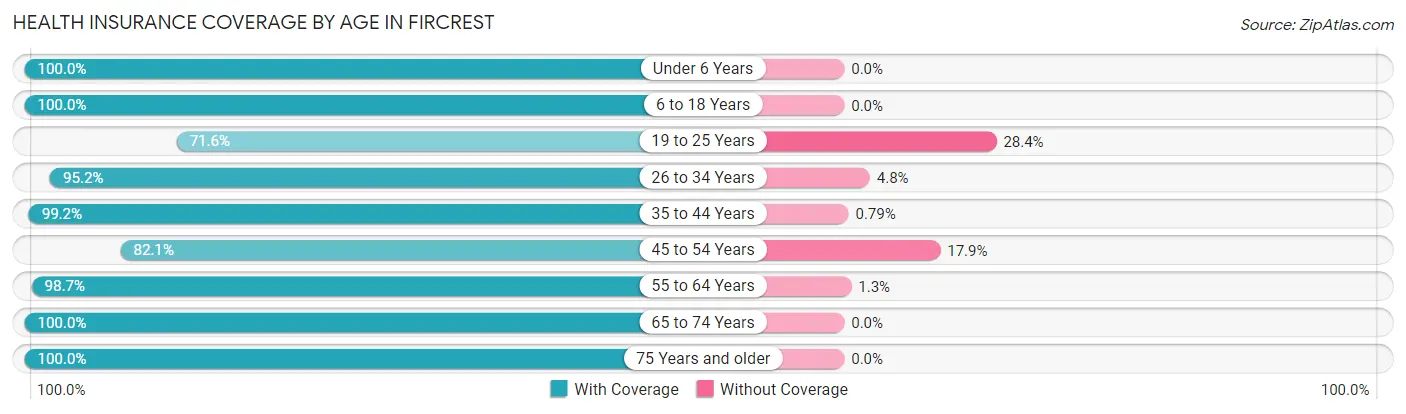
| Age Bracket | With Coverage | Without Coverage |
| Under 6 Years | 417 (100.0%) | 0 (0.0%) |
| 6 to 18 Years | 1,108 (100.0%) | 0 (0.0%) |
| 19 to 25 Years | 399 (71.6%) | 158 (28.4%) |
| 26 to 34 Years | 459 (95.2%) | 23 (4.8%) |
| 35 to 44 Years | 1,125 (99.2%) | 9 (0.8%) |
| 45 to 54 Years | 821 (82.1%) | 179 (17.9%) |
| 55 to 64 Years | 897 (98.7%) | 12 (1.3%) |
| 65 to 74 Years | 751 (100.0%) | 0 (0.0%) |
| 75 Years and older | 740 (100.0%) | 0 (0.0%) |
| Total | 6,717 (94.6%) | 381 (5.4%) |
Health Insurance Coverage by Citizenship Status in Fircrest
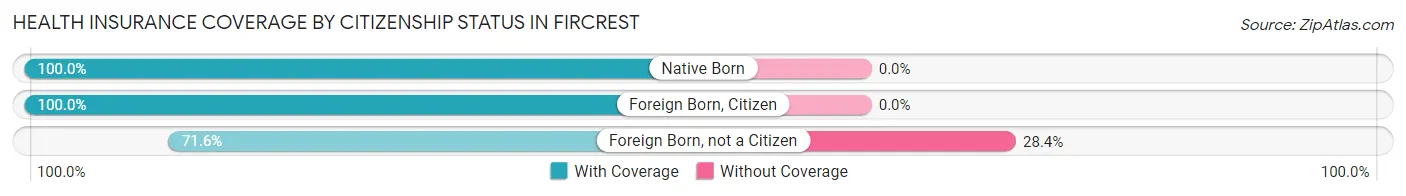
| Citizenship Status | With Coverage | Without Coverage |
| Native Born | 417 (100.0%) | 0 (0.0%) |
| Foreign Born, Citizen | 1,108 (100.0%) | 0 (0.0%) |
| Foreign Born, not a Citizen | 399 (71.6%) | 158 (28.4%) |
Health Insurance Coverage by Household Income in Fircrest
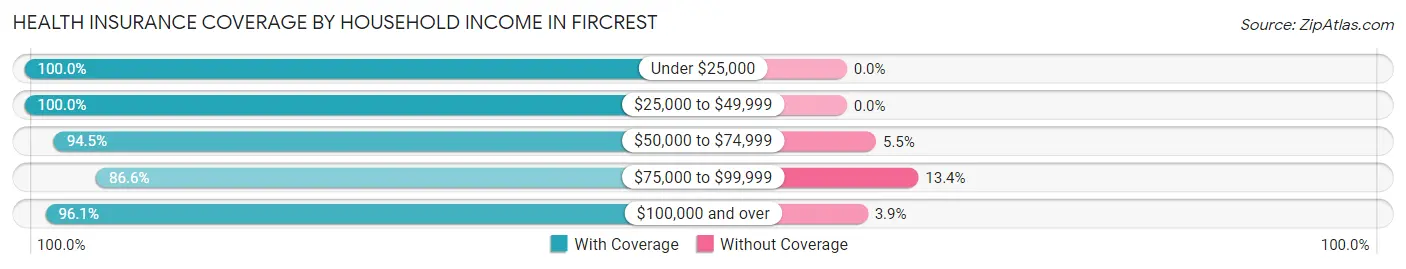
| Household Income | With Coverage | Without Coverage |
| Under $25,000 | 359 (100.0%) | 0 (0.0%) |
| $25,000 to $49,999 | 529 (100.0%) | 0 (0.0%) |
| $50,000 to $74,999 | 793 (94.5%) | 46 (5.5%) |
| $75,000 to $99,999 | 1,149 (86.6%) | 178 (13.4%) |
| $100,000 and over | 3,844 (96.1%) | 157 (3.9%) |
Public vs Private Health Insurance Coverage by Age in Fircrest
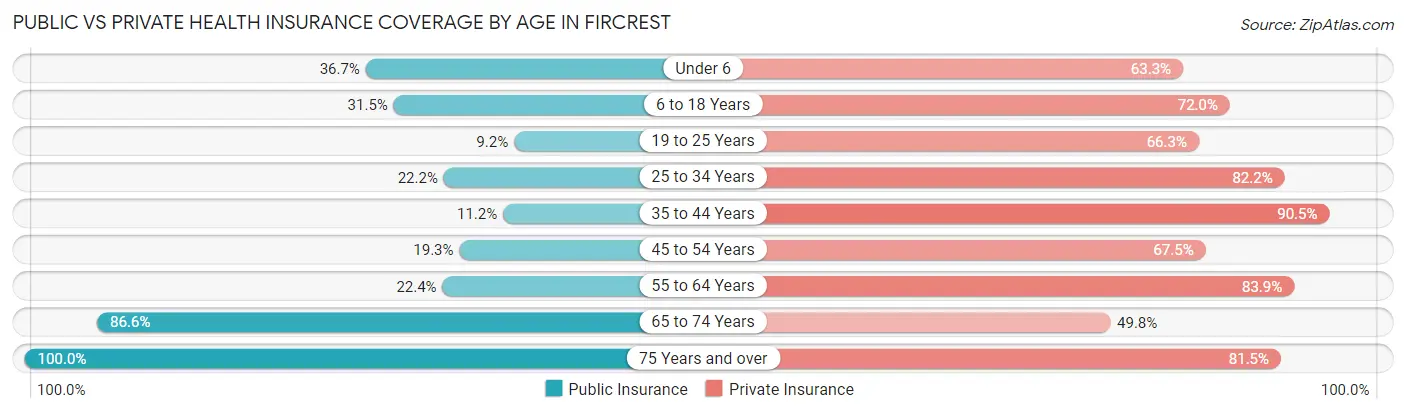
| Age Bracket | Public Insurance | Private Insurance |
| Under 6 | 153 (36.7%) | 264 (63.3%) |
| 6 to 18 Years | 349 (31.5%) | 798 (72.0%) |
| 19 to 25 Years | 51 (9.2%) | 369 (66.2%) |
| 25 to 34 Years | 107 (22.2%) | 396 (82.2%) |
| 35 to 44 Years | 127 (11.2%) | 1,026 (90.5%) |
| 45 to 54 Years | 193 (19.3%) | 675 (67.5%) |
| 55 to 64 Years | 204 (22.4%) | 763 (83.9%) |
| 65 to 74 Years | 650 (86.6%) | 374 (49.8%) |
| 75 Years and over | 740 (100.0%) | 603 (81.5%) |
| Total | 2,574 (36.3%) | 5,268 (74.2%) |
Disability Status by Sex by Age in Fircrest
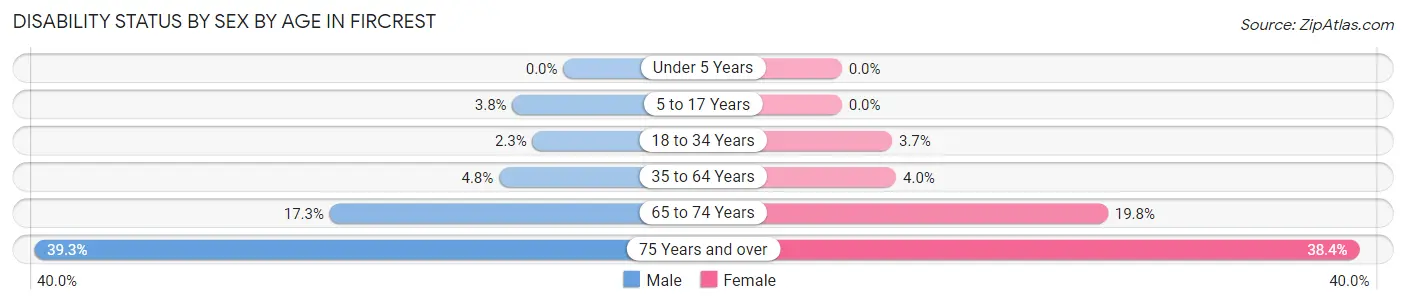
| Age Bracket | Male | Female |
| Under 5 Years | 0 (0.0%) | 0 (0.0%) |
| 5 to 17 Years | 25 (3.8%) | 0 (0.0%) |
| 18 to 34 Years | 10 (2.3%) | 28 (3.7%) |
| 35 to 64 Years | 60 (4.8%) | 72 (4.0%) |
| 65 to 74 Years | 60 (17.3%) | 80 (19.8%) |
| 75 Years and over | 121 (39.3%) | 166 (38.4%) |
Disability Class by Sex by Age in Fircrest
Disability Class: Hearing Difficulty
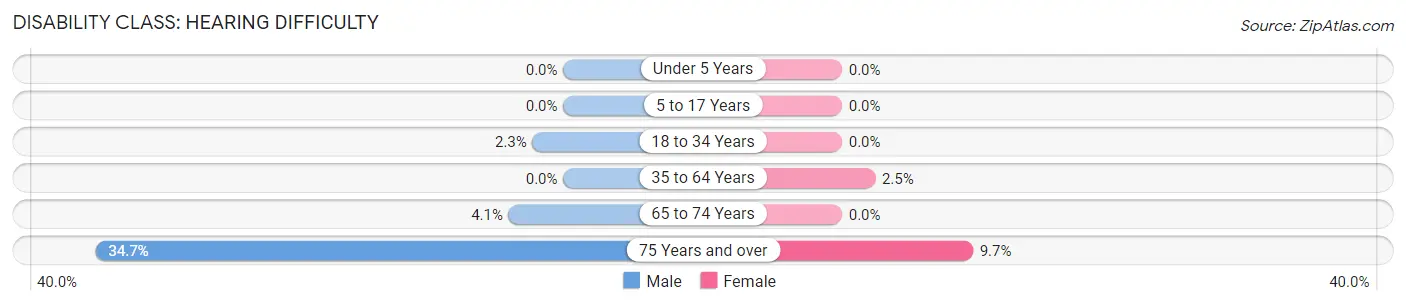
| Age Bracket | Male | Female |
| Under 5 Years | 0 (0.0%) | 0 (0.0%) |
| 5 to 17 Years | 0 (0.0%) | 0 (0.0%) |
| 18 to 34 Years | 10 (2.3%) | 0 (0.0%) |
| 35 to 64 Years | 0 (0.0%) | 44 (2.5%) |
| 65 to 74 Years | 14 (4.1%) | 0 (0.0%) |
| 75 Years and over | 107 (34.7%) | 42 (9.7%) |
Disability Class: Vision Difficulty
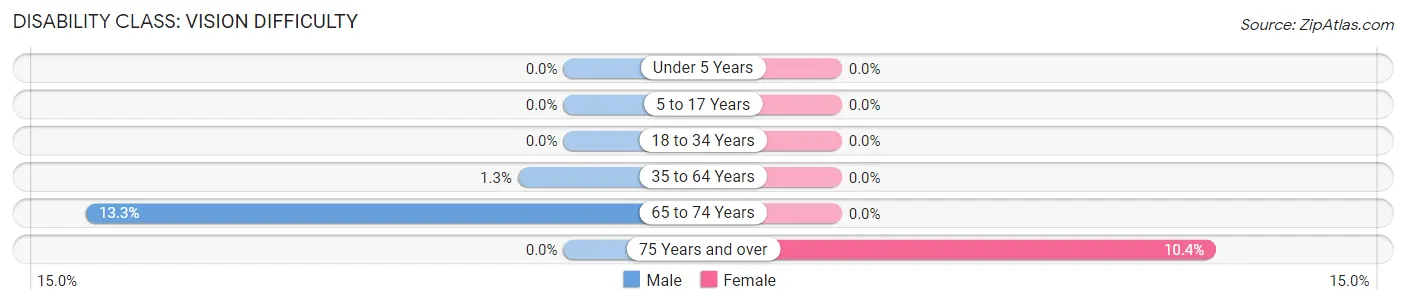
| Age Bracket | Male | Female |
| Under 5 Years | 0 (0.0%) | 0 (0.0%) |
| 5 to 17 Years | 0 (0.0%) | 0 (0.0%) |
| 18 to 34 Years | 0 (0.0%) | 0 (0.0%) |
| 35 to 64 Years | 16 (1.3%) | 0 (0.0%) |
| 65 to 74 Years | 46 (13.3%) | 0 (0.0%) |
| 75 Years and over | 0 (0.0%) | 45 (10.4%) |
Disability Class: Cognitive Difficulty
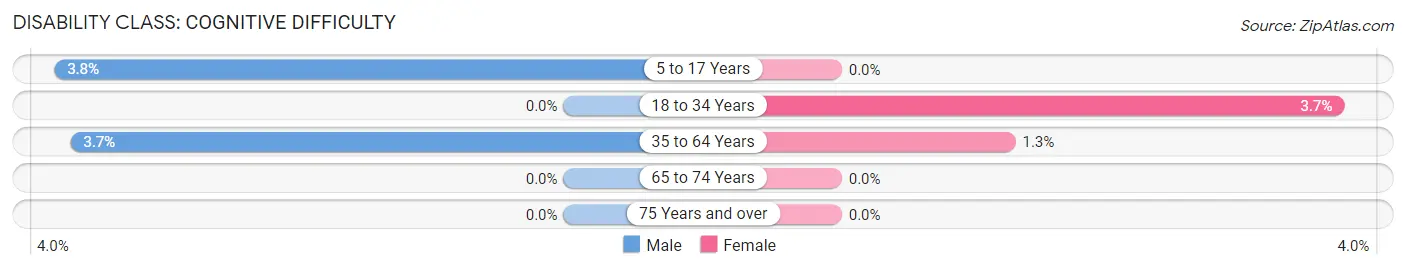
| Age Bracket | Male | Female |
| 5 to 17 Years | 25 (3.8%) | 0 (0.0%) |
| 18 to 34 Years | 0 (0.0%) | 28 (3.7%) |
| 35 to 64 Years | 46 (3.7%) | 23 (1.3%) |
| 65 to 74 Years | 0 (0.0%) | 0 (0.0%) |
| 75 Years and over | 0 (0.0%) | 0 (0.0%) |
Disability Class: Ambulatory Difficulty
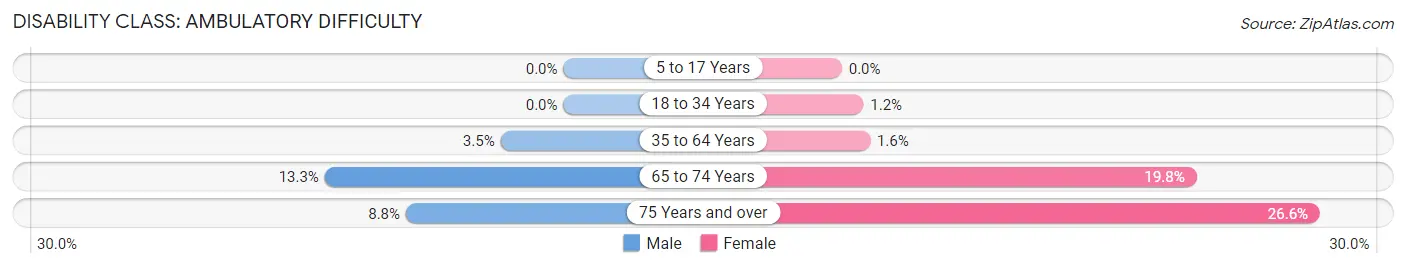
| Age Bracket | Male | Female |
| 5 to 17 Years | 0 (0.0%) | 0 (0.0%) |
| 18 to 34 Years | 0 (0.0%) | 9 (1.2%) |
| 35 to 64 Years | 44 (3.5%) | 28 (1.6%) |
| 65 to 74 Years | 46 (13.3%) | 80 (19.8%) |
| 75 Years and over | 27 (8.8%) | 115 (26.6%) |
Disability Class: Self-Care Difficulty
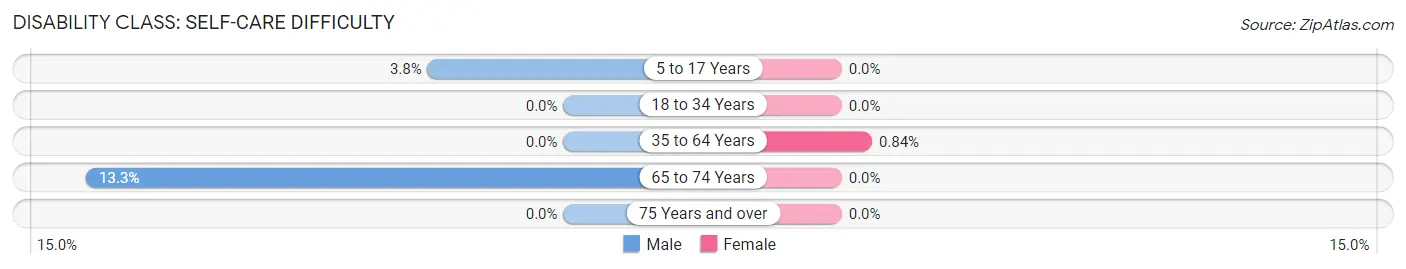
| Age Bracket | Male | Female |
| 5 to 17 Years | 25 (3.8%) | 0 (0.0%) |
| 18 to 34 Years | 0 (0.0%) | 0 (0.0%) |
| 35 to 64 Years | 0 (0.0%) | 15 (0.8%) |
| 65 to 74 Years | 46 (13.3%) | 0 (0.0%) |
| 75 Years and over | 0 (0.0%) | 0 (0.0%) |
Technology Access in Fircrest
Computing Device Access in Fircrest
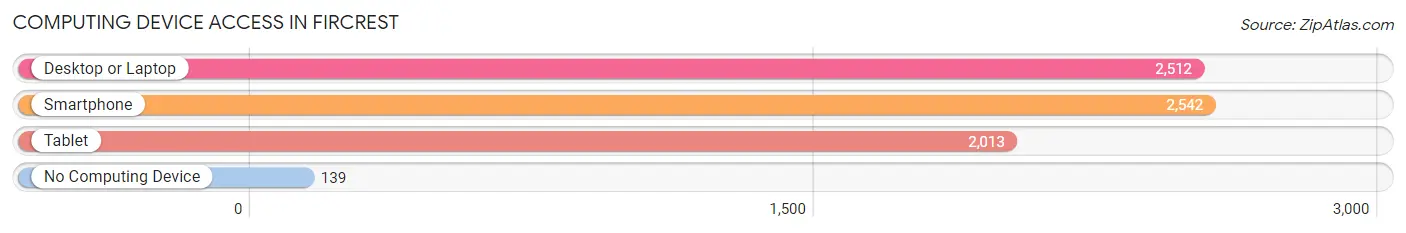
| Device Type | # Households | % Households |
| Desktop or Laptop | 2,512 | 86.7% |
| Smartphone | 2,542 | 87.7% |
| Tablet | 2,013 | 69.5% |
| No Computing Device | 139 | 4.8% |
| Total | 2,898 | 100.0% |
Internet Access in Fircrest
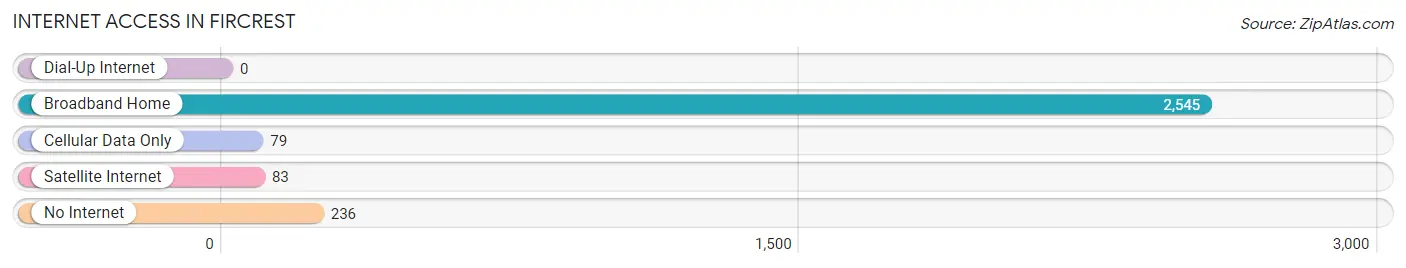
| Internet Type | # Households | % Households |
| Dial-Up Internet | 0 | 0.0% |
| Broadband Home | 2,545 | 87.8% |
| Cellular Data Only | 79 | 2.7% |
| Satellite Internet | 83 | 2.9% |
| No Internet | 236 | 8.1% |
| Total | 2,898 | 100.0% |
Fircrest Summary
Fircrest is a city located in Pierce County, Washington, United States. It is a suburb of Tacoma and is part of the Seattle metropolitan area. The population was 6,497 at the 2010 census.
History
Fircrest was founded in 1925 by the Fircrest Land Company, which was owned by the Tacoma-based Puget Sound Power and Light Company. The company purchased the land from the estate of William H. Fife, a Tacoma businessman. The company planned to develop the area as a residential community for Tacoma's middle-class workers. The name Fircrest was chosen because of the abundance of fir trees in the area.
The first homes in Fircrest were built in 1926 and the city was officially incorporated in 1929. The city was designed to be a self-contained community with its own schools, parks, and shopping district. The city was also designed to be a “dry” city, meaning that the sale of alcohol was prohibited. This prohibition was in place until the 1970s.
Geography
Fircrest is located at 47°14′17″N 122°31′17″W (47.238, -122.521). According to the United States Census Bureau, the city has a total area of 2.3 square miles (6.0 km2), all of it land.
Economy
Fircrest is primarily a residential community, but it does have a few businesses. The largest employer in the city is the Fircrest Golf and Country Club, which employs about 200 people. Other businesses in the city include a grocery store, a hardware store, a pharmacy, and several restaurants.
Demographics
As of the census of 2010, there were 6,497 people, 2,717 households, and 1,717 families residing in the city. The population density was 2,817.3 people per square mile (1,091.2/km2). There were 2,919 housing units at an average density of 1,265.3 per square mile (489.2/km2). The racial makeup of the city was 87.2% White, 2.2% African American, 0.7% Native American, 4.2% Asian, 0.2% Pacific Islander, 1.7% from other races, and 3.8% from two or more races. Hispanic or Latino of any race were 5.2% of the population.
There were 2,717 households, out of which 24.2% had children under the age of 18 living with them, 51.2% were married couples living together, 9.2% had a female householder with no husband present, and 35.7% were non-families. 29.2% of all households were made up of individuals, and 11.7% had someone living alone who was 65 years of age or older. The average household size was 2.37 and the average family size was 2.93.
In the city, the population was spread out, with 21.2% under the age of 18, 6.7% from 18 to 24, 24.2% from 25 to 44, 28.7% from 45 to 64, and 19.2% who were 65 years of age or older. The median age was 43 years. For every 100 females, there were 92.2 males. For every 100 females age 18 and over, there were 89.3 males.
The median income for a household in the city was $60,938, and the median income for a family was $71,944. Males had a median income of $50,917 versus $37,917 for females. The per capita income for the city was $30,945. About 4.2% of families and 5.7% of the population were below the poverty line, including 6.3% of those under age 18 and 4.2% of those age 65 or over.
Common Questions
What is Per Capita Income in Fircrest?
Per Capita income in Fircrest is $50,796.
What is the Median Family Income in Fircrest?
Median Family Income in Fircrest is $115,405.
What is the Median Household income in Fircrest?
Median Household Income in Fircrest is $99,032.
What is Income or Wage Gap in Fircrest?
Income or Wage Gap in Fircrest is 16.4%.
Women in Fircrest earn 83.6 cents for every dollar earned by a man.
What is Inequality or Gini Index in Fircrest?
Inequality or Gini Index in Fircrest is 0.39.
What is the Total Population of Fircrest?
Total Population of Fircrest is 7,098.
What is the Total Male Population of Fircrest?
Total Male Population of Fircrest is 3,199.
What is the Total Female Population of Fircrest?
Total Female Population of Fircrest is 3,899.
What is the Ratio of Males per 100 Females in Fircrest?
There are 82.05 Males per 100 Females in Fircrest.
What is the Ratio of Females per 100 Males in Fircrest?
There are 121.88 Females per 100 Males in Fircrest.
What is the Median Population Age in Fircrest?
Median Population Age in Fircrest is 43.3 Years.
What is the Average Family Size in Fircrest
Average Family Size in Fircrest is 3.0 People.
What is the Average Household Size in Fircrest
Average Household Size in Fircrest is 2.4 People.
How Large is the Labor Force in Fircrest?
There are 3,951 People in the Labor Forcein in Fircrest.
What is the Percentage of People in the Labor Force in Fircrest?
67.2% of People are in the Labor Force in Fircrest.
What is the Unemployment Rate in Fircrest?
Unemployment Rate in Fircrest is 8.1%.