Zip Codes with the Highest Percentage of Population Employed in Legal Services & Support in Seattle, WA

RELATED REPORTS & OPTIONS

Legal Services & Support
Population
Families and Households
Female Fertility
Female Fertility (Unmarried)
Race (Community Size)
Race (Percentage)
Ancestry (Community Size)
AfghanAfricanAlaska NativeAlaskan AthabascanAlbanianAleutAmericanApacheArabArgentineanArmenianAssyrian / Chaldean / SyriacAustralianAustrianBahamianBangladeshiBarbadianBasqueBelgianBelizeanBhutaneseBlackfeetBolivianBrazilianBritishBritish West IndianBulgarianBurmeseCajunCambodianCanadianCape VerdeanCarpatho RusynCelticCentral AmericanCentral American IndianCherokeeCheyenneChickasawChileanChineseChippewaChoctawColombianColvilleComancheCosta RicanCreeCreekCroatianCrowCubanCypriotCzechCzechoslovakianDanishDelawareDominicanDutchEastern EuropeanEcuadorianEgyptianEnglishEstonianEthiopianEuropeanFijianFilipinoFinnishFrenchFrench American IndianFrench CanadianGermanGerman RussianGhanaianGreekGuamanian / ChamorroGuatemalanGuyaneseHaitianHonduranHopiHungarianIcelanderIndian (Asian)IndonesianInupiatIranianIraqiIrishIroquoisIsraeliItalianJamaicanJapaneseJordanianKenyanKoreanLaotianLatvianLebaneseLithuanianLuxembourgerMacedonianMalaysianMalteseMarshalleseMexicanMexican American IndianMongolianMoroccanNative HawaiianNavajoNepaleseNew ZealanderNicaraguanNigerianNorthern EuropeanNorwegianOkinawanOsagePakistaniPalestinianPanamanianParaguayanPennsylvania GermanPeruvianPolishPortuguesePotawatomiPuebloPuerto RicanPuget Sound SalishRomanianRussianSalvadoranSamoanScandinavianScotch-IrishScottishSeminoleSenegaleseSerbianShoshoneSiouxSlavicSlovakSloveneSomaliSouth AfricanSouth AmericanSouth American IndianSpaniardSpanishSpanish AmericanSri LankanSubsaharan AfricanSudaneseSwedishSwissSyrianThaiTlingit-HaidaTonganTrinidadian and TobagonianTsimshianTurkishUgandanUkrainianUruguayanUteVenezuelanVietnameseWelshWest IndianYakamaYaquiYugoslavianYup'ik
Ancestry (Percentage)
AfghanAfricanAlaska NativeAlaskan AthabascanAlbanianAleutAmericanApacheArabArgentineanArmenianAssyrian / Chaldean / SyriacAustralianAustrianBahamianBangladeshiBarbadianBasqueBelgianBelizeanBhutaneseBlackfeetBolivianBrazilianBritishBritish West IndianBulgarianBurmeseCajunCambodianCanadianCape VerdeanCarpatho RusynCelticCentral AmericanCentral American IndianCherokeeCheyenneChickasawChileanChineseChippewaChoctawColombianColvilleComancheCosta RicanCreeCreekCroatianCrowCubanCypriotCzechCzechoslovakianDanishDelawareDominicanDutchEastern EuropeanEcuadorianEgyptianEnglishEstonianEthiopianEuropeanFijianFilipinoFinnishFrenchFrench American IndianFrench CanadianGermanGerman RussianGhanaianGreekGuamanian / ChamorroGuatemalanGuyaneseHaitianHonduranHopiHungarianIcelanderIndian (Asian)IndonesianInupiatIranianIraqiIrishIroquoisIsraeliItalianJamaicanJapaneseJordanianKenyanKoreanLaotianLatvianLebaneseLithuanianLuxembourgerMacedonianMalaysianMalteseMarshalleseMexicanMexican American IndianMongolianMoroccanNative HawaiianNavajoNepaleseNew ZealanderNicaraguanNigerianNorthern EuropeanNorwegianOkinawanOsagePakistaniPalestinianPanamanianParaguayanPennsylvania GermanPeruvianPolishPortuguesePotawatomiPuebloPuerto RicanPuget Sound SalishRomanianRussianSalvadoranSamoanScandinavianScotch-IrishScottishSeminoleSenegaleseSerbianShoshoneSiouxSlavicSlovakSloveneSomaliSouth AfricanSouth AmericanSouth American IndianSpaniardSpanishSpanish AmericanSri LankanSubsaharan AfricanSudaneseSwedishSwissSyrianThaiTlingit-HaidaTonganTrinidadian and TobagonianTsimshianTurkishUgandanUkrainianUruguayanUteVenezuelanVietnameseWelshWest IndianYakamaYaquiYugoslavianYup'ik
Immigrant Origin (Total)
AfghanistanAfricaAlbaniaArgentinaArmeniaAsiaAustraliaAustriaBangladeshBelarusBelgiumBelizeBoliviaBosnia and HerzegovinaBrazilBulgariaBurma / MyanmarCambodiaCameroonCanadaCaribbeanCentral AmericaChileChinaColombiaCongoCosta RicaCroatiaCubaCzechoslovakiaDenmarkDominican RepublicEastern AfricaEastern AsiaEastern EuropeEcuadorEgyptEl SalvadorEnglandEritreaEthiopiaEuropeFijiFranceGermanyGhanaGreeceGuatemalaHaitiHondurasHong KongHungaryIndiaIndonesiaIranIraqIrelandIsraelItalyJamaicaJapanJordanKazakhstanKenyaKoreaKuwaitLaosLatin AmericaLatviaLebanonLiberiaLithuaniaMalaysiaMexicoMicronesiaMiddle AfricaMoldovaMoroccoNepalNetherlandsNicaraguaNigeriaNorth MacedoniaNorthern AfricaNorthern EuropeNorwayOceaniaPakistanPanamaPeruPhilippinesPolandPortugalRomaniaRussiaSaudi ArabiaScotlandSenegalSerbiaSierra LeoneSingaporeSomaliaSouth AfricaSouth AmericaSouth Central AsiaSouth Eastern AsiaSouthern EuropeSpainSri LankaSudanSwedenSwitzerlandSyriaTaiwanThailandTrinidad and TobagoTurkeyUgandaUkraineUzbekistanVenezuelaVietnamWestern AfricaWestern AsiaWestern EuropeYemenZaireZimbabwe
Immigrant Origin (Percentage)
AfghanistanAfricaAlbaniaArgentinaArmeniaAsiaAustraliaAustriaBangladeshBelarusBelgiumBelizeBoliviaBosnia and HerzegovinaBrazilBulgariaBurma / MyanmarCambodiaCameroonCanadaCaribbeanCentral AmericaChileChinaColombiaCongoCosta RicaCroatiaCubaCzechoslovakiaDenmarkDominican RepublicEastern AfricaEastern AsiaEastern EuropeEcuadorEgyptEl SalvadorEnglandEritreaEthiopiaEuropeFijiFranceGermanyGhanaGreeceGuatemalaHaitiHondurasHong KongHungaryIndiaIndonesiaIranIraqIrelandIsraelItalyJamaicaJapanJordanKazakhstanKenyaKoreaKuwaitLaosLatin AmericaLatviaLebanonLiberiaLithuaniaMalaysiaMexicoMicronesiaMiddle AfricaMoldovaMoroccoNepalNetherlandsNicaraguaNigeriaNorth MacedoniaNorthern AfricaNorthern EuropeNorwayOceaniaPakistanPanamaPeruPhilippinesPolandPortugalRomaniaRussiaSaudi ArabiaScotlandSenegalSerbiaSierra LeoneSingaporeSomaliaSouth AfricaSouth AmericaSouth Central AsiaSouth Eastern AsiaSouthern EuropeSpainSri LankaSudanSwedenSwitzerlandSyriaTaiwanThailandTrinidad and TobagoTurkeyUgandaUkraineUzbekistanVenezuelaVietnamWestern AfricaWestern AsiaWestern EuropeYemenZaireZimbabwe
Income
Income (Families)
Income (Households)
Poverty
Poverty (Families)
Unemployment
Employment Occupations
Employment Industries
Employer Class
Commute Time
Commute Means
School Enrollment
Education by Degree Field
Occupancy
Finances
Physical Characteristics
Seattle
Compare Zip Codes
Comparison Subject

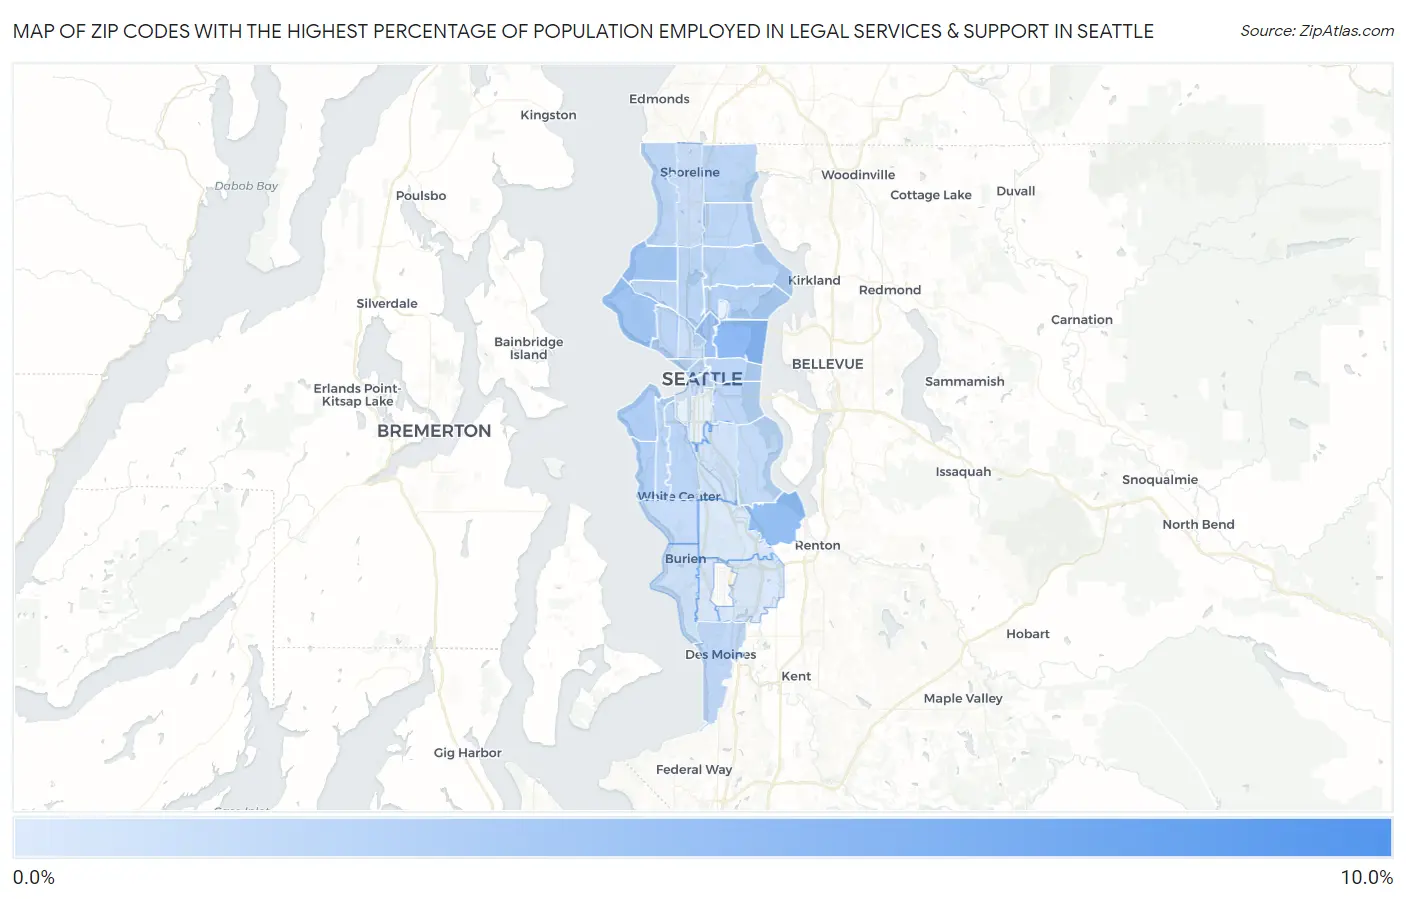
Map of Zip Codes with the Highest Percentage of Population Employed in Legal Services & Support in Seattle

0.0%
10.0%
Zip Codes with the Highest Percentage of Population Employed in Legal Services & Support in Seattle Map

Zip Codes with the Highest Percentage of Population Employed in Legal Services & Support in Seattle, WA

Zip Code % Employed vs State vs National
1.981648.6%1.1%(+7.55)#51.2%(+7.45)#220
2.981124.5%1.1%(+3.43)#111.2%(+3.32)#895
3.981784.1%1.1%(+3.05)#161.2%(+2.94)#1,063
4.981023.5%1.1%(+2.43)#221.2%(+2.32)#1,430
5.981993.5%1.1%(+2.39)#231.2%(+2.28)#1,464
6.981173.4%1.1%(+2.29)#251.2%(+2.18)#1,522
7.981162.7%1.1%(+1.62)#371.2%(+1.51)#2,210
8.981362.5%1.1%(+1.47)#421.2%(+1.36)#2,442
9.981052.3%1.1%(+1.27)#471.2%(+1.16)#2,776
10.981152.1%1.1%(+1.06)#541.2%(+0.951)#3,168
11.981222.1%1.1%(+0.986)#591.2%(+0.877)#3,308
12.981012.1%1.1%(+0.986)#601.2%(+0.877)#3,312
13.981552.0%1.1%(+0.968)#631.2%(+0.859)#3,355
14.981262.0%1.1%(+0.946)#651.2%(+0.836)#3,422
15.981062.0%1.1%(+0.937)#671.2%(+0.828)#3,449
16.981032.0%1.1%(+0.935)#681.2%(+0.826)#3,456
17.981192.0%1.1%(+0.910)#691.2%(+0.801)#3,526
18.981212.0%1.1%(+0.896)#701.2%(+0.787)#3,554
19.981071.9%1.1%(+0.845)#731.2%(+0.736)#3,674
20.981771.9%1.1%(+0.821)#741.2%(+0.712)#3,742
21.981251.9%1.1%(+0.812)#751.2%(+0.703)#3,760
22.981441.9%1.1%(+0.790)#771.2%(+0.680)#3,826
23.981981.8%1.1%(+0.726)#821.2%(+0.616)#4,005
24.981041.7%1.1%(+0.605)#921.2%(+0.496)#4,382
25.981181.6%1.1%(+0.510)#1011.2%(+0.401)#4,733
26.981461.4%1.1%(+0.364)#1081.2%(+0.255)#5,294
27.981091.2%1.1%(+0.172)#1231.2%(+0.063)#6,226
28.981331.2%1.1%(+0.134)#1311.2%(+0.024)#6,433
29.981660.97%1.1%(-0.105)#1671.2%(-0.214)#8,039
30.981080.82%1.1%(-0.252)#2101.2%(-0.362)#9,265
31.981480.44%1.1%(-0.632)#3021.2%(-0.741)#13,334
32.981880.44%1.1%(-0.635)#3031.2%(-0.744)#13,363
33.981680.26%1.1%(-0.815)#3281.2%(-0.924)#15,516

Common Questions

What are the Top 10 Zip Codes with the Highest Percentage of Population Employed in Legal Services & Support in Seattle, WA?
Top 10 Zip Codes with the Highest Percentage of Population Employed in Legal Services & Support in Seattle, WA are:
#1
8.6%
#2
4.5%
#3
4.1%
#4
3.5%
#5
3.5%
#6
3.4%
#7
2.7%
#8
2.5%
#9
2.3%
#10
2.1%
What zip code has the Highest Percentage of Population Employed in Legal Services & Support in Seattle, WA?
98164 has the Highest Percentage of Population Employed in Legal Services & Support in Seattle, WA with 8.6%.
What is the Percentage of Population Employed in Legal Services & Support in Seattle, WA?
Percentage of Population Employed in Legal Services & Support in Seattle is 2.2%.
What is the Percentage of Population Employed in Legal Services & Support in Washington?
Percentage of Population Employed in Legal Services & Support in Washington is 1.1%.
What is the Percentage of Population Employed in Legal Services & Support in the United States?
Percentage of Population Employed in Legal Services & Support in the United States is 1.2%.