Green Bluff, WA Map & Demographics
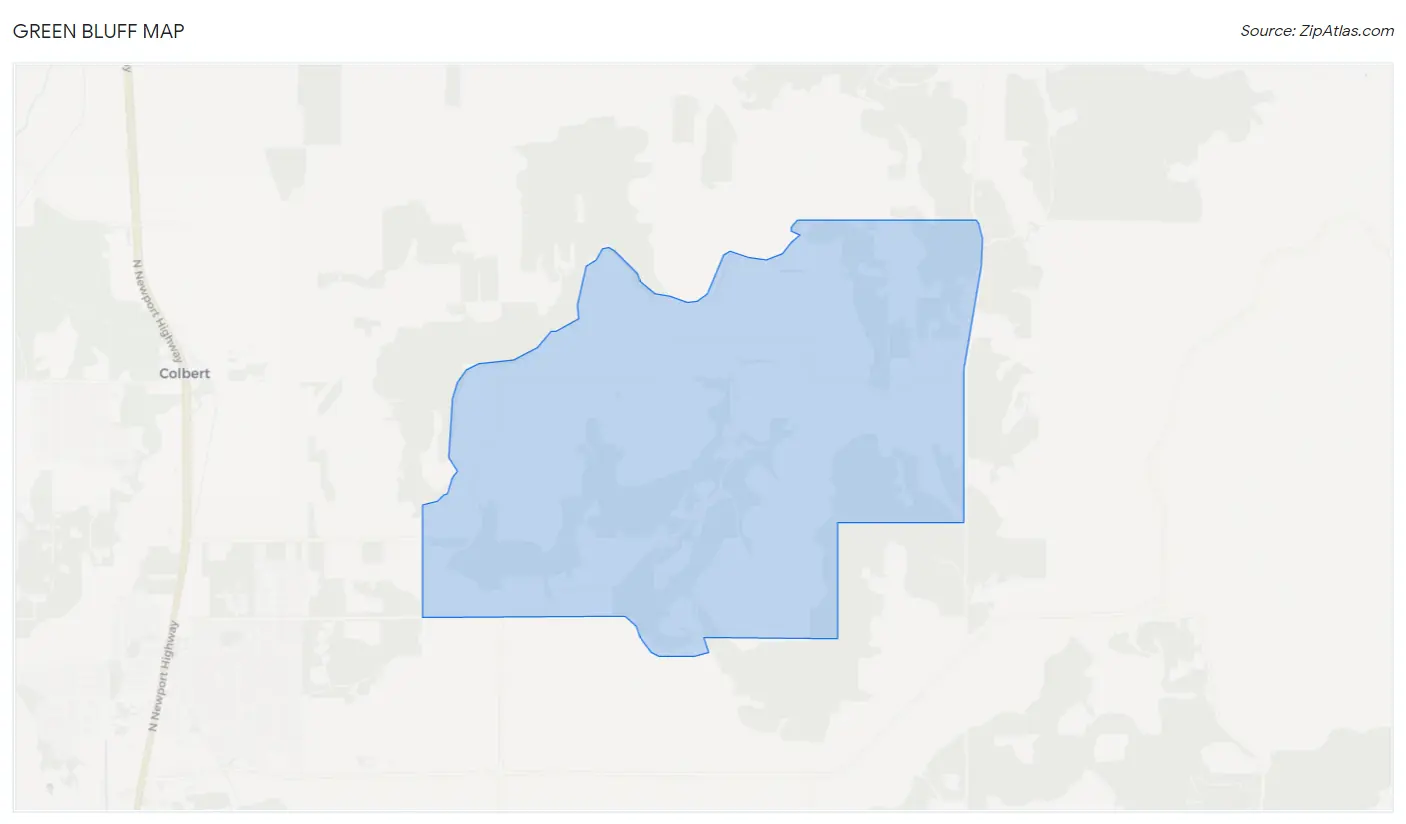
Green Bluff Map
Green Bluff Overview
$77,055
PER CAPITA INCOME
$93,036
AVG HOUSEHOLD INCOME
0.39
INEQUALITY / GINI INDEX
219
TOTAL POPULATION
95
MALE POPULATION
124
FEMALE POPULATION
76.61
MALES / 100 FEMALES
130.53
FEMALES / 100 MALES
66.0
MEDIAN AGE
2.3
AVG FAMILY SIZE
2.1
AVG HOUSEHOLD SIZE
106
LABOR FORCE [ PEOPLE ]
52.7%
PERCENT IN LABOR FORCE
Income in Green Bluff
Income Overview in Green Bluff
| Characteristic | Number | Measure |
| Per Capita Income | 219 | $77,055 |
| Median Family Income | 90 | $0 |
| Mean Family Income | 90 | $176,194 |
| Median Household Income | 103 | $93,036 |
| Mean Household Income | 103 | $161,824 |
| Income Deficit | 90 | $0 |
| Wage / Income Gap (%) | 219 | 0.00% |
| Wage / Income Gap ($) | 219 | 100.00¢ per $1 |
| Gini / Inequality Index | 219 | 0.39 |
Earnings by Sex in Green Bluff
| Sex | Number | Average Earnings |
| Male | 62 (56.9%) | $0 |
| Female | 47 (43.1%) | $0 |
| Total | 109 (100.0%) | $0 |
Earnings by Sex by Income Bracket in Green Bluff
The most common earnings brackets in Green Bluff are $100,000+ for men (24 | 38.7%) and $100,000+ for women (23 | 48.9%).
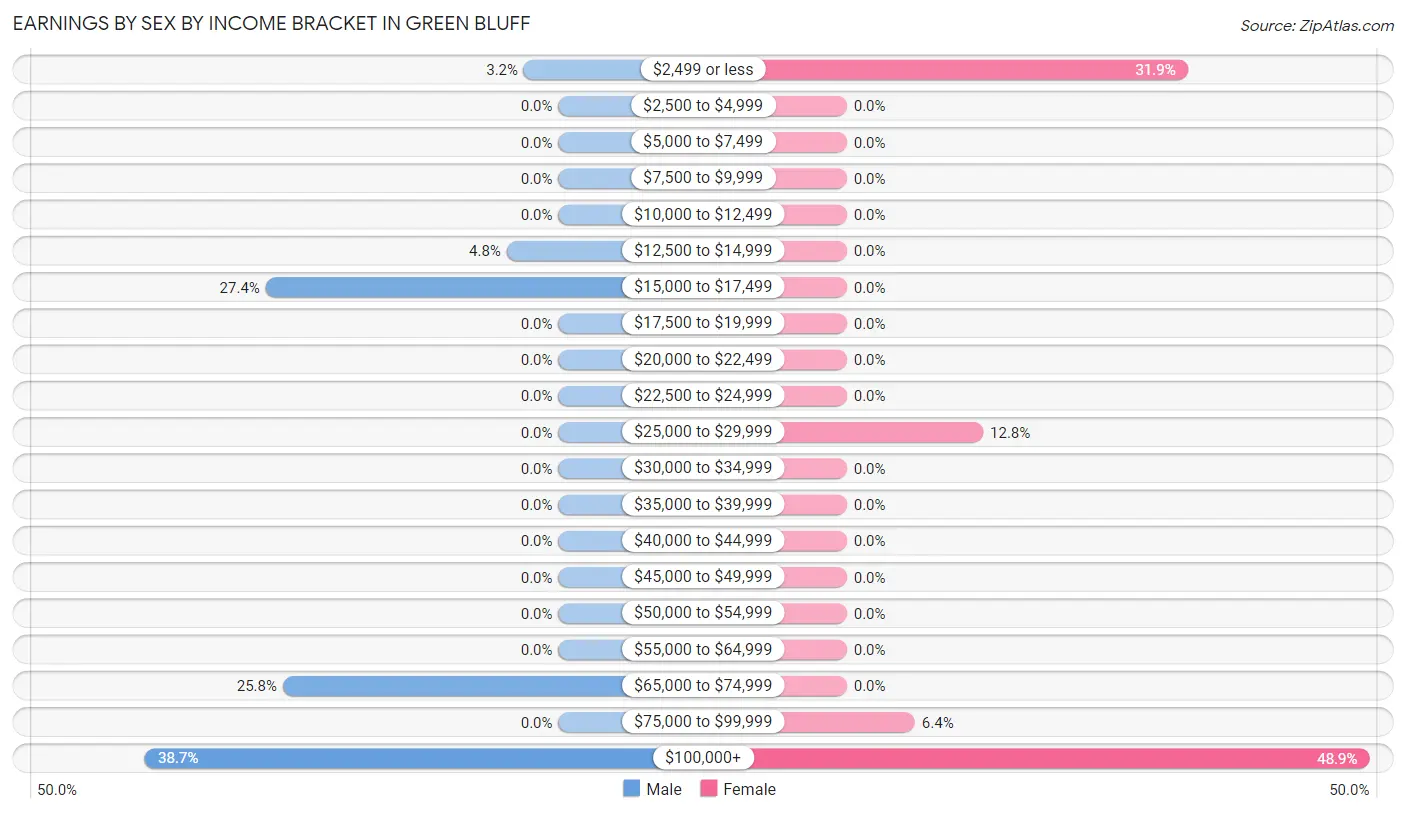
| Income | Male | Female |
| $2,499 or less | 2 (3.2%) | 15 (31.9%) |
| $2,500 to $4,999 | 0 (0.0%) | 0 (0.0%) |
| $5,000 to $7,499 | 0 (0.0%) | 0 (0.0%) |
| $7,500 to $9,999 | 0 (0.0%) | 0 (0.0%) |
| $10,000 to $12,499 | 0 (0.0%) | 0 (0.0%) |
| $12,500 to $14,999 | 3 (4.8%) | 0 (0.0%) |
| $15,000 to $17,499 | 17 (27.4%) | 0 (0.0%) |
| $17,500 to $19,999 | 0 (0.0%) | 0 (0.0%) |
| $20,000 to $22,499 | 0 (0.0%) | 0 (0.0%) |
| $22,500 to $24,999 | 0 (0.0%) | 0 (0.0%) |
| $25,000 to $29,999 | 0 (0.0%) | 6 (12.8%) |
| $30,000 to $34,999 | 0 (0.0%) | 0 (0.0%) |
| $35,000 to $39,999 | 0 (0.0%) | 0 (0.0%) |
| $40,000 to $44,999 | 0 (0.0%) | 0 (0.0%) |
| $45,000 to $49,999 | 0 (0.0%) | 0 (0.0%) |
| $50,000 to $54,999 | 0 (0.0%) | 0 (0.0%) |
| $55,000 to $64,999 | 0 (0.0%) | 0 (0.0%) |
| $65,000 to $74,999 | 16 (25.8%) | 0 (0.0%) |
| $75,000 to $99,999 | 0 (0.0%) | 3 (6.4%) |
| $100,000+ | 24 (38.7%) | 23 (48.9%) |
| Total | 62 (100.0%) | 47 (100.0%) |
Earnings by Sex by Educational Attainment in Green Bluff
| Educational Attainment | Male Income | Female Income |
| Less than High School | - | - |
| High School Diploma | - | - |
| College or Associate's Degree | - | - |
| Bachelor's Degree | - | - |
| Graduate Degree | - | - |
| Total | - | - |
Family Income in Green Bluff
Family Income Brackets in Green Bluff
According to the Green Bluff family income data, there are 30 families falling into the $200,000+ income range, which is the most common income bracket and makes up 33.3% of all families.
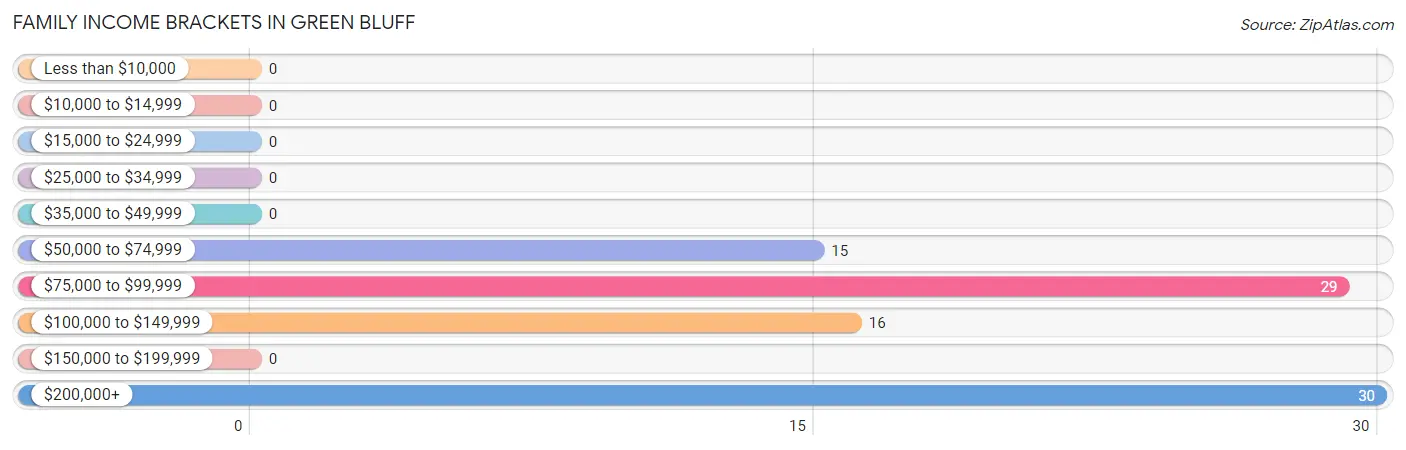
| Income Bracket | # Families | % Families |
| Less than $10,000 | 0 | 0.0% |
| $10,000 to $14,999 | 0 | 0.0% |
| $15,000 to $24,999 | 0 | 0.0% |
| $25,000 to $34,999 | 0 | 0.0% |
| $35,000 to $49,999 | 0 | 0.0% |
| $50,000 to $74,999 | 15 | 16.7% |
| $75,000 to $99,999 | 29 | 32.2% |
| $100,000 to $149,999 | 16 | 17.8% |
| $150,000 to $199,999 | 0 | 0.0% |
| $200,000+ | 30 | 33.3% |
Family Income by Famaliy Size in Green Bluff
| Income Bracket | # Families | Median Income |
| 2-Person Families | 69 (76.7%) | $0 |
| 3-Person Families | 19 (21.1%) | $0 |
| 4-Person Families | 2 (2.2%) | $0 |
| 5-Person Families | 0 (0.0%) | $0 |
| 6-Person Families | 0 (0.0%) | $0 |
| 7+ Person Families | 0 (0.0%) | $0 |
| Total | 90 (100.0%) | $0 |
Family Income by Number of Earners in Green Bluff
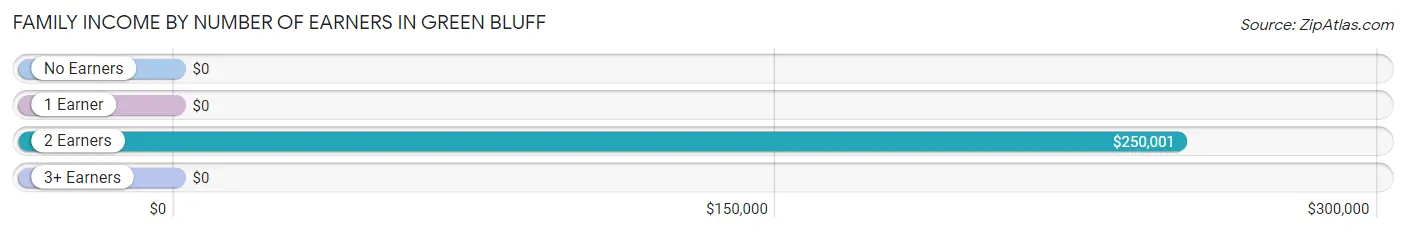
| Number of Earners | # Families | Median Income |
| No Earners | 31 (34.4%) | $0 |
| 1 Earner | 15 (16.7%) | $0 |
| 2 Earners | 44 (48.9%) | $250,001 |
| 3+ Earners | 0 (0.0%) | $0 |
| Total | 90 (100.0%) | $0 |
Household Income in Green Bluff
Household Income Brackets in Green Bluff
With 36 households falling in the category, the $75,000 to $99,999 income range is the most frequent in Green Bluff, accounting for 34.9% of all households.
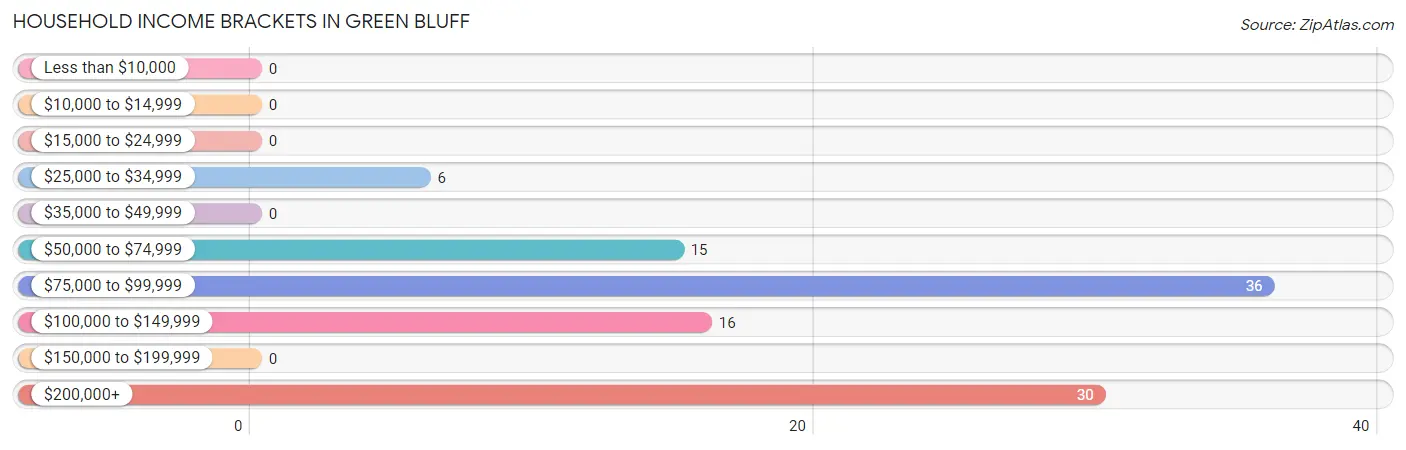
| Income Bracket | # Households | % Households |
| Less than $10,000 | 0 | 0.0% |
| $10,000 to $14,999 | 0 | 0.0% |
| $15,000 to $24,999 | 0 | 0.0% |
| $25,000 to $34,999 | 6 | 5.8% |
| $35,000 to $49,999 | 0 | 0.0% |
| $50,000 to $74,999 | 15 | 14.6% |
| $75,000 to $99,999 | 36 | 35.0% |
| $100,000 to $149,999 | 16 | 15.5% |
| $150,000 to $199,999 | 0 | 0.0% |
| $200,000+ | 30 | 29.1% |
Household Income by Householder Age in Green Bluff
The median household income in Green Bluff is $93,036, with the highest median household income of $89,904 found in the 65+ years age bracket for the primary householder. A total of 55 households (53.4%) fall into this category.
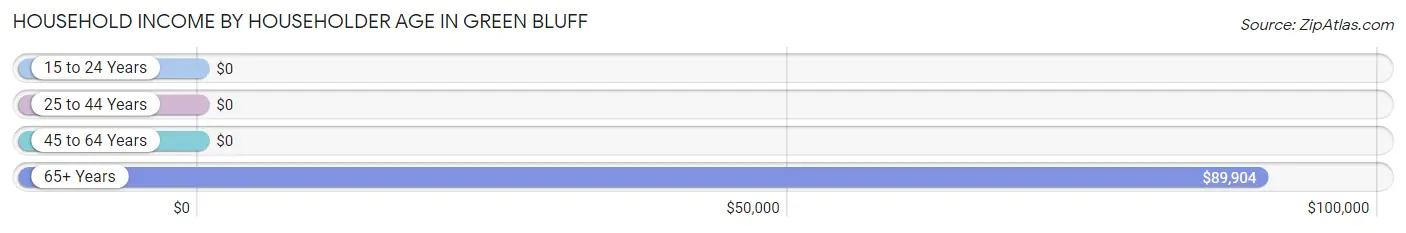
| Income Bracket | # Households | Median Income |
| 15 to 24 Years | 0 (0.0%) | $0 |
| 25 to 44 Years | 9 (8.7%) | $0 |
| 45 to 64 Years | 39 (37.9%) | $0 |
| 65+ Years | 55 (53.4%) | $89,904 |
| Total | 103 (100.0%) | $93,036 |
Poverty in Green Bluff
Income Below Poverty by Sex and Age in Green Bluff
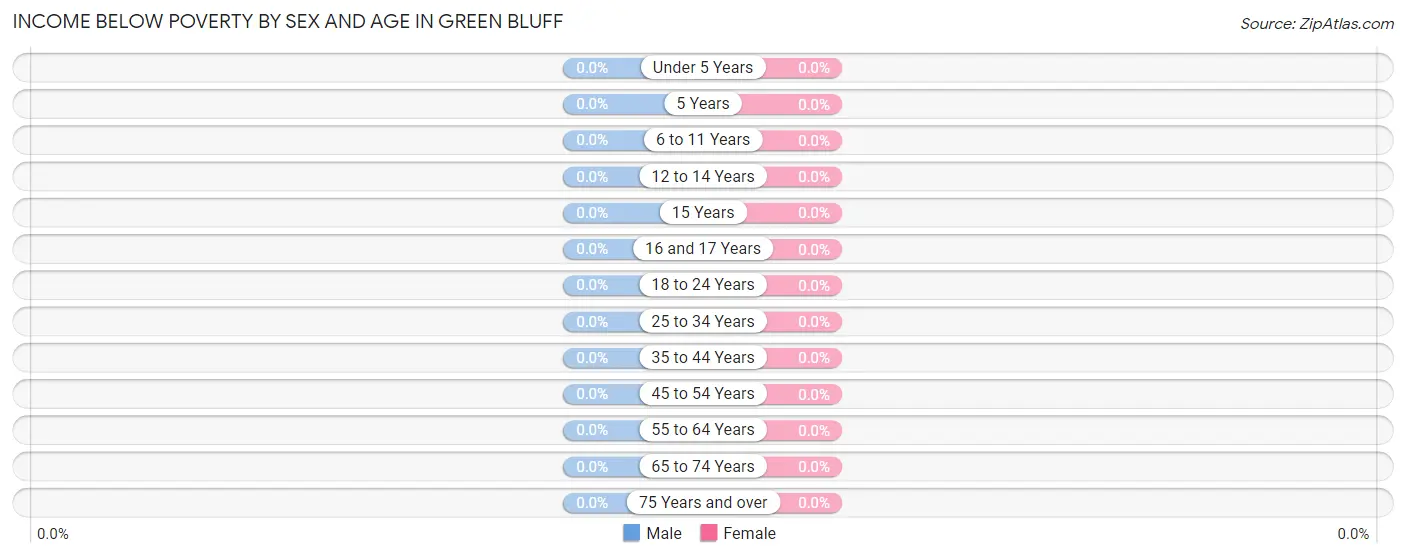
| Age Bracket | Male | Female |
| Under 5 Years | 0 (0.0%) | 0 (0.0%) |
| 5 Years | 0 (0.0%) | 0 (0.0%) |
| 6 to 11 Years | 0 (0.0%) | 0 (0.0%) |
| 12 to 14 Years | 0 (0.0%) | 0 (0.0%) |
| 15 Years | 0 (0.0%) | 0 (0.0%) |
| 16 and 17 Years | 0 (0.0%) | 0 (0.0%) |
| 18 to 24 Years | 0 (0.0%) | 0 (0.0%) |
| 25 to 34 Years | 0 (0.0%) | 0 (0.0%) |
| 35 to 44 Years | 0 (0.0%) | 0 (0.0%) |
| 45 to 54 Years | 0 (0.0%) | 0 (0.0%) |
| 55 to 64 Years | 0 (0.0%) | 0 (0.0%) |
| 65 to 74 Years | 0 (0.0%) | 0 (0.0%) |
| 75 Years and over | 0 (0.0%) | 0 (0.0%) |
| Total | 0 (0.0%) | 0 (0.0%) |
Income Above Poverty by Sex and Age in Green Bluff
According to the poverty statistics in Green Bluff, males aged 18 to 24 years and females aged under 5 years are the age groups that are most secure financially, with 100.0% of males and 100.0% of females in these age groups living above the poverty line.
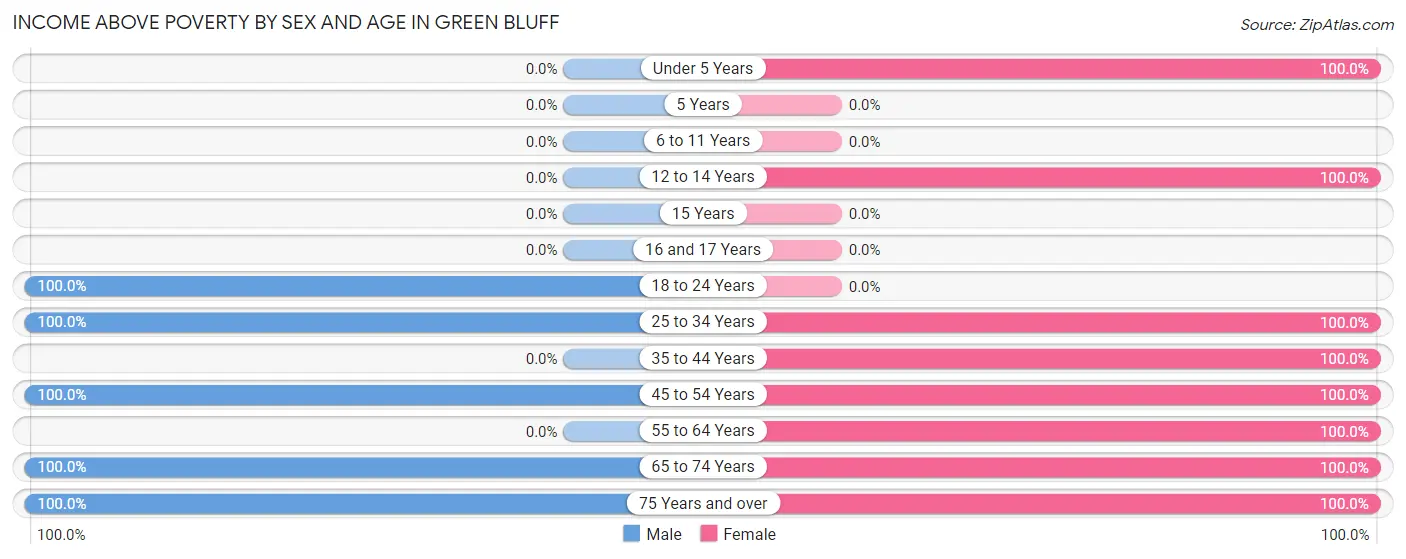
| Age Bracket | Male | Female |
| Under 5 Years | 0 (0.0%) | 3 (100.0%) |
| 5 Years | 0 (0.0%) | 0 (0.0%) |
| 6 to 11 Years | 0 (0.0%) | 0 (0.0%) |
| 12 to 14 Years | 0 (0.0%) | 15 (100.0%) |
| 15 Years | 0 (0.0%) | 0 (0.0%) |
| 16 and 17 Years | 0 (0.0%) | 0 (0.0%) |
| 18 to 24 Years | 2 (100.0%) | 0 (0.0%) |
| 25 to 34 Years | 3 (100.0%) | 3 (100.0%) |
| 35 to 44 Years | 0 (0.0%) | 6 (100.0%) |
| 45 to 54 Years | 16 (100.0%) | 15 (100.0%) |
| 55 to 64 Years | 0 (0.0%) | 23 (100.0%) |
| 65 to 74 Years | 39 (100.0%) | 15 (100.0%) |
| 75 Years and over | 35 (100.0%) | 44 (100.0%) |
| Total | 95 (100.0%) | 124 (100.0%) |
Income Below Poverty Among Married-Couple Families in Green Bluff
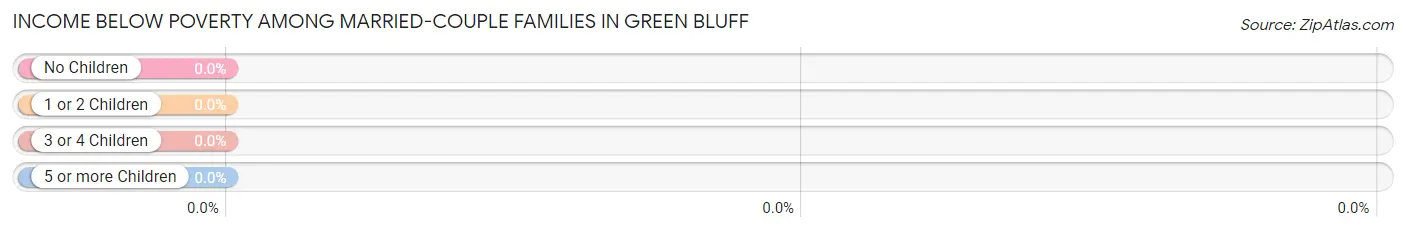
| Children | Above Poverty | Below Poverty |
| No Children | 71 (100.0%) | 0 (0.0%) |
| 1 or 2 Children | 19 (100.0%) | 0 (0.0%) |
| 3 or 4 Children | 0 (0.0%) | 0 (0.0%) |
| 5 or more Children | 0 (0.0%) | 0 (0.0%) |
| Total | 90 (100.0%) | 0 (0.0%) |
Income Below Poverty Among Single-Parent Households in Green Bluff
| Children | Single Father | Single Mother |
| No Children | 0 (0.0%) | 0 (0.0%) |
| 1 or 2 Children | 0 (0.0%) | 0 (0.0%) |
| 3 or 4 Children | 0 (0.0%) | 0 (0.0%) |
| 5 or more Children | 0 (0.0%) | 0 (0.0%) |
| Total | 0 (0.0%) | 0 (0.0%) |
Income Below Poverty Among Married-Couple vs Single-Parent Households in Green Bluff
| Children | Married-Couple Families | Single-Parent Households |
| No Children | 0 (0.0%) | 0 (0.0%) |
| 1 or 2 Children | 0 (0.0%) | 0 (0.0%) |
| 3 or 4 Children | 0 (0.0%) | 0 (0.0%) |
| 5 or more Children | 0 (0.0%) | 0 (0.0%) |
| Total | 0 (0.0%) | 0 (0.0%) |
Race in Green Bluff
The most populous races in Green Bluff are White / Caucasian (188 | 85.8%), and Two or more Races (31 | 14.2%).
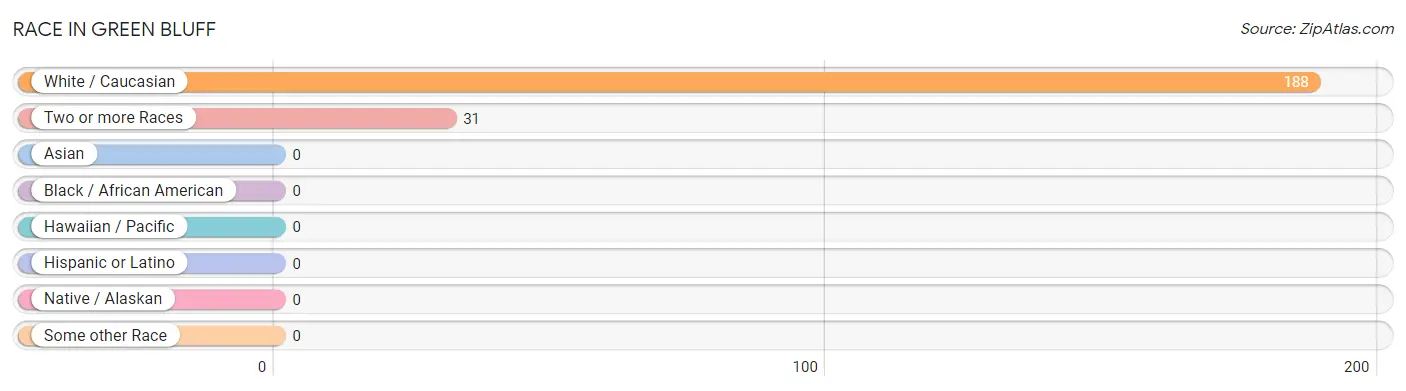
| Race | # Population | % Population |
| Asian | 0 | 0.0% |
| Black / African American | 0 | 0.0% |
| Hawaiian / Pacific | 0 | 0.0% |
| Hispanic or Latino | 0 | 0.0% |
| Native / Alaskan | 0 | 0.0% |
| White / Caucasian | 188 | 85.8% |
| Two or more Races | 31 | 14.2% |
| Some other Race | 0 | 0.0% |
| Total | 219 | 100.0% |
Ancestry in Green Bluff
The most populous ancestries reported in Green Bluff are German (43 | 19.6%), Italian (29 | 13.2%), English (27 | 12.3%), Irish (24 | 11.0%), and Dutch (8 | 3.6%), together accounting for 59.8% of all Green Bluff residents.
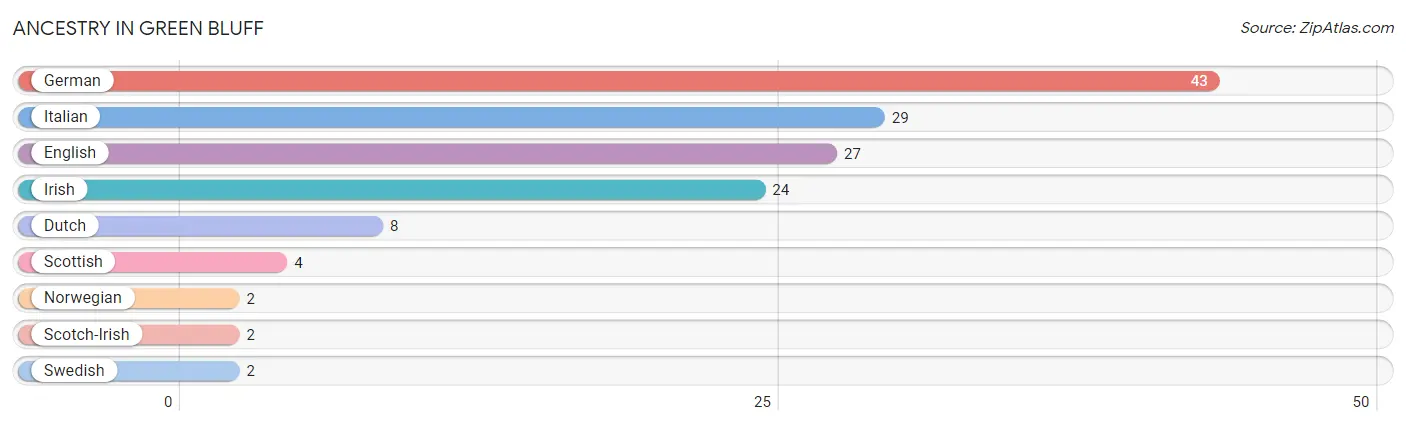
| Ancestry | # Population | % Population |
| Dutch | 8 | 3.6% |
| English | 27 | 12.3% |
| German | 43 | 19.6% |
| Irish | 24 | 11.0% |
| Italian | 29 | 13.2% |
| Norwegian | 2 | 0.9% |
| Scotch-Irish | 2 | 0.9% |
| Scottish | 4 | 1.8% |
| Swedish | 2 | 0.9% | View All 9 Rows |
Immigrants in Green Bluff

| Immigration Origin | # Population | % Population | View All 0 Rows |
Sex and Age in Green Bluff
Sex and Age in Green Bluff
The most populous age groups in Green Bluff are 80 to 84 Years (33 | 34.7%) for men and 60 to 64 Years (23 | 18.5%) for women.
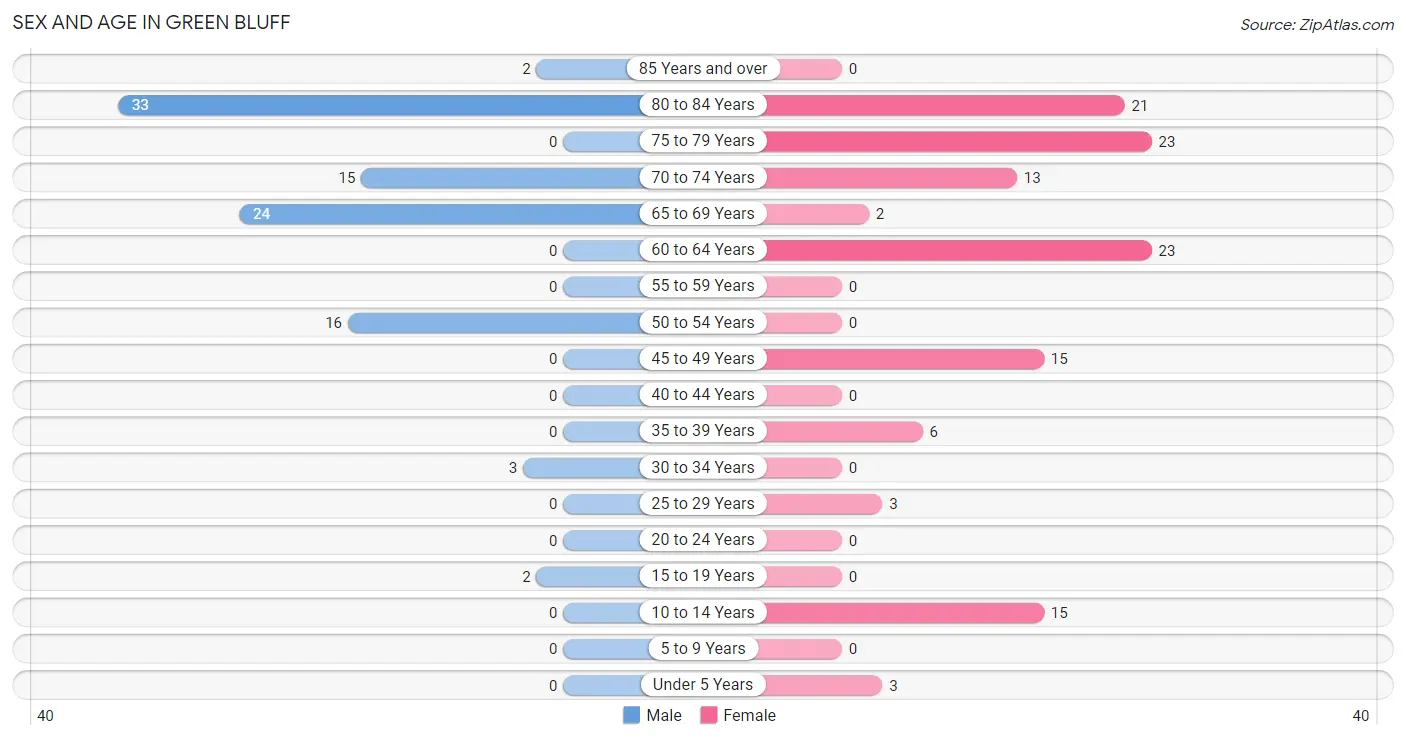
| Age Bracket | Male | Female |
| Under 5 Years | 0 (0.0%) | 3 (2.4%) |
| 5 to 9 Years | 0 (0.0%) | 0 (0.0%) |
| 10 to 14 Years | 0 (0.0%) | 15 (12.1%) |
| 15 to 19 Years | 2 (2.1%) | 0 (0.0%) |
| 20 to 24 Years | 0 (0.0%) | 0 (0.0%) |
| 25 to 29 Years | 0 (0.0%) | 3 (2.4%) |
| 30 to 34 Years | 3 (3.2%) | 0 (0.0%) |
| 35 to 39 Years | 0 (0.0%) | 6 (4.8%) |
| 40 to 44 Years | 0 (0.0%) | 0 (0.0%) |
| 45 to 49 Years | 0 (0.0%) | 15 (12.1%) |
| 50 to 54 Years | 16 (16.8%) | 0 (0.0%) |
| 55 to 59 Years | 0 (0.0%) | 0 (0.0%) |
| 60 to 64 Years | 0 (0.0%) | 23 (18.5%) |
| 65 to 69 Years | 24 (25.3%) | 2 (1.6%) |
| 70 to 74 Years | 15 (15.8%) | 13 (10.5%) |
| 75 to 79 Years | 0 (0.0%) | 23 (18.5%) |
| 80 to 84 Years | 33 (34.7%) | 21 (16.9%) |
| 85 Years and over | 2 (2.1%) | 0 (0.0%) |
| Total | 95 (100.0%) | 124 (100.0%) |
Families and Households in Green Bluff
Median Family Size in Green Bluff
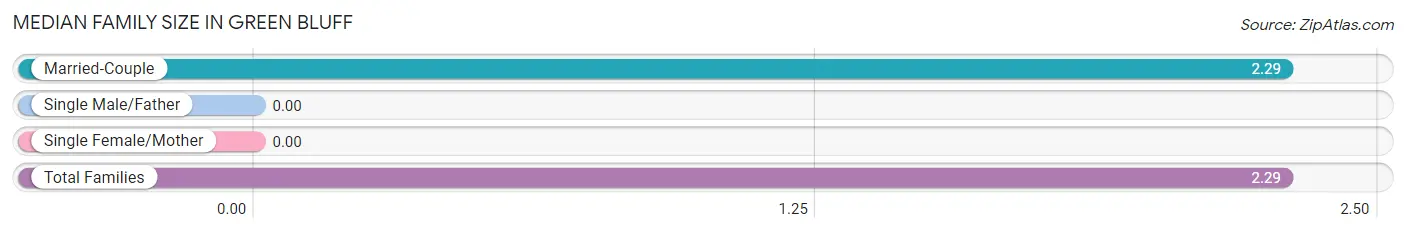
| Family Type | # Families | Family Size |
| Married-Couple | 90 (100.0%) | 2.29 |
| Single Male/Father | 0 (0.0%) | - |
| Single Female/Mother | 0 (0.0%) | - |
| Total Families | 90 (100.0%) | 2.29 |
Median Household Size in Green Bluff
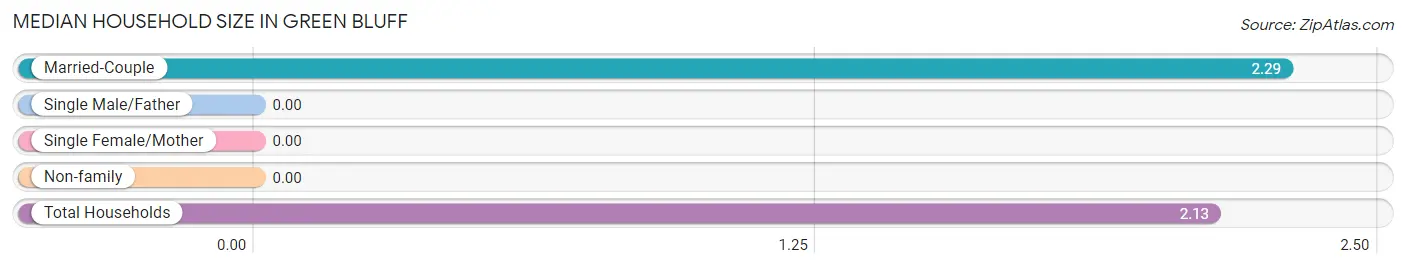
| Household Type | # Households | Household Size |
| Married-Couple | 90 (87.4%) | 2.29 |
| Single Male/Father | 0 (0.0%) | - |
| Single Female/Mother | 0 (0.0%) | - |
| Non-family | 13 (12.6%) | - |
| Total Households | 103 (100.0%) | 2.13 |
Household Size by Marriage Status in Green Bluff
Out of a total of 103 households in Green Bluff, 90 (87.4%) are family households, while 13 (12.6%) are nonfamily households. The most numerous type of family households are 2-person households, comprising 69, and the most common type of nonfamily households are 1-person households, comprising 13.
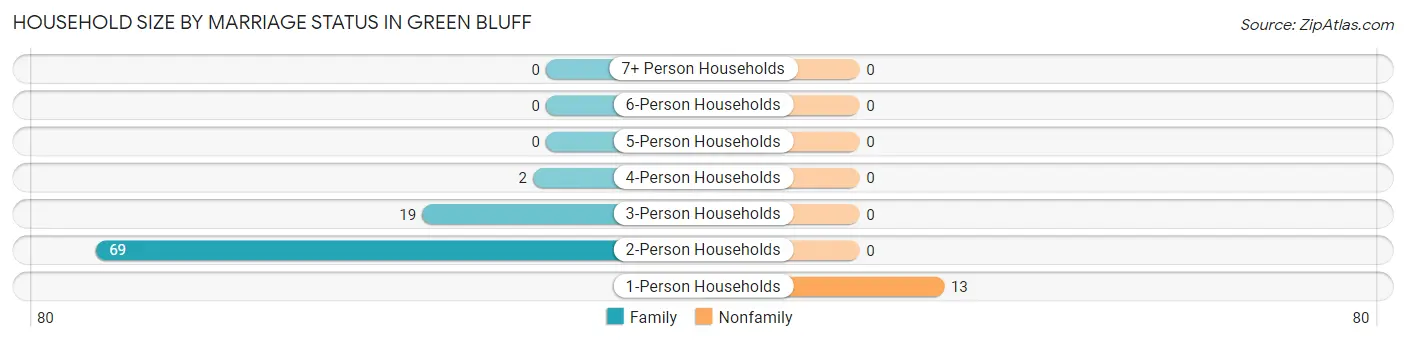
| Household Size | Family Households | Nonfamily Households |
| 1-Person Households | - | 13 (12.6%) |
| 2-Person Households | 69 (67.0%) | 0 (0.0%) |
| 3-Person Households | 19 (18.4%) | 0 (0.0%) |
| 4-Person Households | 2 (1.9%) | 0 (0.0%) |
| 5-Person Households | 0 (0.0%) | 0 (0.0%) |
| 6-Person Households | 0 (0.0%) | 0 (0.0%) |
| 7+ Person Households | 0 (0.0%) | 0 (0.0%) |
| Total | 90 (87.4%) | 13 (12.6%) |
Female Fertility in Green Bluff
Fertility by Age in Green Bluff
Average fertility rate in Green Bluff is 125.0 births per 1,000 women. Women in the age bracket of 20 to 34 years have the highest fertility rate with 1,000.0 births per 1,000 women. Women in the age bracket of 20 to 34 years acount for 100.0% of all women with births.
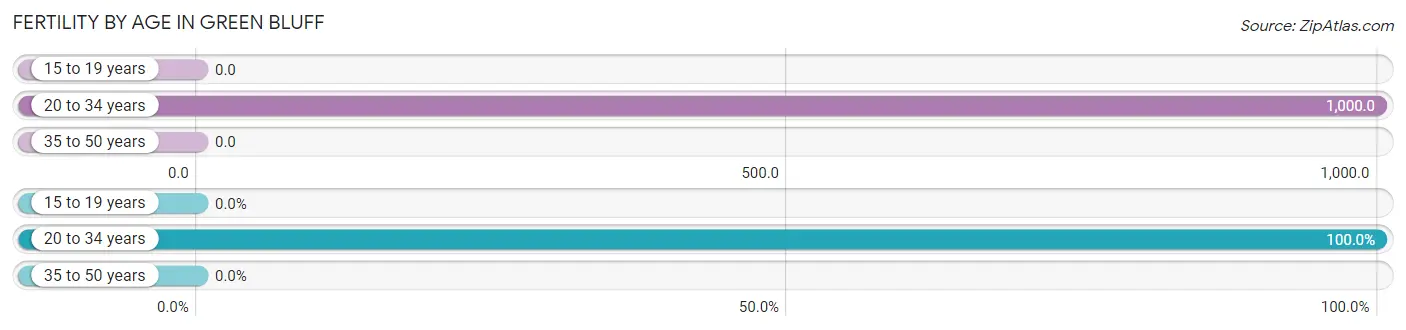
| Age Bracket | Women with Births | Births / 1,000 Women |
| 15 to 19 years | 0 (0.0%) | 0.0 |
| 20 to 34 years | 3 (100.0%) | 1,000.0 |
| 35 to 50 years | 0 (0.0%) | 0.0 |
| Total | 3 (100.0%) | 125.0 |
Fertility by Age by Marriage Status in Green Bluff
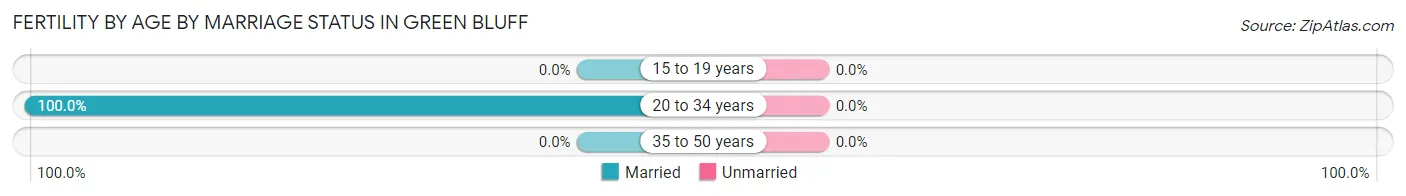
| Age Bracket | Married | Unmarried |
| 15 to 19 years | 0 (0.0%) | 0 (0.0%) |
| 20 to 34 years | 3 (100.0%) | 0 (0.0%) |
| 35 to 50 years | 0 (0.0%) | 0 (0.0%) |
| Total | 3 (100.0%) | 0 (0.0%) |
Fertility by Education in Green Bluff
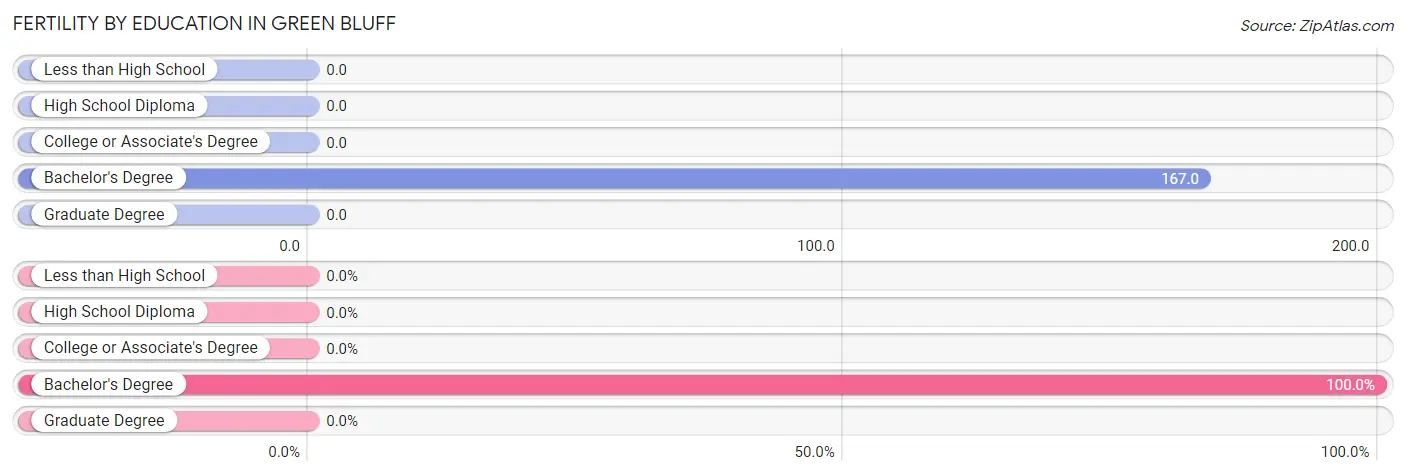
| Educational Attainment | Women with Births | Births / 1,000 Women |
| Less than High School | 0 (0.0%) | 0.0 |
| High School Diploma | 0 (0.0%) | 0.0 |
| College or Associate's Degree | 0 (0.0%) | 0.0 |
| Bachelor's Degree | 3 (100.0%) | 167.0 |
| Graduate Degree | 0 (0.0%) | 0.0 |
| Total | 3 (100.0%) | 125.0 |
Fertility by Education by Marriage Status in Green Bluff
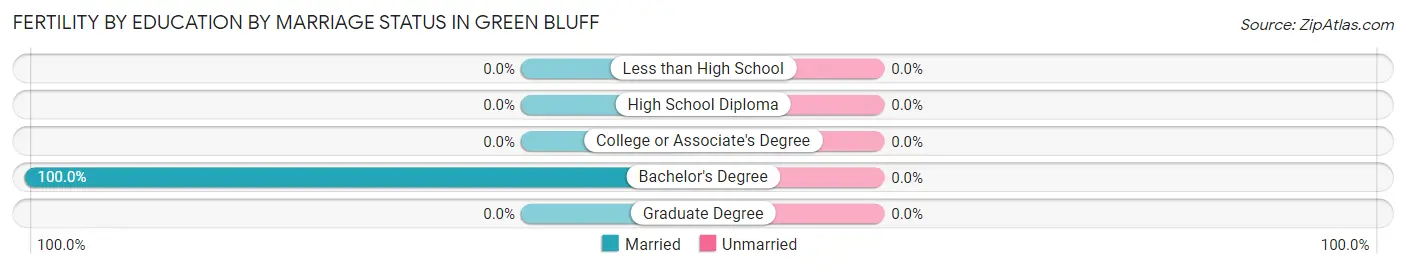
| Educational Attainment | Married | Unmarried |
| Less than High School | 0 (0.0%) | 0 (0.0%) |
| High School Diploma | 0 (0.0%) | 0 (0.0%) |
| College or Associate's Degree | 0 (0.0%) | 0 (0.0%) |
| Bachelor's Degree | 3 (100.0%) | 0 (0.0%) |
| Graduate Degree | 0 (0.0%) | 0 (0.0%) |
| Total | 3 (100.0%) | 0 (0.0%) |
Employment Characteristics in Green Bluff
Employment by Class of Employer in Green Bluff
Among the 103 employed individuals in Green Bluff, private company employees (33 | 32.0%), self-employed (incorporated) (24 | 23.3%), and federal government employees (16 | 15.5%) make up the most common classes of employment.
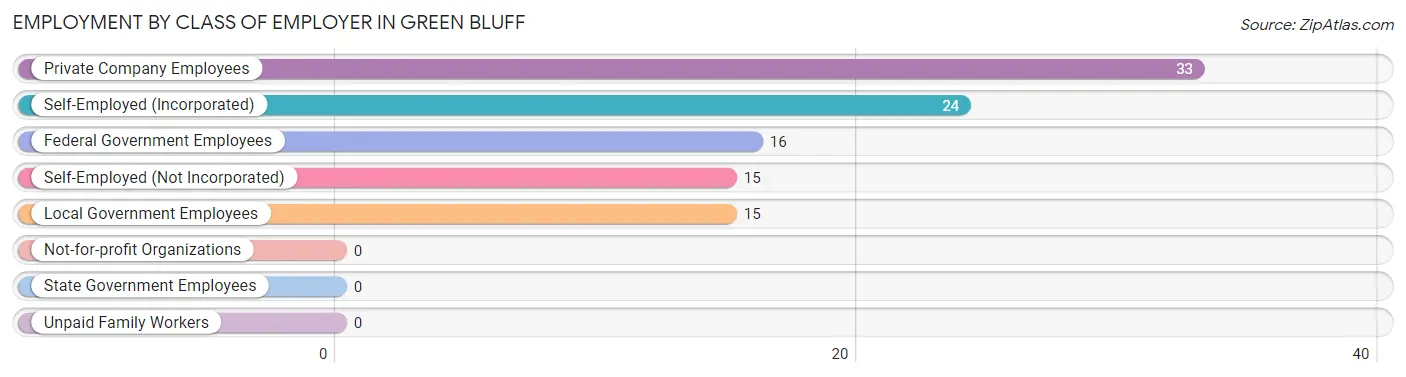
| Employer Class | # Employees | % Employees |
| Private Company Employees | 33 | 32.0% |
| Self-Employed (Incorporated) | 24 | 23.3% |
| Self-Employed (Not Incorporated) | 15 | 14.6% |
| Not-for-profit Organizations | 0 | 0.0% |
| Local Government Employees | 15 | 14.6% |
| State Government Employees | 0 | 0.0% |
| Federal Government Employees | 16 | 15.5% |
| Unpaid Family Workers | 0 | 0.0% |
| Total | 103 | 100.0% |
Employment Status by Age in Green Bluff
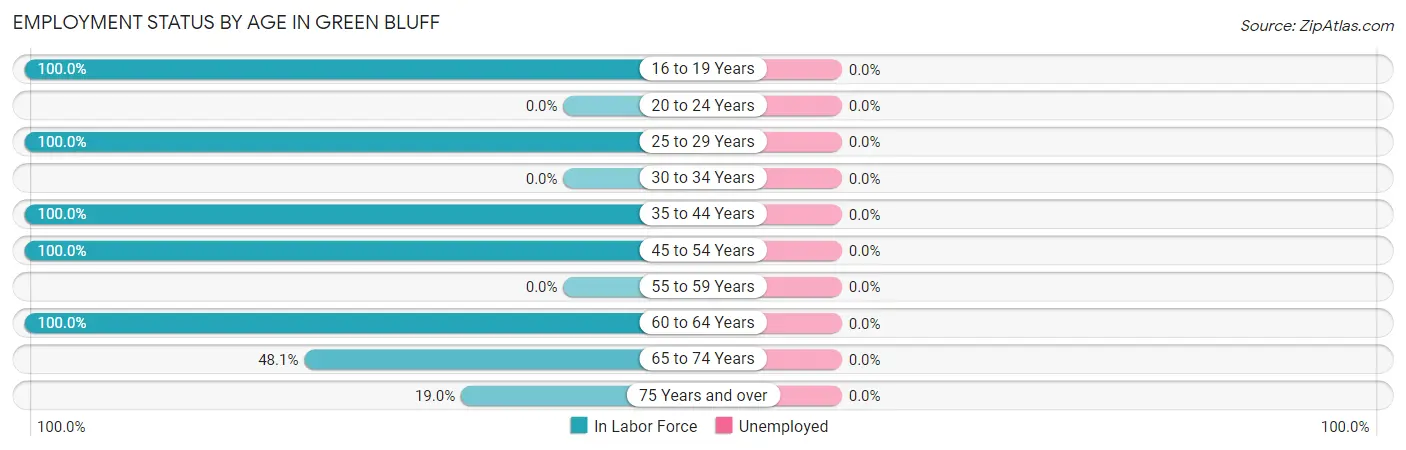
| Age Bracket | In Labor Force | Unemployed |
| 16 to 19 Years | 2 (100.0%) | 0 (0.0%) |
| 20 to 24 Years | 0 (0.0%) | 0 (0.0%) |
| 25 to 29 Years | 3 (100.0%) | 0 (0.0%) |
| 30 to 34 Years | 0 (0.0%) | 0 (0.0%) |
| 35 to 44 Years | 6 (100.0%) | 0 (0.0%) |
| 45 to 54 Years | 31 (100.0%) | 0 (0.0%) |
| 55 to 59 Years | 0 (0.0%) | 0 (0.0%) |
| 60 to 64 Years | 23 (100.0%) | 0 (0.0%) |
| 65 to 74 Years | 26 (48.1%) | 0 (0.0%) |
| 75 Years and over | 15 (19.0%) | 0 (0.0%) |
| Total | 106 (52.7%) | 0 (0.0%) |
Employment Status by Educational Attainment in Green Bluff
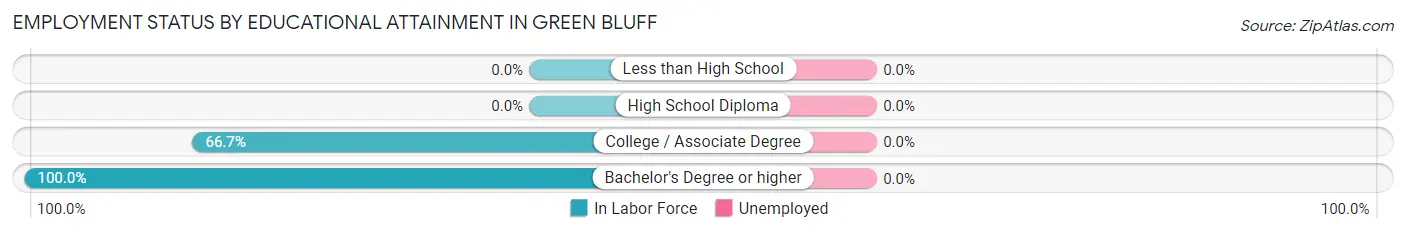
| Educational Attainment | In Labor Force | Unemployed |
| Less than High School | 0 (0.0%) | 0 (0.0%) |
| High School Diploma | 0 (0.0%) | 0 (0.0%) |
| College / Associate Degree | 6 (66.7%) | 0 (0.0%) |
| Bachelor's Degree or higher | 57 (100.0%) | 0 (0.0%) |
| Total | 63 (95.5%) | 0 (0.0%) |
Employment Occupations by Sex in Green Bluff
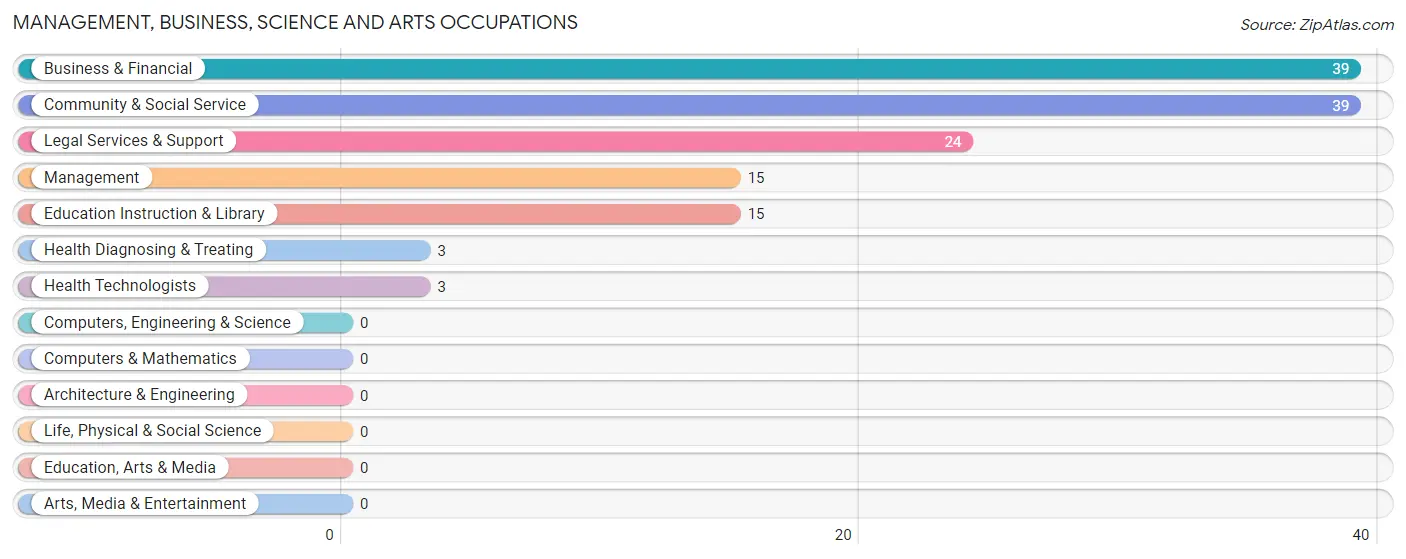
Management, Business, Science and Arts Occupations
The most common Management, Business, Science and Arts occupations in Green Bluff are Business & Financial (39 | 36.8%), Community & Social Service (39 | 36.8%), Legal Services & Support (24 | 22.6%), Management (15 | 14.1%), and Education Instruction & Library (15 | 14.1%).
Management, Business, Science and Arts Occupations by Sex
Within the Management, Business, Science and Arts occupations in Green Bluff, the most male-oriented occupations are Management (100.0%), Legal Services & Support (100.0%), and Community & Social Service (61.5%), while the most female-oriented occupations are Education Instruction & Library (100.0%), Health Diagnosing & Treating (100.0%), and Health Technologists (100.0%).
| Occupation | Male | Female |
| Management | 15 (100.0%) | 0 (0.0%) |
| Business & Financial | 16 (41.0%) | 23 (59.0%) |
| Computers, Engineering & Science | 0 (0.0%) | 0 (0.0%) |
| Computers & Mathematics | 0 (0.0%) | 0 (0.0%) |
| Architecture & Engineering | 0 (0.0%) | 0 (0.0%) |
| Life, Physical & Social Science | 0 (0.0%) | 0 (0.0%) |
| Community & Social Service | 24 (61.5%) | 15 (38.5%) |
| Education, Arts & Media | 0 (0.0%) | 0 (0.0%) |
| Legal Services & Support | 24 (100.0%) | 0 (0.0%) |
| Education Instruction & Library | 0 (0.0%) | 15 (100.0%) |
| Arts, Media & Entertainment | 0 (0.0%) | 0 (0.0%) |
| Health Diagnosing & Treating | 0 (0.0%) | 3 (100.0%) |
| Health Technologists | 0 (0.0%) | 3 (100.0%) |
| Total (Category) | 55 (57.3%) | 41 (42.7%) |
| Total (Overall) | 59 (55.7%) | 47 (44.3%) |
Services Occupations
Services Occupations by Sex
| Occupation | Male | Female |
| Healthcare Support | 0 (0.0%) | 0 (0.0%) |
| Security & Protection | 0 (0.0%) | 0 (0.0%) |
| Firefighting & Prevention | 0 (0.0%) | 0 (0.0%) |
| Law Enforcement | 0 (0.0%) | 0 (0.0%) |
| Food Preparation & Serving | 0 (0.0%) | 0 (0.0%) |
| Cleaning & Maintenance | 0 (0.0%) | 0 (0.0%) |
| Personal Care & Service | 0 (0.0%) | 0 (0.0%) |
| Total (Category) | 0 (0.0%) | 0 (0.0%) |
| Total (Overall) | 59 (55.7%) | 47 (44.3%) |
Sales and Office Occupations

Sales and Office Occupations by Sex
| Occupation | Male | Female |
| Sales & Related | 0 (0.0%) | 0 (0.0%) |
| Office & Administration | 0 (0.0%) | 0 (0.0%) |
| Total (Category) | 0 (0.0%) | 0 (0.0%) |
| Total (Overall) | 59 (55.7%) | 47 (44.3%) |
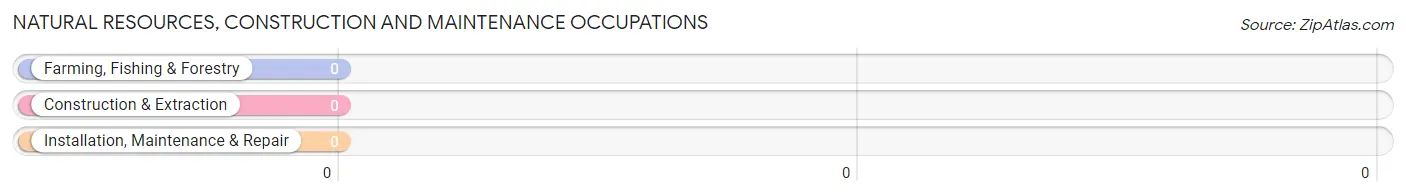
Natural Resources, Construction and Maintenance Occupations
Natural Resources, Construction and Maintenance Occupations by Sex
| Occupation | Male | Female |
| Farming, Fishing & Forestry | 0 (0.0%) | 0 (0.0%) |
| Construction & Extraction | 0 (0.0%) | 0 (0.0%) |
| Installation, Maintenance & Repair | 0 (0.0%) | 0 (0.0%) |
| Total (Category) | 0 (0.0%) | 0 (0.0%) |
| Total (Overall) | 59 (55.7%) | 47 (44.3%) |
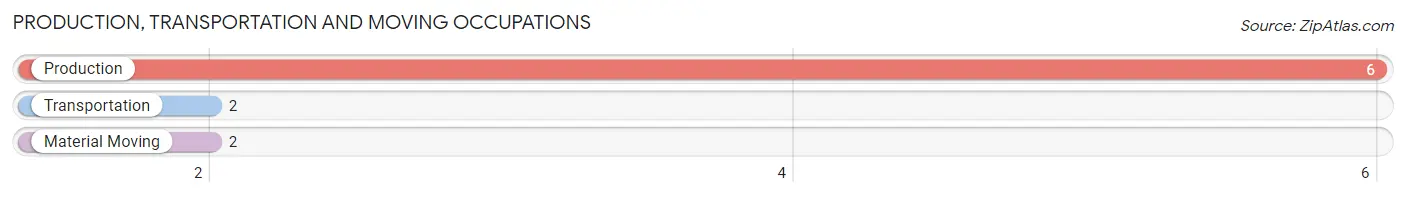
Production, Transportation and Moving Occupations
The most common Production, Transportation and Moving occupations in Green Bluff are Production (6 | 5.7%), Transportation (2 | 1.9%), and Material Moving (2 | 1.9%).
Production, Transportation and Moving Occupations by Sex
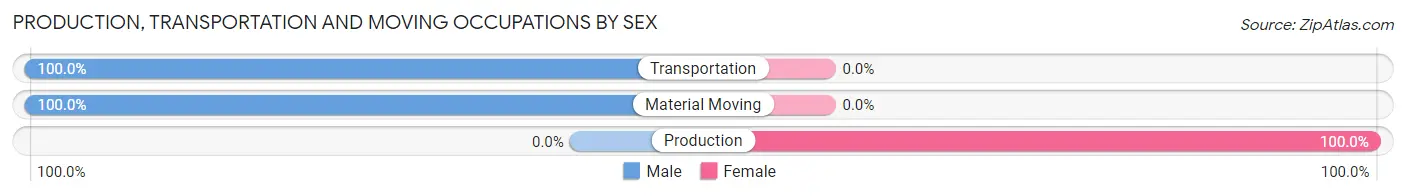
| Occupation | Male | Female |
| Production | 0 (0.0%) | 6 (100.0%) |
| Transportation | 2 (100.0%) | 0 (0.0%) |
| Material Moving | 2 (100.0%) | 0 (0.0%) |
| Total (Category) | 4 (40.0%) | 6 (60.0%) |
| Total (Overall) | 59 (55.7%) | 47 (44.3%) |
Employment Industries by Sex in Green Bluff
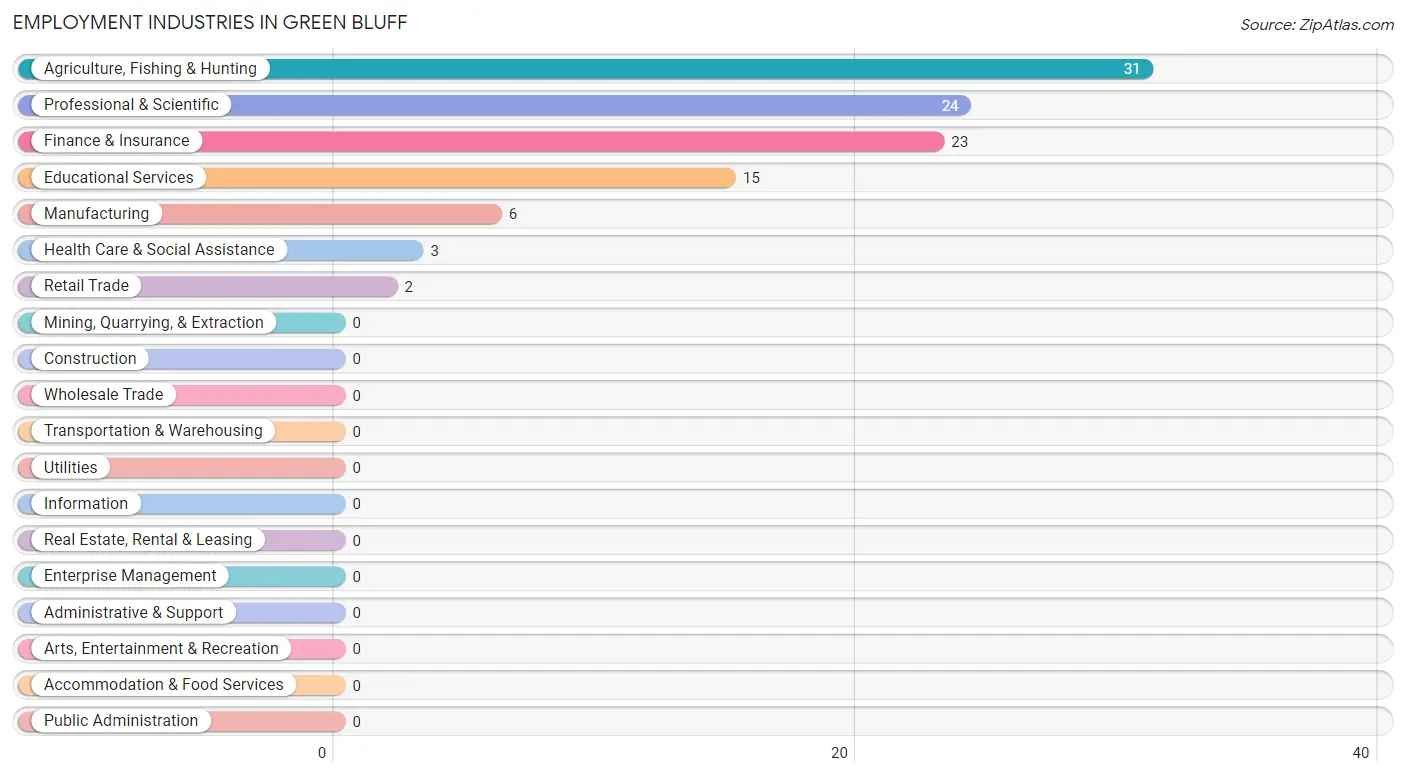
Employment Industries in Green Bluff
The major employment industries in Green Bluff include Agriculture, Fishing & Hunting (31 | 29.2%), Professional & Scientific (24 | 22.6%), Finance & Insurance (23 | 21.7%), Educational Services (15 | 14.1%), and Manufacturing (6 | 5.7%).
Employment Industries by Sex in Green Bluff
The Green Bluff industries that see more men than women are Agriculture, Fishing & Hunting (100.0%), Retail Trade (100.0%), and Professional & Scientific (100.0%), whereas the industries that tend to have a higher number of women are Manufacturing (100.0%), Finance & Insurance (100.0%), and Educational Services (100.0%).
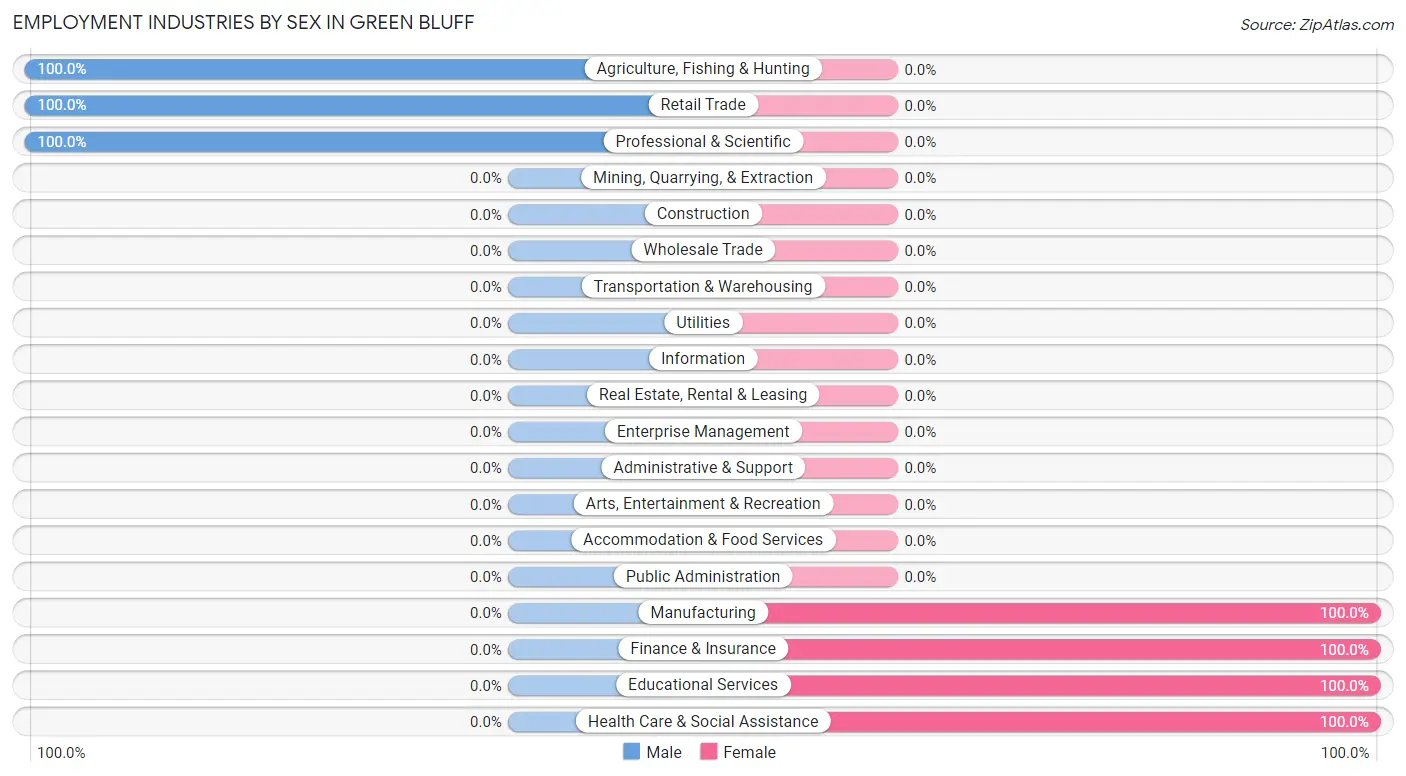
| Industry | Male | Female |
| Agriculture, Fishing & Hunting | 31 (100.0%) | 0 (0.0%) |
| Mining, Quarrying, & Extraction | 0 (0.0%) | 0 (0.0%) |
| Construction | 0 (0.0%) | 0 (0.0%) |
| Manufacturing | 0 (0.0%) | 6 (100.0%) |
| Wholesale Trade | 0 (0.0%) | 0 (0.0%) |
| Retail Trade | 2 (100.0%) | 0 (0.0%) |
| Transportation & Warehousing | 0 (0.0%) | 0 (0.0%) |
| Utilities | 0 (0.0%) | 0 (0.0%) |
| Information | 0 (0.0%) | 0 (0.0%) |
| Finance & Insurance | 0 (0.0%) | 23 (100.0%) |
| Real Estate, Rental & Leasing | 0 (0.0%) | 0 (0.0%) |
| Professional & Scientific | 24 (100.0%) | 0 (0.0%) |
| Enterprise Management | 0 (0.0%) | 0 (0.0%) |
| Administrative & Support | 0 (0.0%) | 0 (0.0%) |
| Educational Services | 0 (0.0%) | 15 (100.0%) |
| Health Care & Social Assistance | 0 (0.0%) | 3 (100.0%) |
| Arts, Entertainment & Recreation | 0 (0.0%) | 0 (0.0%) |
| Accommodation & Food Services | 0 (0.0%) | 0 (0.0%) |
| Public Administration | 0 (0.0%) | 0 (0.0%) |
| Total | 59 (55.7%) | 47 (44.3%) |
Education in Green Bluff
School Enrollment in Green Bluff
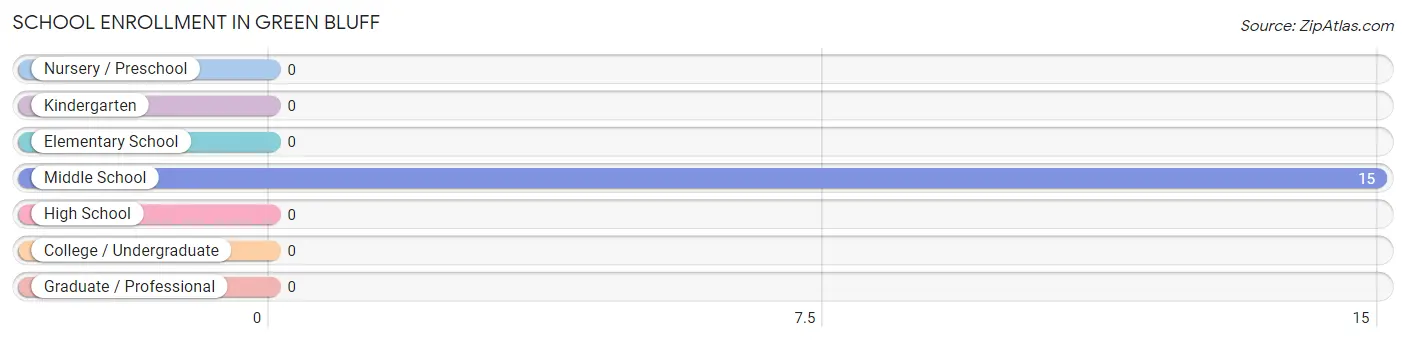
| School Level | # Students | % Students |
| Nursery / Preschool | 0 | 0.0% |
| Kindergarten | 0 | 0.0% |
| Elementary School | 0 | 0.0% |
| Middle School | 15 | 100.0% |
| High School | 0 | 0.0% |
| College / Undergraduate | 0 | 0.0% |
| Graduate / Professional | 0 | 0.0% |
| Total | 15 | 100.0% |
School Enrollment by Age by Funding Source in Green Bluff
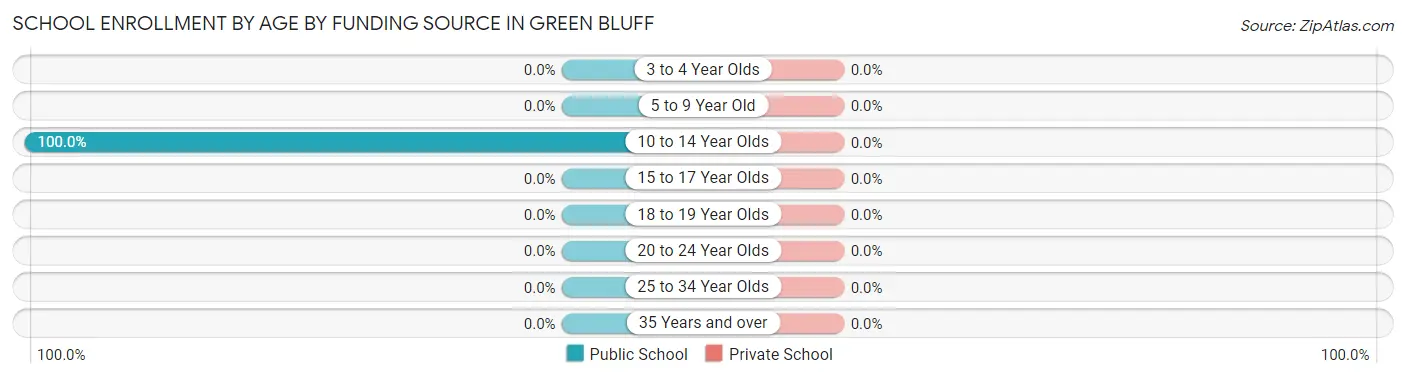
| Age Bracket | Public School | Private School |
| 3 to 4 Year Olds | 0 (0.0%) | 0 (0.0%) |
| 5 to 9 Year Old | 0 (0.0%) | 0 (0.0%) |
| 10 to 14 Year Olds | 15 (100.0%) | 0 (0.0%) |
| 15 to 17 Year Olds | 0 (0.0%) | 0 (0.0%) |
| 18 to 19 Year Olds | 0 (0.0%) | 0 (0.0%) |
| 20 to 24 Year Olds | 0 (0.0%) | 0 (0.0%) |
| 25 to 34 Year Olds | 0 (0.0%) | 0 (0.0%) |
| 35 Years and over | 0 (0.0%) | 0 (0.0%) |
| Total | 15 (100.0%) | 0 (0.0%) |
Educational Attainment by Field of Study in Green Bluff
Bio, nature & agricultural (30 | 19.4%), psychology (24 | 15.5%), literature & languages (23 | 14.8%), arts & humanities (23 | 14.8%), and education (21 | 13.6%) are the most common fields of study among 155 individuals in Green Bluff who have obtained a bachelor's degree or higher.
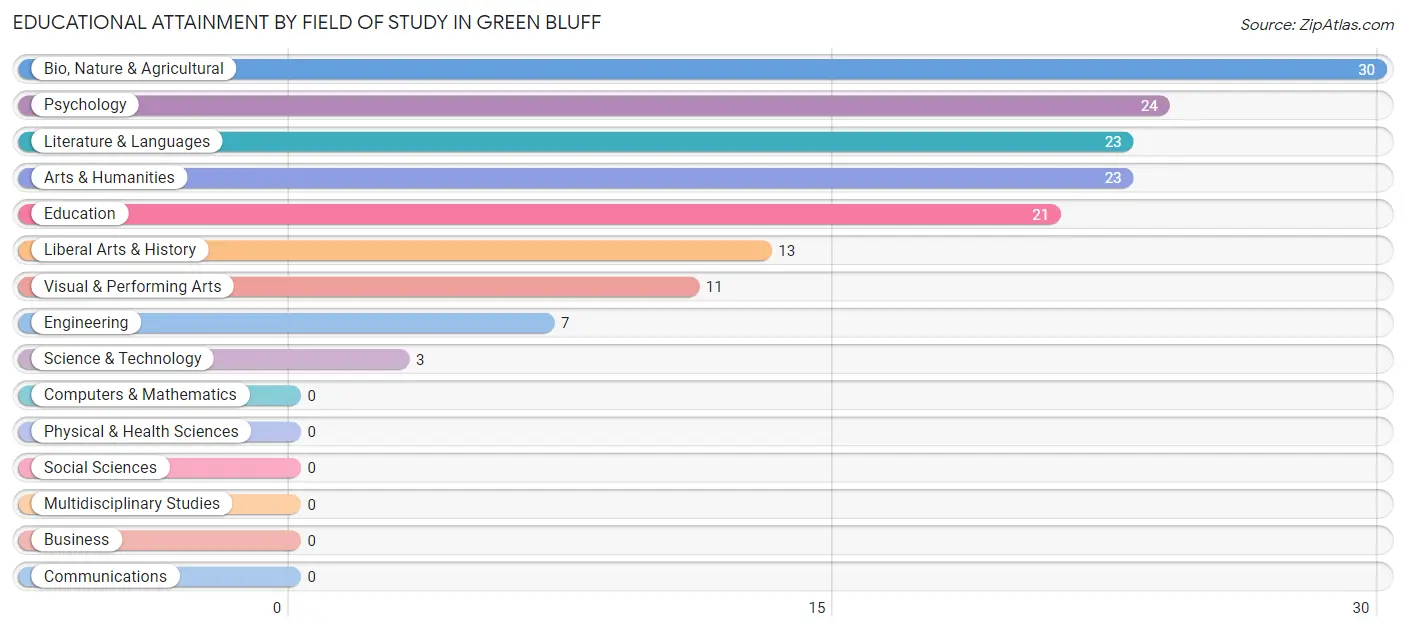
| Field of Study | # Graduates | % Graduates |
| Computers & Mathematics | 0 | 0.0% |
| Bio, Nature & Agricultural | 30 | 19.4% |
| Physical & Health Sciences | 0 | 0.0% |
| Psychology | 24 | 15.5% |
| Social Sciences | 0 | 0.0% |
| Engineering | 7 | 4.5% |
| Multidisciplinary Studies | 0 | 0.0% |
| Science & Technology | 3 | 1.9% |
| Business | 0 | 0.0% |
| Education | 21 | 13.6% |
| Literature & Languages | 23 | 14.8% |
| Liberal Arts & History | 13 | 8.4% |
| Visual & Performing Arts | 11 | 7.1% |
| Communications | 0 | 0.0% |
| Arts & Humanities | 23 | 14.8% |
| Total | 155 | 100.0% |
Transportation & Commute in Green Bluff
Vehicle Availability by Sex in Green Bluff
The most prevalent vehicle ownership categories in Green Bluff are males with 3 vehicles (39, accounting for 66.1%) and females with 3 vehicles (23, making up 88.6%).
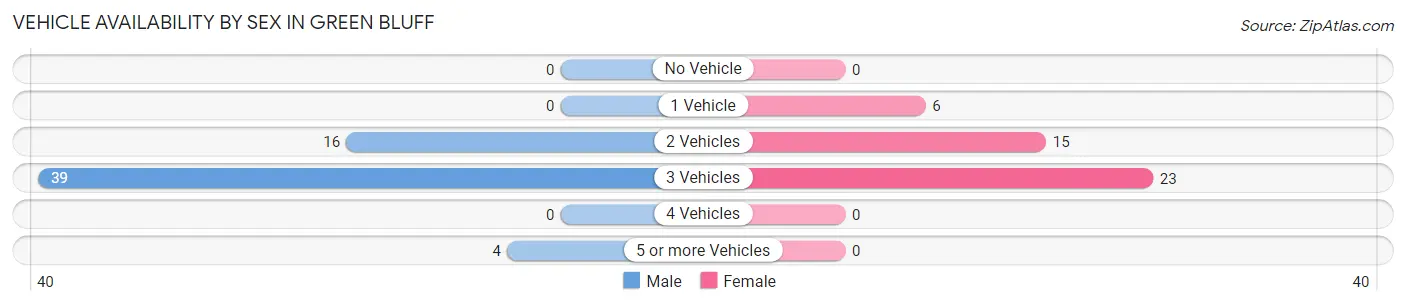
| Vehicles Available | Male | Female |
| No Vehicle | 0 (0.0%) | 0 (0.0%) |
| 1 Vehicle | 0 (0.0%) | 6 (13.6%) |
| 2 Vehicles | 16 (27.1%) | 15 (34.1%) |
| 3 Vehicles | 39 (66.1%) | 23 (52.3%) |
| 4 Vehicles | 0 (0.0%) | 0 (0.0%) |
| 5 or more Vehicles | 4 (6.8%) | 0 (0.0%) |
| Total | 59 (100.0%) | 44 (100.0%) |
Commute Time in Green Bluff
The most frequently occuring commute durations in Green Bluff are 45 to 59 minutes (30 commuters, 34.5%), 15 to 19 minutes (23 commuters, 26.4%), and 10 to 14 minutes (15 commuters, 17.2%).
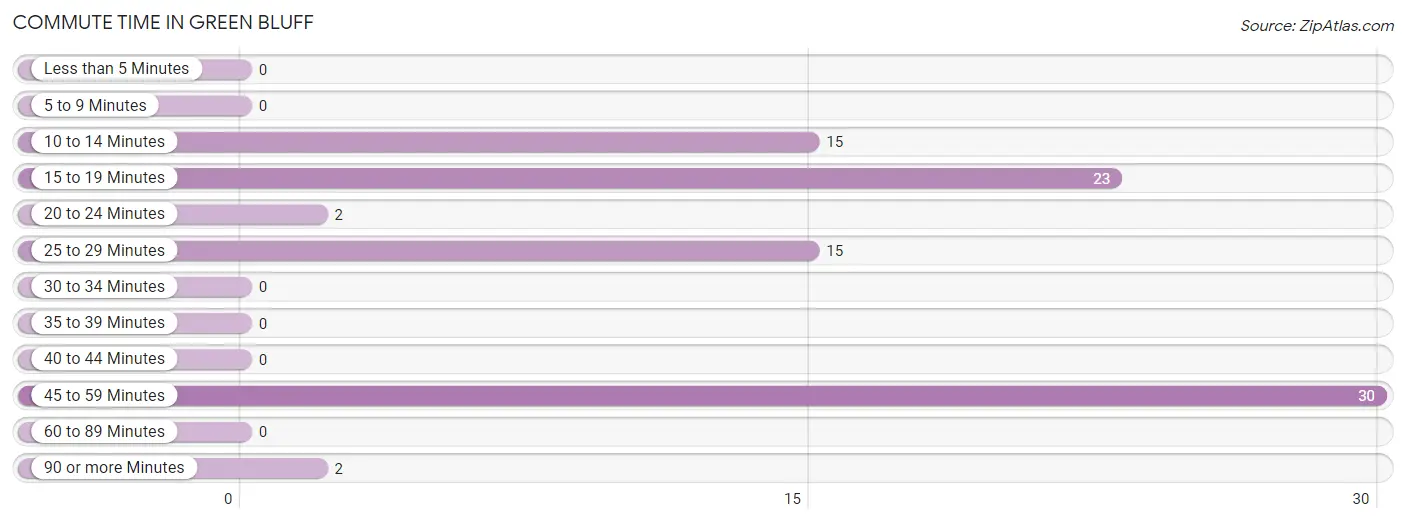
| Commute Time | # Commuters | % Commuters |
| Less than 5 Minutes | 0 | 0.0% |
| 5 to 9 Minutes | 0 | 0.0% |
| 10 to 14 Minutes | 15 | 17.2% |
| 15 to 19 Minutes | 23 | 26.4% |
| 20 to 24 Minutes | 2 | 2.3% |
| 25 to 29 Minutes | 15 | 17.2% |
| 30 to 34 Minutes | 0 | 0.0% |
| 35 to 39 Minutes | 0 | 0.0% |
| 40 to 44 Minutes | 0 | 0.0% |
| 45 to 59 Minutes | 30 | 34.5% |
| 60 to 89 Minutes | 0 | 0.0% |
| 90 or more Minutes | 2 | 2.3% |
Commute Time by Sex in Green Bluff
The most common commute times in Green Bluff are 45 to 59 minutes (24 commuters, 55.8%) for males and 15 to 19 minutes (23 commuters, 52.3%) for females.
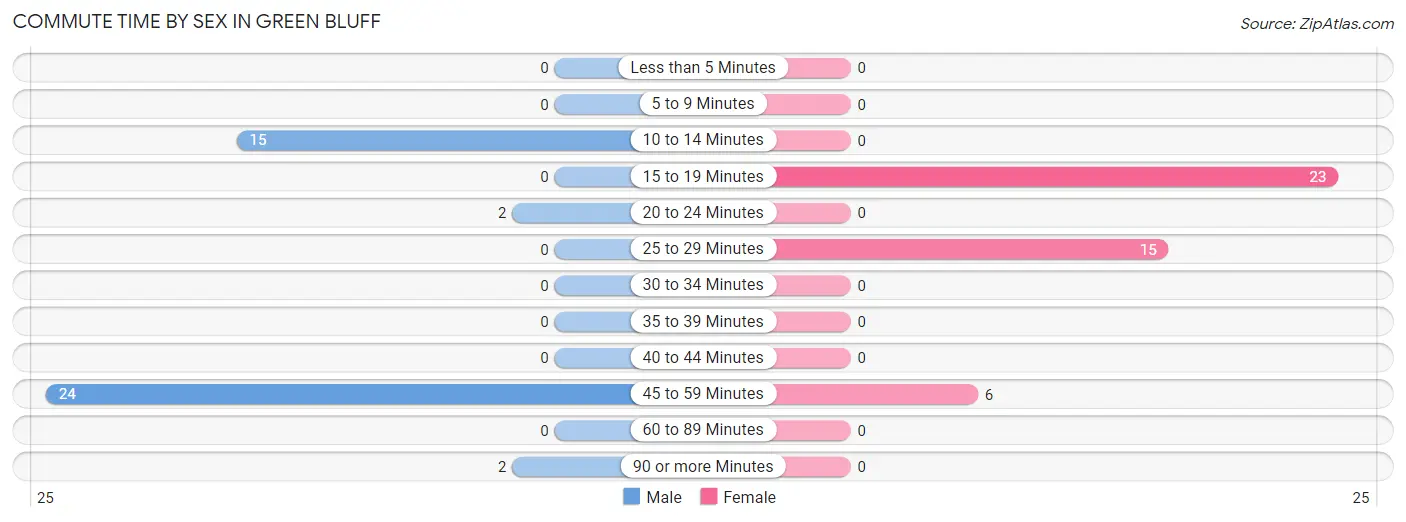
| Commute Time | Male | Female |
| Less than 5 Minutes | 0 (0.0%) | 0 (0.0%) |
| 5 to 9 Minutes | 0 (0.0%) | 0 (0.0%) |
| 10 to 14 Minutes | 15 (34.9%) | 0 (0.0%) |
| 15 to 19 Minutes | 0 (0.0%) | 23 (52.3%) |
| 20 to 24 Minutes | 2 (4.6%) | 0 (0.0%) |
| 25 to 29 Minutes | 0 (0.0%) | 15 (34.1%) |
| 30 to 34 Minutes | 0 (0.0%) | 0 (0.0%) |
| 35 to 39 Minutes | 0 (0.0%) | 0 (0.0%) |
| 40 to 44 Minutes | 0 (0.0%) | 0 (0.0%) |
| 45 to 59 Minutes | 24 (55.8%) | 6 (13.6%) |
| 60 to 89 Minutes | 0 (0.0%) | 0 (0.0%) |
| 90 or more Minutes | 2 (4.6%) | 0 (0.0%) |
Time of Departure to Work by Sex in Green Bluff
The most frequent times of departure to work in Green Bluff are 6:30 AM to 6:59 AM (24, 55.8%) for males and 6:30 AM to 6:59 AM (23, 52.3%) for females.
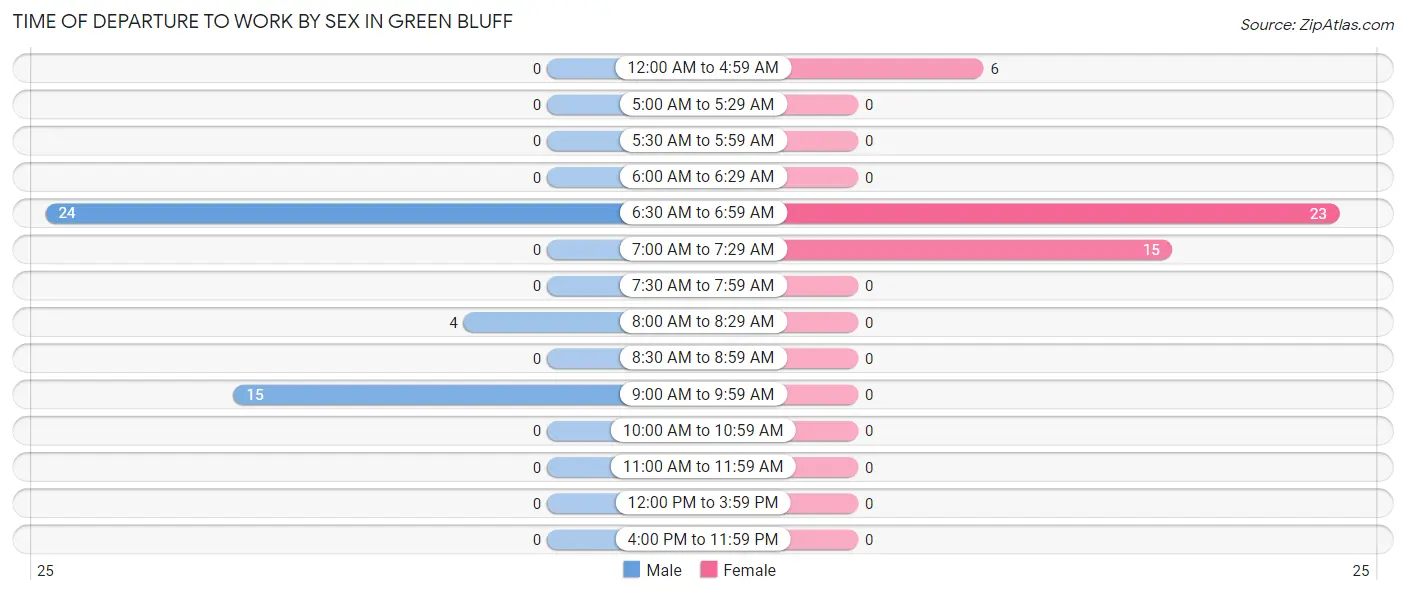
| Time of Departure | Male | Female |
| 12:00 AM to 4:59 AM | 0 (0.0%) | 6 (13.6%) |
| 5:00 AM to 5:29 AM | 0 (0.0%) | 0 (0.0%) |
| 5:30 AM to 5:59 AM | 0 (0.0%) | 0 (0.0%) |
| 6:00 AM to 6:29 AM | 0 (0.0%) | 0 (0.0%) |
| 6:30 AM to 6:59 AM | 24 (55.8%) | 23 (52.3%) |
| 7:00 AM to 7:29 AM | 0 (0.0%) | 15 (34.1%) |
| 7:30 AM to 7:59 AM | 0 (0.0%) | 0 (0.0%) |
| 8:00 AM to 8:29 AM | 4 (9.3%) | 0 (0.0%) |
| 8:30 AM to 8:59 AM | 0 (0.0%) | 0 (0.0%) |
| 9:00 AM to 9:59 AM | 15 (34.9%) | 0 (0.0%) |
| 10:00 AM to 10:59 AM | 0 (0.0%) | 0 (0.0%) |
| 11:00 AM to 11:59 AM | 0 (0.0%) | 0 (0.0%) |
| 12:00 PM to 3:59 PM | 0 (0.0%) | 0 (0.0%) |
| 4:00 PM to 11:59 PM | 0 (0.0%) | 0 (0.0%) |
| Total | 43 (100.0%) | 44 (100.0%) |
Housing Occupancy in Green Bluff
Occupancy by Ownership in Green Bluff
Of the total 103 dwellings in Green Bluff, owner-occupied units account for 97 (94.2%), while renter-occupied units make up 6 (5.8%).
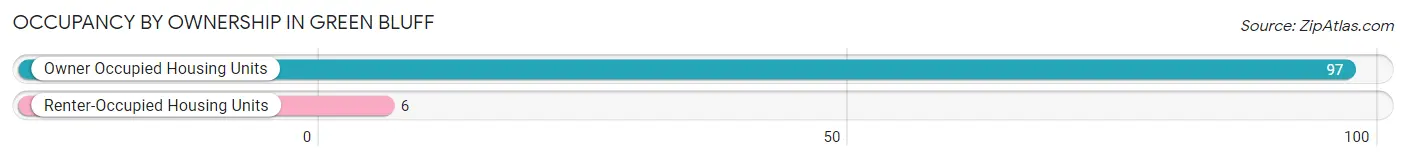
| Occupancy | # Housing Units | % Housing Units |
| Owner Occupied Housing Units | 97 | 94.2% |
| Renter-Occupied Housing Units | 6 | 5.8% |
| Total Occupied Housing Units | 103 | 100.0% |
Occupancy by Household Size in Green Bluff
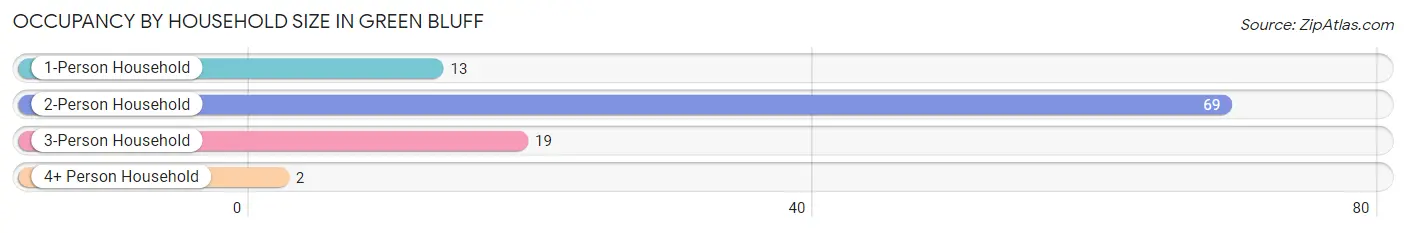
| Household Size | # Housing Units | % Housing Units |
| 1-Person Household | 13 | 12.6% |
| 2-Person Household | 69 | 67.0% |
| 3-Person Household | 19 | 18.4% |
| 4+ Person Household | 2 | 1.9% |
| Total Housing Units | 103 | 100.0% |
Occupancy by Ownership by Household Size in Green Bluff
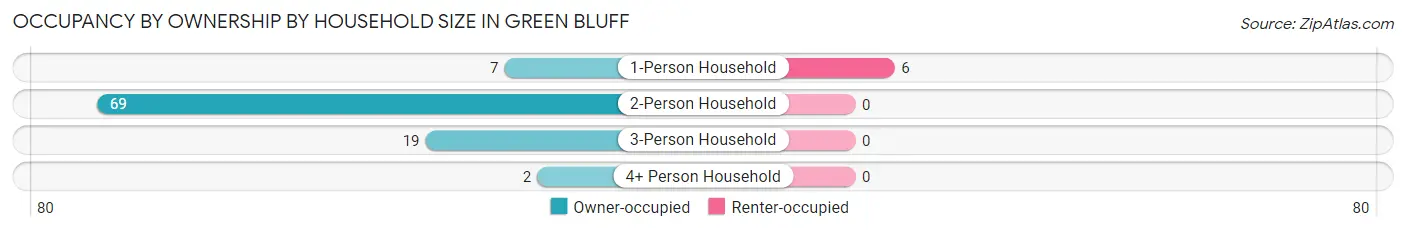
| Household Size | Owner-occupied | Renter-occupied |
| 1-Person Household | 7 (53.8%) | 6 (46.2%) |
| 2-Person Household | 69 (100.0%) | 0 (0.0%) |
| 3-Person Household | 19 (100.0%) | 0 (0.0%) |
| 4+ Person Household | 2 (100.0%) | 0 (0.0%) |
| Total Housing Units | 97 (94.2%) | 6 (5.8%) |
Occupancy by Educational Attainment in Green Bluff
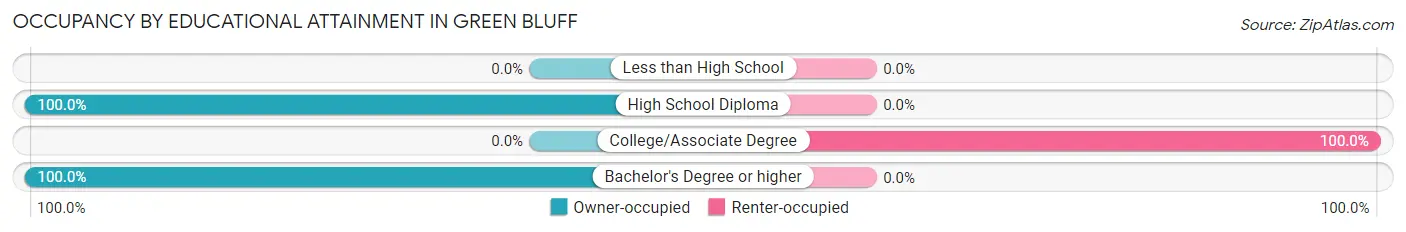
| Household Size | Owner-occupied | Renter-occupied |
| Less than High School | 0 (0.0%) | 0 (0.0%) |
| High School Diploma | 2 (100.0%) | 0 (0.0%) |
| College/Associate Degree | 0 (0.0%) | 6 (100.0%) |
| Bachelor's Degree or higher | 95 (100.0%) | 0 (0.0%) |
Occupancy by Age of Householder in Green Bluff
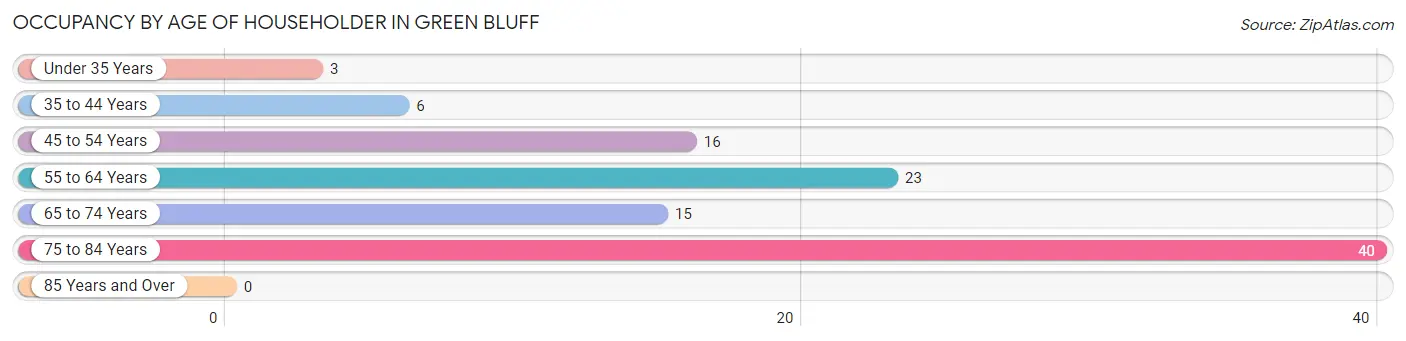
| Age Bracket | # Households | % Households |
| Under 35 Years | 3 | 2.9% |
| 35 to 44 Years | 6 | 5.8% |
| 45 to 54 Years | 16 | 15.5% |
| 55 to 64 Years | 23 | 22.3% |
| 65 to 74 Years | 15 | 14.6% |
| 75 to 84 Years | 40 | 38.8% |
| 85 Years and Over | 0 | 0.0% |
| Total | 103 | 100.0% |
Housing Finances in Green Bluff
Median Income by Occupancy in Green Bluff
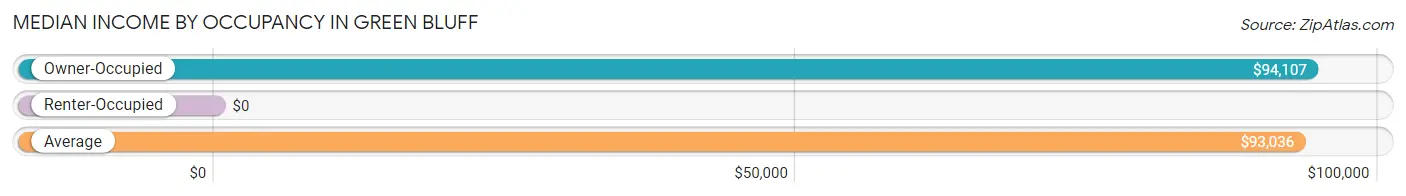
| Occupancy Type | # Households | Median Income |
| Owner-Occupied | 97 (94.2%) | $94,107 |
| Renter-Occupied | 6 (5.8%) | $0 |
| Average | 103 (100.0%) | $93,036 |
Occupancy by Householder Income Bracket in Green Bluff
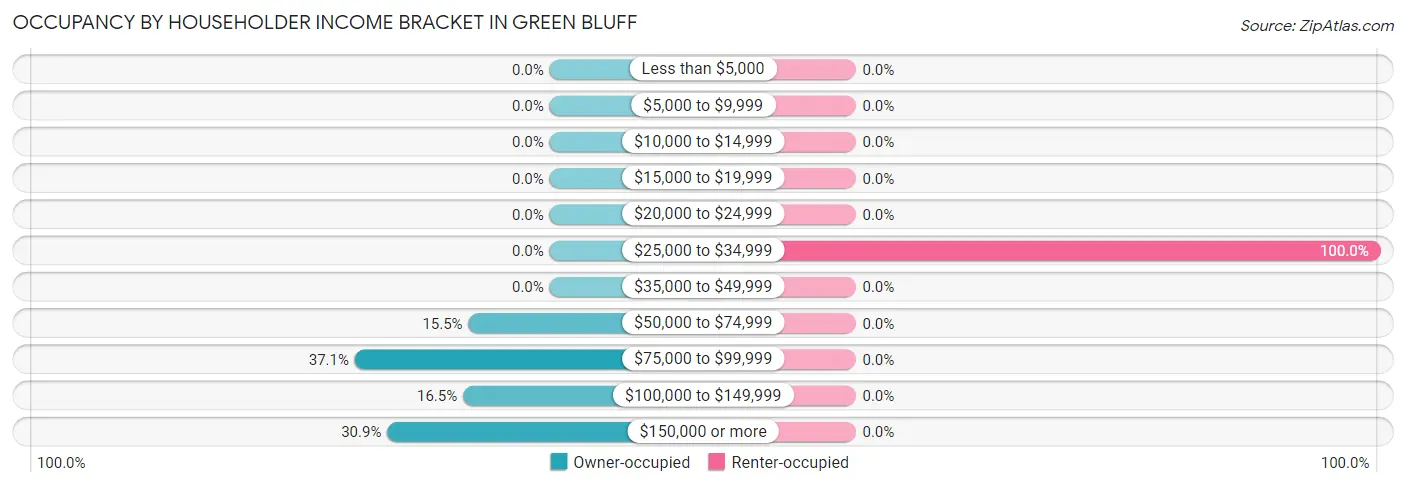
| Income Bracket | Owner-occupied | Renter-occupied |
| Less than $5,000 | 0 (0.0%) | 0 (0.0%) |
| $5,000 to $9,999 | 0 (0.0%) | 0 (0.0%) |
| $10,000 to $14,999 | 0 (0.0%) | 0 (0.0%) |
| $15,000 to $19,999 | 0 (0.0%) | 0 (0.0%) |
| $20,000 to $24,999 | 0 (0.0%) | 0 (0.0%) |
| $25,000 to $34,999 | 0 (0.0%) | 6 (100.0%) |
| $35,000 to $49,999 | 0 (0.0%) | 0 (0.0%) |
| $50,000 to $74,999 | 15 (15.5%) | 0 (0.0%) |
| $75,000 to $99,999 | 36 (37.1%) | 0 (0.0%) |
| $100,000 to $149,999 | 16 (16.5%) | 0 (0.0%) |
| $150,000 or more | 30 (30.9%) | 0 (0.0%) |
| Total | 97 (100.0%) | 6 (100.0%) |
Monthly Housing Cost Tiers in Green Bluff
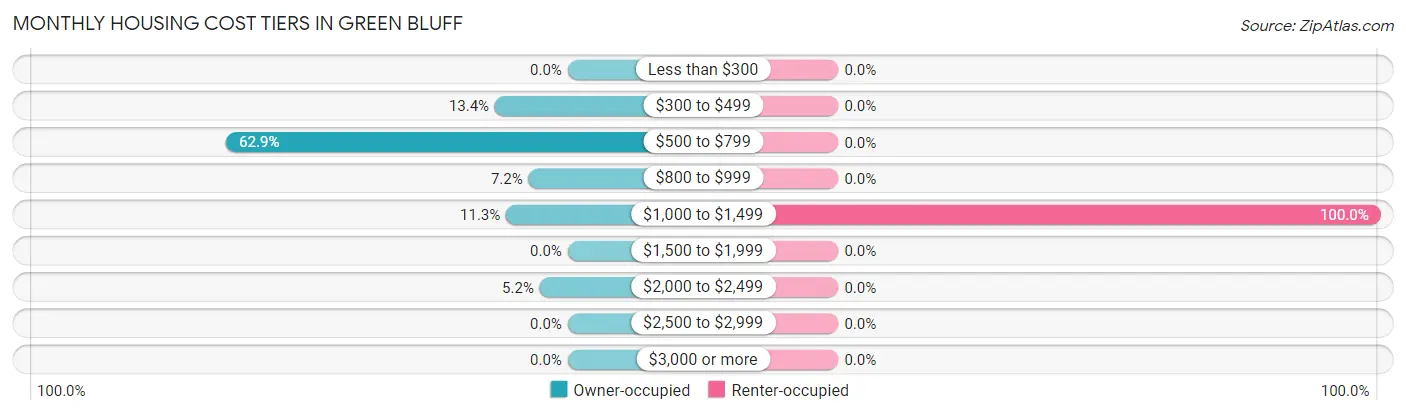
| Monthly Cost | Owner-occupied | Renter-occupied |
| Less than $300 | 0 (0.0%) | 0 (0.0%) |
| $300 to $499 | 13 (13.4%) | 0 (0.0%) |
| $500 to $799 | 61 (62.9%) | 0 (0.0%) |
| $800 to $999 | 7 (7.2%) | 0 (0.0%) |
| $1,000 to $1,499 | 11 (11.3%) | 6 (100.0%) |
| $1,500 to $1,999 | 0 (0.0%) | 0 (0.0%) |
| $2,000 to $2,499 | 5 (5.1%) | 0 (0.0%) |
| $2,500 to $2,999 | 0 (0.0%) | 0 (0.0%) |
| $3,000 or more | 0 (0.0%) | 0 (0.0%) |
| Total | 97 (100.0%) | 6 (100.0%) |
Physical Housing Characteristics in Green Bluff
Housing Structures in Green Bluff
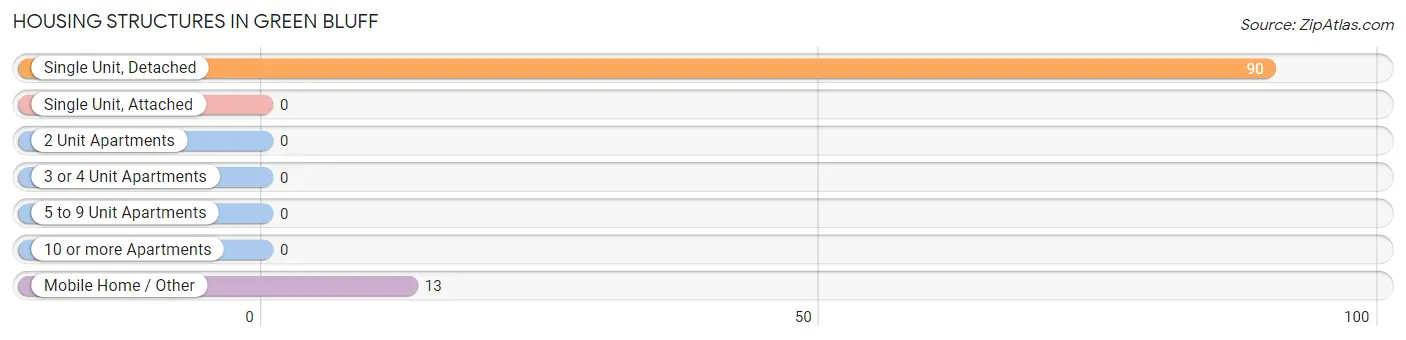
| Structure Type | # Housing Units | % Housing Units |
| Single Unit, Detached | 90 | 87.4% |
| Single Unit, Attached | 0 | 0.0% |
| 2 Unit Apartments | 0 | 0.0% |
| 3 or 4 Unit Apartments | 0 | 0.0% |
| 5 to 9 Unit Apartments | 0 | 0.0% |
| 10 or more Apartments | 0 | 0.0% |
| Mobile Home / Other | 13 | 12.6% |
| Total | 103 | 100.0% |
Housing Structures by Occupancy in Green Bluff
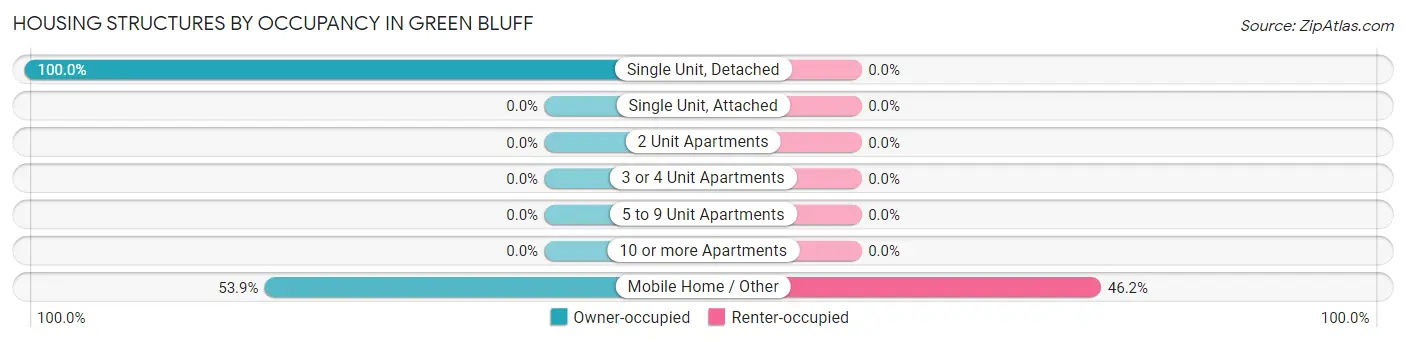
| Structure Type | Owner-occupied | Renter-occupied |
| Single Unit, Detached | 90 (100.0%) | 0 (0.0%) |
| Single Unit, Attached | 0 (0.0%) | 0 (0.0%) |
| 2 Unit Apartments | 0 (0.0%) | 0 (0.0%) |
| 3 or 4 Unit Apartments | 0 (0.0%) | 0 (0.0%) |
| 5 to 9 Unit Apartments | 0 (0.0%) | 0 (0.0%) |
| 10 or more Apartments | 0 (0.0%) | 0 (0.0%) |
| Mobile Home / Other | 7 (53.8%) | 6 (46.2%) |
| Total | 97 (94.2%) | 6 (5.8%) |
Housing Structures by Number of Rooms in Green Bluff
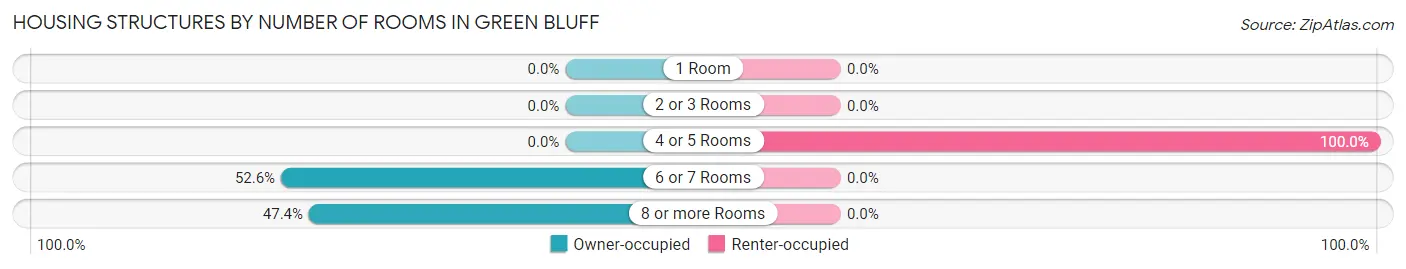
| Number of Rooms | Owner-occupied | Renter-occupied |
| 1 Room | 0 (0.0%) | 0 (0.0%) |
| 2 or 3 Rooms | 0 (0.0%) | 0 (0.0%) |
| 4 or 5 Rooms | 0 (0.0%) | 6 (100.0%) |
| 6 or 7 Rooms | 51 (52.6%) | 0 (0.0%) |
| 8 or more Rooms | 46 (47.4%) | 0 (0.0%) |
| Total | 97 (100.0%) | 6 (100.0%) |
Housing Structure by Heating Type in Green Bluff
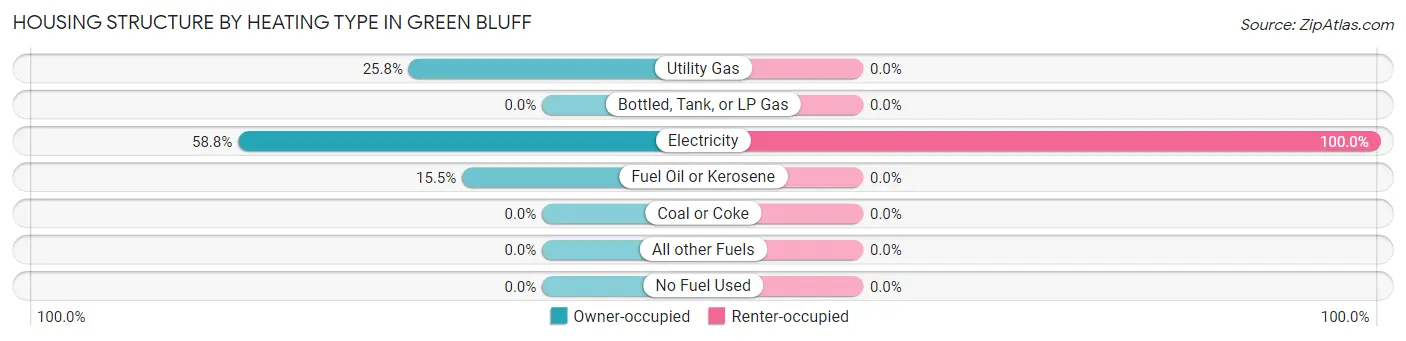
| Heating Type | Owner-occupied | Renter-occupied |
| Utility Gas | 25 (25.8%) | 0 (0.0%) |
| Bottled, Tank, or LP Gas | 0 (0.0%) | 0 (0.0%) |
| Electricity | 57 (58.8%) | 6 (100.0%) |
| Fuel Oil or Kerosene | 15 (15.5%) | 0 (0.0%) |
| Coal or Coke | 0 (0.0%) | 0 (0.0%) |
| All other Fuels | 0 (0.0%) | 0 (0.0%) |
| No Fuel Used | 0 (0.0%) | 0 (0.0%) |
| Total | 97 (100.0%) | 6 (100.0%) |
Household Vehicle Usage in Green Bluff
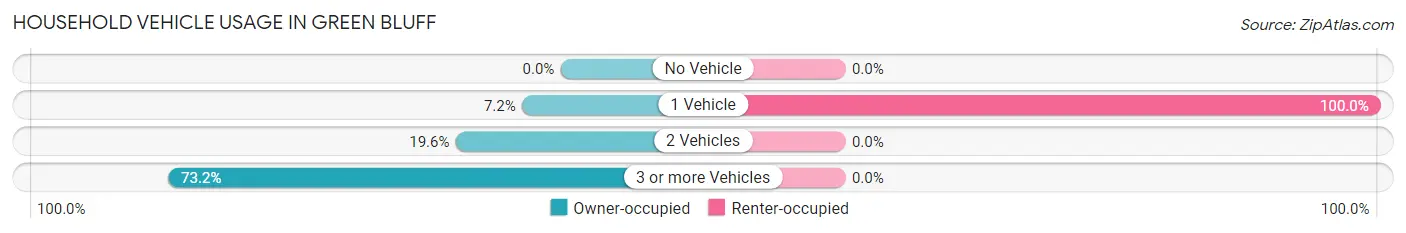
| Vehicles per Household | Owner-occupied | Renter-occupied |
| No Vehicle | 0 (0.0%) | 0 (0.0%) |
| 1 Vehicle | 7 (7.2%) | 6 (100.0%) |
| 2 Vehicles | 19 (19.6%) | 0 (0.0%) |
| 3 or more Vehicles | 71 (73.2%) | 0 (0.0%) |
| Total | 97 (100.0%) | 6 (100.0%) |
Real Estate & Mortgages in Green Bluff
Real Estate and Mortgage Overview in Green Bluff
| Characteristic | Without Mortgage | With Mortgage |
| Housing Units | 92 | 5 |
| Median Property Value | $570,500 | $0 |
| Median Household Income | - | - |
| Monthly Housing Costs | $726 | $0 |
| Real Estate Taxes | $4,478 | $0 |
Property Value by Mortgage Status in Green Bluff
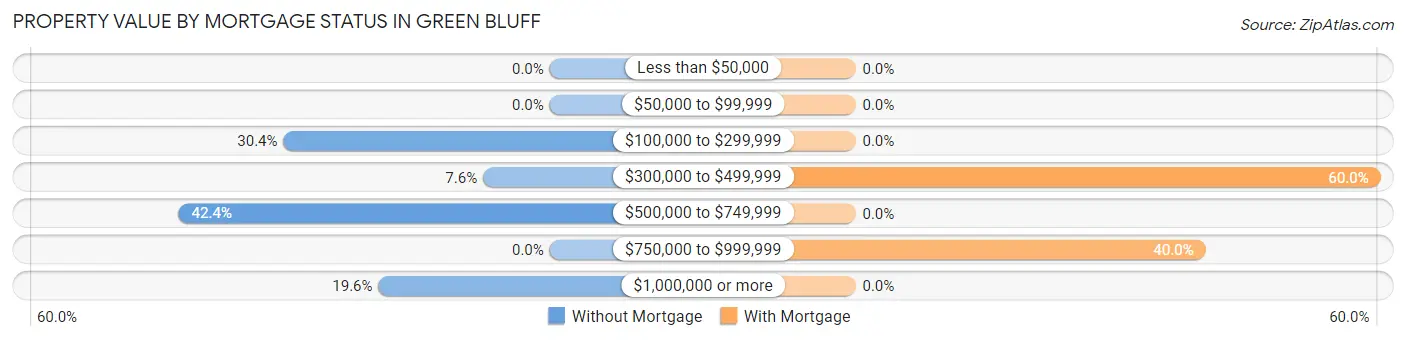
| Property Value | Without Mortgage | With Mortgage |
| Less than $50,000 | 0 (0.0%) | 0 (0.0%) |
| $50,000 to $99,999 | 0 (0.0%) | 0 (0.0%) |
| $100,000 to $299,999 | 28 (30.4%) | 0 (0.0%) |
| $300,000 to $499,999 | 7 (7.6%) | 3 (60.0%) |
| $500,000 to $749,999 | 39 (42.4%) | 0 (0.0%) |
| $750,000 to $999,999 | 0 (0.0%) | 2 (40.0%) |
| $1,000,000 or more | 18 (19.6%) | 0 (0.0%) |
| Total | 92 (100.0%) | 5 (100.0%) |
Household Income by Mortgage Status in Green Bluff
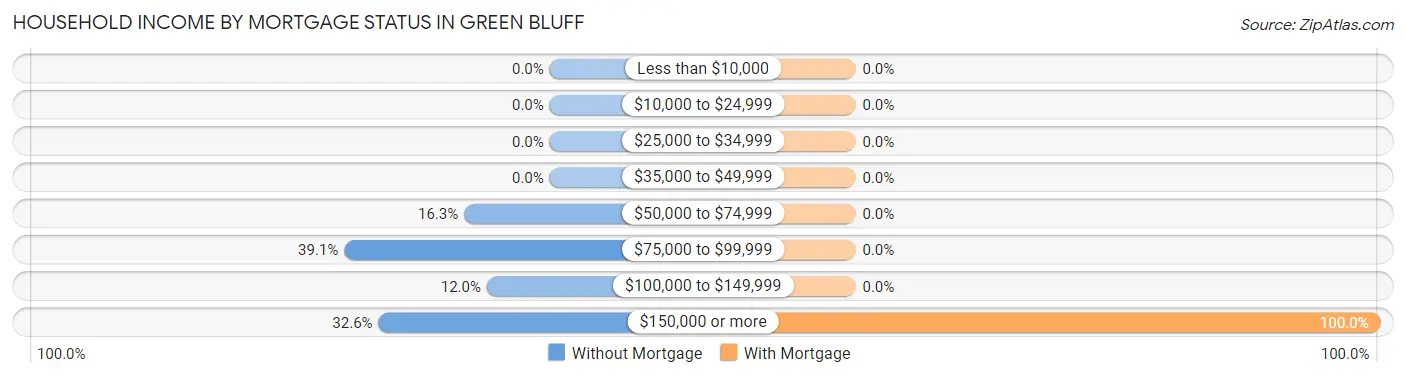
| Household Income | Without Mortgage | With Mortgage |
| Less than $10,000 | 0 (0.0%) | 0 (0.0%) |
| $10,000 to $24,999 | 0 (0.0%) | 0 (0.0%) |
| $25,000 to $34,999 | 0 (0.0%) | 0 (0.0%) |
| $35,000 to $49,999 | 0 (0.0%) | 0 (0.0%) |
| $50,000 to $74,999 | 15 (16.3%) | 0 (0.0%) |
| $75,000 to $99,999 | 36 (39.1%) | 0 (0.0%) |
| $100,000 to $149,999 | 11 (12.0%) | 0 (0.0%) |
| $150,000 or more | 30 (32.6%) | 5 (100.0%) |
| Total | 92 (100.0%) | 5 (100.0%) |
Property Value to Household Income Ratio in Green Bluff
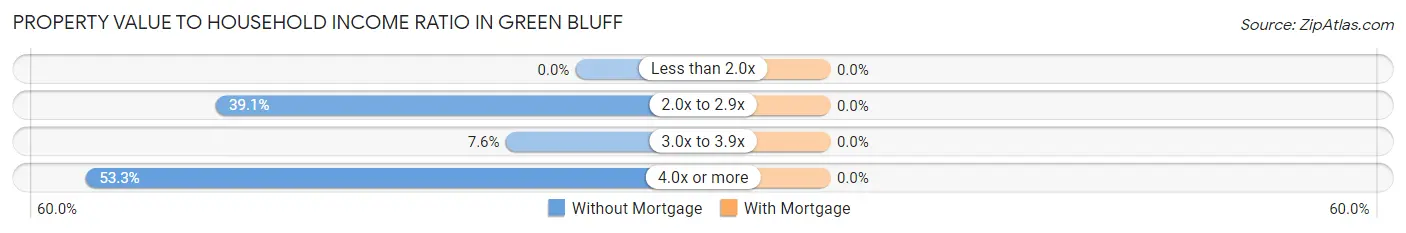
| Value-to-Income Ratio | Without Mortgage | With Mortgage |
| Less than 2.0x | 0 (0.0%) | 0 (0.0%) |
| 2.0x to 2.9x | 36 (39.1%) | 0 (0.0%) |
| 3.0x to 3.9x | 7 (7.6%) | 0 (0.0%) |
| 4.0x or more | 49 (53.3%) | 0 (0.0%) |
| Total | 92 (100.0%) | 5 (100.0%) |
Real Estate Taxes by Mortgage Status in Green Bluff
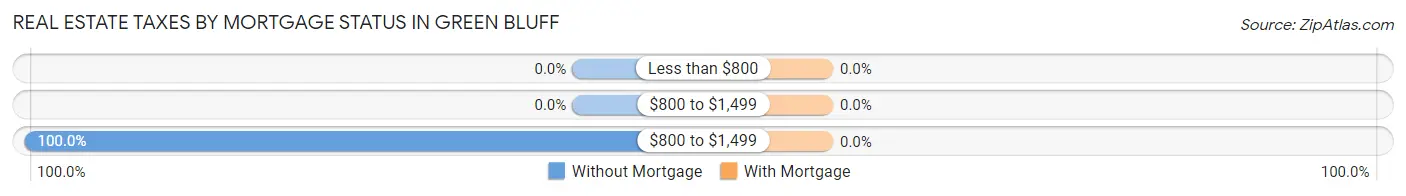
| Property Taxes | Without Mortgage | With Mortgage |
| Less than $800 | 0 (0.0%) | 0 (0.0%) |
| $800 to $1,499 | 0 (0.0%) | 0 (0.0%) |
| $800 to $1,499 | 92 (100.0%) | 0 (0.0%) |
| Total | 92 (100.0%) | 5 (100.0%) |
Health & Disability in Green Bluff
Health Insurance Coverage by Age in Green Bluff
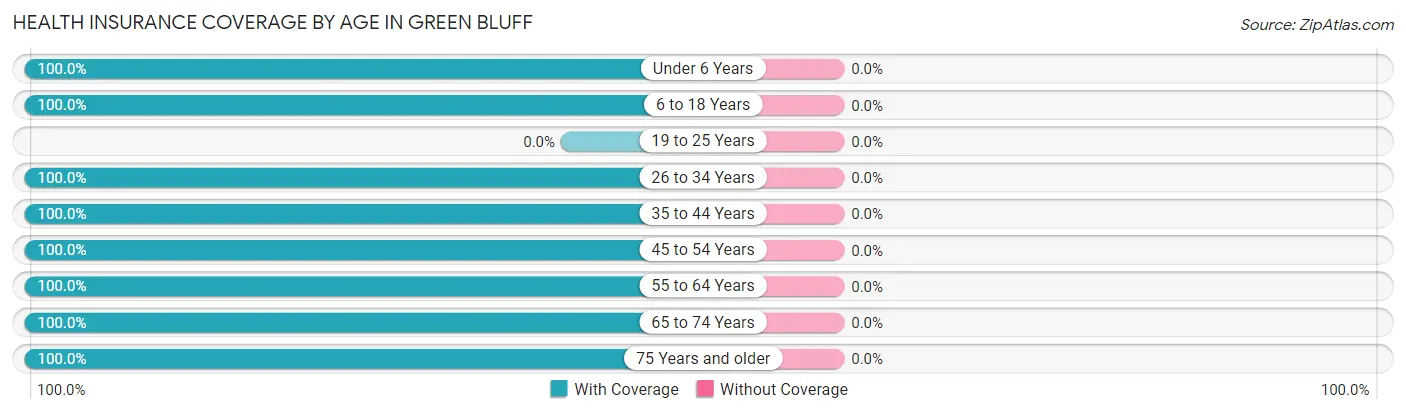
| Age Bracket | With Coverage | Without Coverage |
| Under 6 Years | 3 (100.0%) | 0 (0.0%) |
| 6 to 18 Years | 17 (100.0%) | 0 (0.0%) |
| 19 to 25 Years | 0 (0.0%) | 0 (0.0%) |
| 26 to 34 Years | 6 (100.0%) | 0 (0.0%) |
| 35 to 44 Years | 6 (100.0%) | 0 (0.0%) |
| 45 to 54 Years | 31 (100.0%) | 0 (0.0%) |
| 55 to 64 Years | 23 (100.0%) | 0 (0.0%) |
| 65 to 74 Years | 54 (100.0%) | 0 (0.0%) |
| 75 Years and older | 79 (100.0%) | 0 (0.0%) |
| Total | 219 (100.0%) | 0 (0.0%) |
Health Insurance Coverage by Citizenship Status in Green Bluff
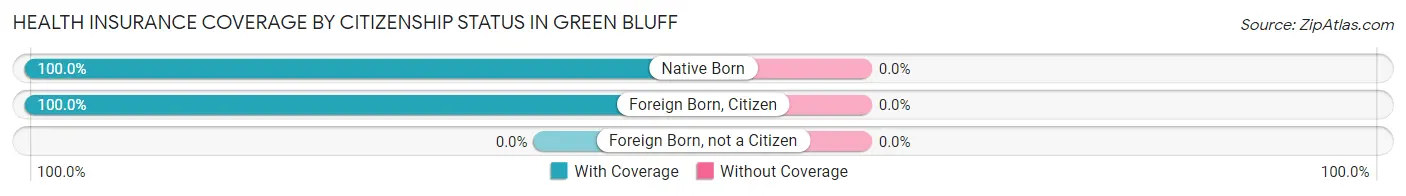
| Citizenship Status | With Coverage | Without Coverage |
| Native Born | 3 (100.0%) | 0 (0.0%) |
| Foreign Born, Citizen | 17 (100.0%) | 0 (0.0%) |
| Foreign Born, not a Citizen | 0 (0.0%) | 0 (0.0%) |
Health Insurance Coverage by Household Income in Green Bluff
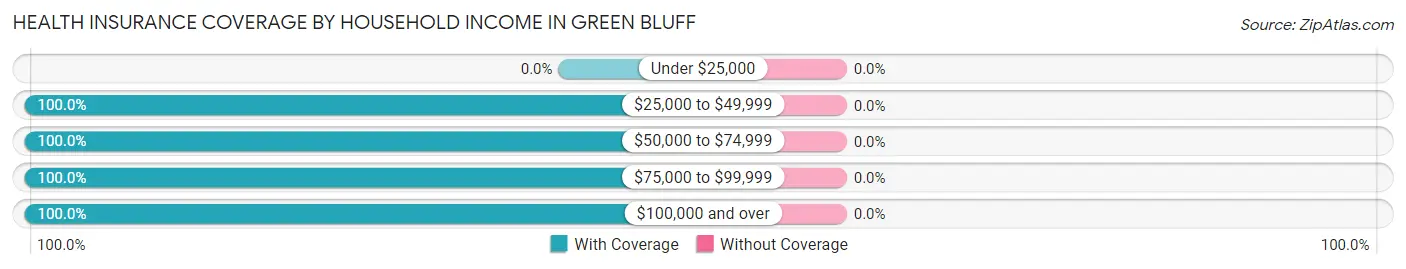
| Household Income | With Coverage | Without Coverage |
| Under $25,000 | 0 (0.0%) | 0 (0.0%) |
| $25,000 to $49,999 | 6 (100.0%) | 0 (0.0%) |
| $50,000 to $74,999 | 31 (100.0%) | 0 (0.0%) |
| $75,000 to $99,999 | 79 (100.0%) | 0 (0.0%) |
| $100,000 and over | 103 (100.0%) | 0 (0.0%) |
Public vs Private Health Insurance Coverage by Age in Green Bluff
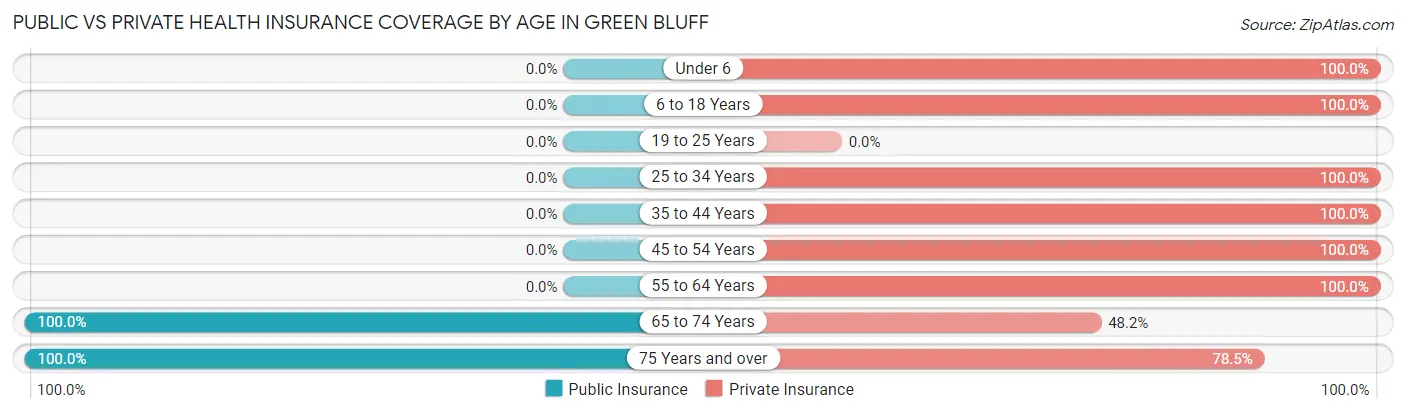
| Age Bracket | Public Insurance | Private Insurance |
| Under 6 | 0 (0.0%) | 3 (100.0%) |
| 6 to 18 Years | 0 (0.0%) | 17 (100.0%) |
| 19 to 25 Years | 0 (0.0%) | 0 (0.0%) |
| 25 to 34 Years | 0 (0.0%) | 6 (100.0%) |
| 35 to 44 Years | 0 (0.0%) | 6 (100.0%) |
| 45 to 54 Years | 0 (0.0%) | 31 (100.0%) |
| 55 to 64 Years | 0 (0.0%) | 23 (100.0%) |
| 65 to 74 Years | 54 (100.0%) | 26 (48.1%) |
| 75 Years and over | 79 (100.0%) | 62 (78.5%) |
| Total | 133 (60.7%) | 174 (79.4%) |
Disability Status by Sex by Age in Green Bluff
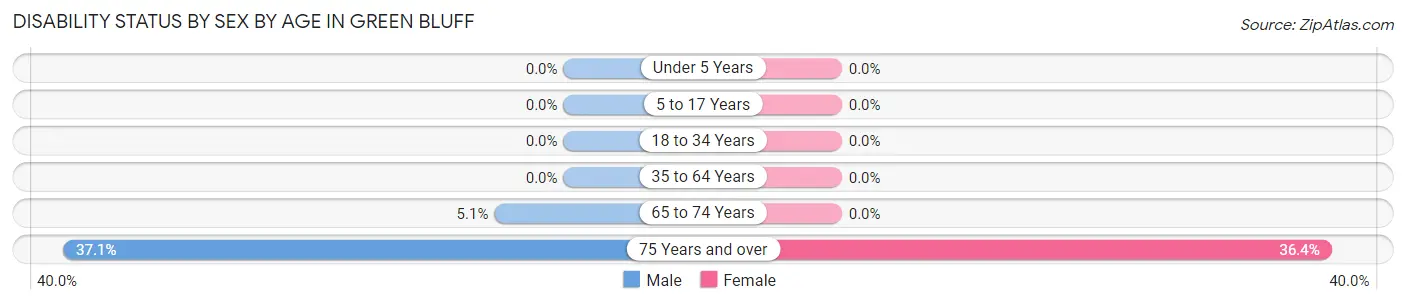
| Age Bracket | Male | Female |
| Under 5 Years | 0 (0.0%) | 0 (0.0%) |
| 5 to 17 Years | 0 (0.0%) | 0 (0.0%) |
| 18 to 34 Years | 0 (0.0%) | 0 (0.0%) |
| 35 to 64 Years | 0 (0.0%) | 0 (0.0%) |
| 65 to 74 Years | 2 (5.1%) | 0 (0.0%) |
| 75 Years and over | 13 (37.1%) | 16 (36.4%) |
Disability Class by Sex by Age in Green Bluff
Disability Class: Hearing Difficulty
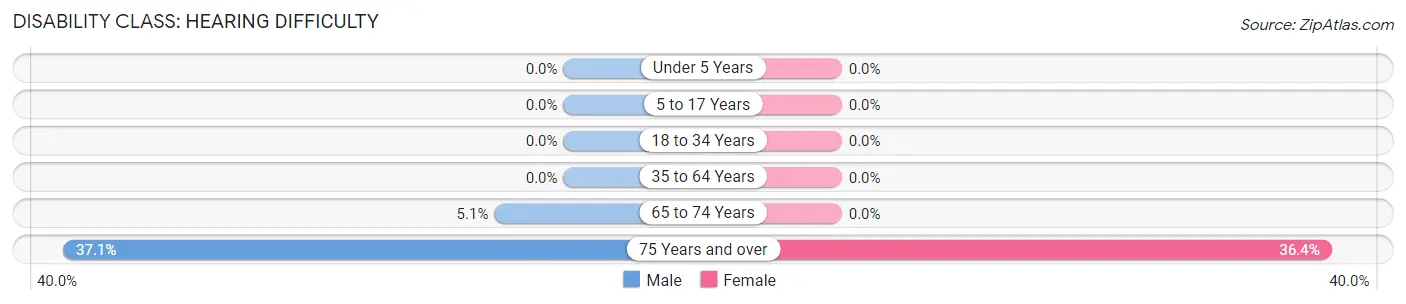
| Age Bracket | Male | Female |
| Under 5 Years | 0 (0.0%) | 0 (0.0%) |
| 5 to 17 Years | 0 (0.0%) | 0 (0.0%) |
| 18 to 34 Years | 0 (0.0%) | 0 (0.0%) |
| 35 to 64 Years | 0 (0.0%) | 0 (0.0%) |
| 65 to 74 Years | 2 (5.1%) | 0 (0.0%) |
| 75 Years and over | 13 (37.1%) | 16 (36.4%) |
Disability Class: Vision Difficulty
| Age Bracket | Male | Female |
| Under 5 Years | 0 (0.0%) | 0 (0.0%) |
| 5 to 17 Years | 0 (0.0%) | 0 (0.0%) |
| 18 to 34 Years | 0 (0.0%) | 0 (0.0%) |
| 35 to 64 Years | 0 (0.0%) | 0 (0.0%) |
| 65 to 74 Years | 0 (0.0%) | 0 (0.0%) |
| 75 Years and over | 0 (0.0%) | 0 (0.0%) |
Disability Class: Cognitive Difficulty
| Age Bracket | Male | Female |
| 5 to 17 Years | 0 (0.0%) | 0 (0.0%) |
| 18 to 34 Years | 0 (0.0%) | 0 (0.0%) |
| 35 to 64 Years | 0 (0.0%) | 0 (0.0%) |
| 65 to 74 Years | 0 (0.0%) | 0 (0.0%) |
| 75 Years and over | 2 (5.7%) | 0 (0.0%) |
Disability Class: Ambulatory Difficulty
| Age Bracket | Male | Female |
| 5 to 17 Years | 0 (0.0%) | 0 (0.0%) |
| 18 to 34 Years | 0 (0.0%) | 0 (0.0%) |
| 35 to 64 Years | 0 (0.0%) | 0 (0.0%) |
| 65 to 74 Years | 0 (0.0%) | 0 (0.0%) |
| 75 Years and over | 2 (5.7%) | 0 (0.0%) |
Disability Class: Self-Care Difficulty
| Age Bracket | Male | Female |
| 5 to 17 Years | 0 (0.0%) | 0 (0.0%) |
| 18 to 34 Years | 0 (0.0%) | 0 (0.0%) |
| 35 to 64 Years | 0 (0.0%) | 0 (0.0%) |
| 65 to 74 Years | 0 (0.0%) | 0 (0.0%) |
| 75 Years and over | 2 (5.7%) | 0 (0.0%) |
Technology Access in Green Bluff
Computing Device Access in Green Bluff
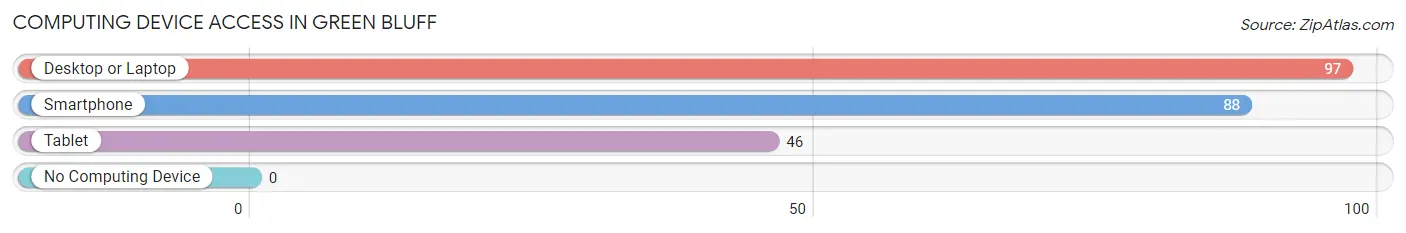
| Device Type | # Households | % Households |
| Desktop or Laptop | 97 | 94.2% |
| Smartphone | 88 | 85.4% |
| Tablet | 46 | 44.7% |
| No Computing Device | 0 | 0.0% |
| Total | 103 | 100.0% |
Internet Access in Green Bluff
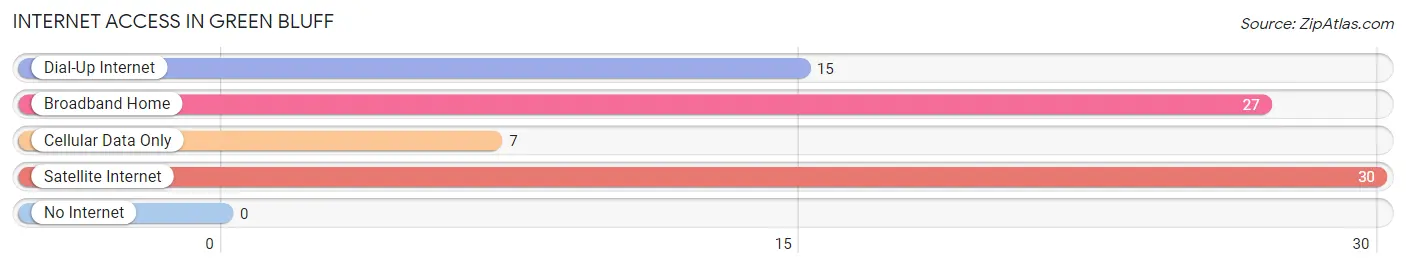
| Internet Type | # Households | % Households |
| Dial-Up Internet | 15 | 14.6% |
| Broadband Home | 27 | 26.2% |
| Cellular Data Only | 7 | 6.8% |
| Satellite Internet | 30 | 29.1% |
| No Internet | 0 | 0.0% |
| Total | 103 | 100.0% |
Green Bluff Summary
Green Bluff is a small unincorporated community located in Spokane County, Washington, United States. It is situated in the foothills of the Cascade Mountains, approximately 20 miles north of Spokane. The community is home to a variety of farms, orchards, wineries, and other agricultural businesses.
History
Green Bluff was first settled in the late 1800s by homesteaders who were attracted to the area’s fertile soil and abundant natural resources. The community was named after the nearby Green Bluff Mountain, which was named for its lush green foliage.
In the early 1900s, the area began to develop as a farming community. The first commercial orchard was planted in 1906, and by the 1920s, the area was home to a variety of fruit and vegetable farms. The community also became known for its production of hops, which were used to make beer.
In the 1950s, the area began to experience a population boom as more people moved to the area to take advantage of the area’s agricultural opportunities. The population continued to grow throughout the 1960s and 1970s, and by the 1980s, the area had become a popular tourist destination.
Geography
Green Bluff is located in the foothills of the Cascade Mountains, approximately 20 miles north of Spokane. The area is characterized by rolling hills, lush forests, and fertile soil. The area is home to a variety of farms, orchards, wineries, and other agricultural businesses.
The climate in Green Bluff is mild and temperate, with warm summers and cool winters. The average annual temperature is around 50 degrees Fahrenheit. The area receives an average of 20 inches of precipitation per year, with most of it falling in the form of snow during the winter months.
Economy
Green Bluff’s economy is largely based on agriculture. The area is home to a variety of farms, orchards, wineries, and other agricultural businesses. The area is also known for its production of hops, which are used to make beer.
In addition to agriculture, the area is also home to a variety of small businesses, including restaurants, shops, and other services. Tourism is also an important part of the local economy, as the area is a popular destination for outdoor recreation and sightseeing.
Demographics
As of the 2010 census, the population of Green Bluff was 1,845. The population is predominantly white (94.3%), with small percentages of other races, including Native American (2.2%), Asian (1.2%), and African American (0.7%).
The median household income in Green Bluff is $50,000, and the median home value is $200,000. The area is served by the Spokane Public Schools district.
Conclusion
Green Bluff is a small unincorporated community located in Spokane County, Washington. The area is characterized by rolling hills, lush forests, and fertile soil, and is home to a variety of farms, orchards, wineries, and other agricultural businesses. The area’s economy is largely based on agriculture, and the population is predominantly white. The area is also a popular destination for outdoor recreation and sightseeing.
Common Questions
What is Per Capita Income in Green Bluff?
Per Capita income in Green Bluff is $77,055.
What is the Median Household income in Green Bluff?
Median Household Income in Green Bluff is $93,036.
What is Inequality or Gini Index in Green Bluff?
Inequality or Gini Index in Green Bluff is 0.39.
What is the Total Population of Green Bluff?
Total Population of Green Bluff is 219.
What is the Total Male Population of Green Bluff?
Total Male Population of Green Bluff is 95.
What is the Total Female Population of Green Bluff?
Total Female Population of Green Bluff is 124.
What is the Ratio of Males per 100 Females in Green Bluff?
There are 76.61 Males per 100 Females in Green Bluff.
What is the Ratio of Females per 100 Males in Green Bluff?
There are 130.53 Females per 100 Males in Green Bluff.
What is the Median Population Age in Green Bluff?
Median Population Age in Green Bluff is 66.0 Years.
What is the Average Family Size in Green Bluff
Average Family Size in Green Bluff is 2.3 People.
What is the Average Household Size in Green Bluff
Average Household Size in Green Bluff is 2.1 People.
How Large is the Labor Force in Green Bluff?
There are 106 People in the Labor Forcein in Green Bluff.
What is the Percentage of People in the Labor Force in Green Bluff?
52.7% of People are in the Labor Force in Green Bluff.