Satsop, WA Map & Demographics
Satsop Map
Satsop Overview
$31,639
PER CAPITA INCOME
$87,639
AVG FAMILY INCOME
$83,333
AVG HOUSEHOLD INCOME
60.7%
WAGE / INCOME GAP [ % ]
39.3¢/ $1
WAGE / INCOME GAP [ $ ]
$2,128
FAMILY INCOME DEFICIT
0.43
INEQUALITY / GINI INDEX
768
TOTAL POPULATION
369
MALE POPULATION
399
FEMALE POPULATION
92.48
MALES / 100 FEMALES
108.13
FEMALES / 100 MALES
39.7
MEDIAN AGE
3.5
AVG FAMILY SIZE
3.0
AVG HOUSEHOLD SIZE
312
LABOR FORCE [ PEOPLE ]
53.0%
PERCENT IN LABOR FORCE
5.8%
UNEMPLOYMENT RATE
Satsop Zip Codes
Satsop Area Codes
Income in Satsop
Income Overview in Satsop
Per Capita Income in Satsop is $31,639, while median incomes of families and households are $87,639 and $83,333 respectively.
| Characteristic | Number | Measure |
| Per Capita Income | 768 | $31,639 |
| Median Family Income | 202 | $87,639 |
| Mean Family Income | 202 | $104,520 |
| Median Household Income | 254 | $83,333 |
| Mean Household Income | 254 | $97,549 |
| Income Deficit | 202 | $2,128 |
| Wage / Income Gap (%) | 768 | 60.68% |
| Wage / Income Gap ($) | 768 | 39.32¢ per $1 |
| Gini / Inequality Index | 768 | 0.43 |
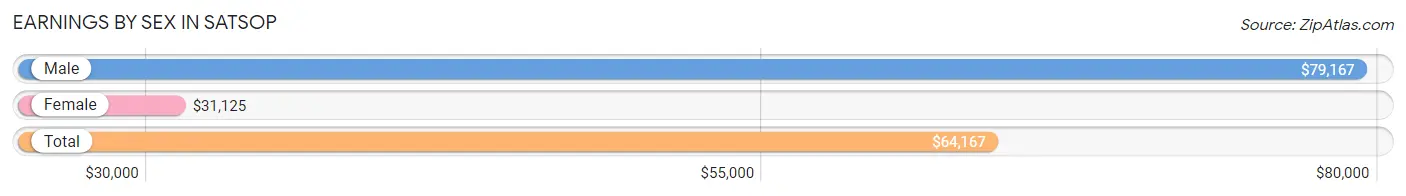
Earnings by Sex in Satsop
Average Earnings in Satsop are $64,167, $79,167 for men and $31,125 for women, a difference of 60.7%.
| Sex | Number | Average Earnings |
| Male | 128 (42.4%) | $79,167 |
| Female | 174 (57.6%) | $31,125 |
| Total | 302 (100.0%) | $64,167 |
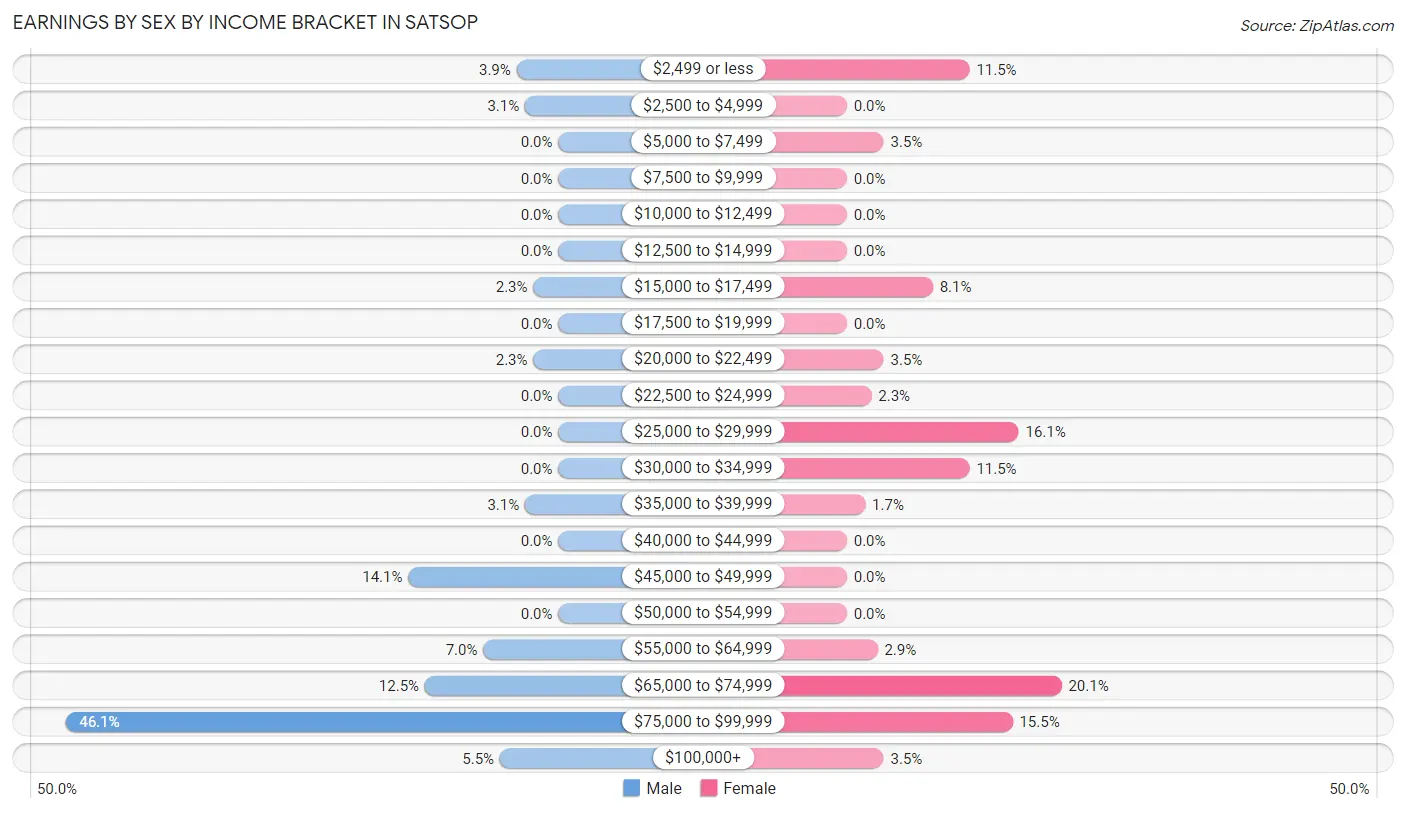
Earnings by Sex by Income Bracket in Satsop
The most common earnings brackets in Satsop are $75,000 to $99,999 for men (59 | 46.1%) and $65,000 to $74,999 for women (35 | 20.1%).
| Income | Male | Female |
| $2,499 or less | 5 (3.9%) | 20 (11.5%) |
| $2,500 to $4,999 | 4 (3.1%) | 0 (0.0%) |
| $5,000 to $7,499 | 0 (0.0%) | 6 (3.5%) |
| $7,500 to $9,999 | 0 (0.0%) | 0 (0.0%) |
| $10,000 to $12,499 | 0 (0.0%) | 0 (0.0%) |
| $12,500 to $14,999 | 0 (0.0%) | 0 (0.0%) |
| $15,000 to $17,499 | 3 (2.3%) | 14 (8.1%) |
| $17,500 to $19,999 | 0 (0.0%) | 0 (0.0%) |
| $20,000 to $22,499 | 3 (2.3%) | 6 (3.5%) |
| $22,500 to $24,999 | 0 (0.0%) | 4 (2.3%) |
| $25,000 to $29,999 | 0 (0.0%) | 28 (16.1%) |
| $30,000 to $34,999 | 0 (0.0%) | 20 (11.5%) |
| $35,000 to $39,999 | 4 (3.1%) | 3 (1.7%) |
| $40,000 to $44,999 | 0 (0.0%) | 0 (0.0%) |
| $45,000 to $49,999 | 18 (14.1%) | 0 (0.0%) |
| $50,000 to $54,999 | 0 (0.0%) | 0 (0.0%) |
| $55,000 to $64,999 | 9 (7.0%) | 5 (2.9%) |
| $65,000 to $74,999 | 16 (12.5%) | 35 (20.1%) |
| $75,000 to $99,999 | 59 (46.1%) | 27 (15.5%) |
| $100,000+ | 7 (5.5%) | 6 (3.5%) |
| Total | 128 (100.0%) | 174 (100.0%) |
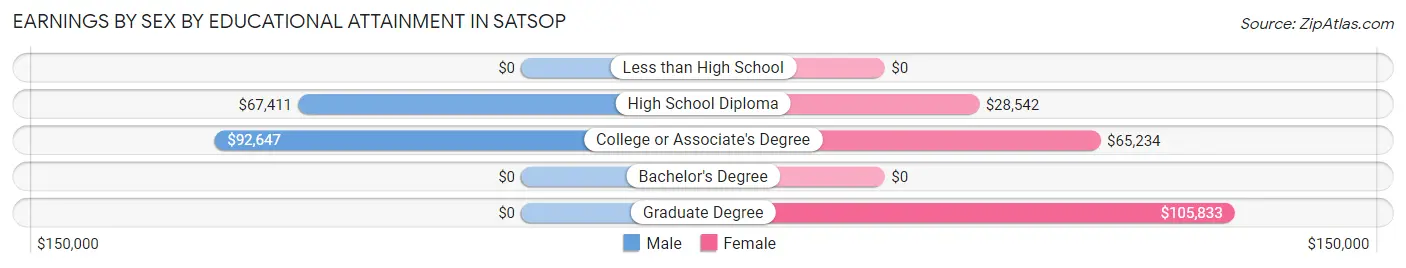
Earnings by Sex by Educational Attainment in Satsop
Average earnings in Satsop are $82,750 for men and $58,500 for women, a difference of 29.3%. Men with an educational attainment of college or associate's degree enjoy the highest average annual earnings of $92,647, while those with high school diploma education earn the least with $67,411. Women with an educational attainment of graduate degree earn the most with the average annual earnings of $105,833, while those with high school diploma education have the smallest earnings of $28,542.
| Educational Attainment | Male Income | Female Income |
| Less than High School | - | - |
| High School Diploma | $67,411 | $28,542 |
| College or Associate's Degree | $92,647 | $65,234 |
| Bachelor's Degree | - | - |
| Graduate Degree | - | - |
| Total | $82,750 | $58,500 |
Family Income in Satsop
Family Income Brackets in Satsop
According to the Satsop family income data, there are 65 families falling into the $75,000 to $99,999 income range, which is the most common income bracket and makes up 32.2% of all families.
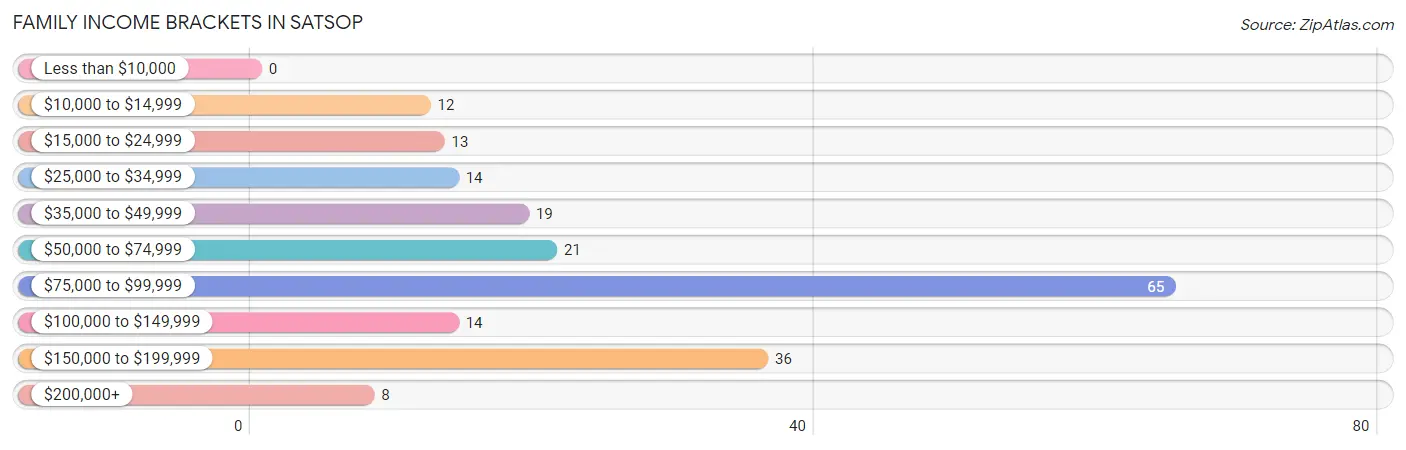
| Income Bracket | # Families | % Families |
| Less than $10,000 | 0 | 0.0% |
| $10,000 to $14,999 | 12 | 5.9% |
| $15,000 to $24,999 | 13 | 6.4% |
| $25,000 to $34,999 | 14 | 6.9% |
| $35,000 to $49,999 | 19 | 9.4% |
| $50,000 to $74,999 | 21 | 10.4% |
| $75,000 to $99,999 | 65 | 32.2% |
| $100,000 to $149,999 | 14 | 6.9% |
| $150,000 to $199,999 | 36 | 17.8% |
| $200,000+ | 8 | 4.0% |
Family Income by Famaliy Size in Satsop
4-person families (58 | 28.7%) account for the highest median family income in Satsop with $95,833 per family, while 2-person families (100 | 49.5%) have the highest median income of $29,286 per family member.
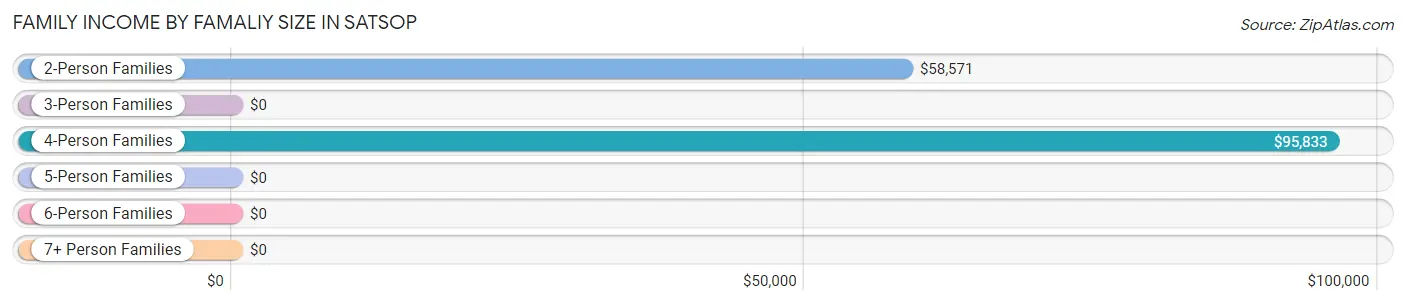
| Income Bracket | # Families | Median Income |
| 2-Person Families | 100 (49.5%) | $58,571 |
| 3-Person Families | 3 (1.5%) | $0 |
| 4-Person Families | 58 (28.7%) | $95,833 |
| 5-Person Families | 41 (20.3%) | $0 |
| 6-Person Families | 0 (0.0%) | $0 |
| 7+ Person Families | 0 (0.0%) | $0 |
| Total | 202 (100.0%) | $87,639 |
Family Income by Number of Earners in Satsop
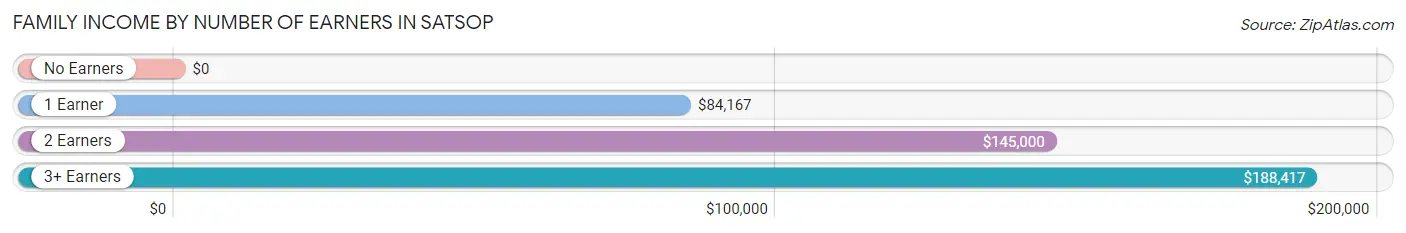
| Number of Earners | # Families | Median Income |
| No Earners | 45 (22.3%) | $0 |
| 1 Earner | 108 (53.5%) | $84,167 |
| 2 Earners | 20 (9.9%) | $145,000 |
| 3+ Earners | 29 (14.4%) | $188,417 |
| Total | 202 (100.0%) | $87,639 |
Household Income in Satsop
Household Income Brackets in Satsop
With 72 households falling in the category, the $75,000 to $99,999 income range is the most frequent in Satsop, accounting for 28.3% of all households.
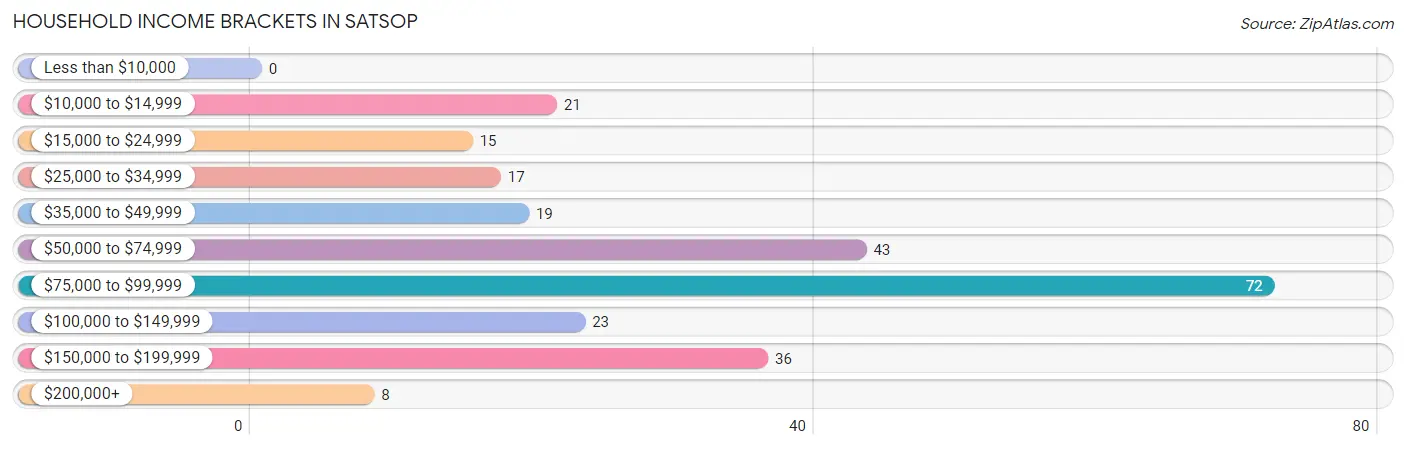
| Income Bracket | # Households | % Households |
| Less than $10,000 | 0 | 0.0% |
| $10,000 to $14,999 | 21 | 8.3% |
| $15,000 to $24,999 | 15 | 5.9% |
| $25,000 to $34,999 | 17 | 6.7% |
| $35,000 to $49,999 | 19 | 7.5% |
| $50,000 to $74,999 | 43 | 16.9% |
| $75,000 to $99,999 | 72 | 28.3% |
| $100,000 to $149,999 | 23 | 9.1% |
| $150,000 to $199,999 | 36 | 14.2% |
| $200,000+ | 8 | 3.1% |
Household Income by Householder Age in Satsop
The median household income in Satsop is $83,333, with the highest median household income of $93,250 found in the 25 to 44 years age bracket for the primary householder. A total of 56 households (22.1%) fall into this category.
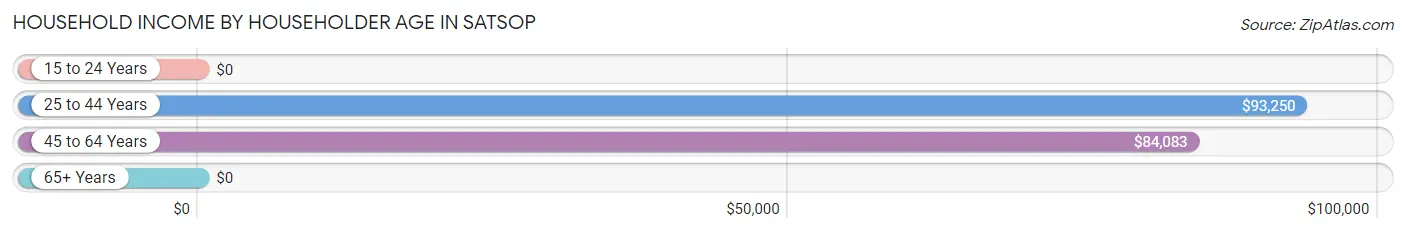
| Income Bracket | # Households | Median Income |
| 15 to 24 Years | 0 (0.0%) | $0 |
| 25 to 44 Years | 56 (22.1%) | $93,250 |
| 45 to 64 Years | 133 (52.4%) | $84,083 |
| 65+ Years | 65 (25.6%) | $0 |
| Total | 254 (100.0%) | $83,333 |
Poverty in Satsop
Income Below Poverty by Sex and Age in Satsop
With 7.9% poverty level for males and 7.3% for females among the residents of Satsop, 75 year old and over males and 65 to 74 year old females are the most vulnerable to poverty, with 22 males (46.8%) and 14 females (82.4%) in their respective age groups living below the poverty level.
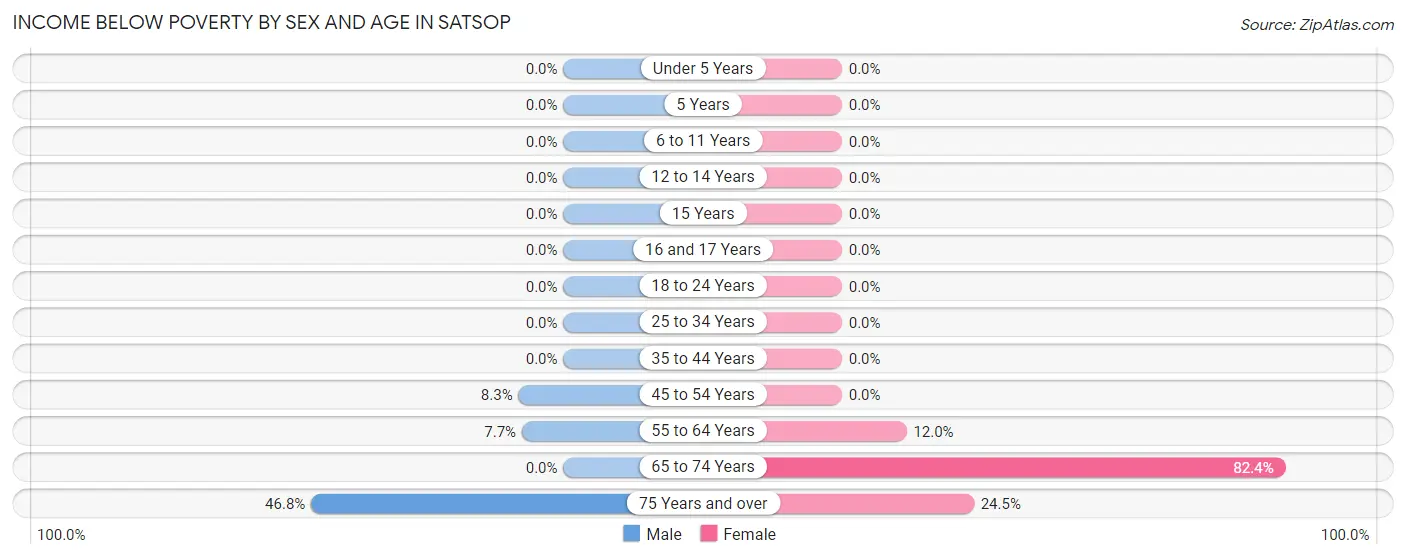
| Age Bracket | Male | Female |
| Under 5 Years | 0 (0.0%) | 0 (0.0%) |
| 5 Years | 0 (0.0%) | 0 (0.0%) |
| 6 to 11 Years | 0 (0.0%) | 0 (0.0%) |
| 12 to 14 Years | 0 (0.0%) | 0 (0.0%) |
| 15 Years | 0 (0.0%) | 0 (0.0%) |
| 16 and 17 Years | 0 (0.0%) | 0 (0.0%) |
| 18 to 24 Years | 0 (0.0%) | 0 (0.0%) |
| 25 to 34 Years | 0 (0.0%) | 0 (0.0%) |
| 35 to 44 Years | 0 (0.0%) | 0 (0.0%) |
| 45 to 54 Years | 4 (8.3%) | 0 (0.0%) |
| 55 to 64 Years | 3 (7.7%) | 3 (12.0%) |
| 65 to 74 Years | 0 (0.0%) | 14 (82.4%) |
| 75 Years and over | 22 (46.8%) | 12 (24.5%) |
| Total | 29 (7.9%) | 29 (7.3%) |
Income Above Poverty by Sex and Age in Satsop
According to the poverty statistics in Satsop, males aged under 5 years and females aged under 5 years are the age groups that are most secure financially, with 100.0% of males and 100.0% of females in these age groups living above the poverty line.
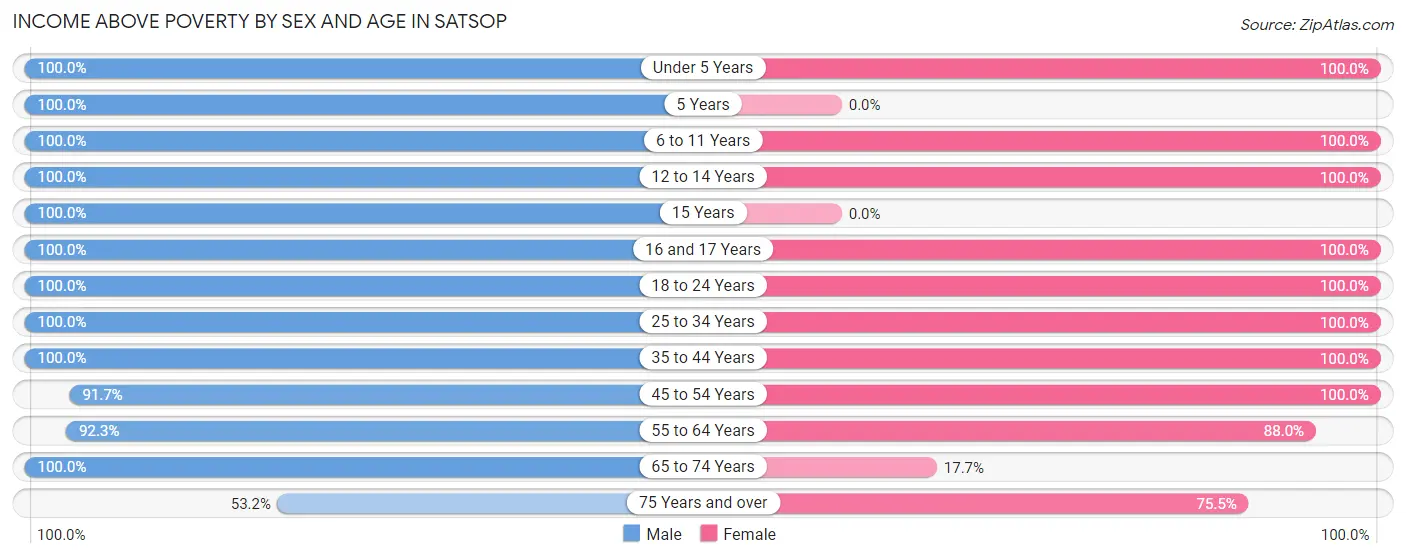
| Age Bracket | Male | Female |
| Under 5 Years | 14 (100.0%) | 7 (100.0%) |
| 5 Years | 7 (100.0%) | 0 (0.0%) |
| 6 to 11 Years | 68 (100.0%) | 44 (100.0%) |
| 12 to 14 Years | 9 (100.0%) | 17 (100.0%) |
| 15 Years | 13 (100.0%) | 0 (0.0%) |
| 16 and 17 Years | 23 (100.0%) | 17 (100.0%) |
| 18 to 24 Years | 11 (100.0%) | 45 (100.0%) |
| 25 to 34 Years | 25 (100.0%) | 28 (100.0%) |
| 35 to 44 Years | 43 (100.0%) | 58 (100.0%) |
| 45 to 54 Years | 44 (91.7%) | 92 (100.0%) |
| 55 to 64 Years | 36 (92.3%) | 22 (88.0%) |
| 65 to 74 Years | 22 (100.0%) | 3 (17.6%) |
| 75 Years and over | 25 (53.2%) | 37 (75.5%) |
| Total | 340 (92.1%) | 370 (92.7%) |
Income Below Poverty Among Married-Couple Families in Satsop
The poverty statistics for married-couple families in Satsop show that 13.4% or 25 of the total 187 families live below the poverty line. Families with no children have the highest poverty rate of 22.9%, comprising of 25 families. On the other hand, families with 1 or 2 children have the lowest poverty rate of 0.0%, which includes 0 families.
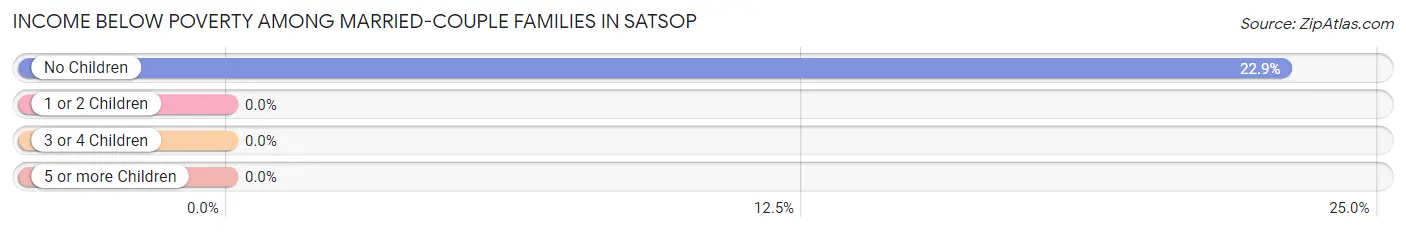
| Children | Above Poverty | Below Poverty |
| No Children | 84 (77.1%) | 25 (22.9%) |
| 1 or 2 Children | 52 (100.0%) | 0 (0.0%) |
| 3 or 4 Children | 26 (100.0%) | 0 (0.0%) |
| 5 or more Children | 0 (0.0%) | 0 (0.0%) |
| Total | 162 (86.6%) | 25 (13.4%) |
Income Below Poverty Among Single-Parent Households in Satsop
| Children | Single Father | Single Mother |
| No Children | 0 (0.0%) | 0 (0.0%) |
| 1 or 2 Children | 0 (0.0%) | 0 (0.0%) |
| 3 or 4 Children | 0 (0.0%) | 0 (0.0%) |
| 5 or more Children | 0 (0.0%) | 0 (0.0%) |
| Total | 0 (0.0%) | 0 (0.0%) |
Income Below Poverty Among Married-Couple vs Single-Parent Households in Satsop
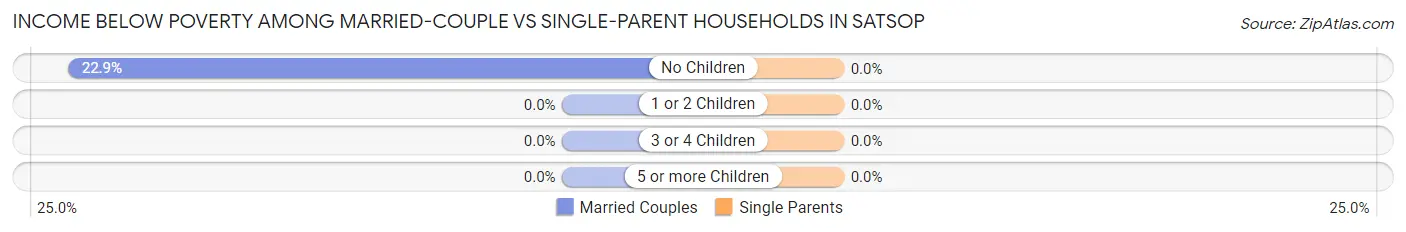
| Children | Married-Couple Families | Single-Parent Households |
| No Children | 25 (22.9%) | 0 (0.0%) |
| 1 or 2 Children | 0 (0.0%) | 0 (0.0%) |
| 3 or 4 Children | 0 (0.0%) | 0 (0.0%) |
| 5 or more Children | 0 (0.0%) | 0 (0.0%) |
| Total | 25 (13.4%) | 0 (0.0%) |
Race in Satsop
The most populous races in Satsop are White / Caucasian (635 | 82.7%), Two or more Races (105 | 13.7%), and Hispanic or Latino (49 | 6.4%).
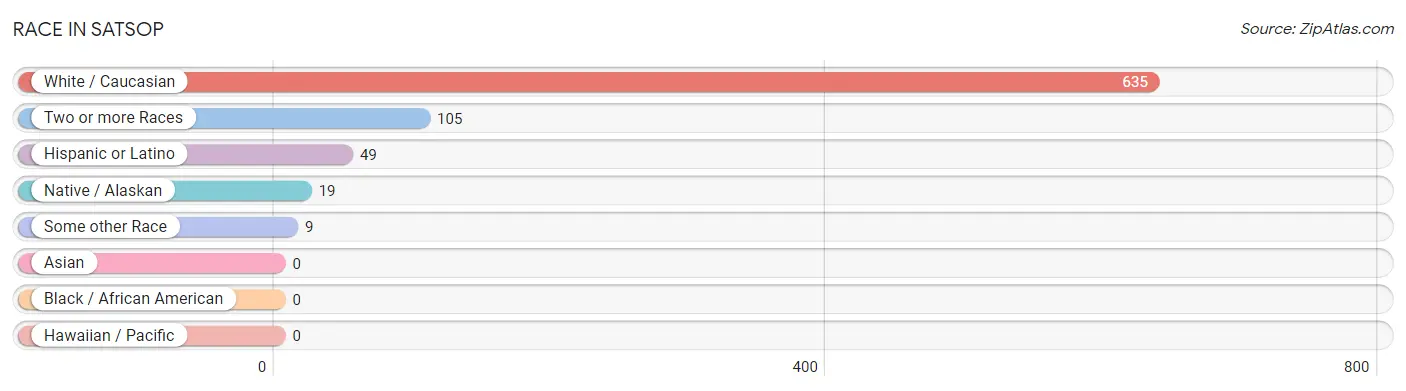
| Race | # Population | % Population |
| Asian | 0 | 0.0% |
| Black / African American | 0 | 0.0% |
| Hawaiian / Pacific | 0 | 0.0% |
| Hispanic or Latino | 49 | 6.4% |
| Native / Alaskan | 19 | 2.5% |
| White / Caucasian | 635 | 82.7% |
| Two or more Races | 105 | 13.7% |
| Some other Race | 9 | 1.2% |
| Total | 768 | 100.0% |
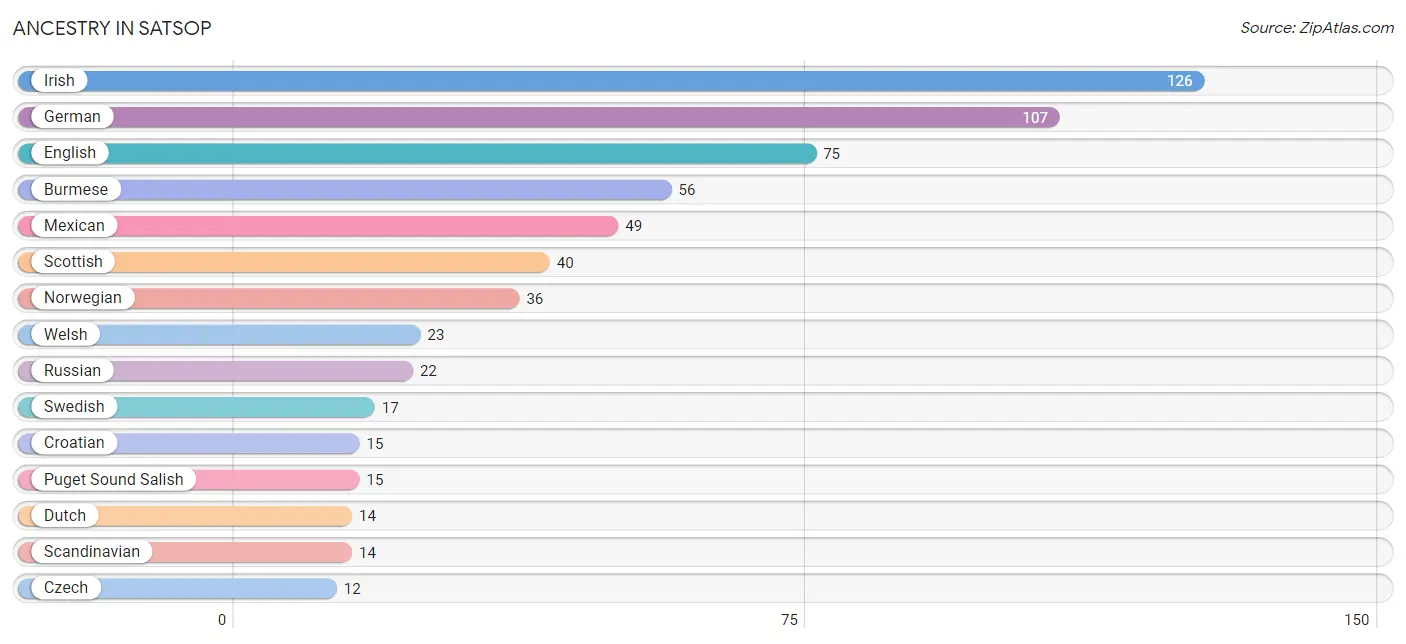
Ancestry in Satsop
The most populous ancestries reported in Satsop are Irish (126 | 16.4%), German (107 | 13.9%), English (75 | 9.8%), Burmese (56 | 7.3%), and Mexican (49 | 6.4%), together accounting for 53.8% of all Satsop residents.
| Ancestry | # Population | % Population |
| American | 10 | 1.3% |
| Burmese | 56 | 7.3% |
| Creek | 4 | 0.5% |
| Croatian | 15 | 1.9% |
| Czech | 12 | 1.6% |
| Danish | 4 | 0.5% |
| Dutch | 14 | 1.8% |
| English | 75 | 9.8% |
| European | 2 | 0.3% |
| French | 3 | 0.4% |
| French Canadian | 2 | 0.3% |
| German | 107 | 13.9% |
| Irish | 126 | 16.4% |
| Italian | 12 | 1.6% |
| Korean | 9 | 1.2% |
| Mexican | 49 | 6.4% |
| Norwegian | 36 | 4.7% |
| Polish | 4 | 0.5% |
| Puget Sound Salish | 15 | 1.9% |
| Russian | 22 | 2.9% |
| Samoan | 9 | 1.2% |
| Scandinavian | 14 | 1.8% |
| Scottish | 40 | 5.2% |
| Swedish | 17 | 2.2% |
| Swiss | 2 | 0.3% |
| Welsh | 23 | 3.0% | View All 26 Rows |
Immigrants in Satsop
The most numerous immigrant groups reported in Satsop came from Central America (9 | 1.2%), Latin America (9 | 1.2%), Mexico (9 | 1.2%), Asia (6 | 0.8%), and Eastern Asia (6 | 0.8%), together accounting for 5.1% of all Satsop residents.
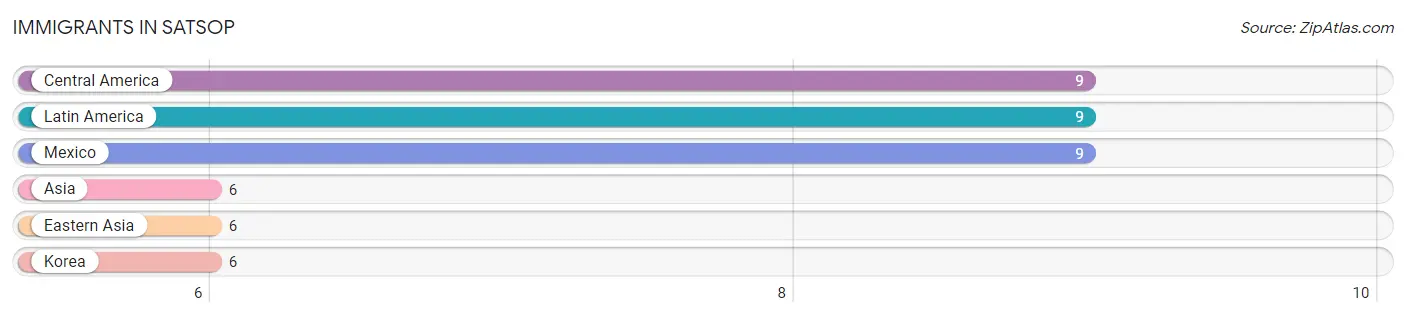
| Immigration Origin | # Population | % Population |
| Asia | 6 | 0.8% |
| Central America | 9 | 1.2% |
| Eastern Asia | 6 | 0.8% |
| Korea | 6 | 0.8% |
| Latin America | 9 | 1.2% |
| Mexico | 9 | 1.2% | View All 6 Rows |
Sex and Age in Satsop
Sex and Age in Satsop
The most populous age groups in Satsop are 10 to 14 Years (44 | 11.9%) for men and 50 to 54 Years (62 | 15.5%) for women.
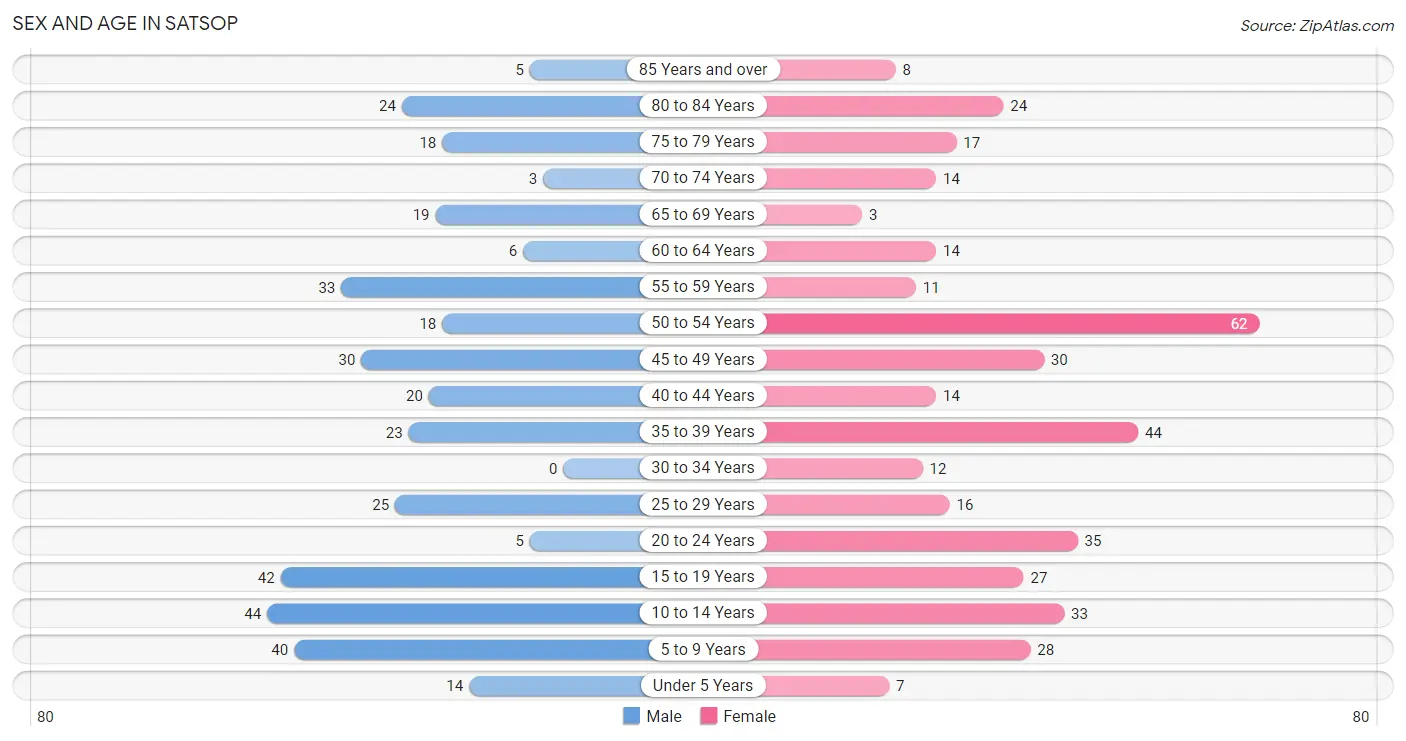
| Age Bracket | Male | Female |
| Under 5 Years | 14 (3.8%) | 7 (1.8%) |
| 5 to 9 Years | 40 (10.8%) | 28 (7.0%) |
| 10 to 14 Years | 44 (11.9%) | 33 (8.3%) |
| 15 to 19 Years | 42 (11.4%) | 27 (6.8%) |
| 20 to 24 Years | 5 (1.4%) | 35 (8.8%) |
| 25 to 29 Years | 25 (6.8%) | 16 (4.0%) |
| 30 to 34 Years | 0 (0.0%) | 12 (3.0%) |
| 35 to 39 Years | 23 (6.2%) | 44 (11.0%) |
| 40 to 44 Years | 20 (5.4%) | 14 (3.5%) |
| 45 to 49 Years | 30 (8.1%) | 30 (7.5%) |
| 50 to 54 Years | 18 (4.9%) | 62 (15.5%) |
| 55 to 59 Years | 33 (8.9%) | 11 (2.8%) |
| 60 to 64 Years | 6 (1.6%) | 14 (3.5%) |
| 65 to 69 Years | 19 (5.1%) | 3 (0.7%) |
| 70 to 74 Years | 3 (0.8%) | 14 (3.5%) |
| 75 to 79 Years | 18 (4.9%) | 17 (4.3%) |
| 80 to 84 Years | 24 (6.5%) | 24 (6.0%) |
| 85 Years and over | 5 (1.4%) | 8 (2.0%) |
| Total | 369 (100.0%) | 399 (100.0%) |
Families and Households in Satsop
Median Family Size in Satsop
The median family size in Satsop is 3.45 persons per family, with single female/mother families (12 | 5.9%) accounting for the largest median family size of 3.5 persons per family. On the other hand, single male/father families (3 | 1.5%) represent the smallest median family size with 3.00 persons per family.
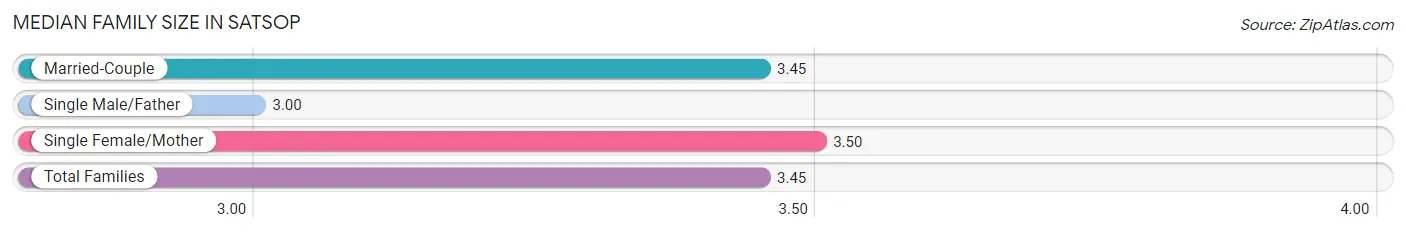
| Family Type | # Families | Family Size |
| Married-Couple | 187 (92.6%) | 3.45 |
| Single Male/Father | 3 (1.5%) | 3.00 |
| Single Female/Mother | 12 (5.9%) | 3.50 |
| Total Families | 202 (100.0%) | 3.45 |
Median Household Size in Satsop
The median household size in Satsop is 3.02 persons per household, with single male/father households (3 | 1.2%) accounting for the largest median household size of 4.33 persons per household. non-family households (52 | 20.5%) represent the smallest median household size with 1.12 persons per household.
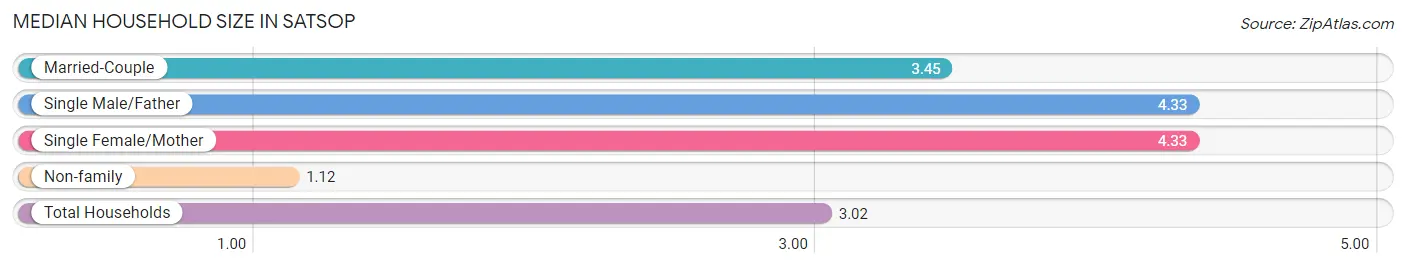
| Household Type | # Households | Household Size |
| Married-Couple | 187 (73.6%) | 3.45 |
| Single Male/Father | 3 (1.2%) | 4.33 |
| Single Female/Mother | 12 (4.7%) | 4.33 |
| Non-family | 52 (20.5%) | 1.12 |
| Total Households | 254 (100.0%) | 3.02 |
Household Size by Marriage Status in Satsop
Out of a total of 254 households in Satsop, 202 (79.5%) are family households, while 52 (20.5%) are nonfamily households. The most numerous type of family households are 2-person households, comprising 93, and the most common type of nonfamily households are 1-person households, comprising 46.
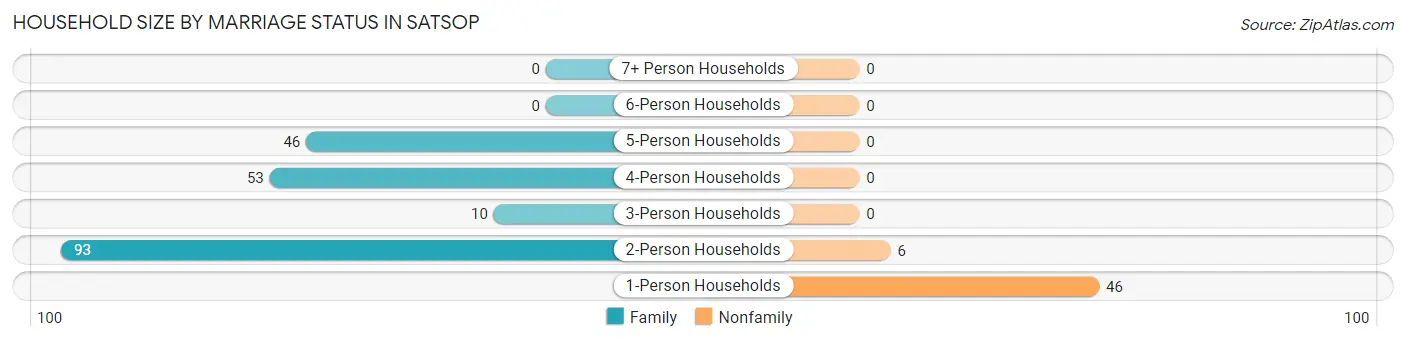
| Household Size | Family Households | Nonfamily Households |
| 1-Person Households | - | 46 (18.1%) |
| 2-Person Households | 93 (36.6%) | 6 (2.4%) |
| 3-Person Households | 10 (3.9%) | 0 (0.0%) |
| 4-Person Households | 53 (20.9%) | 0 (0.0%) |
| 5-Person Households | 46 (18.1%) | 0 (0.0%) |
| 6-Person Households | 0 (0.0%) | 0 (0.0%) |
| 7+ Person Households | 0 (0.0%) | 0 (0.0%) |
| Total | 202 (79.5%) | 52 (20.5%) |
Female Fertility in Satsop
Fertility by Age in Satsop
| Age Bracket | Women with Births | Births / 1,000 Women |
| 15 to 19 years | 0 (0.0%) | 0.0 |
| 20 to 34 years | 0 (0.0%) | 0.0 |
| 35 to 50 years | 0 (0.0%) | 0.0 |
| Total | 0 (0.0%) | 0.0 |
Fertility by Age by Marriage Status in Satsop
| Age Bracket | Married | Unmarried |
| 15 to 19 years | 0 (0.0%) | 0 (0.0%) |
| 20 to 34 years | 0 (0.0%) | 0 (0.0%) |
| 35 to 50 years | 0 (0.0%) | 0 (0.0%) |
| Total | 0 (0.0%) | 0 (0.0%) |
Fertility by Education in Satsop
| Educational Attainment | Women with Births | Births / 1,000 Women |
| Less than High School | 0 (0.0%) | 0.0 |
| High School Diploma | 0 (0.0%) | 0.0 |
| College or Associate's Degree | 0 (0.0%) | 0.0 |
| Bachelor's Degree | 0 (0.0%) | 0.0 |
| Graduate Degree | 0 (0.0%) | 0.0 |
| Total | 0 (0.0%) | 0.0 |
Fertility by Education by Marriage Status in Satsop
| Educational Attainment | Married | Unmarried |
| Less than High School | 0 (0.0%) | 0 (0.0%) |
| High School Diploma | 0 (0.0%) | 0 (0.0%) |
| College or Associate's Degree | 0 (0.0%) | 0 (0.0%) |
| Bachelor's Degree | 0 (0.0%) | 0 (0.0%) |
| Graduate Degree | 0 (0.0%) | 0 (0.0%) |
| Total | 0 (0.0%) | 0 (0.0%) |
Employment Characteristics in Satsop
Employment by Class of Employer in Satsop
Among the 276 employed individuals in Satsop, private company employees (168 | 60.9%), state government employees (49 | 17.7%), and local government employees (44 | 15.9%) make up the most common classes of employment.
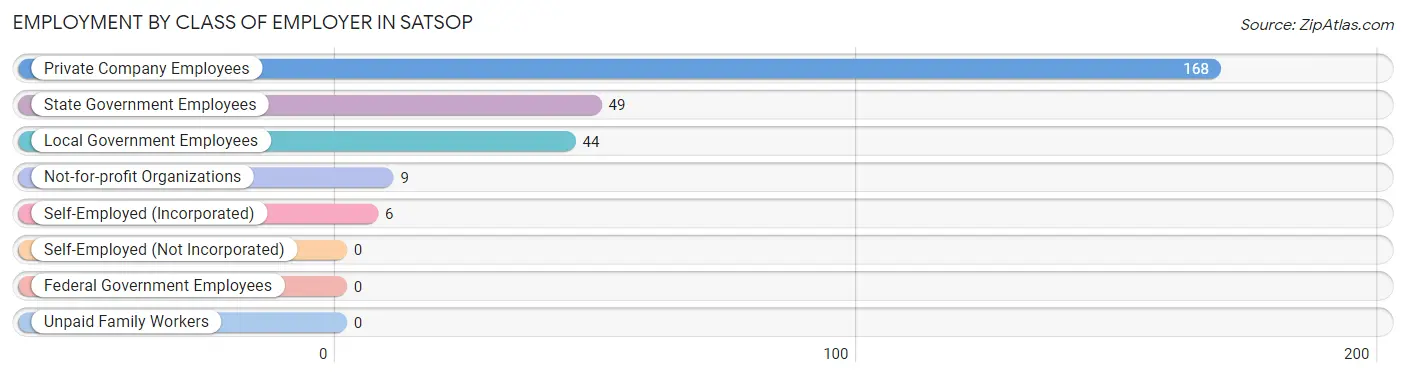
| Employer Class | # Employees | % Employees |
| Private Company Employees | 168 | 60.9% |
| Self-Employed (Incorporated) | 6 | 2.2% |
| Self-Employed (Not Incorporated) | 0 | 0.0% |
| Not-for-profit Organizations | 9 | 3.3% |
| Local Government Employees | 44 | 15.9% |
| State Government Employees | 49 | 17.7% |
| Federal Government Employees | 0 | 0.0% |
| Unpaid Family Workers | 0 | 0.0% |
| Total | 276 | 100.0% |
Employment Status by Age in Satsop
According to the labor force statistics for Satsop, out of the total population over 16 years of age (589), 53.0% or 312 individuals are in the labor force, with 5.8% or 18 of them unemployed. The age group with the highest labor force participation rate is 20 to 24 years, with 100.0% or 40 individuals in the labor force. Within the labor force, the 20 to 24 years age range has the highest percentage of unemployed individuals, with 45.0% or 18 of them being unemployed.
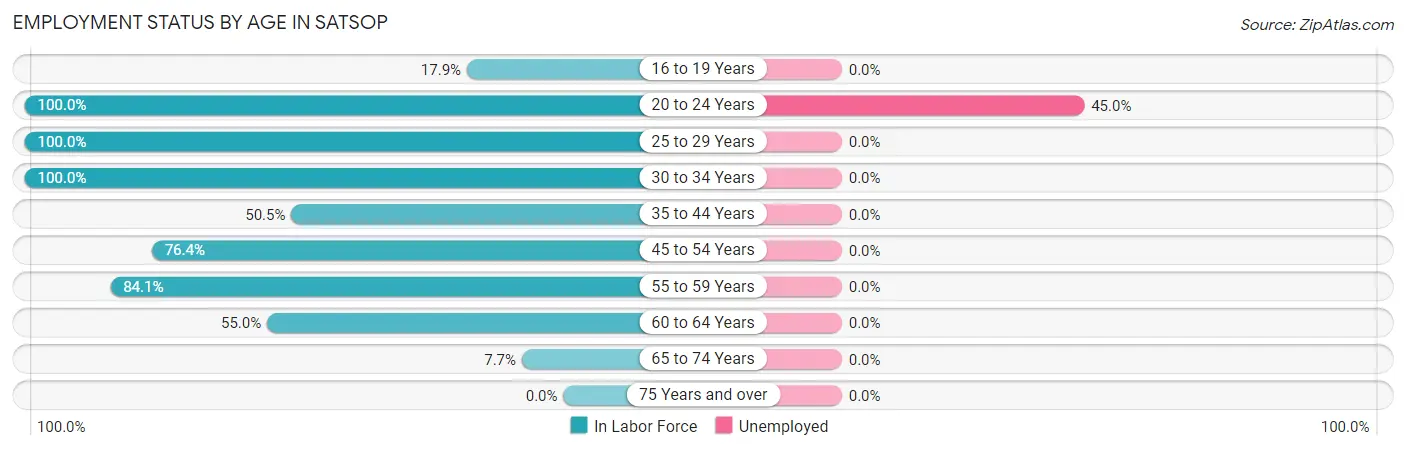
| Age Bracket | In Labor Force | Unemployed |
| 16 to 19 Years | 10 (17.9%) | 0 (0.0%) |
| 20 to 24 Years | 40 (100.0%) | 18 (45.0%) |
| 25 to 29 Years | 41 (100.0%) | 0 (0.0%) |
| 30 to 34 Years | 12 (100.0%) | 0 (0.0%) |
| 35 to 44 Years | 51 (50.5%) | 0 (0.0%) |
| 45 to 54 Years | 107 (76.4%) | 0 (0.0%) |
| 55 to 59 Years | 37 (84.1%) | 0 (0.0%) |
| 60 to 64 Years | 11 (55.0%) | 0 (0.0%) |
| 65 to 74 Years | 3 (7.7%) | 0 (0.0%) |
| 75 Years and over | 0 (0.0%) | 0 (0.0%) |
| Total | 312 (53.0%) | 18 (5.8%) |
Employment Status by Educational Attainment in Satsop
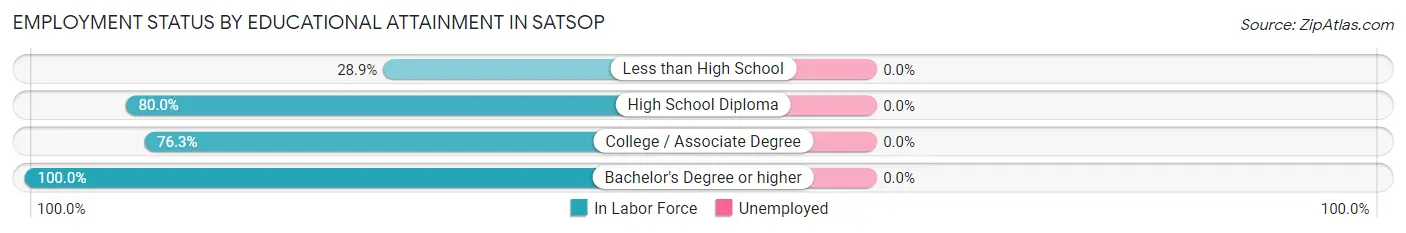
| Educational Attainment | In Labor Force | Unemployed |
| Less than High School | 13 (28.9%) | 0 (0.0%) |
| High School Diploma | 88 (80.0%) | 0 (0.0%) |
| College / Associate Degree | 145 (76.3%) | 0 (0.0%) |
| Bachelor's Degree or higher | 13 (100.0%) | 0 (0.0%) |
| Total | 259 (72.3%) | 0 (0.0%) |
Employment Occupations by Sex in Satsop
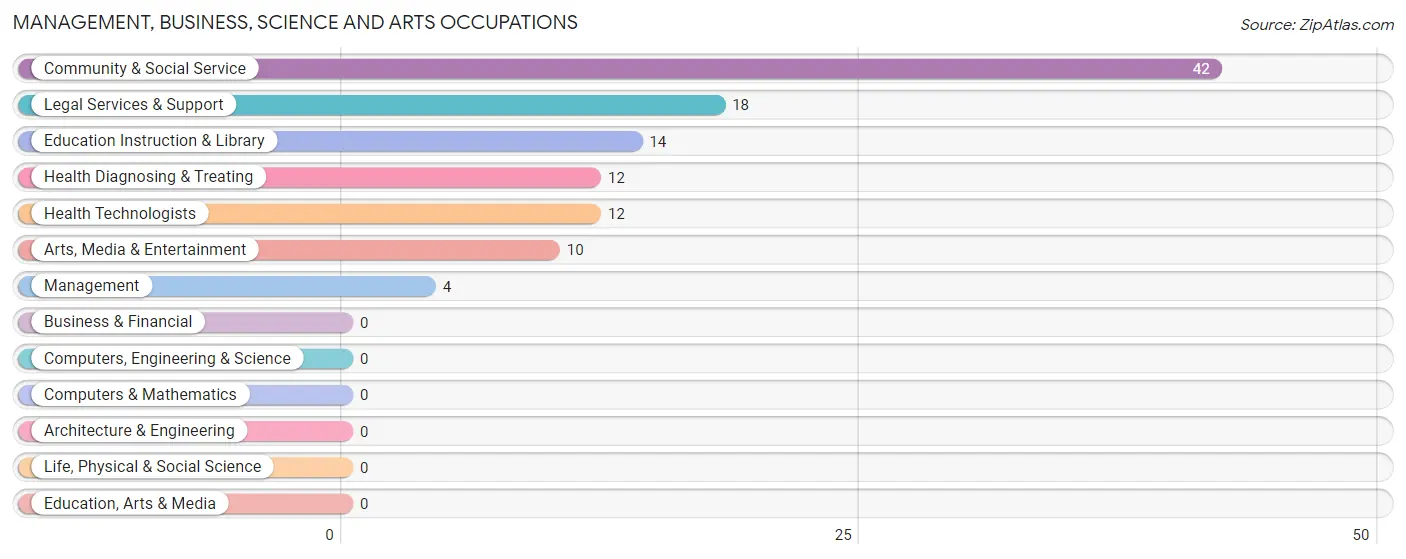
Management, Business, Science and Arts Occupations
The most common Management, Business, Science and Arts occupations in Satsop are Community & Social Service (42 | 14.3%), Legal Services & Support (18 | 6.1%), Education Instruction & Library (14 | 4.8%), Health Diagnosing & Treating (12 | 4.1%), and Health Technologists (12 | 4.1%).
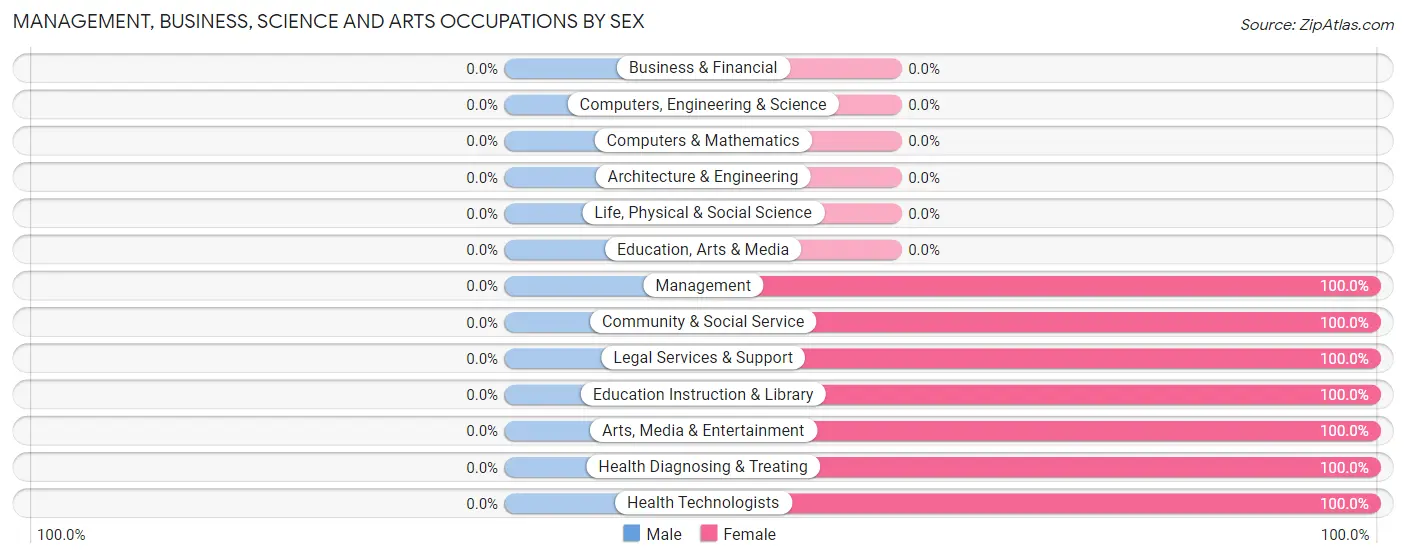
Management, Business, Science and Arts Occupations by Sex
| Occupation | Male | Female |
| Management | 0 (0.0%) | 4 (100.0%) |
| Business & Financial | 0 (0.0%) | 0 (0.0%) |
| Computers, Engineering & Science | 0 (0.0%) | 0 (0.0%) |
| Computers & Mathematics | 0 (0.0%) | 0 (0.0%) |
| Architecture & Engineering | 0 (0.0%) | 0 (0.0%) |
| Life, Physical & Social Science | 0 (0.0%) | 0 (0.0%) |
| Community & Social Service | 0 (0.0%) | 42 (100.0%) |
| Education, Arts & Media | 0 (0.0%) | 0 (0.0%) |
| Legal Services & Support | 0 (0.0%) | 18 (100.0%) |
| Education Instruction & Library | 0 (0.0%) | 14 (100.0%) |
| Arts, Media & Entertainment | 0 (0.0%) | 10 (100.0%) |
| Health Diagnosing & Treating | 0 (0.0%) | 12 (100.0%) |
| Health Technologists | 0 (0.0%) | 12 (100.0%) |
| Total (Category) | 0 (0.0%) | 58 (100.0%) |
| Total (Overall) | 120 (40.8%) | 174 (59.2%) |
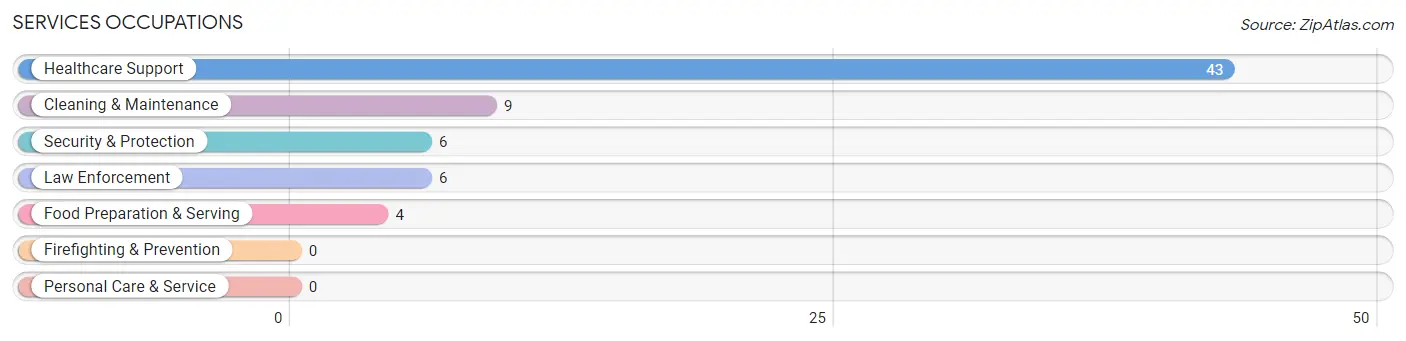
Services Occupations
The most common Services occupations in Satsop are Healthcare Support (43 | 14.6%), Cleaning & Maintenance (9 | 3.1%), Security & Protection (6 | 2.0%), Law Enforcement (6 | 2.0%), and Food Preparation & Serving (4 | 1.4%).
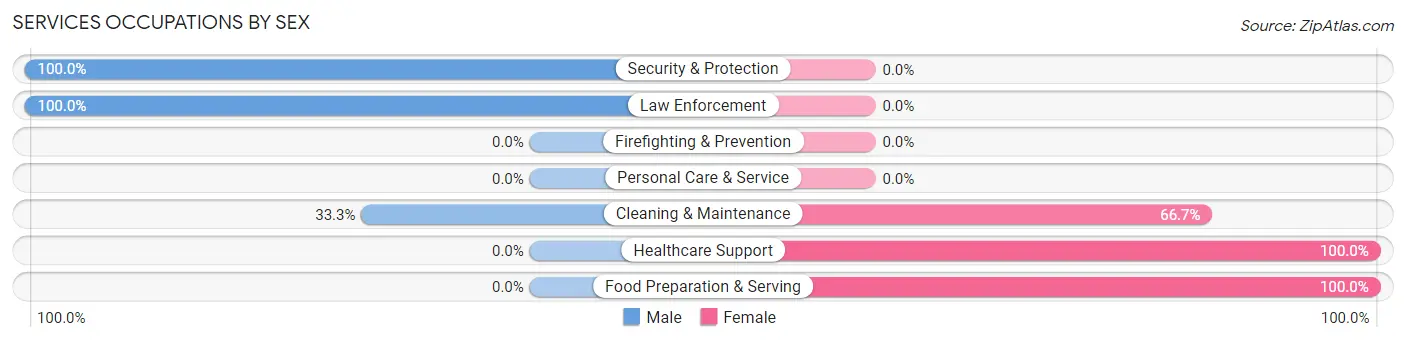
Services Occupations by Sex
Within the Services occupations in Satsop, the most male-oriented occupations are Security & Protection (100.0%), Law Enforcement (100.0%), and Cleaning & Maintenance (33.3%), while the most female-oriented occupations are Healthcare Support (100.0%), Food Preparation & Serving (100.0%), and Cleaning & Maintenance (66.7%).
| Occupation | Male | Female |
| Healthcare Support | 0 (0.0%) | 43 (100.0%) |
| Security & Protection | 6 (100.0%) | 0 (0.0%) |
| Firefighting & Prevention | 0 (0.0%) | 0 (0.0%) |
| Law Enforcement | 6 (100.0%) | 0 (0.0%) |
| Food Preparation & Serving | 0 (0.0%) | 4 (100.0%) |
| Cleaning & Maintenance | 3 (33.3%) | 6 (66.7%) |
| Personal Care & Service | 0 (0.0%) | 0 (0.0%) |
| Total (Category) | 9 (14.5%) | 53 (85.5%) |
| Total (Overall) | 120 (40.8%) | 174 (59.2%) |
Sales and Office Occupations
The most common Sales and Office occupations in Satsop are Sales & Related (32 | 10.9%), and Office & Administration (23 | 7.8%).
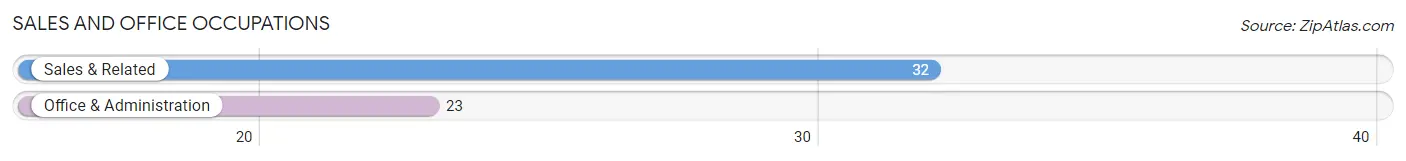
Sales and Office Occupations by Sex
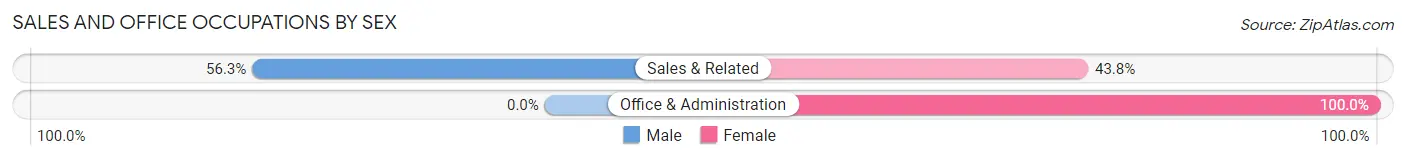
| Occupation | Male | Female |
| Sales & Related | 18 (56.2%) | 14 (43.8%) |
| Office & Administration | 0 (0.0%) | 23 (100.0%) |
| Total (Category) | 18 (32.7%) | 37 (67.3%) |
| Total (Overall) | 120 (40.8%) | 174 (59.2%) |
Natural Resources, Construction and Maintenance Occupations
The most common Natural Resources, Construction and Maintenance occupations in Satsop are Installation, Maintenance & Repair (47 | 16.0%), and Construction & Extraction (34 | 11.6%).
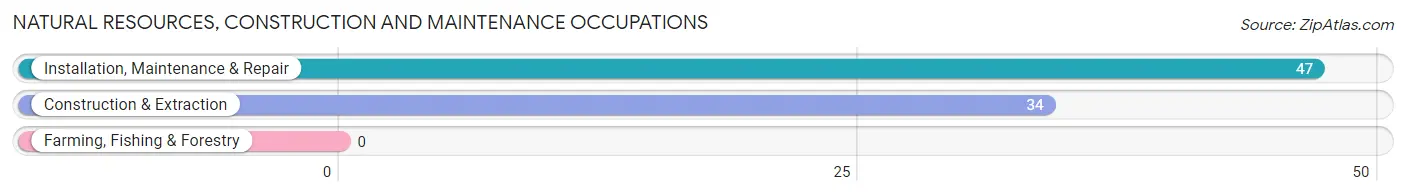
Natural Resources, Construction and Maintenance Occupations by Sex
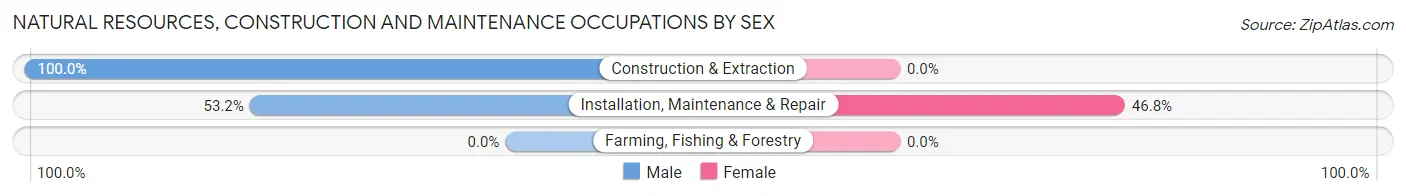
| Occupation | Male | Female |
| Farming, Fishing & Forestry | 0 (0.0%) | 0 (0.0%) |
| Construction & Extraction | 34 (100.0%) | 0 (0.0%) |
| Installation, Maintenance & Repair | 25 (53.2%) | 22 (46.8%) |
| Total (Category) | 59 (72.8%) | 22 (27.2%) |
| Total (Overall) | 120 (40.8%) | 174 (59.2%) |
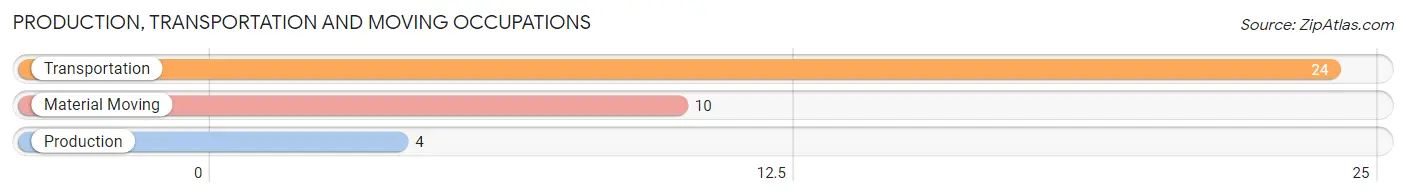
Production, Transportation and Moving Occupations
The most common Production, Transportation and Moving occupations in Satsop are Transportation (24 | 8.2%), Material Moving (10 | 3.4%), and Production (4 | 1.4%).
Production, Transportation and Moving Occupations by Sex
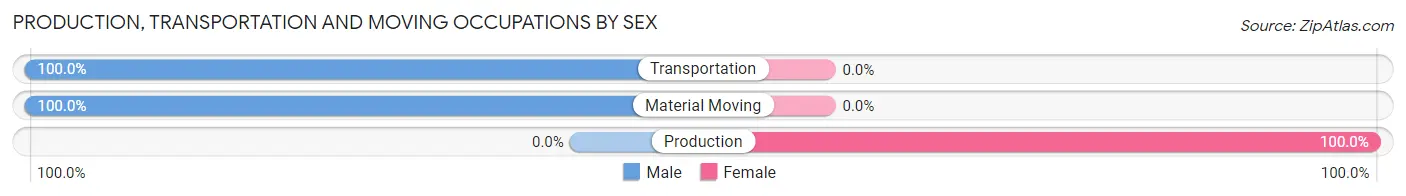
| Occupation | Male | Female |
| Production | 0 (0.0%) | 4 (100.0%) |
| Transportation | 24 (100.0%) | 0 (0.0%) |
| Material Moving | 10 (100.0%) | 0 (0.0%) |
| Total (Category) | 34 (89.5%) | 4 (10.5%) |
| Total (Overall) | 120 (40.8%) | 174 (59.2%) |
Employment Industries by Sex in Satsop
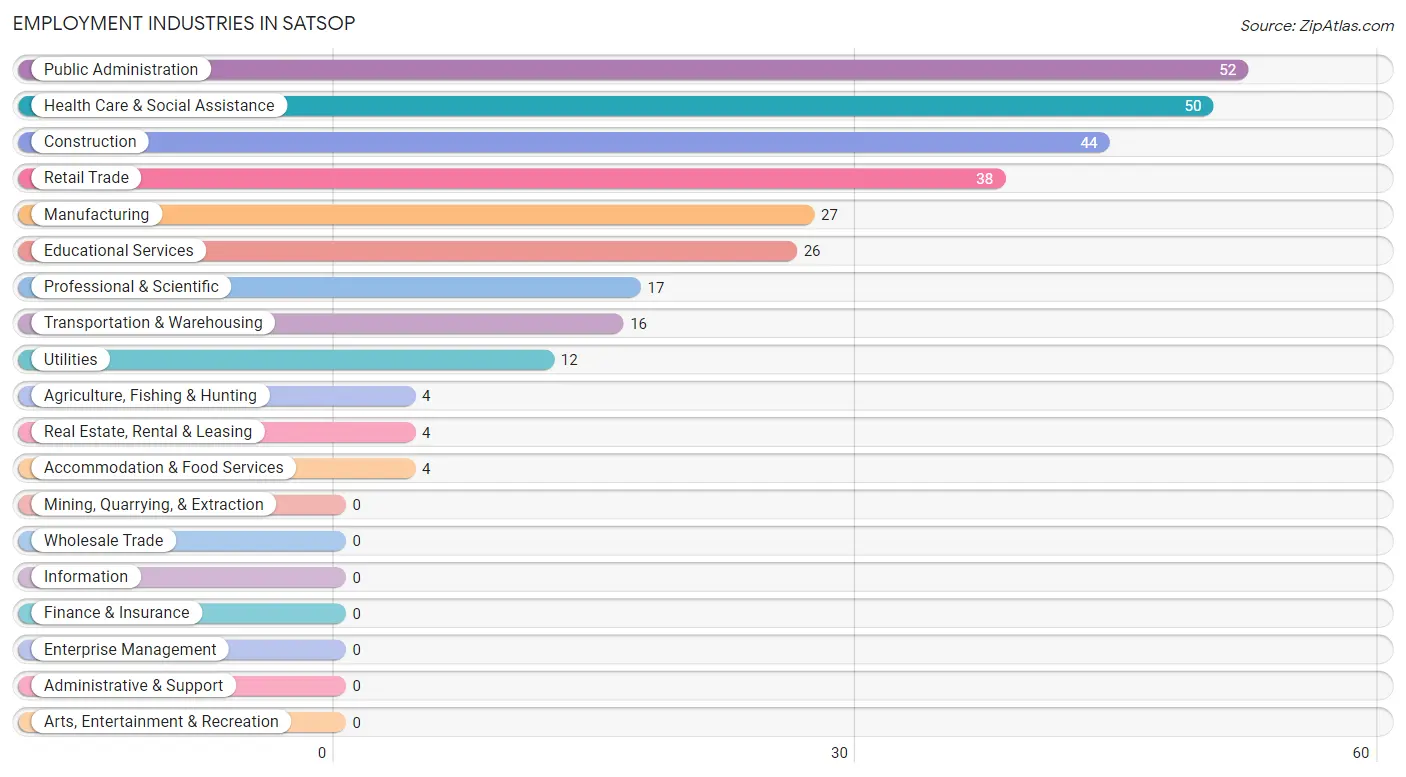
Employment Industries in Satsop
The major employment industries in Satsop include Public Administration (52 | 17.7%), Health Care & Social Assistance (50 | 17.0%), Construction (44 | 15.0%), Retail Trade (38 | 12.9%), and Manufacturing (27 | 9.2%).
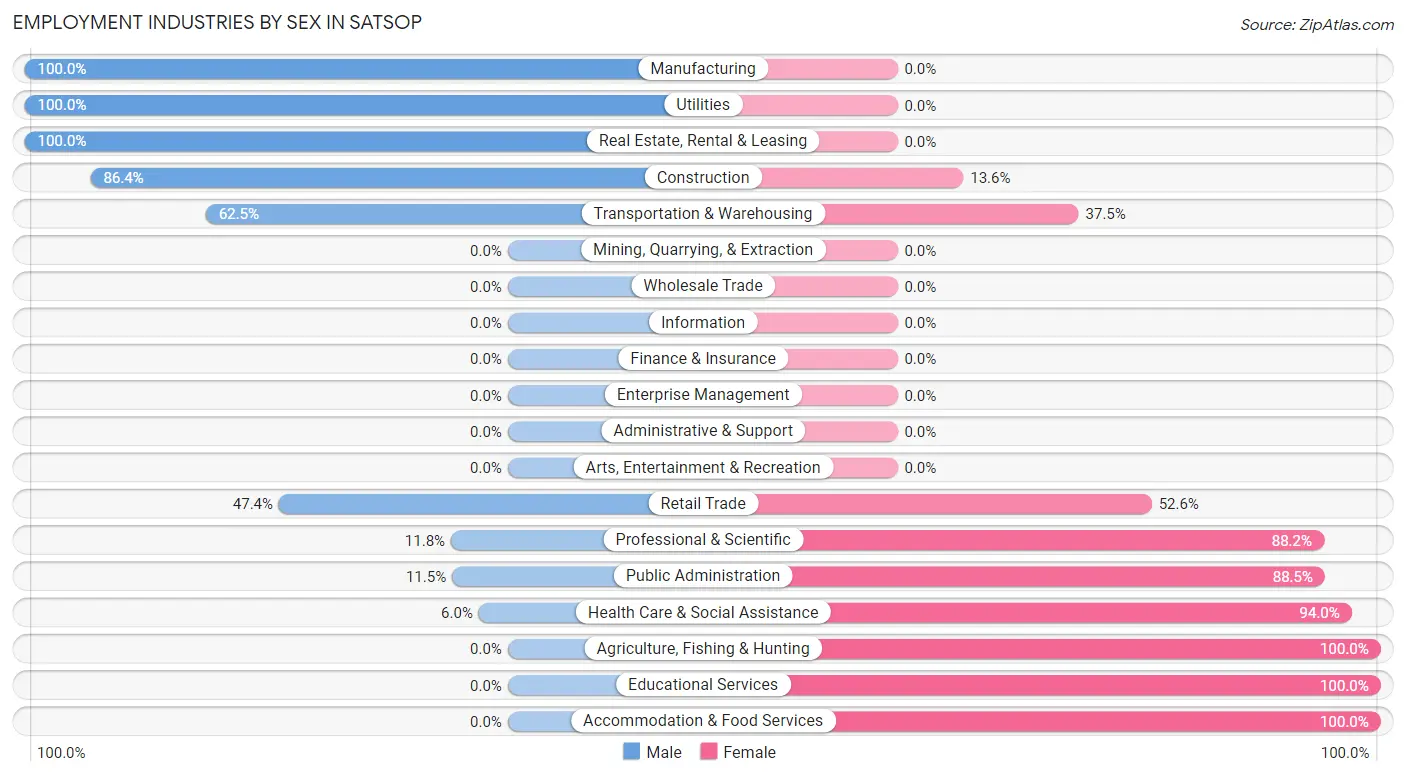
Employment Industries by Sex in Satsop
The Satsop industries that see more men than women are Manufacturing (100.0%), Utilities (100.0%), and Real Estate, Rental & Leasing (100.0%), whereas the industries that tend to have a higher number of women are Agriculture, Fishing & Hunting (100.0%), Educational Services (100.0%), and Accommodation & Food Services (100.0%).
| Industry | Male | Female |
| Agriculture, Fishing & Hunting | 0 (0.0%) | 4 (100.0%) |
| Mining, Quarrying, & Extraction | 0 (0.0%) | 0 (0.0%) |
| Construction | 38 (86.4%) | 6 (13.6%) |
| Manufacturing | 27 (100.0%) | 0 (0.0%) |
| Wholesale Trade | 0 (0.0%) | 0 (0.0%) |
| Retail Trade | 18 (47.4%) | 20 (52.6%) |
| Transportation & Warehousing | 10 (62.5%) | 6 (37.5%) |
| Utilities | 12 (100.0%) | 0 (0.0%) |
| Information | 0 (0.0%) | 0 (0.0%) |
| Finance & Insurance | 0 (0.0%) | 0 (0.0%) |
| Real Estate, Rental & Leasing | 4 (100.0%) | 0 (0.0%) |
| Professional & Scientific | 2 (11.8%) | 15 (88.2%) |
| Enterprise Management | 0 (0.0%) | 0 (0.0%) |
| Administrative & Support | 0 (0.0%) | 0 (0.0%) |
| Educational Services | 0 (0.0%) | 26 (100.0%) |
| Health Care & Social Assistance | 3 (6.0%) | 47 (94.0%) |
| Arts, Entertainment & Recreation | 0 (0.0%) | 0 (0.0%) |
| Accommodation & Food Services | 0 (0.0%) | 4 (100.0%) |
| Public Administration | 6 (11.5%) | 46 (88.5%) |
| Total | 120 (40.8%) | 174 (59.2%) |
Education in Satsop
School Enrollment in Satsop
The most common levels of schooling among the 209 students in Satsop are middle school (61 | 29.2%), elementary school (60 | 28.7%), and high school (57 | 27.3%).
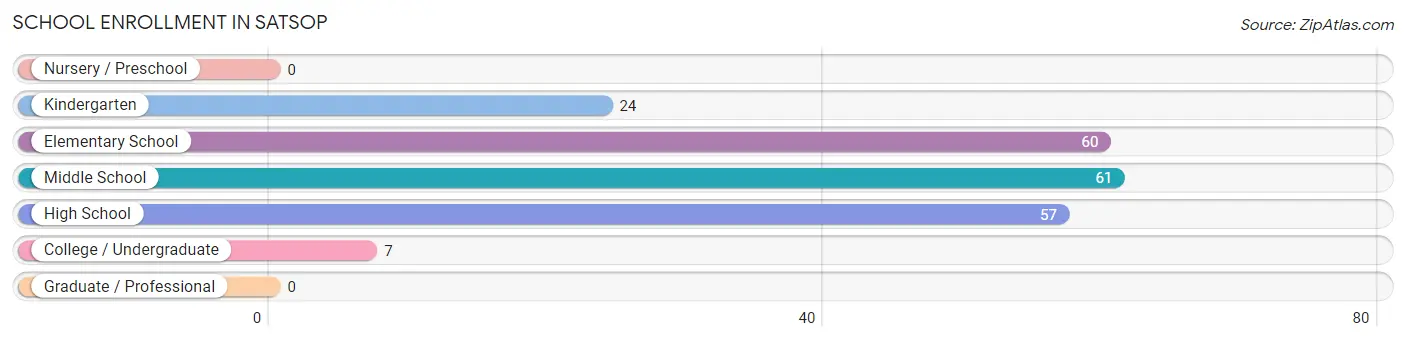
| School Level | # Students | % Students |
| Nursery / Preschool | 0 | 0.0% |
| Kindergarten | 24 | 11.5% |
| Elementary School | 60 | 28.7% |
| Middle School | 61 | 29.2% |
| High School | 57 | 27.3% |
| College / Undergraduate | 7 | 3.4% |
| Graduate / Professional | 0 | 0.0% |
| Total | 209 | 100.0% |
School Enrollment by Age by Funding Source in Satsop
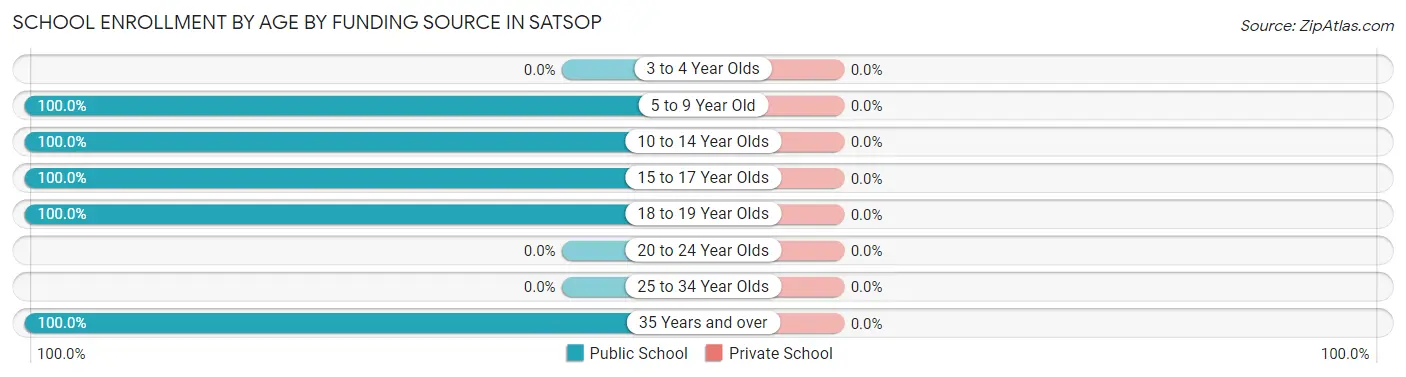
| Age Bracket | Public School | Private School |
| 3 to 4 Year Olds | 0 (0.0%) | 0 (0.0%) |
| 5 to 9 Year Old | 68 (100.0%) | 0 (0.0%) |
| 10 to 14 Year Olds | 77 (100.0%) | 0 (0.0%) |
| 15 to 17 Year Olds | 53 (100.0%) | 0 (0.0%) |
| 18 to 19 Year Olds | 4 (100.0%) | 0 (0.0%) |
| 20 to 24 Year Olds | 0 (0.0%) | 0 (0.0%) |
| 25 to 34 Year Olds | 0 (0.0%) | 0 (0.0%) |
| 35 Years and over | 7 (100.0%) | 0 (0.0%) |
| Total | 209 (100.0%) | 0 (0.0%) |
Educational Attainment by Field of Study in Satsop
Education (22 | 88.0%), and psychology (3 | 12.0%) are the most common fields of study among 25 individuals in Satsop who have obtained a bachelor's degree or higher.
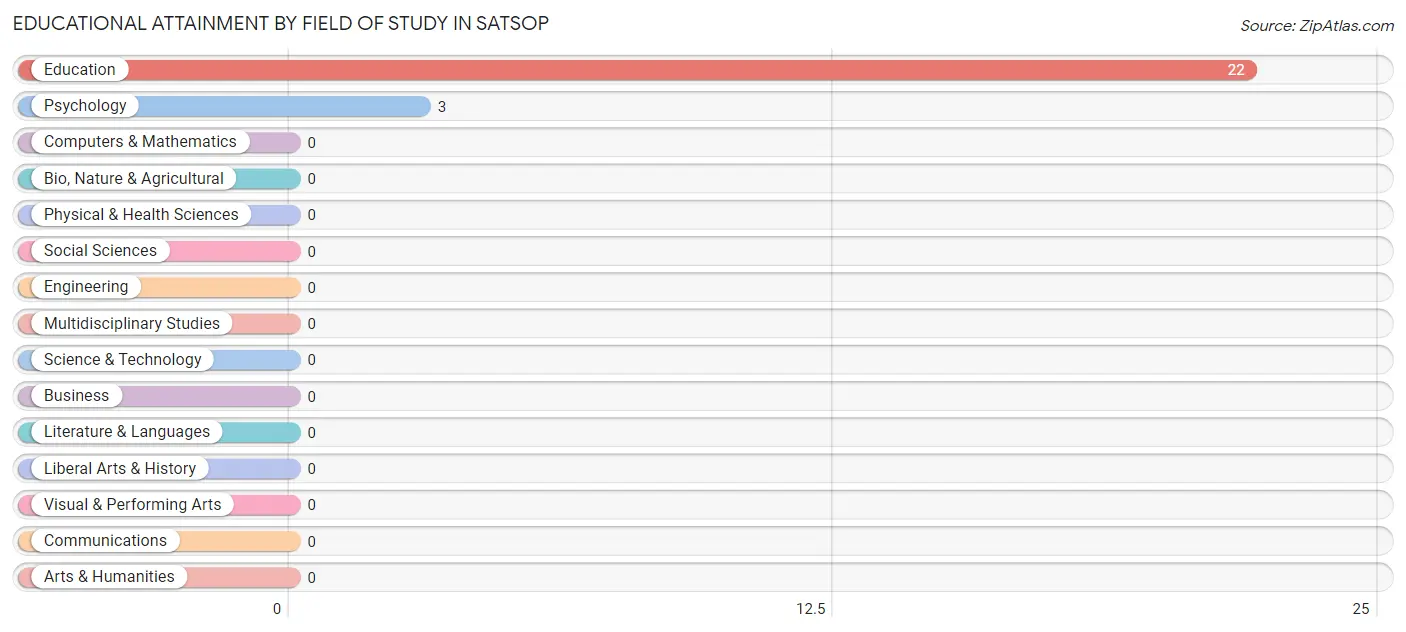
| Field of Study | # Graduates | % Graduates |
| Computers & Mathematics | 0 | 0.0% |
| Bio, Nature & Agricultural | 0 | 0.0% |
| Physical & Health Sciences | 0 | 0.0% |
| Psychology | 3 | 12.0% |
| Social Sciences | 0 | 0.0% |
| Engineering | 0 | 0.0% |
| Multidisciplinary Studies | 0 | 0.0% |
| Science & Technology | 0 | 0.0% |
| Business | 0 | 0.0% |
| Education | 22 | 88.0% |
| Literature & Languages | 0 | 0.0% |
| Liberal Arts & History | 0 | 0.0% |
| Visual & Performing Arts | 0 | 0.0% |
| Communications | 0 | 0.0% |
| Arts & Humanities | 0 | 0.0% |
| Total | 25 | 100.0% |
Transportation & Commute in Satsop
Vehicle Availability by Sex in Satsop
The most prevalent vehicle ownership categories in Satsop are males with 3 vehicles (64, accounting for 61.0%) and females with 3 vehicles (96, making up 37.4%).
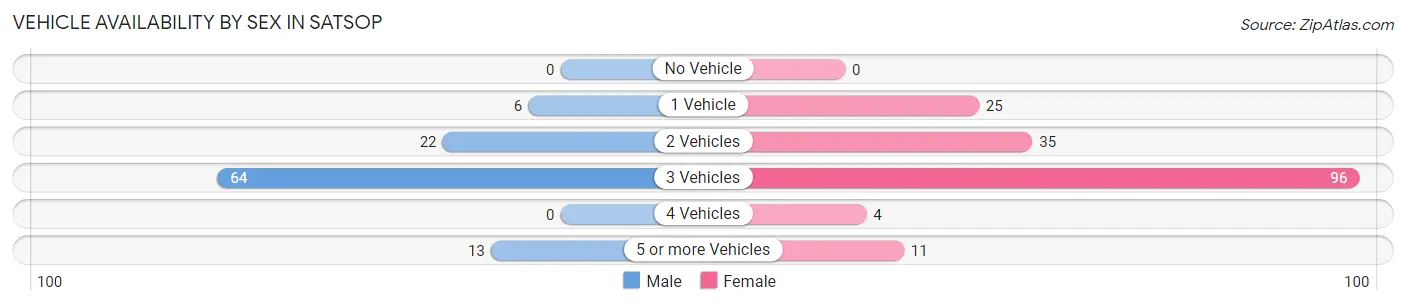
| Vehicles Available | Male | Female |
| No Vehicle | 0 (0.0%) | 0 (0.0%) |
| 1 Vehicle | 6 (5.7%) | 25 (14.6%) |
| 2 Vehicles | 22 (20.9%) | 35 (20.5%) |
| 3 Vehicles | 64 (61.0%) | 96 (56.1%) |
| 4 Vehicles | 0 (0.0%) | 4 (2.3%) |
| 5 or more Vehicles | 13 (12.4%) | 11 (6.4%) |
| Total | 105 (100.0%) | 171 (100.0%) |
Commute Time in Satsop
The most frequently occuring commute durations in Satsop are 30 to 34 minutes (73 commuters, 26.8%), 10 to 14 minutes (32 commuters, 11.8%), and 40 to 44 minutes (28 commuters, 10.3%).
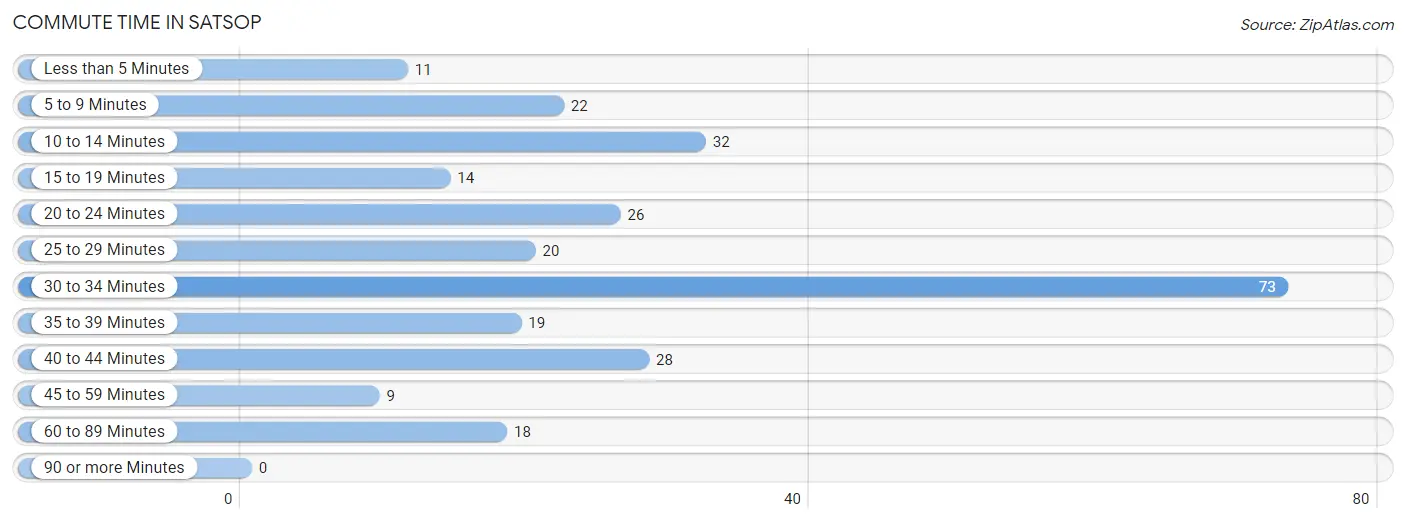
| Commute Time | # Commuters | % Commuters |
| Less than 5 Minutes | 11 | 4.0% |
| 5 to 9 Minutes | 22 | 8.1% |
| 10 to 14 Minutes | 32 | 11.8% |
| 15 to 19 Minutes | 14 | 5.1% |
| 20 to 24 Minutes | 26 | 9.6% |
| 25 to 29 Minutes | 20 | 7.3% |
| 30 to 34 Minutes | 73 | 26.8% |
| 35 to 39 Minutes | 19 | 7.0% |
| 40 to 44 Minutes | 28 | 10.3% |
| 45 to 59 Minutes | 9 | 3.3% |
| 60 to 89 Minutes | 18 | 6.6% |
| 90 or more Minutes | 0 | 0.0% |
Commute Time by Sex in Satsop
The most common commute times in Satsop are 30 to 34 minutes (35 commuters, 33.3%) for males and 30 to 34 minutes (38 commuters, 22.8%) for females.
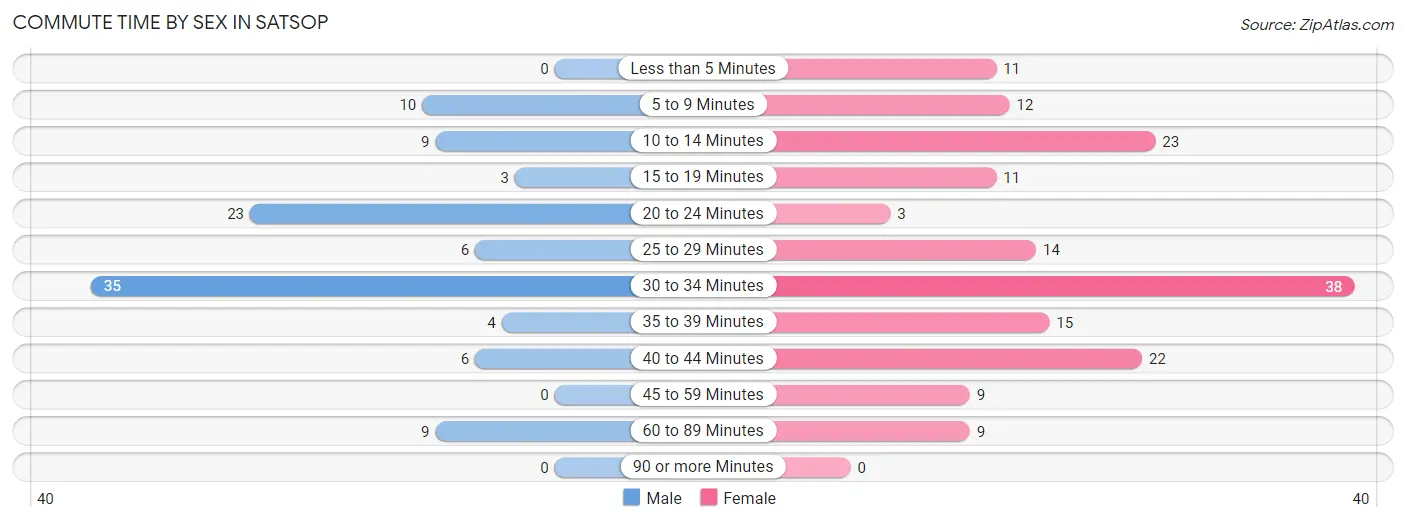
| Commute Time | Male | Female |
| Less than 5 Minutes | 0 (0.0%) | 11 (6.6%) |
| 5 to 9 Minutes | 10 (9.5%) | 12 (7.2%) |
| 10 to 14 Minutes | 9 (8.6%) | 23 (13.8%) |
| 15 to 19 Minutes | 3 (2.9%) | 11 (6.6%) |
| 20 to 24 Minutes | 23 (21.9%) | 3 (1.8%) |
| 25 to 29 Minutes | 6 (5.7%) | 14 (8.4%) |
| 30 to 34 Minutes | 35 (33.3%) | 38 (22.8%) |
| 35 to 39 Minutes | 4 (3.8%) | 15 (9.0%) |
| 40 to 44 Minutes | 6 (5.7%) | 22 (13.2%) |
| 45 to 59 Minutes | 0 (0.0%) | 9 (5.4%) |
| 60 to 89 Minutes | 9 (8.6%) | 9 (5.4%) |
| 90 or more Minutes | 0 (0.0%) | 0 (0.0%) |
Time of Departure to Work by Sex in Satsop
The most frequent times of departure to work in Satsop are 5:00 AM to 5:29 AM (24, 22.9%) for males and 9:00 AM to 9:59 AM (30, 18.0%) for females.
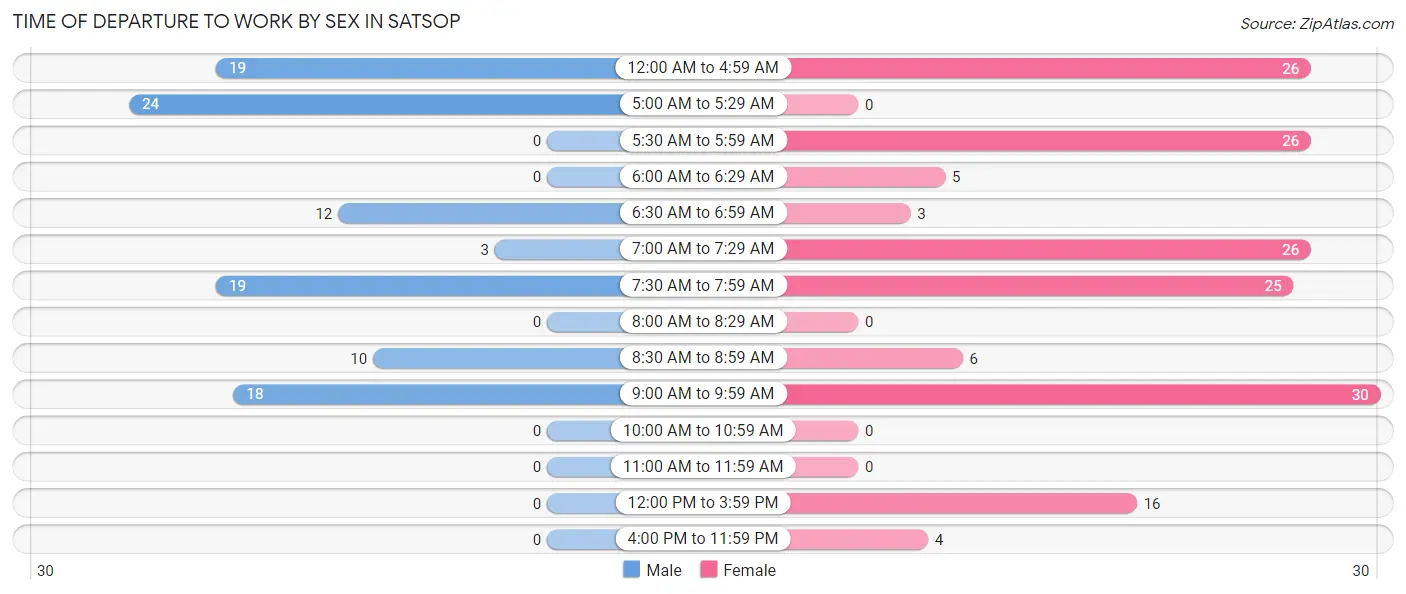
| Time of Departure | Male | Female |
| 12:00 AM to 4:59 AM | 19 (18.1%) | 26 (15.6%) |
| 5:00 AM to 5:29 AM | 24 (22.9%) | 0 (0.0%) |
| 5:30 AM to 5:59 AM | 0 (0.0%) | 26 (15.6%) |
| 6:00 AM to 6:29 AM | 0 (0.0%) | 5 (3.0%) |
| 6:30 AM to 6:59 AM | 12 (11.4%) | 3 (1.8%) |
| 7:00 AM to 7:29 AM | 3 (2.9%) | 26 (15.6%) |
| 7:30 AM to 7:59 AM | 19 (18.1%) | 25 (15.0%) |
| 8:00 AM to 8:29 AM | 0 (0.0%) | 0 (0.0%) |
| 8:30 AM to 8:59 AM | 10 (9.5%) | 6 (3.6%) |
| 9:00 AM to 9:59 AM | 18 (17.1%) | 30 (18.0%) |
| 10:00 AM to 10:59 AM | 0 (0.0%) | 0 (0.0%) |
| 11:00 AM to 11:59 AM | 0 (0.0%) | 0 (0.0%) |
| 12:00 PM to 3:59 PM | 0 (0.0%) | 16 (9.6%) |
| 4:00 PM to 11:59 PM | 0 (0.0%) | 4 (2.4%) |
| Total | 105 (100.0%) | 167 (100.0%) |
Housing Occupancy in Satsop
Occupancy by Ownership in Satsop
Of the total 254 dwellings in Satsop, owner-occupied units account for 217 (85.4%), while renter-occupied units make up 37 (14.6%).
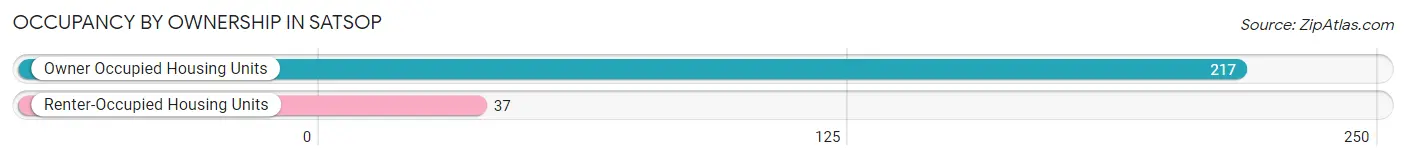
| Occupancy | # Housing Units | % Housing Units |
| Owner Occupied Housing Units | 217 | 85.4% |
| Renter-Occupied Housing Units | 37 | 14.6% |
| Total Occupied Housing Units | 254 | 100.0% |
Occupancy by Household Size in Satsop
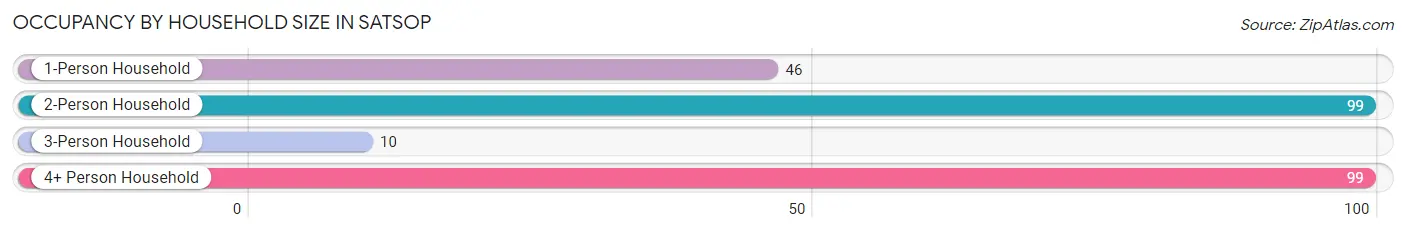
| Household Size | # Housing Units | % Housing Units |
| 1-Person Household | 46 | 18.1% |
| 2-Person Household | 99 | 39.0% |
| 3-Person Household | 10 | 3.9% |
| 4+ Person Household | 99 | 39.0% |
| Total Housing Units | 254 | 100.0% |
Occupancy by Ownership by Household Size in Satsop
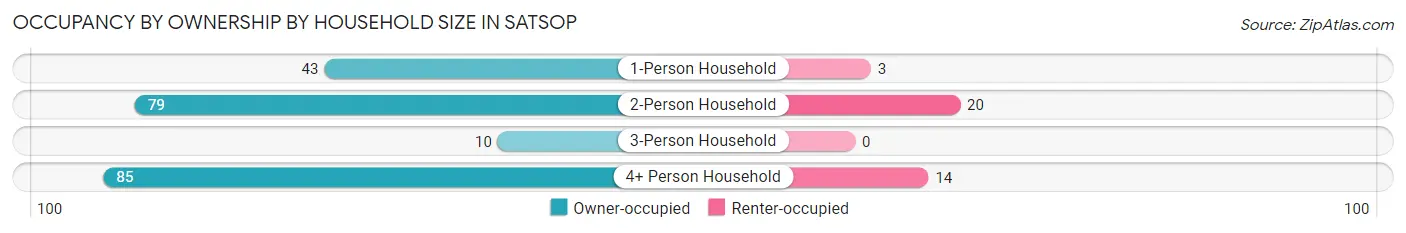
| Household Size | Owner-occupied | Renter-occupied |
| 1-Person Household | 43 (93.5%) | 3 (6.5%) |
| 2-Person Household | 79 (79.8%) | 20 (20.2%) |
| 3-Person Household | 10 (100.0%) | 0 (0.0%) |
| 4+ Person Household | 85 (85.9%) | 14 (14.1%) |
| Total Housing Units | 217 (85.4%) | 37 (14.6%) |
Occupancy by Educational Attainment in Satsop
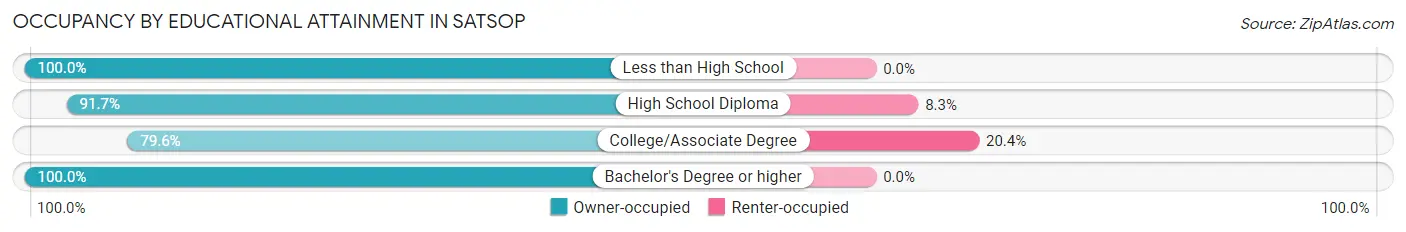
| Household Size | Owner-occupied | Renter-occupied |
| Less than High School | 20 (100.0%) | 0 (0.0%) |
| High School Diploma | 66 (91.7%) | 6 (8.3%) |
| College/Associate Degree | 121 (79.6%) | 31 (20.4%) |
| Bachelor's Degree or higher | 10 (100.0%) | 0 (0.0%) |
Occupancy by Age of Householder in Satsop
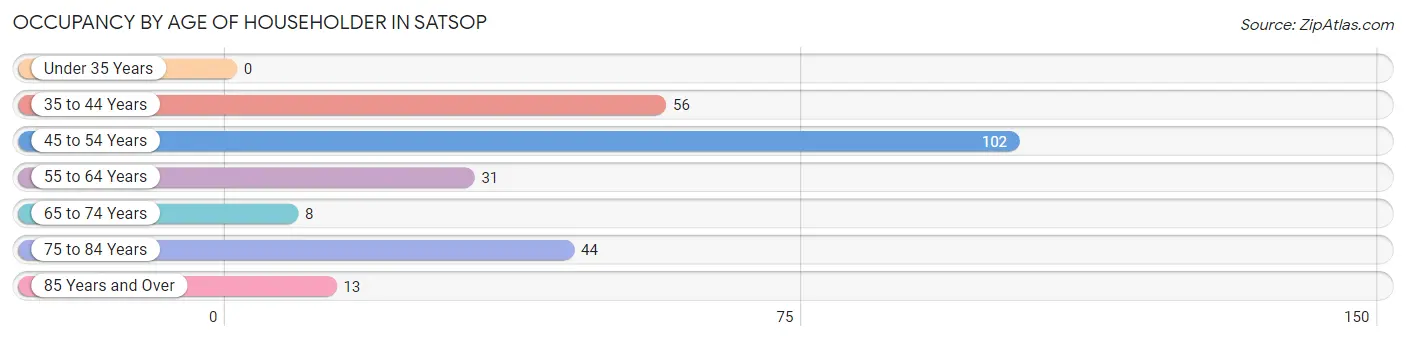
| Age Bracket | # Households | % Households |
| Under 35 Years | 0 | 0.0% |
| 35 to 44 Years | 56 | 22.1% |
| 45 to 54 Years | 102 | 40.2% |
| 55 to 64 Years | 31 | 12.2% |
| 65 to 74 Years | 8 | 3.2% |
| 75 to 84 Years | 44 | 17.3% |
| 85 Years and Over | 13 | 5.1% |
| Total | 254 | 100.0% |
Housing Finances in Satsop
Median Income by Occupancy in Satsop
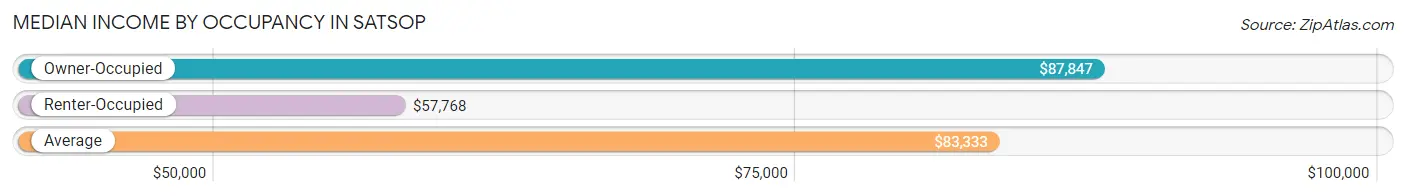
| Occupancy Type | # Households | Median Income |
| Owner-Occupied | 217 (85.4%) | $87,847 |
| Renter-Occupied | 37 (14.6%) | $57,768 |
| Average | 254 (100.0%) | $83,333 |
Occupancy by Householder Income Bracket in Satsop
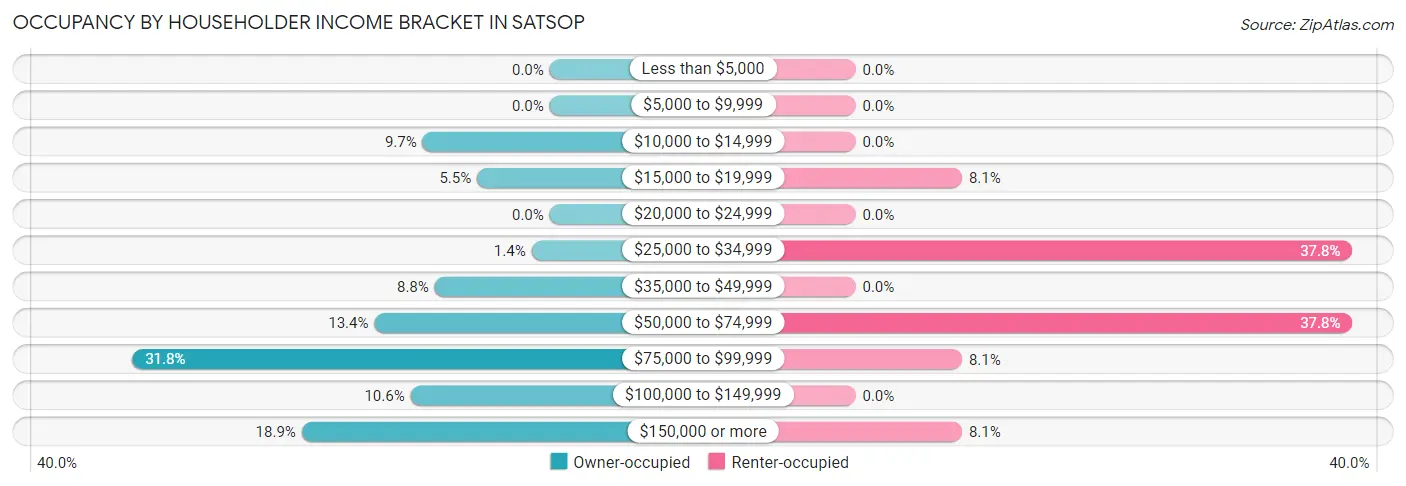
| Income Bracket | Owner-occupied | Renter-occupied |
| Less than $5,000 | 0 (0.0%) | 0 (0.0%) |
| $5,000 to $9,999 | 0 (0.0%) | 0 (0.0%) |
| $10,000 to $14,999 | 21 (9.7%) | 0 (0.0%) |
| $15,000 to $19,999 | 12 (5.5%) | 3 (8.1%) |
| $20,000 to $24,999 | 0 (0.0%) | 0 (0.0%) |
| $25,000 to $34,999 | 3 (1.4%) | 14 (37.8%) |
| $35,000 to $49,999 | 19 (8.8%) | 0 (0.0%) |
| $50,000 to $74,999 | 29 (13.4%) | 14 (37.8%) |
| $75,000 to $99,999 | 69 (31.8%) | 3 (8.1%) |
| $100,000 to $149,999 | 23 (10.6%) | 0 (0.0%) |
| $150,000 or more | 41 (18.9%) | 3 (8.1%) |
| Total | 217 (100.0%) | 37 (100.0%) |
Monthly Housing Cost Tiers in Satsop
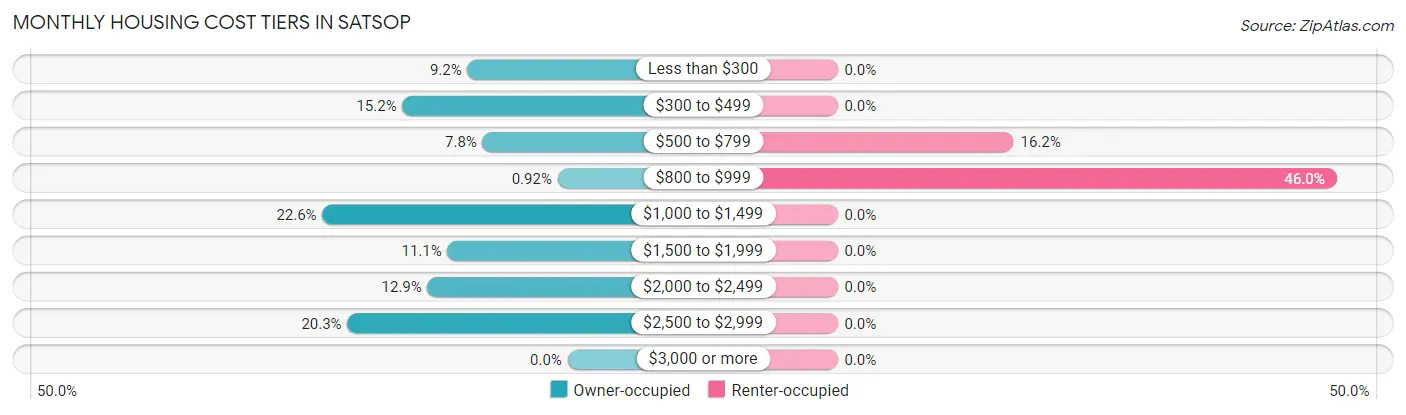
| Monthly Cost | Owner-occupied | Renter-occupied |
| Less than $300 | 20 (9.2%) | 0 (0.0%) |
| $300 to $499 | 33 (15.2%) | 0 (0.0%) |
| $500 to $799 | 17 (7.8%) | 6 (16.2%) |
| $800 to $999 | 2 (0.9%) | 17 (46.0%) |
| $1,000 to $1,499 | 49 (22.6%) | 0 (0.0%) |
| $1,500 to $1,999 | 24 (11.1%) | 0 (0.0%) |
| $2,000 to $2,499 | 28 (12.9%) | 0 (0.0%) |
| $2,500 to $2,999 | 44 (20.3%) | 0 (0.0%) |
| $3,000 or more | 0 (0.0%) | 0 (0.0%) |
| Total | 217 (100.0%) | 37 (100.0%) |
Physical Housing Characteristics in Satsop
Housing Structures in Satsop
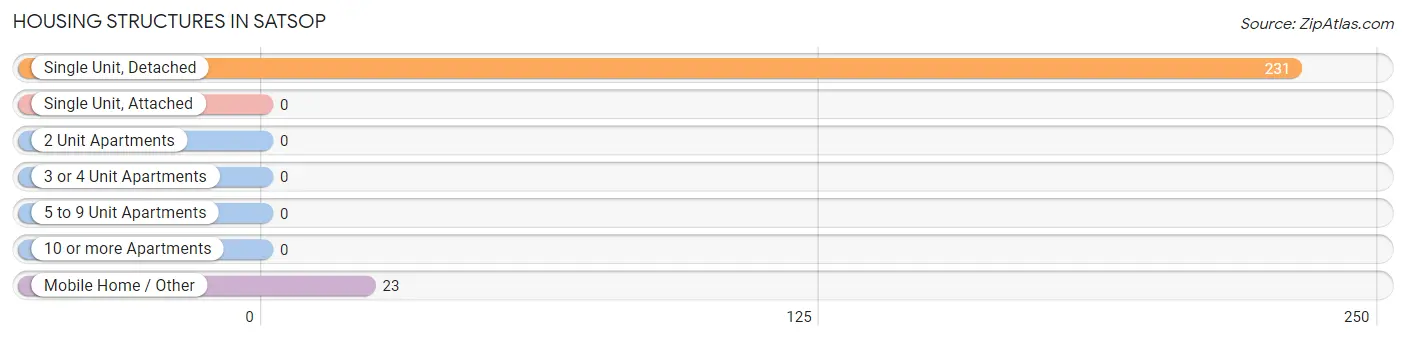
| Structure Type | # Housing Units | % Housing Units |
| Single Unit, Detached | 231 | 90.9% |
| Single Unit, Attached | 0 | 0.0% |
| 2 Unit Apartments | 0 | 0.0% |
| 3 or 4 Unit Apartments | 0 | 0.0% |
| 5 to 9 Unit Apartments | 0 | 0.0% |
| 10 or more Apartments | 0 | 0.0% |
| Mobile Home / Other | 23 | 9.1% |
| Total | 254 | 100.0% |
Housing Structures by Occupancy in Satsop
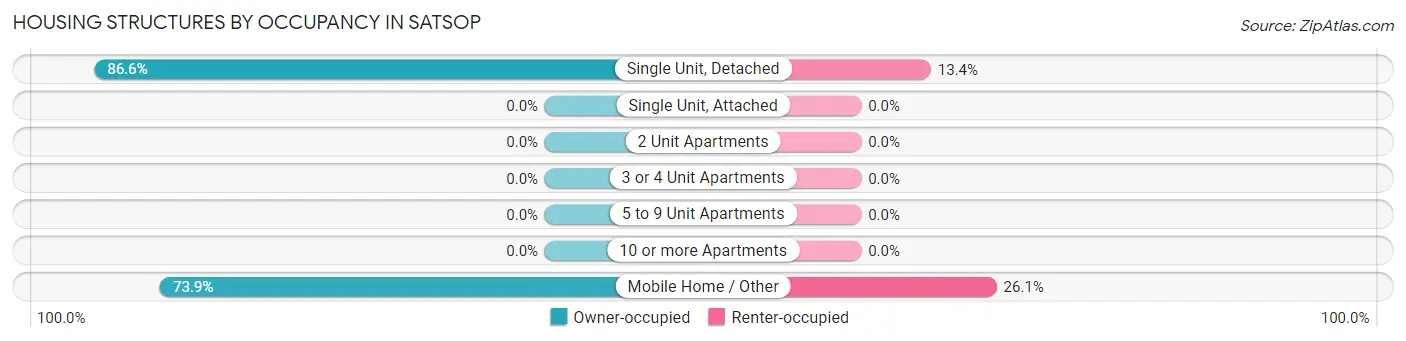
| Structure Type | Owner-occupied | Renter-occupied |
| Single Unit, Detached | 200 (86.6%) | 31 (13.4%) |
| Single Unit, Attached | 0 (0.0%) | 0 (0.0%) |
| 2 Unit Apartments | 0 (0.0%) | 0 (0.0%) |
| 3 or 4 Unit Apartments | 0 (0.0%) | 0 (0.0%) |
| 5 to 9 Unit Apartments | 0 (0.0%) | 0 (0.0%) |
| 10 or more Apartments | 0 (0.0%) | 0 (0.0%) |
| Mobile Home / Other | 17 (73.9%) | 6 (26.1%) |
| Total | 217 (85.4%) | 37 (14.6%) |
Housing Structures by Number of Rooms in Satsop
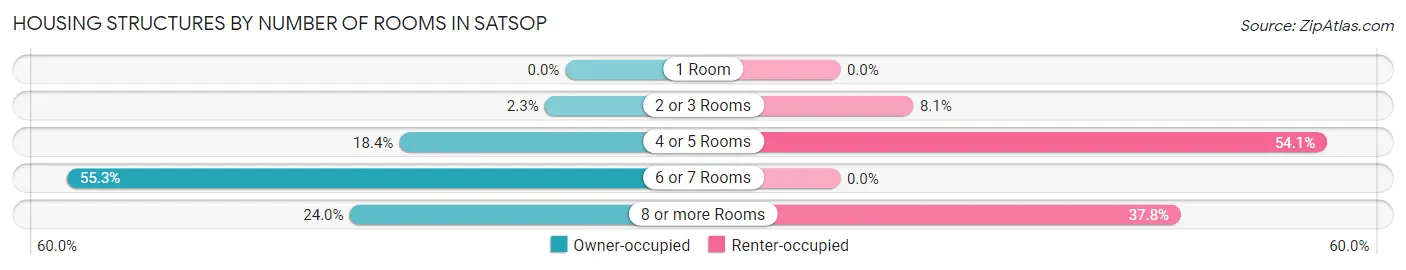
| Number of Rooms | Owner-occupied | Renter-occupied |
| 1 Room | 0 (0.0%) | 0 (0.0%) |
| 2 or 3 Rooms | 5 (2.3%) | 3 (8.1%) |
| 4 or 5 Rooms | 40 (18.4%) | 20 (54.0%) |
| 6 or 7 Rooms | 120 (55.3%) | 0 (0.0%) |
| 8 or more Rooms | 52 (24.0%) | 14 (37.8%) |
| Total | 217 (100.0%) | 37 (100.0%) |
Housing Structure by Heating Type in Satsop
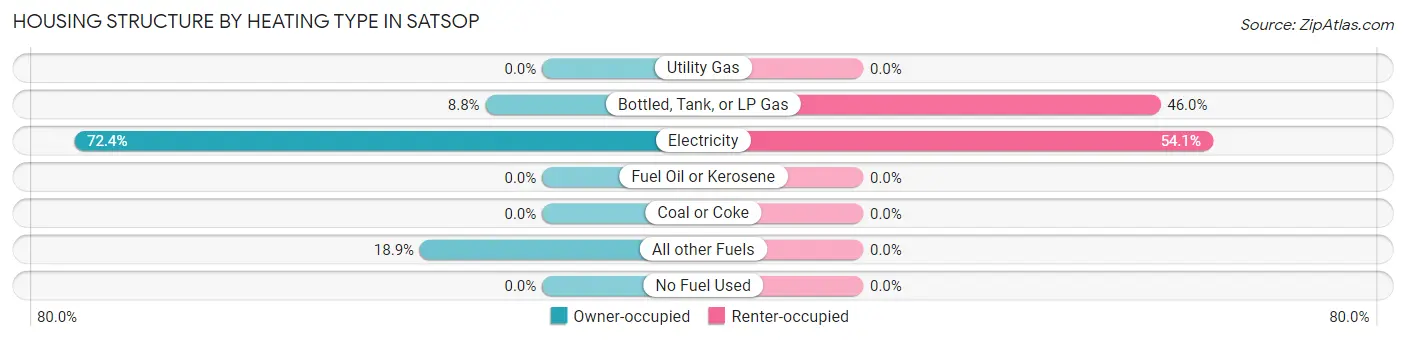
| Heating Type | Owner-occupied | Renter-occupied |
| Utility Gas | 0 (0.0%) | 0 (0.0%) |
| Bottled, Tank, or LP Gas | 19 (8.8%) | 17 (46.0%) |
| Electricity | 157 (72.4%) | 20 (54.0%) |
| Fuel Oil or Kerosene | 0 (0.0%) | 0 (0.0%) |
| Coal or Coke | 0 (0.0%) | 0 (0.0%) |
| All other Fuels | 41 (18.9%) | 0 (0.0%) |
| No Fuel Used | 0 (0.0%) | 0 (0.0%) |
| Total | 217 (100.0%) | 37 (100.0%) |
Household Vehicle Usage in Satsop
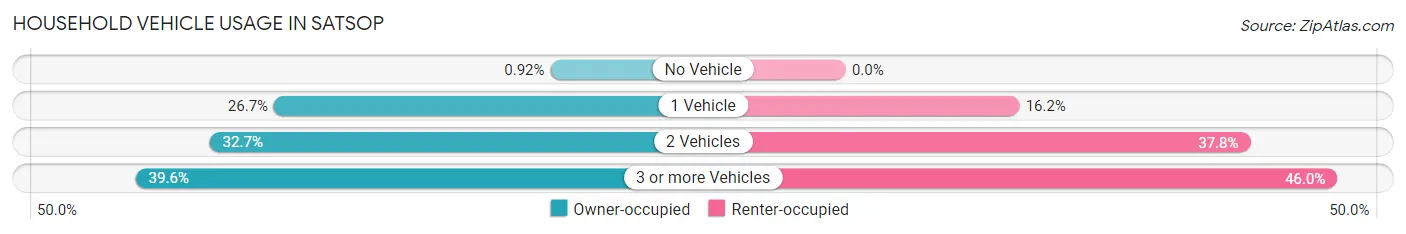
| Vehicles per Household | Owner-occupied | Renter-occupied |
| No Vehicle | 2 (0.9%) | 0 (0.0%) |
| 1 Vehicle | 58 (26.7%) | 6 (16.2%) |
| 2 Vehicles | 71 (32.7%) | 14 (37.8%) |
| 3 or more Vehicles | 86 (39.6%) | 17 (46.0%) |
| Total | 217 (100.0%) | 37 (100.0%) |
Real Estate & Mortgages in Satsop
Real Estate and Mortgage Overview in Satsop
| Characteristic | Without Mortgage | With Mortgage |
| Housing Units | 70 | 147 |
| Median Property Value | $198,800 | $380,100 |
| Median Household Income | $58,750 | $41 |
| Monthly Housing Costs | $438 | $0 |
| Real Estate Taxes | $1,652 | $0 |
Property Value by Mortgage Status in Satsop
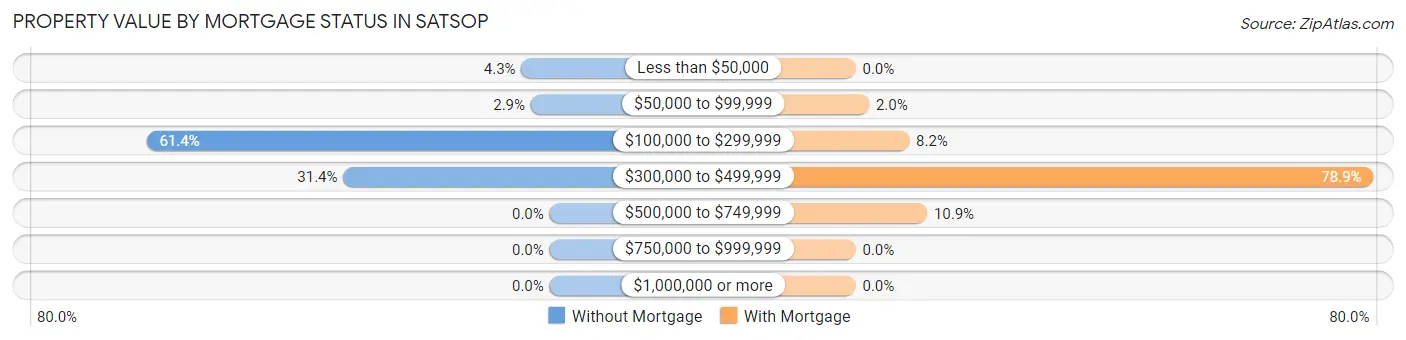
| Property Value | Without Mortgage | With Mortgage |
| Less than $50,000 | 3 (4.3%) | 0 (0.0%) |
| $50,000 to $99,999 | 2 (2.9%) | 3 (2.0%) |
| $100,000 to $299,999 | 43 (61.4%) | 12 (8.2%) |
| $300,000 to $499,999 | 22 (31.4%) | 116 (78.9%) |
| $500,000 to $749,999 | 0 (0.0%) | 16 (10.9%) |
| $750,000 to $999,999 | 0 (0.0%) | 0 (0.0%) |
| $1,000,000 or more | 0 (0.0%) | 0 (0.0%) |
| Total | 70 (100.0%) | 147 (100.0%) |
Household Income by Mortgage Status in Satsop
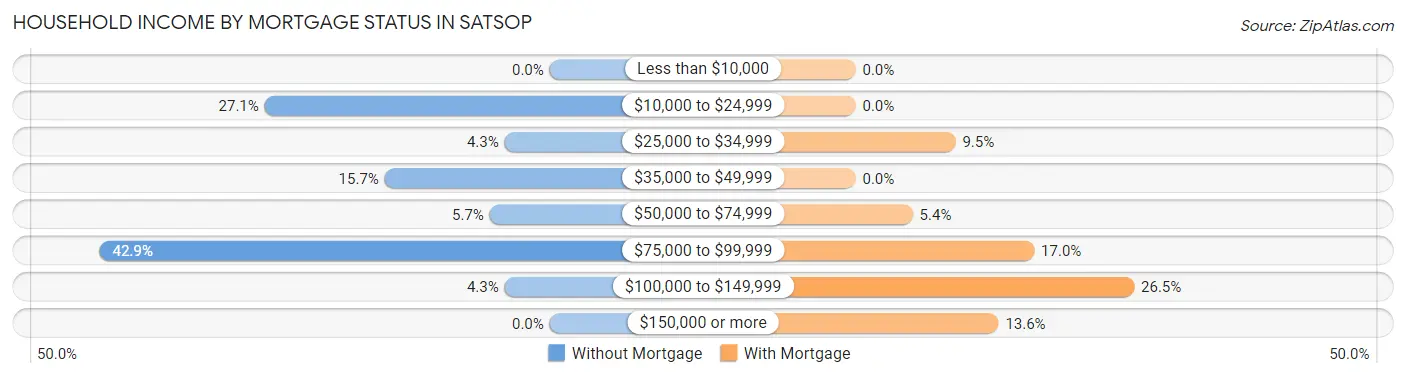
| Household Income | Without Mortgage | With Mortgage |
| Less than $10,000 | 0 (0.0%) | 0 (0.0%) |
| $10,000 to $24,999 | 19 (27.1%) | 0 (0.0%) |
| $25,000 to $34,999 | 3 (4.3%) | 14 (9.5%) |
| $35,000 to $49,999 | 11 (15.7%) | 0 (0.0%) |
| $50,000 to $74,999 | 4 (5.7%) | 8 (5.4%) |
| $75,000 to $99,999 | 30 (42.9%) | 25 (17.0%) |
| $100,000 to $149,999 | 3 (4.3%) | 39 (26.5%) |
| $150,000 or more | 0 (0.0%) | 20 (13.6%) |
| Total | 70 (100.0%) | 147 (100.0%) |
Property Value to Household Income Ratio in Satsop
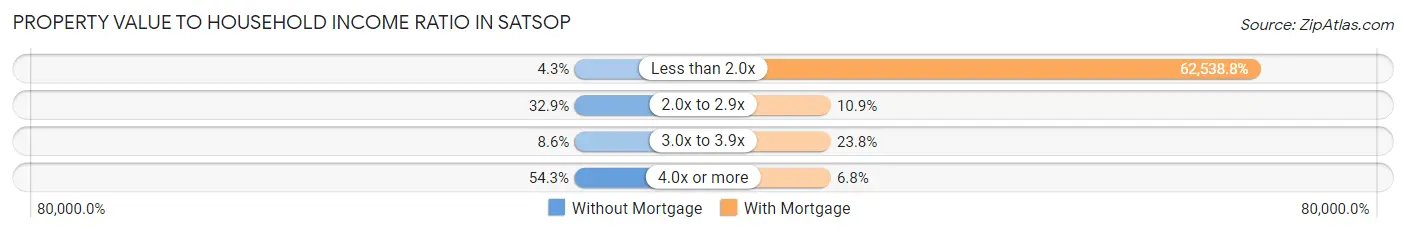
| Value-to-Income Ratio | Without Mortgage | With Mortgage |
| Less than 2.0x | 3 (4.3%) | 91,932 (62,538.8%) |
| 2.0x to 2.9x | 23 (32.9%) | 16 (10.9%) |
| 3.0x to 3.9x | 6 (8.6%) | 35 (23.8%) |
| 4.0x or more | 38 (54.3%) | 10 (6.8%) |
| Total | 70 (100.0%) | 147 (100.0%) |
Real Estate Taxes by Mortgage Status in Satsop
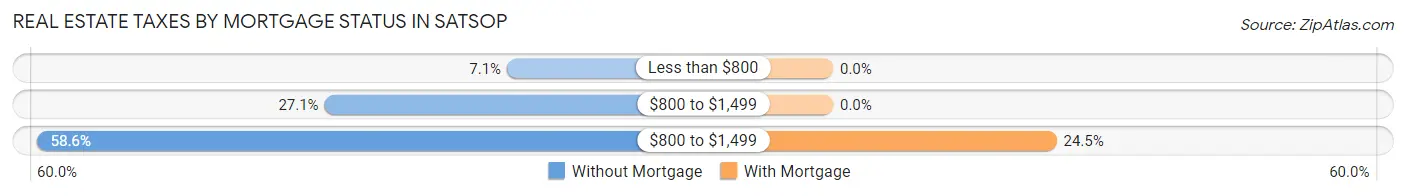
| Property Taxes | Without Mortgage | With Mortgage |
| Less than $800 | 5 (7.1%) | 0 (0.0%) |
| $800 to $1,499 | 19 (27.1%) | 0 (0.0%) |
| $800 to $1,499 | 41 (58.6%) | 36 (24.5%) |
| Total | 70 (100.0%) | 147 (100.0%) |
Health & Disability in Satsop
Health Insurance Coverage by Age in Satsop
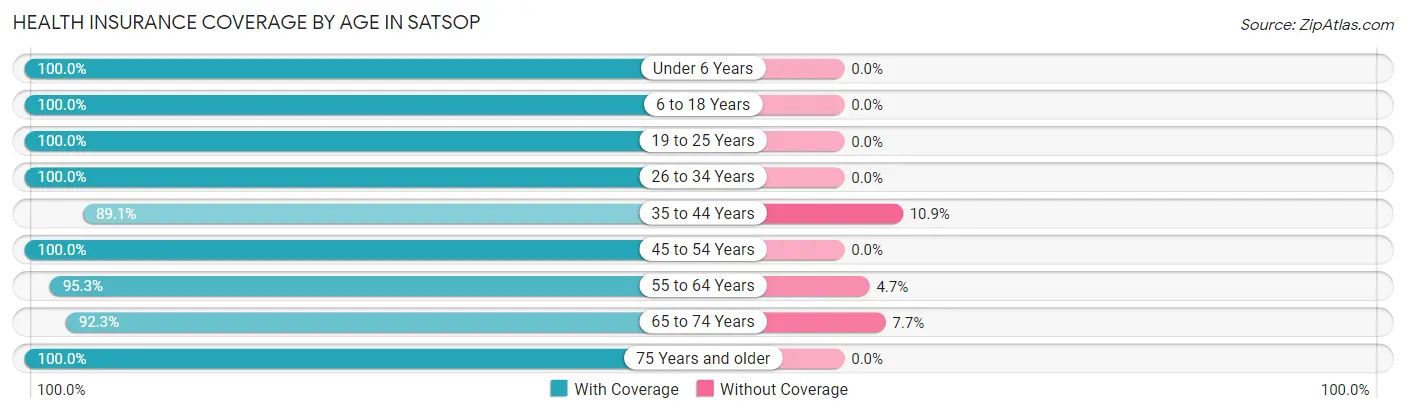
| Age Bracket | With Coverage | Without Coverage |
| Under 6 Years | 28 (100.0%) | 0 (0.0%) |
| 6 to 18 Years | 195 (100.0%) | 0 (0.0%) |
| 19 to 25 Years | 59 (100.0%) | 0 (0.0%) |
| 26 to 34 Years | 46 (100.0%) | 0 (0.0%) |
| 35 to 44 Years | 90 (89.1%) | 11 (10.9%) |
| 45 to 54 Years | 140 (100.0%) | 0 (0.0%) |
| 55 to 64 Years | 61 (95.3%) | 3 (4.7%) |
| 65 to 74 Years | 36 (92.3%) | 3 (7.7%) |
| 75 Years and older | 96 (100.0%) | 0 (0.0%) |
| Total | 751 (97.8%) | 17 (2.2%) |
Health Insurance Coverage by Citizenship Status in Satsop
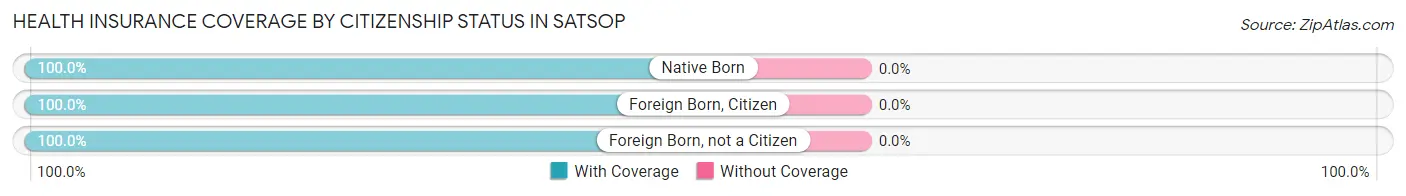
| Citizenship Status | With Coverage | Without Coverage |
| Native Born | 28 (100.0%) | 0 (0.0%) |
| Foreign Born, Citizen | 195 (100.0%) | 0 (0.0%) |
| Foreign Born, not a Citizen | 59 (100.0%) | 0 (0.0%) |
Health Insurance Coverage by Household Income in Satsop
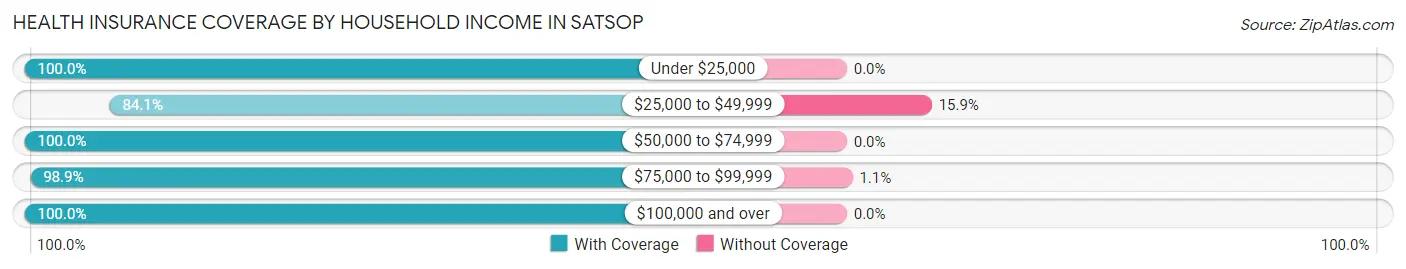
| Household Income | With Coverage | Without Coverage |
| Under $25,000 | 62 (100.0%) | 0 (0.0%) |
| $25,000 to $49,999 | 74 (84.1%) | 14 (15.9%) |
| $50,000 to $74,999 | 70 (100.0%) | 0 (0.0%) |
| $75,000 to $99,999 | 280 (98.9%) | 3 (1.1%) |
| $100,000 and over | 265 (100.0%) | 0 (0.0%) |
Public vs Private Health Insurance Coverage by Age in Satsop
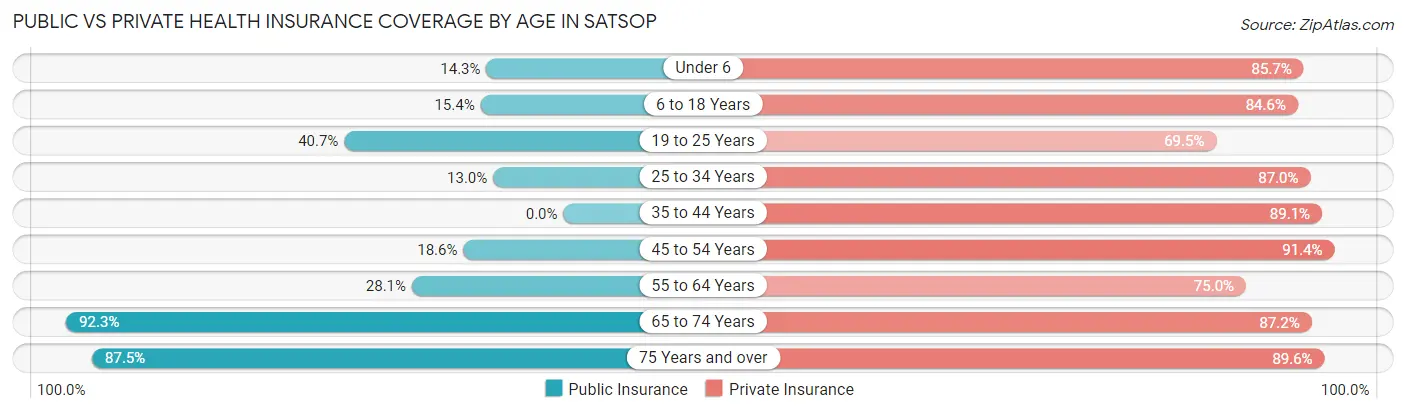
| Age Bracket | Public Insurance | Private Insurance |
| Under 6 | 4 (14.3%) | 24 (85.7%) |
| 6 to 18 Years | 30 (15.4%) | 165 (84.6%) |
| 19 to 25 Years | 24 (40.7%) | 41 (69.5%) |
| 25 to 34 Years | 6 (13.0%) | 40 (87.0%) |
| 35 to 44 Years | 0 (0.0%) | 90 (89.1%) |
| 45 to 54 Years | 26 (18.6%) | 128 (91.4%) |
| 55 to 64 Years | 18 (28.1%) | 48 (75.0%) |
| 65 to 74 Years | 36 (92.3%) | 34 (87.2%) |
| 75 Years and over | 84 (87.5%) | 86 (89.6%) |
| Total | 228 (29.7%) | 656 (85.4%) |
Disability Status by Sex by Age in Satsop
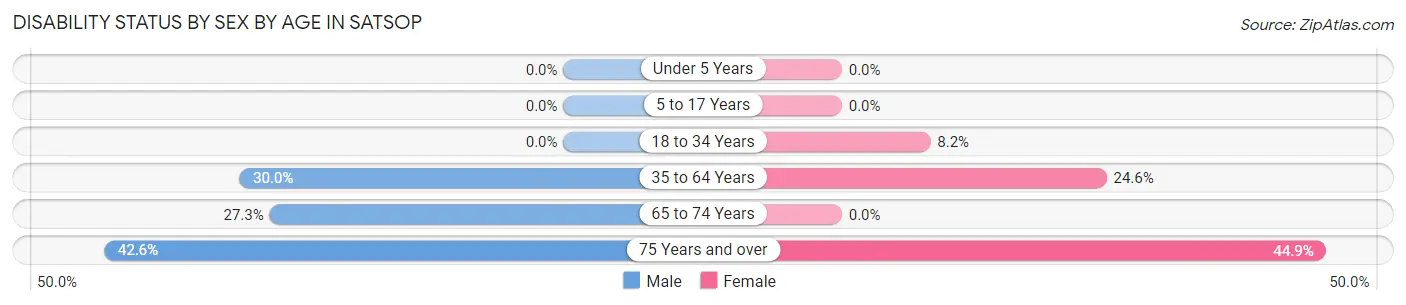
| Age Bracket | Male | Female |
| Under 5 Years | 0 (0.0%) | 0 (0.0%) |
| 5 to 17 Years | 0 (0.0%) | 0 (0.0%) |
| 18 to 34 Years | 0 (0.0%) | 6 (8.2%) |
| 35 to 64 Years | 39 (30.0%) | 43 (24.6%) |
| 65 to 74 Years | 6 (27.3%) | 0 (0.0%) |
| 75 Years and over | 20 (42.5%) | 22 (44.9%) |
Disability Class by Sex by Age in Satsop
Disability Class: Hearing Difficulty
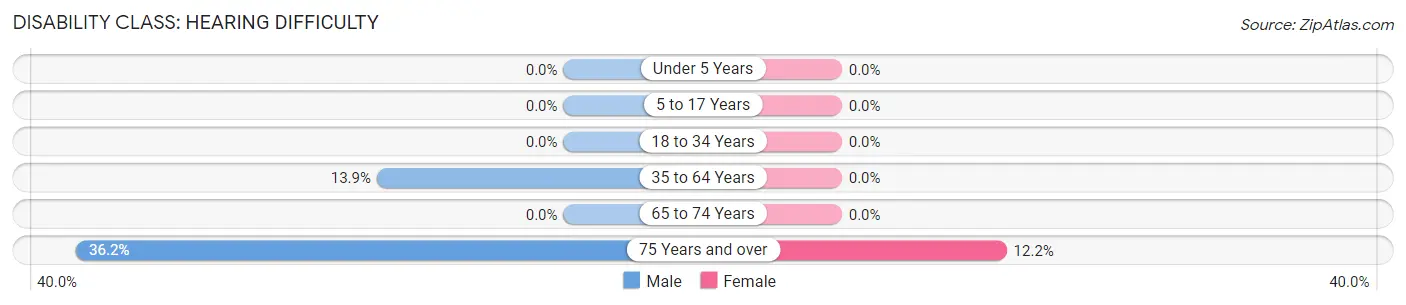
| Age Bracket | Male | Female |
| Under 5 Years | 0 (0.0%) | 0 (0.0%) |
| 5 to 17 Years | 0 (0.0%) | 0 (0.0%) |
| 18 to 34 Years | 0 (0.0%) | 0 (0.0%) |
| 35 to 64 Years | 18 (13.9%) | 0 (0.0%) |
| 65 to 74 Years | 0 (0.0%) | 0 (0.0%) |
| 75 Years and over | 17 (36.2%) | 6 (12.2%) |
Disability Class: Vision Difficulty
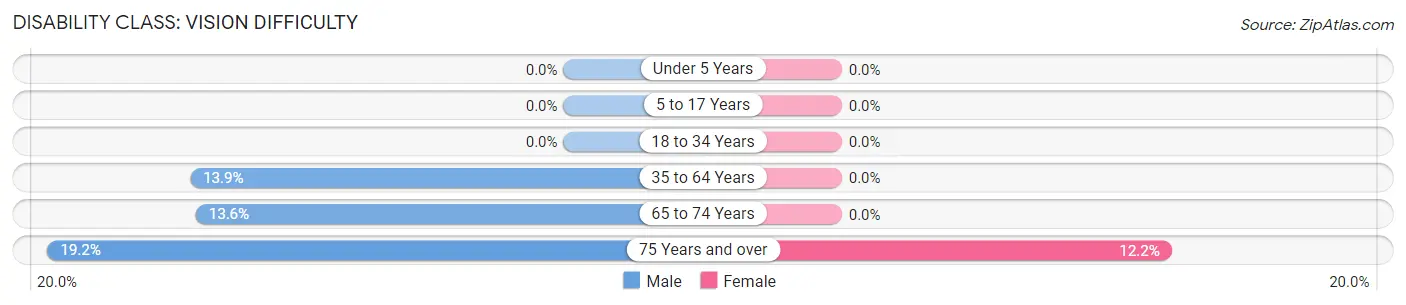
| Age Bracket | Male | Female |
| Under 5 Years | 0 (0.0%) | 0 (0.0%) |
| 5 to 17 Years | 0 (0.0%) | 0 (0.0%) |
| 18 to 34 Years | 0 (0.0%) | 0 (0.0%) |
| 35 to 64 Years | 18 (13.9%) | 0 (0.0%) |
| 65 to 74 Years | 3 (13.6%) | 0 (0.0%) |
| 75 Years and over | 9 (19.2%) | 6 (12.2%) |
Disability Class: Cognitive Difficulty
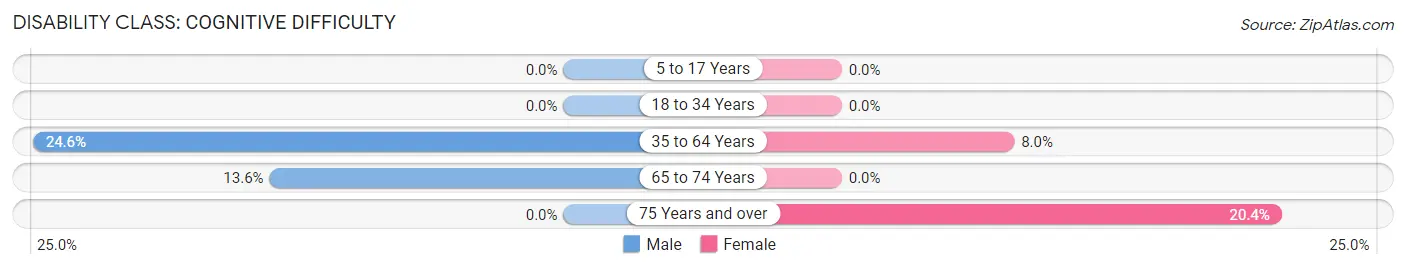
| Age Bracket | Male | Female |
| 5 to 17 Years | 0 (0.0%) | 0 (0.0%) |
| 18 to 34 Years | 0 (0.0%) | 0 (0.0%) |
| 35 to 64 Years | 32 (24.6%) | 14 (8.0%) |
| 65 to 74 Years | 3 (13.6%) | 0 (0.0%) |
| 75 Years and over | 0 (0.0%) | 10 (20.4%) |
Disability Class: Ambulatory Difficulty
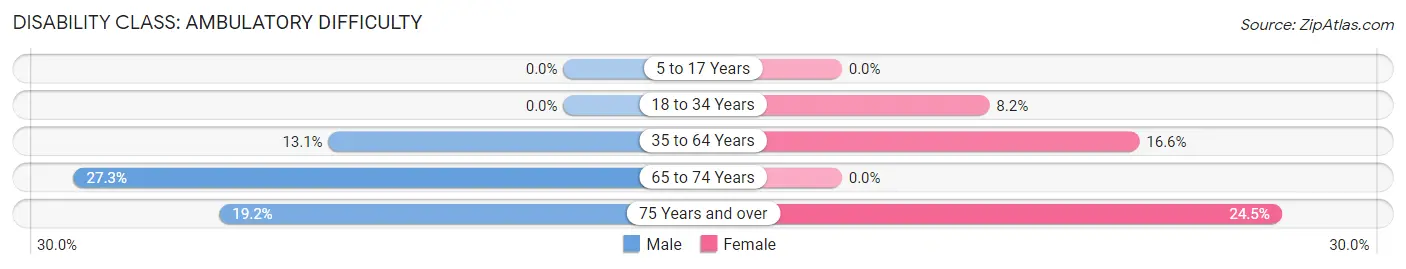
| Age Bracket | Male | Female |
| 5 to 17 Years | 0 (0.0%) | 0 (0.0%) |
| 18 to 34 Years | 0 (0.0%) | 6 (8.2%) |
| 35 to 64 Years | 17 (13.1%) | 29 (16.6%) |
| 65 to 74 Years | 6 (27.3%) | 0 (0.0%) |
| 75 Years and over | 9 (19.2%) | 12 (24.5%) |
Disability Class: Self-Care Difficulty
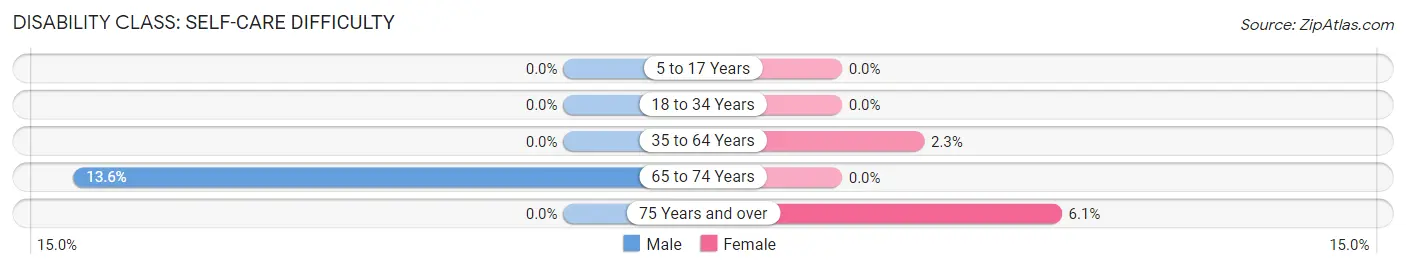
| Age Bracket | Male | Female |
| 5 to 17 Years | 0 (0.0%) | 0 (0.0%) |
| 18 to 34 Years | 0 (0.0%) | 0 (0.0%) |
| 35 to 64 Years | 0 (0.0%) | 4 (2.3%) |
| 65 to 74 Years | 3 (13.6%) | 0 (0.0%) |
| 75 Years and over | 0 (0.0%) | 3 (6.1%) |
Technology Access in Satsop
Computing Device Access in Satsop
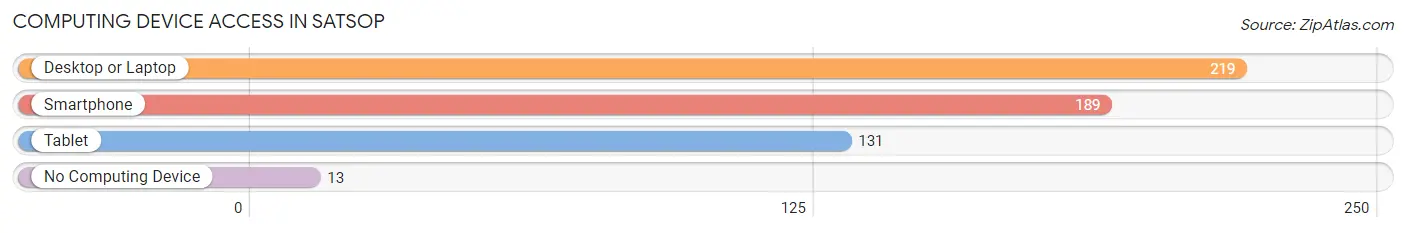
| Device Type | # Households | % Households |
| Desktop or Laptop | 219 | 86.2% |
| Smartphone | 189 | 74.4% |
| Tablet | 131 | 51.6% |
| No Computing Device | 13 | 5.1% |
| Total | 254 | 100.0% |
Internet Access in Satsop
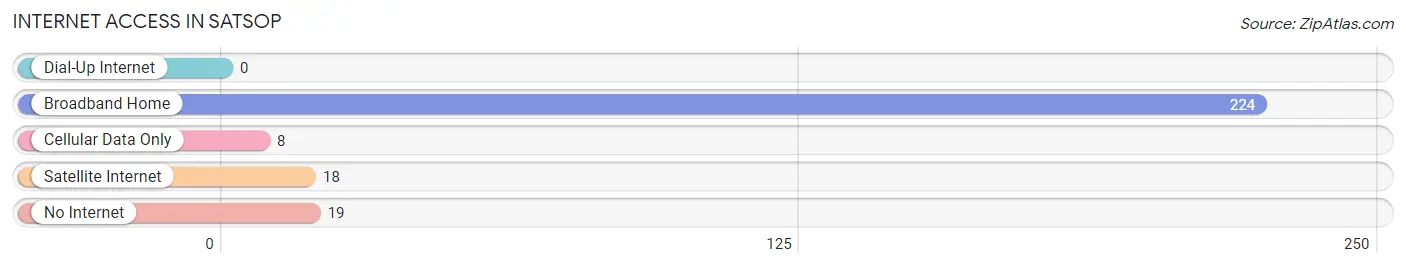
| Internet Type | # Households | % Households |
| Dial-Up Internet | 0 | 0.0% |
| Broadband Home | 224 | 88.2% |
| Cellular Data Only | 8 | 3.2% |
| Satellite Internet | 18 | 7.1% |
| No Internet | 19 | 7.5% |
| Total | 254 | 100.0% |
Satsop Summary
Satsop, Washington is a small unincorporated community located in Grays Harbor County, Washington. It is situated on the Satsop River, approximately 10 miles east of Elma and 25 miles west of Olympia. The population of Satsop was estimated to be around 1,000 in 2020.
History
Satsop was first settled in the late 1800s by a group of Scandinavian immigrants. The town was originally called Satsop Station, and was a stop on the Northern Pacific Railroad. The name Satsop is derived from the Chinook Jargon word “satsop”, which means “place of plenty”.
In the early 1900s, the town was a thriving logging and fishing community. The Satsop River was a major source of salmon and steelhead for the local fishermen. The town also had a sawmill, a general store, a post office, and a school.
In the 1950s, the town began to decline as the logging industry moved away from the area. The sawmill closed and the post office was shut down. The population of Satsop dwindled to just a few hundred people.
In the 1970s, the town was revitalized when the Satsop Nuclear Power Plant was built nearby. The plant provided jobs and economic stability to the area. The population of Satsop began to grow again, and the town was incorporated in 1979.
Geography
Satsop is located in Grays Harbor County, Washington. It is situated on the Satsop River, approximately 10 miles east of Elma and 25 miles west of Olympia. The town is surrounded by lush forests and rolling hills.
The climate in Satsop is mild and temperate. Summers are warm and dry, while winters are cool and wet. The average annual temperature is around 50 degrees Fahrenheit.
Economy
The economy of Satsop is largely based on the timber industry. The town is home to several sawmills and lumber companies. The Satsop Nuclear Power Plant is also a major employer in the area.
In addition to the timber and nuclear industries, Satsop is home to several small businesses. These include restaurants, retail stores, and other services.
Demographics
As of 2020, the population of Satsop was estimated to be around 1,000 people. The racial makeup of the town is predominantly white (90.2%), with small percentages of African American (2.2%), Native American (1.2%), Asian (1.2%), and other races (5.2%).
The median household income in Satsop is $45,000, and the median home value is $150,000. The town has a high rate of homeownership (80%), and the unemployment rate is low (3.2%).
Conclusion
Satsop, Washington is a small unincorporated community located in Grays Harbor County. It is situated on the Satsop River, approximately 10 miles east of Elma and 25 miles west of Olympia. The population of Satsop was estimated to be around 1,000 in 2020. The town’s economy is largely based on the timber and nuclear industries, and it is home to several small businesses. The racial makeup of the town is predominantly white, and the median household income is $45,000. Satsop is a pleasant and peaceful place to live, and it offers its residents a unique and rural lifestyle.
Common Questions
What is Per Capita Income in Satsop?
Per Capita income in Satsop is $31,639.
What is the Median Family Income in Satsop?
Median Family Income in Satsop is $87,639.
What is the Median Household income in Satsop?
Median Household Income in Satsop is $83,333.
What is Income or Wage Gap in Satsop?
Income or Wage Gap in Satsop is 60.7%.
Women in Satsop earn 39.3 cents for every dollar earned by a man.
What is Family Income Deficit in Satsop?
Family Income Deficit in Satsop is $2,128.
Families that are below poverty line in Satsop earn $2,128 less on average than the poverty threshold level.
What is Inequality or Gini Index in Satsop?
Inequality or Gini Index in Satsop is 0.43.
What is the Total Population of Satsop?
Total Population of Satsop is 768.
What is the Total Male Population of Satsop?
Total Male Population of Satsop is 369.
What is the Total Female Population of Satsop?
Total Female Population of Satsop is 399.
What is the Ratio of Males per 100 Females in Satsop?
There are 92.48 Males per 100 Females in Satsop.
What is the Ratio of Females per 100 Males in Satsop?
There are 108.13 Females per 100 Males in Satsop.
What is the Median Population Age in Satsop?
Median Population Age in Satsop is 39.7 Years.
What is the Average Family Size in Satsop
Average Family Size in Satsop is 3.5 People.
What is the Average Household Size in Satsop
Average Household Size in Satsop is 3.0 People.
How Large is the Labor Force in Satsop?
There are 312 People in the Labor Forcein in Satsop.
What is the Percentage of People in the Labor Force in Satsop?
53.0% of People are in the Labor Force in Satsop.
What is the Unemployment Rate in Satsop?
Unemployment Rate in Satsop is 5.8%.