Burley, WA Map & Demographics
Burley Map
Burley Overview
$37,101
PER CAPITA INCOME
$113,333
AVG FAMILY INCOME
$94,222
AVG HOUSEHOLD INCOME
59.4%
WAGE / INCOME GAP [ % ]
40.6¢/ $1
WAGE / INCOME GAP [ $ ]
0.42
INEQUALITY / GINI INDEX
2,808
TOTAL POPULATION
1,289
MALE POPULATION
1,519
FEMALE POPULATION
84.86
MALES / 100 FEMALES
117.84
FEMALES / 100 MALES
38.8
MEDIAN AGE
3.6
AVG FAMILY SIZE
3.2
AVG HOUSEHOLD SIZE
1,108
LABOR FORCE [ PEOPLE ]
50.8%
PERCENT IN LABOR FORCE
Income in Burley
Income Overview in Burley
Per Capita Income in Burley is $37,101, while median incomes of families and households are $113,333 and $94,222 respectively.
| Characteristic | Number | Measure |
| Per Capita Income | 2,808 | $37,101 |
| Median Family Income | 714 | $113,333 |
| Mean Family Income | 714 | $122,120 |
| Median Household Income | 880 | $94,222 |
| Mean Household Income | 880 | $111,545 |
| Income Deficit | 714 | $0 |
| Wage / Income Gap (%) | 2,808 | 59.43% |
| Wage / Income Gap ($) | 2,808 | 40.57¢ per $1 |
| Gini / Inequality Index | 2,808 | 0.42 |
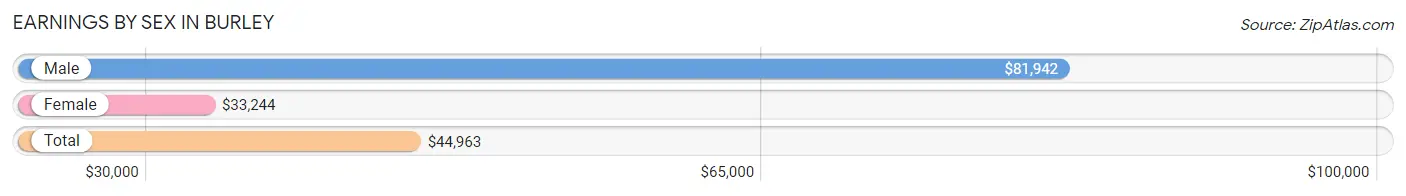
Earnings by Sex in Burley
Average Earnings in Burley are $44,963, $81,942 for men and $33,244 for women, a difference of 59.4%.
| Sex | Number | Average Earnings |
| Male | 727 (59.5%) | $81,942 |
| Female | 494 (40.5%) | $33,244 |
| Total | 1,221 (100.0%) | $44,963 |
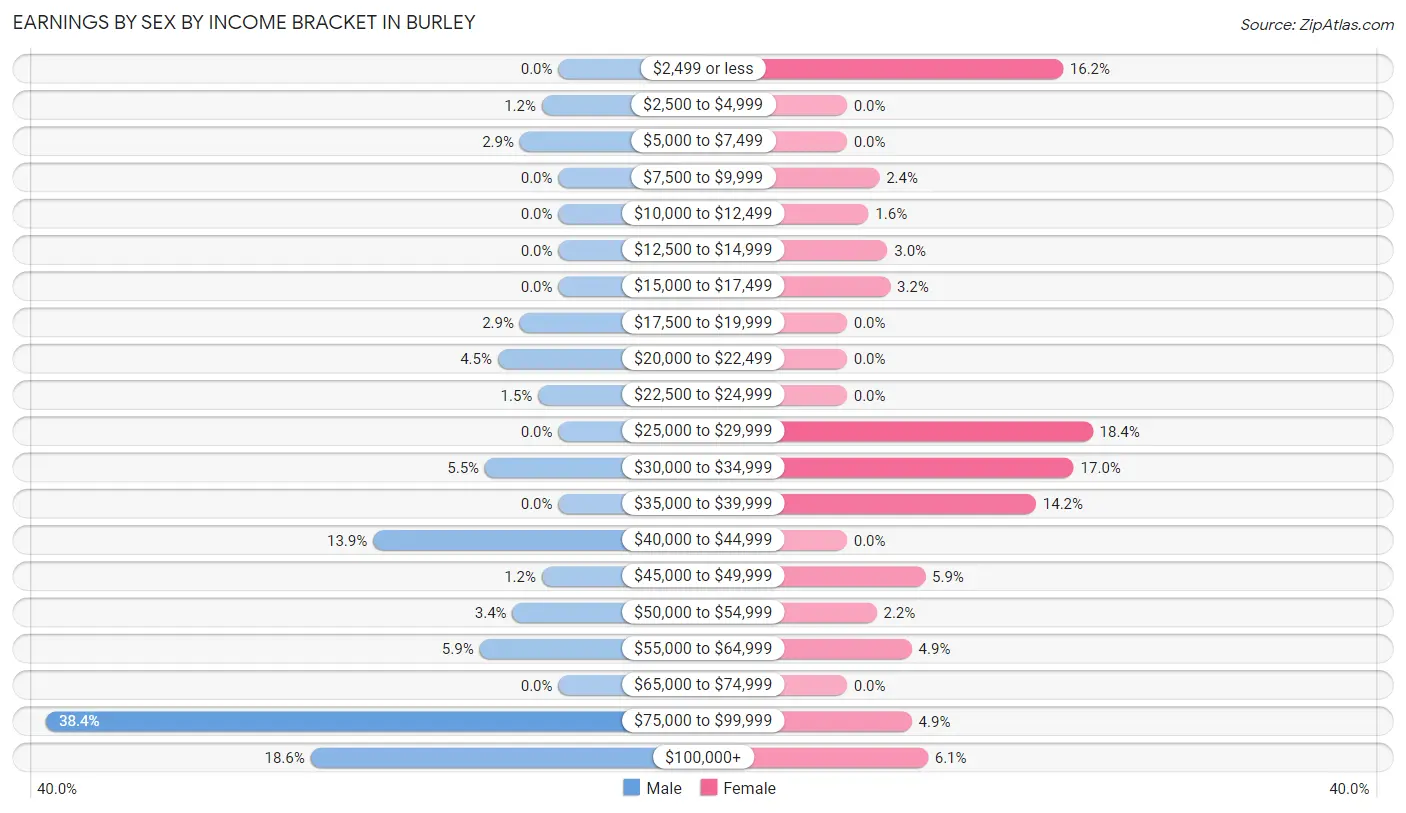
Earnings by Sex by Income Bracket in Burley
The most common earnings brackets in Burley are $75,000 to $99,999 for men (279 | 38.4%) and $25,000 to $29,999 for women (91 | 18.4%).
| Income | Male | Female |
| $2,499 or less | 0 (0.0%) | 80 (16.2%) |
| $2,500 to $4,999 | 9 (1.2%) | 0 (0.0%) |
| $5,000 to $7,499 | 21 (2.9%) | 0 (0.0%) |
| $7,500 to $9,999 | 0 (0.0%) | 12 (2.4%) |
| $10,000 to $12,499 | 0 (0.0%) | 8 (1.6%) |
| $12,500 to $14,999 | 0 (0.0%) | 15 (3.0%) |
| $15,000 to $17,499 | 0 (0.0%) | 16 (3.2%) |
| $17,500 to $19,999 | 21 (2.9%) | 0 (0.0%) |
| $20,000 to $22,499 | 33 (4.5%) | 0 (0.0%) |
| $22,500 to $24,999 | 11 (1.5%) | 0 (0.0%) |
| $25,000 to $29,999 | 0 (0.0%) | 91 (18.4%) |
| $30,000 to $34,999 | 40 (5.5%) | 84 (17.0%) |
| $35,000 to $39,999 | 0 (0.0%) | 70 (14.2%) |
| $40,000 to $44,999 | 101 (13.9%) | 0 (0.0%) |
| $45,000 to $49,999 | 9 (1.2%) | 29 (5.9%) |
| $50,000 to $54,999 | 25 (3.4%) | 11 (2.2%) |
| $55,000 to $64,999 | 43 (5.9%) | 24 (4.9%) |
| $65,000 to $74,999 | 0 (0.0%) | 0 (0.0%) |
| $75,000 to $99,999 | 279 (38.4%) | 24 (4.9%) |
| $100,000+ | 135 (18.6%) | 30 (6.1%) |
| Total | 727 (100.0%) | 494 (100.0%) |
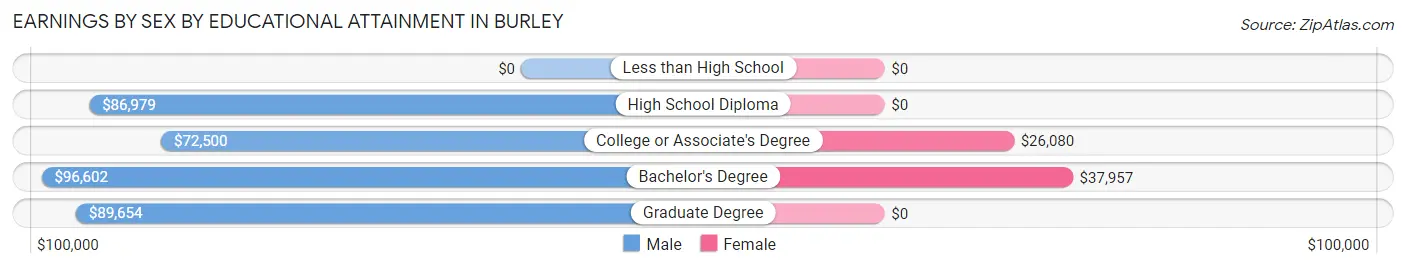
Earnings by Sex by Educational Attainment in Burley
Average earnings in Burley are $88,737 for men and $33,259 for women, a difference of 62.5%. Men with an educational attainment of bachelor's degree enjoy the highest average annual earnings of $96,602, while those with college or associate's degree education earn the least with $72,500. Women with an educational attainment of bachelor's degree earn the most with the average annual earnings of $37,957, while those with college or associate's degree education have the smallest earnings of $26,080.
| Educational Attainment | Male Income | Female Income |
| Less than High School | - | - |
| High School Diploma | $86,979 | $0 |
| College or Associate's Degree | $72,500 | $26,080 |
| Bachelor's Degree | $96,602 | $37,957 |
| Graduate Degree | $89,654 | $0 |
| Total | $88,737 | $33,259 |
Family Income in Burley
Family Income Brackets in Burley
According to the Burley family income data, there are 230 families falling into the $100,000 to $149,999 income range, which is the most common income bracket and makes up 32.2% of all families.
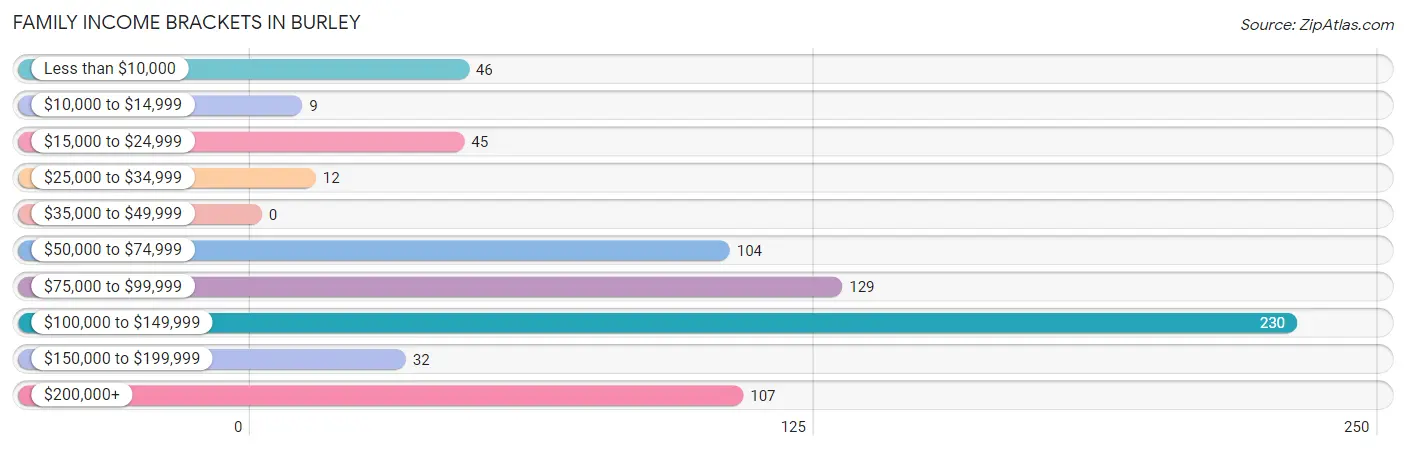
| Income Bracket | # Families | % Families |
| Less than $10,000 | 46 | 6.4% |
| $10,000 to $14,999 | 9 | 1.3% |
| $15,000 to $24,999 | 45 | 6.3% |
| $25,000 to $34,999 | 12 | 1.7% |
| $35,000 to $49,999 | 0 | 0.0% |
| $50,000 to $74,999 | 104 | 14.6% |
| $75,000 to $99,999 | 129 | 18.1% |
| $100,000 to $149,999 | 230 | 32.2% |
| $150,000 to $199,999 | 32 | 4.5% |
| $200,000+ | 107 | 15.0% |
Family Income by Famaliy Size in Burley
4-person families (47 | 6.6%) account for the highest median family income in Burley with $142,768 per family, while 2-person families (321 | 45.0%) have the highest median income of $57,153 per family member.
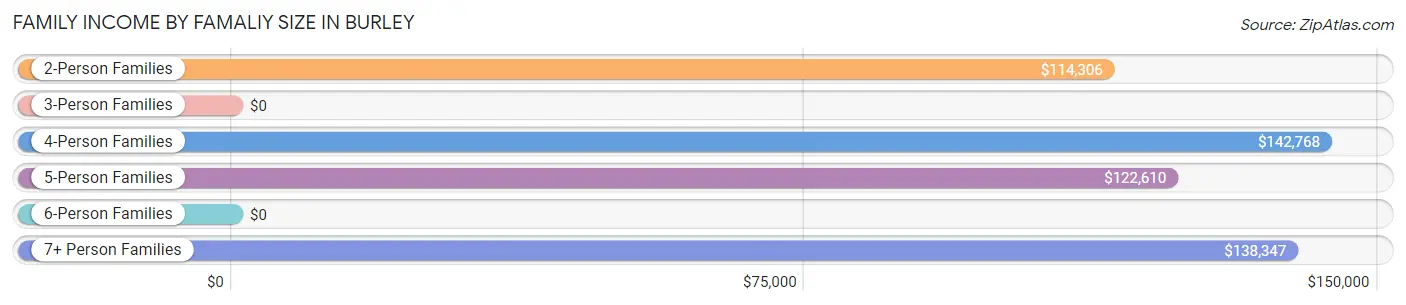
| Income Bracket | # Families | Median Income |
| 2-Person Families | 321 (45.0%) | $114,306 |
| 3-Person Families | 178 (24.9%) | $0 |
| 4-Person Families | 47 (6.6%) | $142,768 |
| 5-Person Families | 109 (15.3%) | $122,610 |
| 6-Person Families | 18 (2.5%) | $0 |
| 7+ Person Families | 41 (5.7%) | $138,347 |
| Total | 714 (100.0%) | $113,333 |
Family Income by Number of Earners in Burley
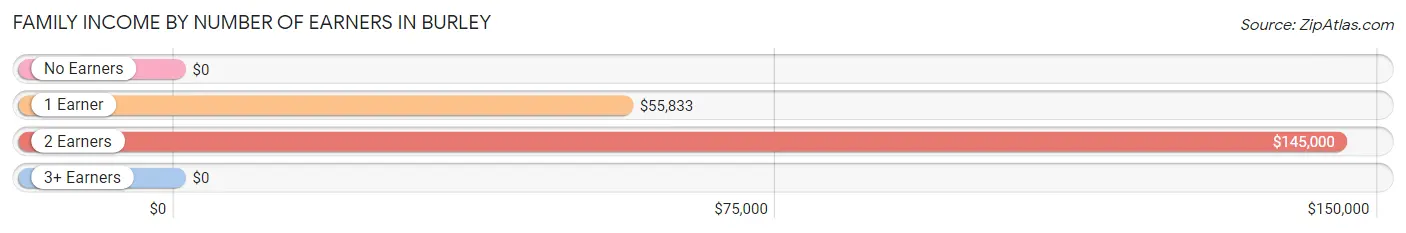
| Number of Earners | # Families | Median Income |
| No Earners | 101 (14.1%) | $0 |
| 1 Earner | 242 (33.9%) | $55,833 |
| 2 Earners | 360 (50.4%) | $145,000 |
| 3+ Earners | 11 (1.5%) | $0 |
| Total | 714 (100.0%) | $113,333 |
Household Income in Burley
Household Income Brackets in Burley
With 230 households falling in the category, the $100,000 to $149,999 income range is the most frequent in Burley, accounting for 26.1% of all households. In contrast, only 18 households (2.1%) fall into the $10,000 to $14,999 income bracket, making it the least populous group.
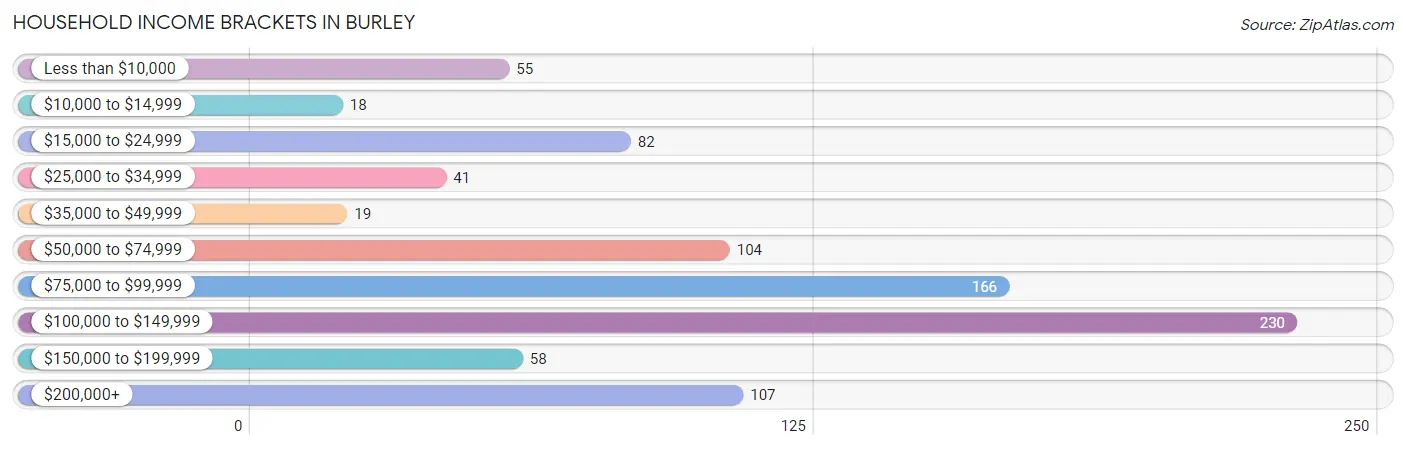
| Income Bracket | # Households | % Households |
| Less than $10,000 | 55 | 6.3% |
| $10,000 to $14,999 | 18 | 2.0% |
| $15,000 to $24,999 | 82 | 9.3% |
| $25,000 to $34,999 | 41 | 4.7% |
| $35,000 to $49,999 | 19 | 2.2% |
| $50,000 to $74,999 | 104 | 11.8% |
| $75,000 to $99,999 | 166 | 18.9% |
| $100,000 to $149,999 | 230 | 26.1% |
| $150,000 to $199,999 | 58 | 6.6% |
| $200,000+ | 107 | 12.2% |
Household Income by Householder Age in Burley
The median household income in Burley is $94,222, with the highest median household income of $145,301 found in the 45 to 64 years age bracket for the primary householder. A total of 372 households (42.3%) fall into this category. Meanwhile, the 15 to 24 years age bracket for the primary householder has the lowest median household income of $0, with 18 households (2.1%) in this group.
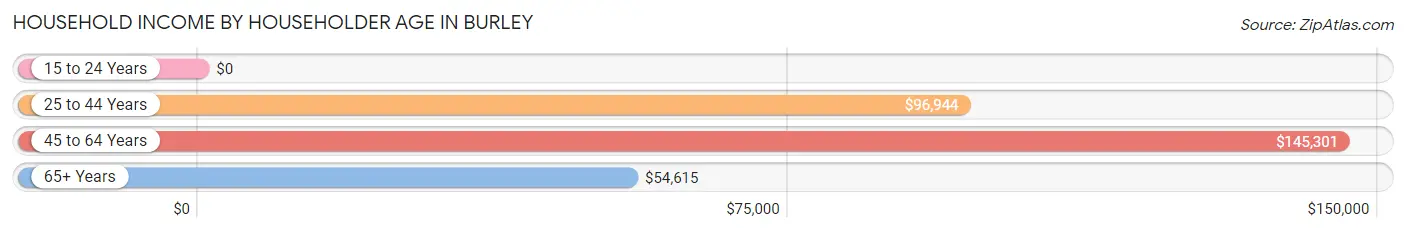
| Income Bracket | # Households | Median Income |
| 15 to 24 Years | 18 (2.1%) | $0 |
| 25 to 44 Years | 282 (32.1%) | $96,944 |
| 45 to 64 Years | 372 (42.3%) | $145,301 |
| 65+ Years | 208 (23.6%) | $54,615 |
| Total | 880 (100.0%) | $94,222 |
Poverty in Burley
Income Below Poverty by Sex and Age in Burley
With 9.7% poverty level for males and 6.7% for females among the residents of Burley, 15 year old males and 15 year old females are the most vulnerable to poverty, with 22 males (100.0%) and 30 females (57.7%) in their respective age groups living below the poverty level.
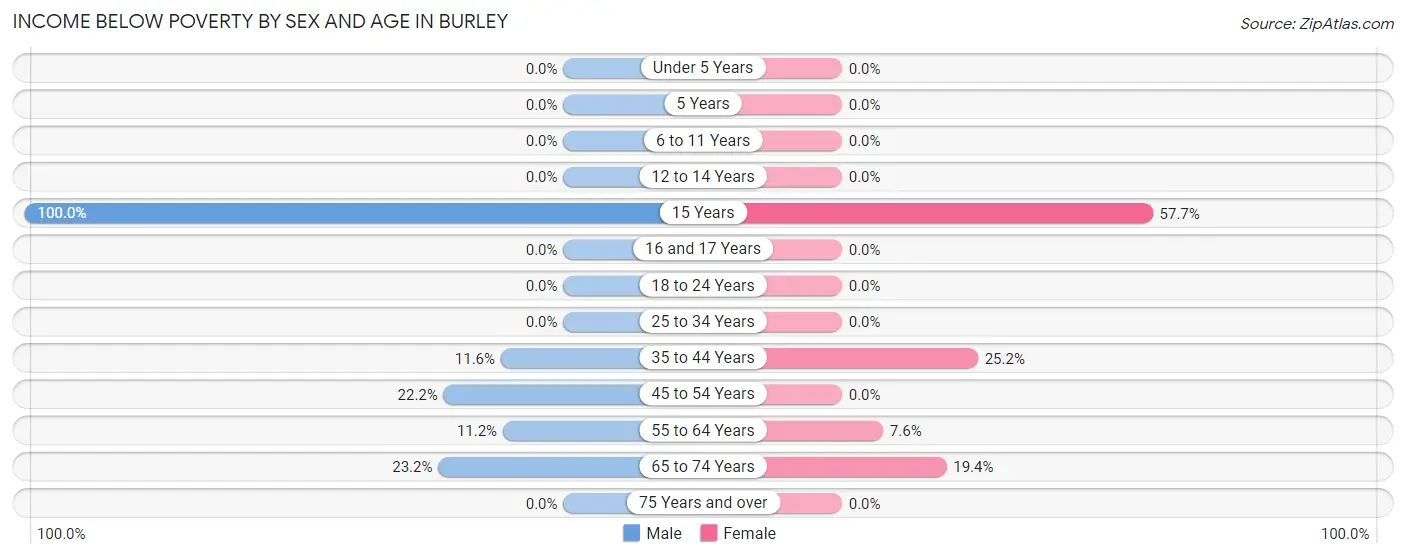
| Age Bracket | Male | Female |
| Under 5 Years | 0 (0.0%) | 0 (0.0%) |
| 5 Years | 0 (0.0%) | 0 (0.0%) |
| 6 to 11 Years | 0 (0.0%) | 0 (0.0%) |
| 12 to 14 Years | 0 (0.0%) | 0 (0.0%) |
| 15 Years | 22 (100.0%) | 30 (57.7%) |
| 16 and 17 Years | 0 (0.0%) | 0 (0.0%) |
| 18 to 24 Years | 0 (0.0%) | 0 (0.0%) |
| 25 to 34 Years | 0 (0.0%) | 0 (0.0%) |
| 35 to 44 Years | 21 (11.6%) | 28 (25.2%) |
| 45 to 54 Years | 20 (22.2%) | 0 (0.0%) |
| 55 to 64 Years | 36 (11.2%) | 18 (7.6%) |
| 65 to 74 Years | 26 (23.2%) | 26 (19.4%) |
| 75 Years and over | 0 (0.0%) | 0 (0.0%) |
| Total | 125 (9.7%) | 102 (6.7%) |
Income Above Poverty by Sex and Age in Burley
According to the poverty statistics in Burley, males aged under 5 years and females aged under 5 years are the age groups that are most secure financially, with 100.0% of males and 100.0% of females in these age groups living above the poverty line.
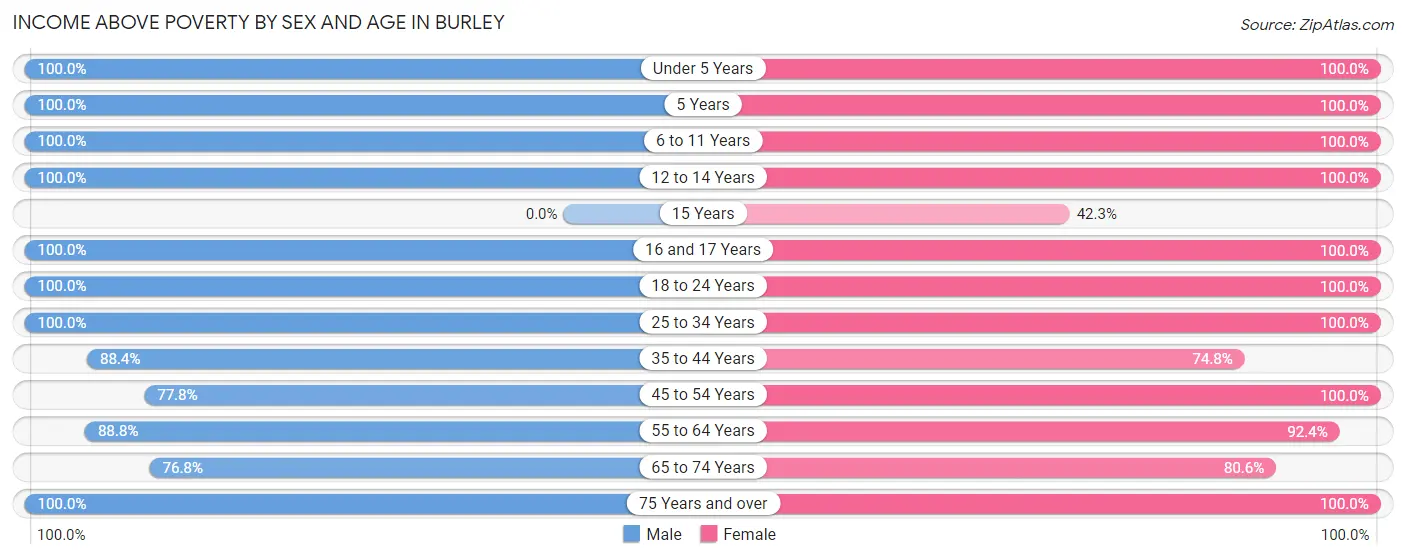
| Age Bracket | Male | Female |
| Under 5 Years | 44 (100.0%) | 28 (100.0%) |
| 5 Years | 27 (100.0%) | 45 (100.0%) |
| 6 to 11 Years | 148 (100.0%) | 205 (100.0%) |
| 12 to 14 Years | 23 (100.0%) | 33 (100.0%) |
| 15 Years | 0 (0.0%) | 22 (42.3%) |
| 16 and 17 Years | 4 (100.0%) | 73 (100.0%) |
| 18 to 24 Years | 152 (100.0%) | 37 (100.0%) |
| 25 to 34 Years | 136 (100.0%) | 204 (100.0%) |
| 35 to 44 Years | 160 (88.4%) | 83 (74.8%) |
| 45 to 54 Years | 70 (77.8%) | 171 (100.0%) |
| 55 to 64 Years | 285 (88.8%) | 218 (92.4%) |
| 65 to 74 Years | 86 (76.8%) | 108 (80.6%) |
| 75 Years and over | 29 (100.0%) | 190 (100.0%) |
| Total | 1,164 (90.3%) | 1,417 (93.3%) |
Income Below Poverty Among Married-Couple Families in Burley
The poverty statistics for married-couple families in Burley show that 7.4% or 44 of the total 593 families live below the poverty line. Families with no children have the highest poverty rate of 12.5%, comprising of 44 families. On the other hand, families with 1 or 2 children have the lowest poverty rate of 0.0%, which includes 0 families.
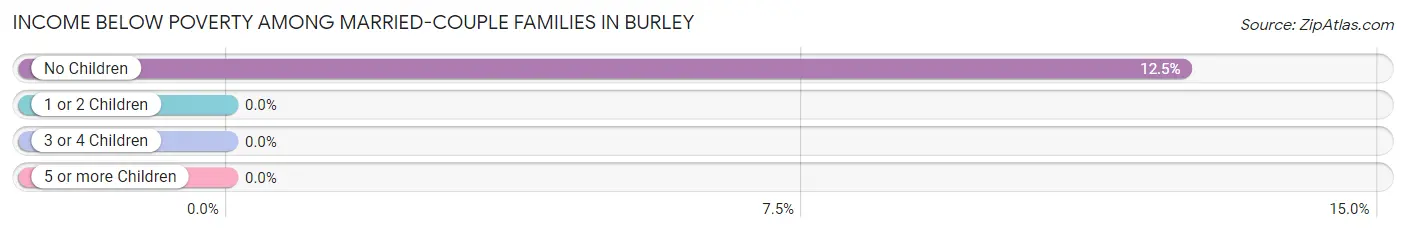
| Children | Above Poverty | Below Poverty |
| No Children | 309 (87.5%) | 44 (12.5%) |
| 1 or 2 Children | 160 (100.0%) | 0 (0.0%) |
| 3 or 4 Children | 76 (100.0%) | 0 (0.0%) |
| 5 or more Children | 4 (100.0%) | 0 (0.0%) |
| Total | 549 (92.6%) | 44 (7.4%) |
Income Below Poverty Among Single-Parent Households in Burley
According to the poverty data in Burley, 58.3% or 21 single-father households and 32.9% or 28 single-mother households are living below the poverty line. Among single-father households, those with 1 or 2 children have the highest poverty rate, with 21 households (100.0%) experiencing poverty. Likewise, among single-mother households, those with 1 or 2 children have the highest poverty rate, with 28 households (32.9%) falling below the poverty line.
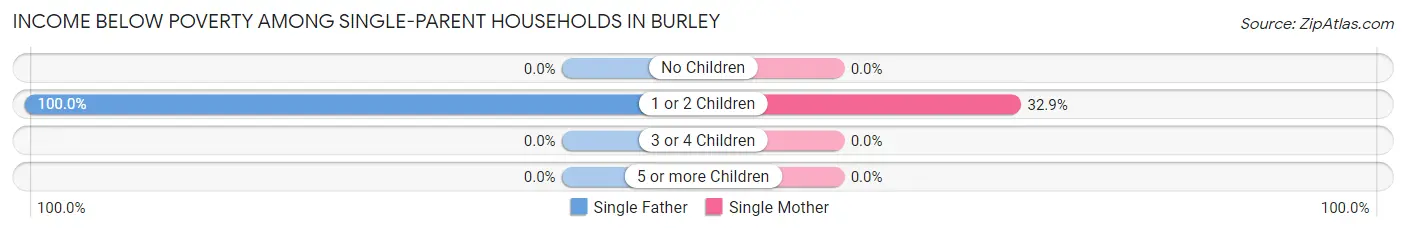
| Children | Single Father | Single Mother |
| No Children | 0 (0.0%) | 0 (0.0%) |
| 1 or 2 Children | 21 (100.0%) | 28 (32.9%) |
| 3 or 4 Children | 0 (0.0%) | 0 (0.0%) |
| 5 or more Children | 0 (0.0%) | 0 (0.0%) |
| Total | 21 (58.3%) | 28 (32.9%) |
Income Below Poverty Among Married-Couple vs Single-Parent Households in Burley
The poverty data for Burley shows that 44 of the married-couple family households (7.4%) and 49 of the single-parent households (40.5%) are living below the poverty level. Within the married-couple family households, those with no children have the highest poverty rate, with 44 households (12.5%) falling below the poverty line. Among the single-parent households, those with 1 or 2 children have the highest poverty rate, with 49 household (46.2%) living below poverty.
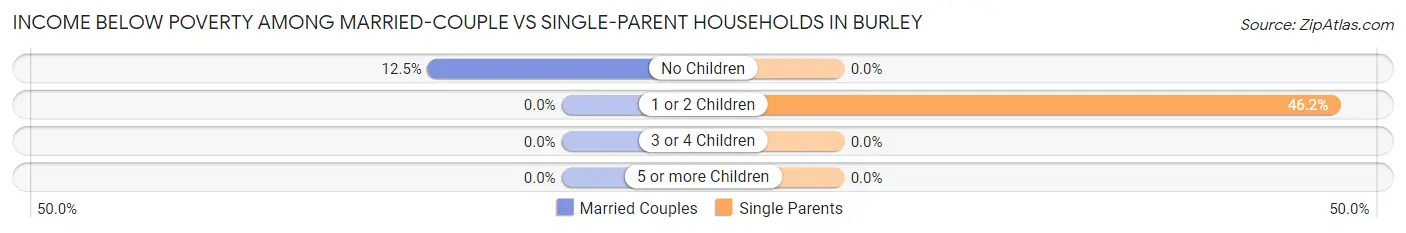
| Children | Married-Couple Families | Single-Parent Households |
| No Children | 44 (12.5%) | 0 (0.0%) |
| 1 or 2 Children | 0 (0.0%) | 49 (46.2%) |
| 3 or 4 Children | 0 (0.0%) | 0 (0.0%) |
| 5 or more Children | 0 (0.0%) | 0 (0.0%) |
| Total | 44 (7.4%) | 49 (40.5%) |
Race in Burley
The most populous races in Burley are White / Caucasian (2,378 | 84.7%), Hispanic or Latino (479 | 17.1%), and Two or more Races (430 | 15.3%).
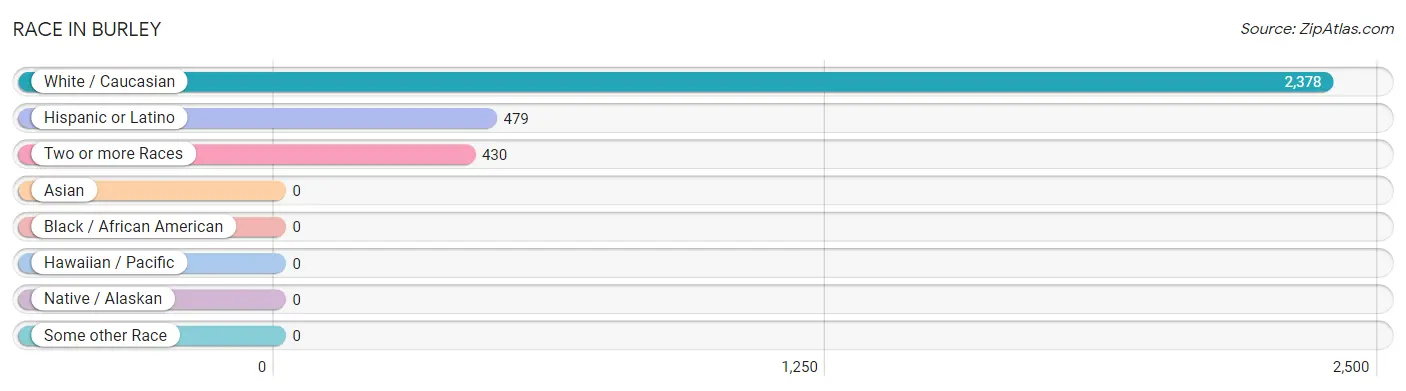
| Race | # Population | % Population |
| Asian | 0 | 0.0% |
| Black / African American | 0 | 0.0% |
| Hawaiian / Pacific | 0 | 0.0% |
| Hispanic or Latino | 479 | 17.1% |
| Native / Alaskan | 0 | 0.0% |
| White / Caucasian | 2,378 | 84.7% |
| Two or more Races | 430 | 15.3% |
| Some other Race | 0 | 0.0% |
| Total | 2,808 | 100.0% |
Ancestry in Burley
The most populous ancestries reported in Burley are German (736 | 26.2%), Mexican (479 | 17.1%), European (416 | 14.8%), Irish (383 | 13.6%), and English (272 | 9.7%), together accounting for 81.4% of all Burley residents.
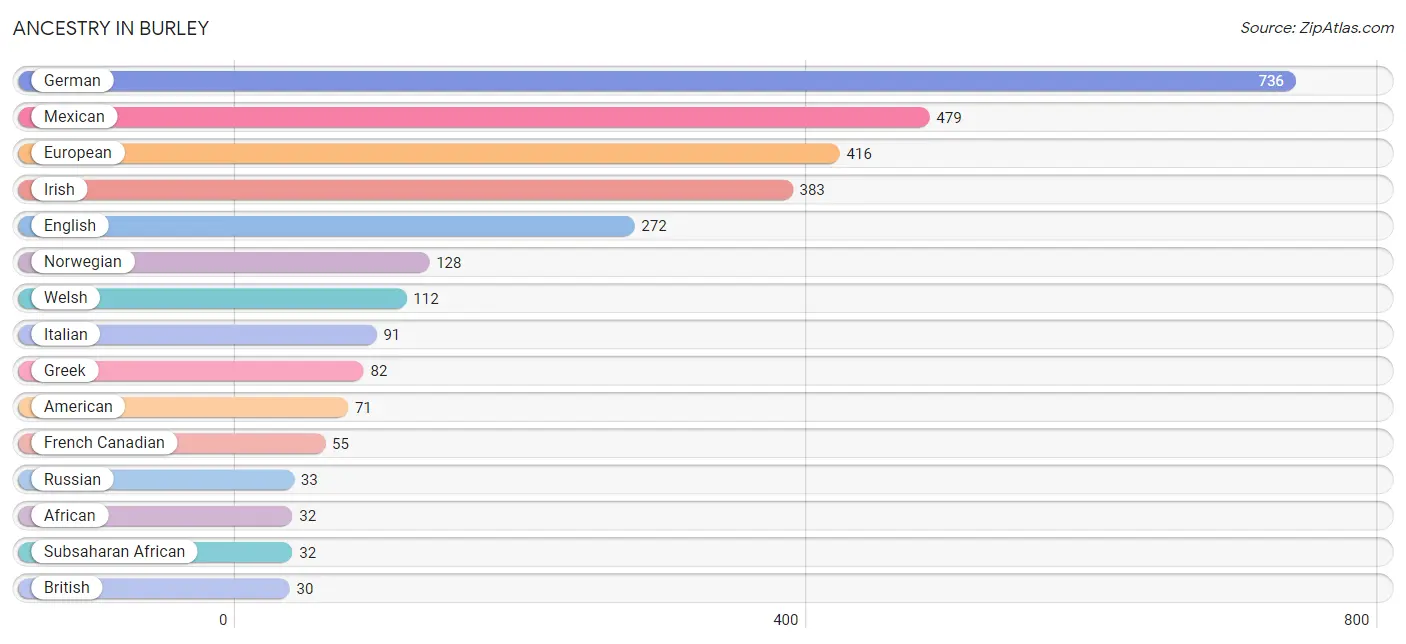
| Ancestry | # Population | % Population |
| African | 32 | 1.1% |
| American | 71 | 2.5% |
| British | 30 | 1.1% |
| Danish | 14 | 0.5% |
| Dutch | 21 | 0.7% |
| Eastern European | 9 | 0.3% |
| English | 272 | 9.7% |
| European | 416 | 14.8% |
| French | 11 | 0.4% |
| French Canadian | 55 | 2.0% |
| German | 736 | 26.2% |
| Greek | 82 | 2.9% |
| Irish | 383 | 13.6% |
| Italian | 91 | 3.2% |
| Mexican | 479 | 17.1% |
| Norwegian | 128 | 4.6% |
| Polish | 9 | 0.3% |
| Russian | 33 | 1.2% |
| Scotch-Irish | 9 | 0.3% |
| Scottish | 10 | 0.4% |
| Subsaharan African | 32 | 1.1% |
| Swedish | 18 | 0.6% |
| Swiss | 9 | 0.3% |
| Welsh | 112 | 4.0% | View All 24 Rows |
Immigrants in Burley
The most numerous immigrant groups reported in Burley came from Europe (21 | 0.7%), Eastern Europe (12 | 0.4%), Moldova (12 | 0.4%), Africa (10 | 0.4%), and Nigeria (10 | 0.4%), together accounting for 2.3% of all Burley residents.
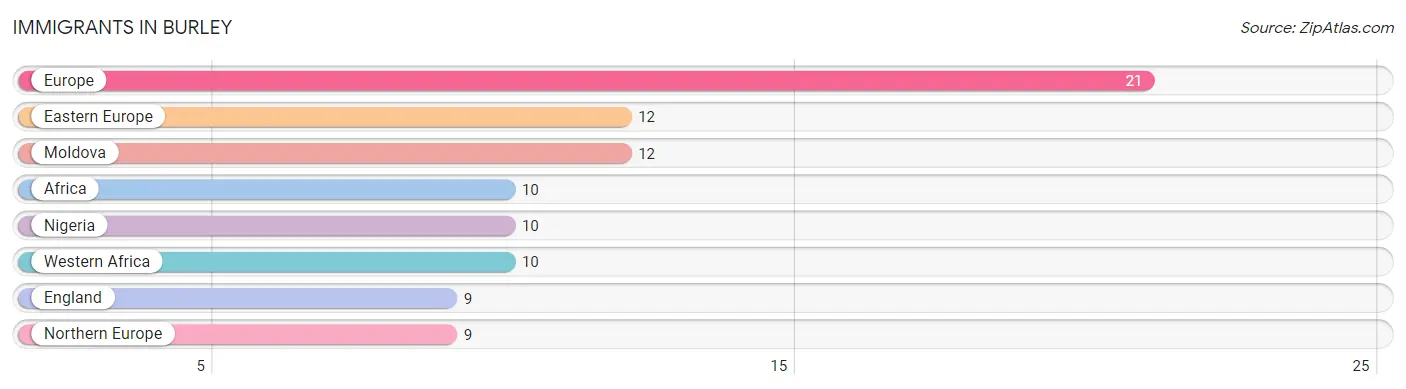
| Immigration Origin | # Population | % Population |
| Africa | 10 | 0.4% |
| Eastern Europe | 12 | 0.4% |
| England | 9 | 0.3% |
| Europe | 21 | 0.7% |
| Moldova | 12 | 0.4% |
| Nigeria | 10 | 0.4% |
| Northern Europe | 9 | 0.3% |
| Western Africa | 10 | 0.4% | View All 8 Rows |
Sex and Age in Burley
Sex and Age in Burley
The most populous age groups in Burley are 55 to 59 Years (196 | 15.2%) for men and 5 to 9 Years (194 | 12.8%) for women.
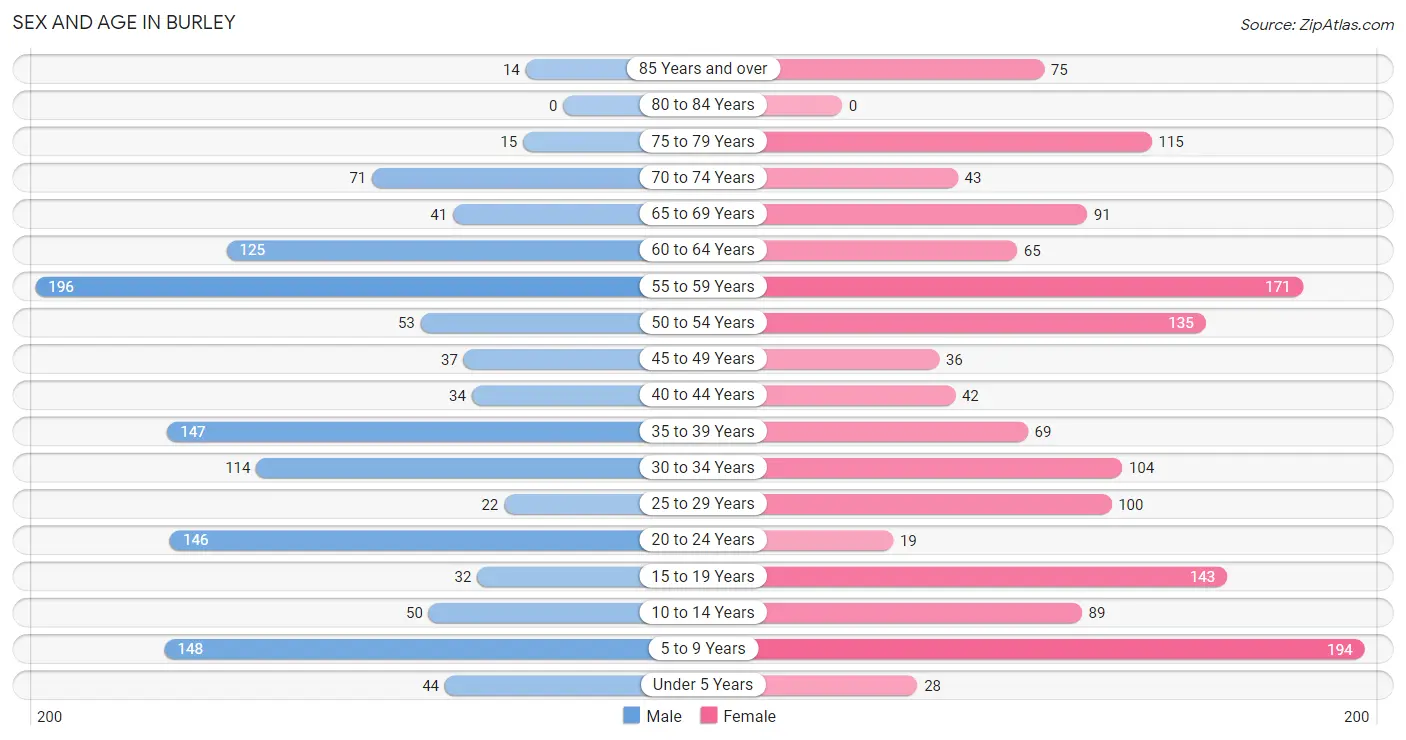
| Age Bracket | Male | Female |
| Under 5 Years | 44 (3.4%) | 28 (1.8%) |
| 5 to 9 Years | 148 (11.5%) | 194 (12.8%) |
| 10 to 14 Years | 50 (3.9%) | 89 (5.9%) |
| 15 to 19 Years | 32 (2.5%) | 143 (9.4%) |
| 20 to 24 Years | 146 (11.3%) | 19 (1.3%) |
| 25 to 29 Years | 22 (1.7%) | 100 (6.6%) |
| 30 to 34 Years | 114 (8.8%) | 104 (6.9%) |
| 35 to 39 Years | 147 (11.4%) | 69 (4.5%) |
| 40 to 44 Years | 34 (2.6%) | 42 (2.8%) |
| 45 to 49 Years | 37 (2.9%) | 36 (2.4%) |
| 50 to 54 Years | 53 (4.1%) | 135 (8.9%) |
| 55 to 59 Years | 196 (15.2%) | 171 (11.3%) |
| 60 to 64 Years | 125 (9.7%) | 65 (4.3%) |
| 65 to 69 Years | 41 (3.2%) | 91 (6.0%) |
| 70 to 74 Years | 71 (5.5%) | 43 (2.8%) |
| 75 to 79 Years | 15 (1.2%) | 115 (7.6%) |
| 80 to 84 Years | 0 (0.0%) | 0 (0.0%) |
| 85 Years and over | 14 (1.1%) | 75 (4.9%) |
| Total | 1,289 (100.0%) | 1,519 (100.0%) |
Families and Households in Burley
Median Family Size in Burley
The median family size in Burley is 3.61 persons per family, with married-couple families (593 | 83.1%) accounting for the largest median family size of 3.8 persons per family. On the other hand, single female/mother families (85 | 11.9%) represent the smallest median family size with 2.68 persons per family.
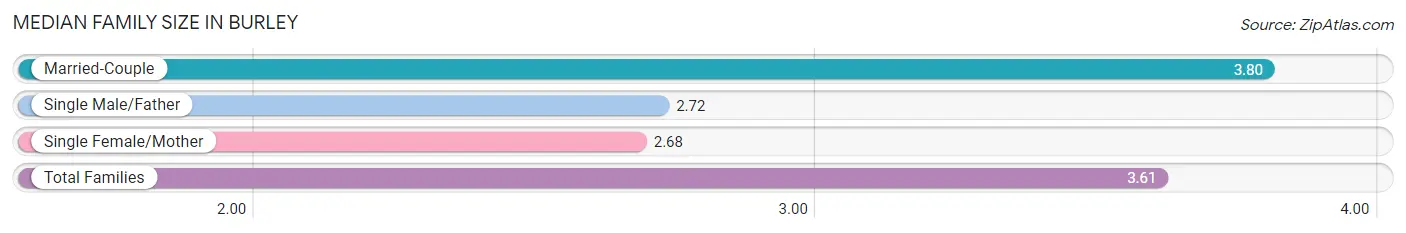
| Family Type | # Families | Family Size |
| Married-Couple | 593 (83.1%) | 3.80 |
| Single Male/Father | 36 (5.0%) | 2.72 |
| Single Female/Mother | 85 (11.9%) | 2.68 |
| Total Families | 714 (100.0%) | 3.61 |
Median Household Size in Burley
The median household size in Burley is 3.19 persons per household, with married-couple households (593 | 67.4%) accounting for the largest median household size of 3.8 persons per household. non-family households (166 | 18.9%) represent the smallest median household size with 1.37 persons per household.
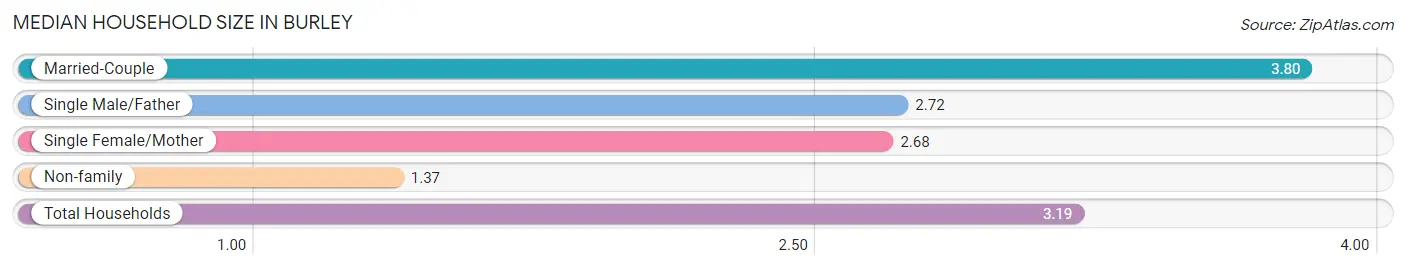
| Household Type | # Households | Household Size |
| Married-Couple | 593 (67.4%) | 3.80 |
| Single Male/Father | 36 (4.1%) | 2.72 |
| Single Female/Mother | 85 (9.7%) | 2.68 |
| Non-family | 166 (18.9%) | 1.37 |
| Total Households | 880 (100.0%) | 3.19 |
Household Size by Marriage Status in Burley
Out of a total of 880 households in Burley, 714 (81.1%) are family households, while 166 (18.9%) are nonfamily households. The most numerous type of family households are 2-person households, comprising 321, and the most common type of nonfamily households are 1-person households, comprising 113.
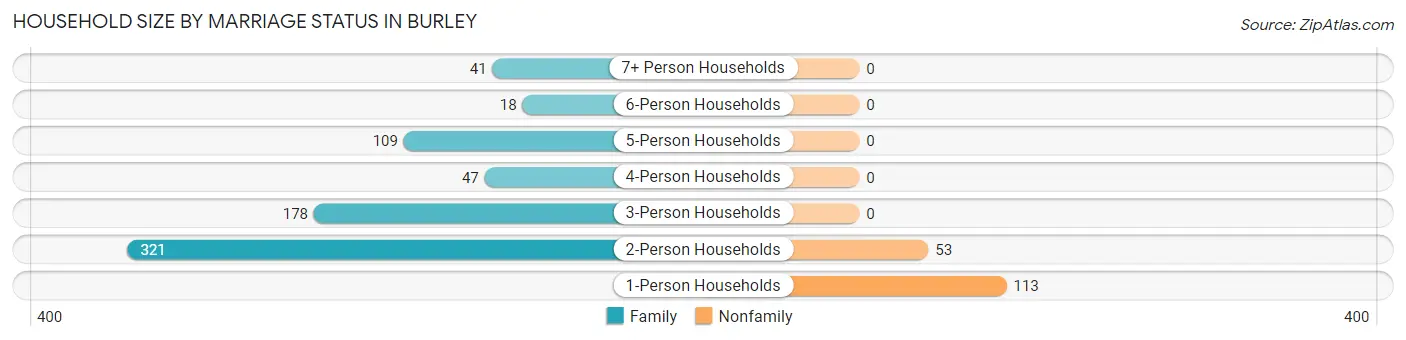
| Household Size | Family Households | Nonfamily Households |
| 1-Person Households | - | 113 (12.8%) |
| 2-Person Households | 321 (36.5%) | 53 (6.0%) |
| 3-Person Households | 178 (20.2%) | 0 (0.0%) |
| 4-Person Households | 47 (5.3%) | 0 (0.0%) |
| 5-Person Households | 109 (12.4%) | 0 (0.0%) |
| 6-Person Households | 18 (2.1%) | 0 (0.0%) |
| 7+ Person Households | 41 (4.7%) | 0 (0.0%) |
| Total | 714 (81.1%) | 166 (18.9%) |
Female Fertility in Burley
Fertility by Age in Burley
| Age Bracket | Women with Births | Births / 1,000 Women |
| 15 to 19 years | 0 (0.0%) | 0.0 |
| 20 to 34 years | 0 (0.0%) | 0.0 |
| 35 to 50 years | 0 (0.0%) | 0.0 |
| Total | 0 (0.0%) | 0.0 |
Fertility by Age by Marriage Status in Burley
| Age Bracket | Married | Unmarried |
| 15 to 19 years | 0 (0.0%) | 0 (0.0%) |
| 20 to 34 years | 0 (0.0%) | 0 (0.0%) |
| 35 to 50 years | 0 (0.0%) | 0 (0.0%) |
| Total | 0 (0.0%) | 0 (0.0%) |
Fertility by Education in Burley
| Educational Attainment | Women with Births | Births / 1,000 Women |
| Less than High School | 0 (0.0%) | 0.0 |
| High School Diploma | 0 (0.0%) | 0.0 |
| College or Associate's Degree | 0 (0.0%) | 0.0 |
| Bachelor's Degree | 0 (0.0%) | 0.0 |
| Graduate Degree | 0 (0.0%) | 0.0 |
| Total | 0 (0.0%) | 0.0 |
Fertility by Education by Marriage Status in Burley
| Educational Attainment | Married | Unmarried |
| Less than High School | 0 (0.0%) | 0 (0.0%) |
| High School Diploma | 0 (0.0%) | 0 (0.0%) |
| College or Associate's Degree | 0 (0.0%) | 0 (0.0%) |
| Bachelor's Degree | 0 (0.0%) | 0 (0.0%) |
| Graduate Degree | 0 (0.0%) | 0 (0.0%) |
| Total | 0 (0.0%) | 0 (0.0%) |
Employment Characteristics in Burley
Employment by Class of Employer in Burley
Among the 1,085 employed individuals in Burley, private company employees (447 | 41.2%), federal government employees (211 | 19.5%), and local government employees (173 | 15.9%) make up the most common classes of employment.
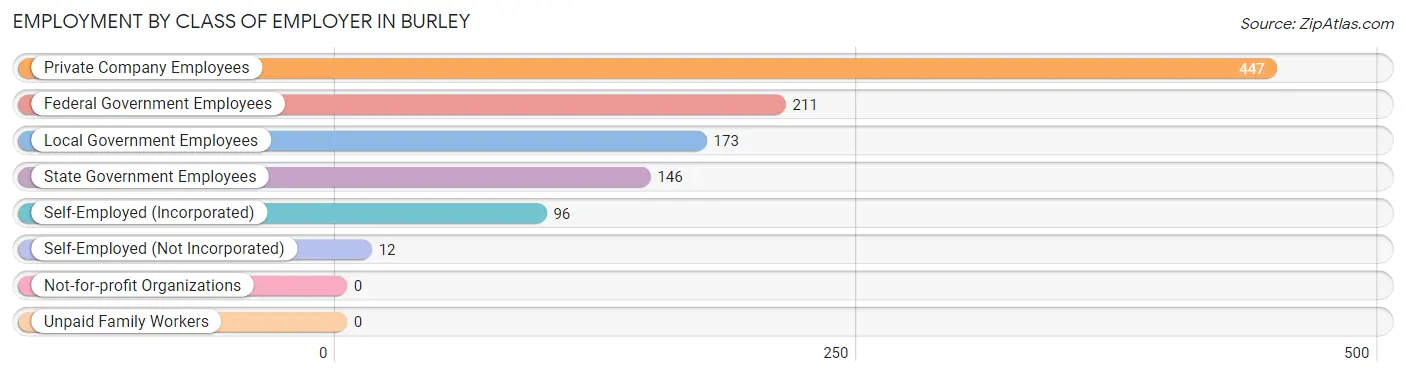
| Employer Class | # Employees | % Employees |
| Private Company Employees | 447 | 41.2% |
| Self-Employed (Incorporated) | 96 | 8.8% |
| Self-Employed (Not Incorporated) | 12 | 1.1% |
| Not-for-profit Organizations | 0 | 0.0% |
| Local Government Employees | 173 | 15.9% |
| State Government Employees | 146 | 13.5% |
| Federal Government Employees | 211 | 19.5% |
| Unpaid Family Workers | 0 | 0.0% |
| Total | 1,085 | 100.0% |
Employment Status by Age in Burley
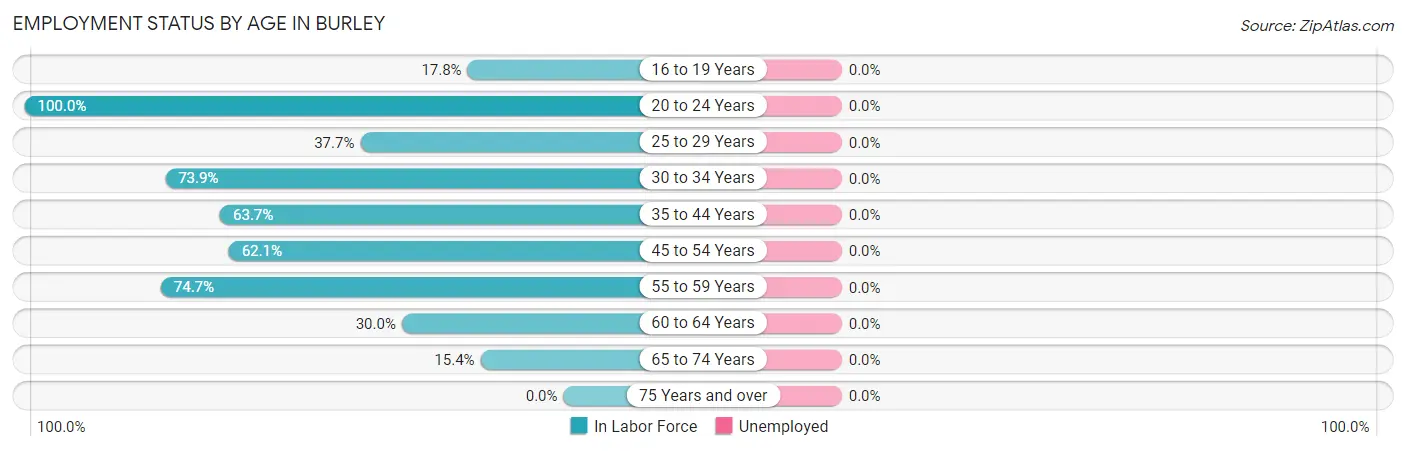
| Age Bracket | In Labor Force | Unemployed |
| 16 to 19 Years | 18 (17.8%) | 0 (0.0%) |
| 20 to 24 Years | 165 (100.0%) | 0 (0.0%) |
| 25 to 29 Years | 46 (37.7%) | 0 (0.0%) |
| 30 to 34 Years | 161 (73.9%) | 0 (0.0%) |
| 35 to 44 Years | 186 (63.7%) | 0 (0.0%) |
| 45 to 54 Years | 162 (62.1%) | 0 (0.0%) |
| 55 to 59 Years | 274 (74.7%) | 0 (0.0%) |
| 60 to 64 Years | 57 (30.0%) | 0 (0.0%) |
| 65 to 74 Years | 38 (15.4%) | 0 (0.0%) |
| 75 Years and over | 0 (0.0%) | 0 (0.0%) |
| Total | 1,108 (50.8%) | 0 (0.0%) |
Employment Status by Educational Attainment in Burley
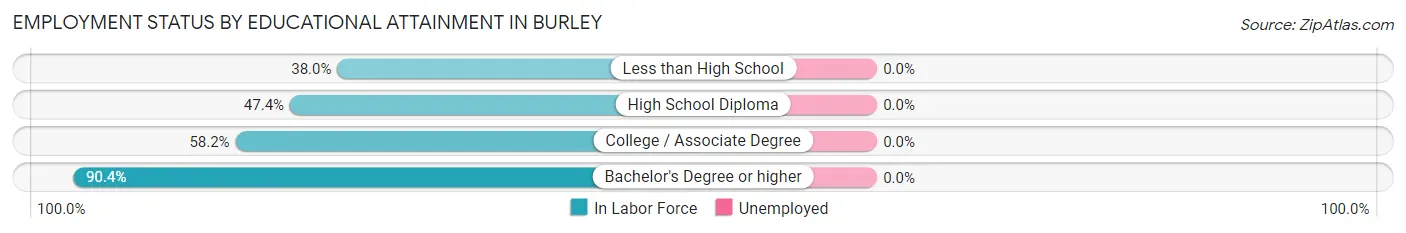
| Educational Attainment | In Labor Force | Unemployed |
| Less than High School | 57 (38.0%) | 0 (0.0%) |
| High School Diploma | 254 (47.4%) | 0 (0.0%) |
| College / Associate Degree | 209 (58.2%) | 0 (0.0%) |
| Bachelor's Degree or higher | 366 (90.4%) | 0 (0.0%) |
| Total | 886 (61.1%) | 0 (0.0%) |
Employment Occupations by Sex in Burley
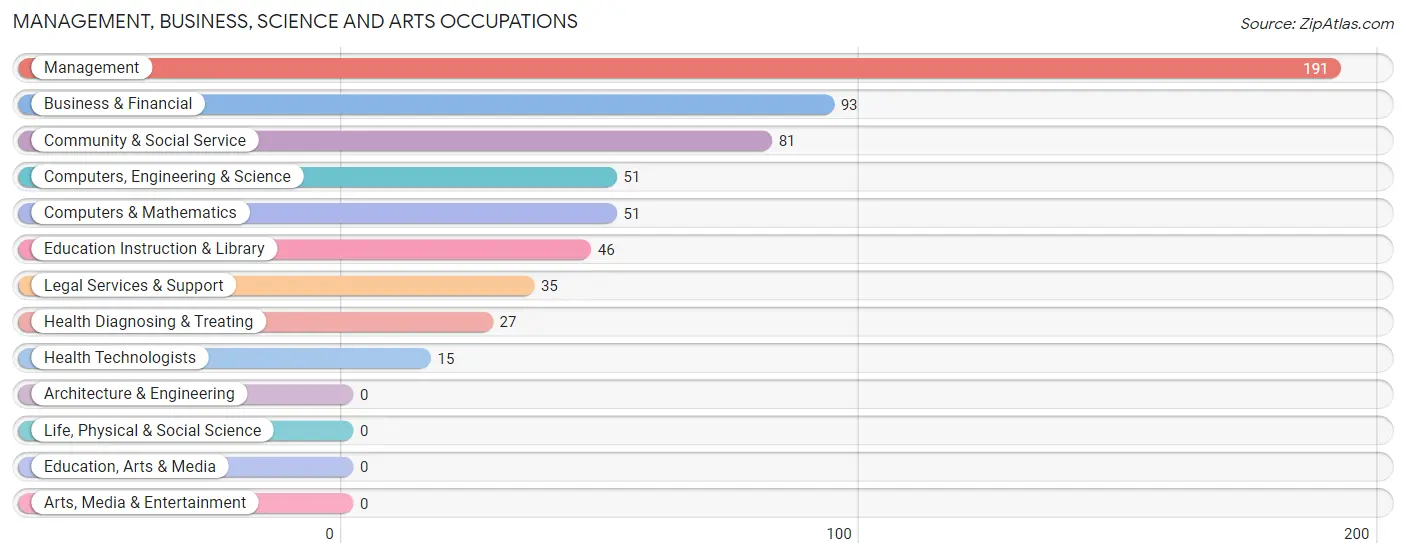
Management, Business, Science and Arts Occupations
The most common Management, Business, Science and Arts occupations in Burley are Management (191 | 17.2%), Business & Financial (93 | 8.4%), Community & Social Service (81 | 7.3%), Computers, Engineering & Science (51 | 4.6%), and Computers & Mathematics (51 | 4.6%).
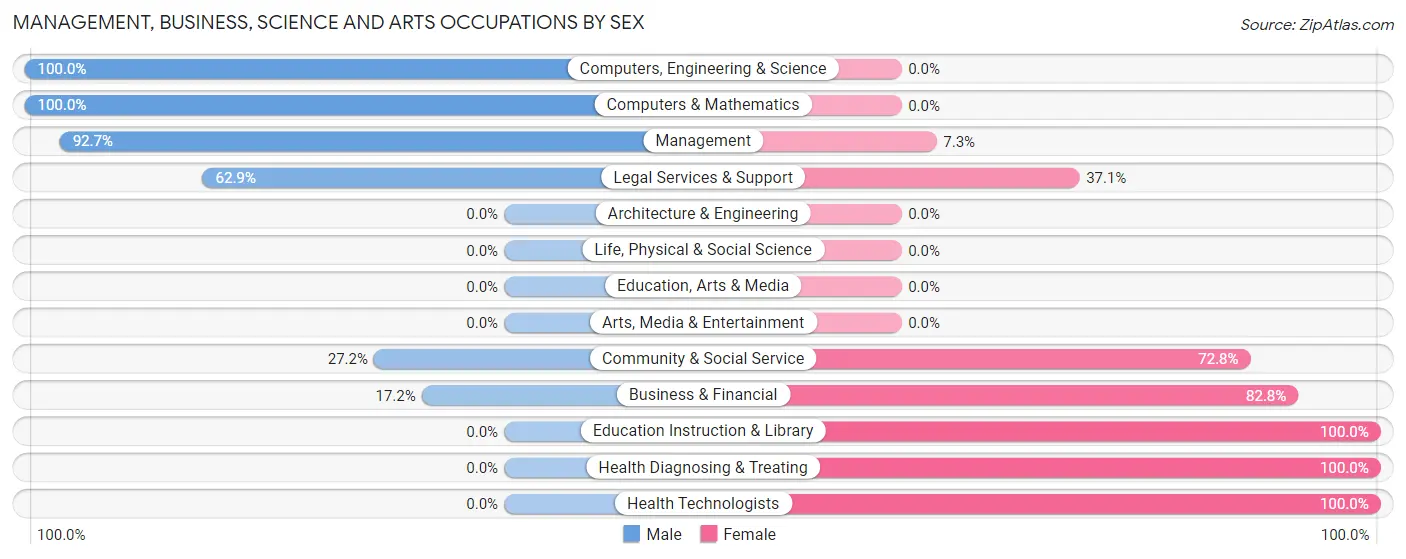
Management, Business, Science and Arts Occupations by Sex
Within the Management, Business, Science and Arts occupations in Burley, the most male-oriented occupations are Computers, Engineering & Science (100.0%), Computers & Mathematics (100.0%), and Management (92.7%), while the most female-oriented occupations are Education Instruction & Library (100.0%), Health Diagnosing & Treating (100.0%), and Health Technologists (100.0%).
| Occupation | Male | Female |
| Management | 177 (92.7%) | 14 (7.3%) |
| Business & Financial | 16 (17.2%) | 77 (82.8%) |
| Computers, Engineering & Science | 51 (100.0%) | 0 (0.0%) |
| Computers & Mathematics | 51 (100.0%) | 0 (0.0%) |
| Architecture & Engineering | 0 (0.0%) | 0 (0.0%) |
| Life, Physical & Social Science | 0 (0.0%) | 0 (0.0%) |
| Community & Social Service | 22 (27.2%) | 59 (72.8%) |
| Education, Arts & Media | 0 (0.0%) | 0 (0.0%) |
| Legal Services & Support | 22 (62.9%) | 13 (37.1%) |
| Education Instruction & Library | 0 (0.0%) | 46 (100.0%) |
| Arts, Media & Entertainment | 0 (0.0%) | 0 (0.0%) |
| Health Diagnosing & Treating | 0 (0.0%) | 27 (100.0%) |
| Health Technologists | 0 (0.0%) | 15 (100.0%) |
| Total (Category) | 266 (60.1%) | 177 (40.0%) |
| Total (Overall) | 681 (61.5%) | 426 (38.5%) |
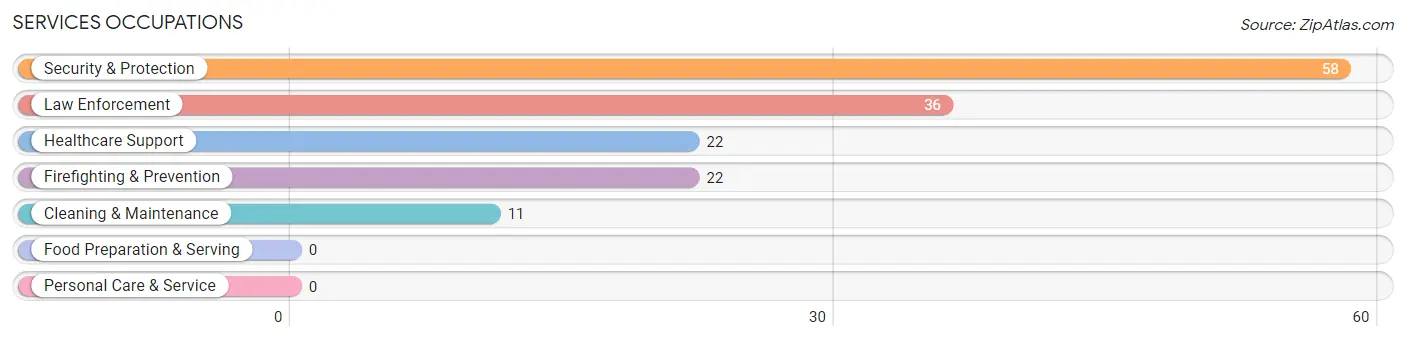
Services Occupations
The most common Services occupations in Burley are Security & Protection (58 | 5.2%), Law Enforcement (36 | 3.3%), Healthcare Support (22 | 2.0%), Firefighting & Prevention (22 | 2.0%), and Cleaning & Maintenance (11 | 1.0%).
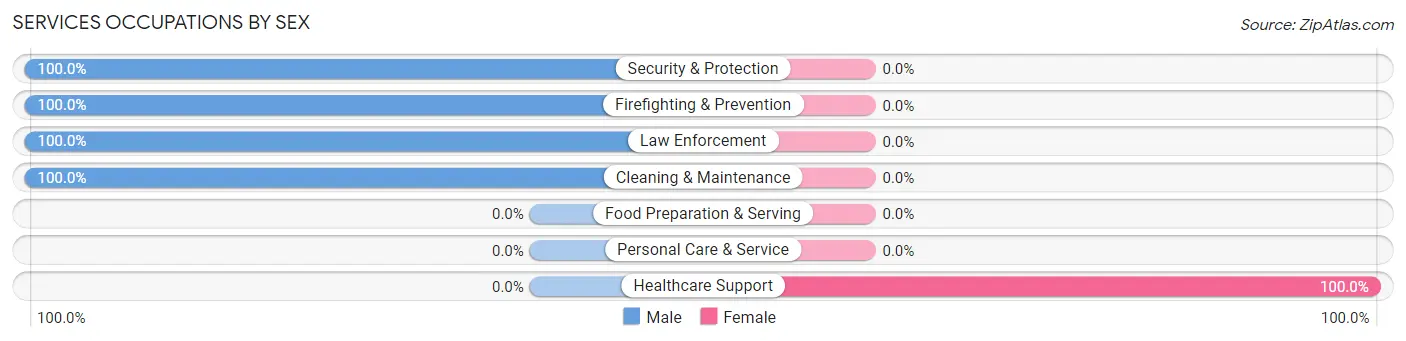
Services Occupations by Sex
| Occupation | Male | Female |
| Healthcare Support | 0 (0.0%) | 22 (100.0%) |
| Security & Protection | 58 (100.0%) | 0 (0.0%) |
| Firefighting & Prevention | 22 (100.0%) | 0 (0.0%) |
| Law Enforcement | 36 (100.0%) | 0 (0.0%) |
| Food Preparation & Serving | 0 (0.0%) | 0 (0.0%) |
| Cleaning & Maintenance | 11 (100.0%) | 0 (0.0%) |
| Personal Care & Service | 0 (0.0%) | 0 (0.0%) |
| Total (Category) | 69 (75.8%) | 22 (24.2%) |
| Total (Overall) | 681 (61.5%) | 426 (38.5%) |
Sales and Office Occupations
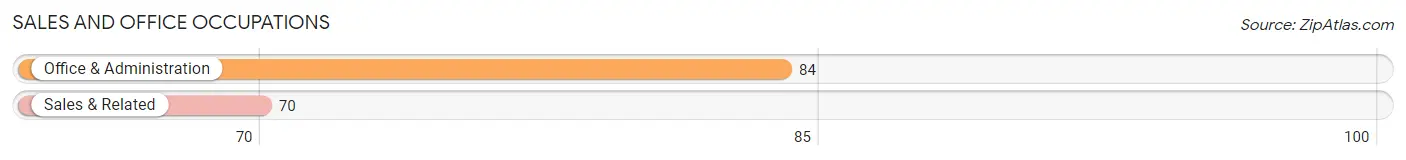
The most common Sales and Office occupations in Burley are Office & Administration (84 | 7.6%), and Sales & Related (70 | 6.3%).
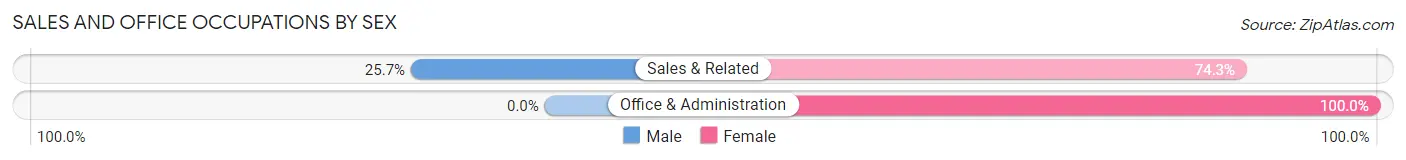
Sales and Office Occupations by Sex
| Occupation | Male | Female |
| Sales & Related | 18 (25.7%) | 52 (74.3%) |
| Office & Administration | 0 (0.0%) | 84 (100.0%) |
| Total (Category) | 18 (11.7%) | 136 (88.3%) |
| Total (Overall) | 681 (61.5%) | 426 (38.5%) |
Natural Resources, Construction and Maintenance Occupations
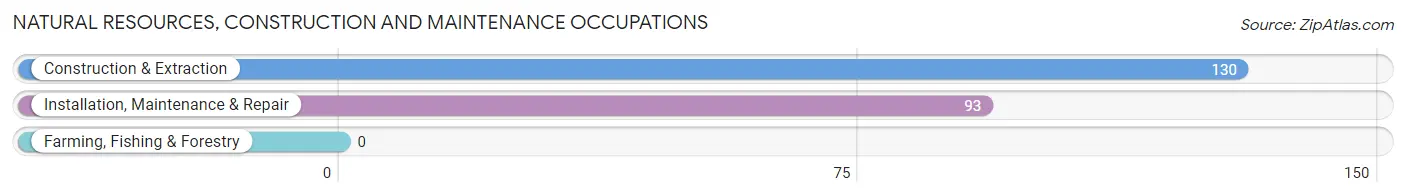
The most common Natural Resources, Construction and Maintenance occupations in Burley are Construction & Extraction (130 | 11.7%), and Installation, Maintenance & Repair (93 | 8.4%).
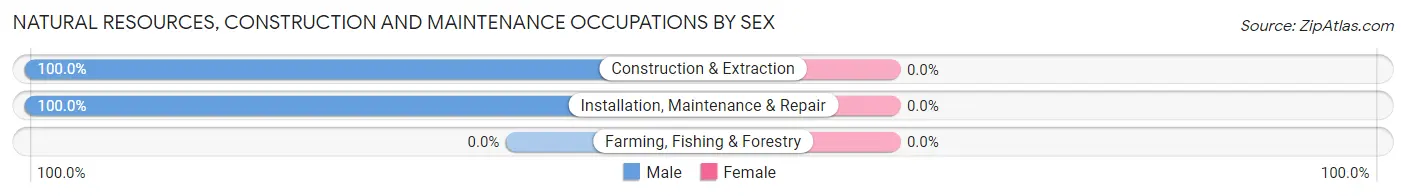
Natural Resources, Construction and Maintenance Occupations by Sex
| Occupation | Male | Female |
| Farming, Fishing & Forestry | 0 (0.0%) | 0 (0.0%) |
| Construction & Extraction | 130 (100.0%) | 0 (0.0%) |
| Installation, Maintenance & Repair | 93 (100.0%) | 0 (0.0%) |
| Total (Category) | 223 (100.0%) | 0 (0.0%) |
| Total (Overall) | 681 (61.5%) | 426 (38.5%) |
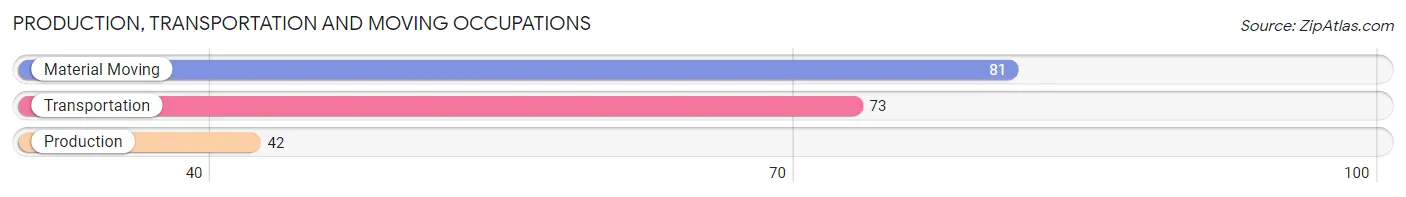
Production, Transportation and Moving Occupations
The most common Production, Transportation and Moving occupations in Burley are Material Moving (81 | 7.3%), Transportation (73 | 6.6%), and Production (42 | 3.8%).
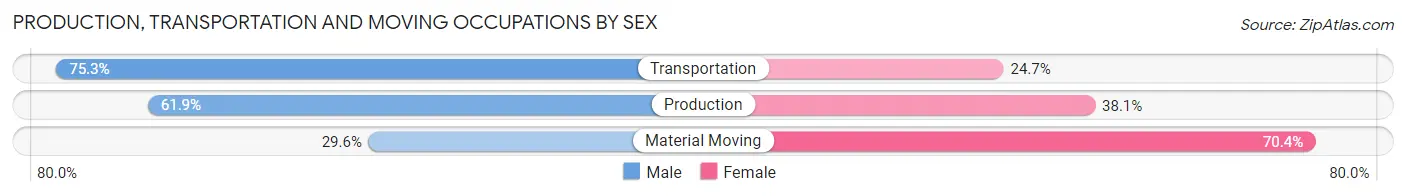
Production, Transportation and Moving Occupations by Sex
| Occupation | Male | Female |
| Production | 26 (61.9%) | 16 (38.1%) |
| Transportation | 55 (75.3%) | 18 (24.7%) |
| Material Moving | 24 (29.6%) | 57 (70.4%) |
| Total (Category) | 105 (53.6%) | 91 (46.4%) |
| Total (Overall) | 681 (61.5%) | 426 (38.5%) |
Employment Industries by Sex in Burley
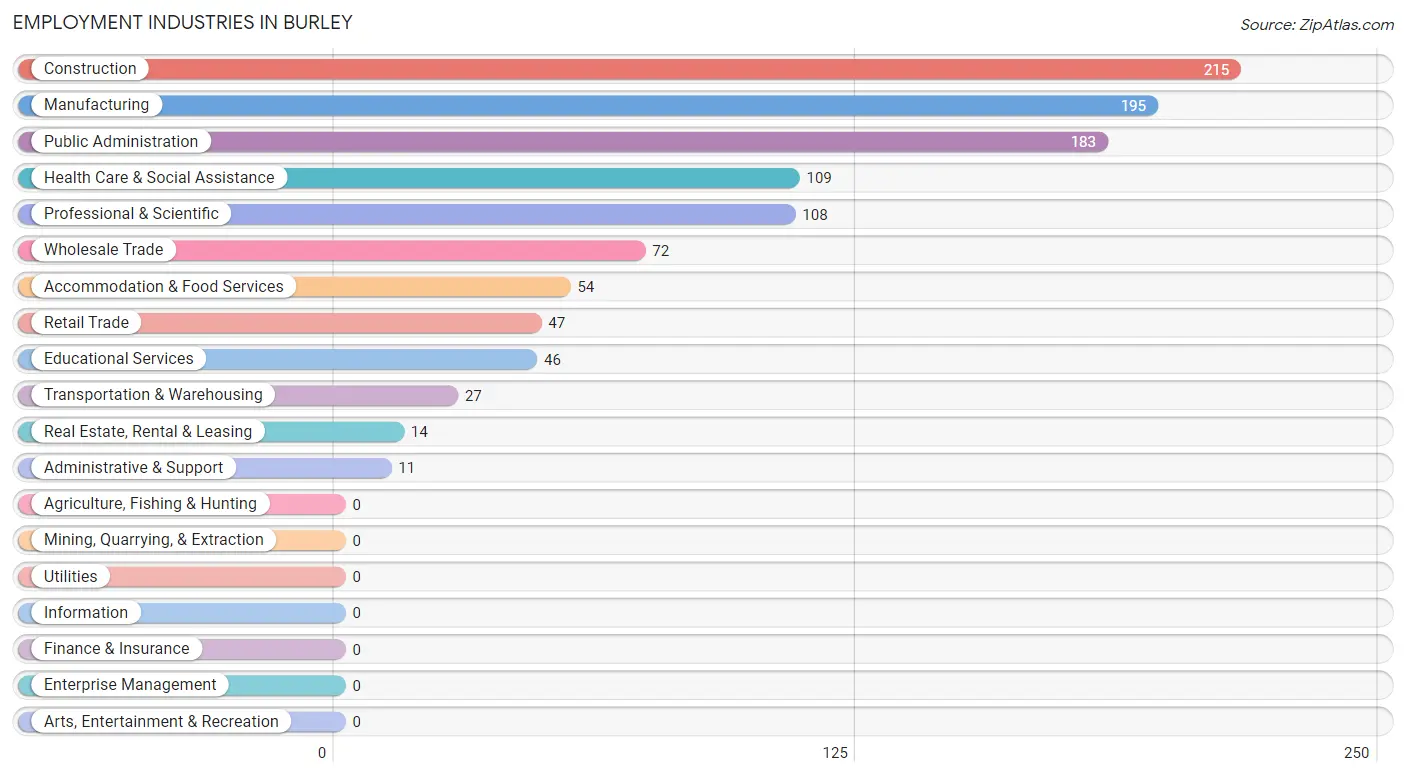
Employment Industries in Burley
The major employment industries in Burley include Construction (215 | 19.4%), Manufacturing (195 | 17.6%), Public Administration (183 | 16.5%), Health Care & Social Assistance (109 | 9.9%), and Professional & Scientific (108 | 9.8%).
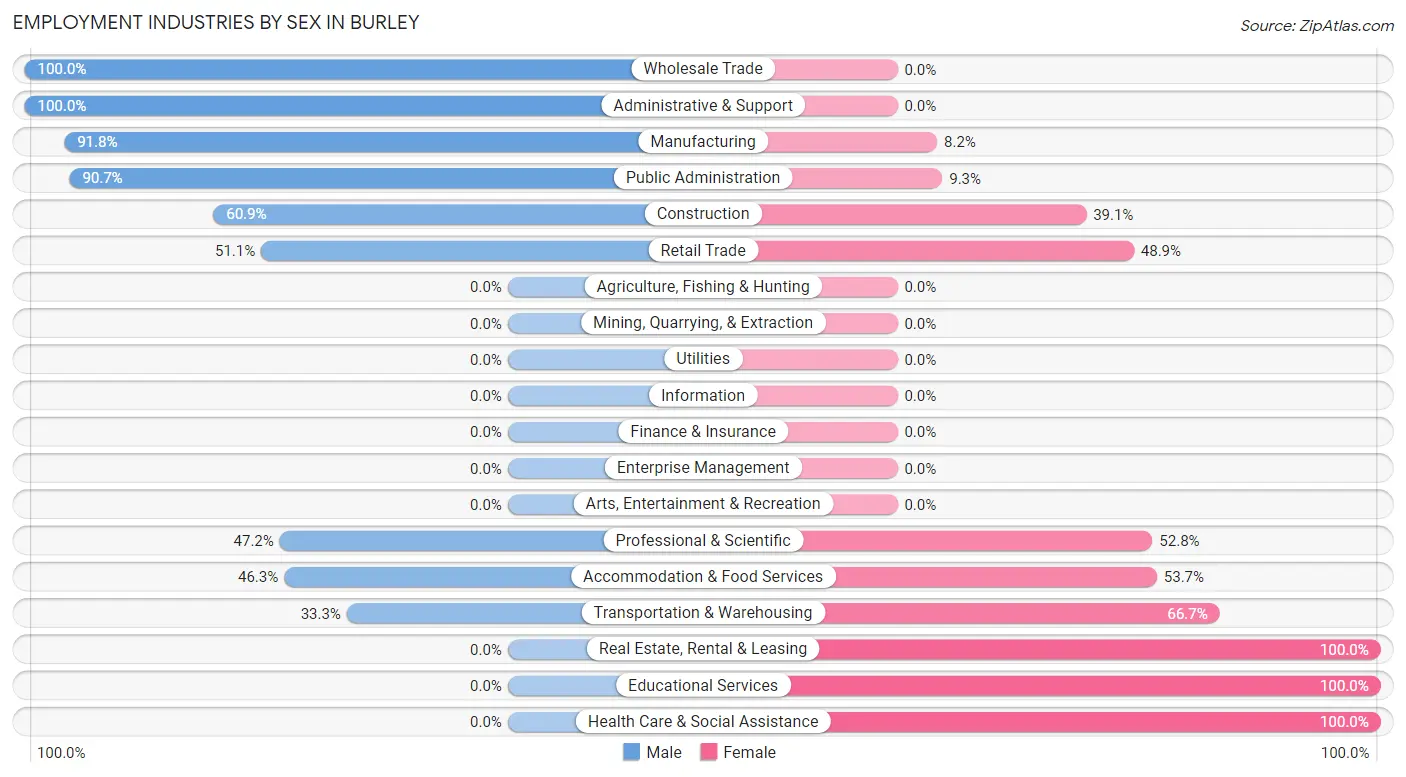
Employment Industries by Sex in Burley
The Burley industries that see more men than women are Wholesale Trade (100.0%), Administrative & Support (100.0%), and Manufacturing (91.8%), whereas the industries that tend to have a higher number of women are Real Estate, Rental & Leasing (100.0%), Educational Services (100.0%), and Health Care & Social Assistance (100.0%).
| Industry | Male | Female |
| Agriculture, Fishing & Hunting | 0 (0.0%) | 0 (0.0%) |
| Mining, Quarrying, & Extraction | 0 (0.0%) | 0 (0.0%) |
| Construction | 131 (60.9%) | 84 (39.1%) |
| Manufacturing | 179 (91.8%) | 16 (8.2%) |
| Wholesale Trade | 72 (100.0%) | 0 (0.0%) |
| Retail Trade | 24 (51.1%) | 23 (48.9%) |
| Transportation & Warehousing | 9 (33.3%) | 18 (66.7%) |
| Utilities | 0 (0.0%) | 0 (0.0%) |
| Information | 0 (0.0%) | 0 (0.0%) |
| Finance & Insurance | 0 (0.0%) | 0 (0.0%) |
| Real Estate, Rental & Leasing | 0 (0.0%) | 14 (100.0%) |
| Professional & Scientific | 51 (47.2%) | 57 (52.8%) |
| Enterprise Management | 0 (0.0%) | 0 (0.0%) |
| Administrative & Support | 11 (100.0%) | 0 (0.0%) |
| Educational Services | 0 (0.0%) | 46 (100.0%) |
| Health Care & Social Assistance | 0 (0.0%) | 109 (100.0%) |
| Arts, Entertainment & Recreation | 0 (0.0%) | 0 (0.0%) |
| Accommodation & Food Services | 25 (46.3%) | 29 (53.7%) |
| Public Administration | 166 (90.7%) | 17 (9.3%) |
| Total | 681 (61.5%) | 426 (38.5%) |
Education in Burley
School Enrollment in Burley
The most common levels of schooling among the 681 students in Burley are elementary school (219 | 32.2%), high school (135 | 19.8%), and kindergarten (117 | 17.2%).
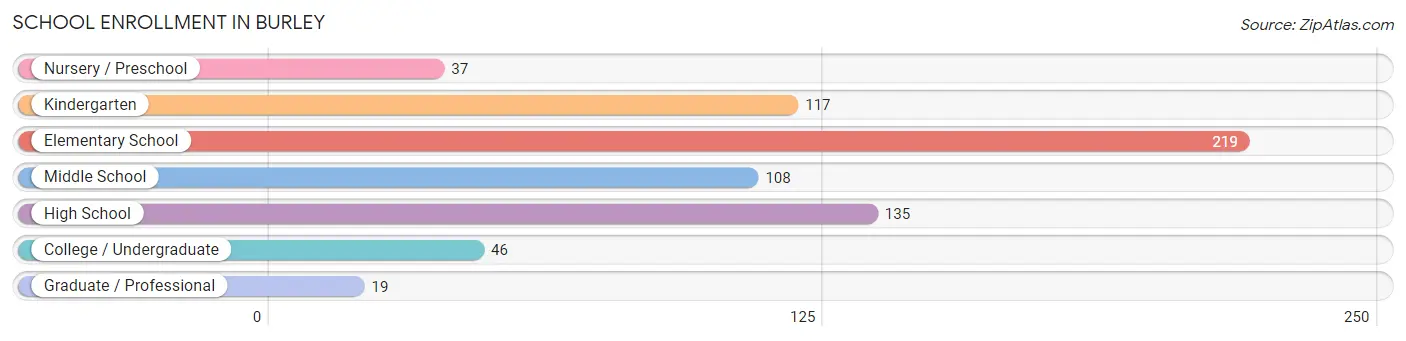
| School Level | # Students | % Students |
| Nursery / Preschool | 37 | 5.4% |
| Kindergarten | 117 | 17.2% |
| Elementary School | 219 | 32.2% |
| Middle School | 108 | 15.9% |
| High School | 135 | 19.8% |
| College / Undergraduate | 46 | 6.8% |
| Graduate / Professional | 19 | 2.8% |
| Total | 681 | 100.0% |
School Enrollment by Age by Funding Source in Burley
Out of a total of 681 students who are enrolled in schools in Burley, 119 (17.5%) attend a private institution, while the remaining 562 (82.5%) are enrolled in public schools. The age group of 18 to 19 year olds has the highest likelihood of being enrolled in private schools, with 6 (100.0% in the age bracket) enrolled. Conversely, the age group of 20 to 24 year olds has the lowest likelihood of being enrolled in a private school, with 8 (100.0% in the age bracket) attending a public institution.
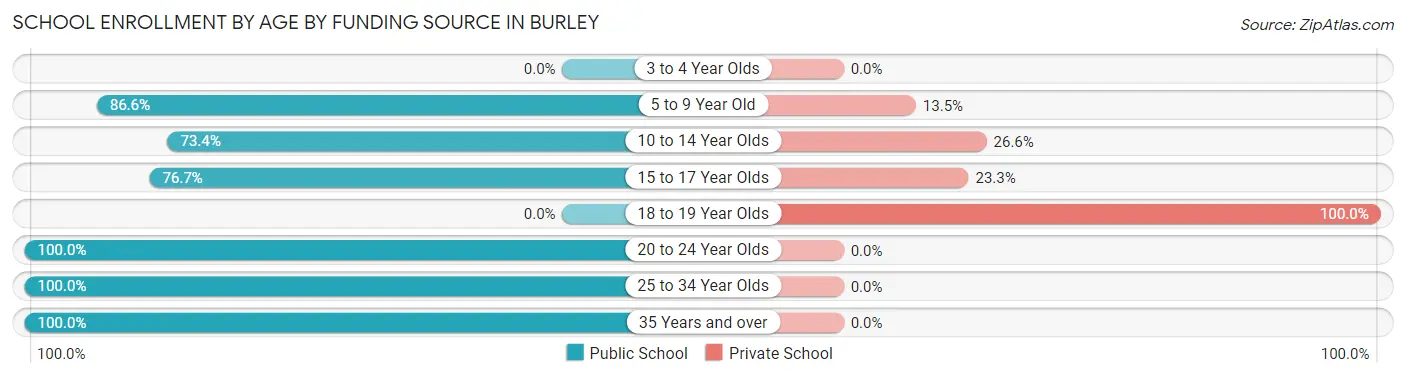
| Age Bracket | Public School | Private School |
| 3 to 4 Year Olds | 0 (0.0%) | 0 (0.0%) |
| 5 to 9 Year Old | 296 (86.6%) | 46 (13.5%) |
| 10 to 14 Year Olds | 102 (73.4%) | 37 (26.6%) |
| 15 to 17 Year Olds | 99 (76.7%) | 30 (23.3%) |
| 18 to 19 Year Olds | 0 (0.0%) | 6 (100.0%) |
| 20 to 24 Year Olds | 8 (100.0%) | 0 (0.0%) |
| 25 to 34 Year Olds | 16 (100.0%) | 0 (0.0%) |
| 35 Years and over | 41 (100.0%) | 0 (0.0%) |
| Total | 562 (82.5%) | 119 (17.5%) |
Educational Attainment by Field of Study in Burley
Engineering (114 | 19.8%), computers & mathematics (83 | 14.4%), social sciences (83 | 14.4%), arts & humanities (59 | 10.2%), and communications (57 | 9.9%) are the most common fields of study among 577 individuals in Burley who have obtained a bachelor's degree or higher.
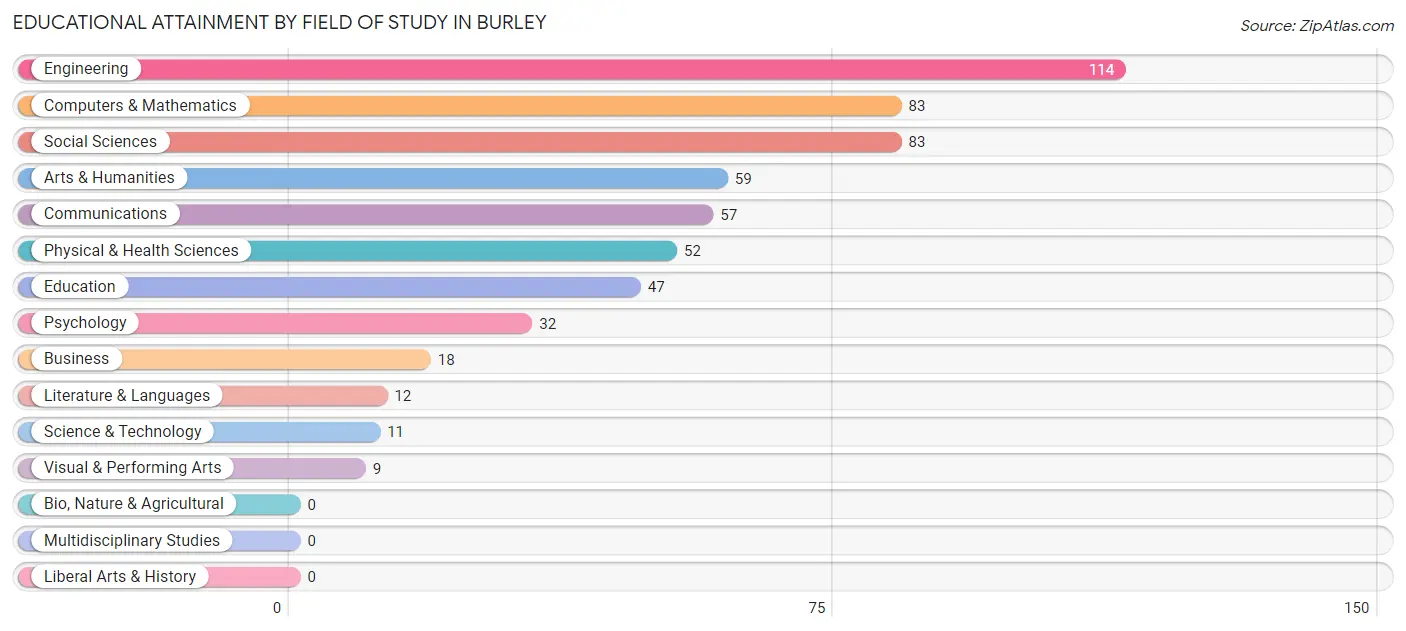
| Field of Study | # Graduates | % Graduates |
| Computers & Mathematics | 83 | 14.4% |
| Bio, Nature & Agricultural | 0 | 0.0% |
| Physical & Health Sciences | 52 | 9.0% |
| Psychology | 32 | 5.6% |
| Social Sciences | 83 | 14.4% |
| Engineering | 114 | 19.8% |
| Multidisciplinary Studies | 0 | 0.0% |
| Science & Technology | 11 | 1.9% |
| Business | 18 | 3.1% |
| Education | 47 | 8.2% |
| Literature & Languages | 12 | 2.1% |
| Liberal Arts & History | 0 | 0.0% |
| Visual & Performing Arts | 9 | 1.6% |
| Communications | 57 | 9.9% |
| Arts & Humanities | 59 | 10.2% |
| Total | 577 | 100.0% |
Transportation & Commute in Burley
Vehicle Availability by Sex in Burley
The most prevalent vehicle ownership categories in Burley are males with 3 vehicles (288, accounting for 43.0%) and females with 3 vehicles (65, making up 69.4%).
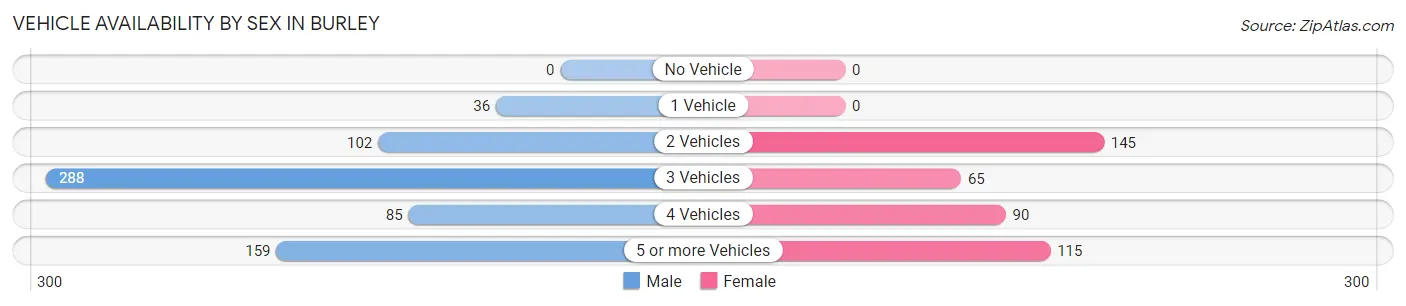
| Vehicles Available | Male | Female |
| No Vehicle | 0 (0.0%) | 0 (0.0%) |
| 1 Vehicle | 36 (5.4%) | 0 (0.0%) |
| 2 Vehicles | 102 (15.2%) | 145 (34.9%) |
| 3 Vehicles | 288 (43.0%) | 65 (15.7%) |
| 4 Vehicles | 85 (12.7%) | 90 (21.7%) |
| 5 or more Vehicles | 159 (23.7%) | 115 (27.7%) |
| Total | 670 (100.0%) | 415 (100.0%) |
Commute Time in Burley
The most frequently occuring commute durations in Burley are 10 to 14 minutes (199 commuters, 21.3%), 30 to 34 minutes (183 commuters, 19.6%), and 15 to 19 minutes (113 commuters, 12.1%).
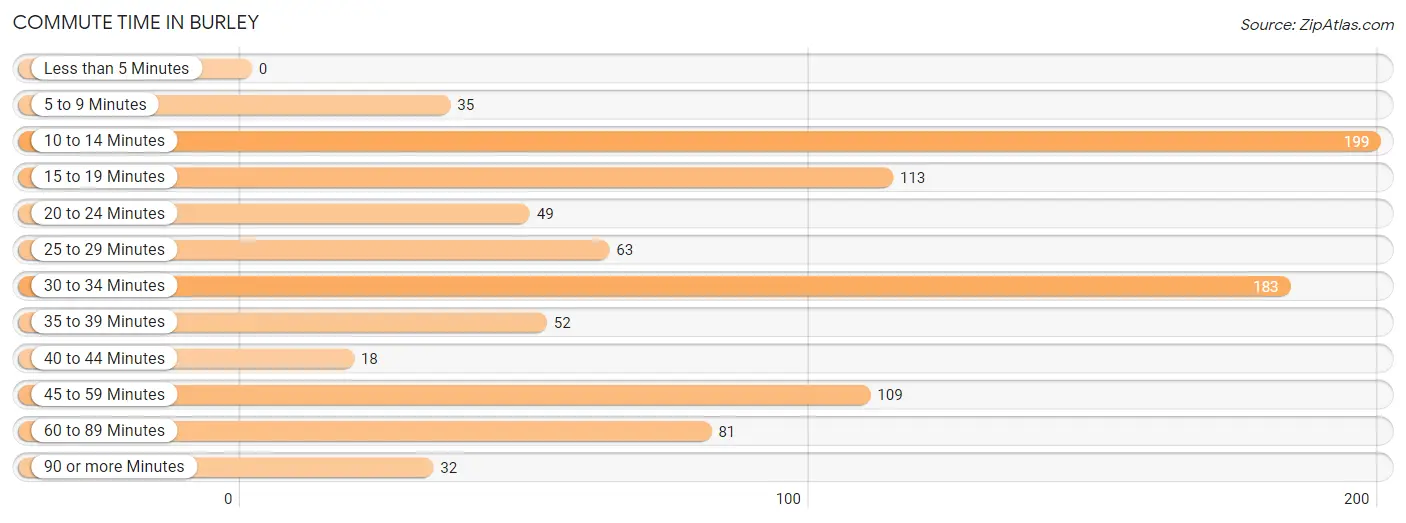
| Commute Time | # Commuters | % Commuters |
| Less than 5 Minutes | 0 | 0.0% |
| 5 to 9 Minutes | 35 | 3.7% |
| 10 to 14 Minutes | 199 | 21.3% |
| 15 to 19 Minutes | 113 | 12.1% |
| 20 to 24 Minutes | 49 | 5.2% |
| 25 to 29 Minutes | 63 | 6.8% |
| 30 to 34 Minutes | 183 | 19.6% |
| 35 to 39 Minutes | 52 | 5.6% |
| 40 to 44 Minutes | 18 | 1.9% |
| 45 to 59 Minutes | 109 | 11.7% |
| 60 to 89 Minutes | 81 | 8.7% |
| 90 or more Minutes | 32 | 3.4% |
Commute Time by Sex in Burley
The most common commute times in Burley are 30 to 34 minutes (154 commuters, 27.8%) for males and 10 to 14 minutes (149 commuters, 39.2%) for females.
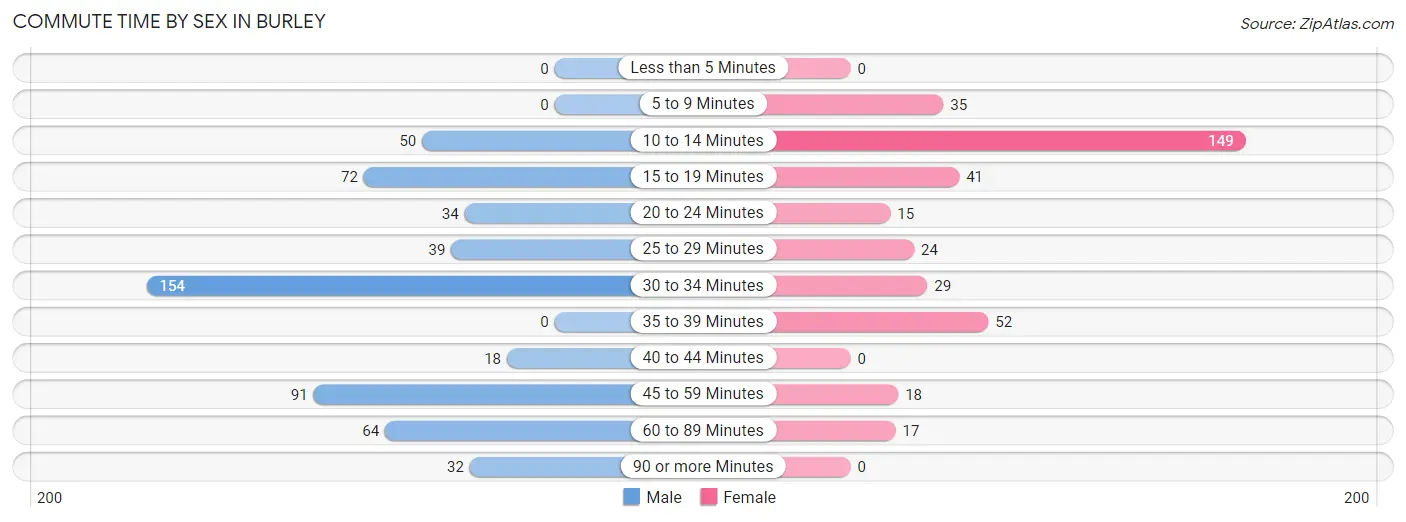
| Commute Time | Male | Female |
| Less than 5 Minutes | 0 (0.0%) | 0 (0.0%) |
| 5 to 9 Minutes | 0 (0.0%) | 35 (9.2%) |
| 10 to 14 Minutes | 50 (9.0%) | 149 (39.2%) |
| 15 to 19 Minutes | 72 (13.0%) | 41 (10.8%) |
| 20 to 24 Minutes | 34 (6.1%) | 15 (4.0%) |
| 25 to 29 Minutes | 39 (7.0%) | 24 (6.3%) |
| 30 to 34 Minutes | 154 (27.8%) | 29 (7.6%) |
| 35 to 39 Minutes | 0 (0.0%) | 52 (13.7%) |
| 40 to 44 Minutes | 18 (3.3%) | 0 (0.0%) |
| 45 to 59 Minutes | 91 (16.4%) | 18 (4.7%) |
| 60 to 89 Minutes | 64 (11.6%) | 17 (4.5%) |
| 90 or more Minutes | 32 (5.8%) | 0 (0.0%) |
Time of Departure to Work by Sex in Burley
The most frequent times of departure to work in Burley are 5:00 AM to 5:29 AM (178, 32.1%) for males and 7:00 AM to 7:29 AM (136, 35.8%) for females.
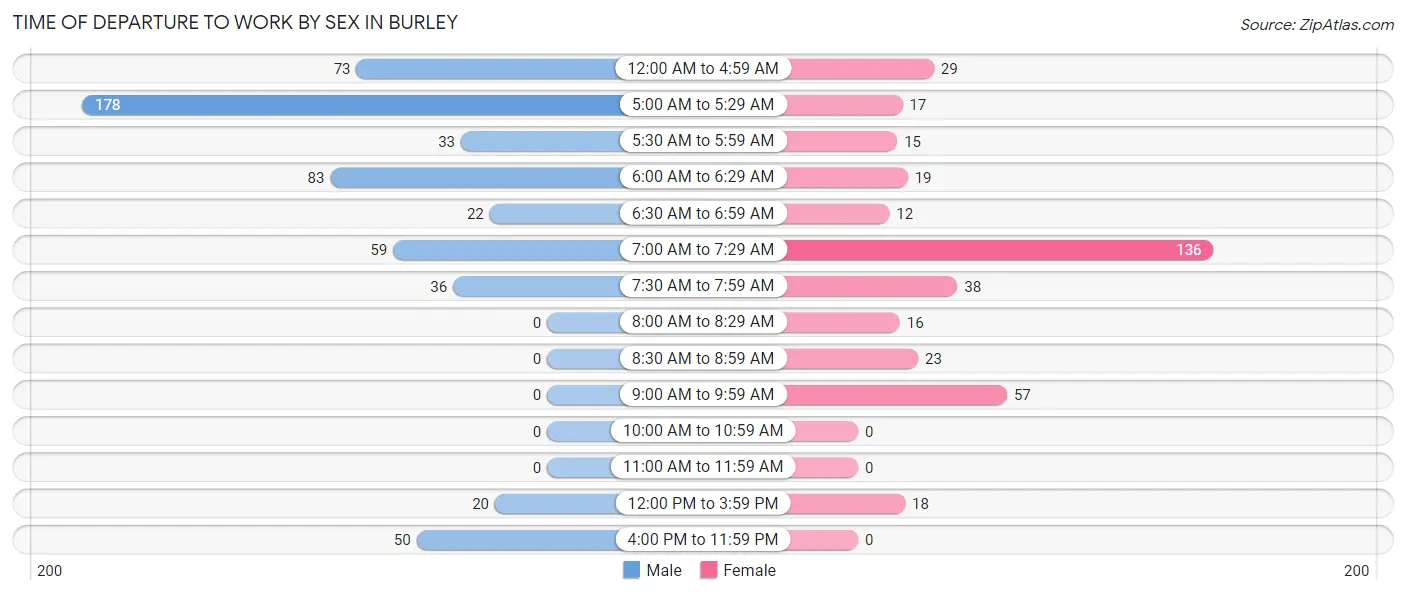
| Time of Departure | Male | Female |
| 12:00 AM to 4:59 AM | 73 (13.2%) | 29 (7.6%) |
| 5:00 AM to 5:29 AM | 178 (32.1%) | 17 (4.5%) |
| 5:30 AM to 5:59 AM | 33 (6.0%) | 15 (4.0%) |
| 6:00 AM to 6:29 AM | 83 (15.0%) | 19 (5.0%) |
| 6:30 AM to 6:59 AM | 22 (4.0%) | 12 (3.2%) |
| 7:00 AM to 7:29 AM | 59 (10.6%) | 136 (35.8%) |
| 7:30 AM to 7:59 AM | 36 (6.5%) | 38 (10.0%) |
| 8:00 AM to 8:29 AM | 0 (0.0%) | 16 (4.2%) |
| 8:30 AM to 8:59 AM | 0 (0.0%) | 23 (6.0%) |
| 9:00 AM to 9:59 AM | 0 (0.0%) | 57 (15.0%) |
| 10:00 AM to 10:59 AM | 0 (0.0%) | 0 (0.0%) |
| 11:00 AM to 11:59 AM | 0 (0.0%) | 0 (0.0%) |
| 12:00 PM to 3:59 PM | 20 (3.6%) | 18 (4.7%) |
| 4:00 PM to 11:59 PM | 50 (9.0%) | 0 (0.0%) |
| Total | 554 (100.0%) | 380 (100.0%) |
Housing Occupancy in Burley
Occupancy by Ownership in Burley
Of the total 880 dwellings in Burley, owner-occupied units account for 658 (74.8%), while renter-occupied units make up 222 (25.2%).
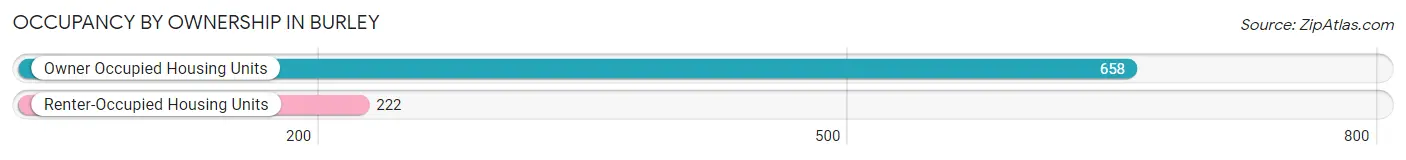
| Occupancy | # Housing Units | % Housing Units |
| Owner Occupied Housing Units | 658 | 74.8% |
| Renter-Occupied Housing Units | 222 | 25.2% |
| Total Occupied Housing Units | 880 | 100.0% |
Occupancy by Household Size in Burley
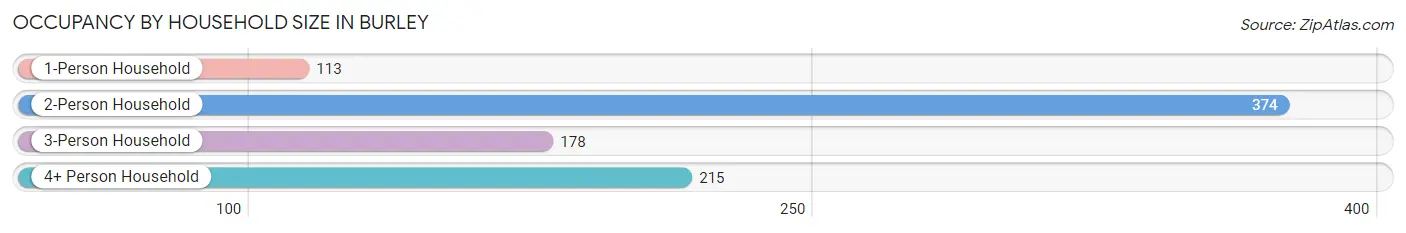
| Household Size | # Housing Units | % Housing Units |
| 1-Person Household | 113 | 12.8% |
| 2-Person Household | 374 | 42.5% |
| 3-Person Household | 178 | 20.2% |
| 4+ Person Household | 215 | 24.4% |
| Total Housing Units | 880 | 100.0% |
Occupancy by Ownership by Household Size in Burley
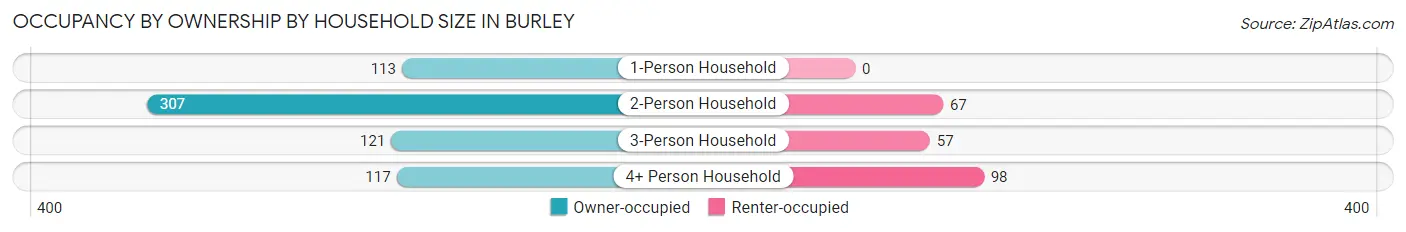
| Household Size | Owner-occupied | Renter-occupied |
| 1-Person Household | 113 (100.0%) | 0 (0.0%) |
| 2-Person Household | 307 (82.1%) | 67 (17.9%) |
| 3-Person Household | 121 (68.0%) | 57 (32.0%) |
| 4+ Person Household | 117 (54.4%) | 98 (45.6%) |
| Total Housing Units | 658 (74.8%) | 222 (25.2%) |
Occupancy by Educational Attainment in Burley
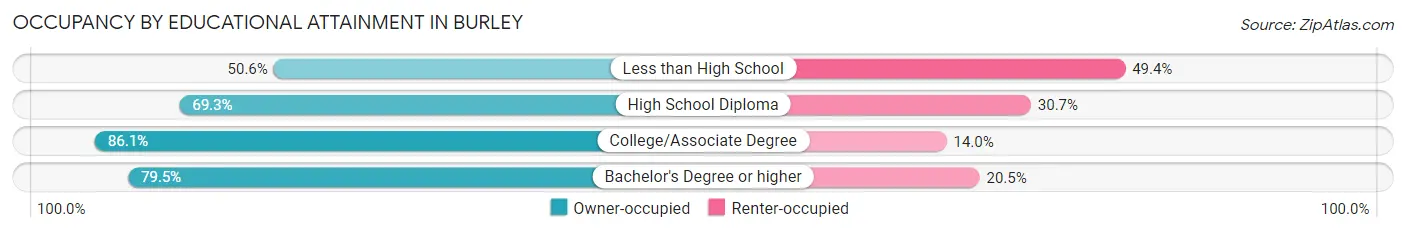
| Household Size | Owner-occupied | Renter-occupied |
| Less than High School | 80 (50.6%) | 78 (49.4%) |
| High School Diploma | 104 (69.3%) | 46 (30.7%) |
| College/Associate Degree | 253 (86.1%) | 41 (14.0%) |
| Bachelor's Degree or higher | 221 (79.5%) | 57 (20.5%) |
Occupancy by Age of Householder in Burley
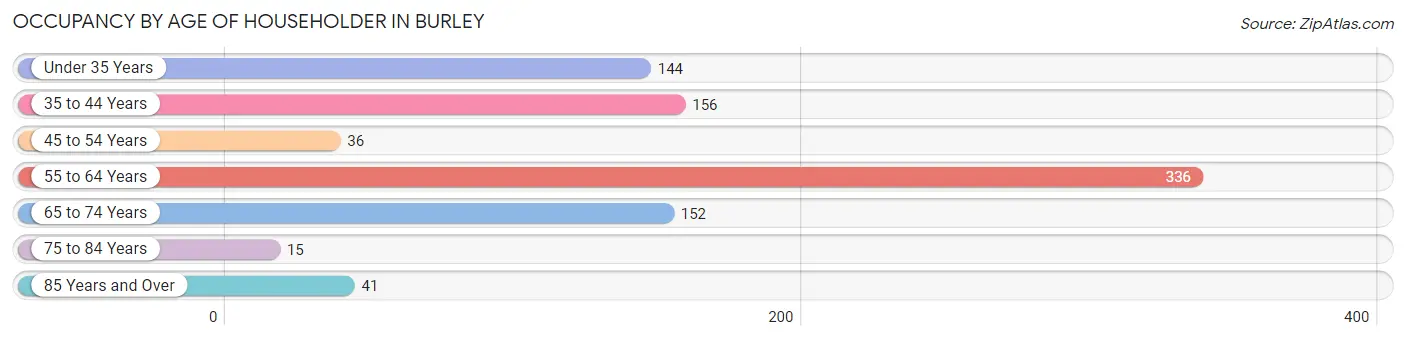
| Age Bracket | # Households | % Households |
| Under 35 Years | 144 | 16.4% |
| 35 to 44 Years | 156 | 17.7% |
| 45 to 54 Years | 36 | 4.1% |
| 55 to 64 Years | 336 | 38.2% |
| 65 to 74 Years | 152 | 17.3% |
| 75 to 84 Years | 15 | 1.7% |
| 85 Years and Over | 41 | 4.7% |
| Total | 880 | 100.0% |
Housing Finances in Burley
Median Income by Occupancy in Burley
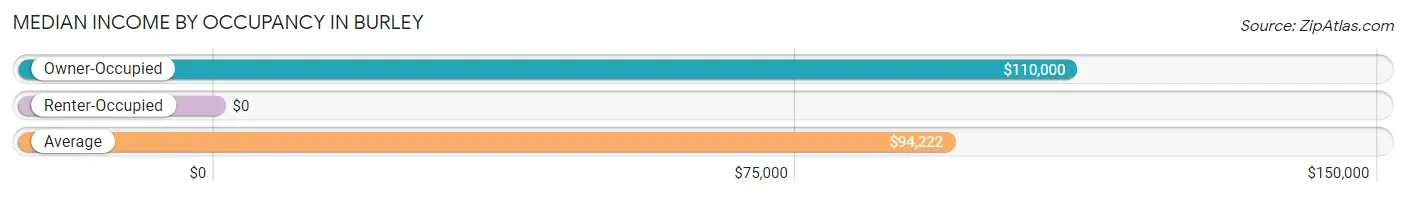
| Occupancy Type | # Households | Median Income |
| Owner-Occupied | 658 (74.8%) | $110,000 |
| Renter-Occupied | 222 (25.2%) | $0 |
| Average | 880 (100.0%) | $94,222 |
Occupancy by Householder Income Bracket in Burley
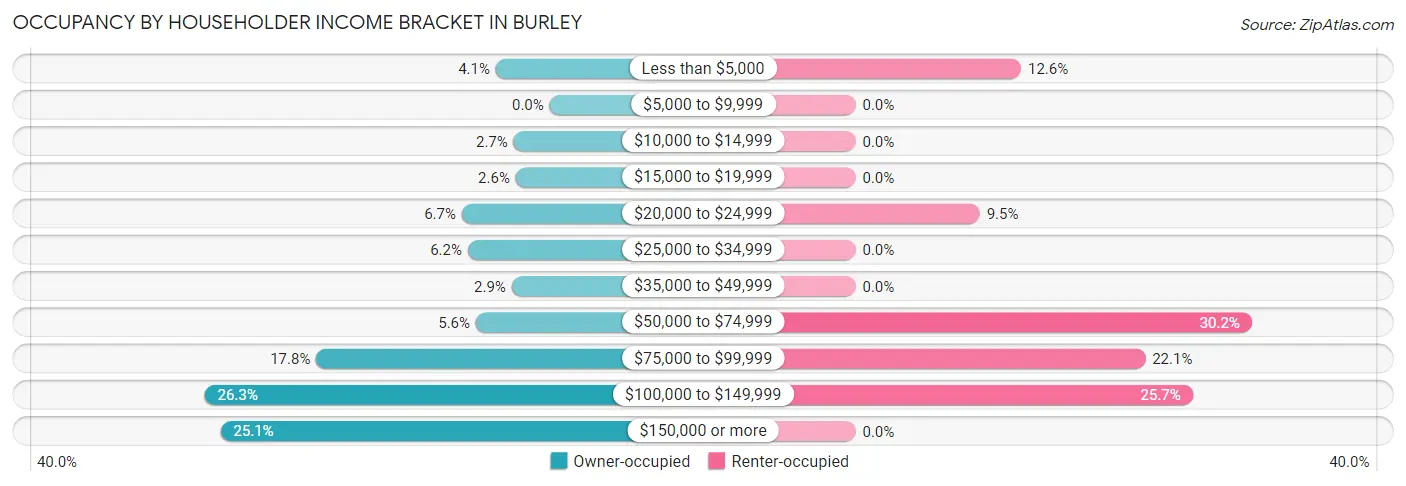
| Income Bracket | Owner-occupied | Renter-occupied |
| Less than $5,000 | 27 (4.1%) | 28 (12.6%) |
| $5,000 to $9,999 | 0 (0.0%) | 0 (0.0%) |
| $10,000 to $14,999 | 18 (2.7%) | 0 (0.0%) |
| $15,000 to $19,999 | 17 (2.6%) | 0 (0.0%) |
| $20,000 to $24,999 | 44 (6.7%) | 21 (9.5%) |
| $25,000 to $34,999 | 41 (6.2%) | 0 (0.0%) |
| $35,000 to $49,999 | 19 (2.9%) | 0 (0.0%) |
| $50,000 to $74,999 | 37 (5.6%) | 67 (30.2%) |
| $75,000 to $99,999 | 117 (17.8%) | 49 (22.1%) |
| $100,000 to $149,999 | 173 (26.3%) | 57 (25.7%) |
| $150,000 or more | 165 (25.1%) | 0 (0.0%) |
| Total | 658 (100.0%) | 222 (100.0%) |
Monthly Housing Cost Tiers in Burley
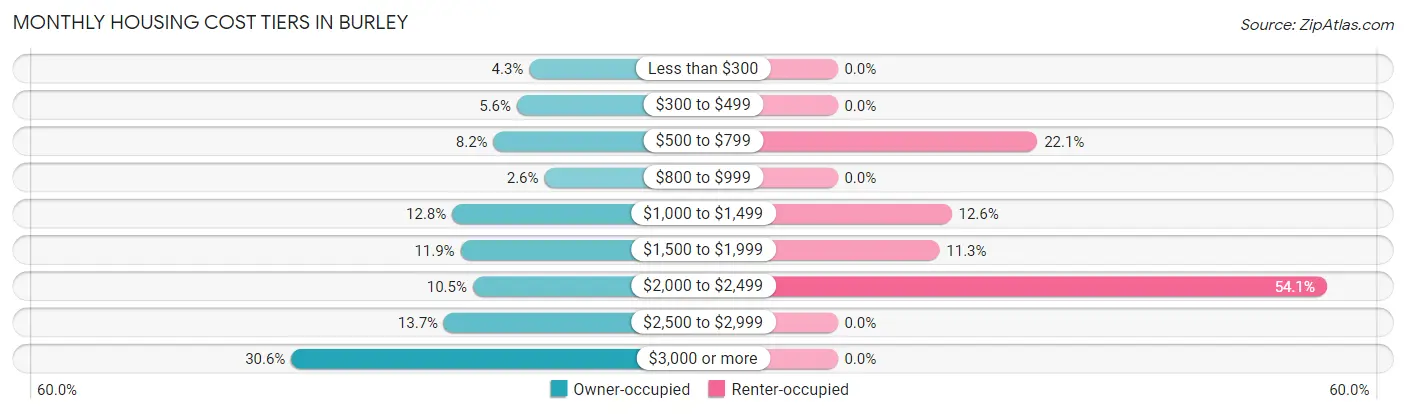
| Monthly Cost | Owner-occupied | Renter-occupied |
| Less than $300 | 28 (4.3%) | 0 (0.0%) |
| $300 to $499 | 37 (5.6%) | 0 (0.0%) |
| $500 to $799 | 54 (8.2%) | 49 (22.1%) |
| $800 to $999 | 17 (2.6%) | 0 (0.0%) |
| $1,000 to $1,499 | 84 (12.8%) | 28 (12.6%) |
| $1,500 to $1,999 | 78 (11.8%) | 25 (11.3%) |
| $2,000 to $2,499 | 69 (10.5%) | 120 (54.0%) |
| $2,500 to $2,999 | 90 (13.7%) | 0 (0.0%) |
| $3,000 or more | 201 (30.5%) | 0 (0.0%) |
| Total | 658 (100.0%) | 222 (100.0%) |
Physical Housing Characteristics in Burley
Housing Structures in Burley
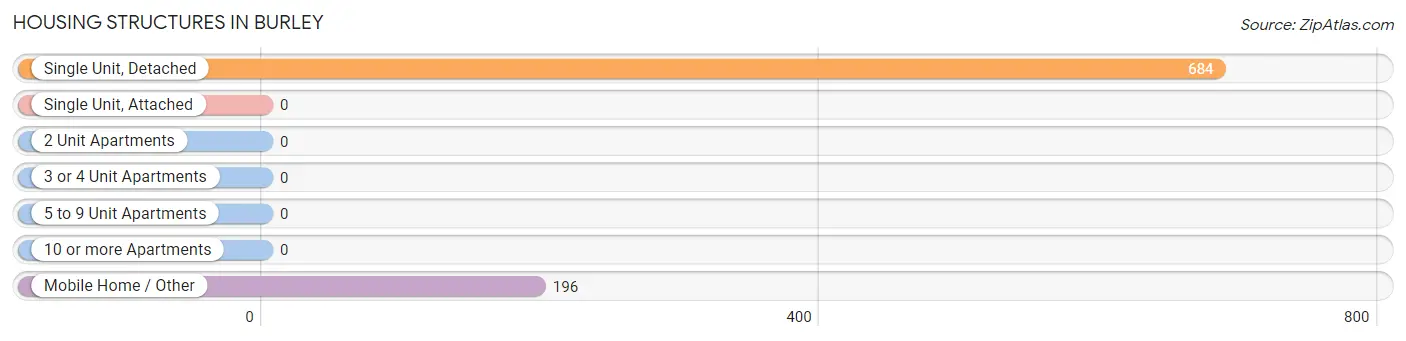
| Structure Type | # Housing Units | % Housing Units |
| Single Unit, Detached | 684 | 77.7% |
| Single Unit, Attached | 0 | 0.0% |
| 2 Unit Apartments | 0 | 0.0% |
| 3 or 4 Unit Apartments | 0 | 0.0% |
| 5 to 9 Unit Apartments | 0 | 0.0% |
| 10 or more Apartments | 0 | 0.0% |
| Mobile Home / Other | 196 | 22.3% |
| Total | 880 | 100.0% |
Housing Structures by Occupancy in Burley
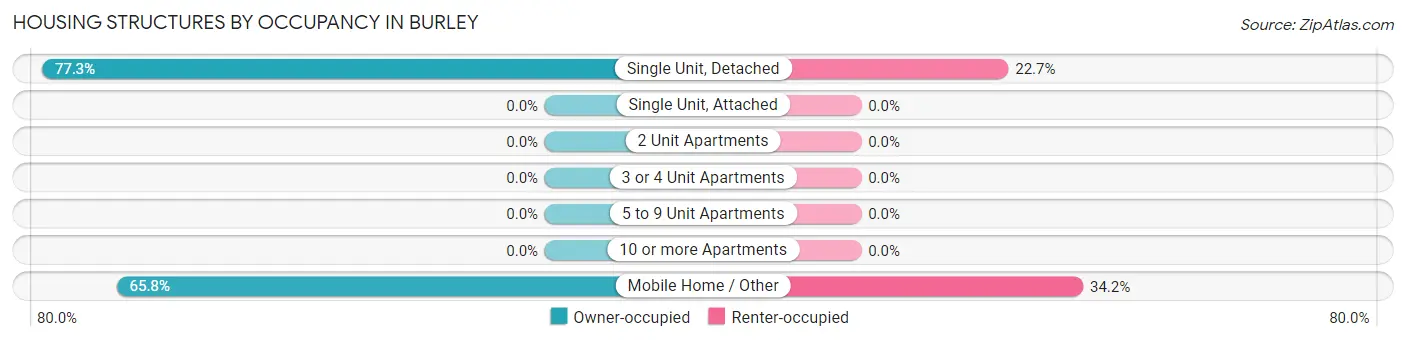
| Structure Type | Owner-occupied | Renter-occupied |
| Single Unit, Detached | 529 (77.3%) | 155 (22.7%) |
| Single Unit, Attached | 0 (0.0%) | 0 (0.0%) |
| 2 Unit Apartments | 0 (0.0%) | 0 (0.0%) |
| 3 or 4 Unit Apartments | 0 (0.0%) | 0 (0.0%) |
| 5 to 9 Unit Apartments | 0 (0.0%) | 0 (0.0%) |
| 10 or more Apartments | 0 (0.0%) | 0 (0.0%) |
| Mobile Home / Other | 129 (65.8%) | 67 (34.2%) |
| Total | 658 (74.8%) | 222 (25.2%) |
Housing Structures by Number of Rooms in Burley
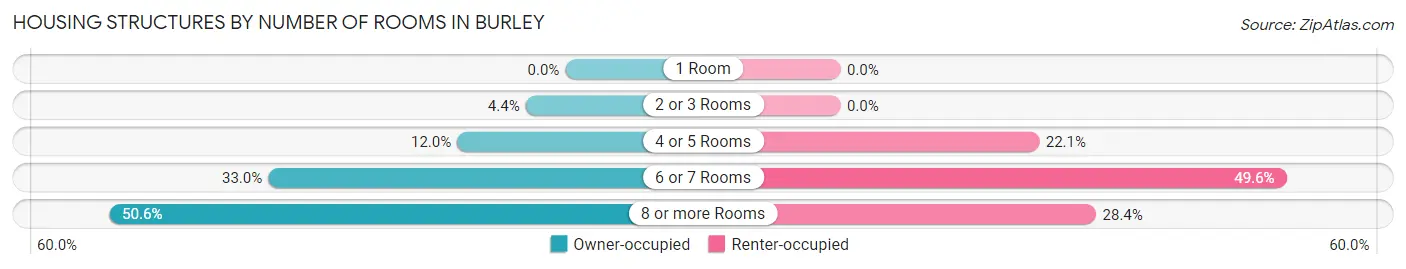
| Number of Rooms | Owner-occupied | Renter-occupied |
| 1 Room | 0 (0.0%) | 0 (0.0%) |
| 2 or 3 Rooms | 29 (4.4%) | 0 (0.0%) |
| 4 or 5 Rooms | 79 (12.0%) | 49 (22.1%) |
| 6 or 7 Rooms | 217 (33.0%) | 110 (49.5%) |
| 8 or more Rooms | 333 (50.6%) | 63 (28.4%) |
| Total | 658 (100.0%) | 222 (100.0%) |
Housing Structure by Heating Type in Burley
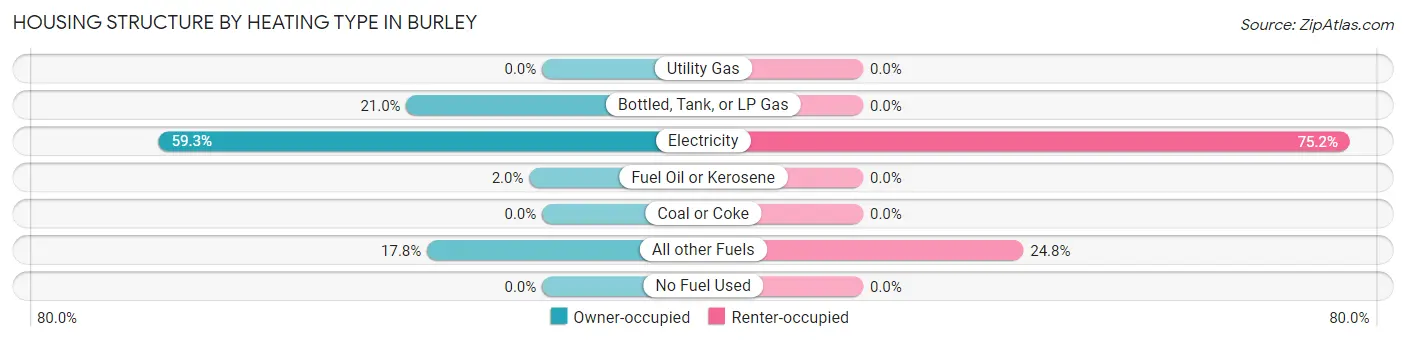
| Heating Type | Owner-occupied | Renter-occupied |
| Utility Gas | 0 (0.0%) | 0 (0.0%) |
| Bottled, Tank, or LP Gas | 138 (21.0%) | 0 (0.0%) |
| Electricity | 390 (59.3%) | 167 (75.2%) |
| Fuel Oil or Kerosene | 13 (2.0%) | 0 (0.0%) |
| Coal or Coke | 0 (0.0%) | 0 (0.0%) |
| All other Fuels | 117 (17.8%) | 55 (24.8%) |
| No Fuel Used | 0 (0.0%) | 0 (0.0%) |
| Total | 658 (100.0%) | 222 (100.0%) |
Household Vehicle Usage in Burley
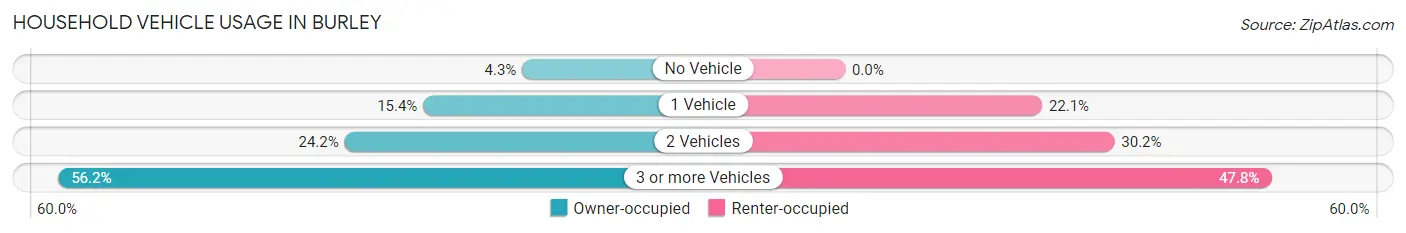
| Vehicles per Household | Owner-occupied | Renter-occupied |
| No Vehicle | 28 (4.3%) | 0 (0.0%) |
| 1 Vehicle | 101 (15.3%) | 49 (22.1%) |
| 2 Vehicles | 159 (24.2%) | 67 (30.2%) |
| 3 or more Vehicles | 370 (56.2%) | 106 (47.7%) |
| Total | 658 (100.0%) | 222 (100.0%) |
Real Estate & Mortgages in Burley
Real Estate and Mortgage Overview in Burley
| Characteristic | Without Mortgage | With Mortgage |
| Housing Units | 143 | 515 |
| Median Property Value | $527,400 | $505,000 |
| Median Household Income | $22,074 | $161 |
| Monthly Housing Costs | $563 | $201 |
| Real Estate Taxes | - | - |
Property Value by Mortgage Status in Burley
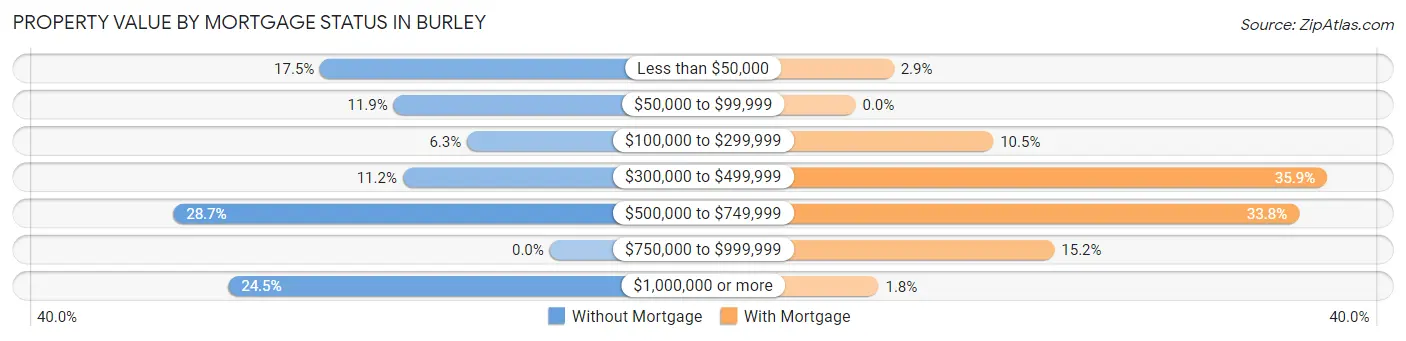
| Property Value | Without Mortgage | With Mortgage |
| Less than $50,000 | 25 (17.5%) | 15 (2.9%) |
| $50,000 to $99,999 | 17 (11.9%) | 0 (0.0%) |
| $100,000 to $299,999 | 9 (6.3%) | 54 (10.5%) |
| $300,000 to $499,999 | 16 (11.2%) | 185 (35.9%) |
| $500,000 to $749,999 | 41 (28.7%) | 174 (33.8%) |
| $750,000 to $999,999 | 0 (0.0%) | 78 (15.1%) |
| $1,000,000 or more | 35 (24.5%) | 9 (1.8%) |
| Total | 143 (100.0%) | 515 (100.0%) |
Household Income by Mortgage Status in Burley
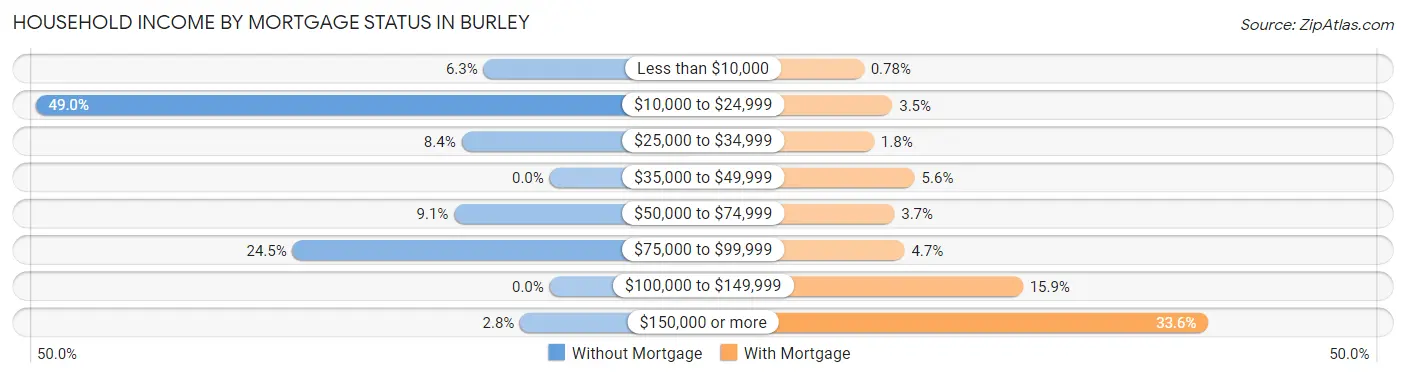
| Household Income | Without Mortgage | With Mortgage |
| Less than $10,000 | 9 (6.3%) | 4 (0.8%) |
| $10,000 to $24,999 | 70 (48.9%) | 18 (3.5%) |
| $25,000 to $34,999 | 12 (8.4%) | 9 (1.8%) |
| $35,000 to $49,999 | 0 (0.0%) | 29 (5.6%) |
| $50,000 to $74,999 | 13 (9.1%) | 19 (3.7%) |
| $75,000 to $99,999 | 35 (24.5%) | 24 (4.7%) |
| $100,000 to $149,999 | 0 (0.0%) | 82 (15.9%) |
| $150,000 or more | 4 (2.8%) | 173 (33.6%) |
| Total | 143 (100.0%) | 515 (100.0%) |
Property Value to Household Income Ratio in Burley
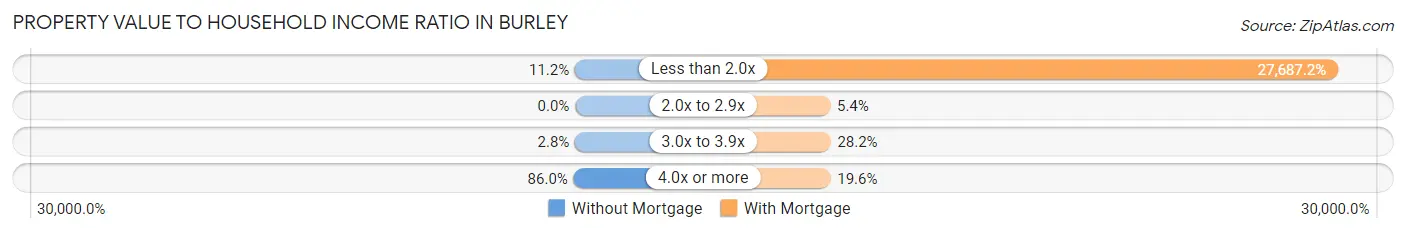
| Value-to-Income Ratio | Without Mortgage | With Mortgage |
| Less than 2.0x | 16 (11.2%) | 142,589 (27,687.2%) |
| 2.0x to 2.9x | 0 (0.0%) | 28 (5.4%) |
| 3.0x to 3.9x | 4 (2.8%) | 145 (28.2%) |
| 4.0x or more | 123 (86.0%) | 101 (19.6%) |
| Total | 143 (100.0%) | 515 (100.0%) |
Real Estate Taxes by Mortgage Status in Burley
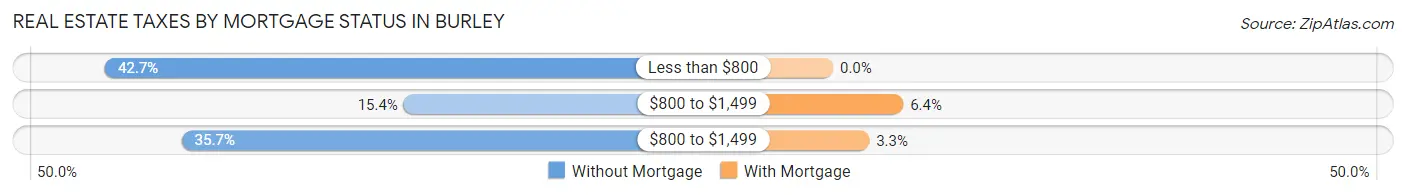
| Property Taxes | Without Mortgage | With Mortgage |
| Less than $800 | 61 (42.7%) | 0 (0.0%) |
| $800 to $1,499 | 22 (15.4%) | 33 (6.4%) |
| $800 to $1,499 | 51 (35.7%) | 17 (3.3%) |
| Total | 143 (100.0%) | 515 (100.0%) |
Health & Disability in Burley
Health Insurance Coverage by Age in Burley
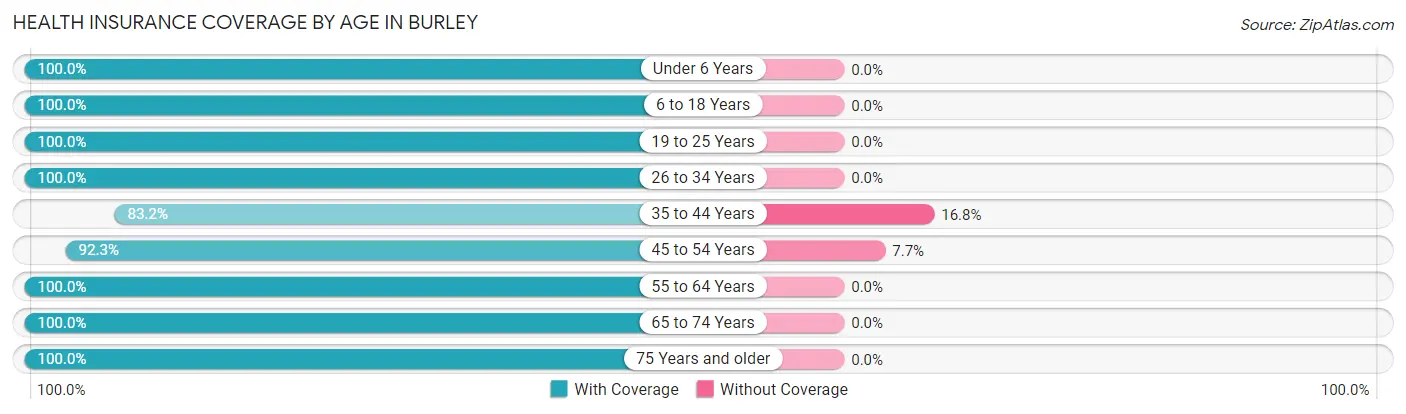
| Age Bracket | With Coverage | Without Coverage |
| Under 6 Years | 144 (100.0%) | 0 (0.0%) |
| 6 to 18 Years | 578 (100.0%) | 0 (0.0%) |
| 19 to 25 Years | 171 (100.0%) | 0 (0.0%) |
| 26 to 34 Years | 340 (100.0%) | 0 (0.0%) |
| 35 to 44 Years | 243 (83.2%) | 49 (16.8%) |
| 45 to 54 Years | 241 (92.3%) | 20 (7.7%) |
| 55 to 64 Years | 557 (100.0%) | 0 (0.0%) |
| 65 to 74 Years | 246 (100.0%) | 0 (0.0%) |
| 75 Years and older | 219 (100.0%) | 0 (0.0%) |
| Total | 2,739 (97.5%) | 69 (2.5%) |
Health Insurance Coverage by Citizenship Status in Burley
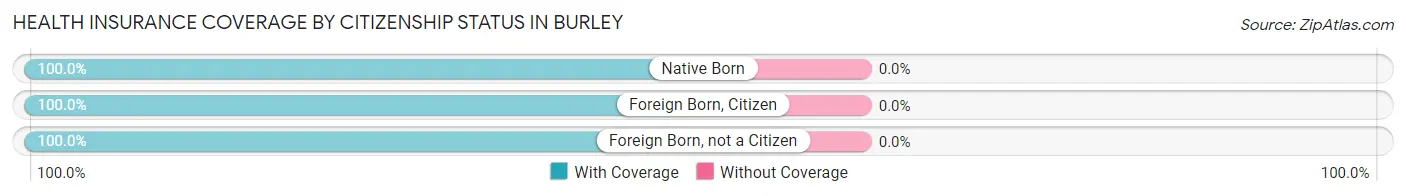
| Citizenship Status | With Coverage | Without Coverage |
| Native Born | 144 (100.0%) | 0 (0.0%) |
| Foreign Born, Citizen | 578 (100.0%) | 0 (0.0%) |
| Foreign Born, not a Citizen | 171 (100.0%) | 0 (0.0%) |
Health Insurance Coverage by Household Income in Burley
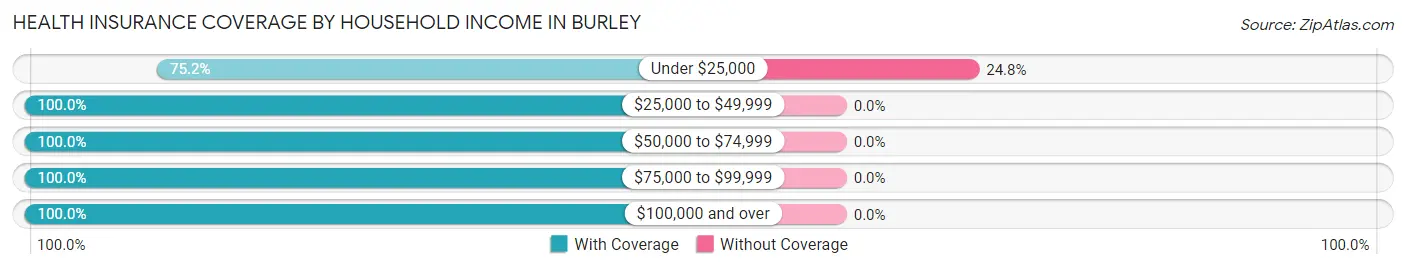
| Household Income | With Coverage | Without Coverage |
| Under $25,000 | 209 (75.2%) | 69 (24.8%) |
| $25,000 to $49,999 | 79 (100.0%) | 0 (0.0%) |
| $50,000 to $74,999 | 313 (100.0%) | 0 (0.0%) |
| $75,000 to $99,999 | 630 (100.0%) | 0 (0.0%) |
| $100,000 and over | 1,508 (100.0%) | 0 (0.0%) |
Public vs Private Health Insurance Coverage by Age in Burley
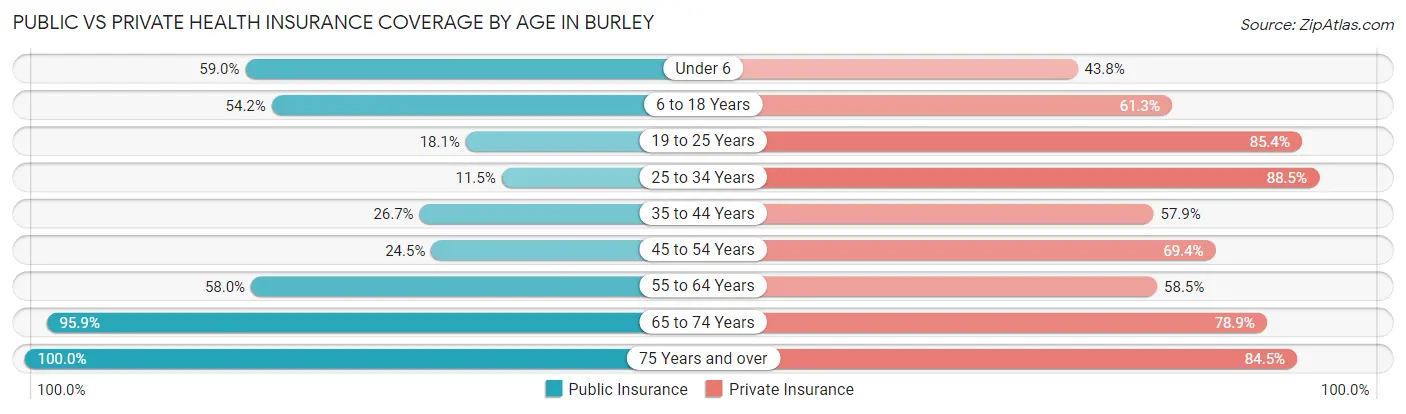
| Age Bracket | Public Insurance | Private Insurance |
| Under 6 | 85 (59.0%) | 63 (43.8%) |
| 6 to 18 Years | 313 (54.1%) | 354 (61.3%) |
| 19 to 25 Years | 31 (18.1%) | 146 (85.4%) |
| 25 to 34 Years | 39 (11.5%) | 301 (88.5%) |
| 35 to 44 Years | 78 (26.7%) | 169 (57.9%) |
| 45 to 54 Years | 64 (24.5%) | 181 (69.4%) |
| 55 to 64 Years | 323 (58.0%) | 326 (58.5%) |
| 65 to 74 Years | 236 (95.9%) | 194 (78.9%) |
| 75 Years and over | 219 (100.0%) | 185 (84.5%) |
| Total | 1,388 (49.4%) | 1,919 (68.3%) |
Disability Status by Sex by Age in Burley
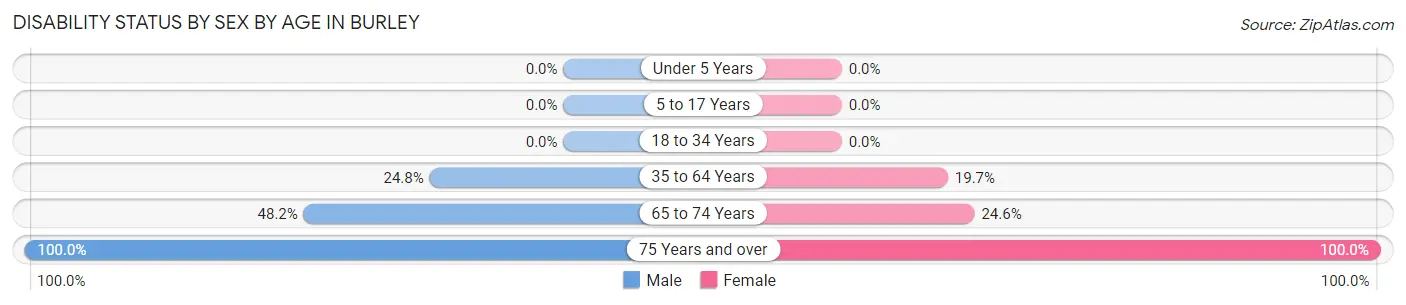
| Age Bracket | Male | Female |
| Under 5 Years | 0 (0.0%) | 0 (0.0%) |
| 5 to 17 Years | 0 (0.0%) | 0 (0.0%) |
| 18 to 34 Years | 0 (0.0%) | 0 (0.0%) |
| 35 to 64 Years | 147 (24.8%) | 102 (19.7%) |
| 65 to 74 Years | 54 (48.2%) | 33 (24.6%) |
| 75 Years and over | 29 (100.0%) | 190 (100.0%) |
Disability Class by Sex by Age in Burley
Disability Class: Hearing Difficulty
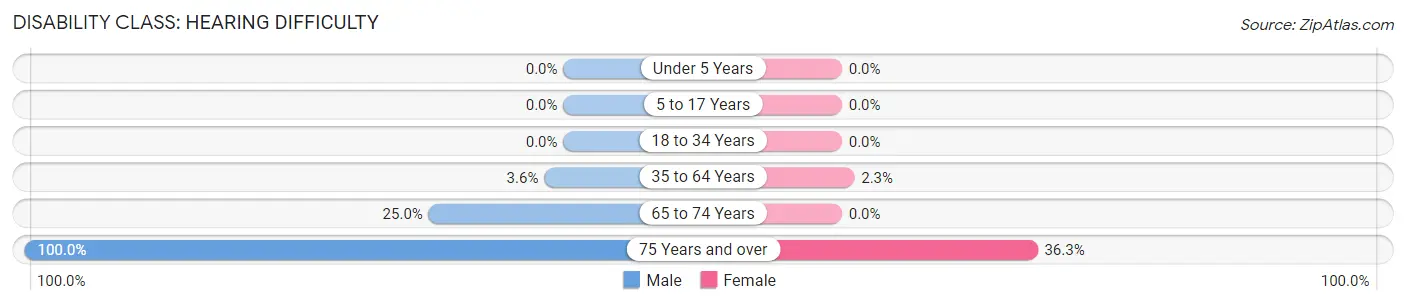
| Age Bracket | Male | Female |
| Under 5 Years | 0 (0.0%) | 0 (0.0%) |
| 5 to 17 Years | 0 (0.0%) | 0 (0.0%) |
| 18 to 34 Years | 0 (0.0%) | 0 (0.0%) |
| 35 to 64 Years | 21 (3.5%) | 12 (2.3%) |
| 65 to 74 Years | 28 (25.0%) | 0 (0.0%) |
| 75 Years and over | 29 (100.0%) | 69 (36.3%) |
Disability Class: Vision Difficulty
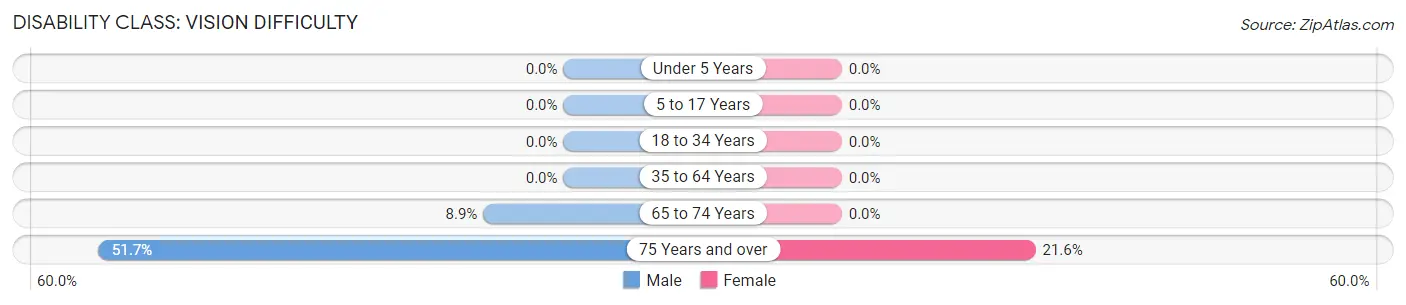
| Age Bracket | Male | Female |
| Under 5 Years | 0 (0.0%) | 0 (0.0%) |
| 5 to 17 Years | 0 (0.0%) | 0 (0.0%) |
| 18 to 34 Years | 0 (0.0%) | 0 (0.0%) |
| 35 to 64 Years | 0 (0.0%) | 0 (0.0%) |
| 65 to 74 Years | 10 (8.9%) | 0 (0.0%) |
| 75 Years and over | 15 (51.7%) | 41 (21.6%) |
Disability Class: Cognitive Difficulty
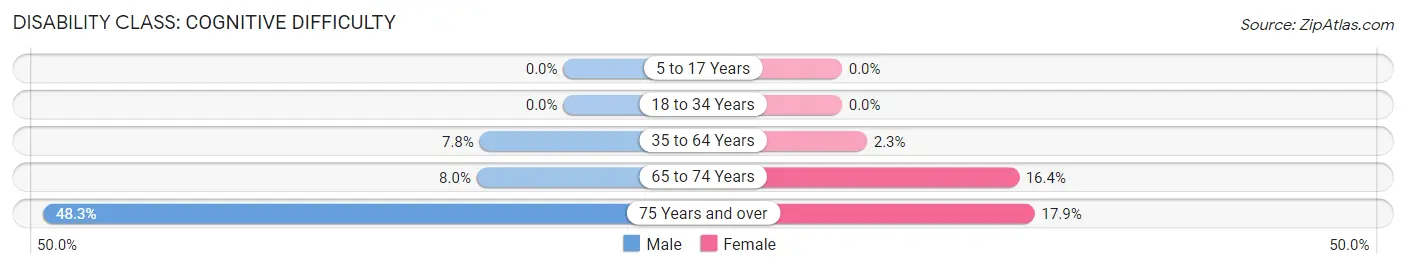
| Age Bracket | Male | Female |
| 5 to 17 Years | 0 (0.0%) | 0 (0.0%) |
| 18 to 34 Years | 0 (0.0%) | 0 (0.0%) |
| 35 to 64 Years | 46 (7.8%) | 12 (2.3%) |
| 65 to 74 Years | 9 (8.0%) | 22 (16.4%) |
| 75 Years and over | 14 (48.3%) | 34 (17.9%) |
Disability Class: Ambulatory Difficulty
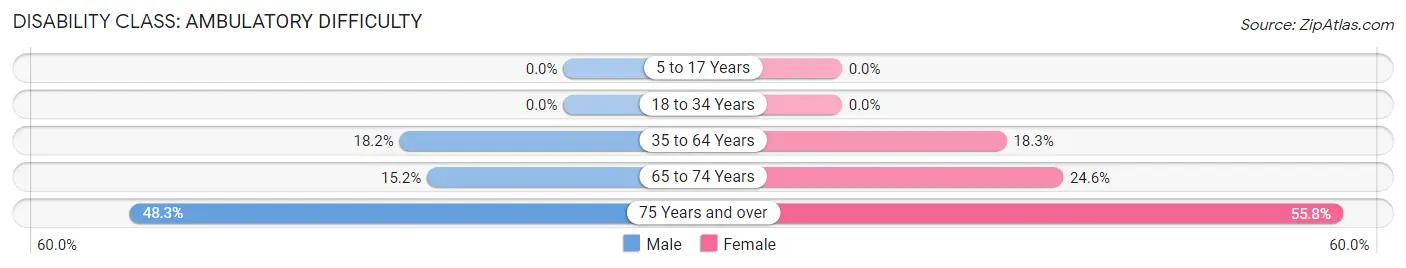
| Age Bracket | Male | Female |
| 5 to 17 Years | 0 (0.0%) | 0 (0.0%) |
| 18 to 34 Years | 0 (0.0%) | 0 (0.0%) |
| 35 to 64 Years | 108 (18.2%) | 95 (18.3%) |
| 65 to 74 Years | 17 (15.2%) | 33 (24.6%) |
| 75 Years and over | 14 (48.3%) | 106 (55.8%) |
Disability Class: Self-Care Difficulty
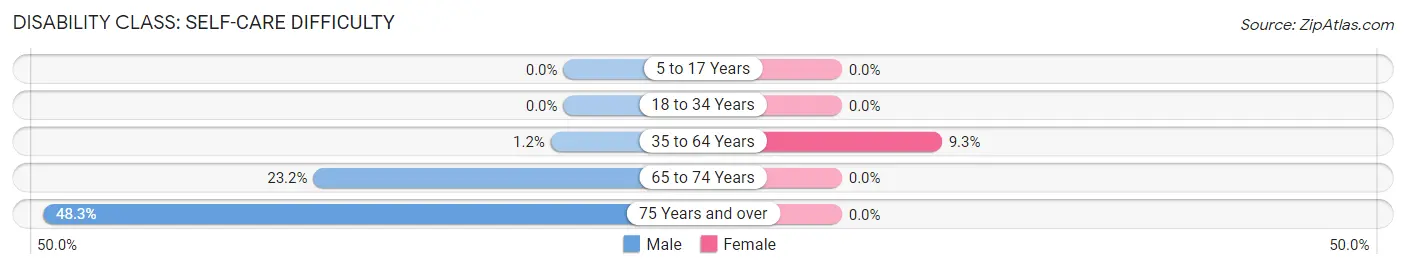
| Age Bracket | Male | Female |
| 5 to 17 Years | 0 (0.0%) | 0 (0.0%) |
| 18 to 34 Years | 0 (0.0%) | 0 (0.0%) |
| 35 to 64 Years | 7 (1.2%) | 48 (9.3%) |
| 65 to 74 Years | 26 (23.2%) | 0 (0.0%) |
| 75 Years and over | 14 (48.3%) | 0 (0.0%) |
Technology Access in Burley
Computing Device Access in Burley
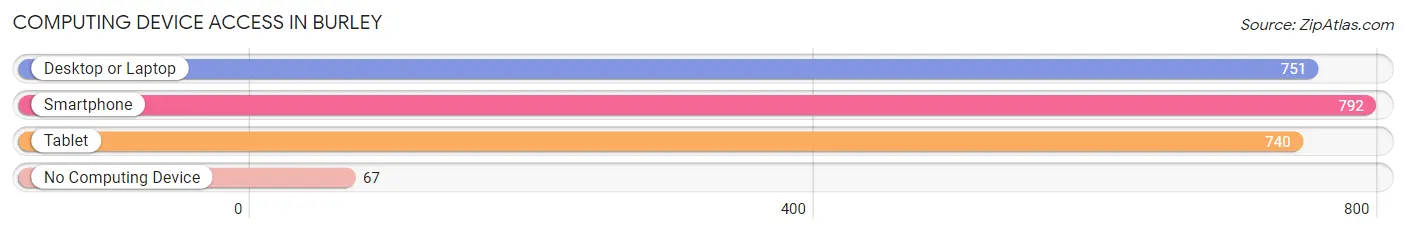
| Device Type | # Households | % Households |
| Desktop or Laptop | 751 | 85.3% |
| Smartphone | 792 | 90.0% |
| Tablet | 740 | 84.1% |
| No Computing Device | 67 | 7.6% |
| Total | 880 | 100.0% |
Internet Access in Burley
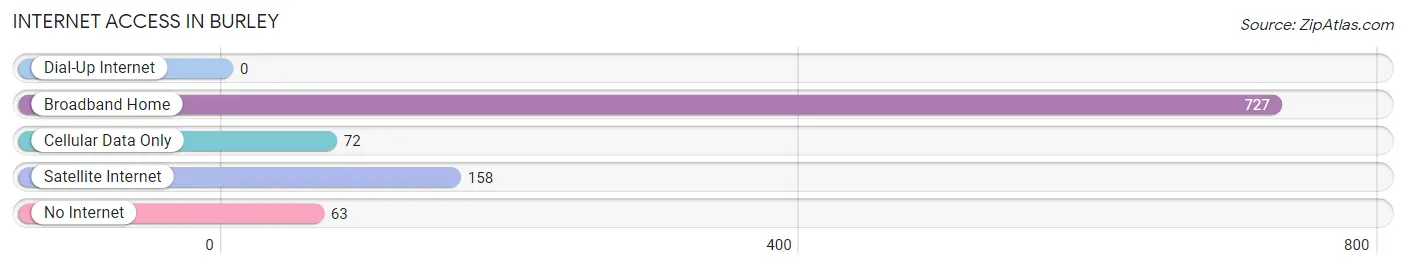
| Internet Type | # Households | % Households |
| Dial-Up Internet | 0 | 0.0% |
| Broadband Home | 727 | 82.6% |
| Cellular Data Only | 72 | 8.2% |
| Satellite Internet | 158 | 17.9% |
| No Internet | 63 | 7.2% |
| Total | 880 | 100.0% |
Burley Summary
Burley is a small city located in the state of Washington, United States. It is situated in the southeastern part of the state, in the county of Kitsap. The city is located on the Kitsap Peninsula, which is bordered by Puget Sound to the west and Hood Canal to the east. The city has a population of approximately 4,000 people, and is part of the Kitsap-Olympic Peninsula Metropolitan Statistical Area.
History
The area that is now Burley was first settled in the late 1800s by a group of settlers from the Midwest. The settlers were attracted to the area due to its abundance of natural resources, including timber, fish, and game. The first post office in the area was established in 1891, and the town was officially incorporated in 1909.
The city was named after a local Native American chief, Chief Burley. The chief was known for his peaceful nature and his willingness to help the settlers in the area.
Geography
Burley is located in the southeastern part of Washington, in the county of Kitsap. The city is situated on the Kitsap Peninsula, which is bordered by Puget Sound to the west and Hood Canal to the east. The city is located at an elevation of approximately 200 feet above sea level.
The city has a total area of 2.2 square miles, all of which is land. The city is located in a temperate climate zone, with mild winters and warm summers. The average annual temperature is approximately 50 degrees Fahrenheit.
Economy
The economy of Burley is largely based on the timber industry. The city is home to several lumber mills, which provide employment for many of the city’s residents. The city is also home to several small businesses, including restaurants, retail stores, and service providers.
The city is also home to a number of tourist attractions, including the Kitsap County Historical Museum, the Kitsap County Fairgrounds, and the Kitsap County Park. These attractions draw visitors from all over the state and beyond.
Demographics
As of the 2010 census, the population of Burley was 4,000. The population is predominantly white, with approximately 90% of the population identifying as white. The remaining 10% of the population is made up of African Americans, Native Americans, Asians, and other races.
The median household income in Burley is approximately $50,000, and the median home value is approximately $200,000. The city has a low unemployment rate, and the poverty rate is below the national average.
Burley is a small city with a rich history and a vibrant economy. The city is home to a diverse population, and is a great place to live and work. The city is a great place to visit, and offers a variety of attractions and activities for visitors.
Common Questions
What is Per Capita Income in Burley?
Per Capita income in Burley is $37,101.
What is the Median Family Income in Burley?
Median Family Income in Burley is $113,333.
What is the Median Household income in Burley?
Median Household Income in Burley is $94,222.
What is Income or Wage Gap in Burley?
Income or Wage Gap in Burley is 59.4%.
Women in Burley earn 40.6 cents for every dollar earned by a man.
What is Inequality or Gini Index in Burley?
Inequality or Gini Index in Burley is 0.42.
What is the Total Population of Burley?
Total Population of Burley is 2,808.
What is the Total Male Population of Burley?
Total Male Population of Burley is 1,289.
What is the Total Female Population of Burley?
Total Female Population of Burley is 1,519.
What is the Ratio of Males per 100 Females in Burley?
There are 84.86 Males per 100 Females in Burley.
What is the Ratio of Females per 100 Males in Burley?
There are 117.84 Females per 100 Males in Burley.
What is the Median Population Age in Burley?
Median Population Age in Burley is 38.8 Years.
What is the Average Family Size in Burley
Average Family Size in Burley is 3.6 People.
What is the Average Household Size in Burley
Average Household Size in Burley is 3.2 People.
How Large is the Labor Force in Burley?
There are 1,108 People in the Labor Forcein in Burley.
What is the Percentage of People in the Labor Force in Burley?
50.8% of People are in the Labor Force in Burley.