Zip Codes with the Highest Percentage of Population Employed in Legal Services & Support in Marysville, WA
RELATED REPORTS & OPTIONS
Legal Services & Support
Marysville
Compare Zip Codes
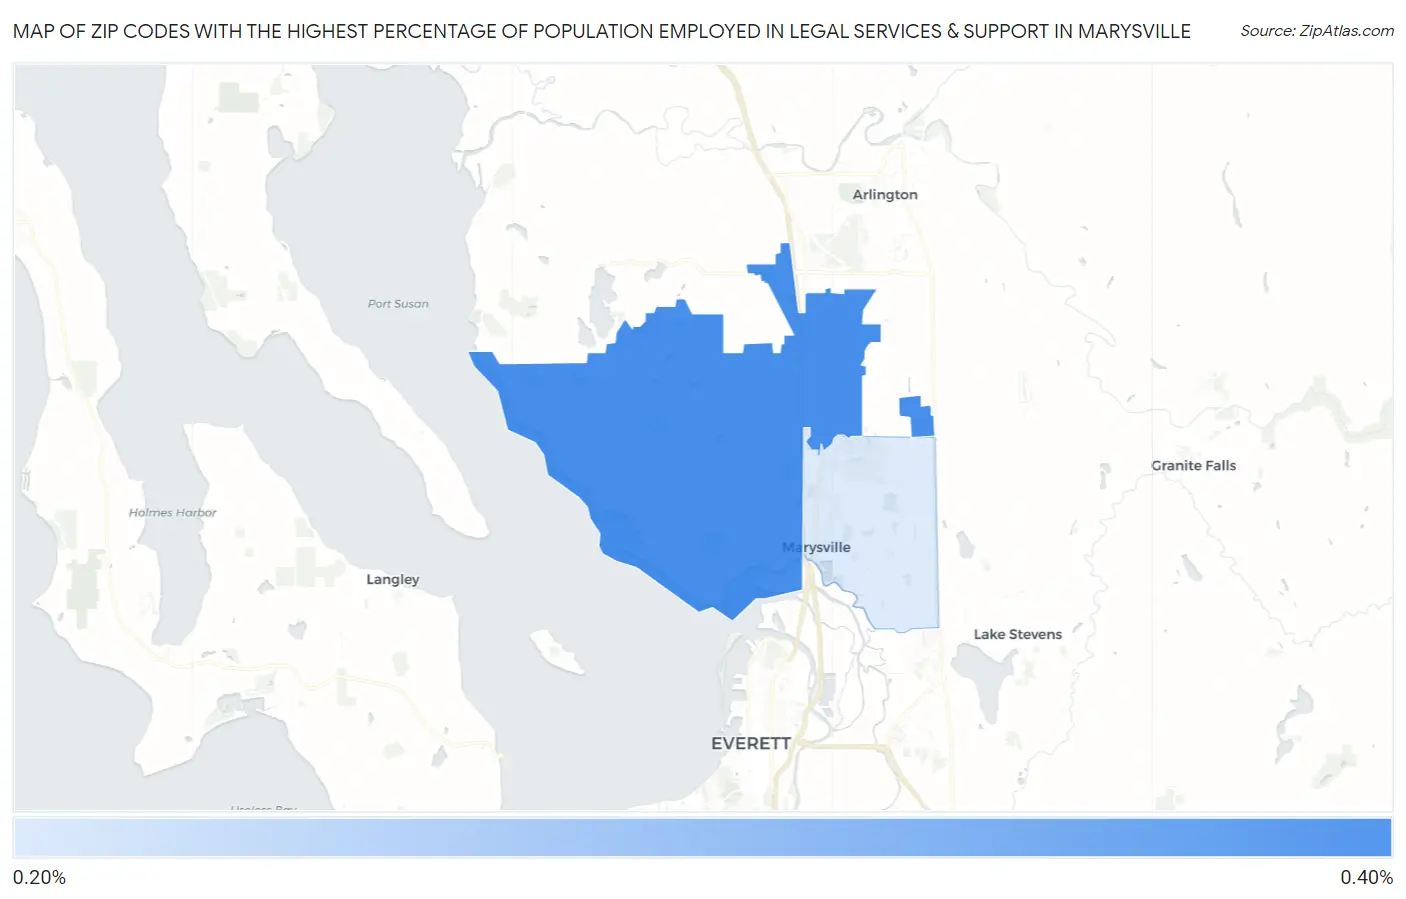
Map of Zip Codes with the Highest Percentage of Population Employed in Legal Services & Support in Marysville
0.26%
0.36%
Zip Codes with the Highest Percentage of Population Employed in Legal Services & Support in Marysville, WA
| Zip Code | % Employed | vs State | vs National | |
| 1. | 98271 | 0.36% | 1.1%(-0.715)#316 | 1.2%(-0.824)#14,334 |
| 2. | 98270 | 0.26% | 1.1%(-0.818)#333 | 1.2%(-0.927)#15,558 |
1
Common Questions
What are the Top Zip Codes with the Highest Percentage of Population Employed in Legal Services & Support in Marysville, WA?
Top Zip Codes with the Highest Percentage of Population Employed in Legal Services & Support in Marysville, WA are:
What zip code has the Highest Percentage of Population Employed in Legal Services & Support in Marysville, WA?
98271 has the Highest Percentage of Population Employed in Legal Services & Support in Marysville, WA with 0.36%.
What is the Percentage of Population Employed in Legal Services & Support in Marysville, WA?
Percentage of Population Employed in Legal Services & Support in Marysville is 0.24%.
What is the Percentage of Population Employed in Legal Services & Support in Washington?
Percentage of Population Employed in Legal Services & Support in Washington is 1.1%.
What is the Percentage of Population Employed in Legal Services & Support in the United States?
Percentage of Population Employed in Legal Services & Support in the United States is 1.2%.