Minnehaha, WA Map & Demographics
Minnehaha Map
Minnehaha Overview
$43,572
PER CAPITA INCOME
$107,480
AVG FAMILY INCOME
$99,620
AVG HOUSEHOLD INCOME
42.9%
WAGE / INCOME GAP [ % ]
57.1¢/ $1
WAGE / INCOME GAP [ $ ]
0.34
INEQUALITY / GINI INDEX
11,582
TOTAL POPULATION
5,504
MALE POPULATION
6,078
FEMALE POPULATION
90.56
MALES / 100 FEMALES
110.43
FEMALES / 100 MALES
38.4
MEDIAN AGE
2.9
AVG FAMILY SIZE
2.6
AVG HOUSEHOLD SIZE
6,513
LABOR FORCE [ PEOPLE ]
69.6%
PERCENT IN LABOR FORCE
7.8%
UNEMPLOYMENT RATE
Income in Minnehaha
Income Overview in Minnehaha
Per Capita Income in Minnehaha is $43,572, while median incomes of families and households are $107,480 and $99,620 respectively.
| Characteristic | Number | Measure |
| Per Capita Income | 11,582 | $43,572 |
| Median Family Income | 3,180 | $107,480 |
| Mean Family Income | 3,180 | $123,410 |
| Median Household Income | 4,439 | $99,620 |
| Mean Household Income | 4,439 | $112,729 |
| Income Deficit | 3,180 | $0 |
| Wage / Income Gap (%) | 11,582 | 42.95% |
| Wage / Income Gap ($) | 11,582 | 57.05¢ per $1 |
| Gini / Inequality Index | 11,582 | 0.34 |
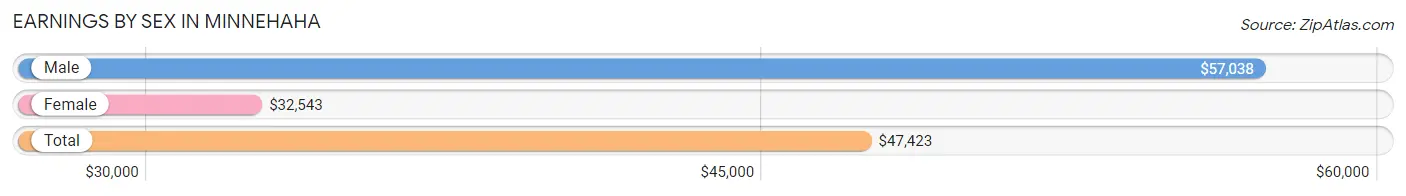
Earnings by Sex in Minnehaha
Average Earnings in Minnehaha are $47,423, $57,038 for men and $32,543 for women, a difference of 42.9%.
| Sex | Number | Average Earnings |
| Male | 3,371 (50.4%) | $57,038 |
| Female | 3,311 (49.5%) | $32,543 |
| Total | 6,682 (100.0%) | $47,423 |
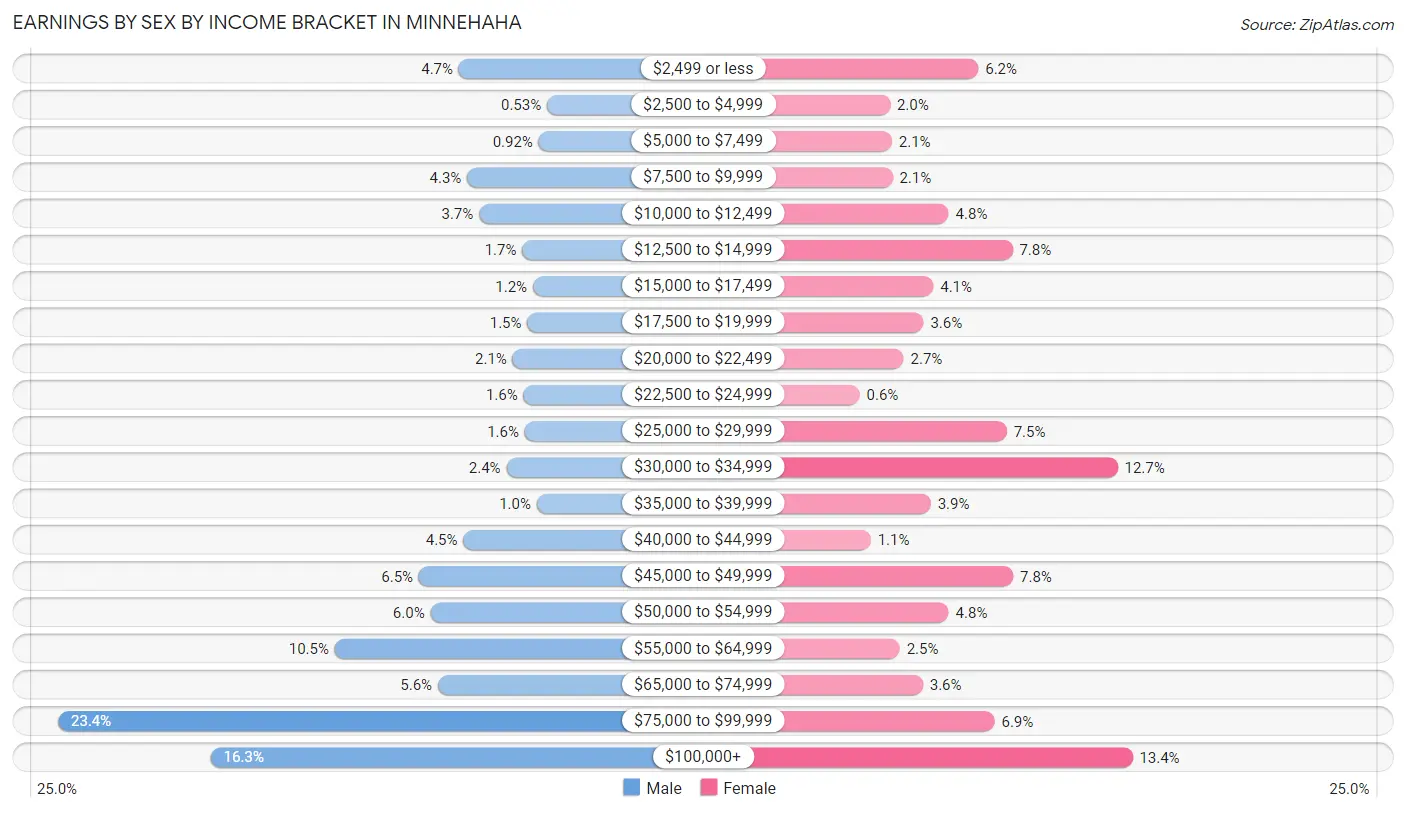
Earnings by Sex by Income Bracket in Minnehaha
The most common earnings brackets in Minnehaha are $75,000 to $99,999 for men (790 | 23.4%) and $100,000+ for women (443 | 13.4%).
| Income | Male | Female |
| $2,499 or less | 157 (4.7%) | 204 (6.2%) |
| $2,500 to $4,999 | 18 (0.5%) | 67 (2.0%) |
| $5,000 to $7,499 | 31 (0.9%) | 70 (2.1%) |
| $7,500 to $9,999 | 144 (4.3%) | 71 (2.1%) |
| $10,000 to $12,499 | 125 (3.7%) | 158 (4.8%) |
| $12,500 to $14,999 | 57 (1.7%) | 257 (7.8%) |
| $15,000 to $17,499 | 40 (1.2%) | 134 (4.1%) |
| $17,500 to $19,999 | 49 (1.5%) | 119 (3.6%) |
| $20,000 to $22,499 | 72 (2.1%) | 88 (2.7%) |
| $22,500 to $24,999 | 55 (1.6%) | 20 (0.6%) |
| $25,000 to $29,999 | 53 (1.6%) | 248 (7.5%) |
| $30,000 to $34,999 | 82 (2.4%) | 420 (12.7%) |
| $35,000 to $39,999 | 34 (1.0%) | 130 (3.9%) |
| $40,000 to $44,999 | 150 (4.4%) | 37 (1.1%) |
| $45,000 to $49,999 | 220 (6.5%) | 258 (7.8%) |
| $50,000 to $54,999 | 202 (6.0%) | 158 (4.8%) |
| $55,000 to $64,999 | 353 (10.5%) | 82 (2.5%) |
| $65,000 to $74,999 | 190 (5.6%) | 118 (3.6%) |
| $75,000 to $99,999 | 790 (23.4%) | 229 (6.9%) |
| $100,000+ | 549 (16.3%) | 443 (13.4%) |
| Total | 3,371 (100.0%) | 3,311 (100.0%) |
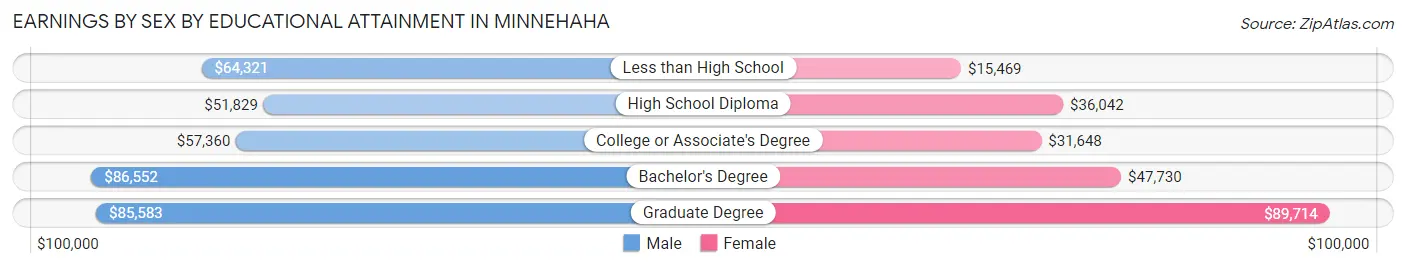
Earnings by Sex by Educational Attainment in Minnehaha
Average earnings in Minnehaha are $57,744 for men and $35,595 for women, a difference of 38.4%. Men with an educational attainment of bachelor's degree enjoy the highest average annual earnings of $86,552, while those with high school diploma education earn the least with $51,829. Women with an educational attainment of graduate degree earn the most with the average annual earnings of $89,714, while those with less than high school education have the smallest earnings of $15,469.
| Educational Attainment | Male Income | Female Income |
| Less than High School | $64,321 | $15,469 |
| High School Diploma | $51,829 | $36,042 |
| College or Associate's Degree | $57,360 | $31,648 |
| Bachelor's Degree | $86,552 | $47,730 |
| Graduate Degree | $85,583 | $89,714 |
| Total | $57,744 | $35,595 |
Family Income in Minnehaha
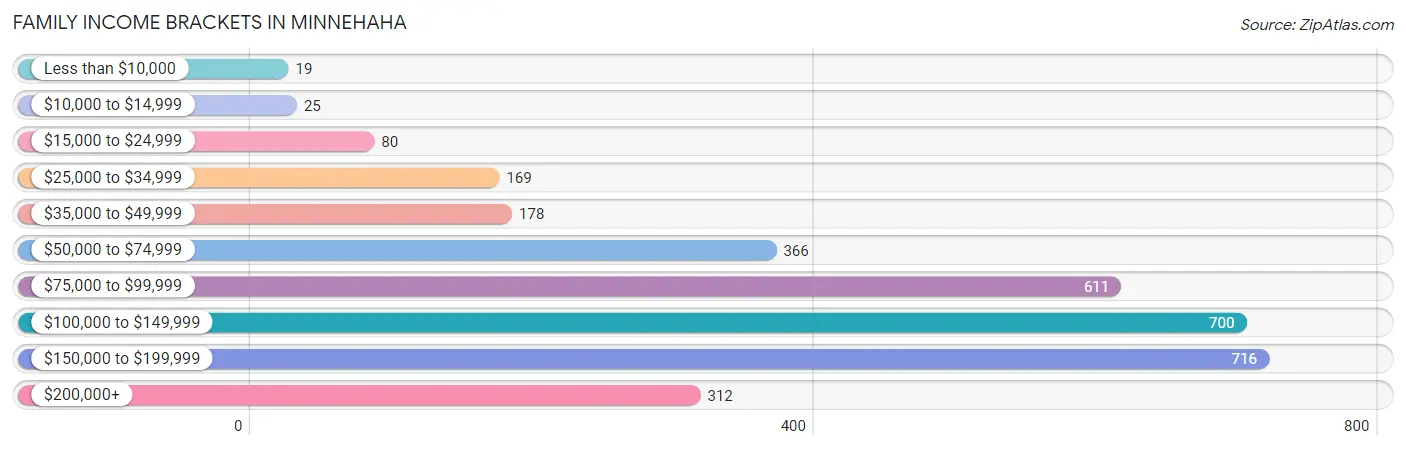
Family Income Brackets in Minnehaha
According to the Minnehaha family income data, there are 716 families falling into the $150,000 to $199,999 income range, which is the most common income bracket and makes up 22.5% of all families. Conversely, the less than $10,000 income bracket is the least frequent group with only 19 families (0.6%) belonging to this category.
| Income Bracket | # Families | % Families |
| Less than $10,000 | 19 | 0.6% |
| $10,000 to $14,999 | 25 | 0.8% |
| $15,000 to $24,999 | 80 | 2.5% |
| $25,000 to $34,999 | 169 | 5.3% |
| $35,000 to $49,999 | 178 | 5.6% |
| $50,000 to $74,999 | 366 | 11.5% |
| $75,000 to $99,999 | 611 | 19.2% |
| $100,000 to $149,999 | 700 | 22.0% |
| $150,000 to $199,999 | 716 | 22.5% |
| $200,000+ | 312 | 9.8% |
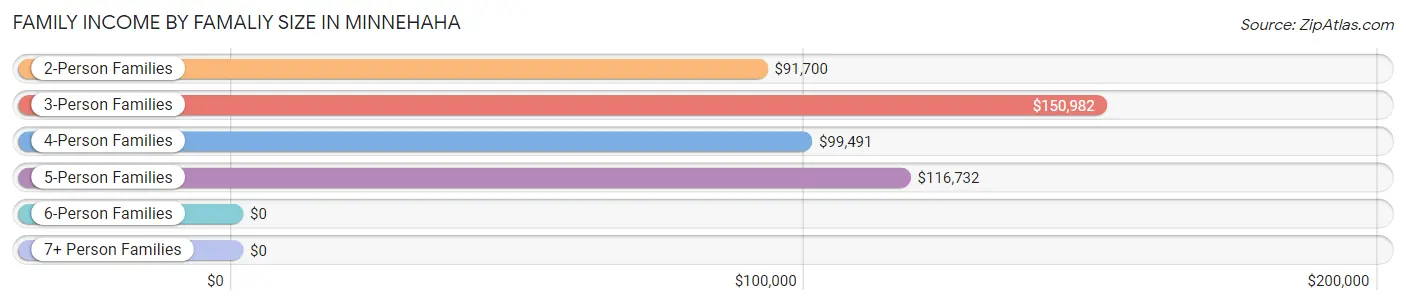
Family Income by Famaliy Size in Minnehaha
3-person families (763 | 24.0%) account for the highest median family income in Minnehaha with $150,982 per family, while 3-person families (763 | 24.0%) have the highest median income of $50,327 per family member.
| Income Bracket | # Families | Median Income |
| 2-Person Families | 1,572 (49.4%) | $91,700 |
| 3-Person Families | 763 (24.0%) | $150,982 |
| 4-Person Families | 450 (14.1%) | $99,491 |
| 5-Person Families | 301 (9.5%) | $116,732 |
| 6-Person Families | 46 (1.5%) | $0 |
| 7+ Person Families | 48 (1.5%) | $0 |
| Total | 3,180 (100.0%) | $107,480 |
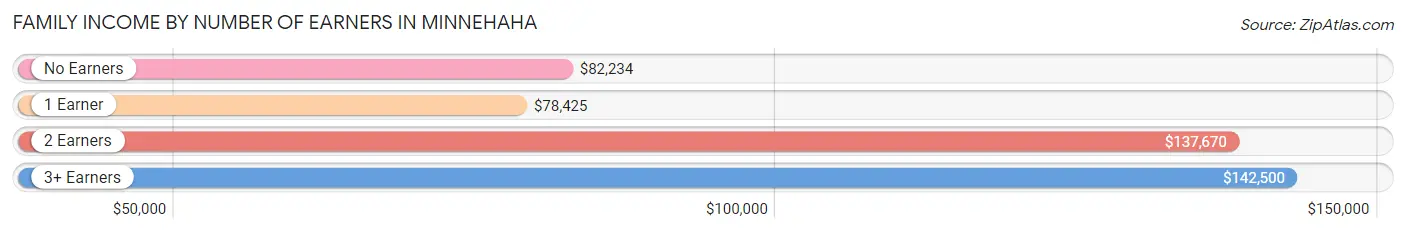
Family Income by Number of Earners in Minnehaha
The median family income in Minnehaha is $107,480, with families comprising 3+ earners (340) having the highest median family income of $142,500, while families with 1 earner (909) have the lowest median family income of $78,425, accounting for 10.7% and 28.6% of families, respectively.
| Number of Earners | # Families | Median Income |
| No Earners | 360 (11.3%) | $82,234 |
| 1 Earner | 909 (28.6%) | $78,425 |
| 2 Earners | 1,571 (49.4%) | $137,670 |
| 3+ Earners | 340 (10.7%) | $142,500 |
| Total | 3,180 (100.0%) | $107,480 |
Household Income in Minnehaha
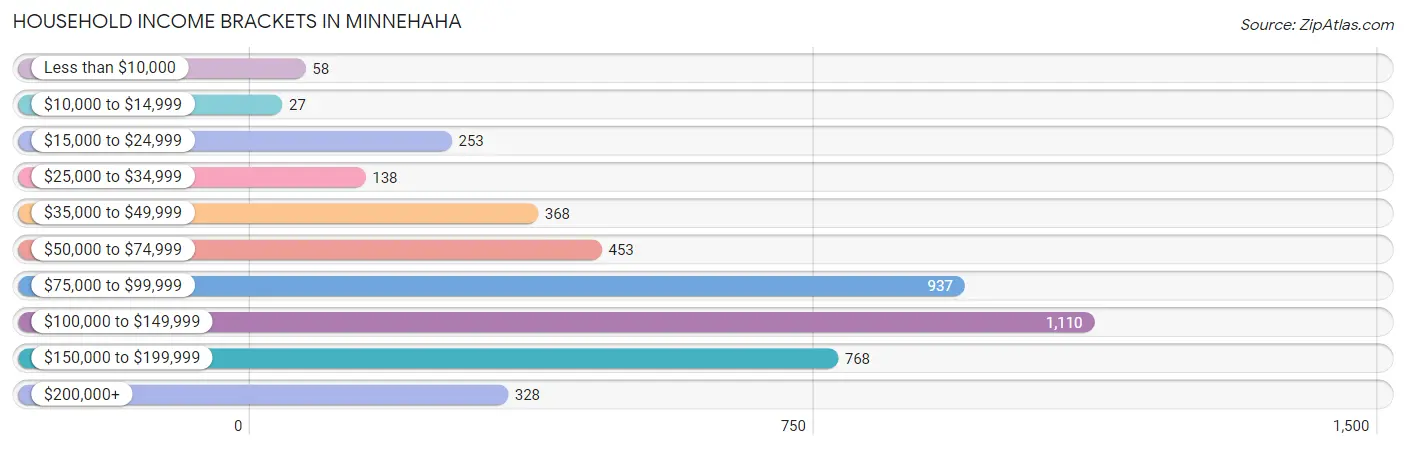
Household Income Brackets in Minnehaha
With 1,110 households falling in the category, the $100,000 to $149,999 income range is the most frequent in Minnehaha, accounting for 25.0% of all households. In contrast, only 27 households (0.6%) fall into the $10,000 to $14,999 income bracket, making it the least populous group.
| Income Bracket | # Households | % Households |
| Less than $10,000 | 58 | 1.3% |
| $10,000 to $14,999 | 27 | 0.6% |
| $15,000 to $24,999 | 253 | 5.7% |
| $25,000 to $34,999 | 138 | 3.1% |
| $35,000 to $49,999 | 368 | 8.3% |
| $50,000 to $74,999 | 453 | 10.2% |
| $75,000 to $99,999 | 937 | 21.1% |
| $100,000 to $149,999 | 1,110 | 25.0% |
| $150,000 to $199,999 | 768 | 17.3% |
| $200,000+ | 328 | 7.4% |
Household Income by Householder Age in Minnehaha
The median household income in Minnehaha is $99,620, with the highest median household income of $108,488 found in the 45 to 64 years age bracket for the primary householder. A total of 1,760 households (39.7%) fall into this category.
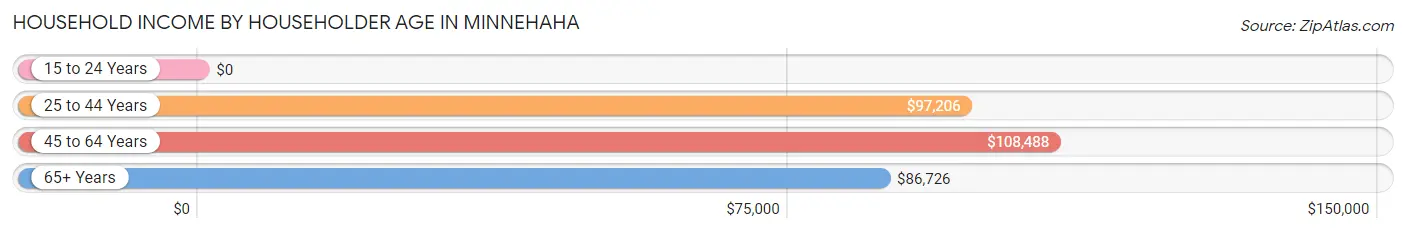
| Income Bracket | # Households | Median Income |
| 15 to 24 Years | 0 (0.0%) | $0 |
| 25 to 44 Years | 1,644 (37.0%) | $97,206 |
| 45 to 64 Years | 1,760 (39.7%) | $108,488 |
| 65+ Years | 1,035 (23.3%) | $86,726 |
| Total | 4,439 (100.0%) | $99,620 |
Poverty in Minnehaha
Income Below Poverty by Sex and Age in Minnehaha
With 6.2% poverty level for males and 5.0% for females among the residents of Minnehaha, 16 and 17 year old males and under 5 year old females are the most vulnerable to poverty, with 64 males (53.8%) and 48 females (23.5%) in their respective age groups living below the poverty level.
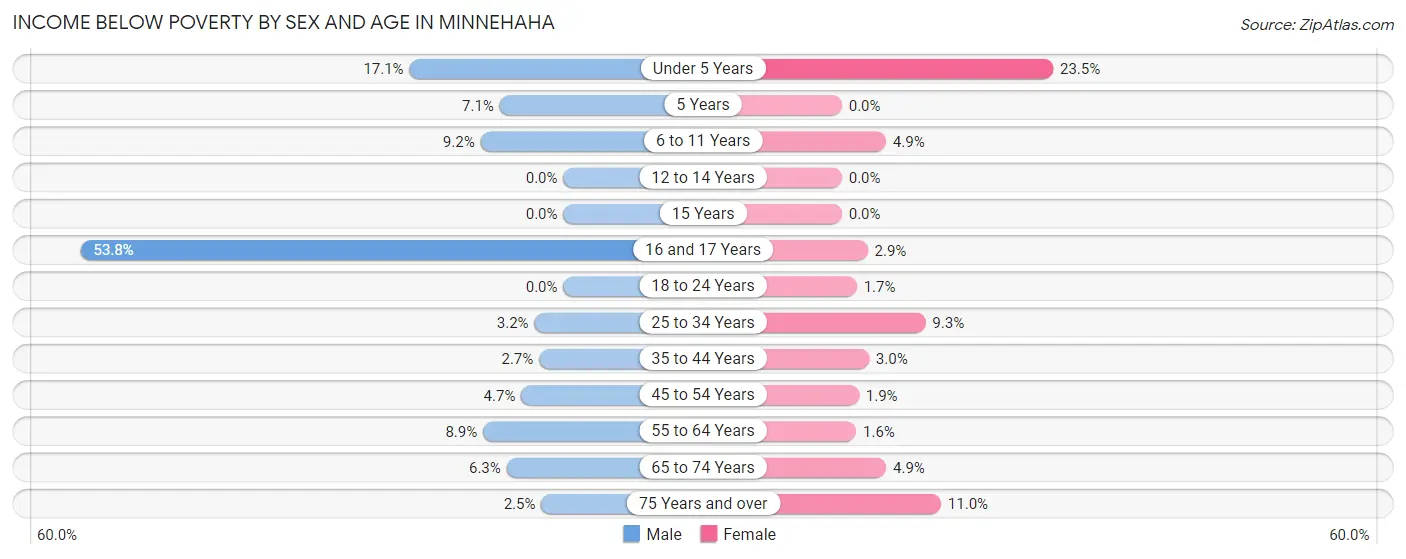
| Age Bracket | Male | Female |
| Under 5 Years | 36 (17.1%) | 48 (23.5%) |
| 5 Years | 10 (7.1%) | 0 (0.0%) |
| 6 to 11 Years | 42 (9.2%) | 37 (4.9%) |
| 12 to 14 Years | 0 (0.0%) | 0 (0.0%) |
| 15 Years | 0 (0.0%) | 0 (0.0%) |
| 16 and 17 Years | 64 (53.8%) | 8 (2.9%) |
| 18 to 24 Years | 0 (0.0%) | 5 (1.7%) |
| 25 to 34 Years | 33 (3.2%) | 87 (9.3%) |
| 35 to 44 Years | 26 (2.7%) | 24 (3.0%) |
| 45 to 54 Years | 26 (4.7%) | 12 (1.9%) |
| 55 to 64 Years | 59 (8.9%) | 17 (1.6%) |
| 65 to 74 Years | 32 (6.3%) | 30 (4.9%) |
| 75 Years and over | 9 (2.5%) | 33 (11.0%) |
| Total | 337 (6.2%) | 301 (5.0%) |
Income Above Poverty by Sex and Age in Minnehaha
According to the poverty statistics in Minnehaha, males aged 12 to 14 years and females aged 5 years are the age groups that are most secure financially, with 100.0% of males and 100.0% of females in these age groups living above the poverty line.
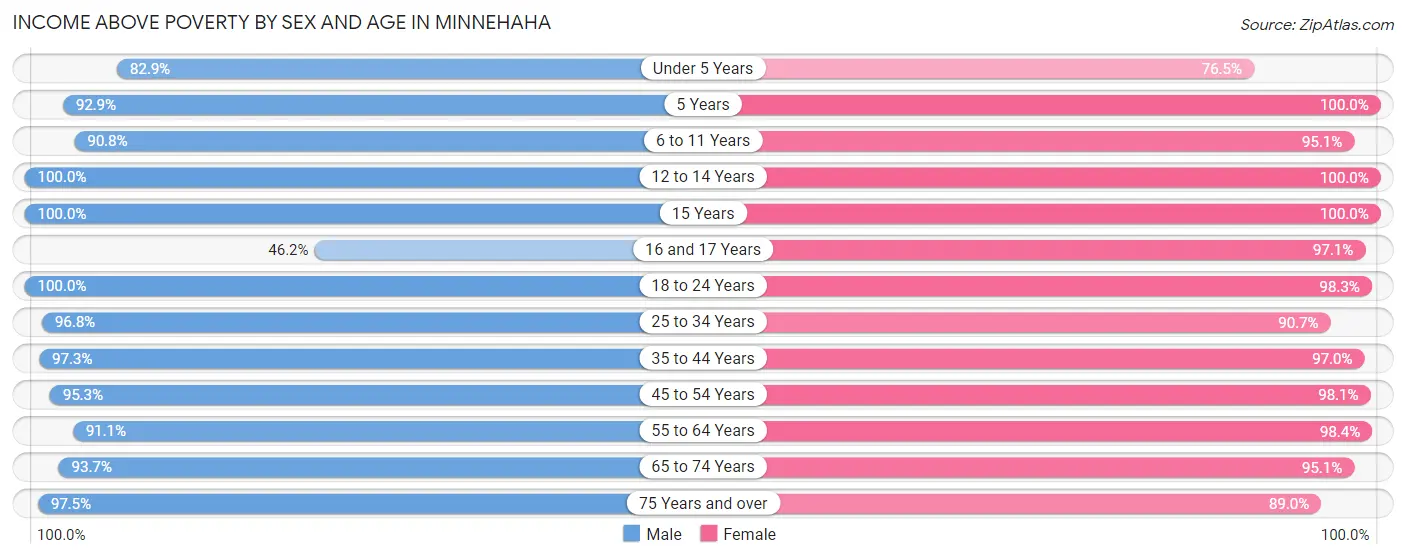
| Age Bracket | Male | Female |
| Under 5 Years | 174 (82.9%) | 156 (76.5%) |
| 5 Years | 131 (92.9%) | 101 (100.0%) |
| 6 to 11 Years | 413 (90.8%) | 717 (95.1%) |
| 12 to 14 Years | 149 (100.0%) | 89 (100.0%) |
| 15 Years | 63 (100.0%) | 9 (100.0%) |
| 16 and 17 Years | 55 (46.2%) | 271 (97.1%) |
| 18 to 24 Years | 243 (100.0%) | 297 (98.3%) |
| 25 to 34 Years | 993 (96.8%) | 847 (90.7%) |
| 35 to 44 Years | 937 (97.3%) | 771 (97.0%) |
| 45 to 54 Years | 528 (95.3%) | 620 (98.1%) |
| 55 to 64 Years | 601 (91.1%) | 1,055 (98.4%) |
| 65 to 74 Years | 474 (93.7%) | 578 (95.1%) |
| 75 Years and over | 357 (97.5%) | 266 (89.0%) |
| Total | 5,118 (93.8%) | 5,777 (95.1%) |
Income Below Poverty Among Married-Couple Families in Minnehaha
The poverty statistics for married-couple families in Minnehaha show that 1.8% or 40 of the total 2,245 families live below the poverty line. Families with 3 or 4 children have the highest poverty rate of 6.7%, comprising of 12 families. On the other hand, families with no children have the lowest poverty rate of 0.9%, which includes 12 families.
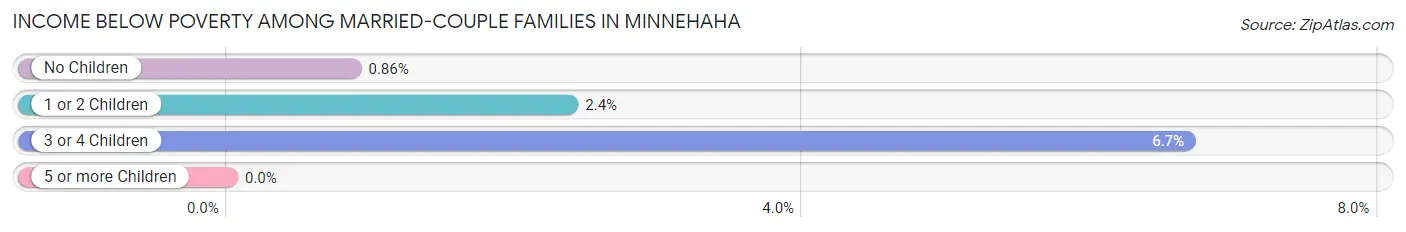
| Children | Above Poverty | Below Poverty |
| No Children | 1,377 (99.1%) | 12 (0.9%) |
| 1 or 2 Children | 660 (97.6%) | 16 (2.4%) |
| 3 or 4 Children | 168 (93.3%) | 12 (6.7%) |
| 5 or more Children | 0 (0.0%) | 0 (0.0%) |
| Total | 2,205 (98.2%) | 40 (1.8%) |
Income Below Poverty Among Single-Parent Households in Minnehaha
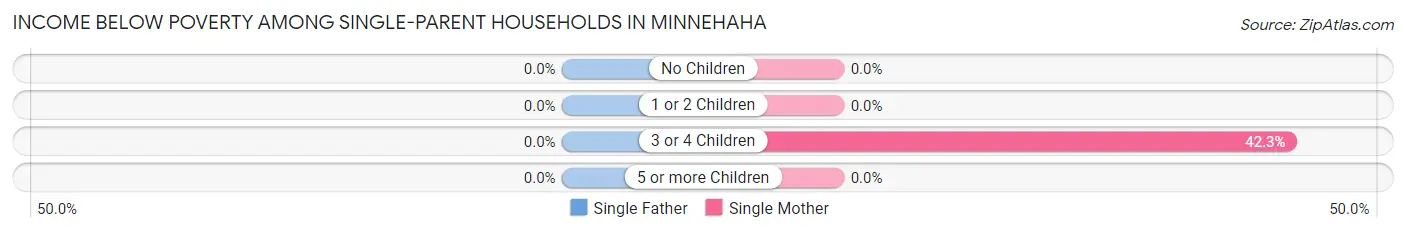
| Children | Single Father | Single Mother |
| No Children | 0 (0.0%) | 0 (0.0%) |
| 1 or 2 Children | 0 (0.0%) | 0 (0.0%) |
| 3 or 4 Children | 0 (0.0%) | 30 (42.2%) |
| 5 or more Children | 0 (0.0%) | 0 (0.0%) |
| Total | 0 (0.0%) | 30 (3.5%) |
Income Below Poverty Among Married-Couple vs Single-Parent Households in Minnehaha
The poverty data for Minnehaha shows that 40 of the married-couple family households (1.8%) and 30 of the single-parent households (3.2%) are living below the poverty level. Within the married-couple family households, those with 3 or 4 children have the highest poverty rate, with 12 households (6.7%) falling below the poverty line. Among the single-parent households, those with 3 or 4 children have the highest poverty rate, with 30 household (42.2%) living below poverty.
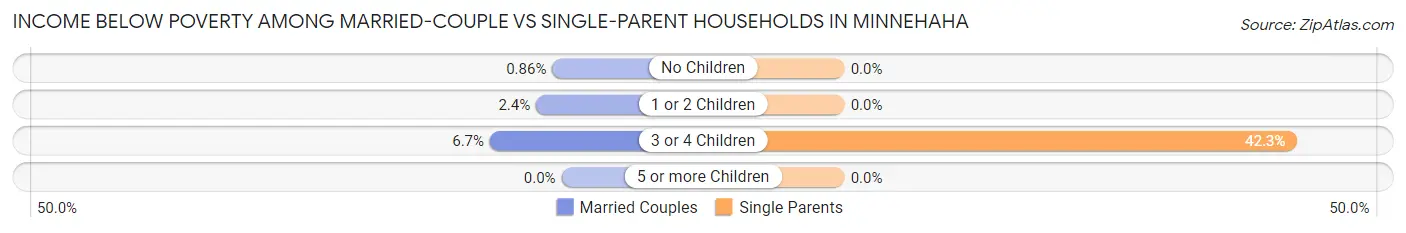
| Children | Married-Couple Families | Single-Parent Households |
| No Children | 12 (0.9%) | 0 (0.0%) |
| 1 or 2 Children | 16 (2.4%) | 0 (0.0%) |
| 3 or 4 Children | 12 (6.7%) | 30 (42.2%) |
| 5 or more Children | 0 (0.0%) | 0 (0.0%) |
| Total | 40 (1.8%) | 30 (3.2%) |
Race in Minnehaha
The most populous races in Minnehaha are White / Caucasian (9,418 | 81.3%), Hispanic or Latino (1,415 | 12.2%), and Two or more Races (952 | 8.2%).
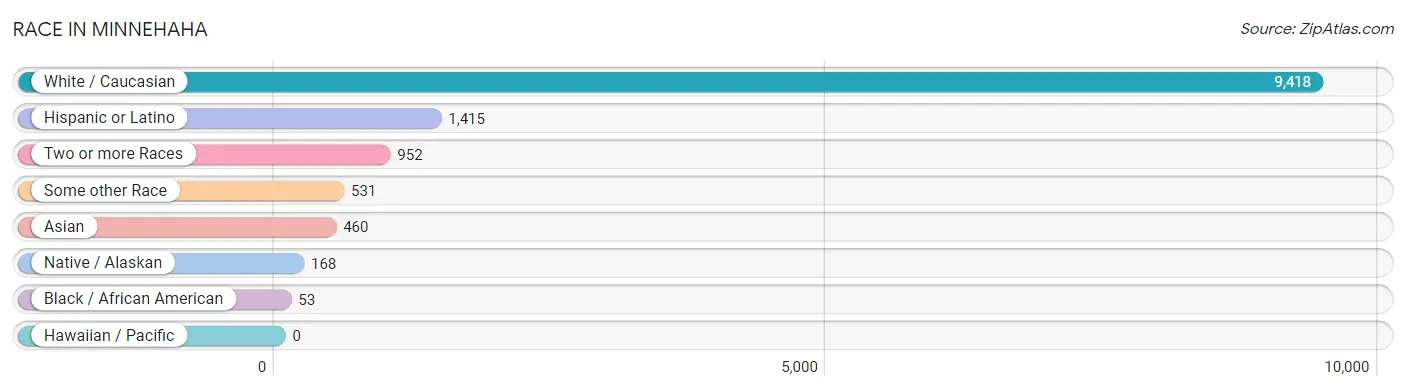
| Race | # Population | % Population |
| Asian | 460 | 4.0% |
| Black / African American | 53 | 0.5% |
| Hawaiian / Pacific | 0 | 0.0% |
| Hispanic or Latino | 1,415 | 12.2% |
| Native / Alaskan | 168 | 1.5% |
| White / Caucasian | 9,418 | 81.3% |
| Two or more Races | 952 | 8.2% |
| Some other Race | 531 | 4.6% |
| Total | 11,582 | 100.0% |
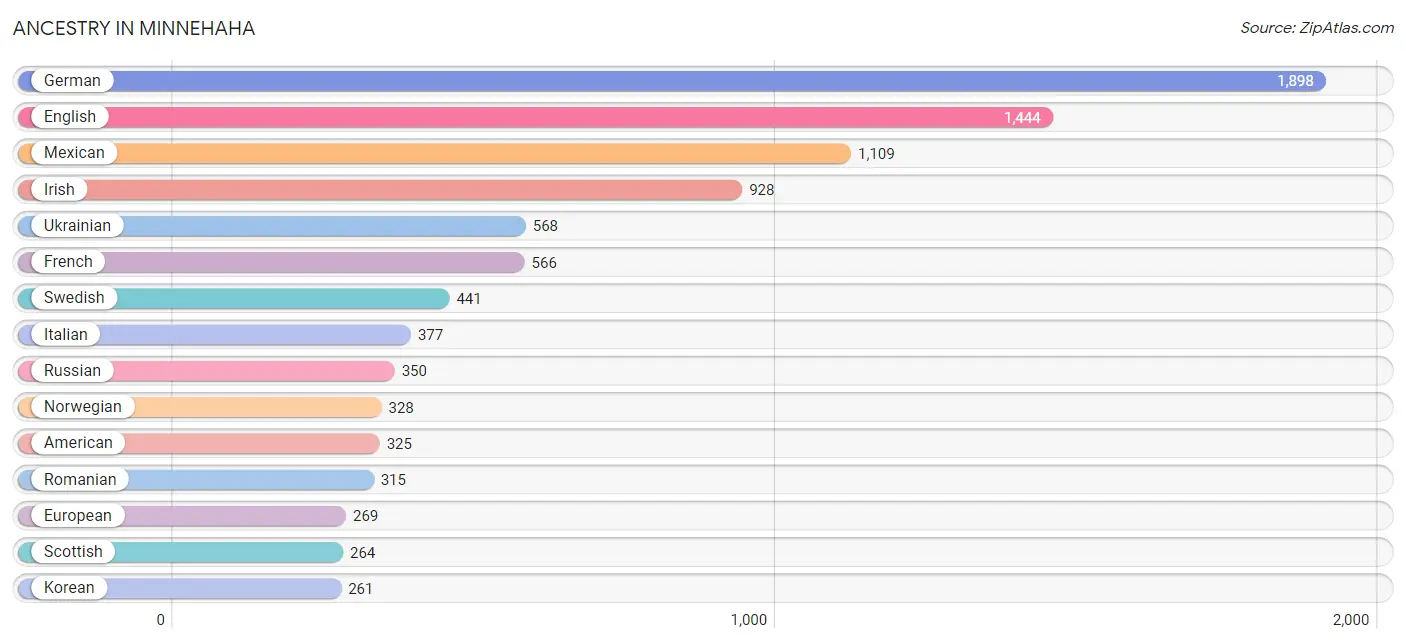
Ancestry in Minnehaha
The most populous ancestries reported in Minnehaha are German (1,898 | 16.4%), English (1,444 | 12.5%), Mexican (1,109 | 9.6%), Irish (928 | 8.0%), and Ukrainian (568 | 4.9%), together accounting for 51.3% of all Minnehaha residents.
| Ancestry | # Population | % Population |
| African | 199 | 1.7% |
| American | 325 | 2.8% |
| Apache | 9 | 0.1% |
| Arab | 38 | 0.3% |
| Bhutanese | 187 | 1.6% |
| Blackfeet | 27 | 0.2% |
| British | 81 | 0.7% |
| Canadian | 45 | 0.4% |
| Celtic | 25 | 0.2% |
| Central American | 102 | 0.9% |
| Central American Indian | 12 | 0.1% |
| Chippewa | 55 | 0.5% |
| Colombian | 44 | 0.4% |
| Costa Rican | 42 | 0.4% |
| Croatian | 25 | 0.2% |
| Cuban | 14 | 0.1% |
| Danish | 25 | 0.2% |
| Dutch | 34 | 0.3% |
| English | 1,444 | 12.5% |
| European | 269 | 2.3% |
| Finnish | 131 | 1.1% |
| French | 566 | 4.9% |
| French Canadian | 194 | 1.7% |
| German | 1,898 | 16.4% |
| Greek | 48 | 0.4% |
| Guamanian / Chamorro | 69 | 0.6% |
| Guatemalan | 18 | 0.2% |
| Honduran | 42 | 0.4% |
| Indian (Asian) | 107 | 0.9% |
| Iranian | 11 | 0.1% |
| Irish | 928 | 8.0% |
| Israeli | 38 | 0.3% |
| Italian | 377 | 3.3% |
| Jamaican | 8 | 0.1% |
| Japanese | 64 | 0.5% |
| Korean | 261 | 2.2% |
| Lithuanian | 19 | 0.2% |
| Mexican | 1,109 | 9.6% |
| Mexican American Indian | 135 | 1.2% |
| Native Hawaiian | 45 | 0.4% |
| Northern European | 34 | 0.3% |
| Norwegian | 328 | 2.8% |
| Pakistani | 20 | 0.2% |
| Palestinian | 38 | 0.3% |
| Polish | 38 | 0.3% |
| Portuguese | 34 | 0.3% |
| Puerto Rican | 52 | 0.4% |
| Romanian | 315 | 2.7% |
| Russian | 350 | 3.0% |
| Scandinavian | 13 | 0.1% |
| Scotch-Irish | 76 | 0.7% |
| Scottish | 264 | 2.3% |
| Serbian | 6 | 0.1% |
| Slovene | 19 | 0.2% |
| South American | 44 | 0.4% |
| Spanish | 57 | 0.5% |
| Sri Lankan | 213 | 1.8% |
| Subsaharan African | 215 | 1.9% |
| Swedish | 441 | 3.8% |
| Swiss | 87 | 0.7% |
| Thai | 27 | 0.2% |
| Tongan | 28 | 0.2% |
| Ukrainian | 568 | 4.9% |
| Welsh | 23 | 0.2% |
| Yaqui | 9 | 0.1% |
| Yugoslavian | 20 | 0.2% | View All 66 Rows |
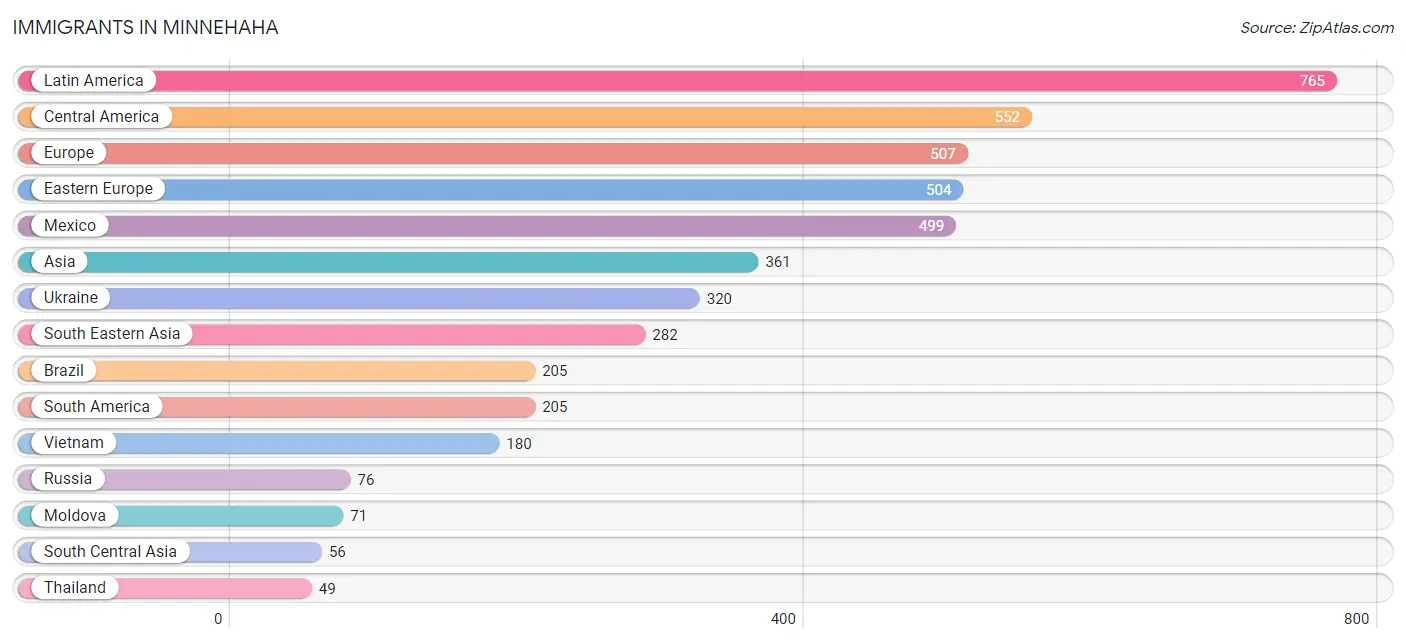
Immigrants in Minnehaha
The most numerous immigrant groups reported in Minnehaha came from Latin America (765 | 6.6%), Central America (552 | 4.8%), Europe (507 | 4.4%), Eastern Europe (504 | 4.3%), and Mexico (499 | 4.3%), together accounting for 24.4% of all Minnehaha residents.
| Immigration Origin | # Population | % Population |
| Asia | 361 | 3.1% |
| Brazil | 205 | 1.8% |
| Canada | 34 | 0.3% |
| Caribbean | 8 | 0.1% |
| Central America | 552 | 4.8% |
| China | 23 | 0.2% |
| Eastern Asia | 23 | 0.2% |
| Eastern Europe | 504 | 4.3% |
| El Salvador | 11 | 0.1% |
| Europe | 507 | 4.4% |
| Honduras | 42 | 0.4% |
| Jamaica | 8 | 0.1% |
| Laos | 31 | 0.3% |
| Latin America | 765 | 6.6% |
| Mexico | 499 | 4.3% |
| Moldova | 71 | 0.6% |
| Northern Europe | 3 | 0.0% |
| Philippines | 22 | 0.2% |
| Romania | 37 | 0.3% |
| Russia | 76 | 0.7% |
| South America | 205 | 1.8% |
| South Central Asia | 56 | 0.5% |
| South Eastern Asia | 282 | 2.4% |
| Thailand | 49 | 0.4% |
| Ukraine | 320 | 2.8% |
| Vietnam | 180 | 1.5% | View All 26 Rows |
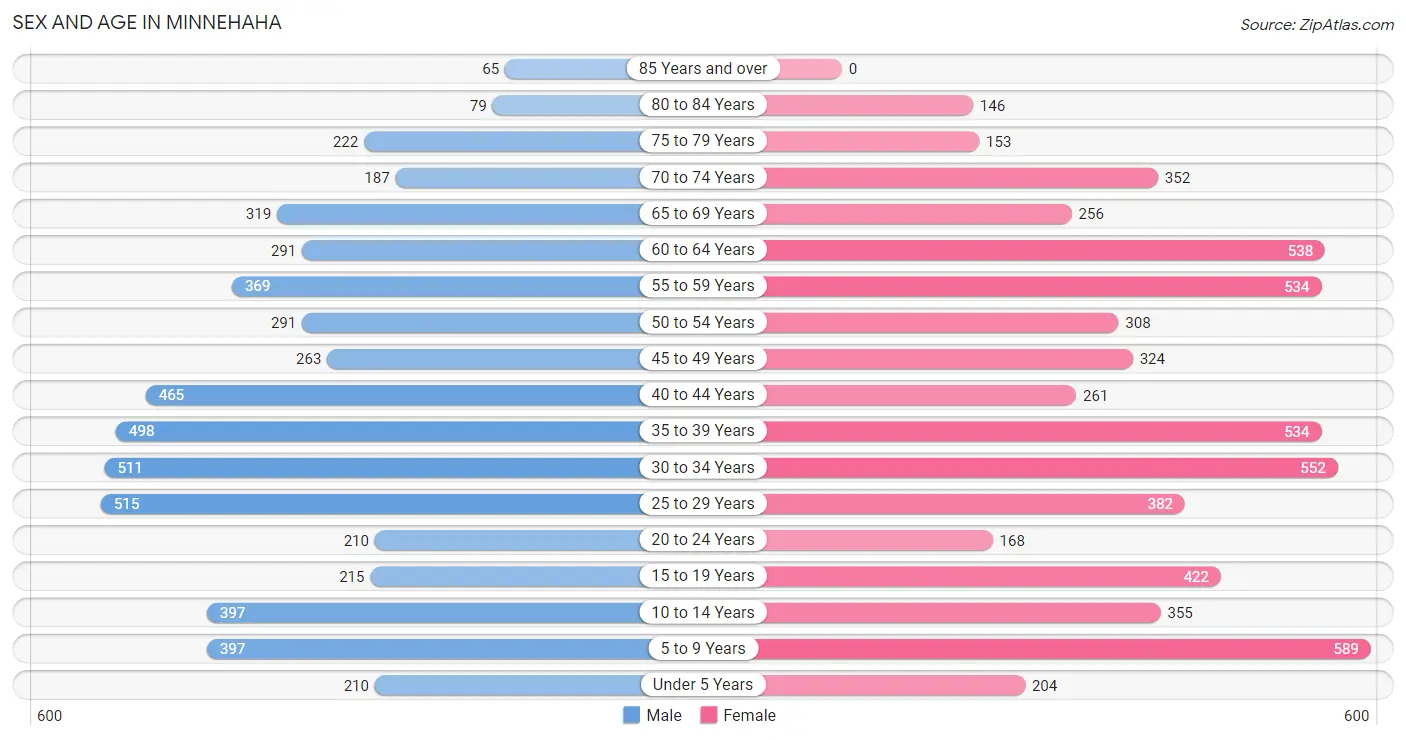
Sex and Age in Minnehaha
Sex and Age in Minnehaha
The most populous age groups in Minnehaha are 25 to 29 Years (515 | 9.4%) for men and 5 to 9 Years (589 | 9.7%) for women.
| Age Bracket | Male | Female |
| Under 5 Years | 210 (3.8%) | 204 (3.4%) |
| 5 to 9 Years | 397 (7.2%) | 589 (9.7%) |
| 10 to 14 Years | 397 (7.2%) | 355 (5.8%) |
| 15 to 19 Years | 215 (3.9%) | 422 (6.9%) |
| 20 to 24 Years | 210 (3.8%) | 168 (2.8%) |
| 25 to 29 Years | 515 (9.4%) | 382 (6.3%) |
| 30 to 34 Years | 511 (9.3%) | 552 (9.1%) |
| 35 to 39 Years | 498 (9.0%) | 534 (8.8%) |
| 40 to 44 Years | 465 (8.5%) | 261 (4.3%) |
| 45 to 49 Years | 263 (4.8%) | 324 (5.3%) |
| 50 to 54 Years | 291 (5.3%) | 308 (5.1%) |
| 55 to 59 Years | 369 (6.7%) | 534 (8.8%) |
| 60 to 64 Years | 291 (5.3%) | 538 (8.8%) |
| 65 to 69 Years | 319 (5.8%) | 256 (4.2%) |
| 70 to 74 Years | 187 (3.4%) | 352 (5.8%) |
| 75 to 79 Years | 222 (4.0%) | 153 (2.5%) |
| 80 to 84 Years | 79 (1.4%) | 146 (2.4%) |
| 85 Years and over | 65 (1.2%) | 0 (0.0%) |
| Total | 5,504 (100.0%) | 6,078 (100.0%) |
Families and Households in Minnehaha
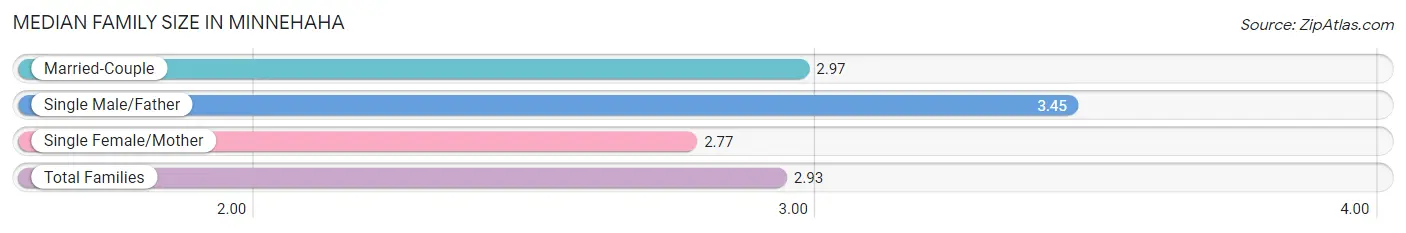
Median Family Size in Minnehaha
The median family size in Minnehaha is 2.93 persons per family, with single male/father families (89 | 2.8%) accounting for the largest median family size of 3.45 persons per family. On the other hand, single female/mother families (846 | 26.6%) represent the smallest median family size with 2.77 persons per family.
| Family Type | # Families | Family Size |
| Married-Couple | 2,245 (70.6%) | 2.97 |
| Single Male/Father | 89 (2.8%) | 3.45 |
| Single Female/Mother | 846 (26.6%) | 2.77 |
| Total Families | 3,180 (100.0%) | 2.93 |
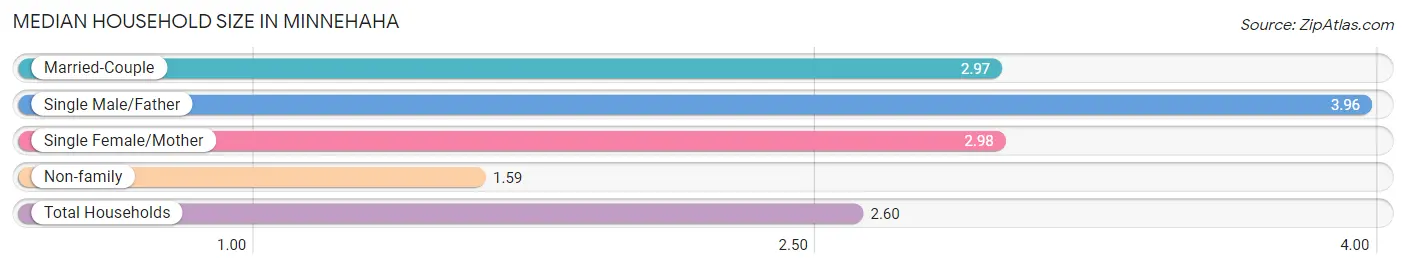
Median Household Size in Minnehaha
The median household size in Minnehaha is 2.60 persons per household, with single male/father households (89 | 2.0%) accounting for the largest median household size of 3.96 persons per household. non-family households (1,259 | 28.4%) represent the smallest median household size with 1.59 persons per household.
| Household Type | # Households | Household Size |
| Married-Couple | 2,245 (50.6%) | 2.97 |
| Single Male/Father | 89 (2.0%) | 3.96 |
| Single Female/Mother | 846 (19.1%) | 2.98 |
| Non-family | 1,259 (28.4%) | 1.59 |
| Total Households | 4,439 (100.0%) | 2.60 |
Household Size by Marriage Status in Minnehaha
Out of a total of 4,439 households in Minnehaha, 3,180 (71.6%) are family households, while 1,259 (28.4%) are nonfamily households. The most numerous type of family households are 2-person households, comprising 1,540, and the most common type of nonfamily households are 1-person households, comprising 677.
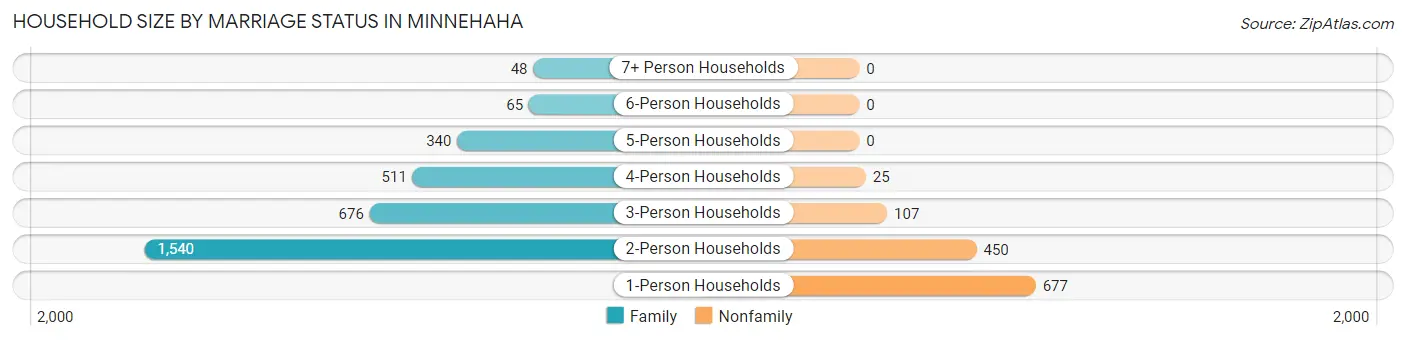
| Household Size | Family Households | Nonfamily Households |
| 1-Person Households | - | 677 (15.2%) |
| 2-Person Households | 1,540 (34.7%) | 450 (10.1%) |
| 3-Person Households | 676 (15.2%) | 107 (2.4%) |
| 4-Person Households | 511 (11.5%) | 25 (0.6%) |
| 5-Person Households | 340 (7.7%) | 0 (0.0%) |
| 6-Person Households | 65 (1.5%) | 0 (0.0%) |
| 7+ Person Households | 48 (1.1%) | 0 (0.0%) |
| Total | 3,180 (71.6%) | 1,259 (28.4%) |
Female Fertility in Minnehaha
Fertility by Age in Minnehaha
Average fertility rate in Minnehaha is 40.0 births per 1,000 women. Women in the age bracket of 20 to 34 years have the highest fertility rate with 78.0 births per 1,000 women. Women in the age bracket of 20 to 34 years acount for 79.6% of all women with births.
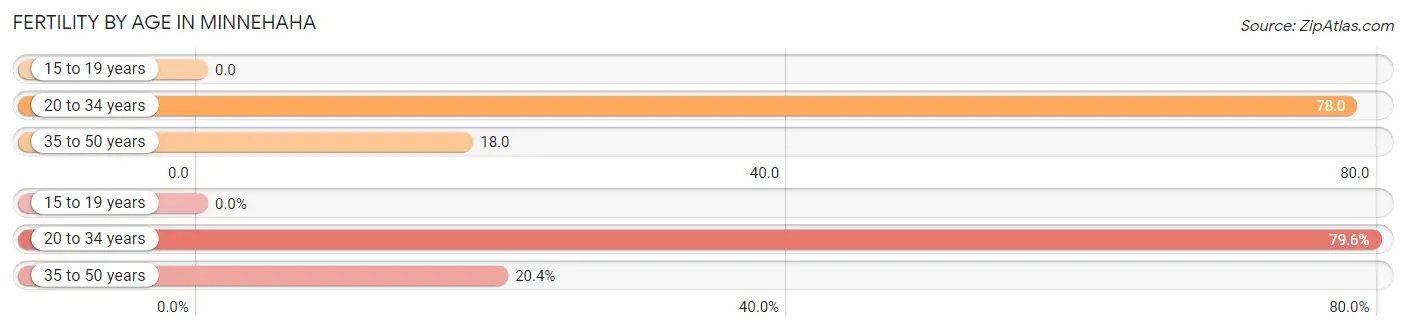
| Age Bracket | Women with Births | Births / 1,000 Women |
| 15 to 19 years | 0 (0.0%) | 0.0 |
| 20 to 34 years | 86 (79.6%) | 78.0 |
| 35 to 50 years | 22 (20.4%) | 18.0 |
| Total | 108 (100.0%) | 40.0 |
Fertility by Age by Marriage Status in Minnehaha
50.9% of women with births (108) in Minnehaha are married. The highest percentage of unmarried women with births falls into 20 to 34 years age bracket with 61.6% of them unmarried at the time of birth, while the lowest percentage of unmarried women with births belong to 35 to 50 years age bracket with 0.0% of them unmarried.
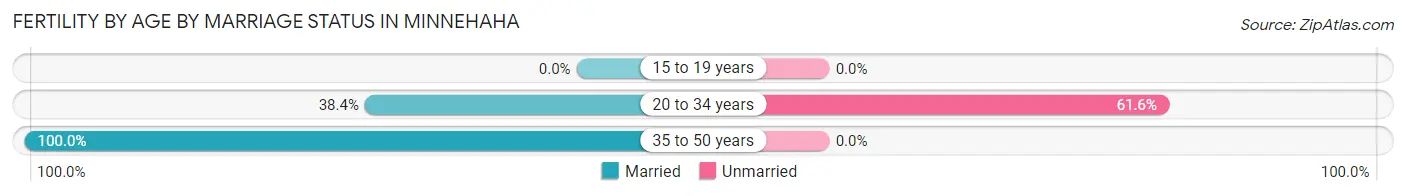
| Age Bracket | Married | Unmarried |
| 15 to 19 years | 0 (0.0%) | 0 (0.0%) |
| 20 to 34 years | 33 (38.4%) | 53 (61.6%) |
| 35 to 50 years | 22 (100.0%) | 0 (0.0%) |
| Total | 55 (50.9%) | 53 (49.1%) |
Fertility by Education in Minnehaha
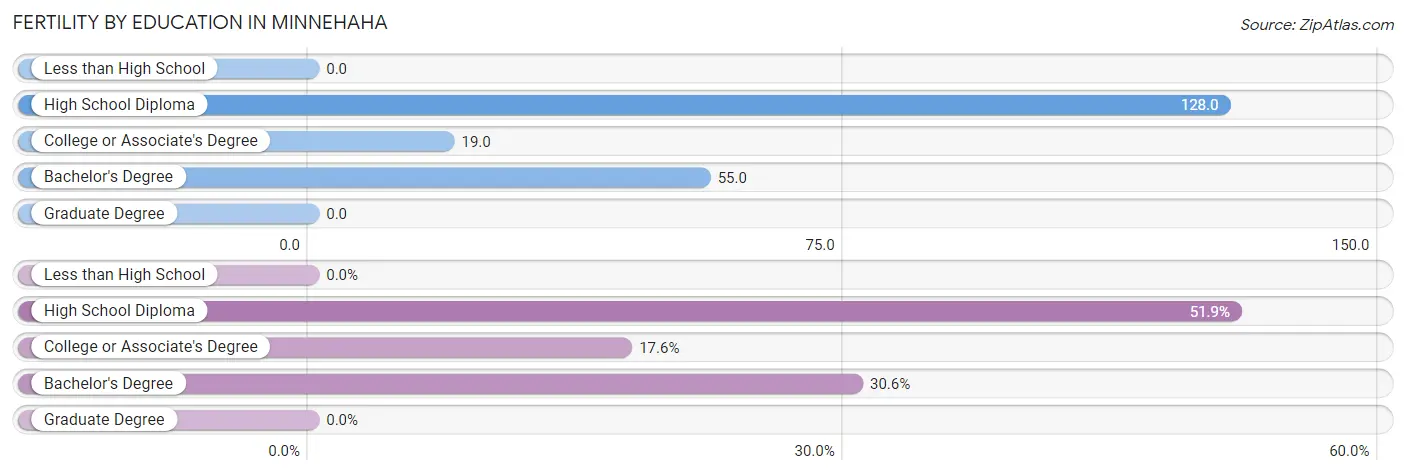
| Educational Attainment | Women with Births | Births / 1,000 Women |
| Less than High School | 0 (0.0%) | 0.0 |
| High School Diploma | 56 (51.8%) | 128.0 |
| College or Associate's Degree | 19 (17.6%) | 19.0 |
| Bachelor's Degree | 33 (30.6%) | 55.0 |
| Graduate Degree | 0 (0.0%) | 0.0 |
| Total | 108 (100.0%) | 40.0 |
Fertility by Education by Marriage Status in Minnehaha
49.1% of women with births in Minnehaha are unmarried. Women with the educational attainment of bachelor's degree are most likely to be married with 100.0% of them married at childbirth, while women with the educational attainment of college or associate's degree are least likely to be married with 100.0% of them unmarried at childbirth.
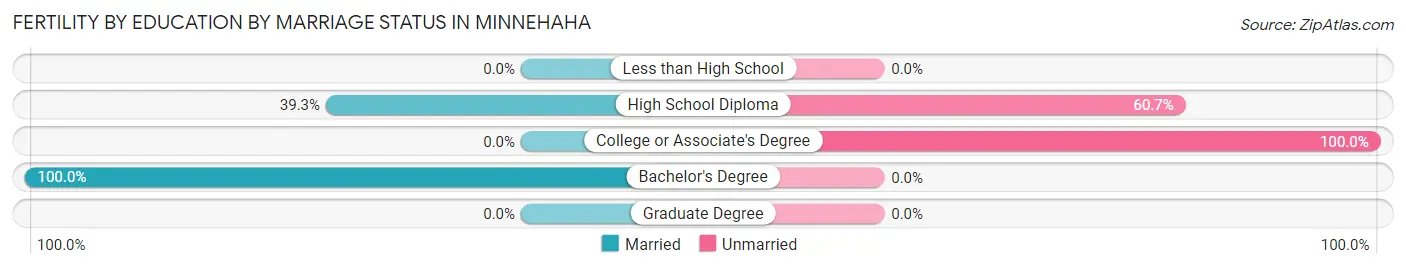
| Educational Attainment | Married | Unmarried |
| Less than High School | 0 (0.0%) | 0 (0.0%) |
| High School Diploma | 22 (39.3%) | 34 (60.7%) |
| College or Associate's Degree | 0 (0.0%) | 19 (100.0%) |
| Bachelor's Degree | 33 (100.0%) | 0 (0.0%) |
| Graduate Degree | 0 (0.0%) | 0 (0.0%) |
| Total | 55 (50.9%) | 53 (49.1%) |
Employment Characteristics in Minnehaha
Employment by Class of Employer in Minnehaha
Among the 5,885 employed individuals in Minnehaha, private company employees (3,743 | 63.6%), not-for-profit organizations (808 | 13.7%), and self-employed (not incorporated) (340 | 5.8%) make up the most common classes of employment.
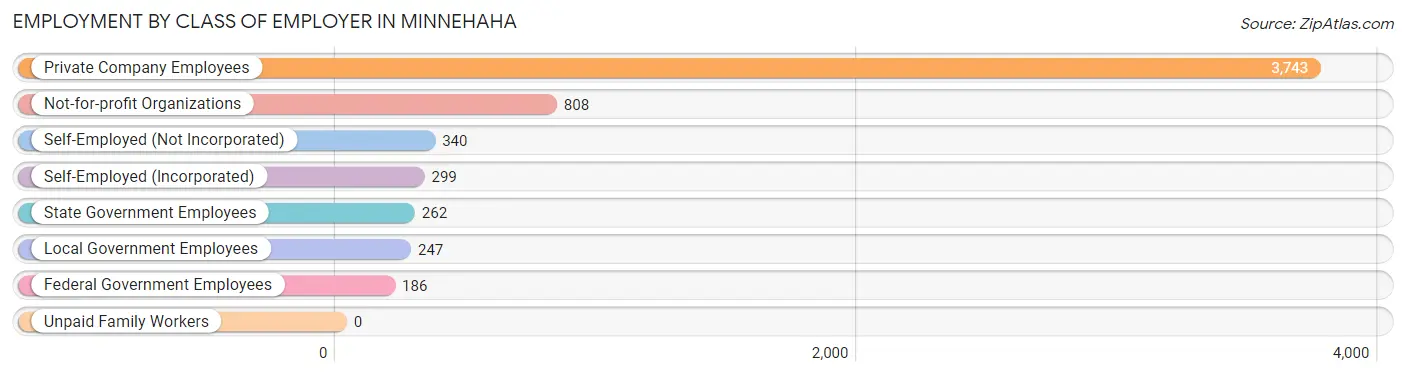
| Employer Class | # Employees | % Employees |
| Private Company Employees | 3,743 | 63.6% |
| Self-Employed (Incorporated) | 299 | 5.1% |
| Self-Employed (Not Incorporated) | 340 | 5.8% |
| Not-for-profit Organizations | 808 | 13.7% |
| Local Government Employees | 247 | 4.2% |
| State Government Employees | 262 | 4.4% |
| Federal Government Employees | 186 | 3.2% |
| Unpaid Family Workers | 0 | 0.0% |
| Total | 5,885 | 100.0% |
Employment Status by Age in Minnehaha
According to the labor force statistics for Minnehaha, out of the total population over 16 years of age (9,358), 69.6% or 6,513 individuals are in the labor force, with 7.8% or 508 of them unemployed. The age group with the highest labor force participation rate is 25 to 29 years, with 95.1% or 853 individuals in the labor force. Within the labor force, the 65 to 74 years age range has the highest percentage of unemployed individuals, with 23.6% or 46 of them being unemployed.
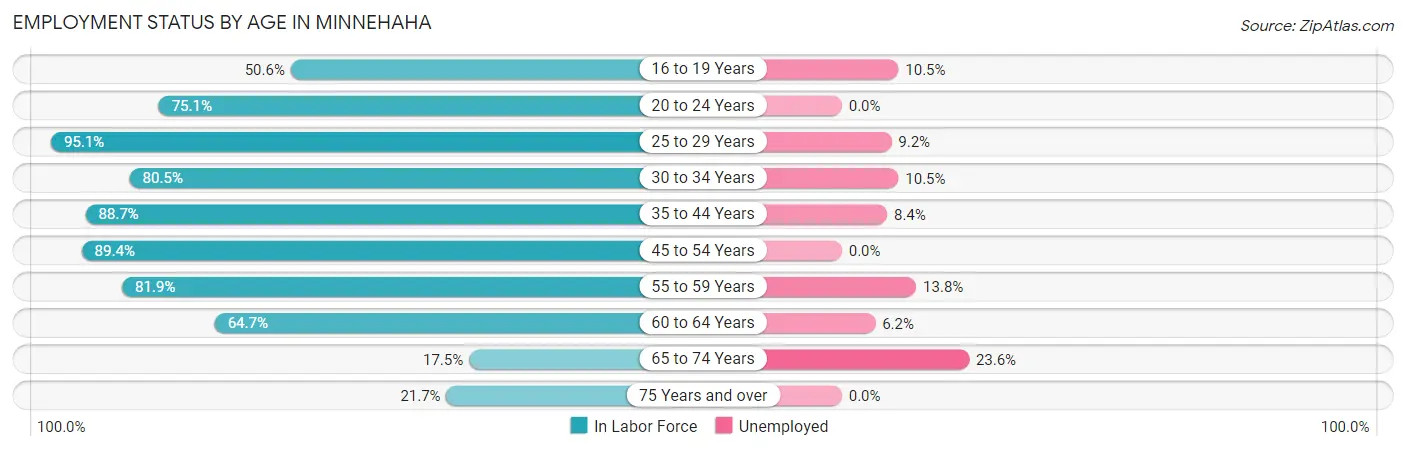
| Age Bracket | In Labor Force | Unemployed |
| 16 to 19 Years | 286 (50.6%) | 30 (10.5%) |
| 20 to 24 Years | 284 (75.1%) | 0 (0.0%) |
| 25 to 29 Years | 853 (95.1%) | 78 (9.2%) |
| 30 to 34 Years | 856 (80.5%) | 90 (10.5%) |
| 35 to 44 Years | 1,559 (88.7%) | 131 (8.4%) |
| 45 to 54 Years | 1,060 (89.4%) | 0 (0.0%) |
| 55 to 59 Years | 740 (81.9%) | 102 (13.8%) |
| 60 to 64 Years | 536 (64.7%) | 33 (6.2%) |
| 65 to 74 Years | 195 (17.5%) | 46 (23.6%) |
| 75 Years and over | 144 (21.7%) | 0 (0.0%) |
| Total | 6,513 (69.6%) | 508 (7.8%) |
Employment Status by Educational Attainment in Minnehaha
According to labor force statistics for Minnehaha, 84.5% of individuals (5,607) out of the total population between 25 and 64 years of age (6,636) are in the labor force, with 7.7% or 432 of them being unemployed. The group with the highest labor force participation rate are those with the educational attainment of bachelor's degree or higher, with 92.9% or 1,579 individuals in the labor force. Within the labor force, individuals with high school diploma education have the highest percentage of unemployment, with 11.3% or 165 of them being unemployed.
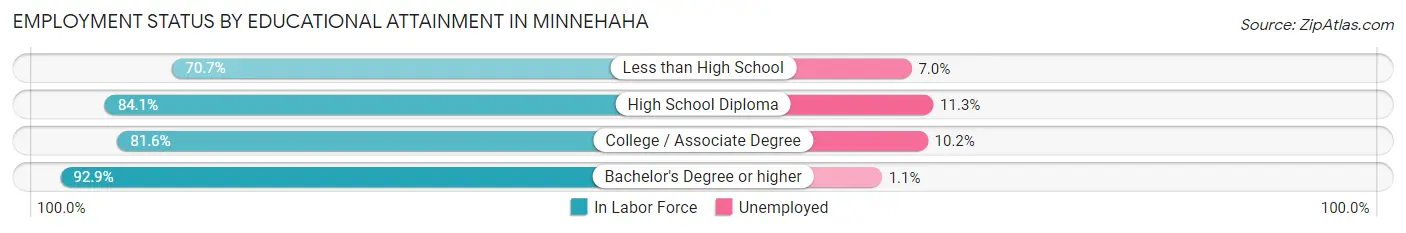
| Educational Attainment | In Labor Force | Unemployed |
| Less than High School | 285 (70.7%) | 28 (7.0%) |
| High School Diploma | 1,462 (84.1%) | 196 (11.3%) |
| College / Associate Degree | 2,281 (81.6%) | 285 (10.2%) |
| Bachelor's Degree or higher | 1,579 (92.9%) | 19 (1.1%) |
| Total | 5,607 (84.5%) | 511 (7.7%) |
Employment Occupations by Sex in Minnehaha
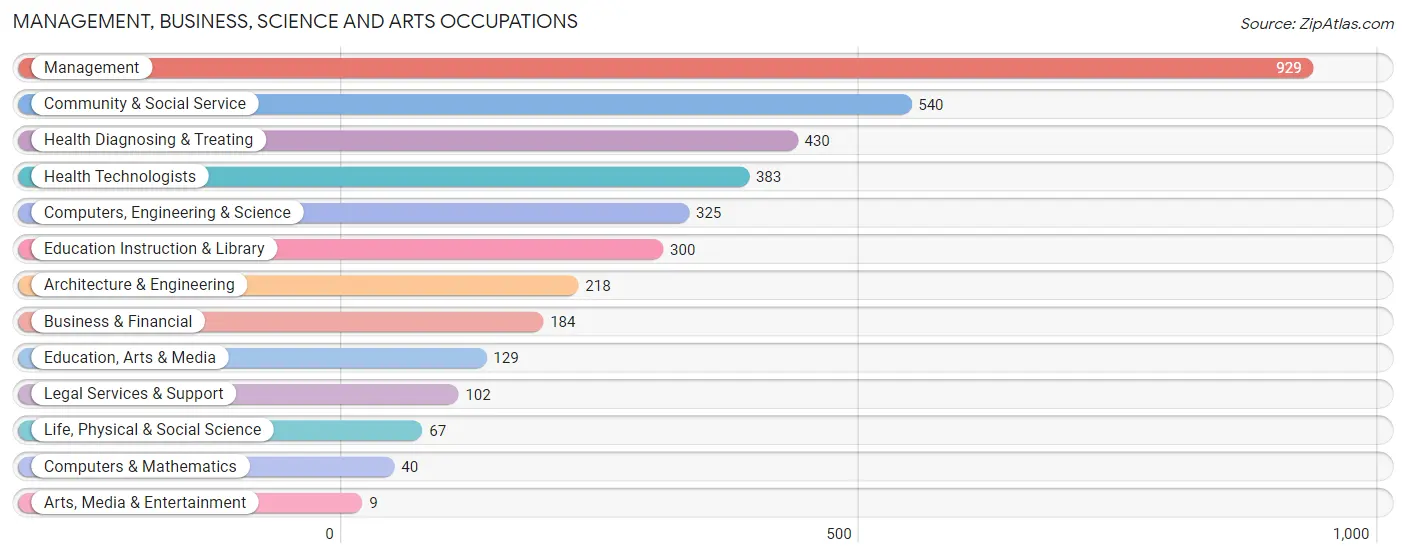
Management, Business, Science and Arts Occupations
The most common Management, Business, Science and Arts occupations in Minnehaha are Management (929 | 15.6%), Community & Social Service (540 | 9.1%), Health Diagnosing & Treating (430 | 7.2%), Health Technologists (383 | 6.4%), and Computers, Engineering & Science (325 | 5.4%).
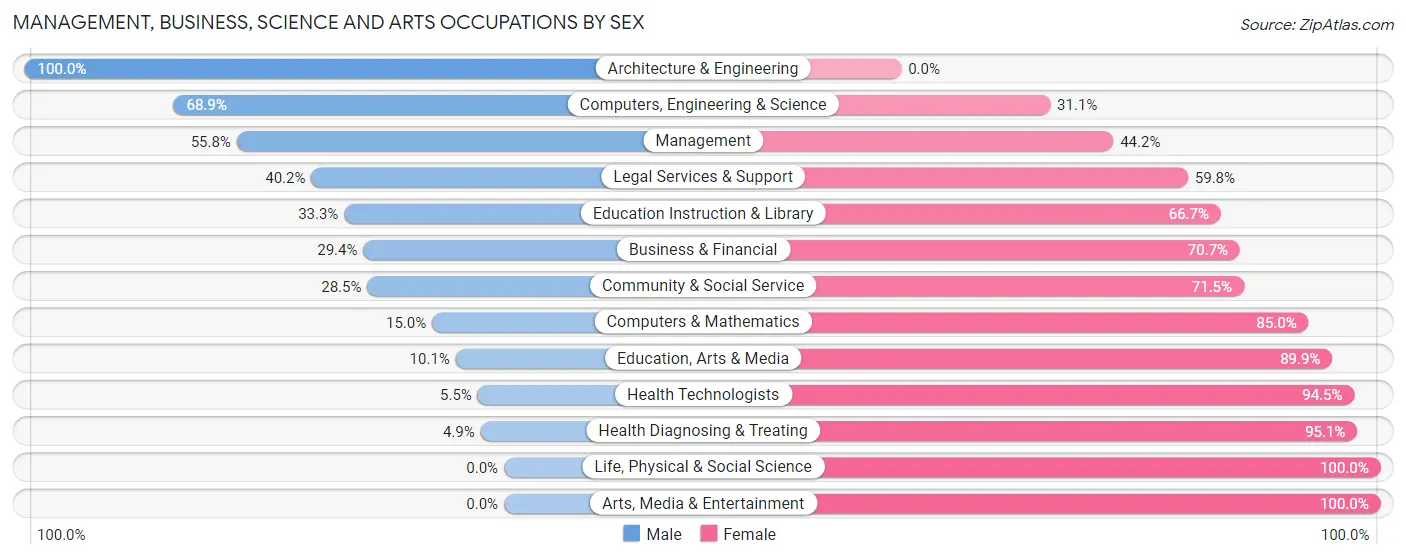
Management, Business, Science and Arts Occupations by Sex
Within the Management, Business, Science and Arts occupations in Minnehaha, the most male-oriented occupations are Architecture & Engineering (100.0%), Computers, Engineering & Science (68.9%), and Management (55.8%), while the most female-oriented occupations are Life, Physical & Social Science (100.0%), Arts, Media & Entertainment (100.0%), and Health Diagnosing & Treating (95.1%).
| Occupation | Male | Female |
| Management | 518 (55.8%) | 411 (44.2%) |
| Business & Financial | 54 (29.3%) | 130 (70.7%) |
| Computers, Engineering & Science | 224 (68.9%) | 101 (31.1%) |
| Computers & Mathematics | 6 (15.0%) | 34 (85.0%) |
| Architecture & Engineering | 218 (100.0%) | 0 (0.0%) |
| Life, Physical & Social Science | 0 (0.0%) | 67 (100.0%) |
| Community & Social Service | 154 (28.5%) | 386 (71.5%) |
| Education, Arts & Media | 13 (10.1%) | 116 (89.9%) |
| Legal Services & Support | 41 (40.2%) | 61 (59.8%) |
| Education Instruction & Library | 100 (33.3%) | 200 (66.7%) |
| Arts, Media & Entertainment | 0 (0.0%) | 9 (100.0%) |
| Health Diagnosing & Treating | 21 (4.9%) | 409 (95.1%) |
| Health Technologists | 21 (5.5%) | 362 (94.5%) |
| Total (Category) | 971 (40.3%) | 1,437 (59.7%) |
| Total (Overall) | 3,028 (50.8%) | 2,932 (49.2%) |
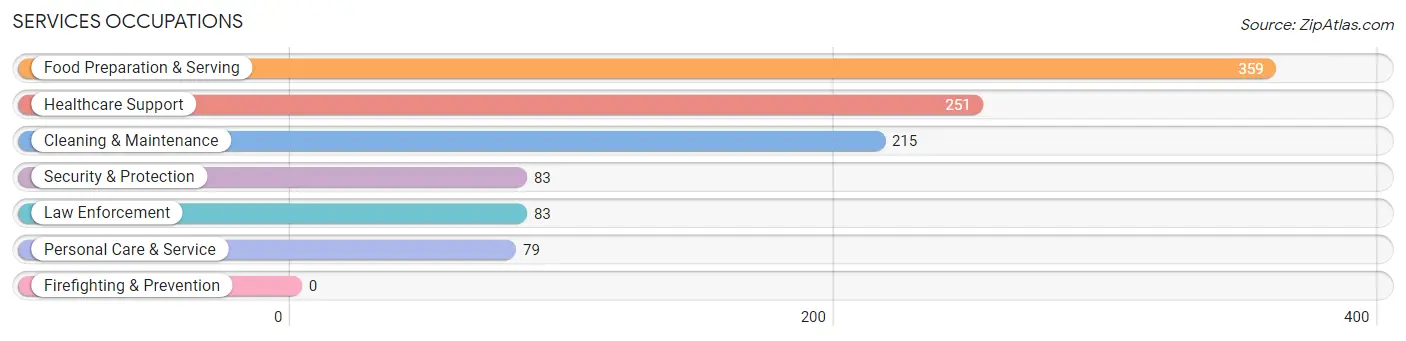
Services Occupations
The most common Services occupations in Minnehaha are Food Preparation & Serving (359 | 6.0%), Healthcare Support (251 | 4.2%), Cleaning & Maintenance (215 | 3.6%), Security & Protection (83 | 1.4%), and Law Enforcement (83 | 1.4%).
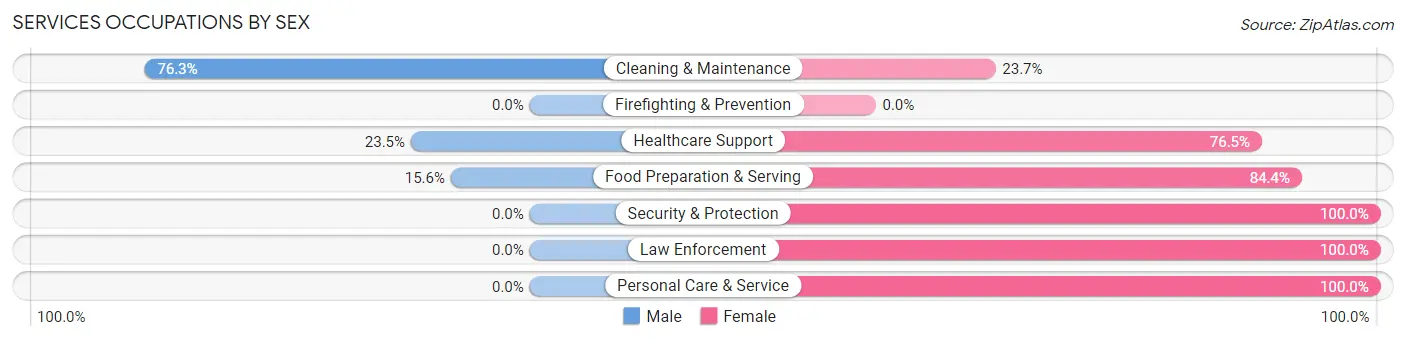
Services Occupations by Sex
Within the Services occupations in Minnehaha, the most male-oriented occupations are Cleaning & Maintenance (76.3%), Healthcare Support (23.5%), and Food Preparation & Serving (15.6%), while the most female-oriented occupations are Security & Protection (100.0%), Law Enforcement (100.0%), and Personal Care & Service (100.0%).
| Occupation | Male | Female |
| Healthcare Support | 59 (23.5%) | 192 (76.5%) |
| Security & Protection | 0 (0.0%) | 83 (100.0%) |
| Firefighting & Prevention | 0 (0.0%) | 0 (0.0%) |
| Law Enforcement | 0 (0.0%) | 83 (100.0%) |
| Food Preparation & Serving | 56 (15.6%) | 303 (84.4%) |
| Cleaning & Maintenance | 164 (76.3%) | 51 (23.7%) |
| Personal Care & Service | 0 (0.0%) | 79 (100.0%) |
| Total (Category) | 279 (28.3%) | 708 (71.7%) |
| Total (Overall) | 3,028 (50.8%) | 2,932 (49.2%) |
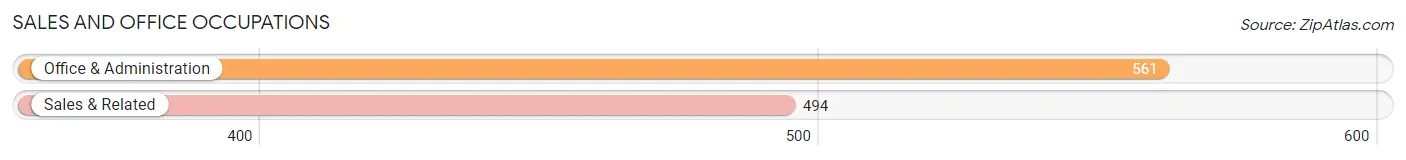
Sales and Office Occupations
The most common Sales and Office occupations in Minnehaha are Office & Administration (561 | 9.4%), and Sales & Related (494 | 8.3%).
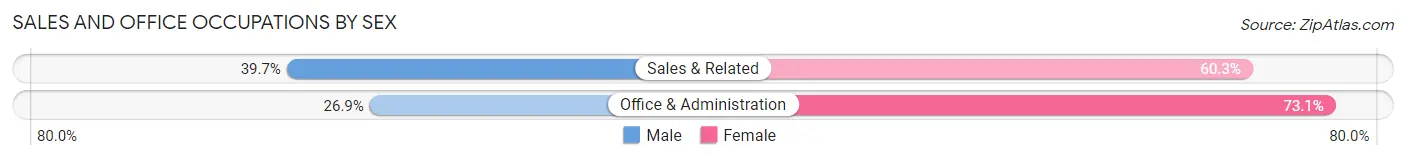
Sales and Office Occupations by Sex
| Occupation | Male | Female |
| Sales & Related | 196 (39.7%) | 298 (60.3%) |
| Office & Administration | 151 (26.9%) | 410 (73.1%) |
| Total (Category) | 347 (32.9%) | 708 (67.1%) |
| Total (Overall) | 3,028 (50.8%) | 2,932 (49.2%) |
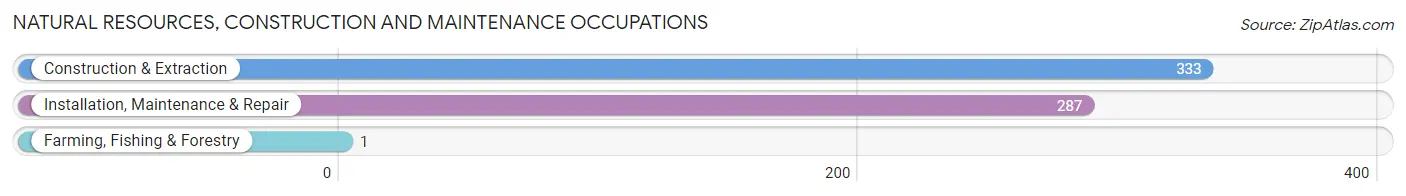
Natural Resources, Construction and Maintenance Occupations
The most common Natural Resources, Construction and Maintenance occupations in Minnehaha are Construction & Extraction (333 | 5.6%), Installation, Maintenance & Repair (287 | 4.8%), and Farming, Fishing & Forestry (1 | 0.0%).
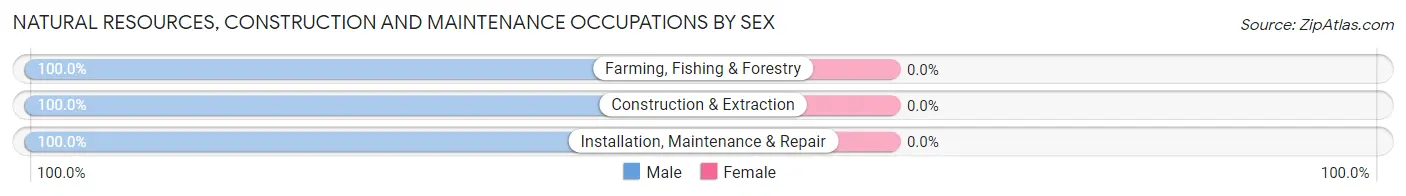
Natural Resources, Construction and Maintenance Occupations by Sex
| Occupation | Male | Female |
| Farming, Fishing & Forestry | 1 (100.0%) | 0 (0.0%) |
| Construction & Extraction | 333 (100.0%) | 0 (0.0%) |
| Installation, Maintenance & Repair | 287 (100.0%) | 0 (0.0%) |
| Total (Category) | 621 (100.0%) | 0 (0.0%) |
| Total (Overall) | 3,028 (50.8%) | 2,932 (49.2%) |
Production, Transportation and Moving Occupations
The most common Production, Transportation and Moving occupations in Minnehaha are Transportation (433 | 7.3%), Production (229 | 3.8%), and Material Moving (227 | 3.8%).
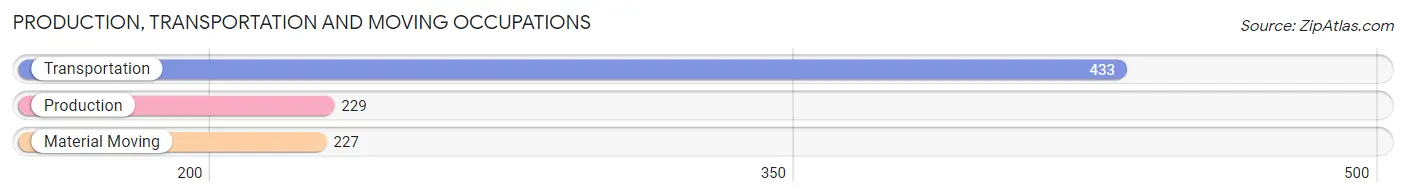
Production, Transportation and Moving Occupations by Sex
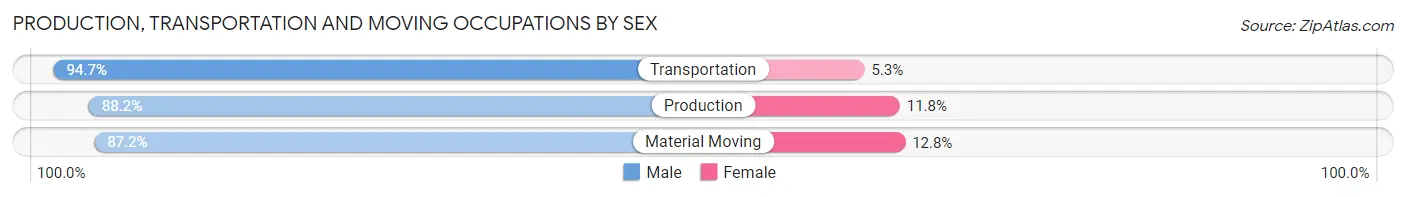
| Occupation | Male | Female |
| Production | 202 (88.2%) | 27 (11.8%) |
| Transportation | 410 (94.7%) | 23 (5.3%) |
| Material Moving | 198 (87.2%) | 29 (12.8%) |
| Total (Category) | 810 (91.1%) | 79 (8.9%) |
| Total (Overall) | 3,028 (50.8%) | 2,932 (49.2%) |
Employment Industries by Sex in Minnehaha
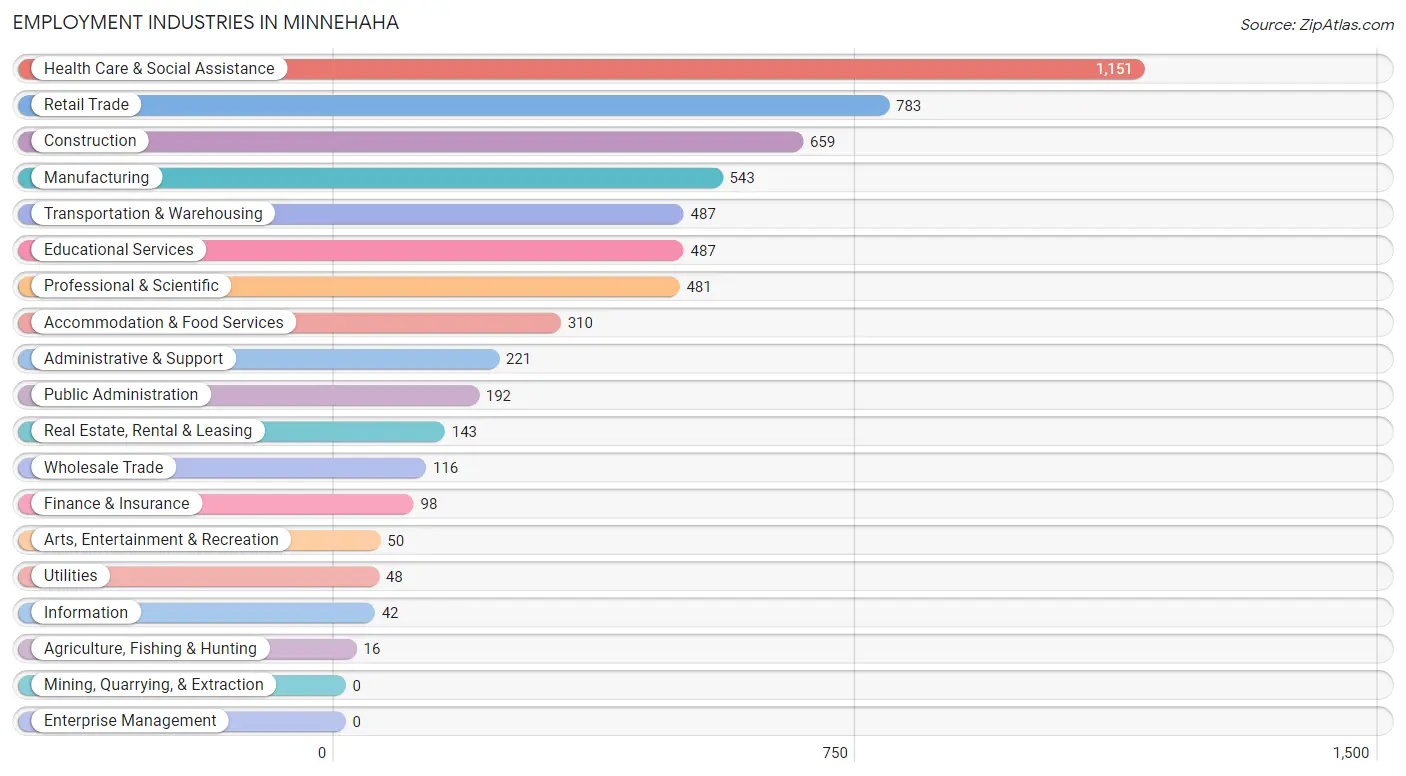
Employment Industries in Minnehaha
The major employment industries in Minnehaha include Health Care & Social Assistance (1,151 | 19.3%), Retail Trade (783 | 13.1%), Construction (659 | 11.1%), Manufacturing (543 | 9.1%), and Transportation & Warehousing (487 | 8.2%).
Employment Industries by Sex in Minnehaha
The Minnehaha industries that see more men than women are Agriculture, Fishing & Hunting (100.0%), Information (100.0%), and Wholesale Trade (95.7%), whereas the industries that tend to have a higher number of women are Educational Services (84.4%), Health Care & Social Assistance (78.9%), and Accommodation & Food Services (69.4%).
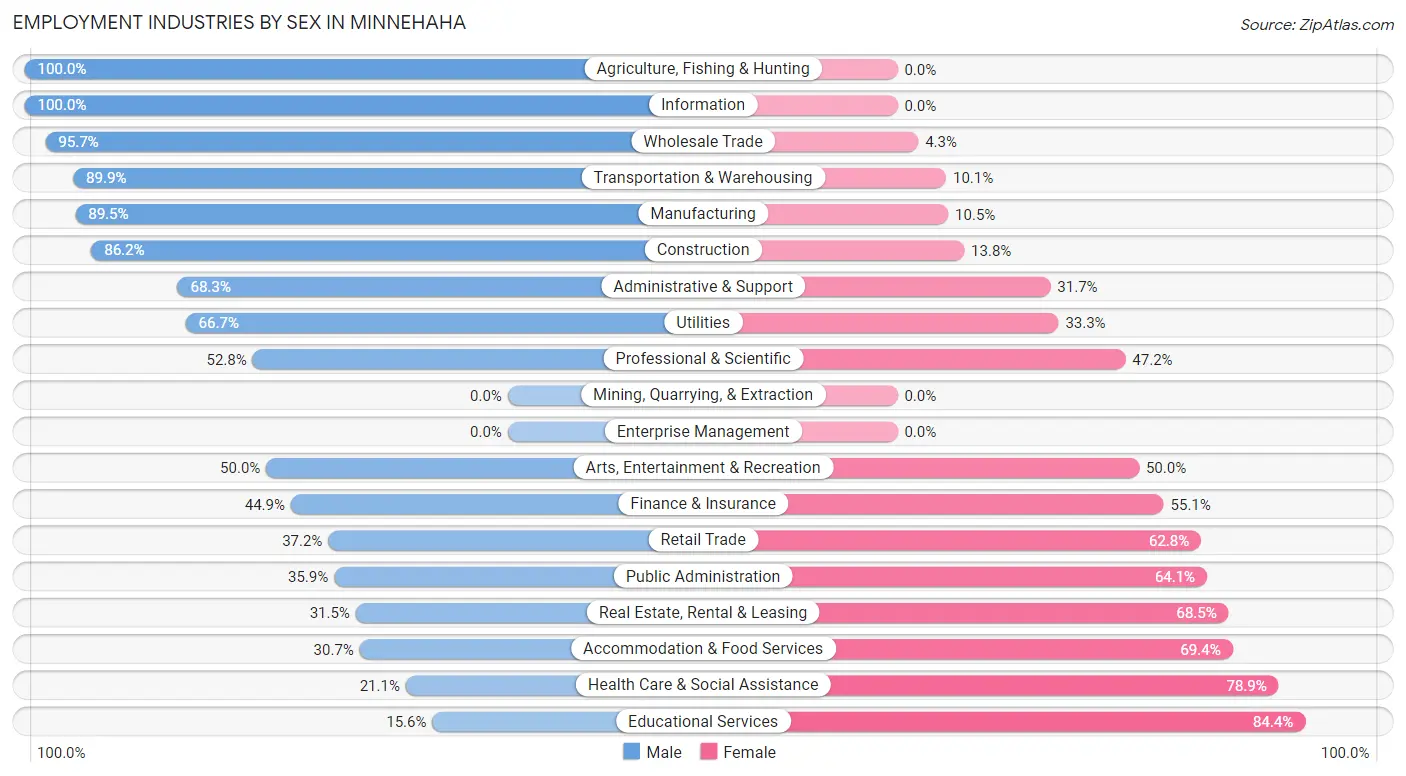
| Industry | Male | Female |
| Agriculture, Fishing & Hunting | 16 (100.0%) | 0 (0.0%) |
| Mining, Quarrying, & Extraction | 0 (0.0%) | 0 (0.0%) |
| Construction | 568 (86.2%) | 91 (13.8%) |
| Manufacturing | 486 (89.5%) | 57 (10.5%) |
| Wholesale Trade | 111 (95.7%) | 5 (4.3%) |
| Retail Trade | 291 (37.2%) | 492 (62.8%) |
| Transportation & Warehousing | 438 (89.9%) | 49 (10.1%) |
| Utilities | 32 (66.7%) | 16 (33.3%) |
| Information | 42 (100.0%) | 0 (0.0%) |
| Finance & Insurance | 44 (44.9%) | 54 (55.1%) |
| Real Estate, Rental & Leasing | 45 (31.5%) | 98 (68.5%) |
| Professional & Scientific | 254 (52.8%) | 227 (47.2%) |
| Enterprise Management | 0 (0.0%) | 0 (0.0%) |
| Administrative & Support | 151 (68.3%) | 70 (31.7%) |
| Educational Services | 76 (15.6%) | 411 (84.4%) |
| Health Care & Social Assistance | 243 (21.1%) | 908 (78.9%) |
| Arts, Entertainment & Recreation | 25 (50.0%) | 25 (50.0%) |
| Accommodation & Food Services | 95 (30.6%) | 215 (69.4%) |
| Public Administration | 69 (35.9%) | 123 (64.1%) |
| Total | 3,028 (50.8%) | 2,932 (49.2%) |
Education in Minnehaha
School Enrollment in Minnehaha
The most common levels of schooling among the 2,741 students in Minnehaha are elementary school (721 | 26.3%), middle school (596 | 21.7%), and high school (567 | 20.7%).
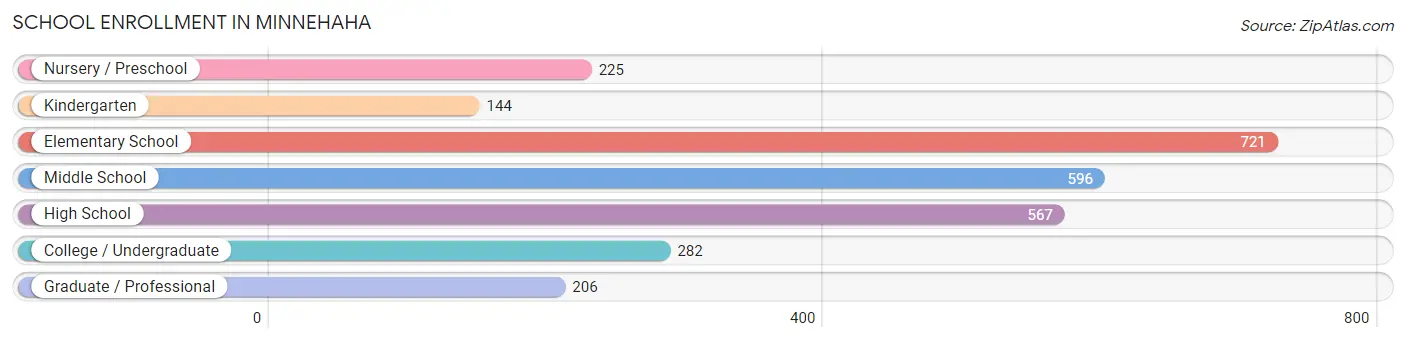
| School Level | # Students | % Students |
| Nursery / Preschool | 225 | 8.2% |
| Kindergarten | 144 | 5.2% |
| Elementary School | 721 | 26.3% |
| Middle School | 596 | 21.7% |
| High School | 567 | 20.7% |
| College / Undergraduate | 282 | 10.3% |
| Graduate / Professional | 206 | 7.5% |
| Total | 2,741 | 100.0% |
School Enrollment by Age by Funding Source in Minnehaha
Out of a total of 2,741 students who are enrolled in schools in Minnehaha, 743 (27.1%) attend a private institution, while the remaining 1,998 (72.9%) are enrolled in public schools. The age group of 35 years and over has the highest likelihood of being enrolled in private schools, with 177 (75.6% in the age bracket) enrolled. Conversely, the age group of 3 to 4 year olds has the lowest likelihood of being enrolled in a private school, with 17 (100.0% in the age bracket) attending a public institution.
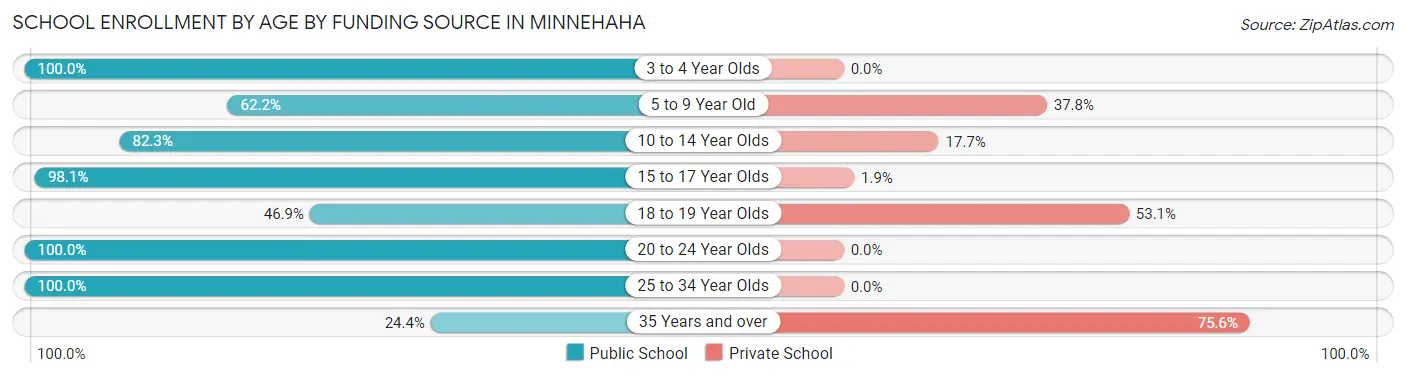
| Age Bracket | Public School | Private School |
| 3 to 4 Year Olds | 17 (100.0%) | 0 (0.0%) |
| 5 to 9 Year Old | 613 (62.2%) | 373 (37.8%) |
| 10 to 14 Year Olds | 619 (82.3%) | 133 (17.7%) |
| 15 to 17 Year Olds | 456 (98.1%) | 9 (1.9%) |
| 18 to 19 Year Olds | 45 (46.9%) | 51 (53.1%) |
| 20 to 24 Year Olds | 66 (100.0%) | 0 (0.0%) |
| 25 to 34 Year Olds | 125 (100.0%) | 0 (0.0%) |
| 35 Years and over | 57 (24.4%) | 177 (75.6%) |
| Total | 1,998 (72.9%) | 743 (27.1%) |
Educational Attainment by Field of Study in Minnehaha
Science & technology (361 | 17.0%), engineering (253 | 11.9%), education (233 | 11.0%), psychology (204 | 9.6%), and arts & humanities (190 | 8.9%) are the most common fields of study among 2,125 individuals in Minnehaha who have obtained a bachelor's degree or higher.
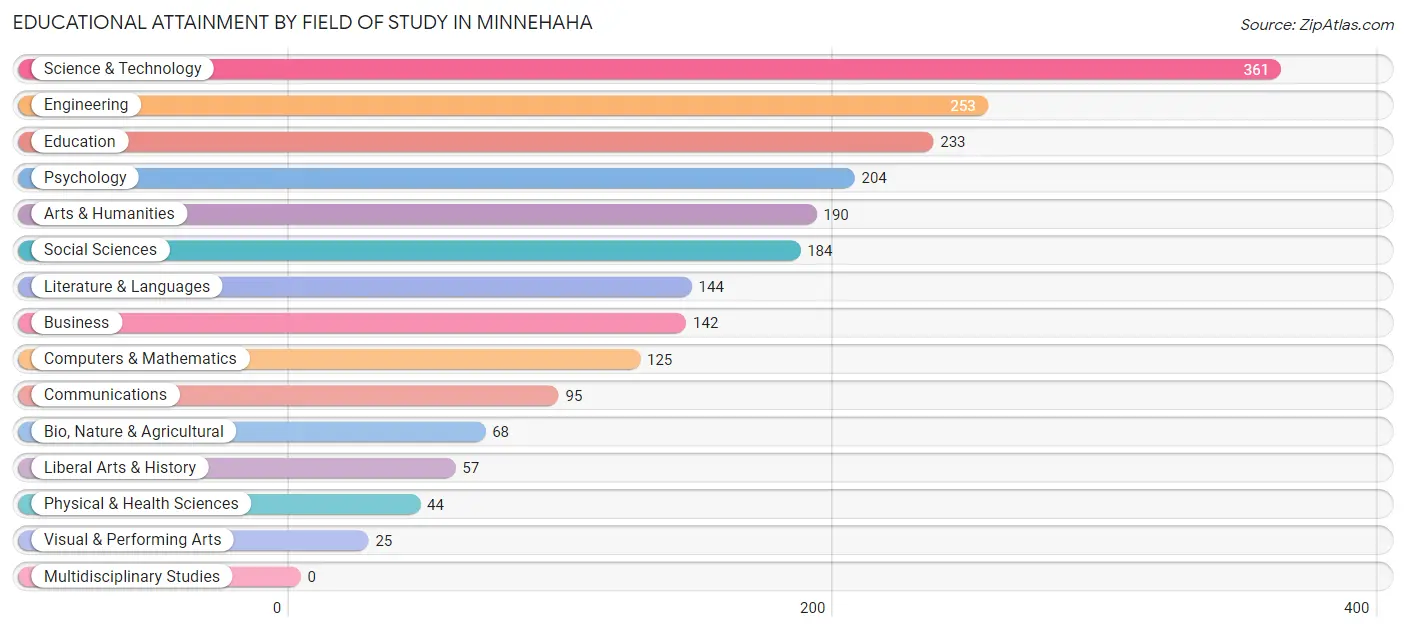
| Field of Study | # Graduates | % Graduates |
| Computers & Mathematics | 125 | 5.9% |
| Bio, Nature & Agricultural | 68 | 3.2% |
| Physical & Health Sciences | 44 | 2.1% |
| Psychology | 204 | 9.6% |
| Social Sciences | 184 | 8.7% |
| Engineering | 253 | 11.9% |
| Multidisciplinary Studies | 0 | 0.0% |
| Science & Technology | 361 | 17.0% |
| Business | 142 | 6.7% |
| Education | 233 | 11.0% |
| Literature & Languages | 144 | 6.8% |
| Liberal Arts & History | 57 | 2.7% |
| Visual & Performing Arts | 25 | 1.2% |
| Communications | 95 | 4.5% |
| Arts & Humanities | 190 | 8.9% |
| Total | 2,125 | 100.0% |
Transportation & Commute in Minnehaha
Vehicle Availability by Sex in Minnehaha
The most prevalent vehicle ownership categories in Minnehaha are males with 2 vehicles (1,270, accounting for 43.0%) and females with 2 vehicles (1,217, making up 43.5%).
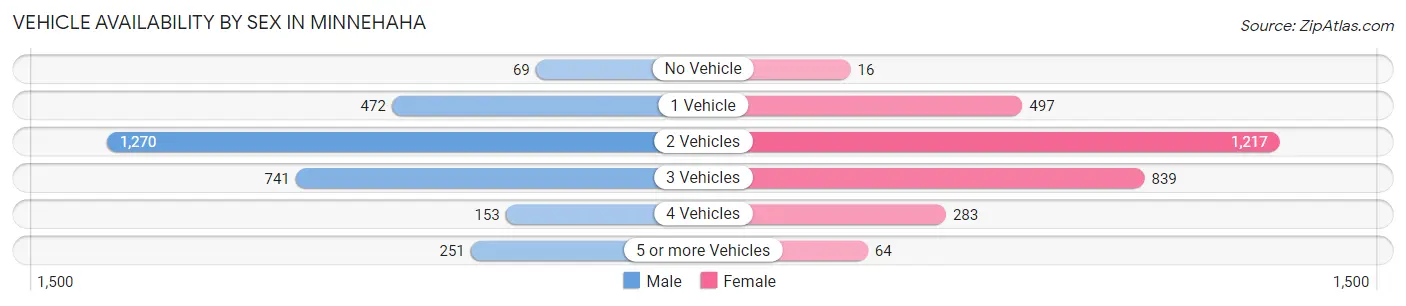
| Vehicles Available | Male | Female |
| No Vehicle | 69 (2.3%) | 16 (0.5%) |
| 1 Vehicle | 472 (16.0%) | 497 (17.0%) |
| 2 Vehicles | 1,270 (43.0%) | 1,217 (41.7%) |
| 3 Vehicles | 741 (25.1%) | 839 (28.8%) |
| 4 Vehicles | 153 (5.2%) | 283 (9.7%) |
| 5 or more Vehicles | 251 (8.5%) | 64 (2.2%) |
| Total | 2,956 (100.0%) | 2,916 (100.0%) |
Commute Time in Minnehaha
The most frequently occuring commute durations in Minnehaha are 15 to 19 minutes (1,071 commuters, 21.9%), 20 to 24 minutes (897 commuters, 18.4%), and 10 to 14 minutes (846 commuters, 17.3%).
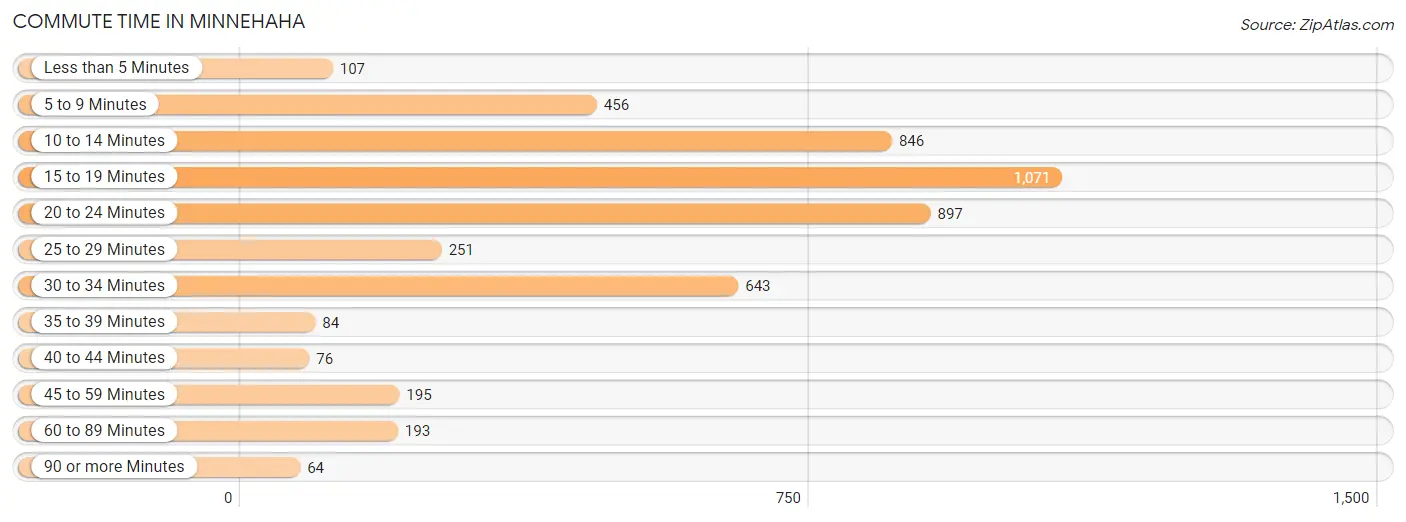
| Commute Time | # Commuters | % Commuters |
| Less than 5 Minutes | 107 | 2.2% |
| 5 to 9 Minutes | 456 | 9.3% |
| 10 to 14 Minutes | 846 | 17.3% |
| 15 to 19 Minutes | 1,071 | 21.9% |
| 20 to 24 Minutes | 897 | 18.4% |
| 25 to 29 Minutes | 251 | 5.1% |
| 30 to 34 Minutes | 643 | 13.2% |
| 35 to 39 Minutes | 84 | 1.7% |
| 40 to 44 Minutes | 76 | 1.6% |
| 45 to 59 Minutes | 195 | 4.0% |
| 60 to 89 Minutes | 193 | 4.0% |
| 90 or more Minutes | 64 | 1.3% |
Commute Time by Sex in Minnehaha
The most common commute times in Minnehaha are 20 to 24 minutes (526 commuters, 20.0%) for males and 15 to 19 minutes (553 commuters, 24.6%) for females.
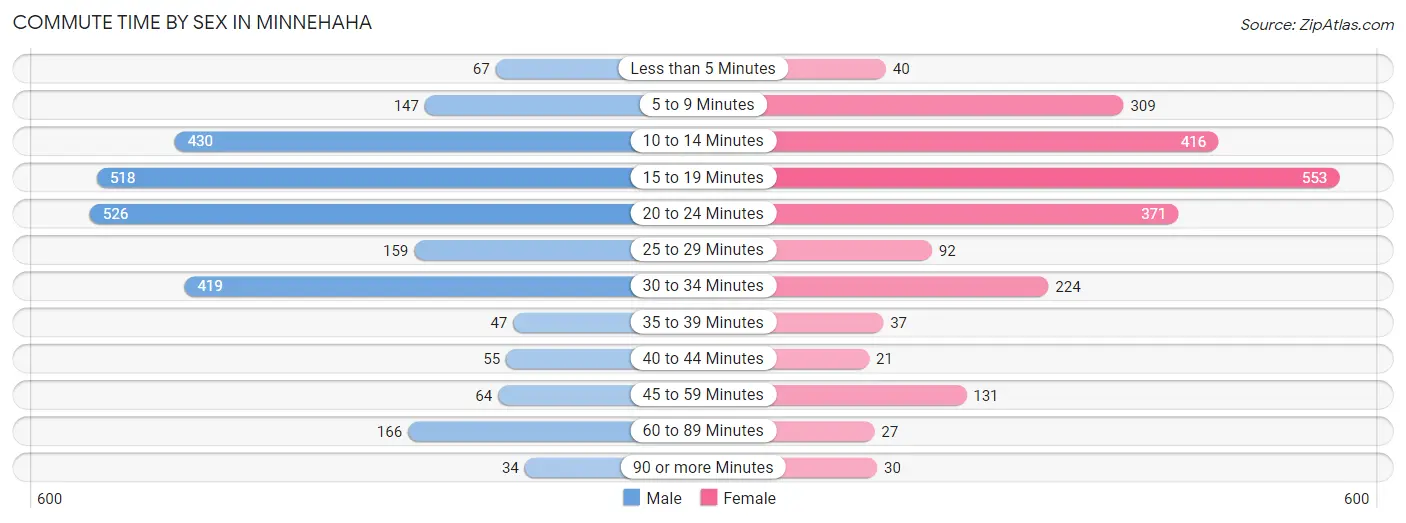
| Commute Time | Male | Female |
| Less than 5 Minutes | 67 (2.5%) | 40 (1.8%) |
| 5 to 9 Minutes | 147 (5.6%) | 309 (13.7%) |
| 10 to 14 Minutes | 430 (16.3%) | 416 (18.5%) |
| 15 to 19 Minutes | 518 (19.7%) | 553 (24.6%) |
| 20 to 24 Minutes | 526 (20.0%) | 371 (16.5%) |
| 25 to 29 Minutes | 159 (6.0%) | 92 (4.1%) |
| 30 to 34 Minutes | 419 (15.9%) | 224 (10.0%) |
| 35 to 39 Minutes | 47 (1.8%) | 37 (1.6%) |
| 40 to 44 Minutes | 55 (2.1%) | 21 (0.9%) |
| 45 to 59 Minutes | 64 (2.4%) | 131 (5.8%) |
| 60 to 89 Minutes | 166 (6.3%) | 27 (1.2%) |
| 90 or more Minutes | 34 (1.3%) | 30 (1.3%) |
Time of Departure to Work by Sex in Minnehaha
The most frequent times of departure to work in Minnehaha are 6:30 AM to 6:59 AM (320, 12.2%) for males and 7:30 AM to 7:59 AM (452, 20.1%) for females.
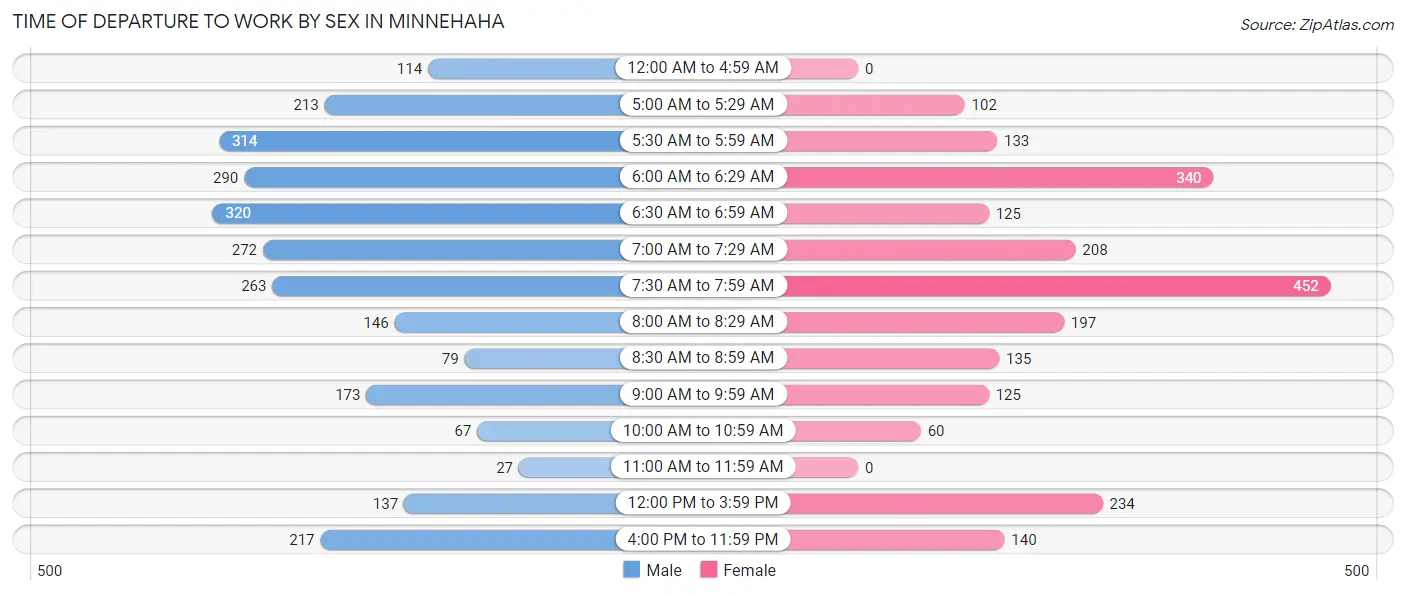
| Time of Departure | Male | Female |
| 12:00 AM to 4:59 AM | 114 (4.3%) | 0 (0.0%) |
| 5:00 AM to 5:29 AM | 213 (8.1%) | 102 (4.5%) |
| 5:30 AM to 5:59 AM | 314 (11.9%) | 133 (5.9%) |
| 6:00 AM to 6:29 AM | 290 (11.0%) | 340 (15.1%) |
| 6:30 AM to 6:59 AM | 320 (12.2%) | 125 (5.6%) |
| 7:00 AM to 7:29 AM | 272 (10.3%) | 208 (9.2%) |
| 7:30 AM to 7:59 AM | 263 (10.0%) | 452 (20.1%) |
| 8:00 AM to 8:29 AM | 146 (5.6%) | 197 (8.7%) |
| 8:30 AM to 8:59 AM | 79 (3.0%) | 135 (6.0%) |
| 9:00 AM to 9:59 AM | 173 (6.6%) | 125 (5.6%) |
| 10:00 AM to 10:59 AM | 67 (2.5%) | 60 (2.7%) |
| 11:00 AM to 11:59 AM | 27 (1.0%) | 0 (0.0%) |
| 12:00 PM to 3:59 PM | 137 (5.2%) | 234 (10.4%) |
| 4:00 PM to 11:59 PM | 217 (8.2%) | 140 (6.2%) |
| Total | 2,632 (100.0%) | 2,251 (100.0%) |
Housing Occupancy in Minnehaha
Occupancy by Ownership in Minnehaha
Of the total 4,439 dwellings in Minnehaha, owner-occupied units account for 3,339 (75.2%), while renter-occupied units make up 1,100 (24.8%).
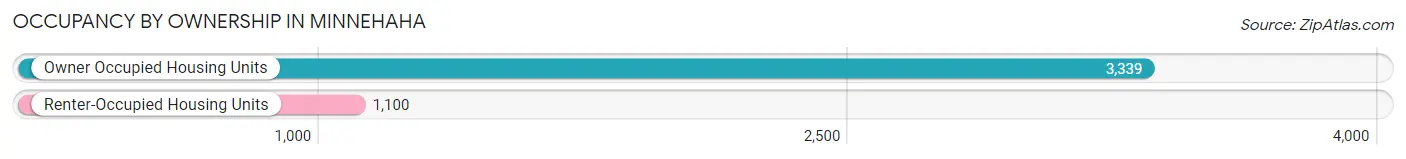
| Occupancy | # Housing Units | % Housing Units |
| Owner Occupied Housing Units | 3,339 | 75.2% |
| Renter-Occupied Housing Units | 1,100 | 24.8% |
| Total Occupied Housing Units | 4,439 | 100.0% |
Occupancy by Household Size in Minnehaha
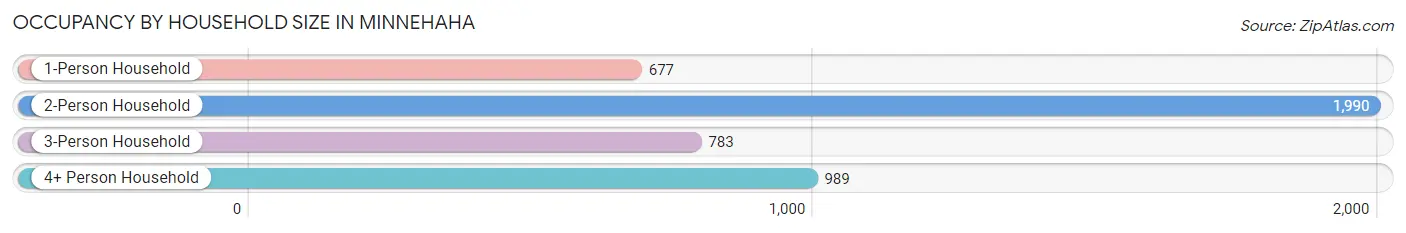
| Household Size | # Housing Units | % Housing Units |
| 1-Person Household | 677 | 15.2% |
| 2-Person Household | 1,990 | 44.8% |
| 3-Person Household | 783 | 17.6% |
| 4+ Person Household | 989 | 22.3% |
| Total Housing Units | 4,439 | 100.0% |
Occupancy by Ownership by Household Size in Minnehaha
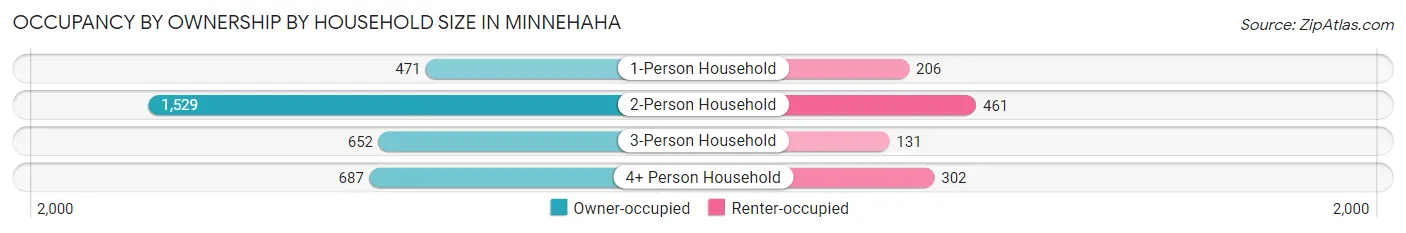
| Household Size | Owner-occupied | Renter-occupied |
| 1-Person Household | 471 (69.6%) | 206 (30.4%) |
| 2-Person Household | 1,529 (76.8%) | 461 (23.2%) |
| 3-Person Household | 652 (83.3%) | 131 (16.7%) |
| 4+ Person Household | 687 (69.5%) | 302 (30.5%) |
| Total Housing Units | 3,339 (75.2%) | 1,100 (24.8%) |
Occupancy by Educational Attainment in Minnehaha
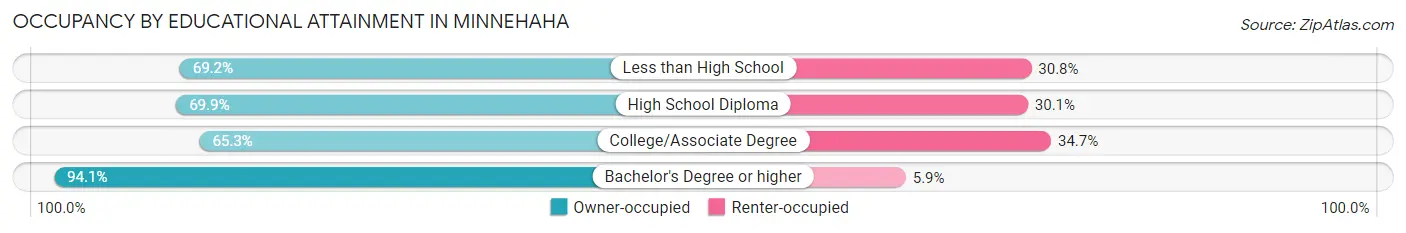
| Household Size | Owner-occupied | Renter-occupied |
| Less than High School | 171 (69.2%) | 76 (30.8%) |
| High School Diploma | 479 (69.9%) | 206 (30.1%) |
| College/Associate Degree | 1,389 (65.3%) | 737 (34.7%) |
| Bachelor's Degree or higher | 1,300 (94.1%) | 81 (5.9%) |
Occupancy by Age of Householder in Minnehaha
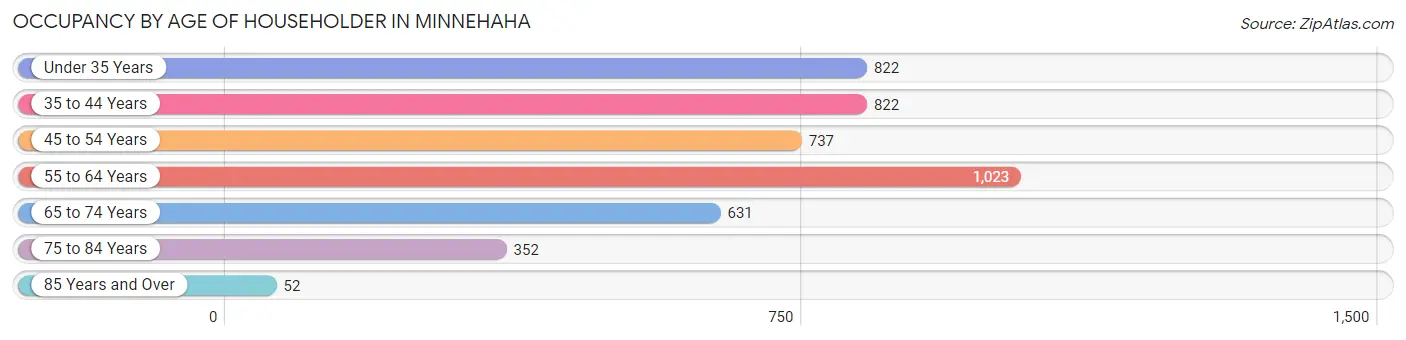
| Age Bracket | # Households | % Households |
| Under 35 Years | 822 | 18.5% |
| 35 to 44 Years | 822 | 18.5% |
| 45 to 54 Years | 737 | 16.6% |
| 55 to 64 Years | 1,023 | 23.1% |
| 65 to 74 Years | 631 | 14.2% |
| 75 to 84 Years | 352 | 7.9% |
| 85 Years and Over | 52 | 1.2% |
| Total | 4,439 | 100.0% |
Housing Finances in Minnehaha
Median Income by Occupancy in Minnehaha
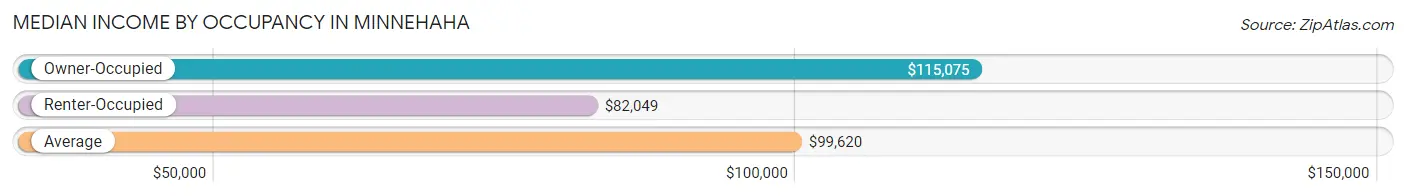
| Occupancy Type | # Households | Median Income |
| Owner-Occupied | 3,339 (75.2%) | $115,075 |
| Renter-Occupied | 1,100 (24.8%) | $82,049 |
| Average | 4,439 (100.0%) | $99,620 |
Occupancy by Householder Income Bracket in Minnehaha
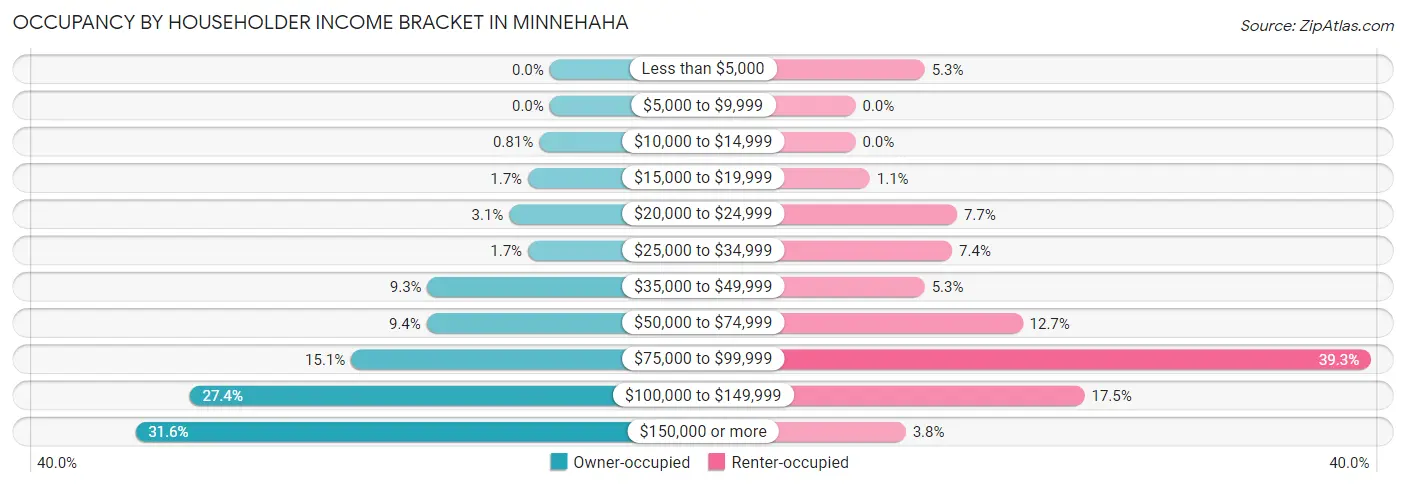
| Income Bracket | Owner-occupied | Renter-occupied |
| Less than $5,000 | 0 (0.0%) | 58 (5.3%) |
| $5,000 to $9,999 | 0 (0.0%) | 0 (0.0%) |
| $10,000 to $14,999 | 27 (0.8%) | 0 (0.0%) |
| $15,000 to $19,999 | 55 (1.7%) | 12 (1.1%) |
| $20,000 to $24,999 | 103 (3.1%) | 85 (7.7%) |
| $25,000 to $34,999 | 55 (1.7%) | 81 (7.4%) |
| $35,000 to $49,999 | 311 (9.3%) | 58 (5.3%) |
| $50,000 to $74,999 | 313 (9.4%) | 140 (12.7%) |
| $75,000 to $99,999 | 505 (15.1%) | 432 (39.3%) |
| $100,000 to $149,999 | 916 (27.4%) | 192 (17.4%) |
| $150,000 or more | 1,054 (31.6%) | 42 (3.8%) |
| Total | 3,339 (100.0%) | 1,100 (100.0%) |
Monthly Housing Cost Tiers in Minnehaha
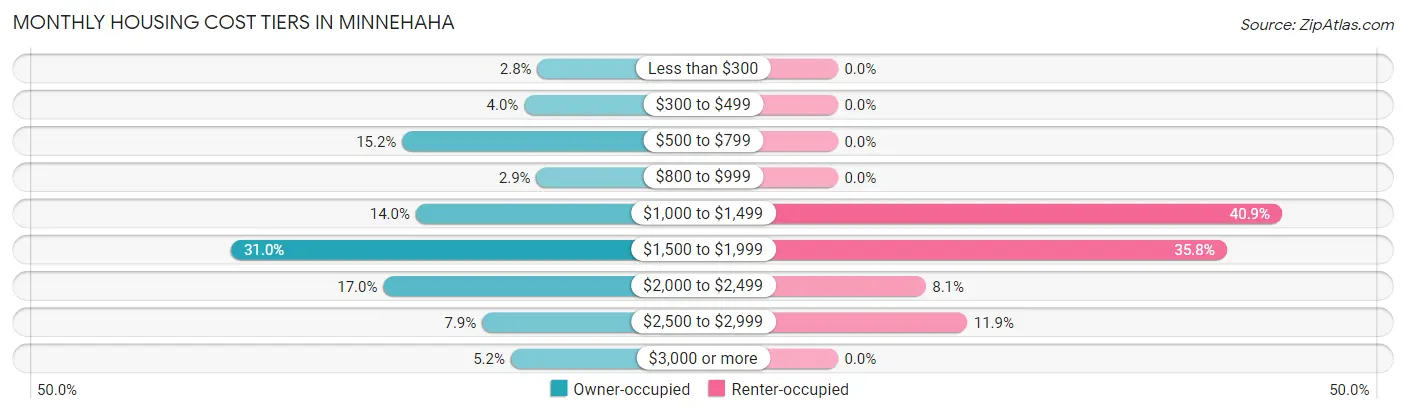
| Monthly Cost | Owner-occupied | Renter-occupied |
| Less than $300 | 93 (2.8%) | 0 (0.0%) |
| $300 to $499 | 134 (4.0%) | 0 (0.0%) |
| $500 to $799 | 509 (15.2%) | 0 (0.0%) |
| $800 to $999 | 96 (2.9%) | 0 (0.0%) |
| $1,000 to $1,499 | 467 (14.0%) | 450 (40.9%) |
| $1,500 to $1,999 | 1,035 (31.0%) | 394 (35.8%) |
| $2,000 to $2,499 | 567 (17.0%) | 89 (8.1%) |
| $2,500 to $2,999 | 263 (7.9%) | 131 (11.9%) |
| $3,000 or more | 175 (5.2%) | 0 (0.0%) |
| Total | 3,339 (100.0%) | 1,100 (100.0%) |
Physical Housing Characteristics in Minnehaha
Housing Structures in Minnehaha
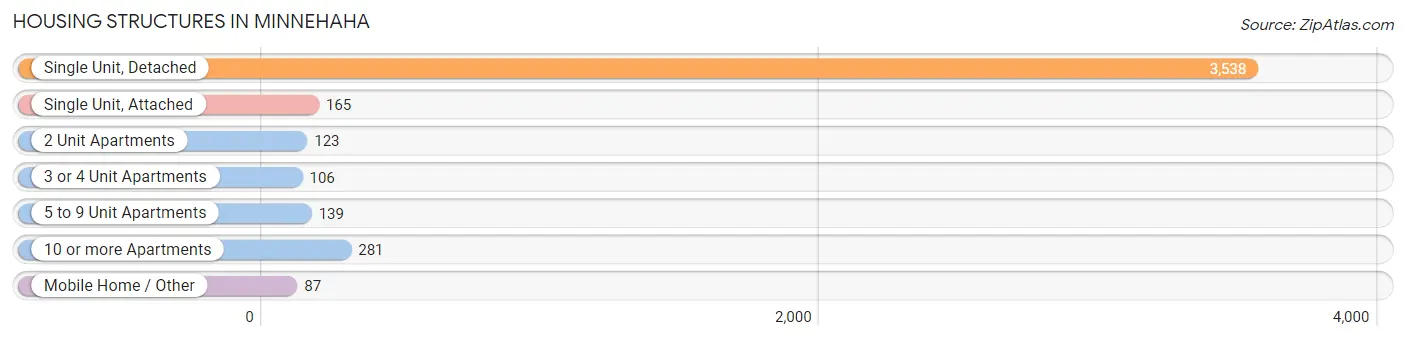
| Structure Type | # Housing Units | % Housing Units |
| Single Unit, Detached | 3,538 | 79.7% |
| Single Unit, Attached | 165 | 3.7% |
| 2 Unit Apartments | 123 | 2.8% |
| 3 or 4 Unit Apartments | 106 | 2.4% |
| 5 to 9 Unit Apartments | 139 | 3.1% |
| 10 or more Apartments | 281 | 6.3% |
| Mobile Home / Other | 87 | 2.0% |
| Total | 4,439 | 100.0% |
Housing Structures by Occupancy in Minnehaha
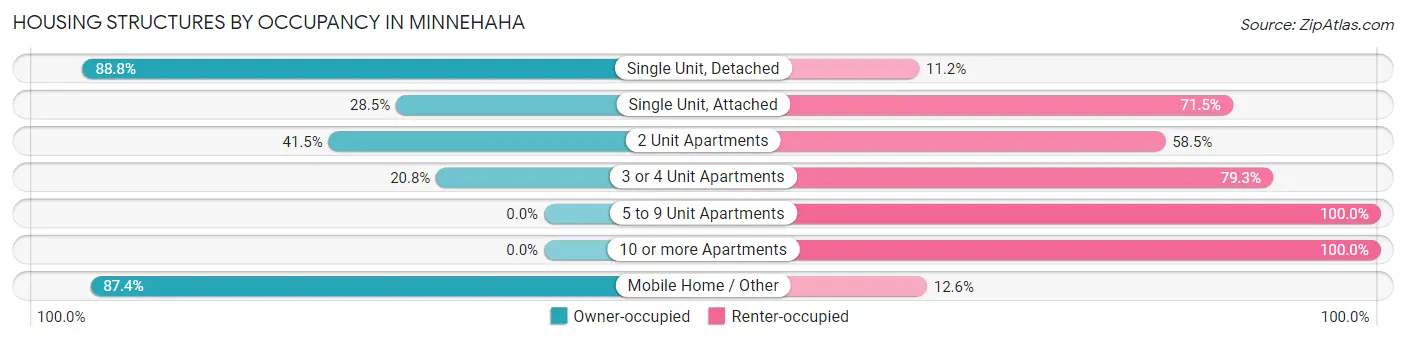
| Structure Type | Owner-occupied | Renter-occupied |
| Single Unit, Detached | 3,143 (88.8%) | 395 (11.2%) |
| Single Unit, Attached | 47 (28.5%) | 118 (71.5%) |
| 2 Unit Apartments | 51 (41.5%) | 72 (58.5%) |
| 3 or 4 Unit Apartments | 22 (20.7%) | 84 (79.2%) |
| 5 to 9 Unit Apartments | 0 (0.0%) | 139 (100.0%) |
| 10 or more Apartments | 0 (0.0%) | 281 (100.0%) |
| Mobile Home / Other | 76 (87.4%) | 11 (12.6%) |
| Total | 3,339 (75.2%) | 1,100 (24.8%) |
Housing Structures by Number of Rooms in Minnehaha
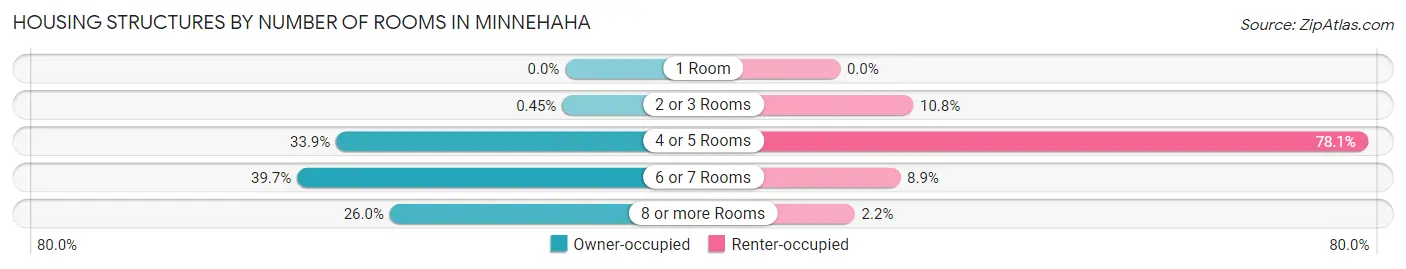
| Number of Rooms | Owner-occupied | Renter-occupied |
| 1 Room | 0 (0.0%) | 0 (0.0%) |
| 2 or 3 Rooms | 15 (0.4%) | 119 (10.8%) |
| 4 or 5 Rooms | 1,132 (33.9%) | 859 (78.1%) |
| 6 or 7 Rooms | 1,325 (39.7%) | 98 (8.9%) |
| 8 or more Rooms | 867 (26.0%) | 24 (2.2%) |
| Total | 3,339 (100.0%) | 1,100 (100.0%) |
Housing Structure by Heating Type in Minnehaha
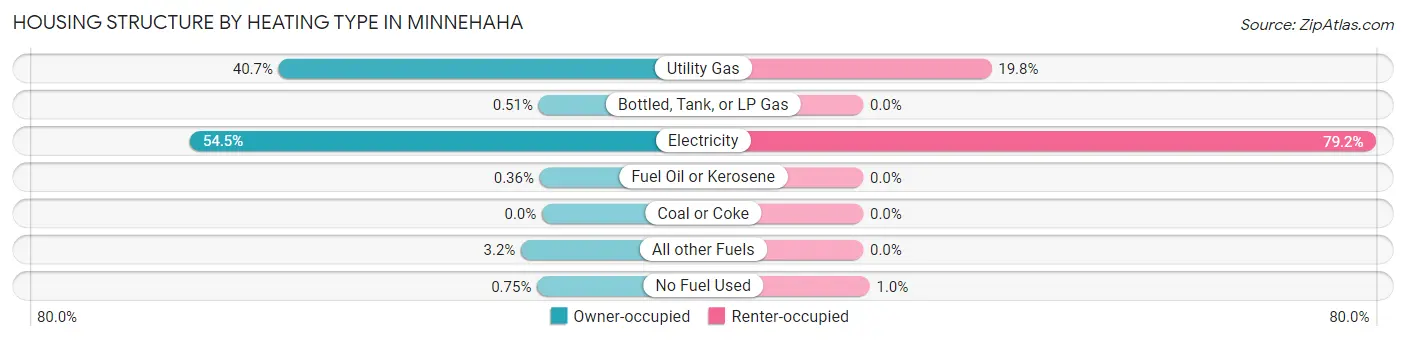
| Heating Type | Owner-occupied | Renter-occupied |
| Utility Gas | 1,359 (40.7%) | 218 (19.8%) |
| Bottled, Tank, or LP Gas | 17 (0.5%) | 0 (0.0%) |
| Electricity | 1,818 (54.4%) | 871 (79.2%) |
| Fuel Oil or Kerosene | 12 (0.4%) | 0 (0.0%) |
| Coal or Coke | 0 (0.0%) | 0 (0.0%) |
| All other Fuels | 108 (3.2%) | 0 (0.0%) |
| No Fuel Used | 25 (0.7%) | 11 (1.0%) |
| Total | 3,339 (100.0%) | 1,100 (100.0%) |
Household Vehicle Usage in Minnehaha
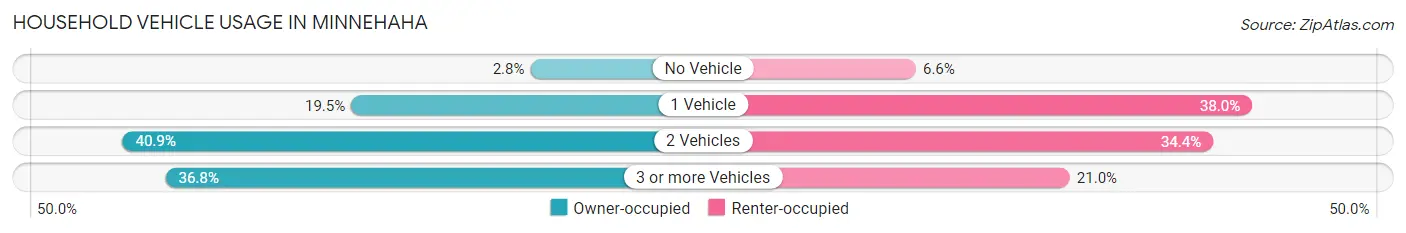
| Vehicles per Household | Owner-occupied | Renter-occupied |
| No Vehicle | 93 (2.8%) | 73 (6.6%) |
| 1 Vehicle | 652 (19.5%) | 418 (38.0%) |
| 2 Vehicles | 1,364 (40.8%) | 378 (34.4%) |
| 3 or more Vehicles | 1,230 (36.8%) | 231 (21.0%) |
| Total | 3,339 (100.0%) | 1,100 (100.0%) |
Real Estate & Mortgages in Minnehaha
Real Estate and Mortgage Overview in Minnehaha
| Characteristic | Without Mortgage | With Mortgage |
| Housing Units | 883 | 2,456 |
| Median Property Value | $303,400 | $411,100 |
| Median Household Income | $79,799 | $878 |
| Monthly Housing Costs | $615 | $158 |
| Real Estate Taxes | $3,465 | $123 |
Property Value by Mortgage Status in Minnehaha
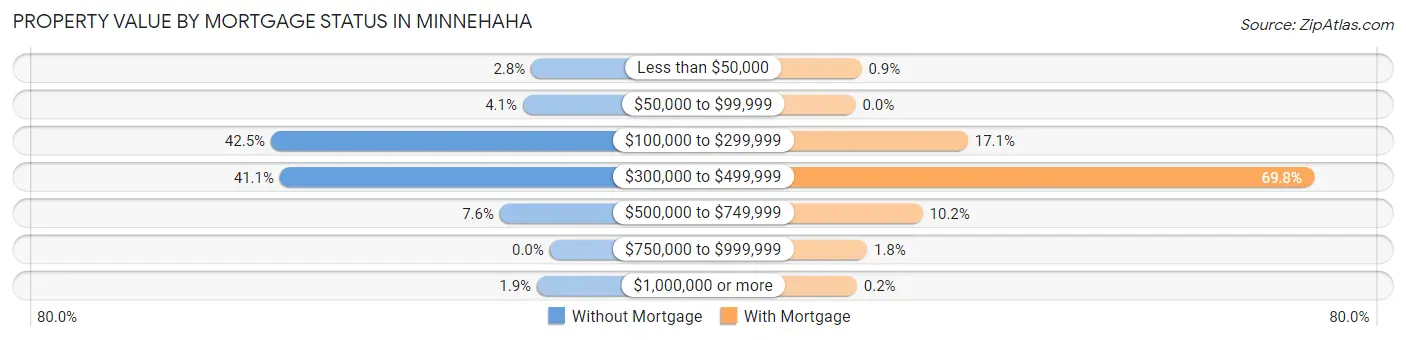
| Property Value | Without Mortgage | With Mortgage |
| Less than $50,000 | 25 (2.8%) | 22 (0.9%) |
| $50,000 to $99,999 | 36 (4.1%) | 0 (0.0%) |
| $100,000 to $299,999 | 375 (42.5%) | 420 (17.1%) |
| $300,000 to $499,999 | 363 (41.1%) | 1,715 (69.8%) |
| $500,000 to $749,999 | 67 (7.6%) | 251 (10.2%) |
| $750,000 to $999,999 | 0 (0.0%) | 43 (1.8%) |
| $1,000,000 or more | 17 (1.9%) | 5 (0.2%) |
| Total | 883 (100.0%) | 2,456 (100.0%) |
Household Income by Mortgage Status in Minnehaha
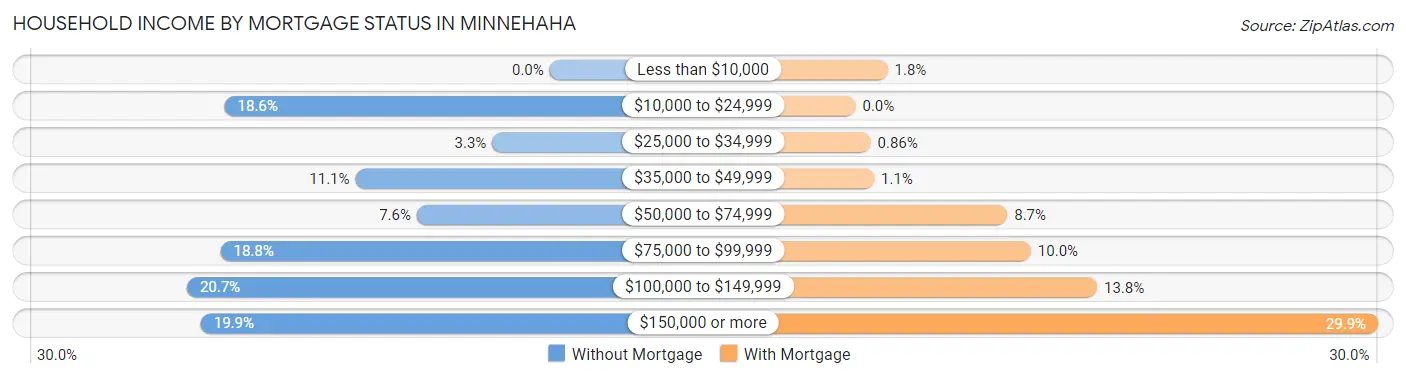
| Household Income | Without Mortgage | With Mortgage |
| Less than $10,000 | 0 (0.0%) | 45 (1.8%) |
| $10,000 to $24,999 | 164 (18.6%) | 0 (0.0%) |
| $25,000 to $34,999 | 29 (3.3%) | 21 (0.9%) |
| $35,000 to $49,999 | 98 (11.1%) | 26 (1.1%) |
| $50,000 to $74,999 | 67 (7.6%) | 213 (8.7%) |
| $75,000 to $99,999 | 166 (18.8%) | 246 (10.0%) |
| $100,000 to $149,999 | 183 (20.7%) | 339 (13.8%) |
| $150,000 or more | 176 (19.9%) | 733 (29.8%) |
| Total | 883 (100.0%) | 2,456 (100.0%) |
Property Value to Household Income Ratio in Minnehaha
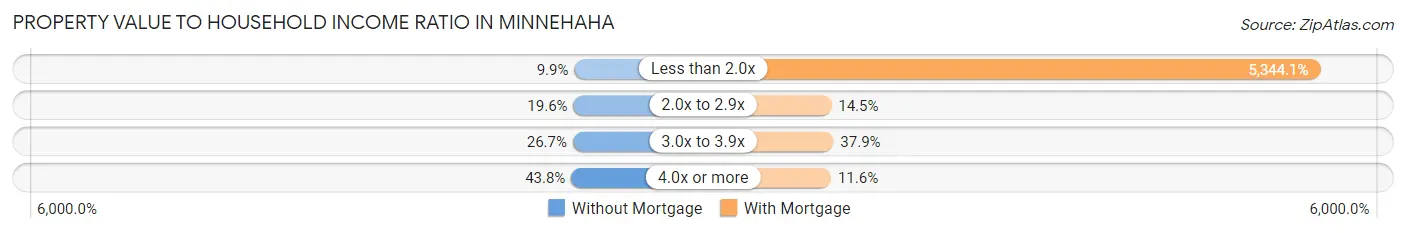
| Value-to-Income Ratio | Without Mortgage | With Mortgage |
| Less than 2.0x | 87 (9.9%) | 131,250 (5,344.1%) |
| 2.0x to 2.9x | 173 (19.6%) | 356 (14.5%) |
| 3.0x to 3.9x | 236 (26.7%) | 931 (37.9%) |
| 4.0x or more | 387 (43.8%) | 286 (11.6%) |
| Total | 883 (100.0%) | 2,456 (100.0%) |
Real Estate Taxes by Mortgage Status in Minnehaha
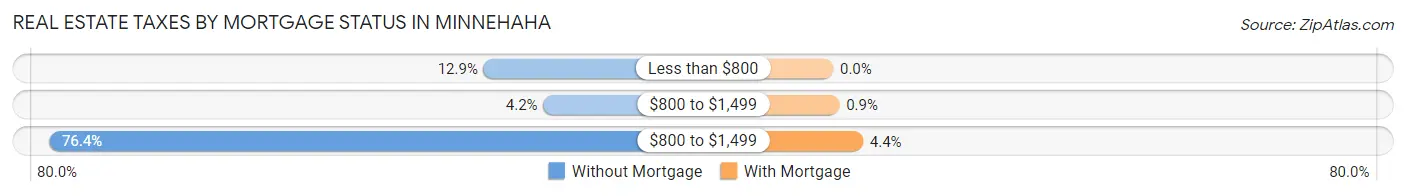
| Property Taxes | Without Mortgage | With Mortgage |
| Less than $800 | 114 (12.9%) | 0 (0.0%) |
| $800 to $1,499 | 37 (4.2%) | 22 (0.9%) |
| $800 to $1,499 | 675 (76.4%) | 107 (4.4%) |
| Total | 883 (100.0%) | 2,456 (100.0%) |
Health & Disability in Minnehaha
Health Insurance Coverage by Age in Minnehaha
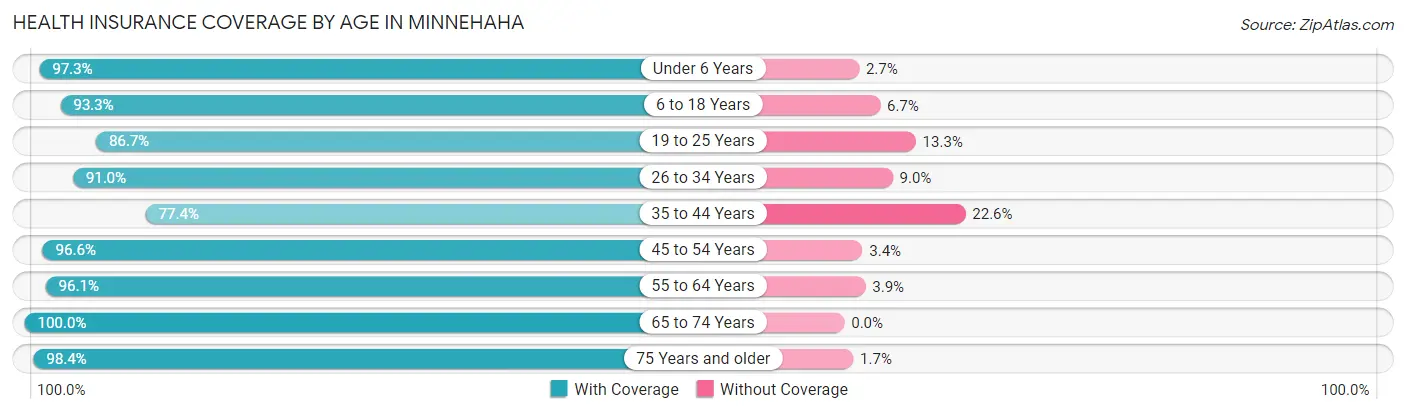
| Age Bracket | With Coverage | Without Coverage |
| Under 6 Years | 638 (97.3%) | 18 (2.7%) |
| 6 to 18 Years | 1,877 (93.3%) | 134 (6.7%) |
| 19 to 25 Years | 560 (86.7%) | 86 (13.3%) |
| 26 to 34 Years | 1,607 (91.0%) | 159 (9.0%) |
| 35 to 44 Years | 1,361 (77.4%) | 397 (22.6%) |
| 45 to 54 Years | 1,146 (96.6%) | 40 (3.4%) |
| 55 to 64 Years | 1,664 (96.1%) | 68 (3.9%) |
| 65 to 74 Years | 1,114 (100.0%) | 0 (0.0%) |
| 75 Years and older | 654 (98.4%) | 11 (1.7%) |
| Total | 10,621 (92.1%) | 913 (7.9%) |
Health Insurance Coverage by Citizenship Status in Minnehaha
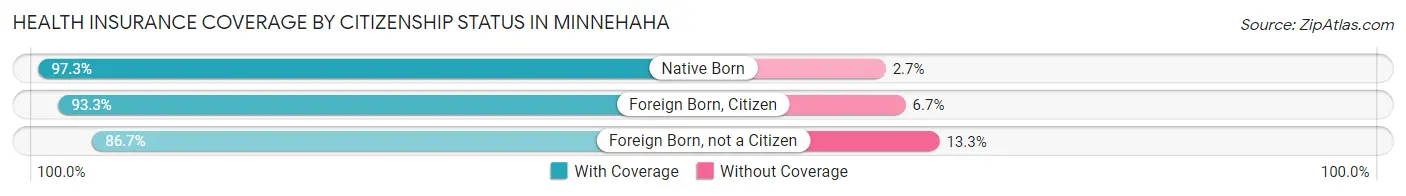
| Citizenship Status | With Coverage | Without Coverage |
| Native Born | 638 (97.3%) | 18 (2.7%) |
| Foreign Born, Citizen | 1,877 (93.3%) | 134 (6.7%) |
| Foreign Born, not a Citizen | 560 (86.7%) | 86 (13.3%) |
Health Insurance Coverage by Household Income in Minnehaha
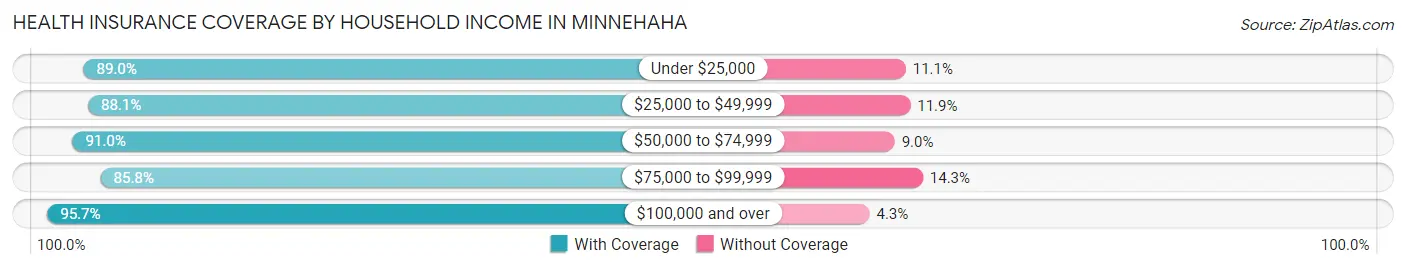
| Household Income | With Coverage | Without Coverage |
| Under $25,000 | 507 (88.9%) | 63 (11.1%) |
| $25,000 to $49,999 | 815 (88.1%) | 110 (11.9%) |
| $50,000 to $74,999 | 1,034 (91.0%) | 102 (9.0%) |
| $75,000 to $99,999 | 2,227 (85.8%) | 370 (14.2%) |
| $100,000 and over | 5,998 (95.7%) | 267 (4.3%) |
Public vs Private Health Insurance Coverage by Age in Minnehaha
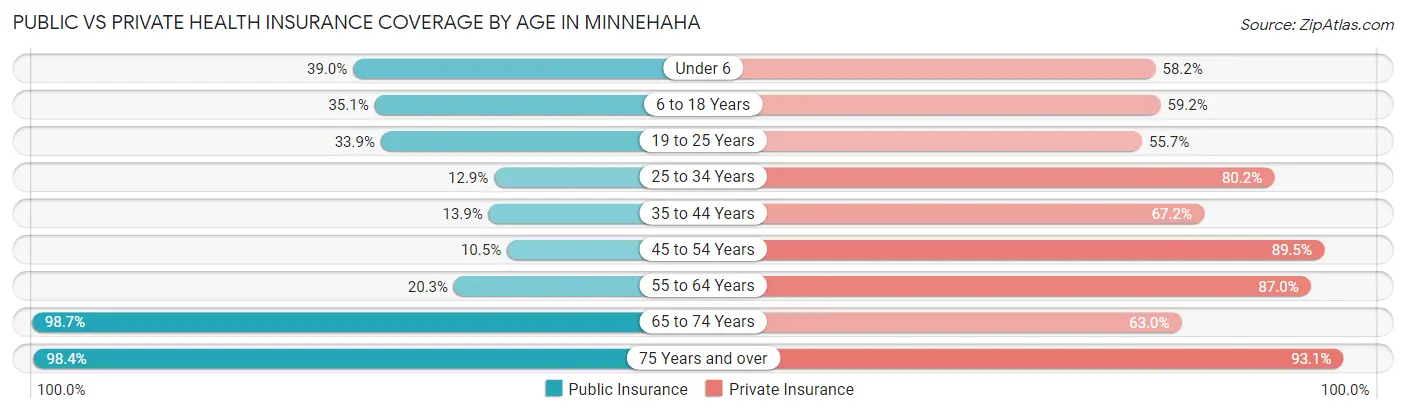
| Age Bracket | Public Insurance | Private Insurance |
| Under 6 | 256 (39.0%) | 382 (58.2%) |
| 6 to 18 Years | 705 (35.1%) | 1,190 (59.2%) |
| 19 to 25 Years | 219 (33.9%) | 360 (55.7%) |
| 25 to 34 Years | 227 (12.9%) | 1,417 (80.2%) |
| 35 to 44 Years | 244 (13.9%) | 1,181 (67.2%) |
| 45 to 54 Years | 124 (10.5%) | 1,061 (89.5%) |
| 55 to 64 Years | 352 (20.3%) | 1,507 (87.0%) |
| 65 to 74 Years | 1,099 (98.7%) | 702 (63.0%) |
| 75 Years and over | 654 (98.4%) | 619 (93.1%) |
| Total | 3,880 (33.6%) | 8,419 (73.0%) |
Disability Status by Sex by Age in Minnehaha
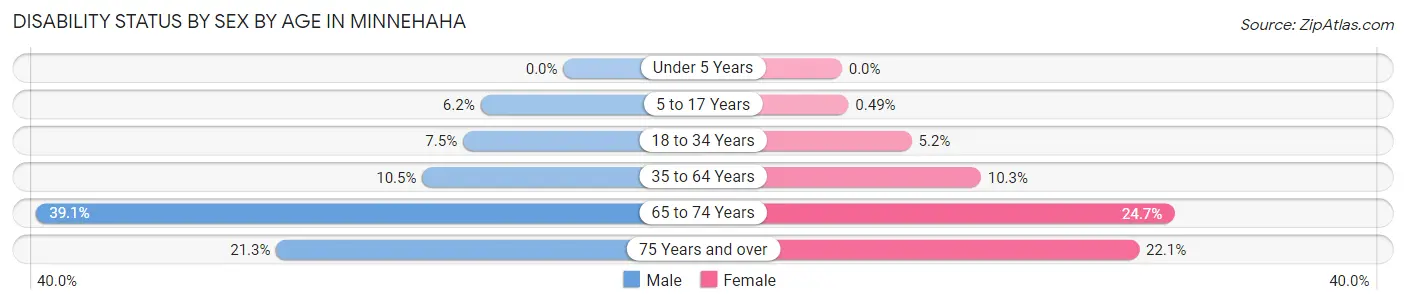
| Age Bracket | Male | Female |
| Under 5 Years | 0 (0.0%) | 0 (0.0%) |
| 5 to 17 Years | 60 (6.1%) | 6 (0.5%) |
| 18 to 34 Years | 91 (7.4%) | 64 (5.2%) |
| 35 to 64 Years | 228 (10.5%) | 258 (10.3%) |
| 65 to 74 Years | 198 (39.1%) | 150 (24.7%) |
| 75 Years and over | 78 (21.3%) | 66 (22.1%) |
Disability Class by Sex by Age in Minnehaha
Disability Class: Hearing Difficulty
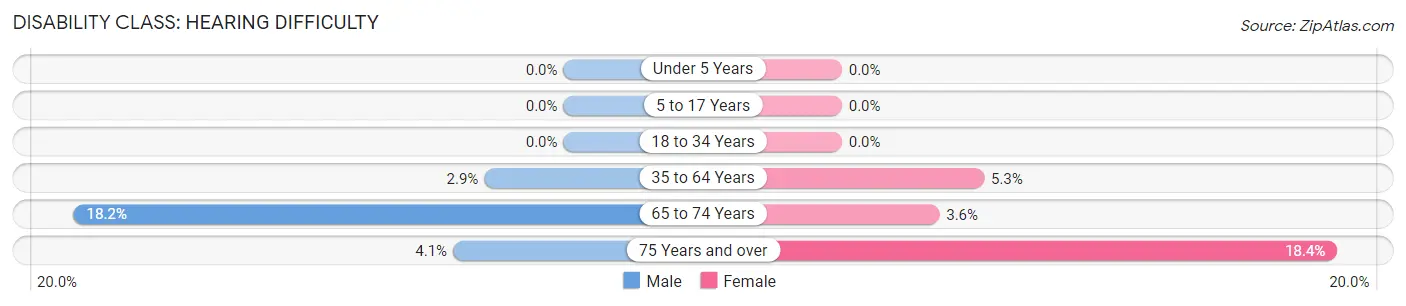
| Age Bracket | Male | Female |
| Under 5 Years | 0 (0.0%) | 0 (0.0%) |
| 5 to 17 Years | 0 (0.0%) | 0 (0.0%) |
| 18 to 34 Years | 0 (0.0%) | 0 (0.0%) |
| 35 to 64 Years | 64 (2.9%) | 132 (5.3%) |
| 65 to 74 Years | 92 (18.2%) | 22 (3.6%) |
| 75 Years and over | 15 (4.1%) | 55 (18.4%) |
Disability Class: Vision Difficulty
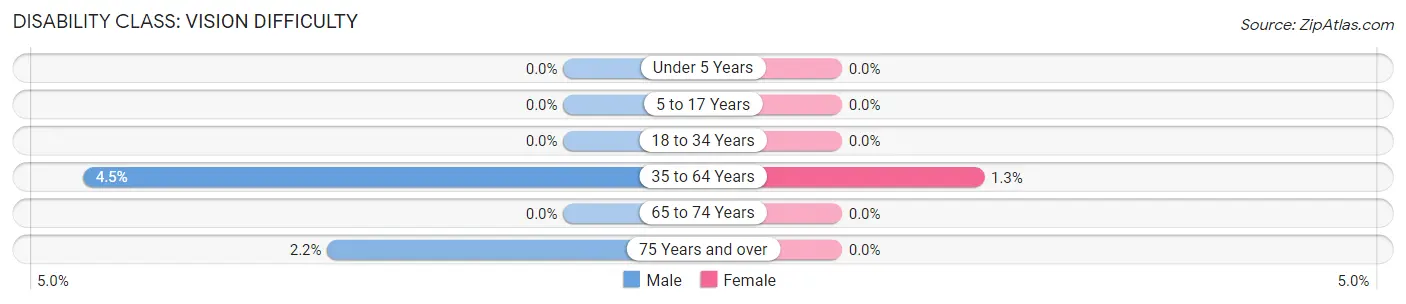
| Age Bracket | Male | Female |
| Under 5 Years | 0 (0.0%) | 0 (0.0%) |
| 5 to 17 Years | 0 (0.0%) | 0 (0.0%) |
| 18 to 34 Years | 0 (0.0%) | 0 (0.0%) |
| 35 to 64 Years | 97 (4.5%) | 33 (1.3%) |
| 65 to 74 Years | 0 (0.0%) | 0 (0.0%) |
| 75 Years and over | 8 (2.2%) | 0 (0.0%) |
Disability Class: Cognitive Difficulty
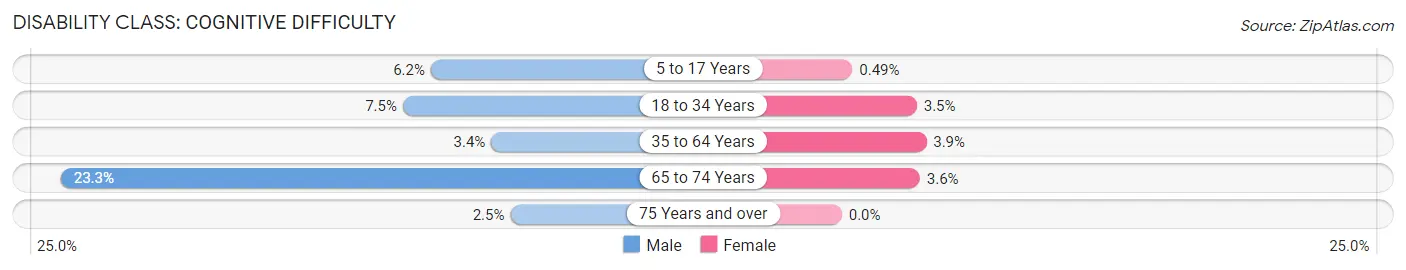
| Age Bracket | Male | Female |
| 5 to 17 Years | 60 (6.1%) | 6 (0.5%) |
| 18 to 34 Years | 91 (7.4%) | 43 (3.5%) |
| 35 to 64 Years | 73 (3.4%) | 98 (3.9%) |
| 65 to 74 Years | 118 (23.3%) | 22 (3.6%) |
| 75 Years and over | 9 (2.5%) | 0 (0.0%) |
Disability Class: Ambulatory Difficulty
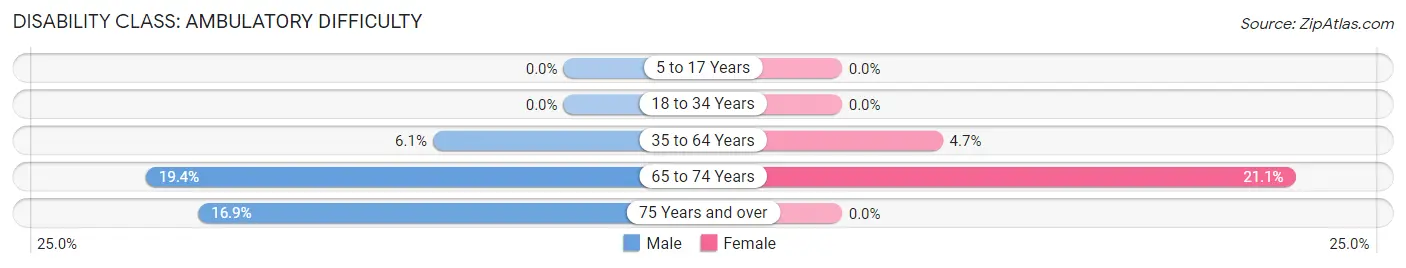
| Age Bracket | Male | Female |
| 5 to 17 Years | 0 (0.0%) | 0 (0.0%) |
| 18 to 34 Years | 0 (0.0%) | 0 (0.0%) |
| 35 to 64 Years | 132 (6.1%) | 117 (4.7%) |
| 65 to 74 Years | 98 (19.4%) | 128 (21.0%) |
| 75 Years and over | 62 (16.9%) | 0 (0.0%) |
Disability Class: Self-Care Difficulty
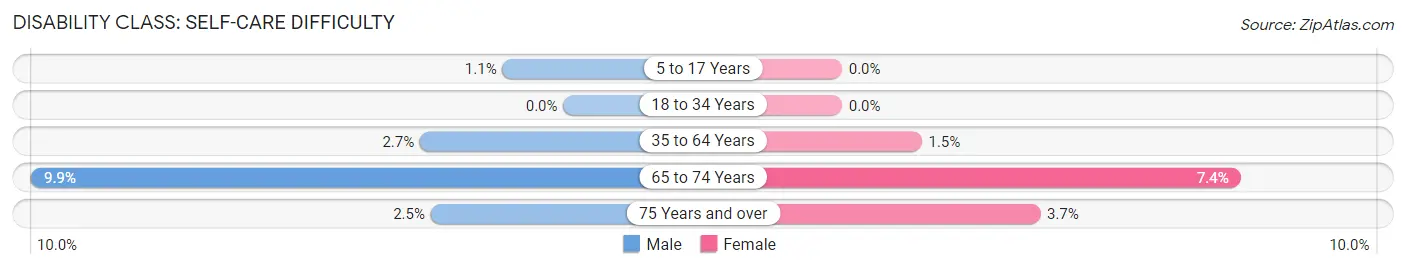
| Age Bracket | Male | Female |
| 5 to 17 Years | 11 (1.1%) | 0 (0.0%) |
| 18 to 34 Years | 0 (0.0%) | 0 (0.0%) |
| 35 to 64 Years | 58 (2.7%) | 37 (1.5%) |
| 65 to 74 Years | 50 (9.9%) | 45 (7.4%) |
| 75 Years and over | 9 (2.5%) | 11 (3.7%) |
Technology Access in Minnehaha
Computing Device Access in Minnehaha
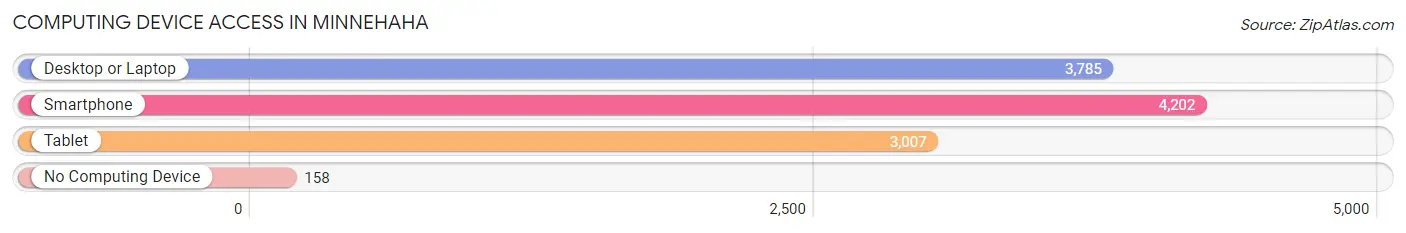
| Device Type | # Households | % Households |
| Desktop or Laptop | 3,785 | 85.3% |
| Smartphone | 4,202 | 94.7% |
| Tablet | 3,007 | 67.7% |
| No Computing Device | 158 | 3.6% |
| Total | 4,439 | 100.0% |
Internet Access in Minnehaha
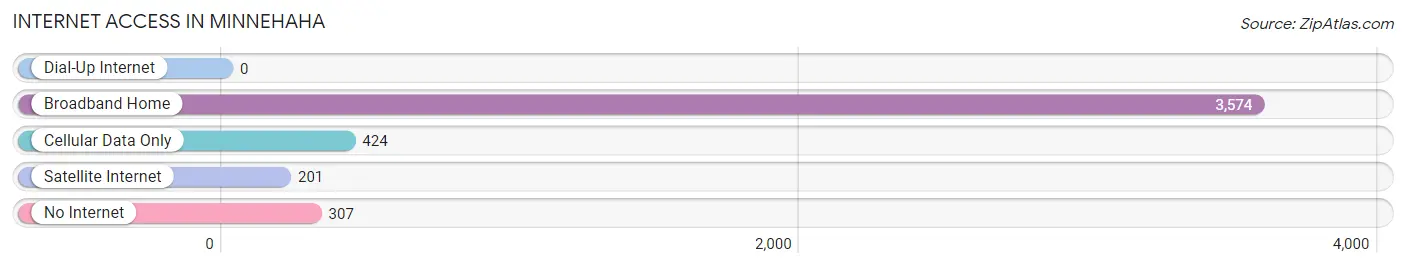
| Internet Type | # Households | % Households |
| Dial-Up Internet | 0 | 0.0% |
| Broadband Home | 3,574 | 80.5% |
| Cellular Data Only | 424 | 9.6% |
| Satellite Internet | 201 | 4.5% |
| No Internet | 307 | 6.9% |
| Total | 4,439 | 100.0% |
Minnehaha Summary
Minnehaha, Washington is a small unincorporated community located in the southwestern corner of Spokane County, Washington. It is situated on the Spokane River, just south of the city of Spokane. The population of Minnehaha is estimated to be around 1,000 people.
History
Minnehaha was first settled in the late 1800s by a group of settlers from Minnesota. The settlers named the area after the famous waterfall in Minneapolis, Minnesota. The area was originally used for farming and logging, and the first post office was established in 1891.
In the early 1900s, the area began to develop into a small town. The first school was built in 1910, and the first church was built in 1912. The town was incorporated in 1914, and the first mayor was elected in 1915.
Geography
Minnehaha is located in the southwestern corner of Spokane County, Washington. It is situated on the Spokane River, just south of the city of Spokane. The area is mostly flat, with some rolling hills. The climate is generally mild, with temperatures ranging from the low 30s in the winter to the high 80s in the summer.
Economy
The economy of Minnehaha is largely based on agriculture and tourism. The area is home to several farms, which produce a variety of crops, including wheat, corn, and hay. The area is also home to several wineries, which produce a variety of wines.
Tourism is also an important part of the economy. The area is home to several parks, including Riverside State Park, which offers camping, hiking, and other outdoor activities. The area is also home to several golf courses, which attract visitors from all over the region.
Demographics
As of the 2010 census, the population of Minnehaha was estimated to be 1,000 people. The racial makeup of the town was 94.2% White, 0.7% African American, 0.3% Native American, 0.3% Asian, 0.1% Pacific Islander, and 4.4% from other races. The median household income was $45,000, and the median age was 40.
Conclusion
Minnehaha, Washington is a small unincorporated community located in the southwestern corner of Spokane County, Washington. It is situated on the Spokane River, just south of the city of Spokane. The population of Minnehaha is estimated to be around 1,000 people. The economy of Minnehaha is largely based on agriculture and tourism, and the area is home to several farms, wineries, parks, and golf courses. The racial makeup of the town is 94.2% White, 0.7% African American, 0.3% Native American, 0.3% Asian, 0.1% Pacific Islander, and 4.4% from other races. The median household income was $45,000, and the median age was 40.
Common Questions
What is Per Capita Income in Minnehaha?
Per Capita income in Minnehaha is $43,572.
What is the Median Family Income in Minnehaha?
Median Family Income in Minnehaha is $107,480.
What is the Median Household income in Minnehaha?
Median Household Income in Minnehaha is $99,620.
What is Income or Wage Gap in Minnehaha?
Income or Wage Gap in Minnehaha is 42.9%.
Women in Minnehaha earn 57.1 cents for every dollar earned by a man.
What is Inequality or Gini Index in Minnehaha?
Inequality or Gini Index in Minnehaha is 0.34.
What is the Total Population of Minnehaha?
Total Population of Minnehaha is 11,582.
What is the Total Male Population of Minnehaha?
Total Male Population of Minnehaha is 5,504.
What is the Total Female Population of Minnehaha?
Total Female Population of Minnehaha is 6,078.
What is the Ratio of Males per 100 Females in Minnehaha?
There are 90.56 Males per 100 Females in Minnehaha.
What is the Ratio of Females per 100 Males in Minnehaha?
There are 110.43 Females per 100 Males in Minnehaha.
What is the Median Population Age in Minnehaha?
Median Population Age in Minnehaha is 38.4 Years.
What is the Average Family Size in Minnehaha
Average Family Size in Minnehaha is 2.9 People.
What is the Average Household Size in Minnehaha
Average Household Size in Minnehaha is 2.6 People.
How Large is the Labor Force in Minnehaha?
There are 6,513 People in the Labor Forcein in Minnehaha.
What is the Percentage of People in the Labor Force in Minnehaha?
69.6% of People are in the Labor Force in Minnehaha.
What is the Unemployment Rate in Minnehaha?
Unemployment Rate in Minnehaha is 7.8%.