Colville, WA Map & Demographics
Colville Map
Colville Overview
$31,138
PER CAPITA INCOME
$60,750
AVG FAMILY INCOME
$45,972
AVG HOUSEHOLD INCOME
28.4%
WAGE / INCOME GAP [ % ]
71.6¢/ $1
WAGE / INCOME GAP [ $ ]
$13,670
FAMILY INCOME DEFICIT
0.49
INEQUALITY / GINI INDEX
4,927
TOTAL POPULATION
2,387
MALE POPULATION
2,540
FEMALE POPULATION
93.98
MALES / 100 FEMALES
106.41
FEMALES / 100 MALES
42.3
MEDIAN AGE
3.0
AVG FAMILY SIZE
2.3
AVG HOUSEHOLD SIZE
2,007
LABOR FORCE [ PEOPLE ]
50.5%
PERCENT IN LABOR FORCE
3.3%
UNEMPLOYMENT RATE
Colville Zip Codes
Colville Area Codes
Income in Colville
Income Overview in Colville
Per Capita Income in Colville is $31,138, while median incomes of families and households are $60,750 and $45,972 respectively.
| Characteristic | Number | Measure |
| Per Capita Income | 4,927 | $31,138 |
| Median Family Income | 1,236 | $60,750 |
| Mean Family Income | 1,236 | $78,414 |
| Median Household Income | 2,071 | $45,972 |
| Mean Household Income | 2,071 | $71,878 |
| Income Deficit | 1,236 | $13,670 |
| Wage / Income Gap (%) | 4,927 | 28.36% |
| Wage / Income Gap ($) | 4,927 | 71.64¢ per $1 |
| Gini / Inequality Index | 4,927 | 0.49 |
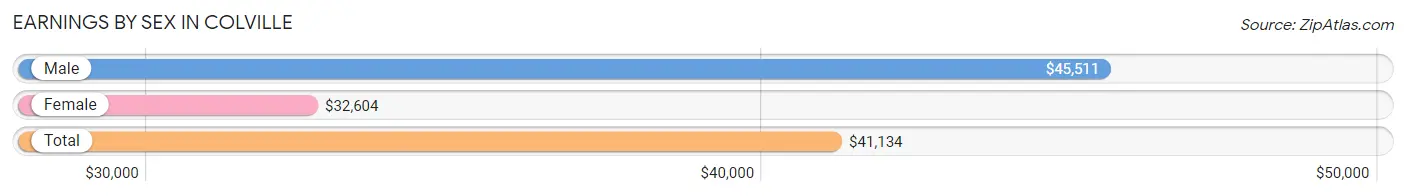
Earnings by Sex in Colville
Average Earnings in Colville are $41,134, $45,511 for men and $32,604 for women, a difference of 28.4%.
| Sex | Number | Average Earnings |
| Male | 1,084 (52.5%) | $45,511 |
| Female | 980 (47.5%) | $32,604 |
| Total | 2,064 (100.0%) | $41,134 |
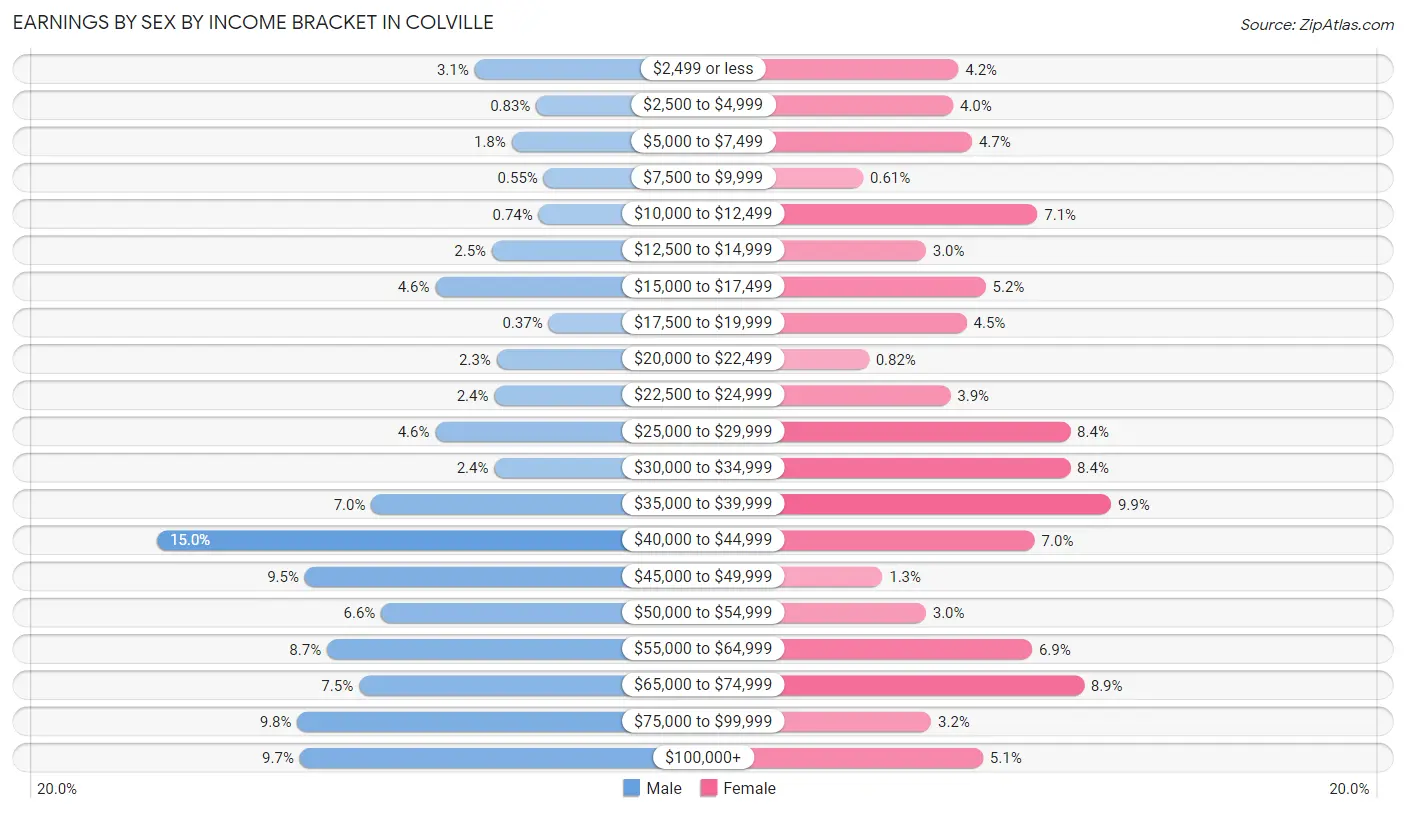
Earnings by Sex by Income Bracket in Colville
The most common earnings brackets in Colville are $40,000 to $44,999 for men (163 | 15.0%) and $35,000 to $39,999 for women (97 | 9.9%).
| Income | Male | Female |
| $2,499 or less | 34 (3.1%) | 41 (4.2%) |
| $2,500 to $4,999 | 9 (0.8%) | 39 (4.0%) |
| $5,000 to $7,499 | 19 (1.8%) | 46 (4.7%) |
| $7,500 to $9,999 | 6 (0.5%) | 6 (0.6%) |
| $10,000 to $12,499 | 8 (0.7%) | 70 (7.1%) |
| $12,500 to $14,999 | 27 (2.5%) | 29 (3.0%) |
| $15,000 to $17,499 | 50 (4.6%) | 51 (5.2%) |
| $17,500 to $19,999 | 4 (0.4%) | 44 (4.5%) |
| $20,000 to $22,499 | 25 (2.3%) | 8 (0.8%) |
| $22,500 to $24,999 | 26 (2.4%) | 38 (3.9%) |
| $25,000 to $29,999 | 50 (4.6%) | 82 (8.4%) |
| $30,000 to $34,999 | 26 (2.4%) | 82 (8.4%) |
| $35,000 to $39,999 | 76 (7.0%) | 97 (9.9%) |
| $40,000 to $44,999 | 163 (15.0%) | 69 (7.0%) |
| $45,000 to $49,999 | 103 (9.5%) | 13 (1.3%) |
| $50,000 to $54,999 | 72 (6.6%) | 29 (3.0%) |
| $55,000 to $64,999 | 94 (8.7%) | 68 (6.9%) |
| $65,000 to $74,999 | 81 (7.5%) | 87 (8.9%) |
| $75,000 to $99,999 | 106 (9.8%) | 31 (3.2%) |
| $100,000+ | 105 (9.7%) | 50 (5.1%) |
| Total | 1,084 (100.0%) | 980 (100.0%) |
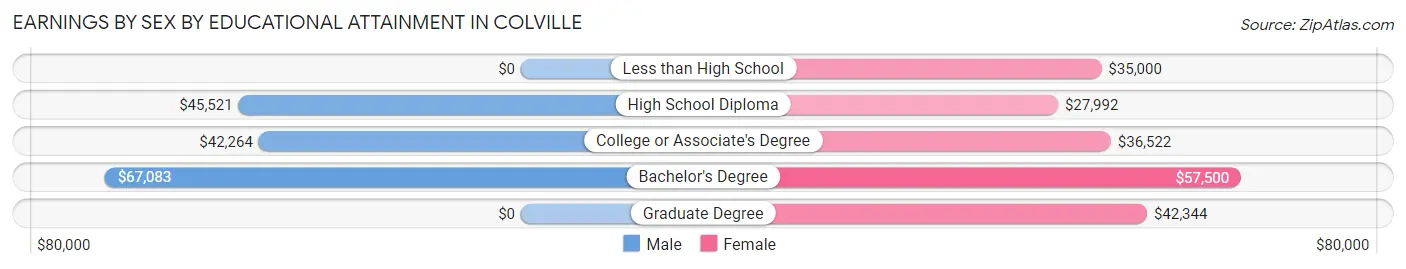
Earnings by Sex by Educational Attainment in Colville
Average earnings in Colville are $46,277 for men and $32,656 for women, a difference of 29.4%. Men with an educational attainment of bachelor's degree enjoy the highest average annual earnings of $67,083, while those with college or associate's degree education earn the least with $42,264. Women with an educational attainment of bachelor's degree earn the most with the average annual earnings of $57,500, while those with high school diploma education have the smallest earnings of $27,992.
| Educational Attainment | Male Income | Female Income |
| Less than High School | - | - |
| High School Diploma | $45,521 | $27,992 |
| College or Associate's Degree | $42,264 | $36,522 |
| Bachelor's Degree | $67,083 | $57,500 |
| Graduate Degree | - | - |
| Total | $46,277 | $32,656 |
Family Income in Colville
Family Income Brackets in Colville
According to the Colville family income data, there are 269 families falling into the $100,000 to $149,999 income range, which is the most common income bracket and makes up 21.8% of all families. Conversely, the $10,000 to $14,999 income bracket is the least frequent group with only 31 families (2.5%) belonging to this category.
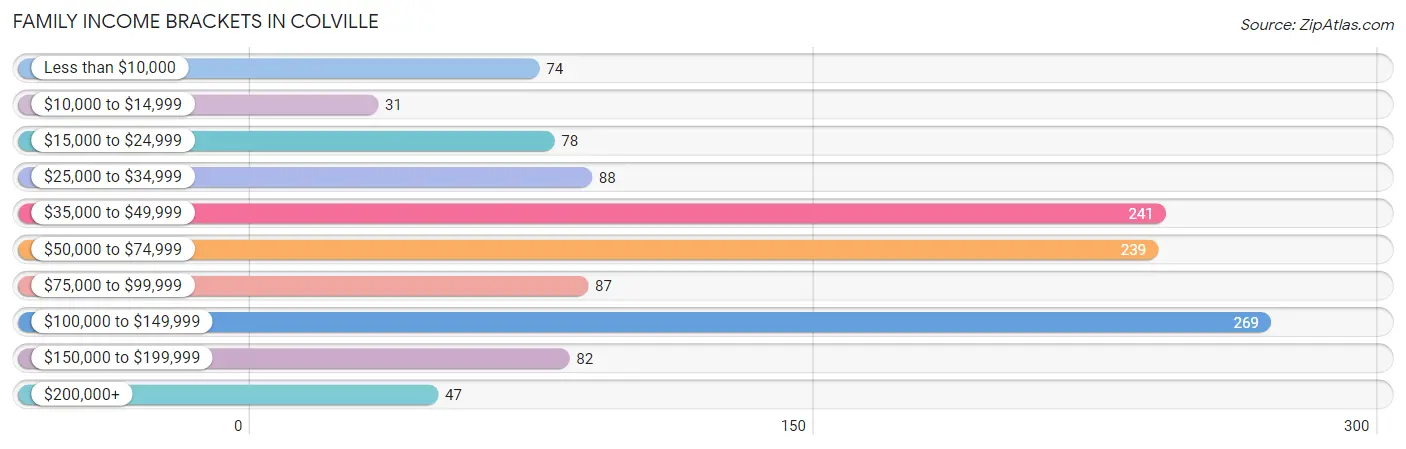
| Income Bracket | # Families | % Families |
| Less than $10,000 | 74 | 6.0% |
| $10,000 to $14,999 | 31 | 2.5% |
| $15,000 to $24,999 | 78 | 6.3% |
| $25,000 to $34,999 | 88 | 7.1% |
| $35,000 to $49,999 | 241 | 19.5% |
| $50,000 to $74,999 | 239 | 19.3% |
| $75,000 to $99,999 | 87 | 7.0% |
| $100,000 to $149,999 | 269 | 21.8% |
| $150,000 to $199,999 | 82 | 6.6% |
| $200,000+ | 47 | 3.8% |
Family Income by Famaliy Size in Colville
2-person families (681 | 55.1%) account for the highest median family income in Colville with $70,464 per family, while 2-person families (681 | 55.1%) have the highest median income of $35,232 per family member.
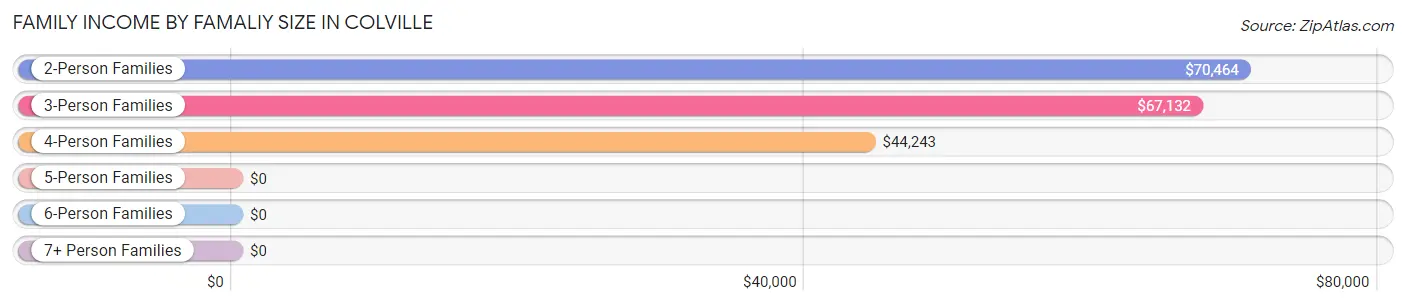
| Income Bracket | # Families | Median Income |
| 2-Person Families | 681 (55.1%) | $70,464 |
| 3-Person Families | 153 (12.4%) | $67,132 |
| 4-Person Families | 254 (20.5%) | $44,243 |
| 5-Person Families | 104 (8.4%) | $0 |
| 6-Person Families | 27 (2.2%) | $0 |
| 7+ Person Families | 17 (1.4%) | $0 |
| Total | 1,236 (100.0%) | $60,750 |
Family Income by Number of Earners in Colville
The median family income in Colville is $60,750, with families comprising 3+ earners (52) having the highest median family income of $140,313, while families with no earners (250) have the lowest median family income of $32,568, accounting for 4.2% and 20.2% of families, respectively.
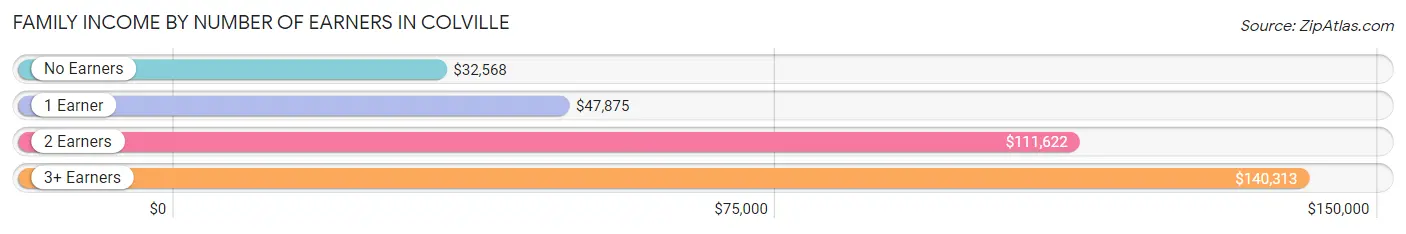
| Number of Earners | # Families | Median Income |
| No Earners | 250 (20.2%) | $32,568 |
| 1 Earner | 544 (44.0%) | $47,875 |
| 2 Earners | 390 (31.6%) | $111,622 |
| 3+ Earners | 52 (4.2%) | $140,313 |
| Total | 1,236 (100.0%) | $60,750 |
Household Income in Colville
Household Income Brackets in Colville
With 408 households falling in the category, the $35,000 to $49,999 income range is the most frequent in Colville, accounting for 19.7% of all households. In contrast, only 75 households (3.6%) fall into the $200,000+ income bracket, making it the least populous group.
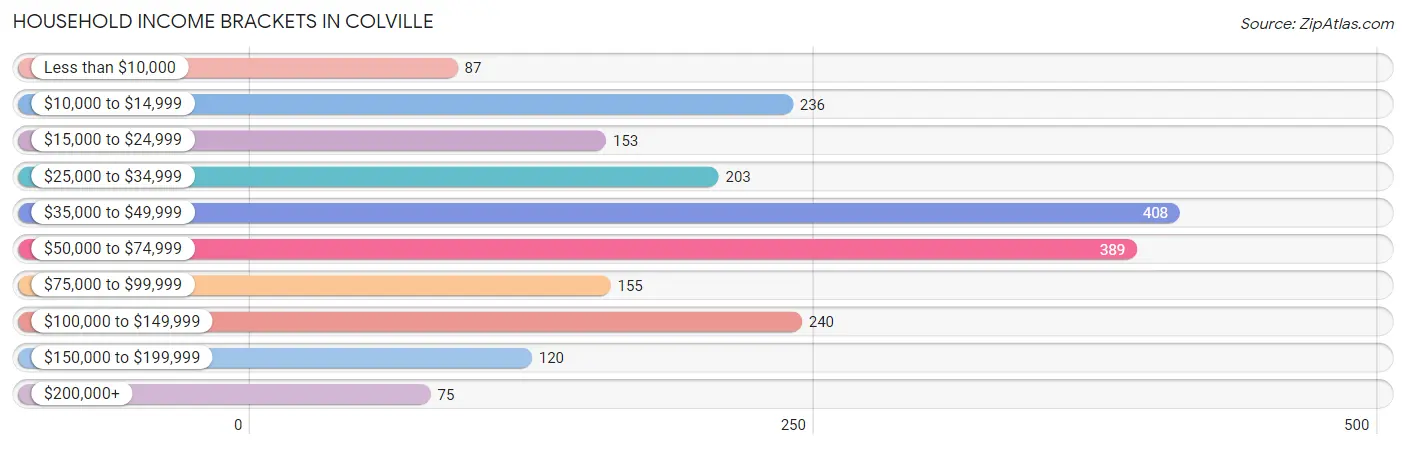
| Income Bracket | # Households | % Households |
| Less than $10,000 | 87 | 4.2% |
| $10,000 to $14,999 | 236 | 11.4% |
| $15,000 to $24,999 | 153 | 7.4% |
| $25,000 to $34,999 | 203 | 9.8% |
| $35,000 to $49,999 | 408 | 19.7% |
| $50,000 to $74,999 | 389 | 18.8% |
| $75,000 to $99,999 | 155 | 7.5% |
| $100,000 to $149,999 | 240 | 11.6% |
| $150,000 to $199,999 | 120 | 5.8% |
| $200,000+ | 75 | 3.6% |
Household Income by Householder Age in Colville
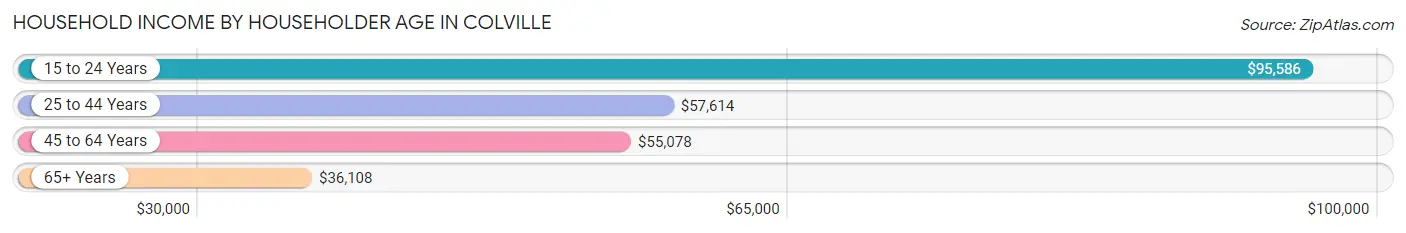
The median household income in Colville is $45,972, with the highest median household income of $95,586 found in the 15 to 24 years age bracket for the primary householder. A total of 49 households (2.4%) fall into this category. Meanwhile, the 65+ years age bracket for the primary householder has the lowest median household income of $36,108, with 767 households (37.0%) in this group.
| Income Bracket | # Households | Median Income |
| 15 to 24 Years | 49 (2.4%) | $95,586 |
| 25 to 44 Years | 613 (29.6%) | $57,614 |
| 45 to 64 Years | 642 (31.0%) | $55,078 |
| 65+ Years | 767 (37.0%) | $36,108 |
| Total | 2,071 (100.0%) | $45,972 |
Poverty in Colville
Income Below Poverty by Sex and Age in Colville
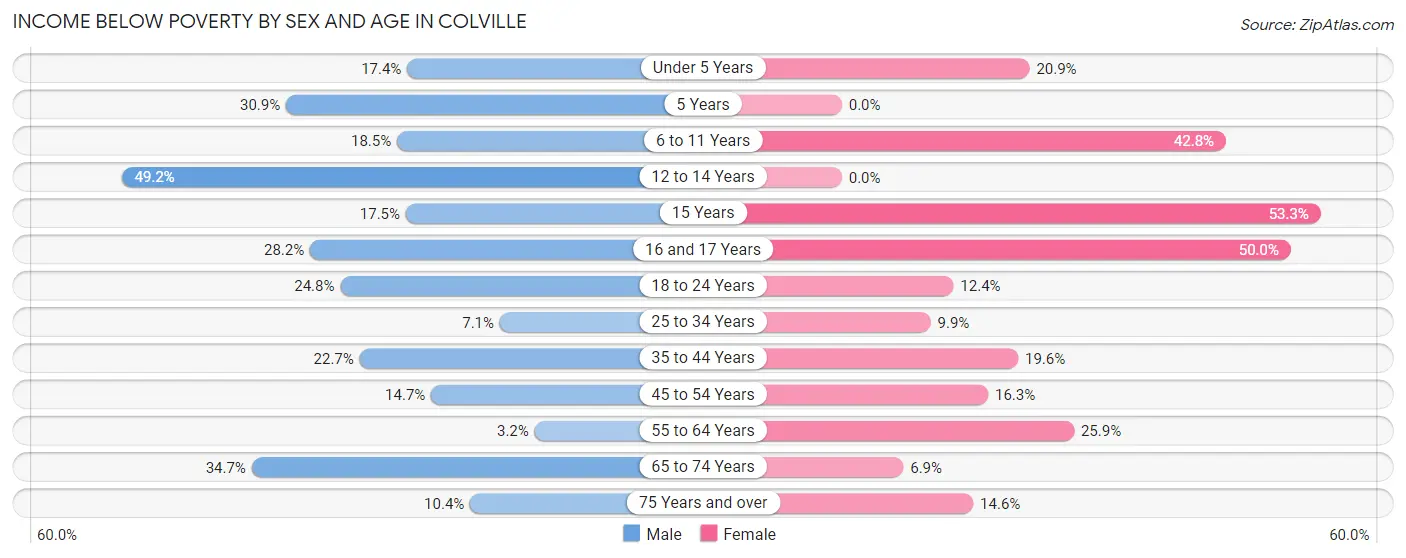
With 18.9% poverty level for males and 18.1% for females among the residents of Colville, 12 to 14 year old males and 15 year old females are the most vulnerable to poverty, with 31 males (49.2%) and 16 females (53.3%) in their respective age groups living below the poverty level.
| Age Bracket | Male | Female |
| Under 5 Years | 32 (17.4%) | 37 (20.9%) |
| 5 Years | 21 (30.9%) | 0 (0.0%) |
| 6 to 11 Years | 15 (18.5%) | 77 (42.8%) |
| 12 to 14 Years | 31 (49.2%) | 0 (0.0%) |
| 15 Years | 10 (17.5%) | 16 (53.3%) |
| 16 and 17 Years | 11 (28.2%) | 28 (50.0%) |
| 18 to 24 Years | 38 (24.8%) | 22 (12.4%) |
| 25 to 34 Years | 28 (7.1%) | 35 (9.9%) |
| 35 to 44 Years | 49 (22.7%) | 42 (19.6%) |
| 45 to 54 Years | 44 (14.7%) | 51 (16.3%) |
| 55 to 64 Years | 7 (3.2%) | 75 (25.9%) |
| 65 to 74 Years | 126 (34.7%) | 20 (6.9%) |
| 75 Years and over | 11 (10.4%) | 49 (14.6%) |
| Total | 423 (18.9%) | 452 (18.1%) |
Income Above Poverty by Sex and Age in Colville
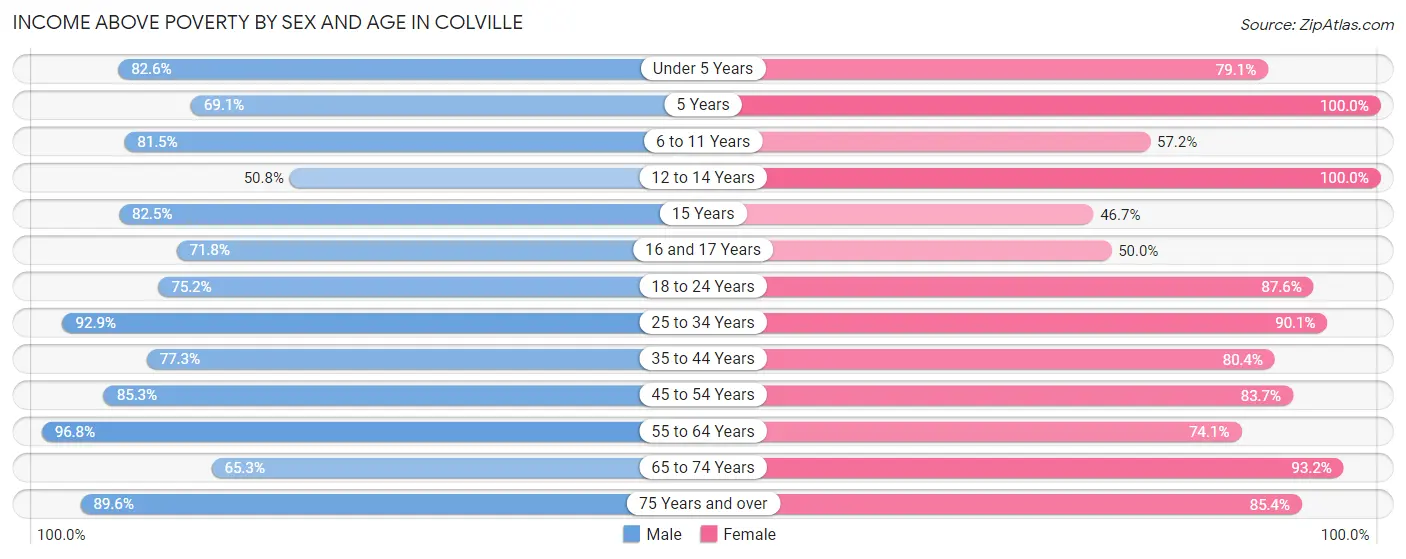
According to the poverty statistics in Colville, males aged 55 to 64 years and females aged 5 years are the age groups that are most secure financially, with 96.8% of males and 100.0% of females in these age groups living above the poverty line.
| Age Bracket | Male | Female |
| Under 5 Years | 152 (82.6%) | 140 (79.1%) |
| 5 Years | 47 (69.1%) | 44 (100.0%) |
| 6 to 11 Years | 66 (81.5%) | 103 (57.2%) |
| 12 to 14 Years | 32 (50.8%) | 28 (100.0%) |
| 15 Years | 47 (82.5%) | 14 (46.7%) |
| 16 and 17 Years | 28 (71.8%) | 28 (50.0%) |
| 18 to 24 Years | 115 (75.2%) | 155 (87.6%) |
| 25 to 34 Years | 368 (92.9%) | 319 (90.1%) |
| 35 to 44 Years | 167 (77.3%) | 172 (80.4%) |
| 45 to 54 Years | 255 (85.3%) | 262 (83.7%) |
| 55 to 64 Years | 212 (96.8%) | 215 (74.1%) |
| 65 to 74 Years | 237 (65.3%) | 272 (93.1%) |
| 75 Years and over | 95 (89.6%) | 286 (85.4%) |
| Total | 1,821 (81.1%) | 2,038 (81.9%) |
Income Below Poverty Among Married-Couple Families in Colville
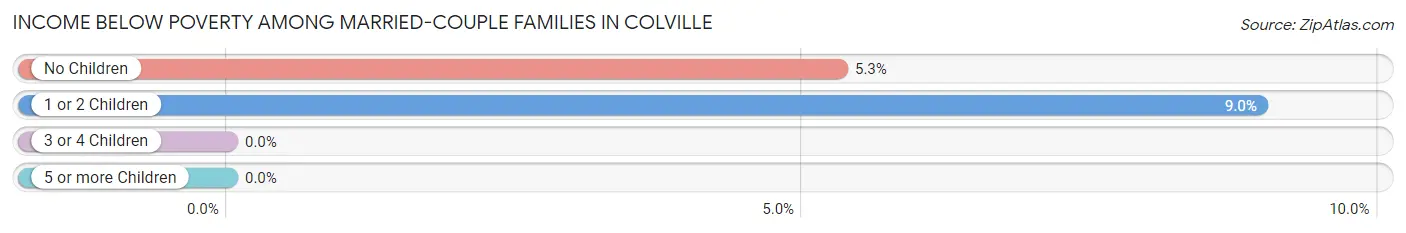
The poverty statistics for married-couple families in Colville show that 5.7% or 54 of the total 948 families live below the poverty line. Families with 1 or 2 children have the highest poverty rate of 9.0%, comprising of 21 families. On the other hand, families with 3 or 4 children have the lowest poverty rate of 0.0%, which includes 0 families.
| Children | Above Poverty | Below Poverty |
| No Children | 588 (94.7%) | 33 (5.3%) |
| 1 or 2 Children | 213 (91.0%) | 21 (9.0%) |
| 3 or 4 Children | 93 (100.0%) | 0 (0.0%) |
| 5 or more Children | 0 (0.0%) | 0 (0.0%) |
| Total | 894 (94.3%) | 54 (5.7%) |
Income Below Poverty Among Single-Parent Households in Colville
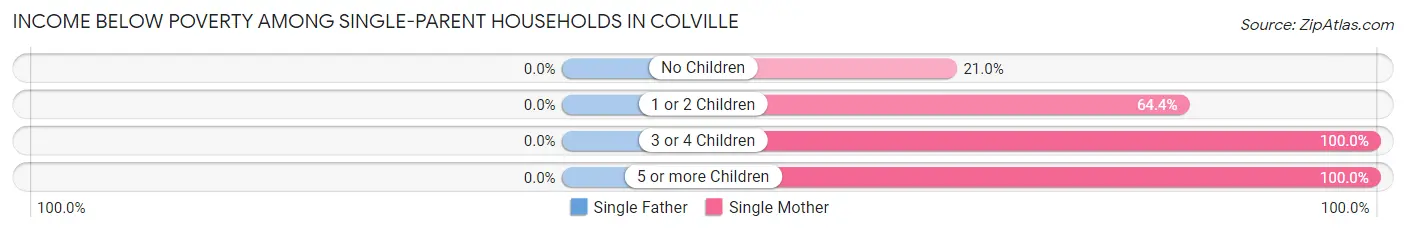
| Children | Single Father | Single Mother |
| No Children | 0 (0.0%) | 25 (21.0%) |
| 1 or 2 Children | 0 (0.0%) | 65 (64.4%) |
| 3 or 4 Children | 0 (0.0%) | 21 (100.0%) |
| 5 or more Children | 0 (0.0%) | 11 (100.0%) |
| Total | 0 (0.0%) | 122 (48.4%) |
Income Below Poverty Among Married-Couple vs Single-Parent Households in Colville
The poverty data for Colville shows that 54 of the married-couple family households (5.7%) and 122 of the single-parent households (42.4%) are living below the poverty level. Within the married-couple family households, those with 1 or 2 children have the highest poverty rate, with 21 households (9.0%) falling below the poverty line. Among the single-parent households, those with 5 or more children have the highest poverty rate, with 11 household (100.0%) living below poverty.
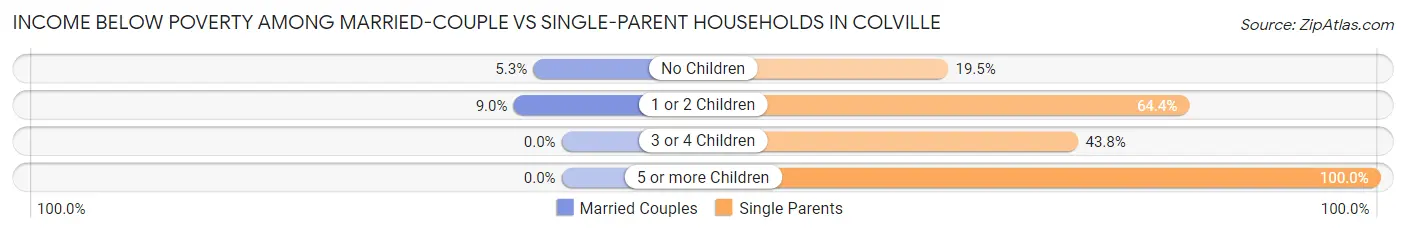
| Children | Married-Couple Families | Single-Parent Households |
| No Children | 33 (5.3%) | 25 (19.5%) |
| 1 or 2 Children | 21 (9.0%) | 65 (64.4%) |
| 3 or 4 Children | 0 (0.0%) | 21 (43.8%) |
| 5 or more Children | 0 (0.0%) | 11 (100.0%) |
| Total | 54 (5.7%) | 122 (42.4%) |
Race in Colville
The most populous races in Colville are White / Caucasian (4,174 | 84.7%), Two or more Races (611 | 12.4%), and Hispanic or Latino (458 | 9.3%).
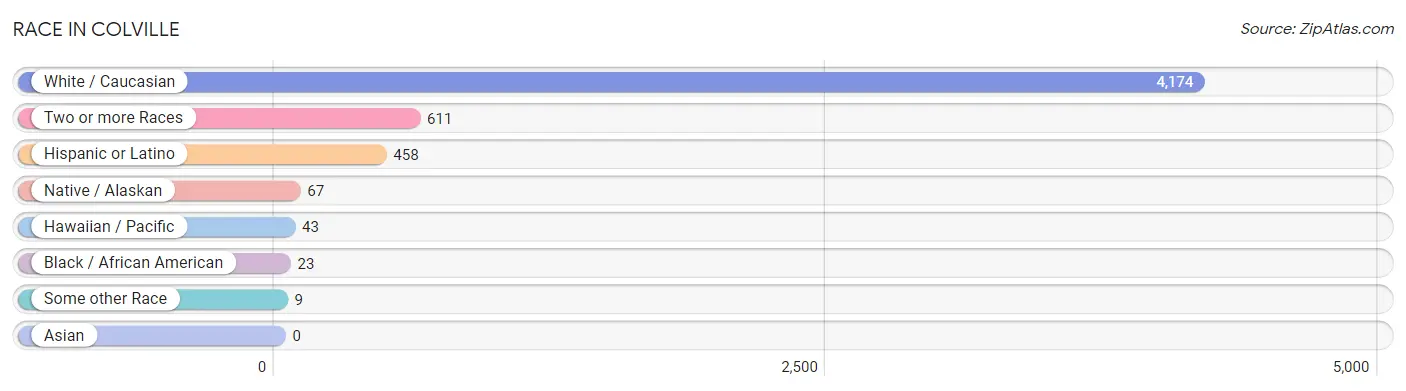
| Race | # Population | % Population |
| Asian | 0 | 0.0% |
| Black / African American | 23 | 0.5% |
| Hawaiian / Pacific | 43 | 0.9% |
| Hispanic or Latino | 458 | 9.3% |
| Native / Alaskan | 67 | 1.4% |
| White / Caucasian | 4,174 | 84.7% |
| Two or more Races | 611 | 12.4% |
| Some other Race | 9 | 0.2% |
| Total | 4,927 | 100.0% |
Ancestry in Colville
The most populous ancestries reported in Colville are German (1,233 | 25.0%), English (551 | 11.2%), Irish (538 | 10.9%), European (367 | 7.4%), and Norwegian (357 | 7.2%), together accounting for 61.8% of all Colville residents.
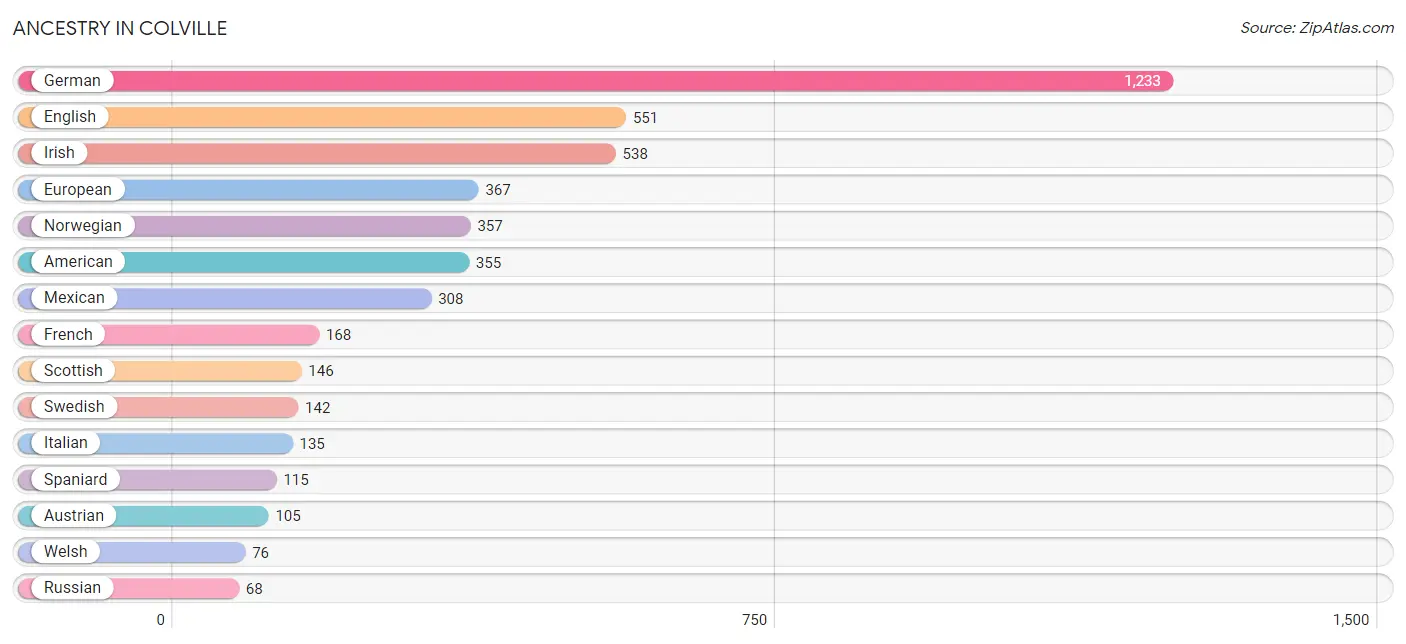
| Ancestry | # Population | % Population |
| American | 355 | 7.2% |
| Arab | 7 | 0.1% |
| Australian | 10 | 0.2% |
| Austrian | 105 | 2.1% |
| Basque | 25 | 0.5% |
| British | 38 | 0.8% |
| Burmese | 34 | 0.7% |
| Canadian | 11 | 0.2% |
| Celtic | 7 | 0.1% |
| Central American | 10 | 0.2% |
| Cherokee | 27 | 0.5% |
| Choctaw | 1 | 0.0% |
| Colville | 31 | 0.6% |
| Czechoslovakian | 27 | 0.5% |
| Danish | 51 | 1.0% |
| Dutch | 63 | 1.3% |
| English | 551 | 11.2% |
| European | 367 | 7.4% |
| Finnish | 8 | 0.2% |
| French | 168 | 3.4% |
| French Canadian | 36 | 0.7% |
| German | 1,233 | 25.0% |
| Guamanian / Chamorro | 7 | 0.1% |
| Iraqi | 7 | 0.1% |
| Irish | 538 | 10.9% |
| Italian | 135 | 2.7% |
| Japanese | 27 | 0.5% |
| Korean | 15 | 0.3% |
| Luxembourger | 6 | 0.1% |
| Mexican | 308 | 6.2% |
| Northern European | 29 | 0.6% |
| Norwegian | 357 | 7.2% |
| Panamanian | 10 | 0.2% |
| Peruvian | 17 | 0.4% |
| Polish | 56 | 1.1% |
| Portuguese | 42 | 0.9% |
| Puerto Rican | 7 | 0.1% |
| Romanian | 57 | 1.2% |
| Russian | 68 | 1.4% |
| Samoan | 36 | 0.7% |
| Scandinavian | 38 | 0.8% |
| Scotch-Irish | 26 | 0.5% |
| Scottish | 146 | 3.0% |
| Serbian | 10 | 0.2% |
| Slavic | 20 | 0.4% |
| South American | 17 | 0.4% |
| Spaniard | 115 | 2.3% |
| Swedish | 142 | 2.9% |
| Swiss | 61 | 1.2% |
| Ukrainian | 34 | 0.7% |
| Welsh | 76 | 1.5% |
| Yakama | 9 | 0.2% |
| Yugoslavian | 1 | 0.0% | View All 53 Rows |
Immigrants in Colville
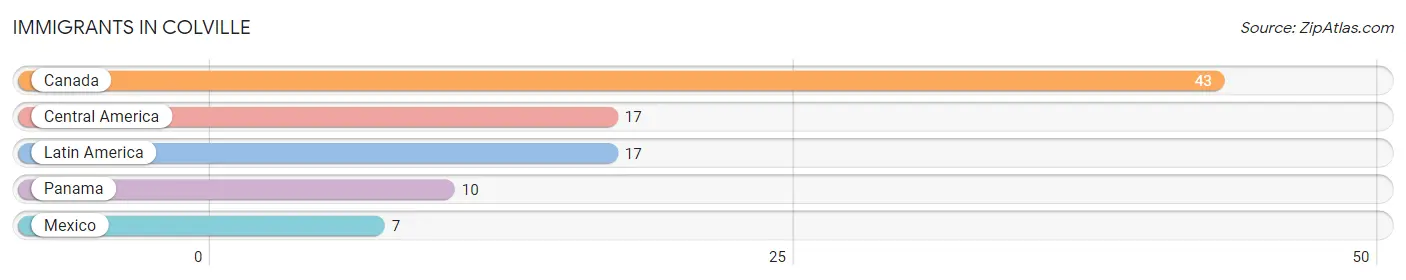
The most numerous immigrant groups reported in Colville came from Canada (43 | 0.9%), Central America (17 | 0.4%), Latin America (17 | 0.4%), Panama (10 | 0.2%), and Mexico (7 | 0.1%), together accounting for 1.9% of all Colville residents.
| Immigration Origin | # Population | % Population |
| Canada | 43 | 0.9% |
| Central America | 17 | 0.4% |
| Latin America | 17 | 0.4% |
| Mexico | 7 | 0.1% |
| Panama | 10 | 0.2% | View All 5 Rows |
Sex and Age in Colville
Sex and Age in Colville
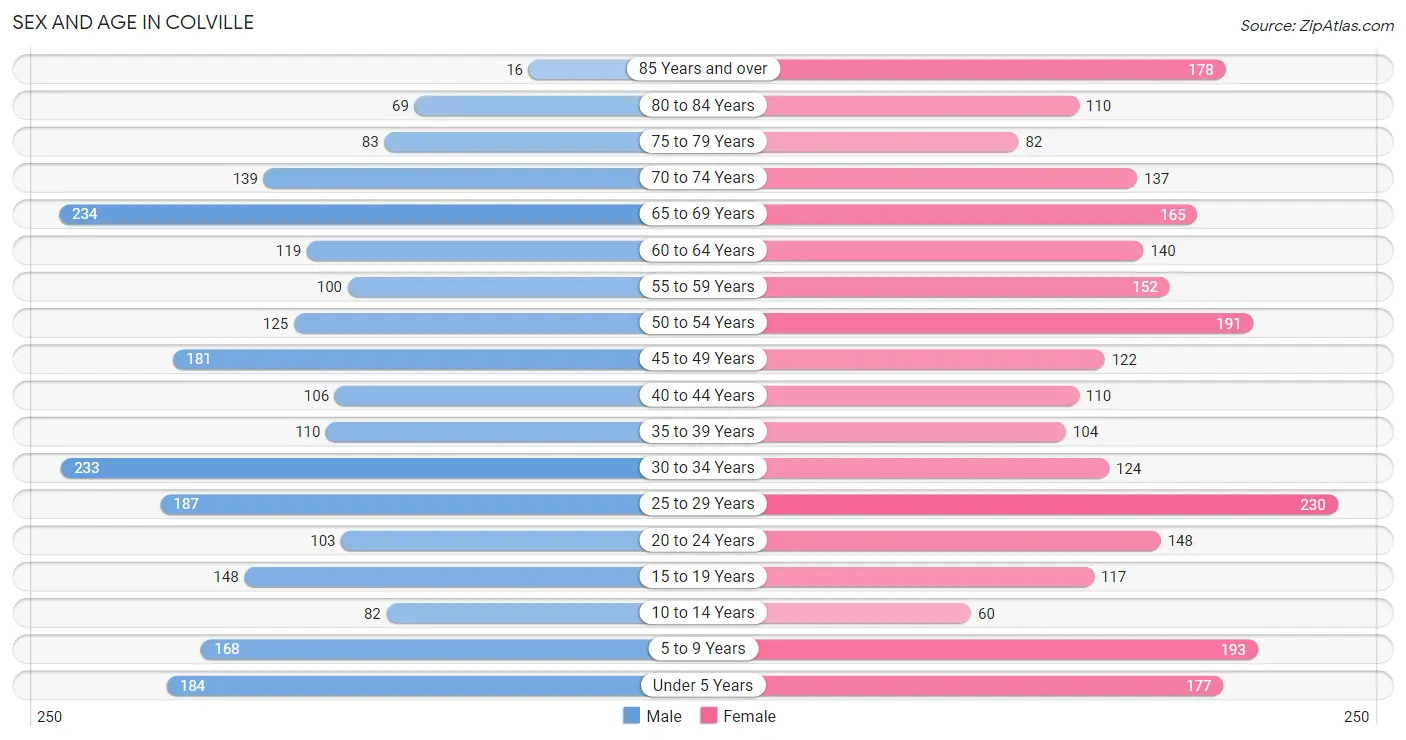
The most populous age groups in Colville are 65 to 69 Years (234 | 9.8%) for men and 25 to 29 Years (230 | 9.1%) for women.
| Age Bracket | Male | Female |
| Under 5 Years | 184 (7.7%) | 177 (7.0%) |
| 5 to 9 Years | 168 (7.0%) | 193 (7.6%) |
| 10 to 14 Years | 82 (3.4%) | 60 (2.4%) |
| 15 to 19 Years | 148 (6.2%) | 117 (4.6%) |
| 20 to 24 Years | 103 (4.3%) | 148 (5.8%) |
| 25 to 29 Years | 187 (7.8%) | 230 (9.1%) |
| 30 to 34 Years | 233 (9.8%) | 124 (4.9%) |
| 35 to 39 Years | 110 (4.6%) | 104 (4.1%) |
| 40 to 44 Years | 106 (4.4%) | 110 (4.3%) |
| 45 to 49 Years | 181 (7.6%) | 122 (4.8%) |
| 50 to 54 Years | 125 (5.2%) | 191 (7.5%) |
| 55 to 59 Years | 100 (4.2%) | 152 (6.0%) |
| 60 to 64 Years | 119 (5.0%) | 140 (5.5%) |
| 65 to 69 Years | 234 (9.8%) | 165 (6.5%) |
| 70 to 74 Years | 139 (5.8%) | 137 (5.4%) |
| 75 to 79 Years | 83 (3.5%) | 82 (3.2%) |
| 80 to 84 Years | 69 (2.9%) | 110 (4.3%) |
| 85 Years and over | 16 (0.7%) | 178 (7.0%) |
| Total | 2,387 (100.0%) | 2,540 (100.0%) |
Families and Households in Colville
Median Family Size in Colville
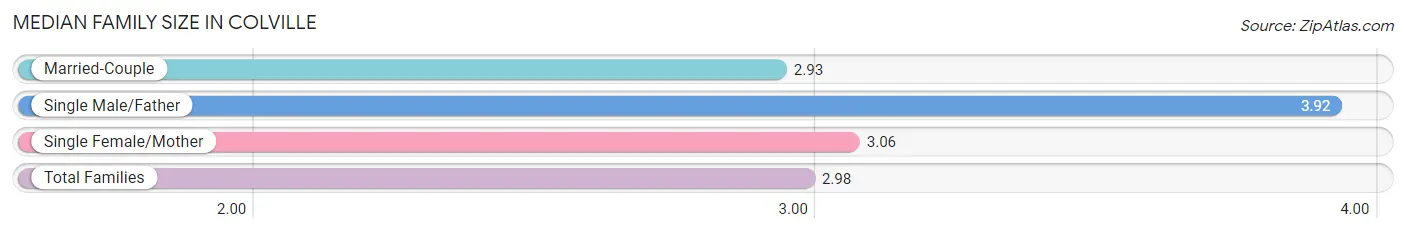
The median family size in Colville is 2.98 persons per family, with single male/father families (36 | 2.9%) accounting for the largest median family size of 3.92 persons per family. On the other hand, married-couple families (948 | 76.7%) represent the smallest median family size with 2.93 persons per family.
| Family Type | # Families | Family Size |
| Married-Couple | 948 (76.7%) | 2.93 |
| Single Male/Father | 36 (2.9%) | 3.92 |
| Single Female/Mother | 252 (20.4%) | 3.06 |
| Total Families | 1,236 (100.0%) | 2.98 |
Median Household Size in Colville
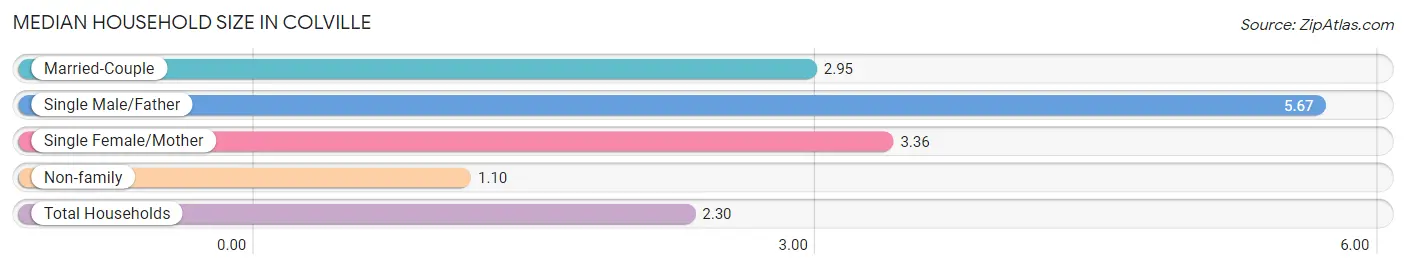
The median household size in Colville is 2.30 persons per household, with single male/father households (36 | 1.7%) accounting for the largest median household size of 5.67 persons per household. non-family households (835 | 40.3%) represent the smallest median household size with 1.10 persons per household.
| Household Type | # Households | Household Size |
| Married-Couple | 948 (45.8%) | 2.95 |
| Single Male/Father | 36 (1.7%) | 5.67 |
| Single Female/Mother | 252 (12.2%) | 3.36 |
| Non-family | 835 (40.3%) | 1.10 |
| Total Households | 2,071 (100.0%) | 2.30 |
Household Size by Marriage Status in Colville
Out of a total of 2,071 households in Colville, 1,236 (59.7%) are family households, while 835 (40.3%) are nonfamily households. The most numerous type of family households are 2-person households, comprising 639, and the most common type of nonfamily households are 1-person households, comprising 765.
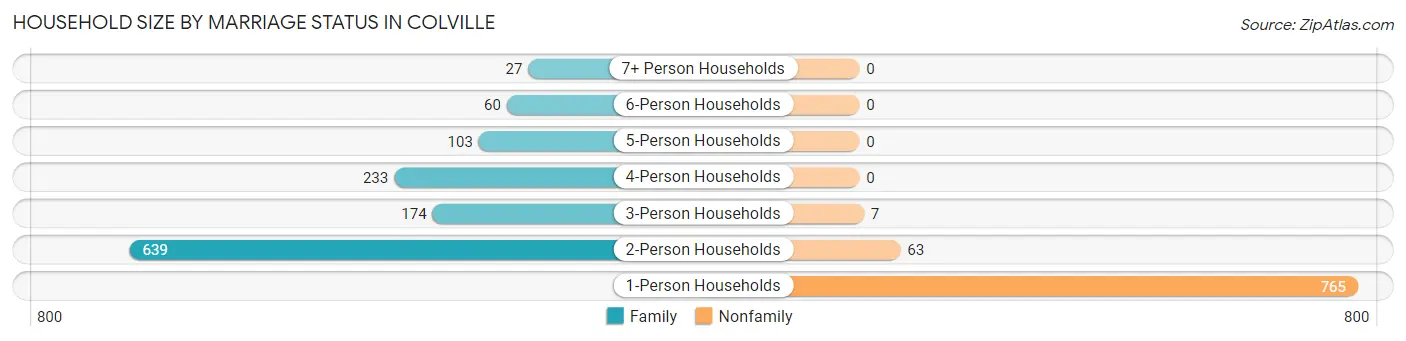
| Household Size | Family Households | Nonfamily Households |
| 1-Person Households | - | 765 (36.9%) |
| 2-Person Households | 639 (30.8%) | 63 (3.0%) |
| 3-Person Households | 174 (8.4%) | 7 (0.3%) |
| 4-Person Households | 233 (11.3%) | 0 (0.0%) |
| 5-Person Households | 103 (5.0%) | 0 (0.0%) |
| 6-Person Households | 60 (2.9%) | 0 (0.0%) |
| 7+ Person Households | 27 (1.3%) | 0 (0.0%) |
| Total | 1,236 (59.7%) | 835 (40.3%) |
Female Fertility in Colville
Fertility by Age in Colville
Average fertility rate in Colville is 112.0 births per 1,000 women. Women in the age bracket of 20 to 34 years have the highest fertility rate with 187.0 births per 1,000 women. Women in the age bracket of 20 to 34 years acount for 86.2% of all women with births.
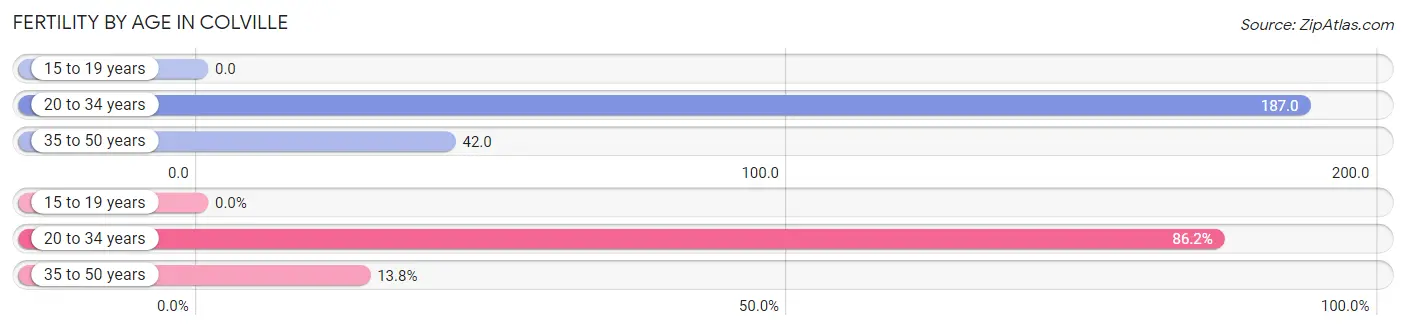
| Age Bracket | Women with Births | Births / 1,000 Women |
| 15 to 19 years | 0 (0.0%) | 0.0 |
| 20 to 34 years | 94 (86.2%) | 187.0 |
| 35 to 50 years | 15 (13.8%) | 42.0 |
| Total | 109 (100.0%) | 112.0 |
Fertility by Age by Marriage Status in Colville
33.9% of women with births (109) in Colville are married. The highest percentage of unmarried women with births falls into 20 to 34 years age bracket with 76.6% of them unmarried at the time of birth, while the lowest percentage of unmarried women with births belong to 35 to 50 years age bracket with 0.0% of them unmarried.
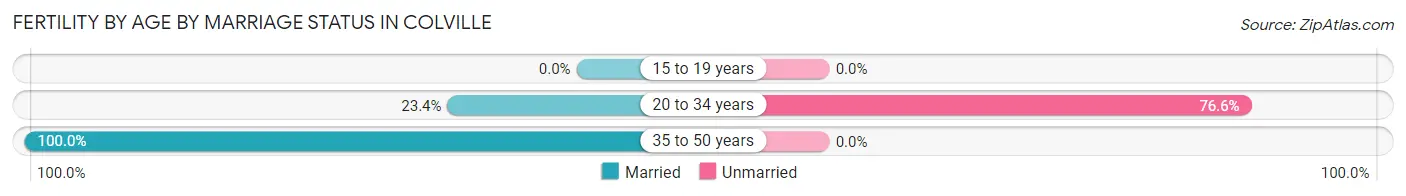
| Age Bracket | Married | Unmarried |
| 15 to 19 years | 0 (0.0%) | 0 (0.0%) |
| 20 to 34 years | 22 (23.4%) | 72 (76.6%) |
| 35 to 50 years | 15 (100.0%) | 0 (0.0%) |
| Total | 37 (33.9%) | 72 (66.1%) |
Fertility by Education in Colville
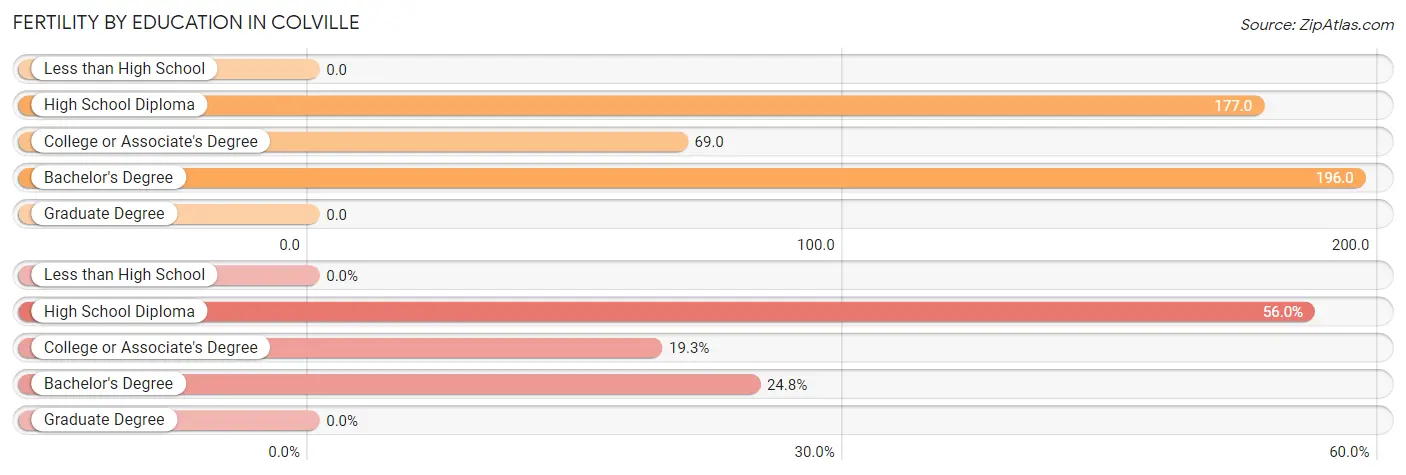
| Educational Attainment | Women with Births | Births / 1,000 Women |
| Less than High School | 0 (0.0%) | 0.0 |
| High School Diploma | 61 (56.0%) | 177.0 |
| College or Associate's Degree | 21 (19.3%) | 69.0 |
| Bachelor's Degree | 27 (24.8%) | 196.0 |
| Graduate Degree | 0 (0.0%) | 0.0 |
| Total | 109 (100.0%) | 112.0 |
Fertility by Education by Marriage Status in Colville
66.1% of women with births in Colville are unmarried. Women with the educational attainment of bachelor's degree are most likely to be married with 100.0% of them married at childbirth, while women with the educational attainment of high school diploma are least likely to be married with 100.0% of them unmarried at childbirth.
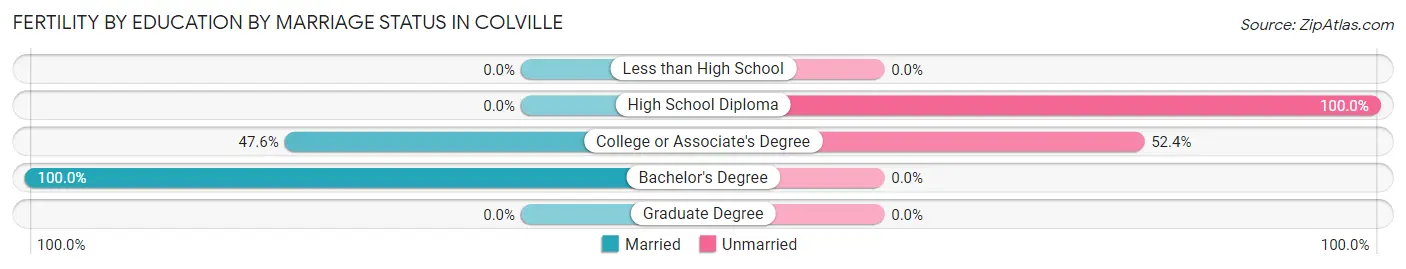
| Educational Attainment | Married | Unmarried |
| Less than High School | 0 (0.0%) | 0 (0.0%) |
| High School Diploma | 0 (0.0%) | 61 (100.0%) |
| College or Associate's Degree | 10 (47.6%) | 11 (52.4%) |
| Bachelor's Degree | 27 (100.0%) | 0 (0.0%) |
| Graduate Degree | 0 (0.0%) | 0 (0.0%) |
| Total | 37 (33.9%) | 72 (66.1%) |
Employment Characteristics in Colville
Employment by Class of Employer in Colville
Among the 1,922 employed individuals in Colville, private company employees (990 | 51.5%), self-employed (not incorporated) (241 | 12.5%), and not-for-profit organizations (206 | 10.7%) make up the most common classes of employment.
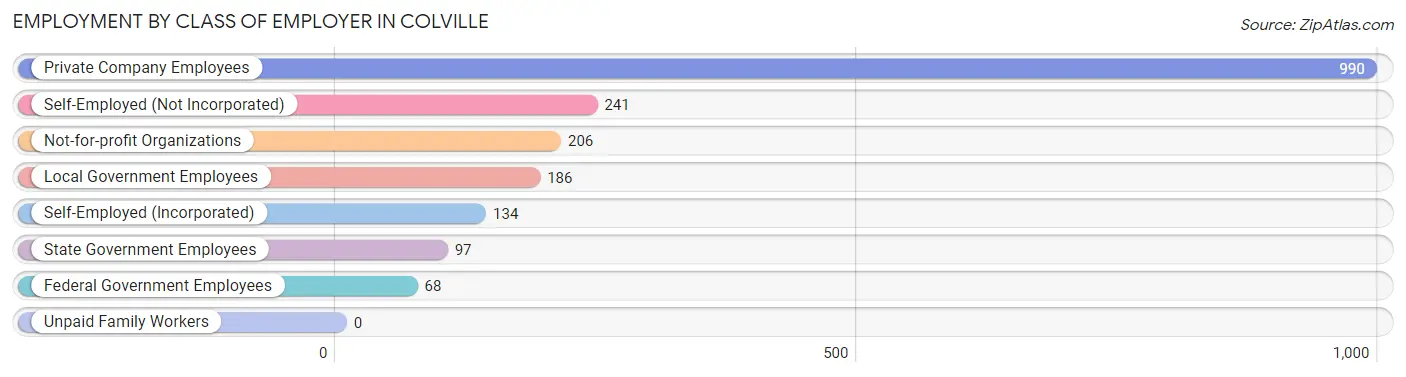
| Employer Class | # Employees | % Employees |
| Private Company Employees | 990 | 51.5% |
| Self-Employed (Incorporated) | 134 | 7.0% |
| Self-Employed (Not Incorporated) | 241 | 12.5% |
| Not-for-profit Organizations | 206 | 10.7% |
| Local Government Employees | 186 | 9.7% |
| State Government Employees | 97 | 5.1% |
| Federal Government Employees | 68 | 3.5% |
| Unpaid Family Workers | 0 | 0.0% |
| Total | 1,922 | 100.0% |
Employment Status by Age in Colville
According to the labor force statistics for Colville, out of the total population over 16 years of age (3,974), 50.5% or 2,007 individuals are in the labor force, with 3.3% or 66 of them unemployed. The age group with the highest labor force participation rate is 30 to 34 years, with 88.2% or 315 individuals in the labor force. Within the labor force, the 20 to 24 years age range has the highest percentage of unemployed individuals, with 10.5% or 15 of them being unemployed.
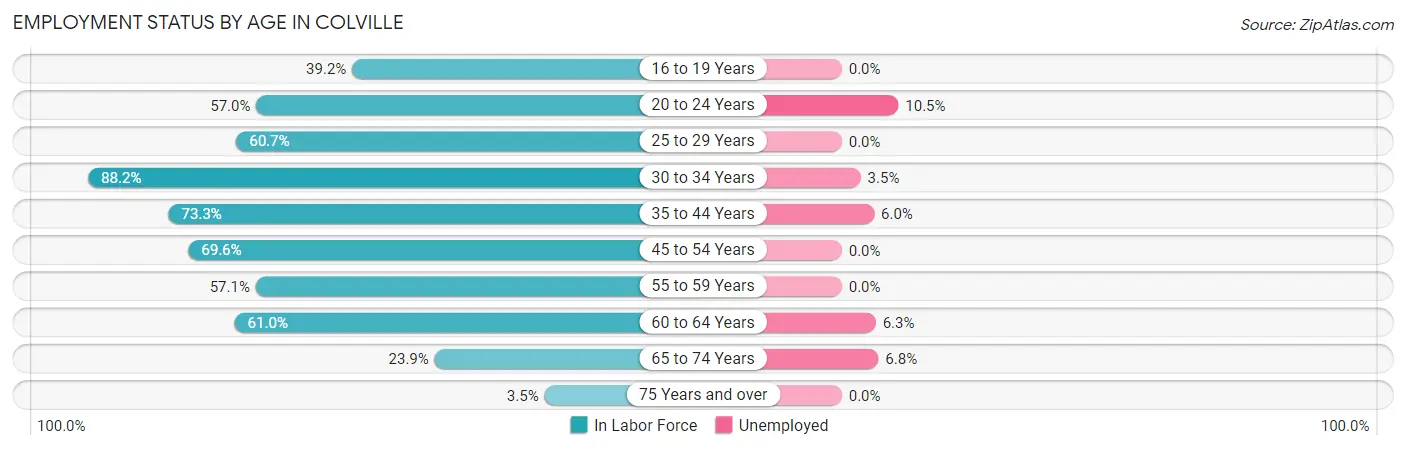
| Age Bracket | In Labor Force | Unemployed |
| 16 to 19 Years | 69 (39.2%) | 0 (0.0%) |
| 20 to 24 Years | 143 (57.0%) | 15 (10.5%) |
| 25 to 29 Years | 253 (60.7%) | 0 (0.0%) |
| 30 to 34 Years | 315 (88.2%) | 11 (3.5%) |
| 35 to 44 Years | 315 (73.3%) | 19 (6.0%) |
| 45 to 54 Years | 431 (69.6%) | 0 (0.0%) |
| 55 to 59 Years | 144 (57.1%) | 0 (0.0%) |
| 60 to 64 Years | 158 (61.0%) | 10 (6.3%) |
| 65 to 74 Years | 161 (23.9%) | 11 (6.8%) |
| 75 Years and over | 19 (3.5%) | 0 (0.0%) |
| Total | 2,007 (50.5%) | 66 (3.3%) |
Employment Status by Educational Attainment in Colville
According to labor force statistics for Colville, 69.2% of individuals (1,615) out of the total population between 25 and 64 years of age (2,334) are in the labor force, with 2.5% or 40 of them being unemployed. The group with the highest labor force participation rate are those with the educational attainment of bachelor's degree or higher, with 82.5% or 419 individuals in the labor force. Within the labor force, individuals with college / associate degree education have the highest percentage of unemployment, with 5.7% or 29 of them being unemployed.
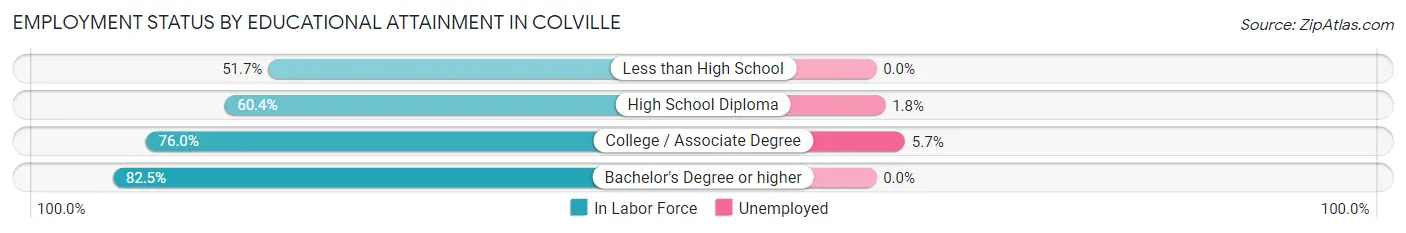
| Educational Attainment | In Labor Force | Unemployed |
| Less than High School | 62 (51.7%) | 0 (0.0%) |
| High School Diploma | 625 (60.4%) | 19 (1.8%) |
| College / Associate Degree | 510 (76.0%) | 38 (5.7%) |
| Bachelor's Degree or higher | 419 (82.5%) | 0 (0.0%) |
| Total | 1,615 (69.2%) | 58 (2.5%) |
Employment Occupations by Sex in Colville
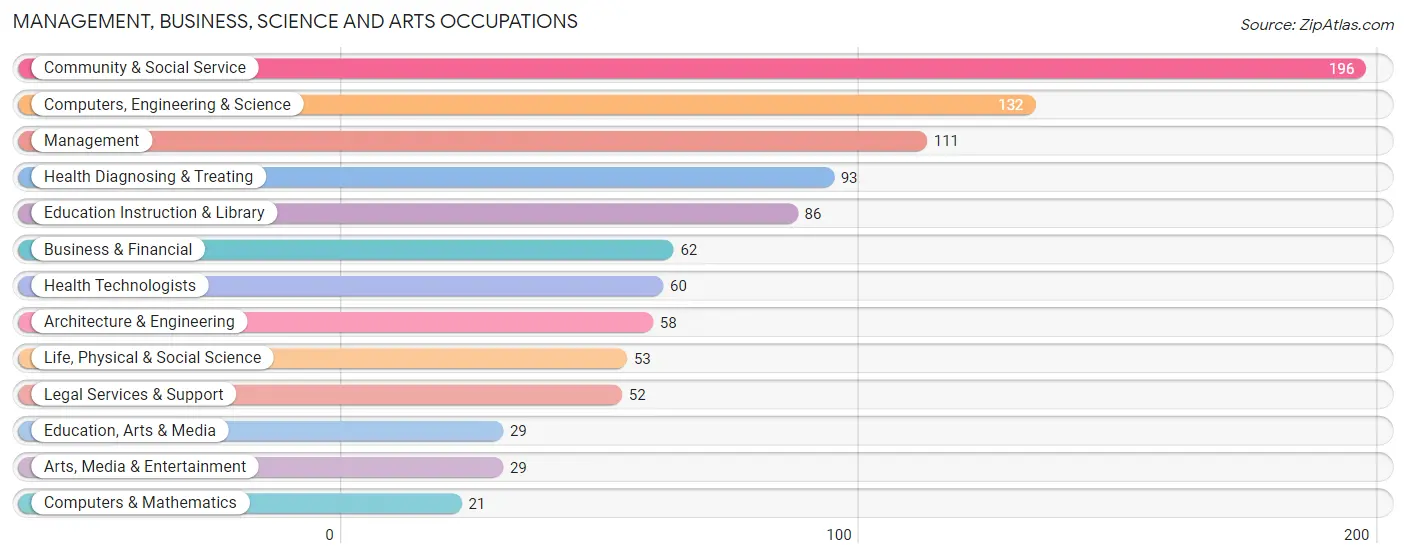
Management, Business, Science and Arts Occupations
The most common Management, Business, Science and Arts occupations in Colville are Community & Social Service (196 | 10.1%), Computers, Engineering & Science (132 | 6.8%), Management (111 | 5.7%), Health Diagnosing & Treating (93 | 4.8%), and Education Instruction & Library (86 | 4.4%).
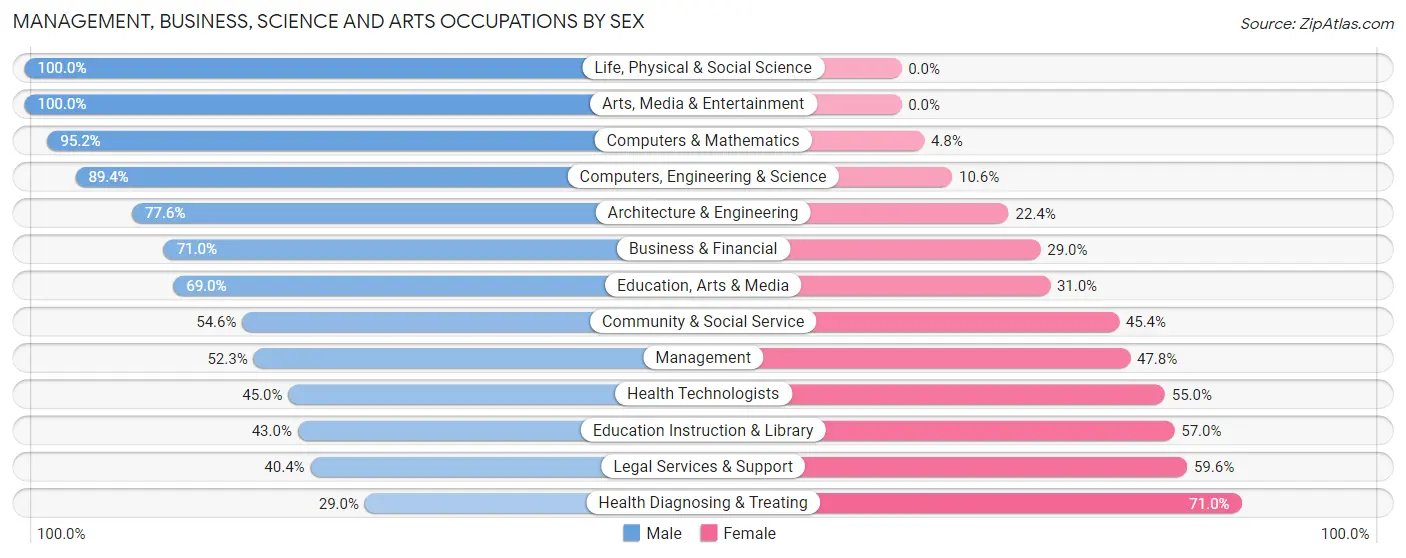
Management, Business, Science and Arts Occupations by Sex
Within the Management, Business, Science and Arts occupations in Colville, the most male-oriented occupations are Life, Physical & Social Science (100.0%), Arts, Media & Entertainment (100.0%), and Computers & Mathematics (95.2%), while the most female-oriented occupations are Health Diagnosing & Treating (71.0%), Legal Services & Support (59.6%), and Education Instruction & Library (57.0%).
| Occupation | Male | Female |
| Management | 58 (52.2%) | 53 (47.7%) |
| Business & Financial | 44 (71.0%) | 18 (29.0%) |
| Computers, Engineering & Science | 118 (89.4%) | 14 (10.6%) |
| Computers & Mathematics | 20 (95.2%) | 1 (4.8%) |
| Architecture & Engineering | 45 (77.6%) | 13 (22.4%) |
| Life, Physical & Social Science | 53 (100.0%) | 0 (0.0%) |
| Community & Social Service | 107 (54.6%) | 89 (45.4%) |
| Education, Arts & Media | 20 (69.0%) | 9 (31.0%) |
| Legal Services & Support | 21 (40.4%) | 31 (59.6%) |
| Education Instruction & Library | 37 (43.0%) | 49 (57.0%) |
| Arts, Media & Entertainment | 29 (100.0%) | 0 (0.0%) |
| Health Diagnosing & Treating | 27 (29.0%) | 66 (71.0%) |
| Health Technologists | 27 (45.0%) | 33 (55.0%) |
| Total (Category) | 354 (59.6%) | 240 (40.4%) |
| Total (Overall) | 993 (51.1%) | 949 (48.9%) |
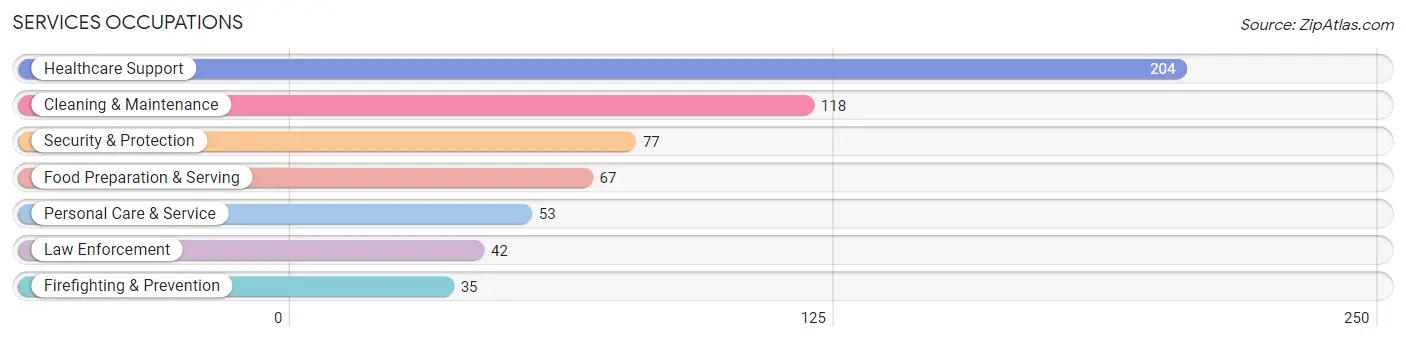
Services Occupations
The most common Services occupations in Colville are Healthcare Support (204 | 10.5%), Cleaning & Maintenance (118 | 6.1%), Security & Protection (77 | 4.0%), Food Preparation & Serving (67 | 3.5%), and Personal Care & Service (53 | 2.7%).
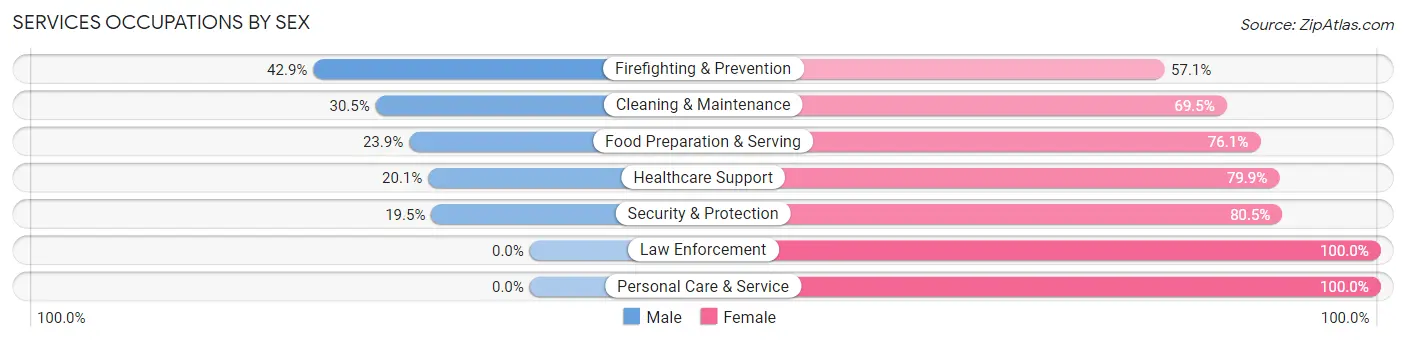
Services Occupations by Sex
Within the Services occupations in Colville, the most male-oriented occupations are Firefighting & Prevention (42.9%), Cleaning & Maintenance (30.5%), and Food Preparation & Serving (23.9%), while the most female-oriented occupations are Law Enforcement (100.0%), Personal Care & Service (100.0%), and Security & Protection (80.5%).
| Occupation | Male | Female |
| Healthcare Support | 41 (20.1%) | 163 (79.9%) |
| Security & Protection | 15 (19.5%) | 62 (80.5%) |
| Firefighting & Prevention | 15 (42.9%) | 20 (57.1%) |
| Law Enforcement | 0 (0.0%) | 42 (100.0%) |
| Food Preparation & Serving | 16 (23.9%) | 51 (76.1%) |
| Cleaning & Maintenance | 36 (30.5%) | 82 (69.5%) |
| Personal Care & Service | 0 (0.0%) | 53 (100.0%) |
| Total (Category) | 108 (20.8%) | 411 (79.2%) |
| Total (Overall) | 993 (51.1%) | 949 (48.9%) |
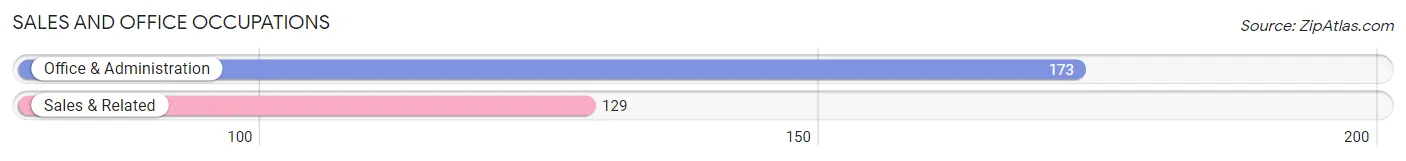
Sales and Office Occupations
The most common Sales and Office occupations in Colville are Office & Administration (173 | 8.9%), and Sales & Related (129 | 6.6%).
Sales and Office Occupations by Sex
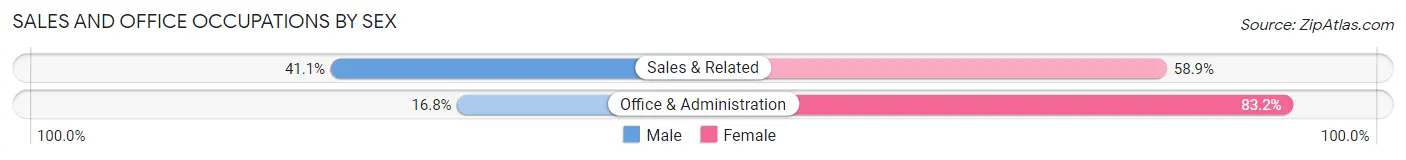
| Occupation | Male | Female |
| Sales & Related | 53 (41.1%) | 76 (58.9%) |
| Office & Administration | 29 (16.8%) | 144 (83.2%) |
| Total (Category) | 82 (27.2%) | 220 (72.9%) |
| Total (Overall) | 993 (51.1%) | 949 (48.9%) |
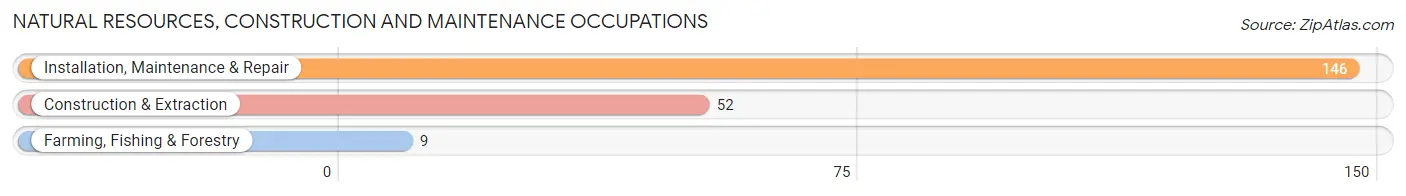
Natural Resources, Construction and Maintenance Occupations
The most common Natural Resources, Construction and Maintenance occupations in Colville are Installation, Maintenance & Repair (146 | 7.5%), Construction & Extraction (52 | 2.7%), and Farming, Fishing & Forestry (9 | 0.5%).
Natural Resources, Construction and Maintenance Occupations by Sex
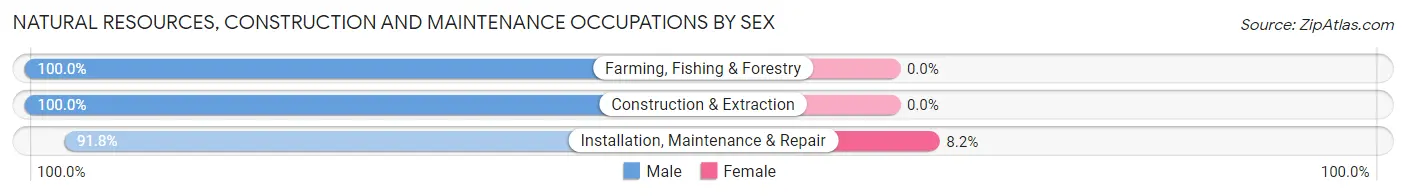
| Occupation | Male | Female |
| Farming, Fishing & Forestry | 9 (100.0%) | 0 (0.0%) |
| Construction & Extraction | 52 (100.0%) | 0 (0.0%) |
| Installation, Maintenance & Repair | 134 (91.8%) | 12 (8.2%) |
| Total (Category) | 195 (94.2%) | 12 (5.8%) |
| Total (Overall) | 993 (51.1%) | 949 (48.9%) |
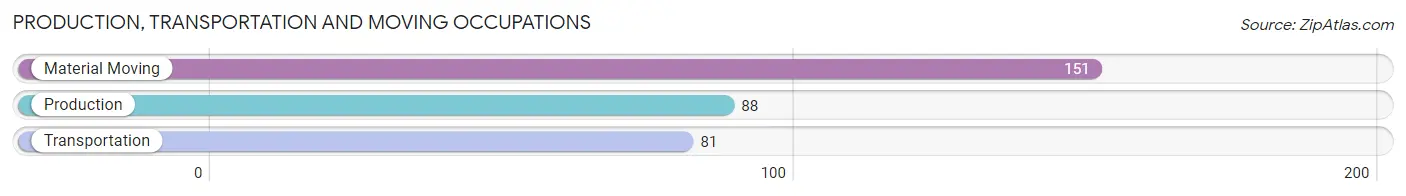
Production, Transportation and Moving Occupations
The most common Production, Transportation and Moving occupations in Colville are Material Moving (151 | 7.8%), Production (88 | 4.5%), and Transportation (81 | 4.2%).
Production, Transportation and Moving Occupations by Sex
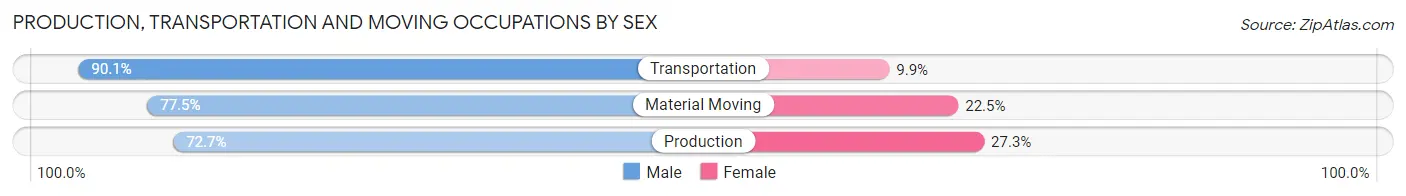
| Occupation | Male | Female |
| Production | 64 (72.7%) | 24 (27.3%) |
| Transportation | 73 (90.1%) | 8 (9.9%) |
| Material Moving | 117 (77.5%) | 34 (22.5%) |
| Total (Category) | 254 (79.4%) | 66 (20.6%) |
| Total (Overall) | 993 (51.1%) | 949 (48.9%) |
Employment Industries by Sex in Colville
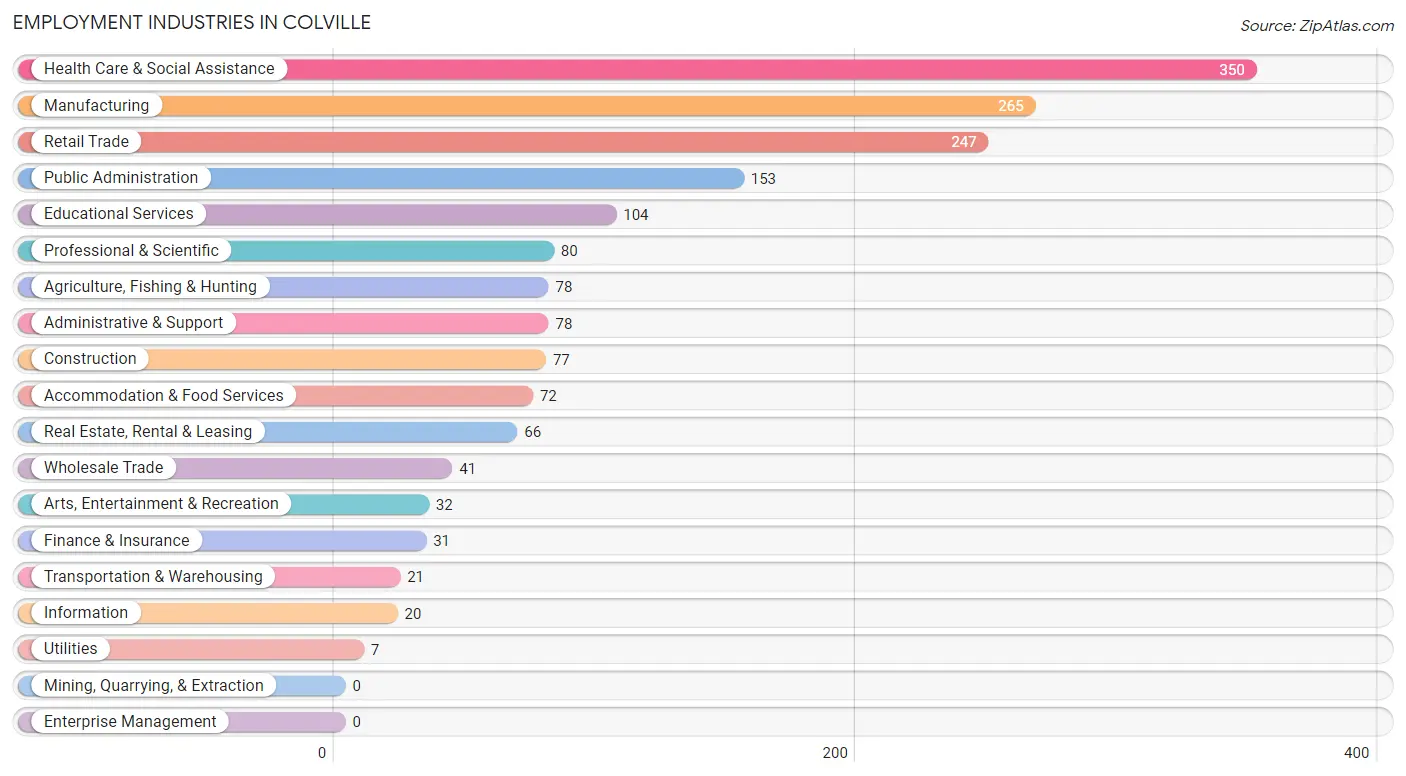
Employment Industries in Colville
The major employment industries in Colville include Health Care & Social Assistance (350 | 18.0%), Manufacturing (265 | 13.7%), Retail Trade (247 | 12.7%), Public Administration (153 | 7.9%), and Educational Services (104 | 5.4%).
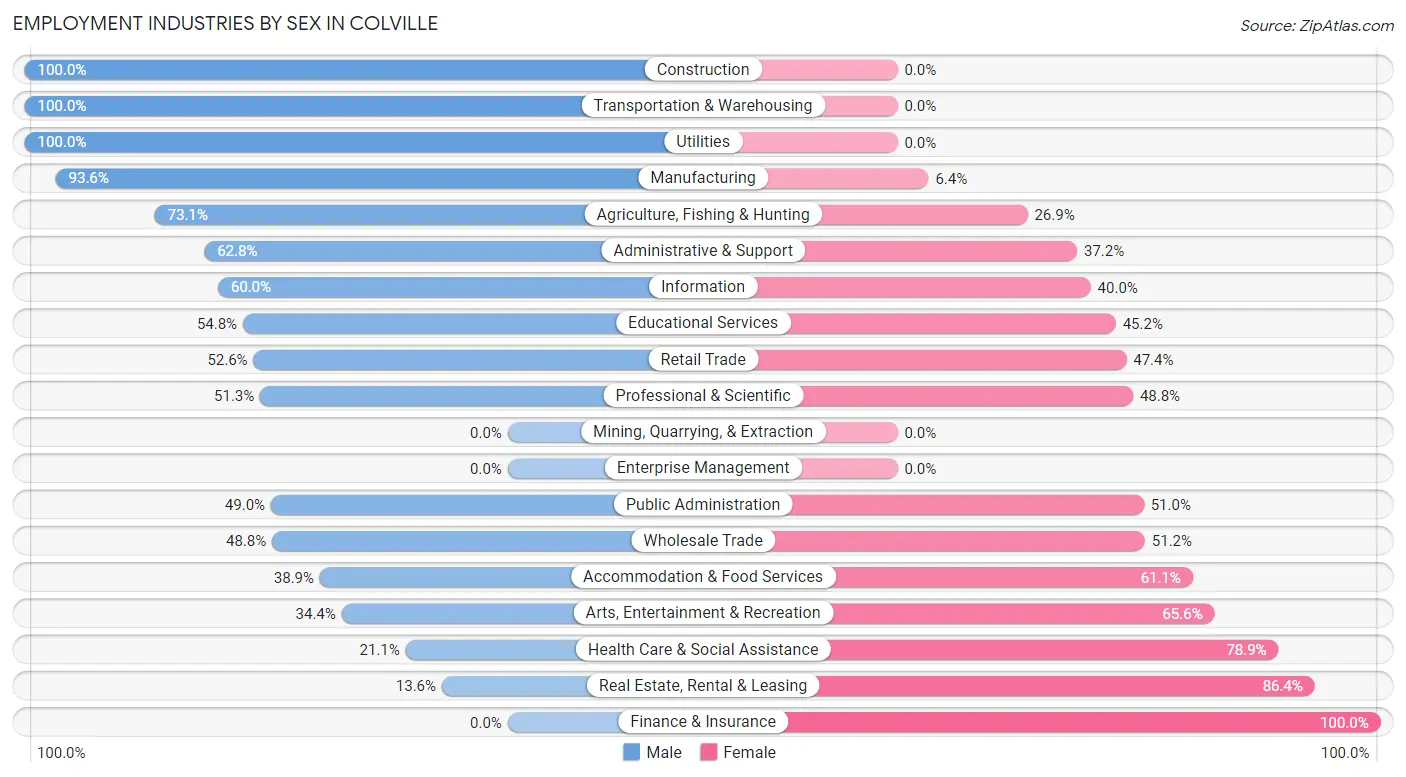
Employment Industries by Sex in Colville
The Colville industries that see more men than women are Construction (100.0%), Transportation & Warehousing (100.0%), and Utilities (100.0%), whereas the industries that tend to have a higher number of women are Finance & Insurance (100.0%), Real Estate, Rental & Leasing (86.4%), and Health Care & Social Assistance (78.9%).
| Industry | Male | Female |
| Agriculture, Fishing & Hunting | 57 (73.1%) | 21 (26.9%) |
| Mining, Quarrying, & Extraction | 0 (0.0%) | 0 (0.0%) |
| Construction | 77 (100.0%) | 0 (0.0%) |
| Manufacturing | 248 (93.6%) | 17 (6.4%) |
| Wholesale Trade | 20 (48.8%) | 21 (51.2%) |
| Retail Trade | 130 (52.6%) | 117 (47.4%) |
| Transportation & Warehousing | 21 (100.0%) | 0 (0.0%) |
| Utilities | 7 (100.0%) | 0 (0.0%) |
| Information | 12 (60.0%) | 8 (40.0%) |
| Finance & Insurance | 0 (0.0%) | 31 (100.0%) |
| Real Estate, Rental & Leasing | 9 (13.6%) | 57 (86.4%) |
| Professional & Scientific | 41 (51.2%) | 39 (48.7%) |
| Enterprise Management | 0 (0.0%) | 0 (0.0%) |
| Administrative & Support | 49 (62.8%) | 29 (37.2%) |
| Educational Services | 57 (54.8%) | 47 (45.2%) |
| Health Care & Social Assistance | 74 (21.1%) | 276 (78.9%) |
| Arts, Entertainment & Recreation | 11 (34.4%) | 21 (65.6%) |
| Accommodation & Food Services | 28 (38.9%) | 44 (61.1%) |
| Public Administration | 75 (49.0%) | 78 (51.0%) |
| Total | 993 (51.1%) | 949 (48.9%) |
Education in Colville
School Enrollment in Colville
The most common levels of schooling among the 935 students in Colville are elementary school (264 | 28.2%), high school (251 | 26.8%), and nursery / preschool (154 | 16.5%).

| School Level | # Students | % Students |
| Nursery / Preschool | 154 | 16.5% |
| Kindergarten | 78 | 8.3% |
| Elementary School | 264 | 28.2% |
| Middle School | 84 | 9.0% |
| High School | 251 | 26.8% |
| College / Undergraduate | 67 | 7.2% |
| Graduate / Professional | 37 | 4.0% |
| Total | 935 | 100.0% |
School Enrollment by Age by Funding Source in Colville
Out of a total of 935 students who are enrolled in schools in Colville, 78 (8.3%) attend a private institution, while the remaining 857 (91.7%) are enrolled in public schools. The age group of 35 years and over has the highest likelihood of being enrolled in private schools, with 38 (66.7% in the age bracket) enrolled. Conversely, the age group of 18 to 19 year olds has the lowest likelihood of being enrolled in a private school, with 56 (100.0% in the age bracket) attending a public institution.
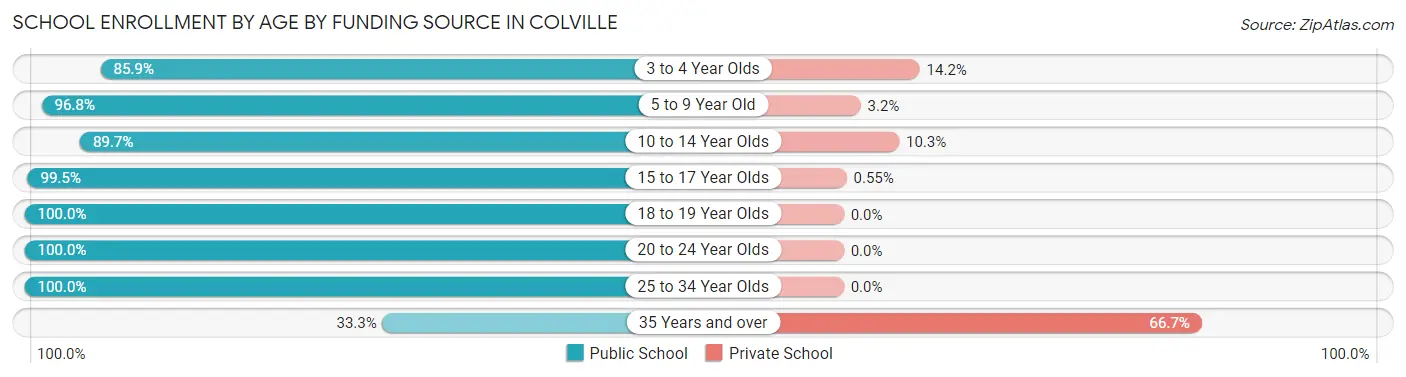
| Age Bracket | Public School | Private School |
| 3 to 4 Year Olds | 91 (85.9%) | 15 (14.1%) |
| 5 to 9 Year Old | 337 (96.8%) | 11 (3.2%) |
| 10 to 14 Year Olds | 113 (89.7%) | 13 (10.3%) |
| 15 to 17 Year Olds | 182 (99.5%) | 1 (0.5%) |
| 18 to 19 Year Olds | 56 (100.0%) | 0 (0.0%) |
| 20 to 24 Year Olds | 23 (100.0%) | 0 (0.0%) |
| 25 to 34 Year Olds | 36 (100.0%) | 0 (0.0%) |
| 35 Years and over | 19 (33.3%) | 38 (66.7%) |
| Total | 857 (91.7%) | 78 (8.3%) |
Educational Attainment by Field of Study in Colville
Science & technology (125 | 12.3%), bio, nature & agricultural (122 | 12.0%), social sciences (113 | 11.2%), engineering (103 | 10.2%), and education (103 | 10.2%) are the most common fields of study among 1,013 individuals in Colville who have obtained a bachelor's degree or higher.
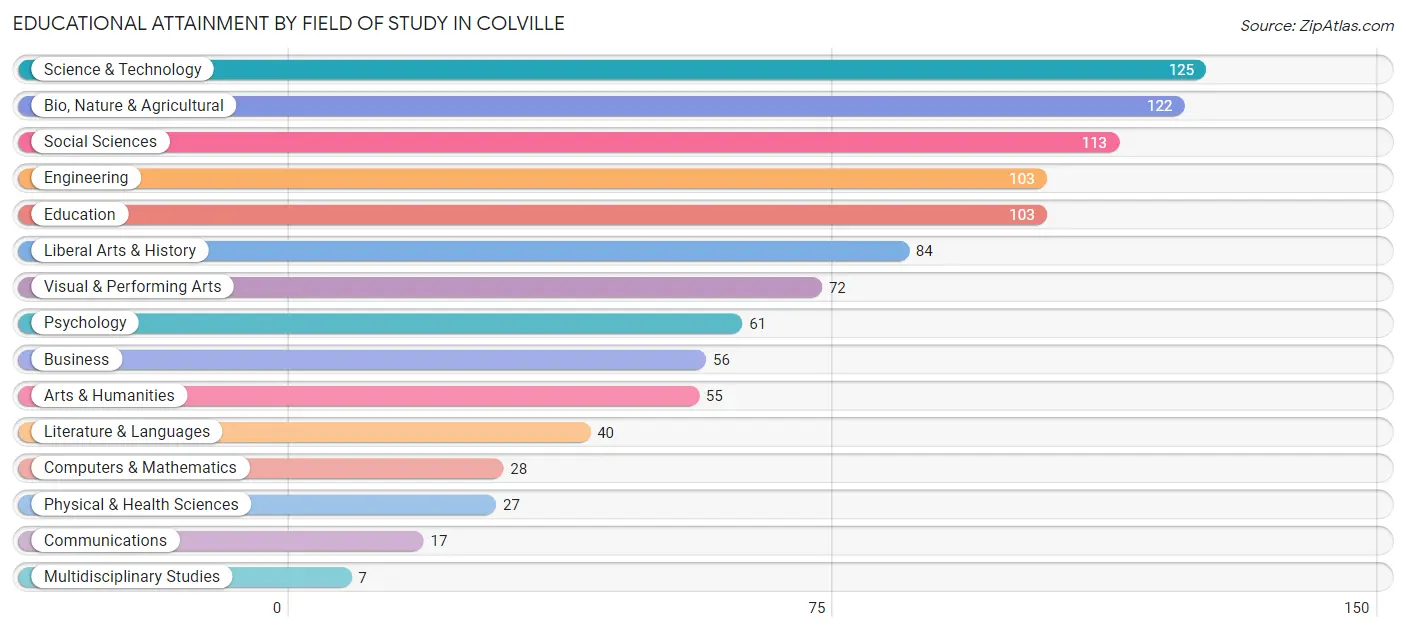
| Field of Study | # Graduates | % Graduates |
| Computers & Mathematics | 28 | 2.8% |
| Bio, Nature & Agricultural | 122 | 12.0% |
| Physical & Health Sciences | 27 | 2.7% |
| Psychology | 61 | 6.0% |
| Social Sciences | 113 | 11.2% |
| Engineering | 103 | 10.2% |
| Multidisciplinary Studies | 7 | 0.7% |
| Science & Technology | 125 | 12.3% |
| Business | 56 | 5.5% |
| Education | 103 | 10.2% |
| Literature & Languages | 40 | 4.0% |
| Liberal Arts & History | 84 | 8.3% |
| Visual & Performing Arts | 72 | 7.1% |
| Communications | 17 | 1.7% |
| Arts & Humanities | 55 | 5.4% |
| Total | 1,013 | 100.0% |
Transportation & Commute in Colville
Vehicle Availability by Sex in Colville
The most prevalent vehicle ownership categories in Colville are males with 2 vehicles (492, accounting for 50.1%) and females with 2 vehicles (433, making up 52.4%).
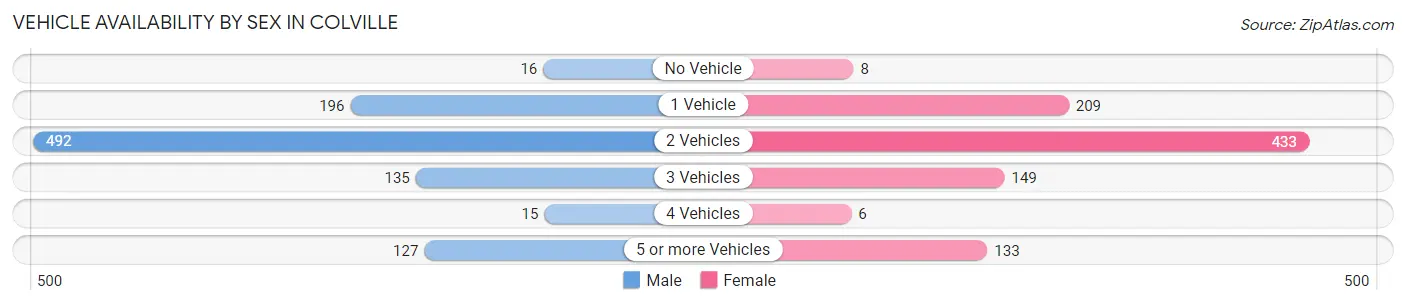
| Vehicles Available | Male | Female |
| No Vehicle | 16 (1.6%) | 8 (0.9%) |
| 1 Vehicle | 196 (20.0%) | 209 (22.3%) |
| 2 Vehicles | 492 (50.1%) | 433 (46.2%) |
| 3 Vehicles | 135 (13.8%) | 149 (15.9%) |
| 4 Vehicles | 15 (1.5%) | 6 (0.6%) |
| 5 or more Vehicles | 127 (13.0%) | 133 (14.2%) |
| Total | 981 (100.0%) | 938 (100.0%) |
Commute Time in Colville
The most frequently occuring commute durations in Colville are 5 to 9 minutes (598 commuters, 35.6%), 10 to 14 minutes (312 commuters, 18.6%), and less than 5 minutes (280 commuters, 16.7%).
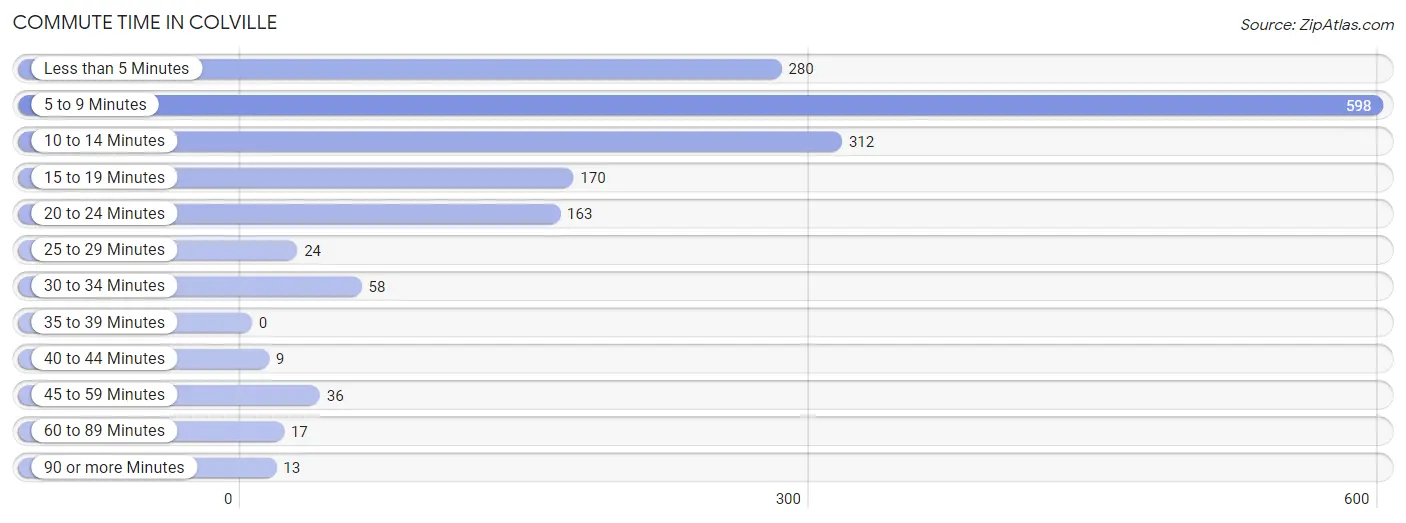
| Commute Time | # Commuters | % Commuters |
| Less than 5 Minutes | 280 | 16.7% |
| 5 to 9 Minutes | 598 | 35.6% |
| 10 to 14 Minutes | 312 | 18.6% |
| 15 to 19 Minutes | 170 | 10.1% |
| 20 to 24 Minutes | 163 | 9.7% |
| 25 to 29 Minutes | 24 | 1.4% |
| 30 to 34 Minutes | 58 | 3.5% |
| 35 to 39 Minutes | 0 | 0.0% |
| 40 to 44 Minutes | 9 | 0.5% |
| 45 to 59 Minutes | 36 | 2.1% |
| 60 to 89 Minutes | 17 | 1.0% |
| 90 or more Minutes | 13 | 0.8% |
Commute Time by Sex in Colville
The most common commute times in Colville are 5 to 9 minutes (304 commuters, 33.8%) for males and 5 to 9 minutes (294 commuters, 37.6%) for females.
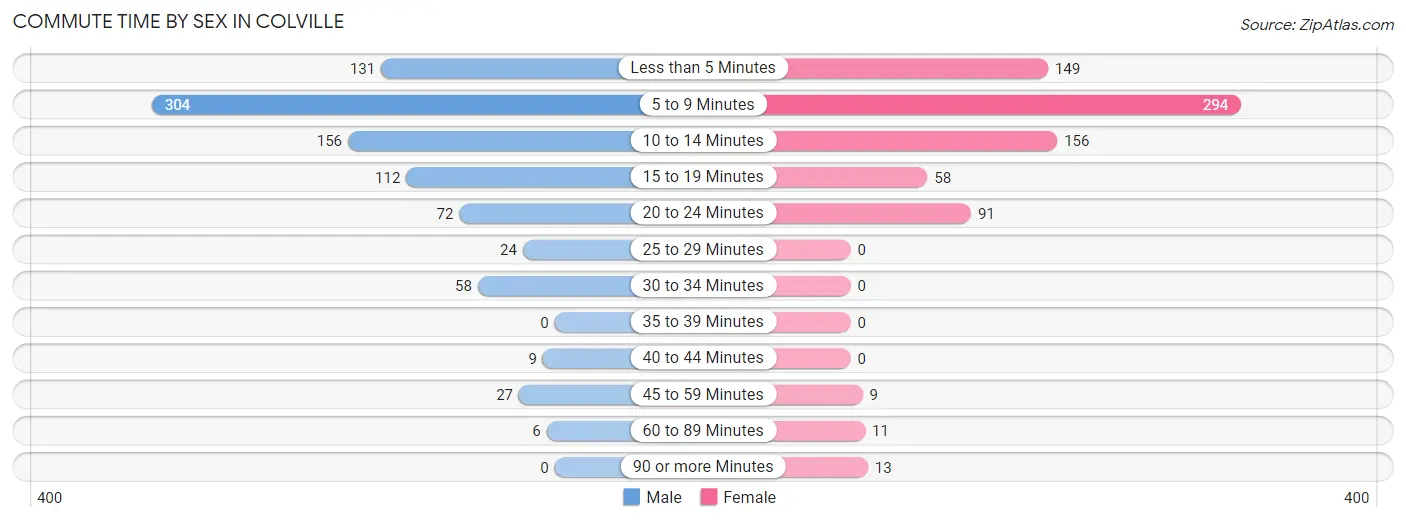
| Commute Time | Male | Female |
| Less than 5 Minutes | 131 (14.6%) | 149 (19.1%) |
| 5 to 9 Minutes | 304 (33.8%) | 294 (37.6%) |
| 10 to 14 Minutes | 156 (17.3%) | 156 (20.0%) |
| 15 to 19 Minutes | 112 (12.5%) | 58 (7.4%) |
| 20 to 24 Minutes | 72 (8.0%) | 91 (11.7%) |
| 25 to 29 Minutes | 24 (2.7%) | 0 (0.0%) |
| 30 to 34 Minutes | 58 (6.5%) | 0 (0.0%) |
| 35 to 39 Minutes | 0 (0.0%) | 0 (0.0%) |
| 40 to 44 Minutes | 9 (1.0%) | 0 (0.0%) |
| 45 to 59 Minutes | 27 (3.0%) | 9 (1.1%) |
| 60 to 89 Minutes | 6 (0.7%) | 11 (1.4%) |
| 90 or more Minutes | 0 (0.0%) | 13 (1.7%) |
Time of Departure to Work by Sex in Colville
The most frequent times of departure to work in Colville are 7:30 AM to 7:59 AM (148, 16.5%) for males and 7:30 AM to 7:59 AM (216, 27.7%) for females.
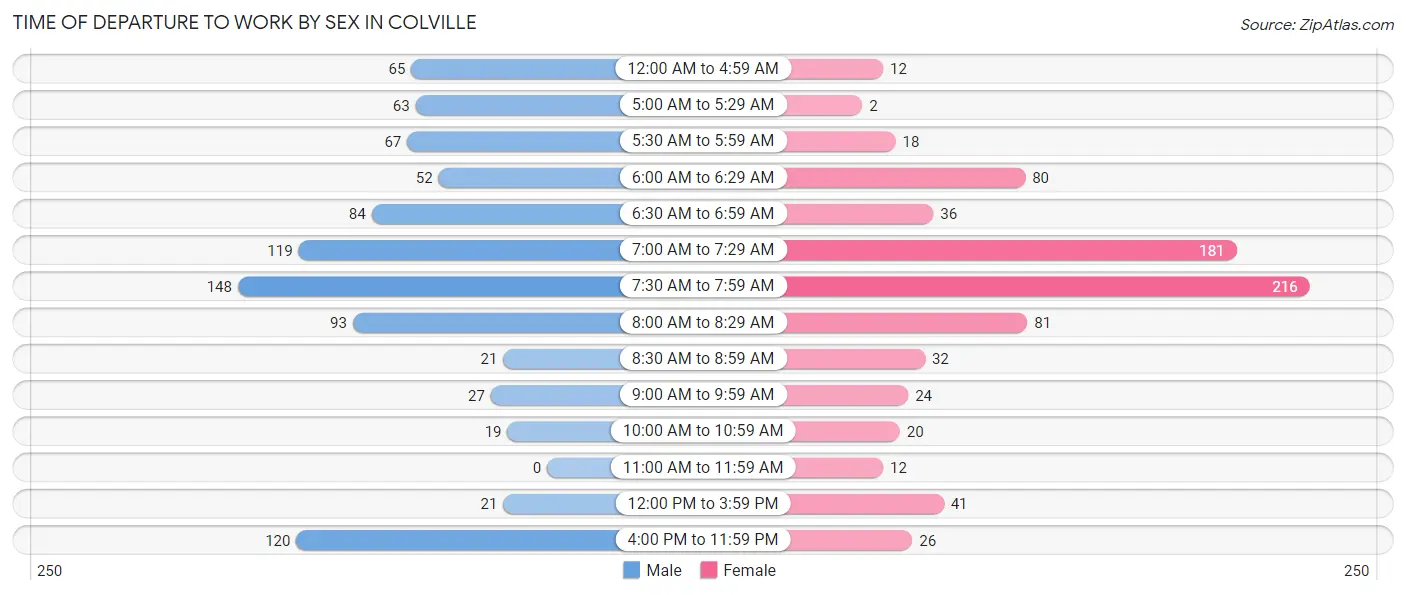
| Time of Departure | Male | Female |
| 12:00 AM to 4:59 AM | 65 (7.2%) | 12 (1.5%) |
| 5:00 AM to 5:29 AM | 63 (7.0%) | 2 (0.3%) |
| 5:30 AM to 5:59 AM | 67 (7.4%) | 18 (2.3%) |
| 6:00 AM to 6:29 AM | 52 (5.8%) | 80 (10.2%) |
| 6:30 AM to 6:59 AM | 84 (9.3%) | 36 (4.6%) |
| 7:00 AM to 7:29 AM | 119 (13.2%) | 181 (23.2%) |
| 7:30 AM to 7:59 AM | 148 (16.5%) | 216 (27.7%) |
| 8:00 AM to 8:29 AM | 93 (10.3%) | 81 (10.4%) |
| 8:30 AM to 8:59 AM | 21 (2.3%) | 32 (4.1%) |
| 9:00 AM to 9:59 AM | 27 (3.0%) | 24 (3.1%) |
| 10:00 AM to 10:59 AM | 19 (2.1%) | 20 (2.6%) |
| 11:00 AM to 11:59 AM | 0 (0.0%) | 12 (1.5%) |
| 12:00 PM to 3:59 PM | 21 (2.3%) | 41 (5.2%) |
| 4:00 PM to 11:59 PM | 120 (13.4%) | 26 (3.3%) |
| Total | 899 (100.0%) | 781 (100.0%) |
Housing Occupancy in Colville
Occupancy by Ownership in Colville
Of the total 2,071 dwellings in Colville, owner-occupied units account for 1,204 (58.1%), while renter-occupied units make up 867 (41.9%).
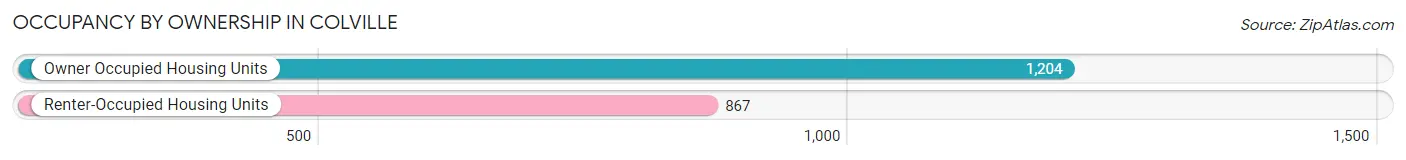
| Occupancy | # Housing Units | % Housing Units |
| Owner Occupied Housing Units | 1,204 | 58.1% |
| Renter-Occupied Housing Units | 867 | 41.9% |
| Total Occupied Housing Units | 2,071 | 100.0% |
Occupancy by Household Size in Colville
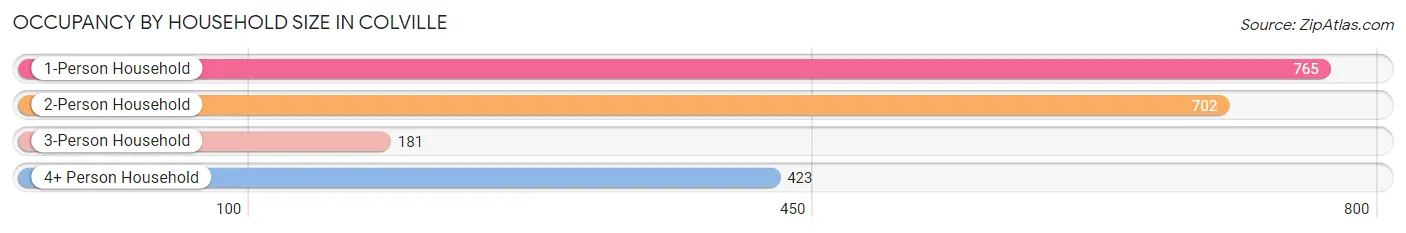
| Household Size | # Housing Units | % Housing Units |
| 1-Person Household | 765 | 36.9% |
| 2-Person Household | 702 | 33.9% |
| 3-Person Household | 181 | 8.7% |
| 4+ Person Household | 423 | 20.4% |
| Total Housing Units | 2,071 | 100.0% |
Occupancy by Ownership by Household Size in Colville
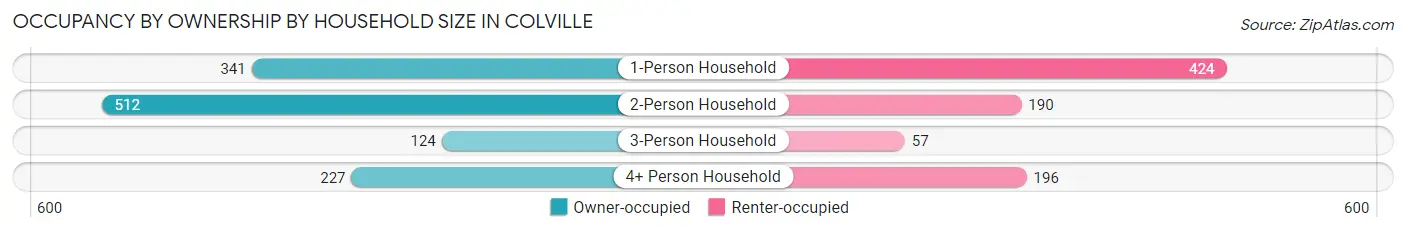
| Household Size | Owner-occupied | Renter-occupied |
| 1-Person Household | 341 (44.6%) | 424 (55.4%) |
| 2-Person Household | 512 (72.9%) | 190 (27.1%) |
| 3-Person Household | 124 (68.5%) | 57 (31.5%) |
| 4+ Person Household | 227 (53.7%) | 196 (46.3%) |
| Total Housing Units | 1,204 (58.1%) | 867 (41.9%) |
Occupancy by Educational Attainment in Colville
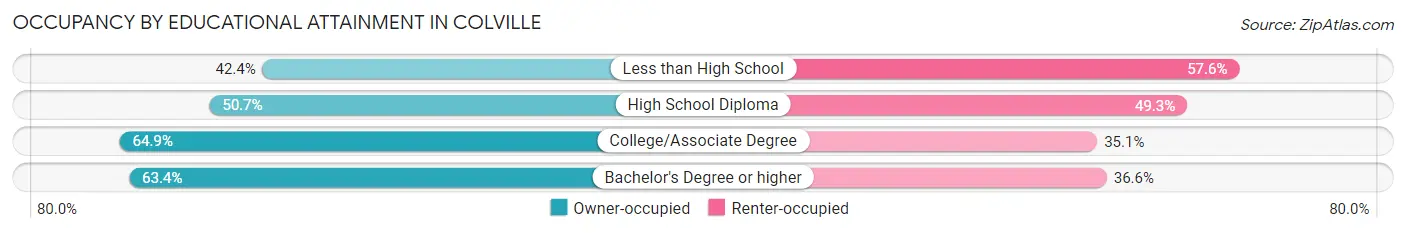
| Household Size | Owner-occupied | Renter-occupied |
| Less than High School | 56 (42.4%) | 76 (57.6%) |
| High School Diploma | 364 (50.7%) | 354 (49.3%) |
| College/Associate Degree | 413 (64.9%) | 223 (35.1%) |
| Bachelor's Degree or higher | 371 (63.4%) | 214 (36.6%) |
Occupancy by Age of Householder in Colville
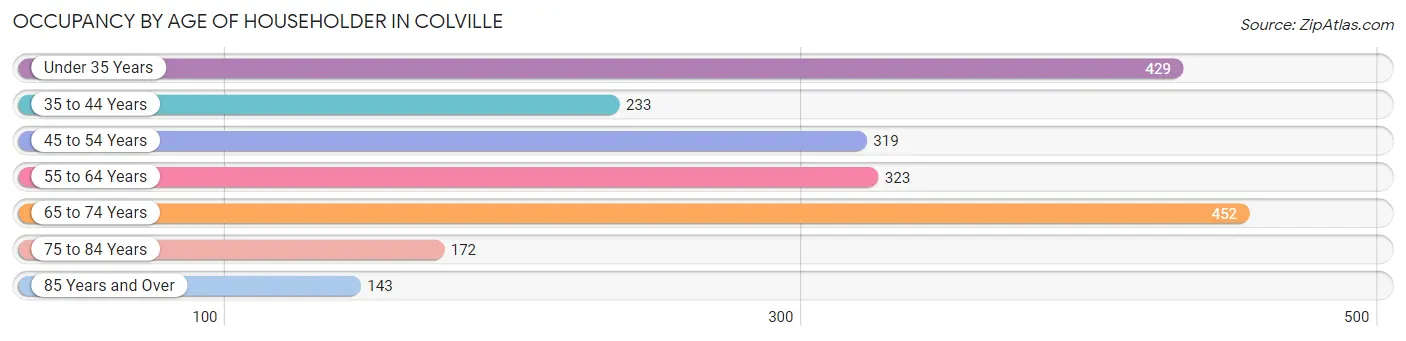
| Age Bracket | # Households | % Households |
| Under 35 Years | 429 | 20.7% |
| 35 to 44 Years | 233 | 11.3% |
| 45 to 54 Years | 319 | 15.4% |
| 55 to 64 Years | 323 | 15.6% |
| 65 to 74 Years | 452 | 21.8% |
| 75 to 84 Years | 172 | 8.3% |
| 85 Years and Over | 143 | 6.9% |
| Total | 2,071 | 100.0% |
Housing Finances in Colville
Median Income by Occupancy in Colville
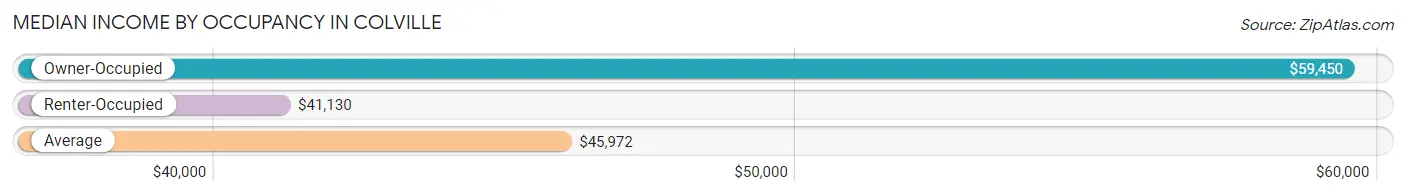
| Occupancy Type | # Households | Median Income |
| Owner-Occupied | 1,204 (58.1%) | $59,450 |
| Renter-Occupied | 867 (41.9%) | $41,130 |
| Average | 2,071 (100.0%) | $45,972 |
Occupancy by Householder Income Bracket in Colville
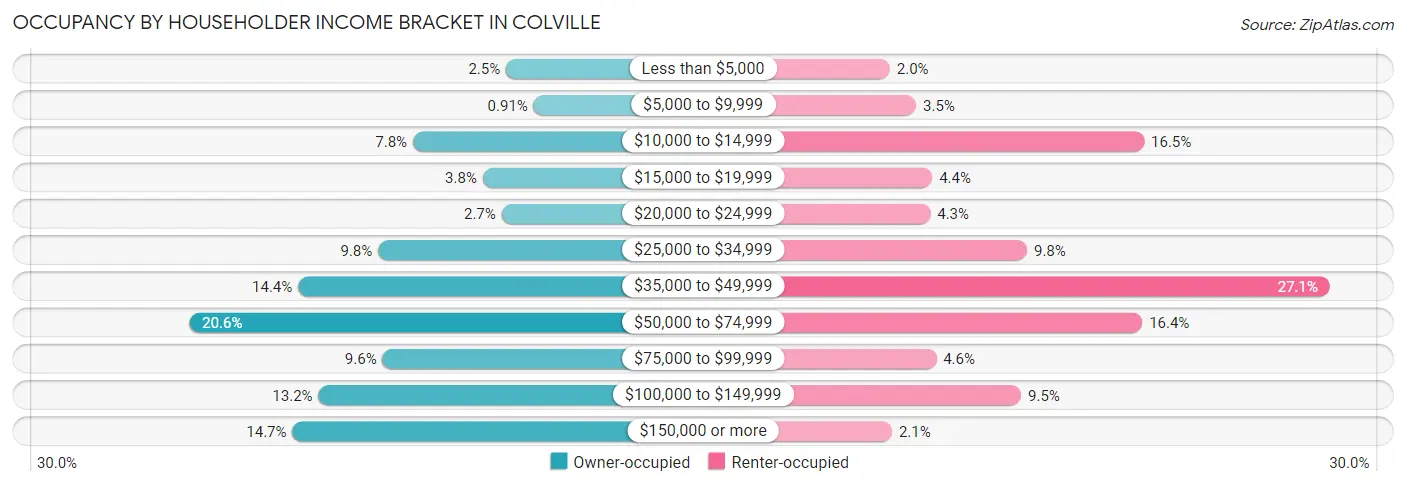
| Income Bracket | Owner-occupied | Renter-occupied |
| Less than $5,000 | 30 (2.5%) | 17 (2.0%) |
| $5,000 to $9,999 | 11 (0.9%) | 30 (3.5%) |
| $10,000 to $14,999 | 94 (7.8%) | 143 (16.5%) |
| $15,000 to $19,999 | 46 (3.8%) | 38 (4.4%) |
| $20,000 to $24,999 | 33 (2.7%) | 37 (4.3%) |
| $25,000 to $34,999 | 118 (9.8%) | 85 (9.8%) |
| $35,000 to $49,999 | 173 (14.4%) | 235 (27.1%) |
| $50,000 to $74,999 | 248 (20.6%) | 142 (16.4%) |
| $75,000 to $99,999 | 115 (9.6%) | 40 (4.6%) |
| $100,000 to $149,999 | 159 (13.2%) | 82 (9.5%) |
| $150,000 or more | 177 (14.7%) | 18 (2.1%) |
| Total | 1,204 (100.0%) | 867 (100.0%) |
Monthly Housing Cost Tiers in Colville
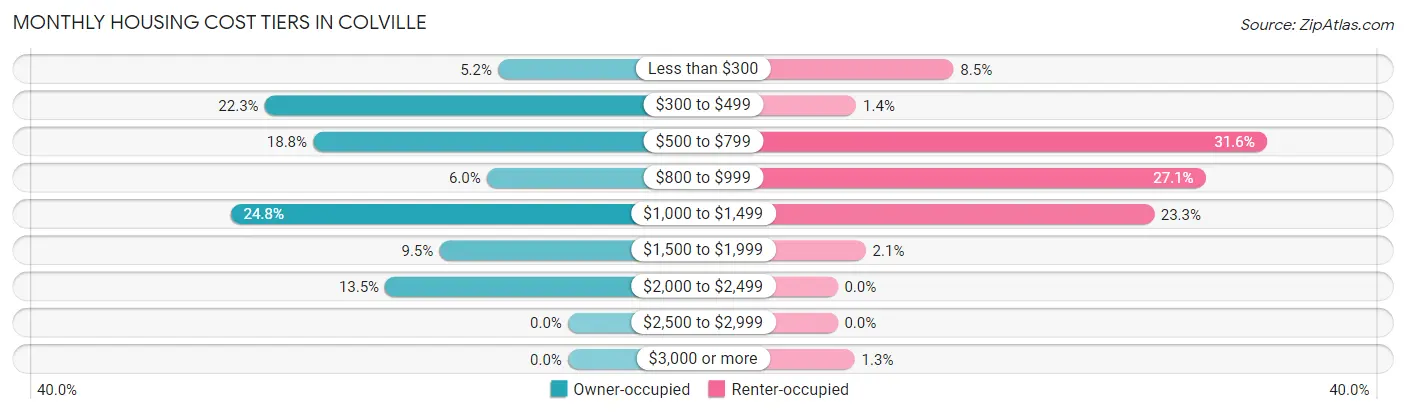
| Monthly Cost | Owner-occupied | Renter-occupied |
| Less than $300 | 62 (5.1%) | 74 (8.5%) |
| $300 to $499 | 269 (22.3%) | 12 (1.4%) |
| $500 to $799 | 226 (18.8%) | 274 (31.6%) |
| $800 to $999 | 72 (6.0%) | 235 (27.1%) |
| $1,000 to $1,499 | 299 (24.8%) | 202 (23.3%) |
| $1,500 to $1,999 | 114 (9.5%) | 18 (2.1%) |
| $2,000 to $2,499 | 162 (13.5%) | 0 (0.0%) |
| $2,500 to $2,999 | 0 (0.0%) | 0 (0.0%) |
| $3,000 or more | 0 (0.0%) | 11 (1.3%) |
| Total | 1,204 (100.0%) | 867 (100.0%) |
Physical Housing Characteristics in Colville
Housing Structures in Colville
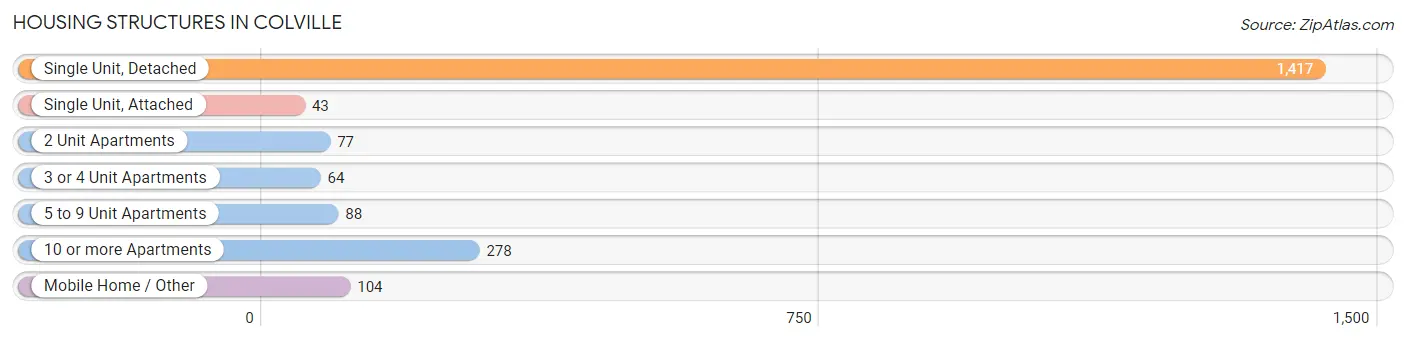
| Structure Type | # Housing Units | % Housing Units |
| Single Unit, Detached | 1,417 | 68.4% |
| Single Unit, Attached | 43 | 2.1% |
| 2 Unit Apartments | 77 | 3.7% |
| 3 or 4 Unit Apartments | 64 | 3.1% |
| 5 to 9 Unit Apartments | 88 | 4.3% |
| 10 or more Apartments | 278 | 13.4% |
| Mobile Home / Other | 104 | 5.0% |
| Total | 2,071 | 100.0% |
Housing Structures by Occupancy in Colville
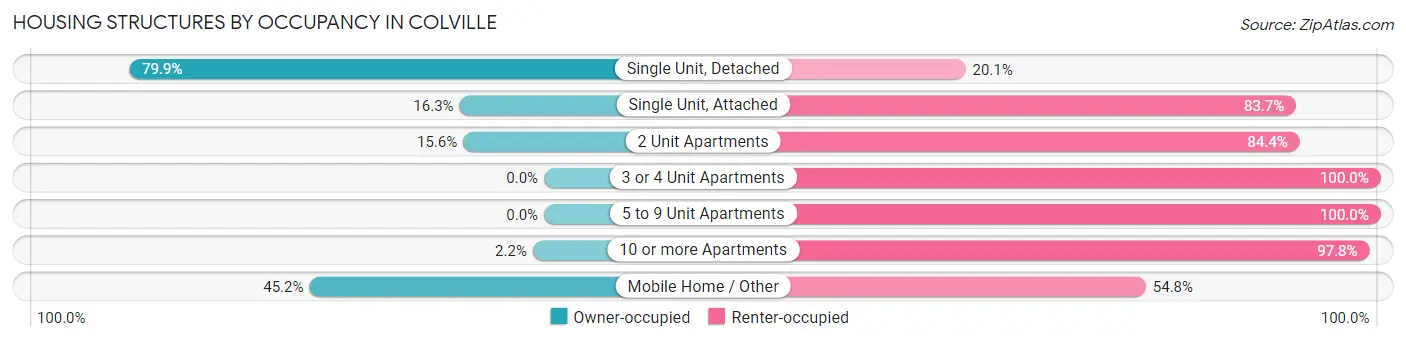
| Structure Type | Owner-occupied | Renter-occupied |
| Single Unit, Detached | 1,132 (79.9%) | 285 (20.1%) |
| Single Unit, Attached | 7 (16.3%) | 36 (83.7%) |
| 2 Unit Apartments | 12 (15.6%) | 65 (84.4%) |
| 3 or 4 Unit Apartments | 0 (0.0%) | 64 (100.0%) |
| 5 to 9 Unit Apartments | 0 (0.0%) | 88 (100.0%) |
| 10 or more Apartments | 6 (2.2%) | 272 (97.8%) |
| Mobile Home / Other | 47 (45.2%) | 57 (54.8%) |
| Total | 1,204 (58.1%) | 867 (41.9%) |
Housing Structures by Number of Rooms in Colville
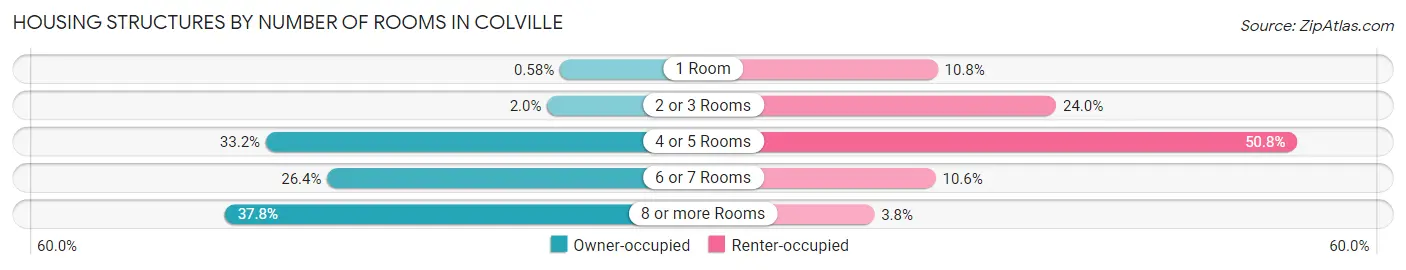
| Number of Rooms | Owner-occupied | Renter-occupied |
| 1 Room | 7 (0.6%) | 94 (10.8%) |
| 2 or 3 Rooms | 24 (2.0%) | 208 (24.0%) |
| 4 or 5 Rooms | 400 (33.2%) | 440 (50.7%) |
| 6 or 7 Rooms | 318 (26.4%) | 92 (10.6%) |
| 8 or more Rooms | 455 (37.8%) | 33 (3.8%) |
| Total | 1,204 (100.0%) | 867 (100.0%) |
Housing Structure by Heating Type in Colville
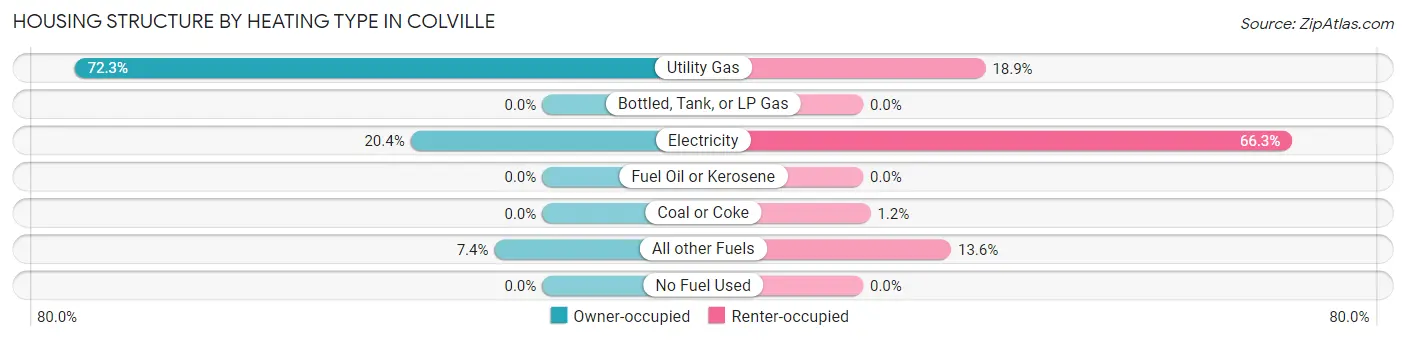
| Heating Type | Owner-occupied | Renter-occupied |
| Utility Gas | 870 (72.3%) | 164 (18.9%) |
| Bottled, Tank, or LP Gas | 0 (0.0%) | 0 (0.0%) |
| Electricity | 245 (20.3%) | 575 (66.3%) |
| Fuel Oil or Kerosene | 0 (0.0%) | 0 (0.0%) |
| Coal or Coke | 0 (0.0%) | 10 (1.1%) |
| All other Fuels | 89 (7.4%) | 118 (13.6%) |
| No Fuel Used | 0 (0.0%) | 0 (0.0%) |
| Total | 1,204 (100.0%) | 867 (100.0%) |
Household Vehicle Usage in Colville
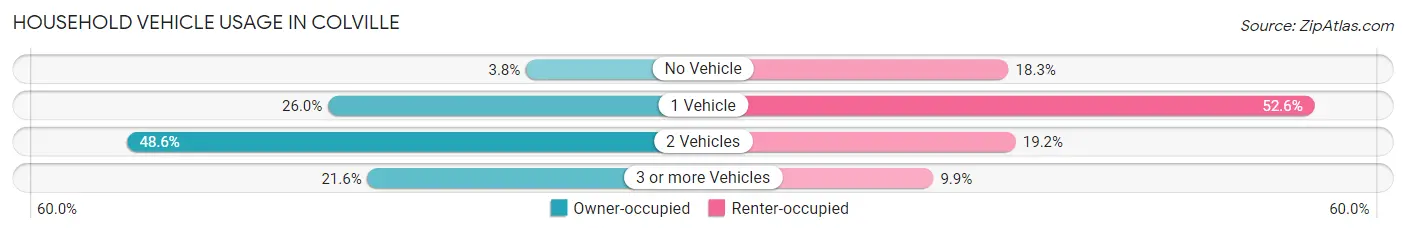
| Vehicles per Household | Owner-occupied | Renter-occupied |
| No Vehicle | 46 (3.8%) | 159 (18.3%) |
| 1 Vehicle | 313 (26.0%) | 456 (52.6%) |
| 2 Vehicles | 585 (48.6%) | 166 (19.2%) |
| 3 or more Vehicles | 260 (21.6%) | 86 (9.9%) |
| Total | 1,204 (100.0%) | 867 (100.0%) |
Real Estate & Mortgages in Colville
Real Estate and Mortgage Overview in Colville
| Characteristic | Without Mortgage | With Mortgage |
| Housing Units | 501 | 703 |
| Median Property Value | $215,100 | $237,400 |
| Median Household Income | $54,375 | $127 |
| Monthly Housing Costs | $444 | $0 |
| Real Estate Taxes | $1,379 | $13 |
Property Value by Mortgage Status in Colville
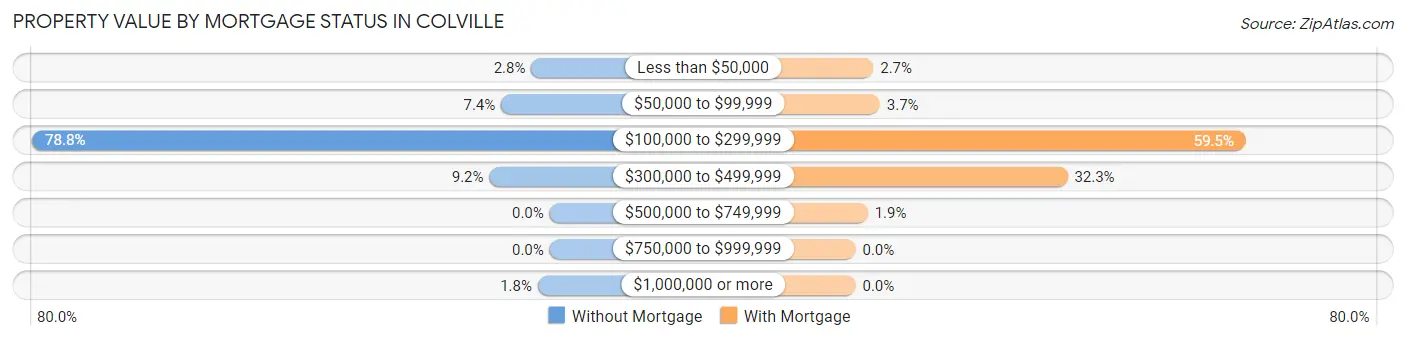
| Property Value | Without Mortgage | With Mortgage |
| Less than $50,000 | 14 (2.8%) | 19 (2.7%) |
| $50,000 to $99,999 | 37 (7.4%) | 26 (3.7%) |
| $100,000 to $299,999 | 395 (78.8%) | 418 (59.5%) |
| $300,000 to $499,999 | 46 (9.2%) | 227 (32.3%) |
| $500,000 to $749,999 | 0 (0.0%) | 13 (1.8%) |
| $750,000 to $999,999 | 0 (0.0%) | 0 (0.0%) |
| $1,000,000 or more | 9 (1.8%) | 0 (0.0%) |
| Total | 501 (100.0%) | 703 (100.0%) |
Household Income by Mortgage Status in Colville
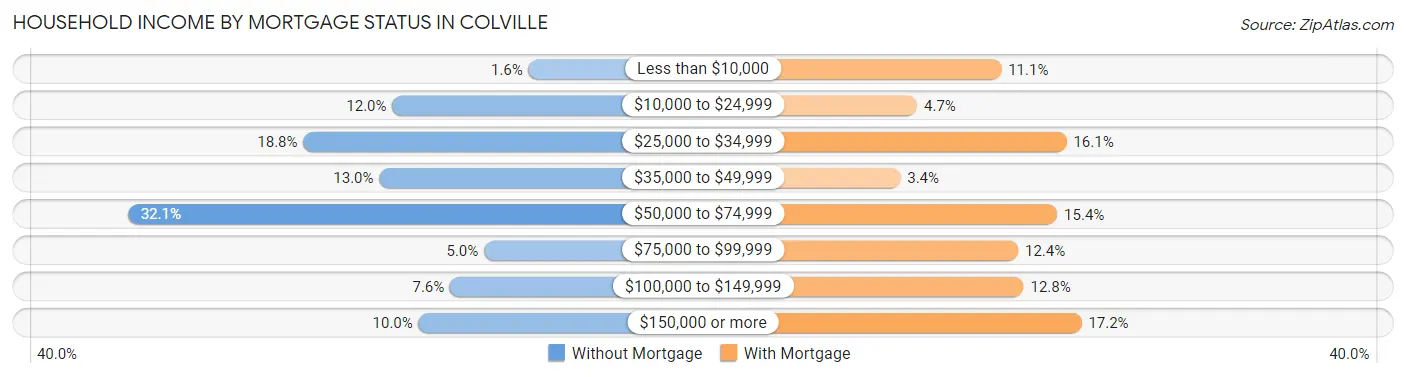
| Household Income | Without Mortgage | With Mortgage |
| Less than $10,000 | 8 (1.6%) | 78 (11.1%) |
| $10,000 to $24,999 | 60 (12.0%) | 33 (4.7%) |
| $25,000 to $34,999 | 94 (18.8%) | 113 (16.1%) |
| $35,000 to $49,999 | 65 (13.0%) | 24 (3.4%) |
| $50,000 to $74,999 | 161 (32.1%) | 108 (15.4%) |
| $75,000 to $99,999 | 25 (5.0%) | 87 (12.4%) |
| $100,000 to $149,999 | 38 (7.6%) | 90 (12.8%) |
| $150,000 or more | 50 (10.0%) | 121 (17.2%) |
| Total | 501 (100.0%) | 703 (100.0%) |
Property Value to Household Income Ratio in Colville
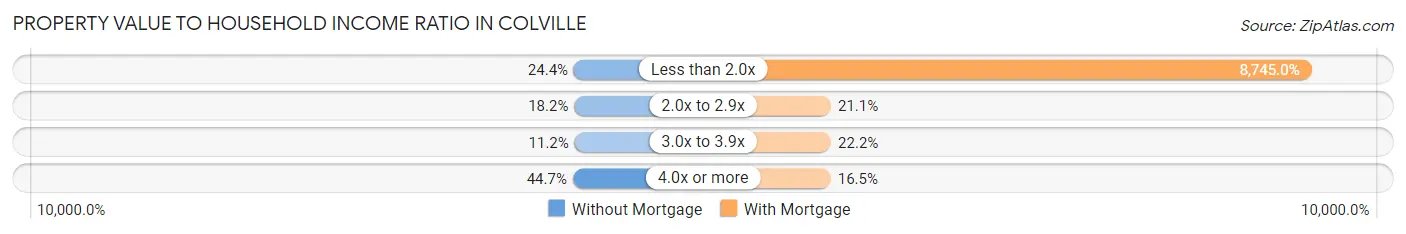
| Value-to-Income Ratio | Without Mortgage | With Mortgage |
| Less than 2.0x | 122 (24.3%) | 61,477 (8,745.0%) |
| 2.0x to 2.9x | 91 (18.2%) | 148 (21.0%) |
| 3.0x to 3.9x | 56 (11.2%) | 156 (22.2%) |
| 4.0x or more | 224 (44.7%) | 116 (16.5%) |
| Total | 501 (100.0%) | 703 (100.0%) |
Real Estate Taxes by Mortgage Status in Colville
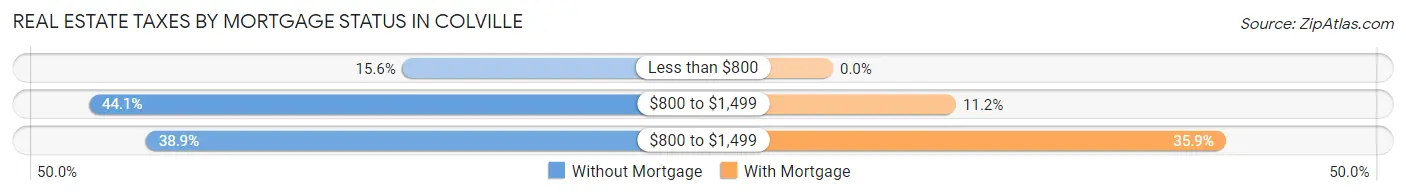
| Property Taxes | Without Mortgage | With Mortgage |
| Less than $800 | 78 (15.6%) | 0 (0.0%) |
| $800 to $1,499 | 221 (44.1%) | 79 (11.2%) |
| $800 to $1,499 | 195 (38.9%) | 252 (35.8%) |
| Total | 501 (100.0%) | 703 (100.0%) |
Health & Disability in Colville
Health Insurance Coverage by Age in Colville
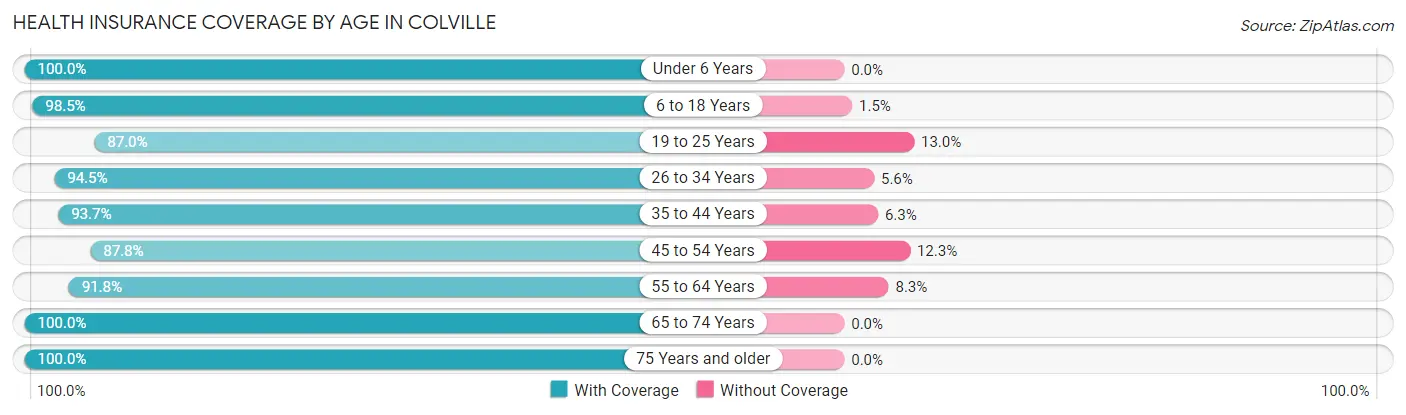
| Age Bracket | With Coverage | Without Coverage |
| Under 6 Years | 473 (100.0%) | 0 (0.0%) |
| 6 to 18 Years | 607 (98.5%) | 9 (1.5%) |
| 19 to 25 Years | 321 (87.0%) | 48 (13.0%) |
| 26 to 34 Years | 630 (94.5%) | 37 (5.6%) |
| 35 to 44 Years | 403 (93.7%) | 27 (6.3%) |
| 45 to 54 Years | 537 (87.7%) | 75 (12.2%) |
| 55 to 64 Years | 467 (91.7%) | 42 (8.3%) |
| 65 to 74 Years | 655 (100.0%) | 0 (0.0%) |
| 75 Years and older | 441 (100.0%) | 0 (0.0%) |
| Total | 4,534 (95.0%) | 238 (5.0%) |
Health Insurance Coverage by Citizenship Status in Colville
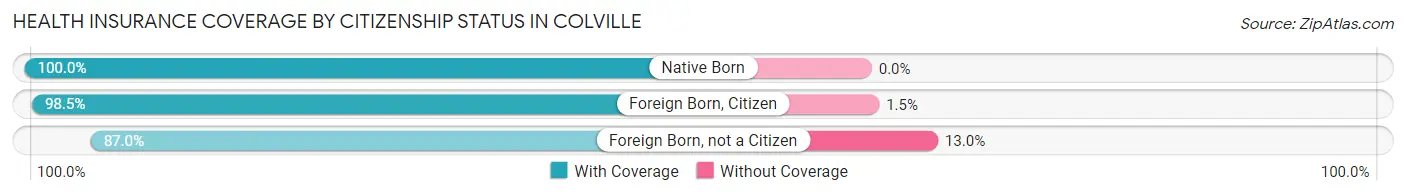
| Citizenship Status | With Coverage | Without Coverage |
| Native Born | 473 (100.0%) | 0 (0.0%) |
| Foreign Born, Citizen | 607 (98.5%) | 9 (1.5%) |
| Foreign Born, not a Citizen | 321 (87.0%) | 48 (13.0%) |
Health Insurance Coverage by Household Income in Colville
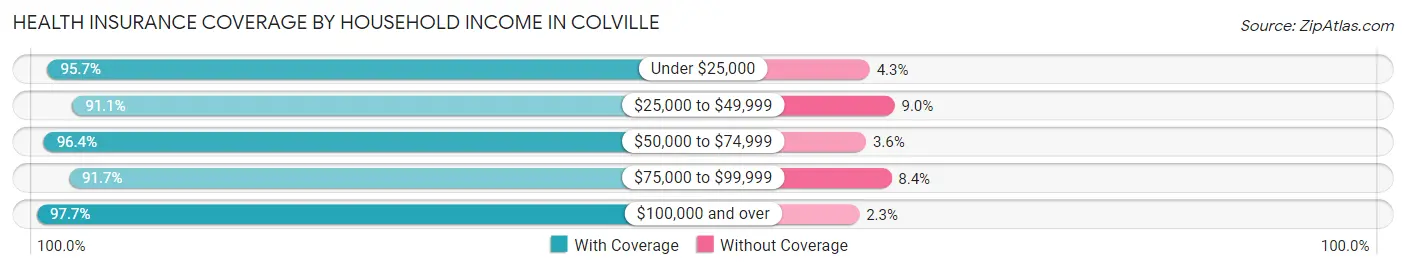
| Household Income | With Coverage | Without Coverage |
| Under $25,000 | 759 (95.7%) | 34 (4.3%) |
| $25,000 to $49,999 | 977 (91.0%) | 96 (8.9%) |
| $50,000 to $74,999 | 940 (96.4%) | 35 (3.6%) |
| $75,000 to $99,999 | 428 (91.6%) | 39 (8.4%) |
| $100,000 and over | 1,426 (97.7%) | 34 (2.3%) |
Public vs Private Health Insurance Coverage by Age in Colville
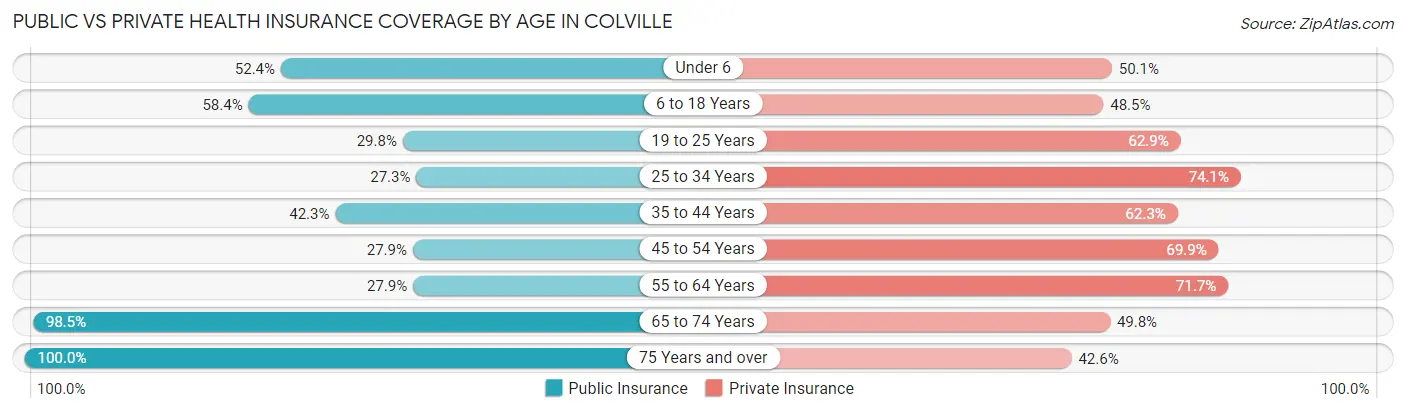
| Age Bracket | Public Insurance | Private Insurance |
| Under 6 | 248 (52.4%) | 237 (50.1%) |
| 6 to 18 Years | 360 (58.4%) | 299 (48.5%) |
| 19 to 25 Years | 110 (29.8%) | 232 (62.9%) |
| 25 to 34 Years | 182 (27.3%) | 494 (74.1%) |
| 35 to 44 Years | 182 (42.3%) | 268 (62.3%) |
| 45 to 54 Years | 171 (27.9%) | 428 (69.9%) |
| 55 to 64 Years | 142 (27.9%) | 365 (71.7%) |
| 65 to 74 Years | 645 (98.5%) | 326 (49.8%) |
| 75 Years and over | 441 (100.0%) | 188 (42.6%) |
| Total | 2,481 (52.0%) | 2,837 (59.5%) |
Disability Status by Sex by Age in Colville
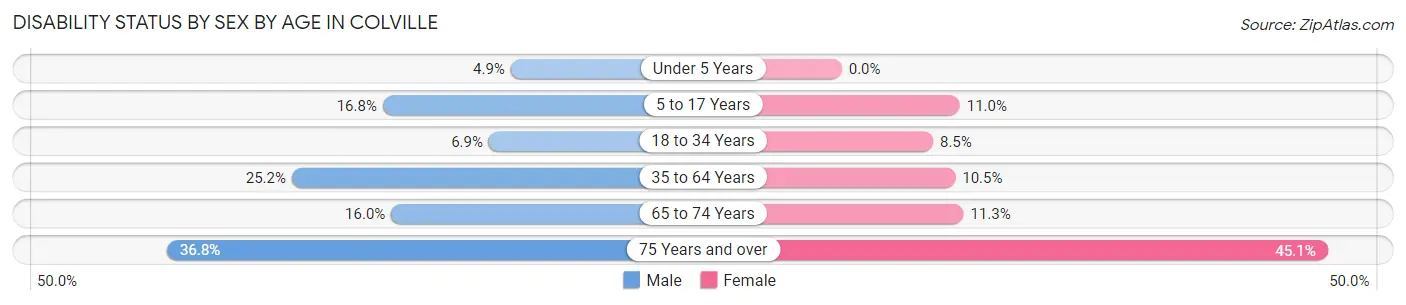
| Age Bracket | Male | Female |
| Under 5 Years | 9 (4.9%) | 0 (0.0%) |
| 5 to 17 Years | 58 (16.8%) | 37 (11.0%) |
| 18 to 34 Years | 38 (6.9%) | 45 (8.5%) |
| 35 to 64 Years | 185 (25.2%) | 86 (10.5%) |
| 65 to 74 Years | 58 (16.0%) | 33 (11.3%) |
| 75 Years and over | 39 (36.8%) | 151 (45.1%) |
Disability Class by Sex by Age in Colville
Disability Class: Hearing Difficulty
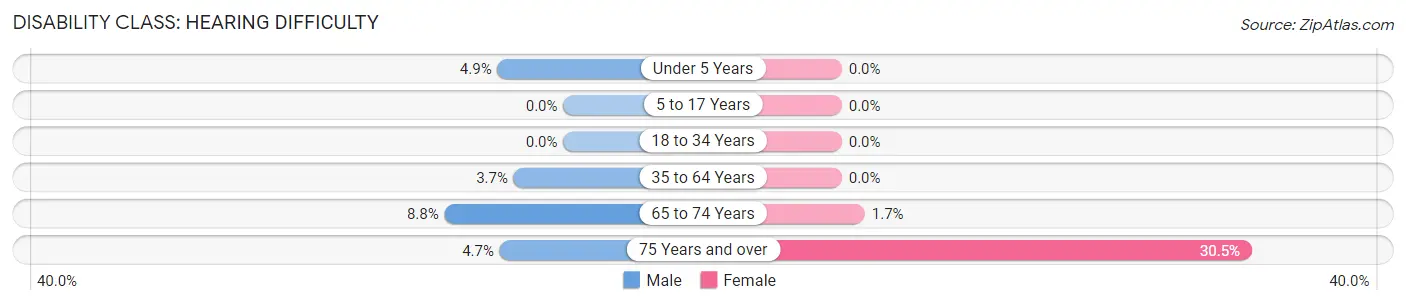
| Age Bracket | Male | Female |
| Under 5 Years | 9 (4.9%) | 0 (0.0%) |
| 5 to 17 Years | 0 (0.0%) | 0 (0.0%) |
| 18 to 34 Years | 0 (0.0%) | 0 (0.0%) |
| 35 to 64 Years | 27 (3.7%) | 0 (0.0%) |
| 65 to 74 Years | 32 (8.8%) | 5 (1.7%) |
| 75 Years and over | 5 (4.7%) | 102 (30.4%) |
Disability Class: Vision Difficulty
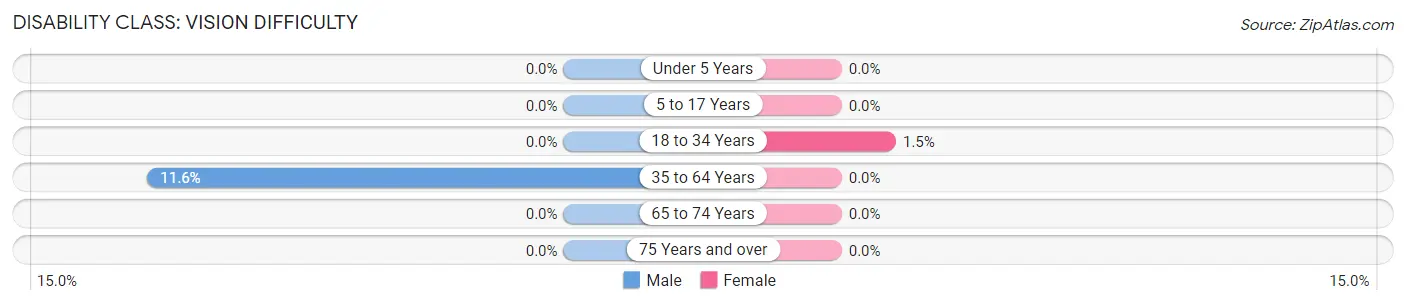
| Age Bracket | Male | Female |
| Under 5 Years | 0 (0.0%) | 0 (0.0%) |
| 5 to 17 Years | 0 (0.0%) | 0 (0.0%) |
| 18 to 34 Years | 0 (0.0%) | 8 (1.5%) |
| 35 to 64 Years | 85 (11.6%) | 0 (0.0%) |
| 65 to 74 Years | 0 (0.0%) | 0 (0.0%) |
| 75 Years and over | 0 (0.0%) | 0 (0.0%) |
Disability Class: Cognitive Difficulty
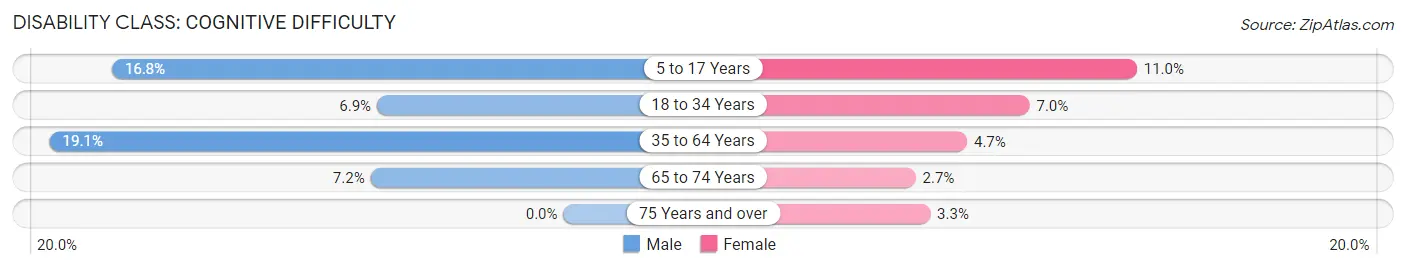
| Age Bracket | Male | Female |
| 5 to 17 Years | 58 (16.8%) | 37 (11.0%) |
| 18 to 34 Years | 38 (6.9%) | 37 (7.0%) |
| 35 to 64 Years | 140 (19.1%) | 38 (4.6%) |
| 65 to 74 Years | 26 (7.2%) | 8 (2.7%) |
| 75 Years and over | 0 (0.0%) | 11 (3.3%) |
Disability Class: Ambulatory Difficulty
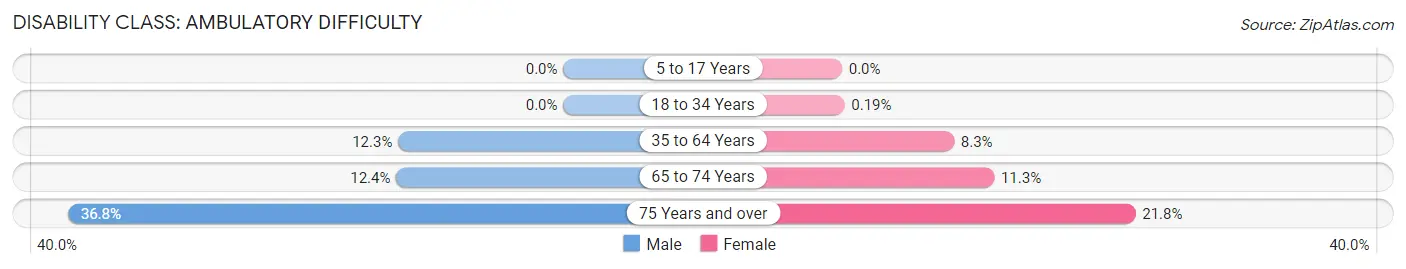
| Age Bracket | Male | Female |
| 5 to 17 Years | 0 (0.0%) | 0 (0.0%) |
| 18 to 34 Years | 0 (0.0%) | 1 (0.2%) |
| 35 to 64 Years | 90 (12.3%) | 68 (8.3%) |
| 65 to 74 Years | 45 (12.4%) | 33 (11.3%) |
| 75 Years and over | 39 (36.8%) | 73 (21.8%) |
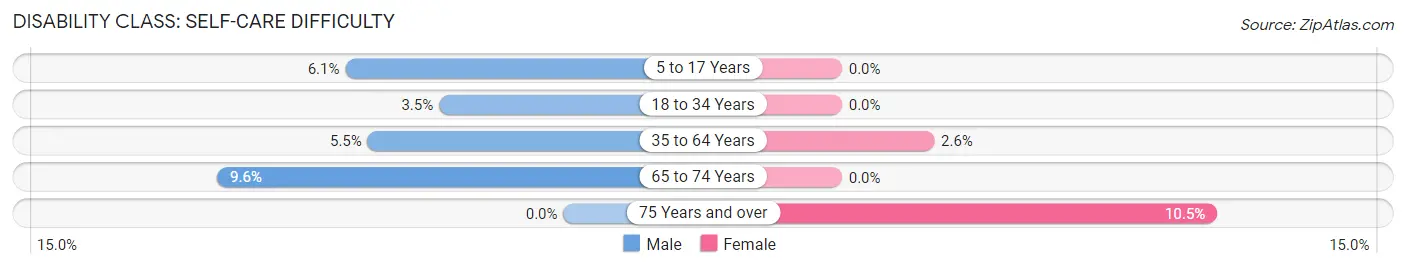
Disability Class: Self-Care Difficulty
| Age Bracket | Male | Female |
| 5 to 17 Years | 21 (6.1%) | 0 (0.0%) |
| 18 to 34 Years | 19 (3.5%) | 0 (0.0%) |
| 35 to 64 Years | 40 (5.4%) | 21 (2.6%) |
| 65 to 74 Years | 35 (9.6%) | 0 (0.0%) |
| 75 Years and over | 0 (0.0%) | 35 (10.4%) |
Technology Access in Colville
Computing Device Access in Colville
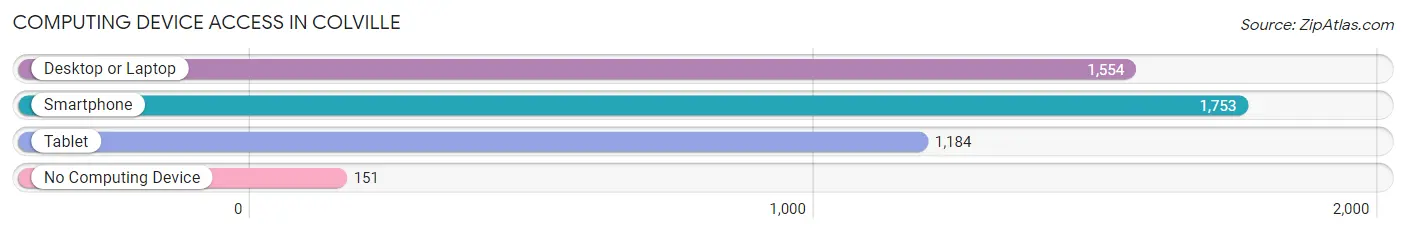
| Device Type | # Households | % Households |
| Desktop or Laptop | 1,554 | 75.0% |
| Smartphone | 1,753 | 84.7% |
| Tablet | 1,184 | 57.2% |
| No Computing Device | 151 | 7.3% |
| Total | 2,071 | 100.0% |
Internet Access in Colville
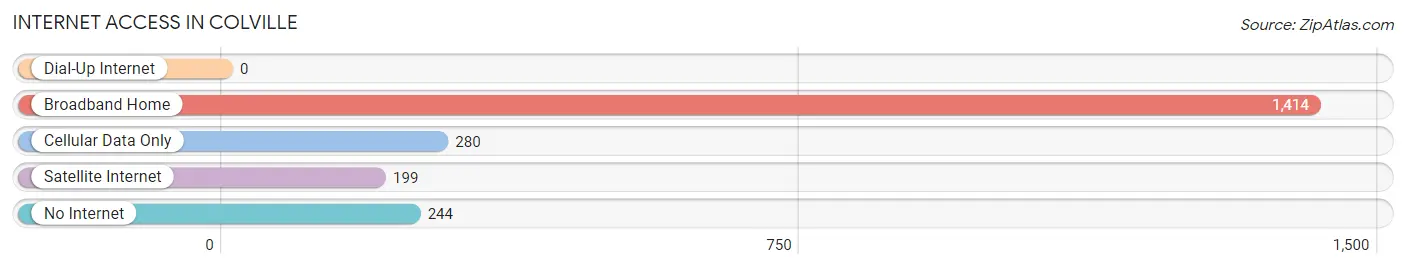
| Internet Type | # Households | % Households |
| Dial-Up Internet | 0 | 0.0% |
| Broadband Home | 1,414 | 68.3% |
| Cellular Data Only | 280 | 13.5% |
| Satellite Internet | 199 | 9.6% |
| No Internet | 244 | 11.8% |
| Total | 2,071 | 100.0% |
Colville Summary
Colville, Washington is a small city located in the northeastern corner of the state, in Stevens County. It is the county seat and the largest city in the county, with a population of 4,673 as of the 2010 census. The city is situated in the foothills of the Selkirk Mountains, and is surrounded by rolling hills, forests, and lakes.
History
The area around Colville was first inhabited by the Spokane and Colville tribes of Native Americans. The first white settlers arrived in the area in the late 1800s, and the town of Colville was officially founded in 1883. The town was named after Andrew Colvig, a local settler who had served in the Civil War.
The town grew quickly, and by the early 1900s, it had become a major trading center for the surrounding area. The town was incorporated in 1909, and the first mayor was elected in 1910.
In the early 1900s, Colville was a major hub for the timber industry, and the town was home to several sawmills and lumber companies. The timber industry declined in the mid-1900s, and the town shifted its focus to agriculture and tourism.
Geography
Colville is located in the northeastern corner of Washington, in Stevens County. It is situated in the foothills of the Selkirk Mountains, and is surrounded by rolling hills, forests, and lakes. The city is located at an elevation of 1,845 feet, and has a total area of 4.2 square miles.
The climate in Colville is generally mild, with warm summers and cold winters. The average annual temperature is 46°F, and the average annual precipitation is 16.5 inches.
Economy
The economy of Colville is largely based on agriculture and tourism. The city is home to several farms and ranches, and the surrounding area is known for its production of wheat, barley, and other grains.
The city is also a popular tourist destination, and is home to several attractions, including the Colville National Forest, the Colville Indian Reservation, and the Colville Historical Museum.
Demographics
As of the 2010 census, Colville had a population of 4,673. The racial makeup of the city was 92.3% White, 0.7% African American, 1.2% Native American, 0.4% Asian, 0.1% Pacific Islander, 2.3% from other races, and 3.1% from two or more races. Hispanic or Latino of any race were 5.2% of the population.
The median household income in Colville was $37,917, and the median family income was $45,938. The per capita income was $19,945. About 14.3% of the population was below the poverty line.
Common Questions
What is Per Capita Income in Colville?
Per Capita income in Colville is $31,138.
What is the Median Family Income in Colville?
Median Family Income in Colville is $60,750.
What is the Median Household income in Colville?
Median Household Income in Colville is $45,972.
What is Income or Wage Gap in Colville?
Income or Wage Gap in Colville is 28.4%.
Women in Colville earn 71.6 cents for every dollar earned by a man.
What is Family Income Deficit in Colville?
Family Income Deficit in Colville is $13,670.
Families that are below poverty line in Colville earn $13,670 less on average than the poverty threshold level.
What is Inequality or Gini Index in Colville?
Inequality or Gini Index in Colville is 0.49.
What is the Total Population of Colville?
Total Population of Colville is 4,927.
What is the Total Male Population of Colville?
Total Male Population of Colville is 2,387.
What is the Total Female Population of Colville?
Total Female Population of Colville is 2,540.
What is the Ratio of Males per 100 Females in Colville?
There are 93.98 Males per 100 Females in Colville.
What is the Ratio of Females per 100 Males in Colville?
There are 106.41 Females per 100 Males in Colville.
What is the Median Population Age in Colville?
Median Population Age in Colville is 42.3 Years.
What is the Average Family Size in Colville
Average Family Size in Colville is 3.0 People.
What is the Average Household Size in Colville
Average Household Size in Colville is 2.3 People.
How Large is the Labor Force in Colville?
There are 2,007 People in the Labor Forcein in Colville.
What is the Percentage of People in the Labor Force in Colville?
50.5% of People are in the Labor Force in Colville.
What is the Unemployment Rate in Colville?
Unemployment Rate in Colville is 3.3%.