Zip Codes with the Highest Percentage of Population Employed in Legal Services & Support in Snohomish, WA
RELATED REPORTS & OPTIONS
Legal Services & Support
Snohomish
Compare Zip Codes
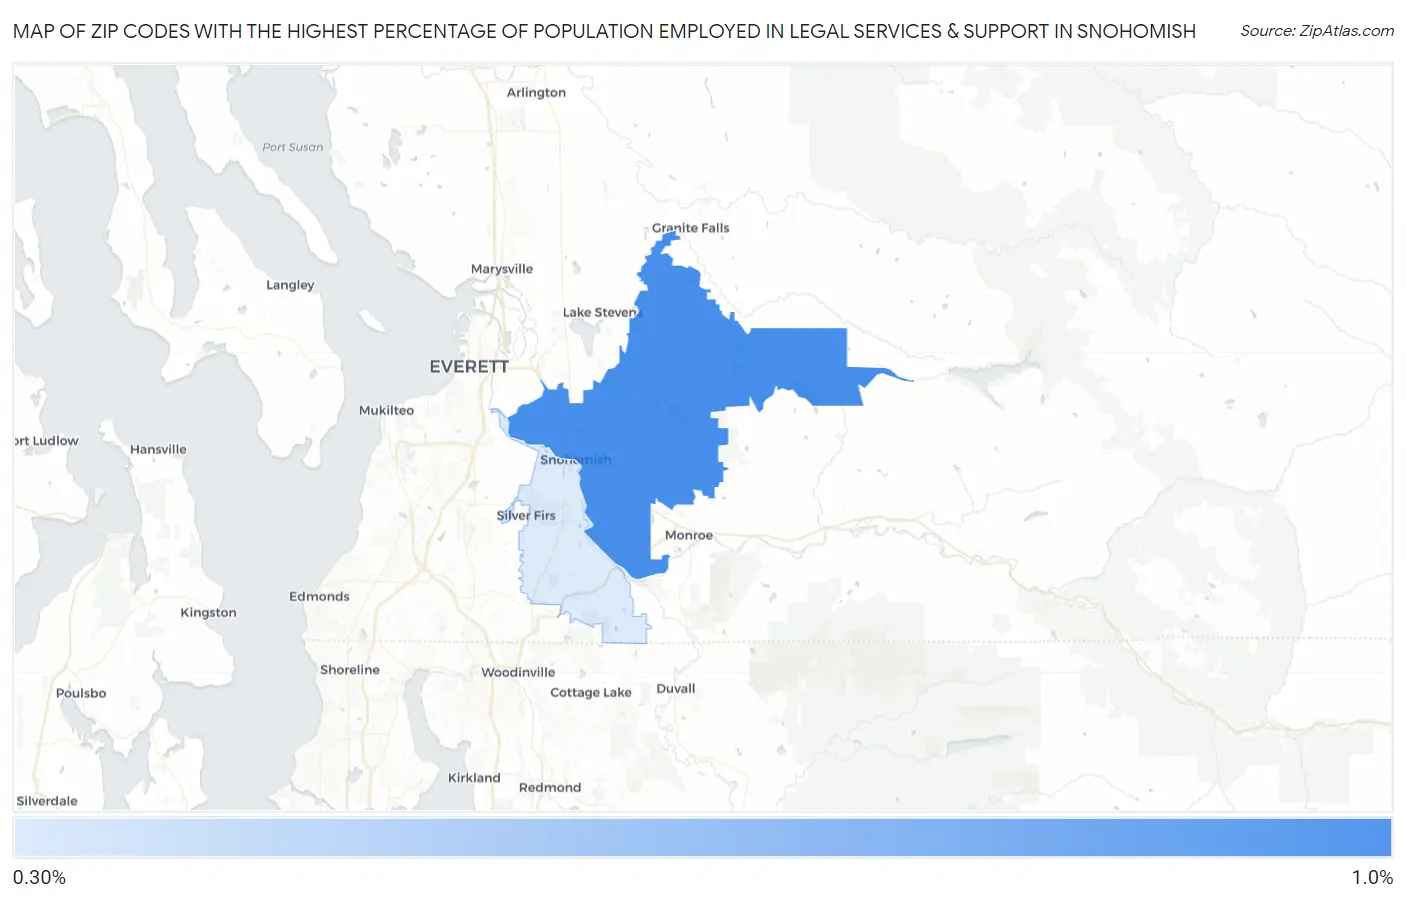
Map of Zip Codes with the Highest Percentage of Population Employed in Legal Services & Support in Snohomish
0.35%
0.83%
Zip Codes with the Highest Percentage of Population Employed in Legal Services & Support in Snohomish, WA
| Zip Code | % Employed | vs State | vs National | |
| 1. | 98290 | 0.83% | 1.1%(-0.243)#209 | 1.2%(-0.352)#9,177 |
| 2. | 98296 | 0.35% | 1.1%(-0.729)#319 | 1.2%(-0.838)#14,512 |
1
Common Questions
What are the Top Zip Codes with the Highest Percentage of Population Employed in Legal Services & Support in Snohomish, WA?
Top Zip Codes with the Highest Percentage of Population Employed in Legal Services & Support in Snohomish, WA are:
What zip code has the Highest Percentage of Population Employed in Legal Services & Support in Snohomish, WA?
98290 has the Highest Percentage of Population Employed in Legal Services & Support in Snohomish, WA with 0.83%.
What is the Percentage of Population Employed in Legal Services & Support in Snohomish, WA?
Percentage of Population Employed in Legal Services & Support in Snohomish is 0.34%.
What is the Percentage of Population Employed in Legal Services & Support in Washington?
Percentage of Population Employed in Legal Services & Support in Washington is 1.1%.
What is the Percentage of Population Employed in Legal Services & Support in the United States?
Percentage of Population Employed in Legal Services & Support in the United States is 1.2%.