Chewelah, WA Map & Demographics
Chewelah Map
Chewelah Overview
$32,235
PER CAPITA INCOME
$83,125
AVG FAMILY INCOME
$52,905
AVG HOUSEHOLD INCOME
42.2%
WAGE / INCOME GAP [ % ]
57.8¢/ $1
WAGE / INCOME GAP [ $ ]
0.43
INEQUALITY / GINI INDEX
2,508
TOTAL POPULATION
1,119
MALE POPULATION
1,389
FEMALE POPULATION
80.56
MALES / 100 FEMALES
124.13
FEMALES / 100 MALES
49.0
MEDIAN AGE
2.9
AVG FAMILY SIZE
2.2
AVG HOUSEHOLD SIZE
1,065
LABOR FORCE [ PEOPLE ]
50.4%
PERCENT IN LABOR FORCE
7.6%
UNEMPLOYMENT RATE
Chewelah Zip Codes
Chewelah Area Codes
Income in Chewelah
Income Overview in Chewelah
Per Capita Income in Chewelah is $32,235, while median incomes of families and households are $83,125 and $52,905 respectively.
| Characteristic | Number | Measure |
| Per Capita Income | 2,508 | $32,235 |
| Median Family Income | 611 | $83,125 |
| Mean Family Income | 611 | $91,772 |
| Median Household Income | 1,085 | $52,905 |
| Mean Household Income | 1,085 | $71,732 |
| Income Deficit | 611 | $0 |
| Wage / Income Gap (%) | 2,508 | 42.21% |
| Wage / Income Gap ($) | 2,508 | 57.79¢ per $1 |
| Gini / Inequality Index | 2,508 | 0.43 |
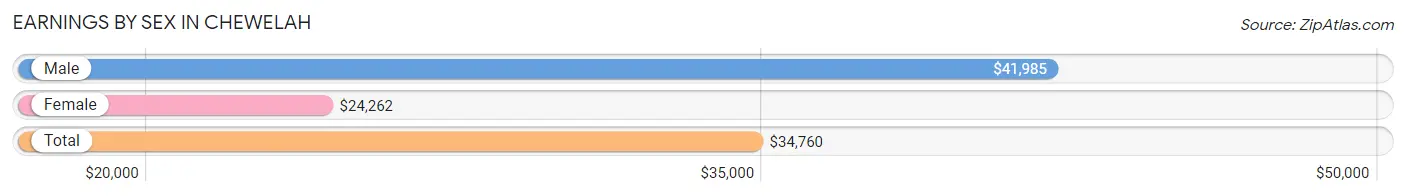
Earnings by Sex in Chewelah
Average Earnings in Chewelah are $34,760, $41,985 for men and $24,262 for women, a difference of 42.2%.
| Sex | Number | Average Earnings |
| Male | 605 (54.8%) | $41,985 |
| Female | 498 (45.2%) | $24,262 |
| Total | 1,103 (100.0%) | $34,760 |
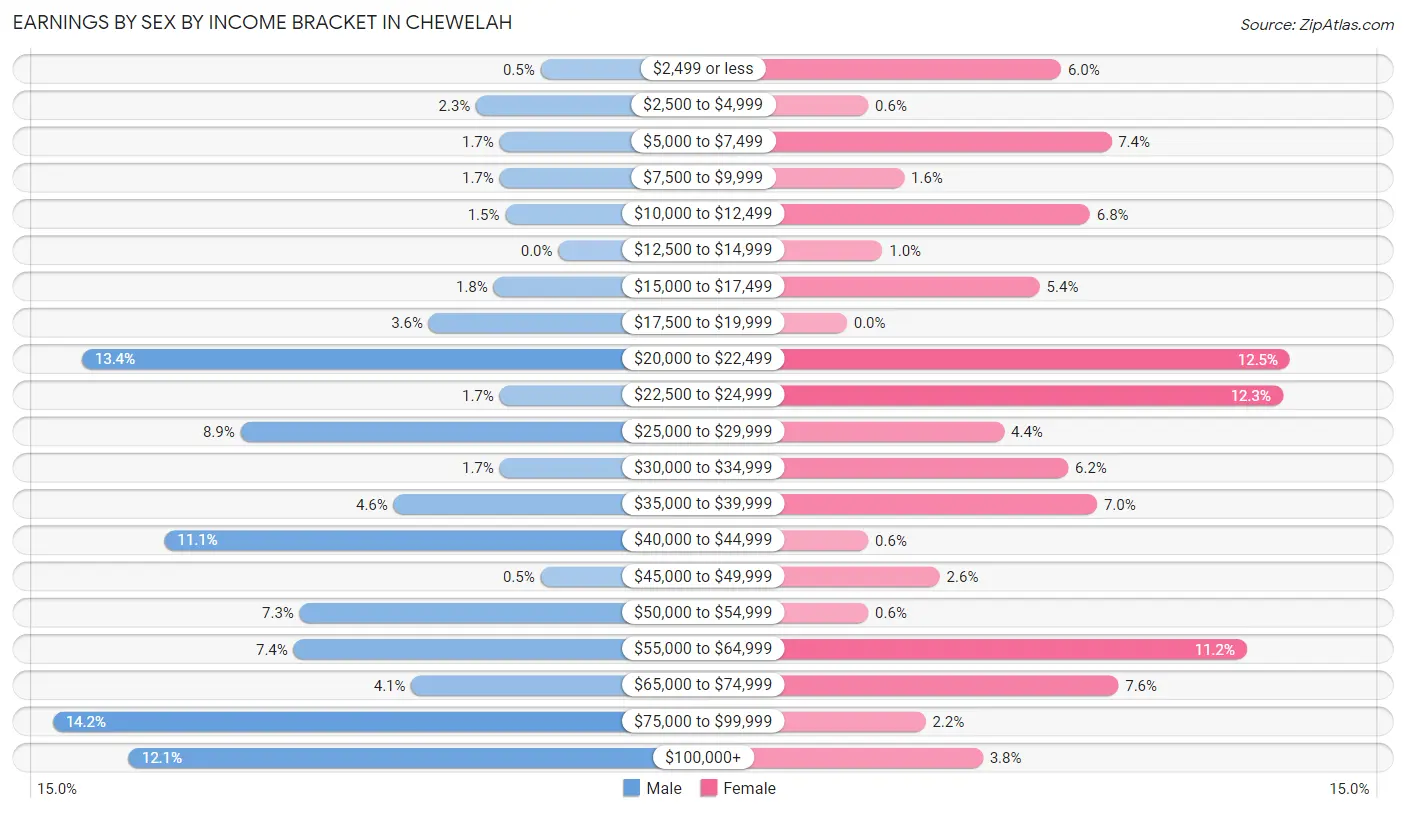
Earnings by Sex by Income Bracket in Chewelah
The most common earnings brackets in Chewelah are $75,000 to $99,999 for men (86 | 14.2%) and $20,000 to $22,499 for women (62 | 12.4%).
| Income | Male | Female |
| $2,499 or less | 3 (0.5%) | 30 (6.0%) |
| $2,500 to $4,999 | 14 (2.3%) | 3 (0.6%) |
| $5,000 to $7,499 | 10 (1.7%) | 37 (7.4%) |
| $7,500 to $9,999 | 10 (1.7%) | 8 (1.6%) |
| $10,000 to $12,499 | 9 (1.5%) | 34 (6.8%) |
| $12,500 to $14,999 | 0 (0.0%) | 5 (1.0%) |
| $15,000 to $17,499 | 11 (1.8%) | 27 (5.4%) |
| $17,500 to $19,999 | 22 (3.6%) | 0 (0.0%) |
| $20,000 to $22,499 | 81 (13.4%) | 62 (12.4%) |
| $22,500 to $24,999 | 10 (1.7%) | 61 (12.2%) |
| $25,000 to $29,999 | 54 (8.9%) | 22 (4.4%) |
| $30,000 to $34,999 | 10 (1.7%) | 31 (6.2%) |
| $35,000 to $39,999 | 28 (4.6%) | 35 (7.0%) |
| $40,000 to $44,999 | 67 (11.1%) | 3 (0.6%) |
| $45,000 to $49,999 | 3 (0.5%) | 13 (2.6%) |
| $50,000 to $54,999 | 44 (7.3%) | 3 (0.6%) |
| $55,000 to $64,999 | 45 (7.4%) | 56 (11.2%) |
| $65,000 to $74,999 | 25 (4.1%) | 38 (7.6%) |
| $75,000 to $99,999 | 86 (14.2%) | 11 (2.2%) |
| $100,000+ | 73 (12.1%) | 19 (3.8%) |
| Total | 605 (100.0%) | 498 (100.0%) |
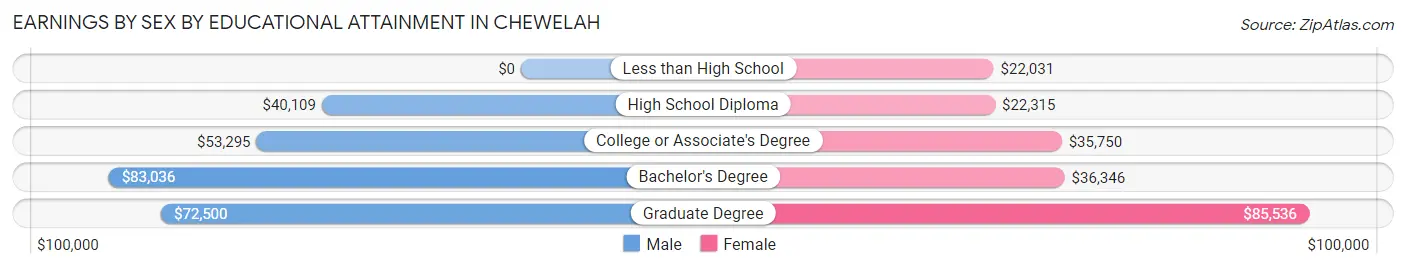
Earnings by Sex by Educational Attainment in Chewelah
Average earnings in Chewelah are $52,917 for men and $29,659 for women, a difference of 44.0%. Men with an educational attainment of bachelor's degree enjoy the highest average annual earnings of $83,036, while those with high school diploma education earn the least with $40,109. Women with an educational attainment of graduate degree earn the most with the average annual earnings of $85,536, while those with less than high school education have the smallest earnings of $22,031.
| Educational Attainment | Male Income | Female Income |
| Less than High School | - | - |
| High School Diploma | $40,109 | $22,315 |
| College or Associate's Degree | $53,295 | $35,750 |
| Bachelor's Degree | $83,036 | $36,346 |
| Graduate Degree | $72,500 | $85,536 |
| Total | $52,917 | $29,659 |
Family Income in Chewelah
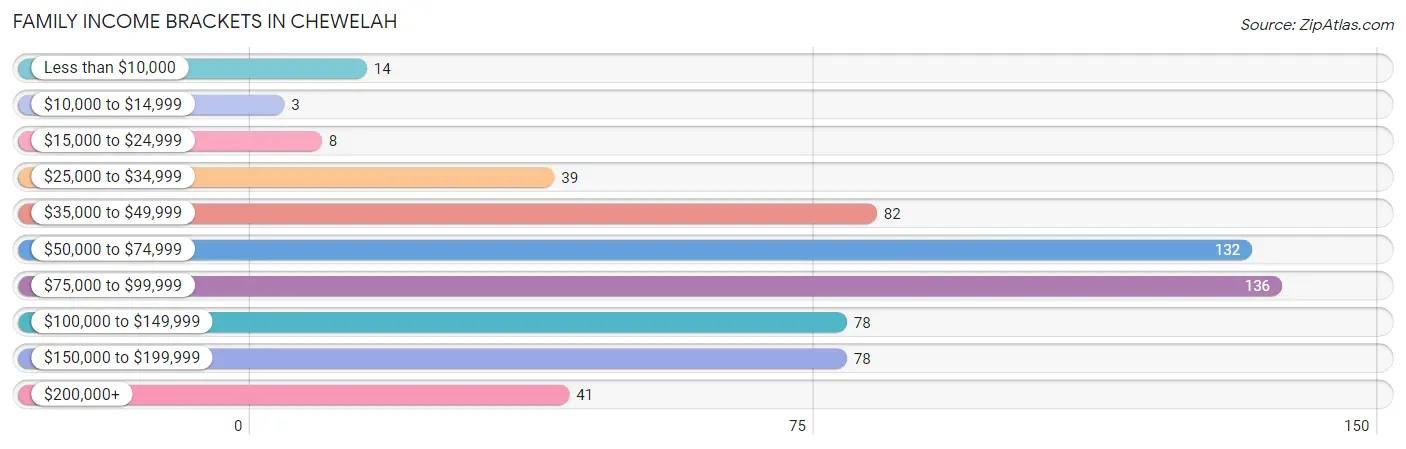
Family Income Brackets in Chewelah
According to the Chewelah family income data, there are 136 families falling into the $75,000 to $99,999 income range, which is the most common income bracket and makes up 22.3% of all families. Conversely, the $10,000 to $14,999 income bracket is the least frequent group with only 3 families (0.5%) belonging to this category.
| Income Bracket | # Families | % Families |
| Less than $10,000 | 14 | 2.3% |
| $10,000 to $14,999 | 3 | 0.5% |
| $15,000 to $24,999 | 8 | 1.3% |
| $25,000 to $34,999 | 39 | 6.4% |
| $35,000 to $49,999 | 82 | 13.4% |
| $50,000 to $74,999 | 132 | 21.6% |
| $75,000 to $99,999 | 136 | 22.3% |
| $100,000 to $149,999 | 78 | 12.8% |
| $150,000 to $199,999 | 78 | 12.8% |
| $200,000+ | 41 | 6.7% |
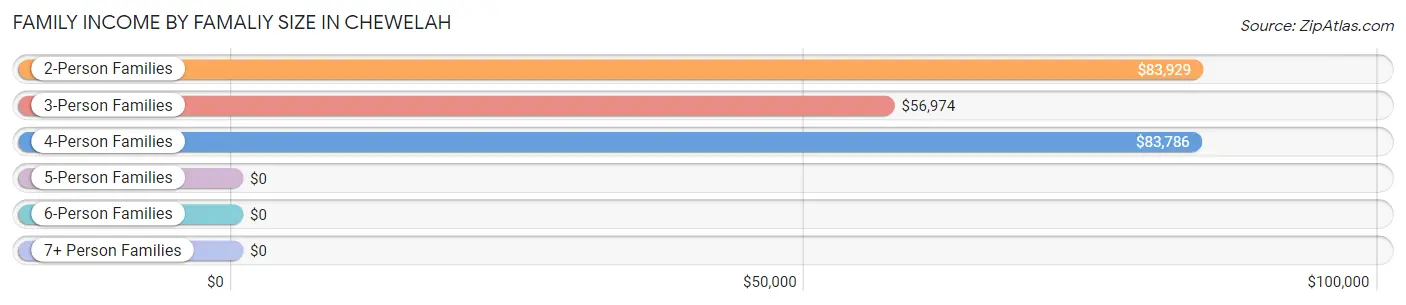
Family Income by Famaliy Size in Chewelah
2-person families (364 | 59.6%) account for the highest median family income in Chewelah with $83,929 per family, while 2-person families (364 | 59.6%) have the highest median income of $41,964 per family member.
| Income Bracket | # Families | Median Income |
| 2-Person Families | 364 (59.6%) | $83,929 |
| 3-Person Families | 100 (16.4%) | $56,974 |
| 4-Person Families | 94 (15.4%) | $83,786 |
| 5-Person Families | 35 (5.7%) | $0 |
| 6-Person Families | 7 (1.1%) | $0 |
| 7+ Person Families | 11 (1.8%) | $0 |
| Total | 611 (100.0%) | $83,125 |
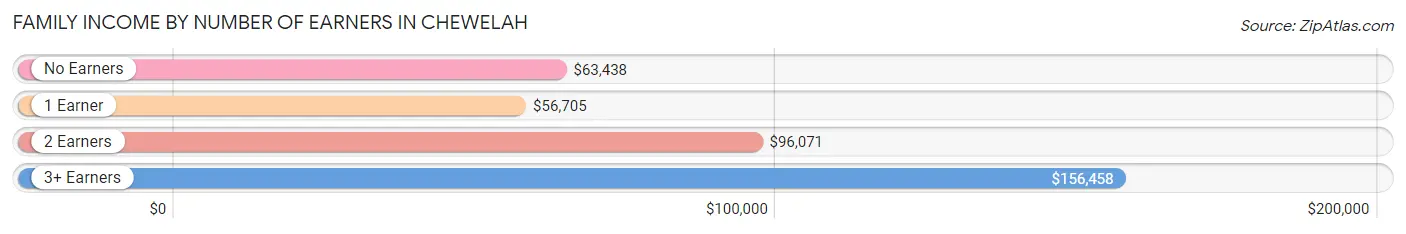
Family Income by Number of Earners in Chewelah
The median family income in Chewelah is $83,125, with families comprising 3+ earners (63) having the highest median family income of $156,458, while families with 1 earner (290) have the lowest median family income of $56,705, accounting for 10.3% and 47.5% of families, respectively.
| Number of Earners | # Families | Median Income |
| No Earners | 114 (18.7%) | $63,438 |
| 1 Earner | 290 (47.5%) | $56,705 |
| 2 Earners | 144 (23.6%) | $96,071 |
| 3+ Earners | 63 (10.3%) | $156,458 |
| Total | 611 (100.0%) | $83,125 |
Household Income in Chewelah
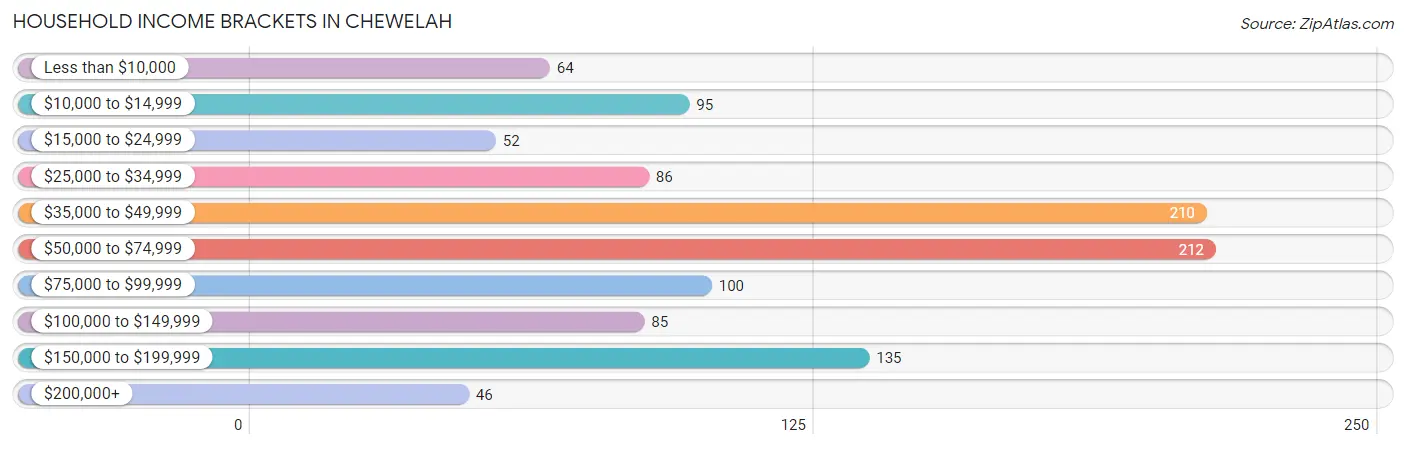
Household Income Brackets in Chewelah
With 212 households falling in the category, the $50,000 to $74,999 income range is the most frequent in Chewelah, accounting for 19.5% of all households. In contrast, only 46 households (4.2%) fall into the $200,000+ income bracket, making it the least populous group.
| Income Bracket | # Households | % Households |
| Less than $10,000 | 64 | 5.9% |
| $10,000 to $14,999 | 95 | 8.8% |
| $15,000 to $24,999 | 52 | 4.8% |
| $25,000 to $34,999 | 86 | 7.9% |
| $35,000 to $49,999 | 210 | 19.4% |
| $50,000 to $74,999 | 212 | 19.5% |
| $75,000 to $99,999 | 100 | 9.2% |
| $100,000 to $149,999 | 85 | 7.8% |
| $150,000 to $199,999 | 135 | 12.4% |
| $200,000+ | 46 | 4.2% |
Household Income by Householder Age in Chewelah
The median household income in Chewelah is $52,905, with the highest median household income of $57,153 found in the 25 to 44 years age bracket for the primary householder. A total of 215 households (19.8%) fall into this category. Meanwhile, the 15 to 24 years age bracket for the primary householder has the lowest median household income of $39,688, with 35 households (3.2%) in this group.
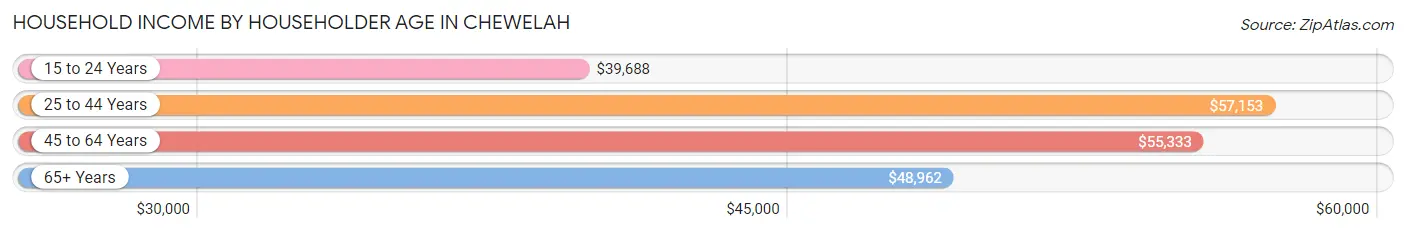
| Income Bracket | # Households | Median Income |
| 15 to 24 Years | 35 (3.2%) | $39,688 |
| 25 to 44 Years | 215 (19.8%) | $57,153 |
| 45 to 64 Years | 428 (39.5%) | $55,333 |
| 65+ Years | 407 (37.5%) | $48,962 |
| Total | 1,085 (100.0%) | $52,905 |
Poverty in Chewelah
Income Below Poverty by Sex and Age in Chewelah
With 10.4% poverty level for males and 22.9% for females among the residents of Chewelah, 15 year old males and 16 and 17 year old females are the most vulnerable to poverty, with 2 males (100.0%) and 31 females (79.5%) in their respective age groups living below the poverty level.
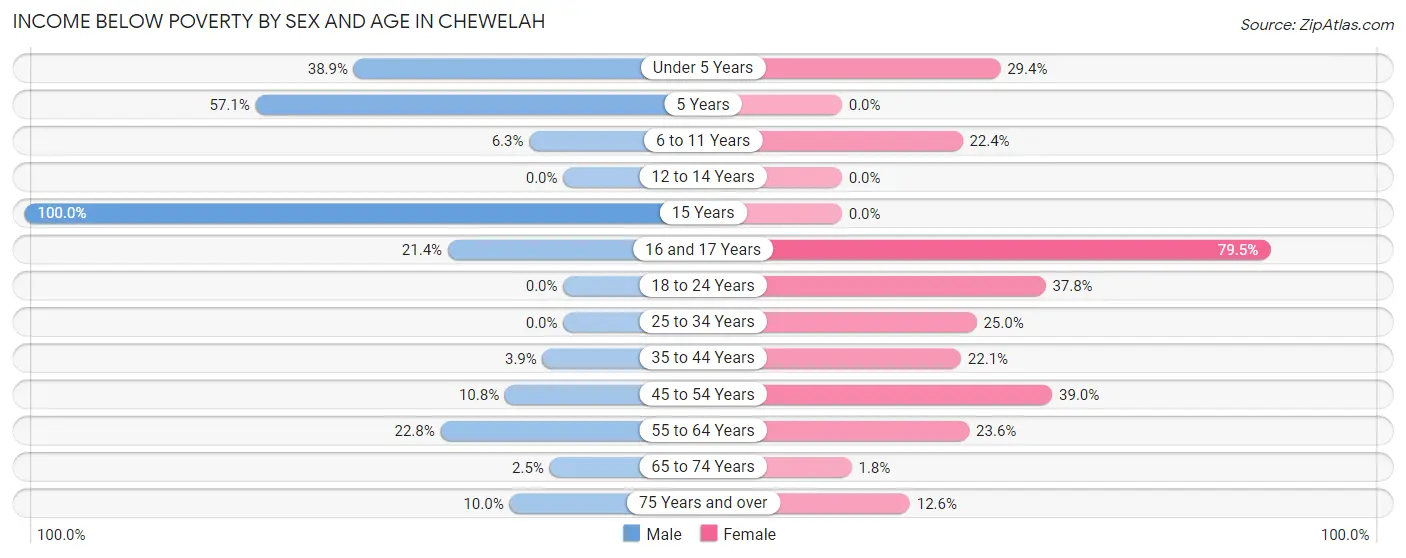
| Age Bracket | Male | Female |
| Under 5 Years | 21 (38.9%) | 20 (29.4%) |
| 5 Years | 8 (57.1%) | 0 (0.0%) |
| 6 to 11 Years | 6 (6.3%) | 15 (22.4%) |
| 12 to 14 Years | 0 (0.0%) | 0 (0.0%) |
| 15 Years | 2 (100.0%) | 0 (0.0%) |
| 16 and 17 Years | 6 (21.4%) | 31 (79.5%) |
| 18 to 24 Years | 0 (0.0%) | 31 (37.8%) |
| 25 to 34 Years | 0 (0.0%) | 26 (25.0%) |
| 35 to 44 Years | 6 (3.8%) | 21 (22.1%) |
| 45 to 54 Years | 13 (10.8%) | 73 (39.0%) |
| 55 to 64 Years | 44 (22.8%) | 61 (23.6%) |
| 65 to 74 Years | 5 (2.5%) | 3 (1.8%) |
| 75 Years and over | 5 (10.0%) | 27 (12.6%) |
| Total | 116 (10.4%) | 308 (22.9%) |
Income Above Poverty by Sex and Age in Chewelah
According to the poverty statistics in Chewelah, males aged 12 to 14 years and females aged 5 years are the age groups that are most secure financially, with 100.0% of males and 100.0% of females in these age groups living above the poverty line.
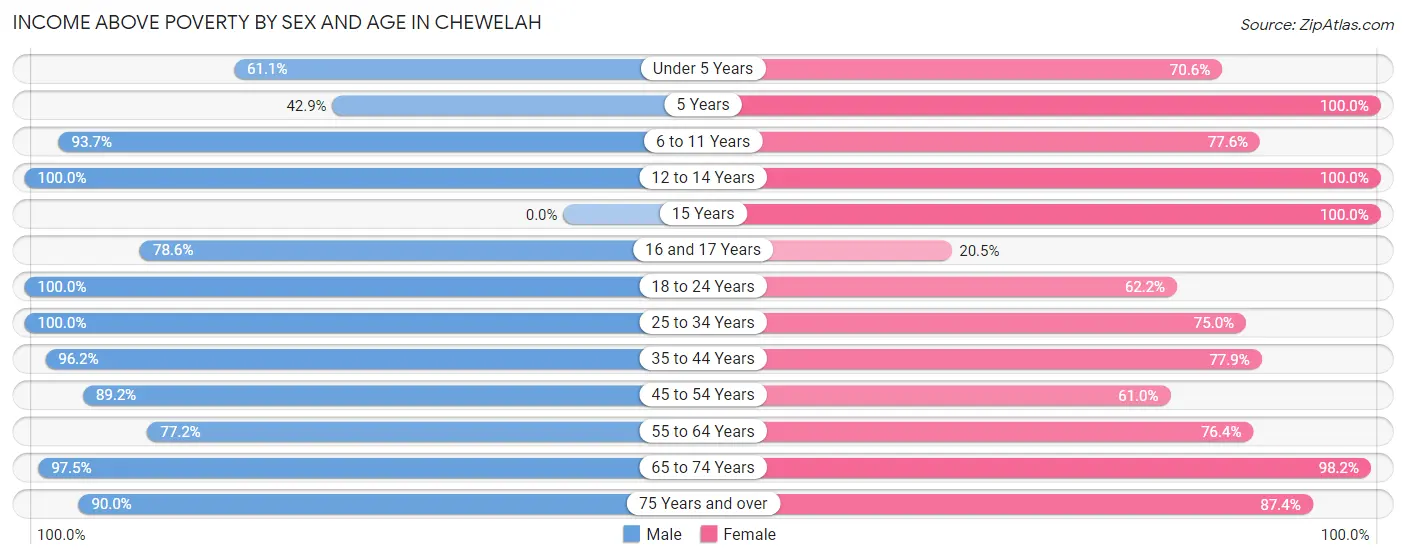
| Age Bracket | Male | Female |
| Under 5 Years | 33 (61.1%) | 48 (70.6%) |
| 5 Years | 6 (42.9%) | 31 (100.0%) |
| 6 to 11 Years | 89 (93.7%) | 52 (77.6%) |
| 12 to 14 Years | 20 (100.0%) | 21 (100.0%) |
| 15 Years | 0 (0.0%) | 13 (100.0%) |
| 16 and 17 Years | 22 (78.6%) | 8 (20.5%) |
| 18 to 24 Years | 79 (100.0%) | 51 (62.2%) |
| 25 to 34 Years | 111 (100.0%) | 78 (75.0%) |
| 35 to 44 Years | 150 (96.2%) | 74 (77.9%) |
| 45 to 54 Years | 107 (89.2%) | 114 (61.0%) |
| 55 to 64 Years | 149 (77.2%) | 197 (76.4%) |
| 65 to 74 Years | 192 (97.5%) | 163 (98.2%) |
| 75 Years and over | 45 (90.0%) | 187 (87.4%) |
| Total | 1,003 (89.6%) | 1,037 (77.1%) |
Income Below Poverty Among Married-Couple Families in Chewelah
The poverty statistics for married-couple families in Chewelah show that 1.8% or 8 of the total 445 families live below the poverty line. Families with no children have the highest poverty rate of 2.2%, comprising of 8 families. On the other hand, families with 1 or 2 children have the lowest poverty rate of 0.0%, which includes 0 families.
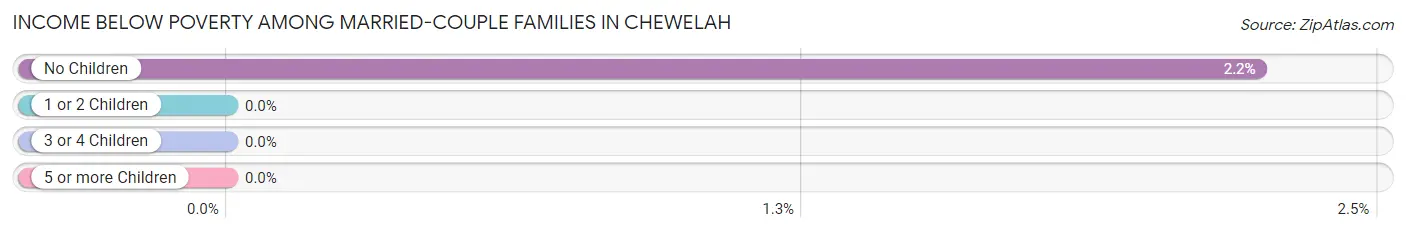
| Children | Above Poverty | Below Poverty |
| No Children | 349 (97.8%) | 8 (2.2%) |
| 1 or 2 Children | 70 (100.0%) | 0 (0.0%) |
| 3 or 4 Children | 14 (100.0%) | 0 (0.0%) |
| 5 or more Children | 4 (100.0%) | 0 (0.0%) |
| Total | 437 (98.2%) | 8 (1.8%) |
Income Below Poverty Among Single-Parent Households in Chewelah
According to the poverty data in Chewelah, 7.1% or 6 single-father households and 38.3% or 31 single-mother households are living below the poverty line. Among single-father households, those with 3 or 4 children have the highest poverty rate, with 6 households (14.6%) experiencing poverty. Likewise, among single-mother households, those with 3 or 4 children have the highest poverty rate, with 22 households (100.0%) falling below the poverty line.
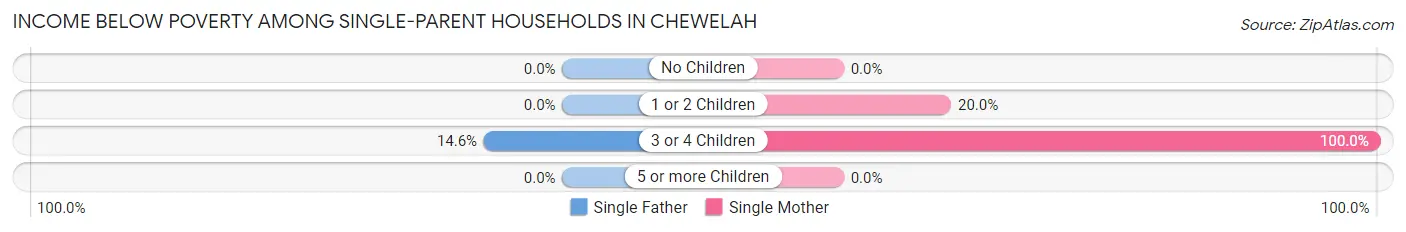
| Children | Single Father | Single Mother |
| No Children | 0 (0.0%) | 0 (0.0%) |
| 1 or 2 Children | 0 (0.0%) | 9 (20.0%) |
| 3 or 4 Children | 6 (14.6%) | 22 (100.0%) |
| 5 or more Children | 0 (0.0%) | 0 (0.0%) |
| Total | 6 (7.1%) | 31 (38.3%) |
Income Below Poverty Among Married-Couple vs Single-Parent Households in Chewelah
The poverty data for Chewelah shows that 8 of the married-couple family households (1.8%) and 37 of the single-parent households (22.3%) are living below the poverty level. Within the married-couple family households, those with no children have the highest poverty rate, with 8 households (2.2%) falling below the poverty line. Among the single-parent households, those with 3 or 4 children have the highest poverty rate, with 28 household (44.4%) living below poverty.
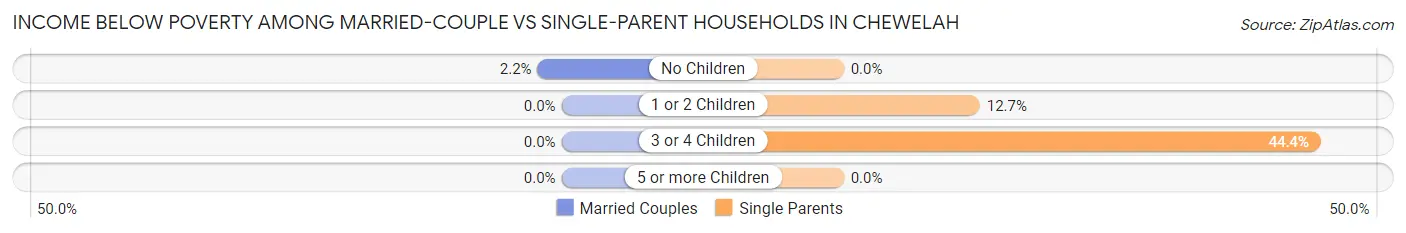
| Children | Married-Couple Families | Single-Parent Households |
| No Children | 8 (2.2%) | 0 (0.0%) |
| 1 or 2 Children | 0 (0.0%) | 9 (12.7%) |
| 3 or 4 Children | 0 (0.0%) | 28 (44.4%) |
| 5 or more Children | 0 (0.0%) | 0 (0.0%) |
| Total | 8 (1.8%) | 37 (22.3%) |
Race in Chewelah
The most populous races in Chewelah are White / Caucasian (2,126 | 84.8%), Some other Race (169 | 6.7%), and Two or more Races (141 | 5.6%).
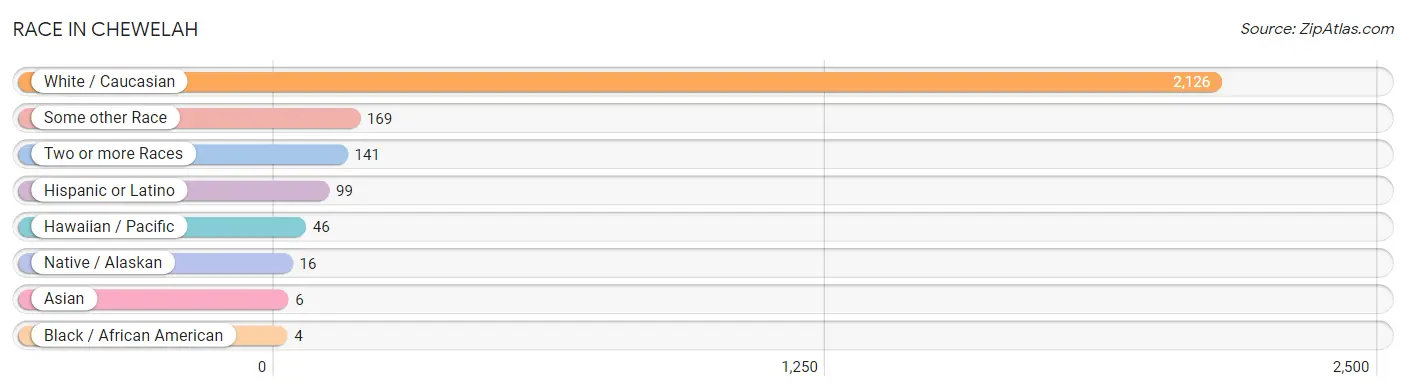
| Race | # Population | % Population |
| Asian | 6 | 0.2% |
| Black / African American | 4 | 0.2% |
| Hawaiian / Pacific | 46 | 1.8% |
| Hispanic or Latino | 99 | 4.0% |
| Native / Alaskan | 16 | 0.6% |
| White / Caucasian | 2,126 | 84.8% |
| Two or more Races | 141 | 5.6% |
| Some other Race | 169 | 6.7% |
| Total | 2,508 | 100.0% |
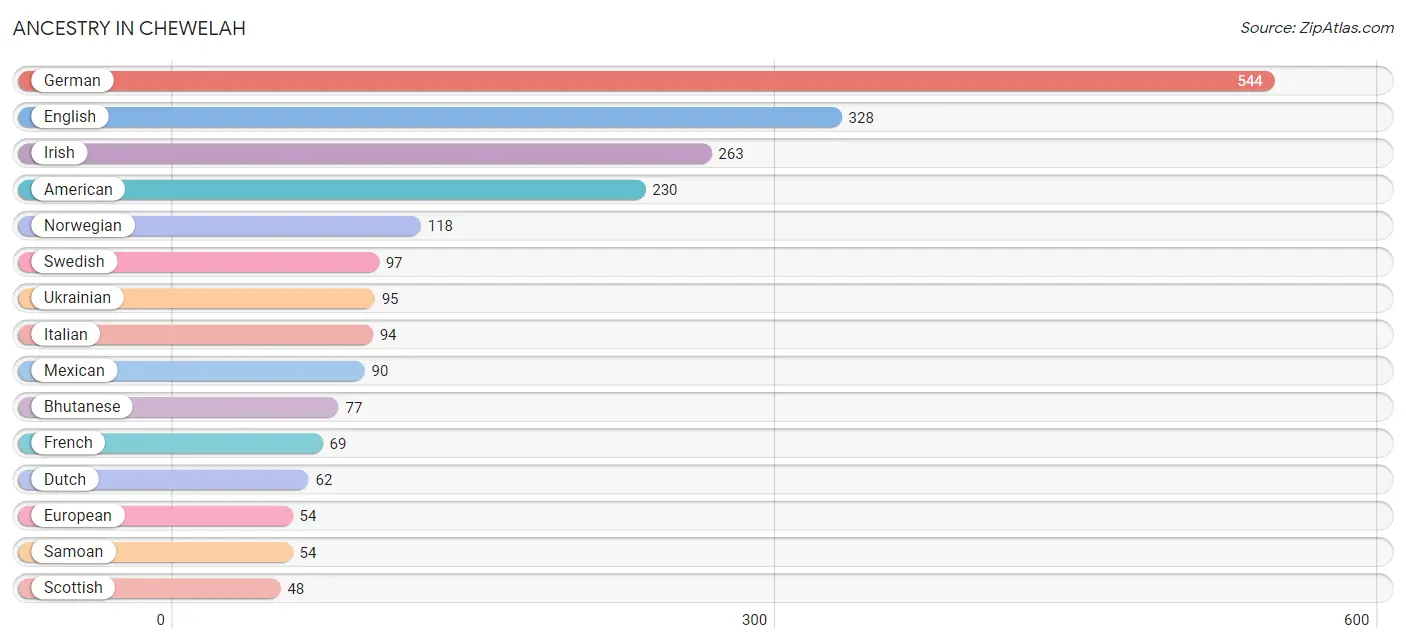
Ancestry in Chewelah
The most populous ancestries reported in Chewelah are German (544 | 21.7%), English (328 | 13.1%), Irish (263 | 10.5%), American (230 | 9.2%), and Norwegian (118 | 4.7%), together accounting for 59.1% of all Chewelah residents.
| Ancestry | # Population | % Population |
| African | 4 | 0.2% |
| American | 230 | 9.2% |
| Apache | 9 | 0.4% |
| Arab | 10 | 0.4% |
| Bhutanese | 77 | 3.1% |
| British | 30 | 1.2% |
| Cherokee | 7 | 0.3% |
| Chippewa | 5 | 0.2% |
| Choctaw | 5 | 0.2% |
| Colville | 4 | 0.2% |
| Czech | 3 | 0.1% |
| Czechoslovakian | 4 | 0.2% |
| Danish | 12 | 0.5% |
| Dutch | 62 | 2.5% |
| English | 328 | 13.1% |
| European | 54 | 2.1% |
| Finnish | 12 | 0.5% |
| French | 69 | 2.8% |
| French Canadian | 14 | 0.6% |
| German | 544 | 21.7% |
| Greek | 6 | 0.2% |
| Guamanian / Chamorro | 35 | 1.4% |
| Hungarian | 29 | 1.2% |
| Irish | 263 | 10.5% |
| Italian | 94 | 3.7% |
| Lebanese | 10 | 0.4% |
| Mexican | 90 | 3.6% |
| Native Hawaiian | 3 | 0.1% |
| Norwegian | 118 | 4.7% |
| Pennsylvania German | 10 | 0.4% |
| Portuguese | 7 | 0.3% |
| Russian | 11 | 0.4% |
| Samoan | 54 | 2.1% |
| Scandinavian | 14 | 0.6% |
| Scotch-Irish | 31 | 1.2% |
| Scottish | 48 | 1.9% |
| Spanish | 9 | 0.4% |
| Subsaharan African | 4 | 0.2% |
| Swedish | 97 | 3.9% |
| Swiss | 16 | 0.6% |
| Tlingit-Haida | 7 | 0.3% |
| Tongan | 45 | 1.8% |
| Ukrainian | 95 | 3.8% |
| Welsh | 44 | 1.8% | View All 44 Rows |
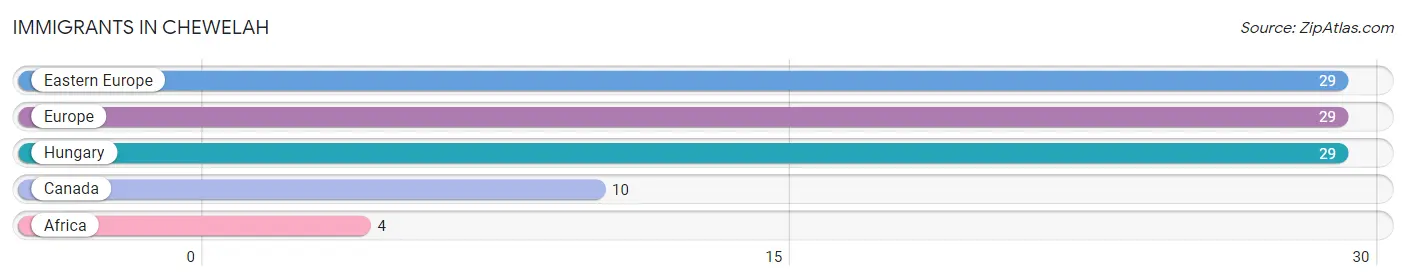
Immigrants in Chewelah
The most numerous immigrant groups reported in Chewelah came from Eastern Europe (29 | 1.2%), Europe (29 | 1.2%), Hungary (29 | 1.2%), Canada (10 | 0.4%), and Africa (4 | 0.2%), together accounting for 4.0% of all Chewelah residents.
| Immigration Origin | # Population | % Population |
| Africa | 4 | 0.2% |
| Canada | 10 | 0.4% |
| Eastern Europe | 29 | 1.2% |
| Europe | 29 | 1.2% |
| Hungary | 29 | 1.2% | View All 5 Rows |
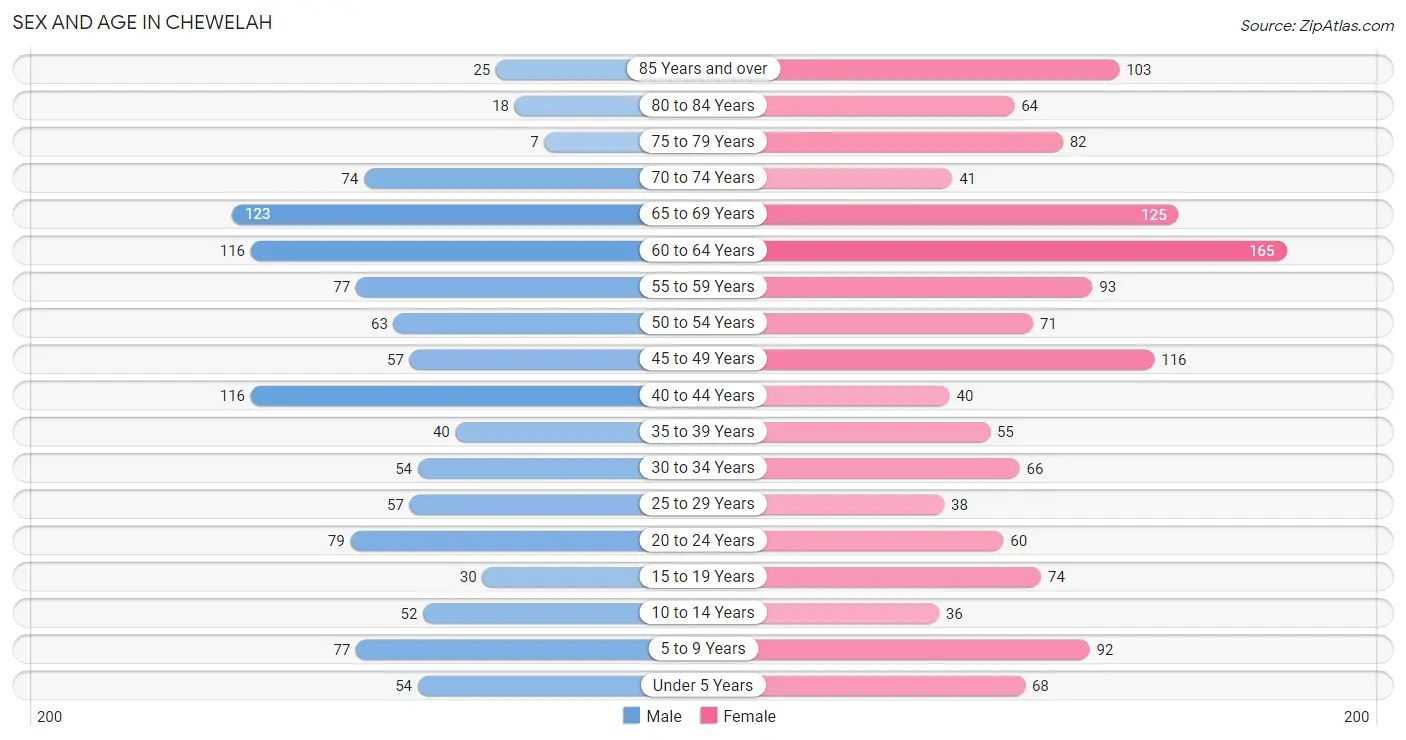
Sex and Age in Chewelah
Sex and Age in Chewelah
The most populous age groups in Chewelah are 65 to 69 Years (123 | 11.0%) for men and 60 to 64 Years (165 | 11.9%) for women.
| Age Bracket | Male | Female |
| Under 5 Years | 54 (4.8%) | 68 (4.9%) |
| 5 to 9 Years | 77 (6.9%) | 92 (6.6%) |
| 10 to 14 Years | 52 (4.6%) | 36 (2.6%) |
| 15 to 19 Years | 30 (2.7%) | 74 (5.3%) |
| 20 to 24 Years | 79 (7.1%) | 60 (4.3%) |
| 25 to 29 Years | 57 (5.1%) | 38 (2.7%) |
| 30 to 34 Years | 54 (4.8%) | 66 (4.8%) |
| 35 to 39 Years | 40 (3.6%) | 55 (4.0%) |
| 40 to 44 Years | 116 (10.4%) | 40 (2.9%) |
| 45 to 49 Years | 57 (5.1%) | 116 (8.4%) |
| 50 to 54 Years | 63 (5.6%) | 71 (5.1%) |
| 55 to 59 Years | 77 (6.9%) | 93 (6.7%) |
| 60 to 64 Years | 116 (10.4%) | 165 (11.9%) |
| 65 to 69 Years | 123 (11.0%) | 125 (9.0%) |
| 70 to 74 Years | 74 (6.6%) | 41 (2.9%) |
| 75 to 79 Years | 7 (0.6%) | 82 (5.9%) |
| 80 to 84 Years | 18 (1.6%) | 64 (4.6%) |
| 85 Years and over | 25 (2.2%) | 103 (7.4%) |
| Total | 1,119 (100.0%) | 1,389 (100.0%) |
Families and Households in Chewelah
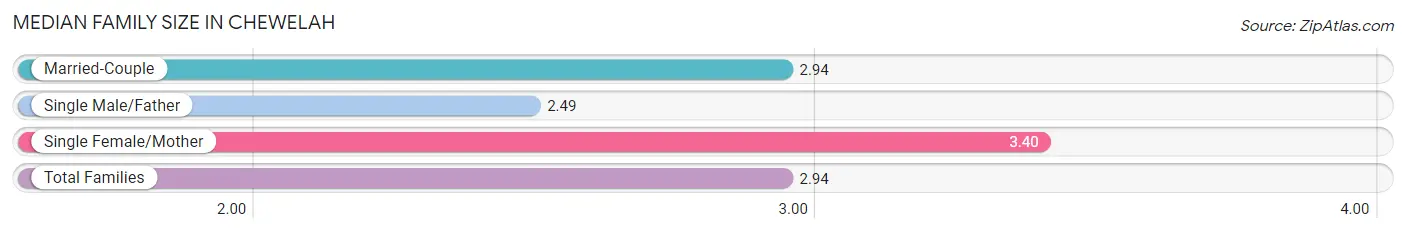
Median Family Size in Chewelah
The median family size in Chewelah is 2.94 persons per family, with single female/mother families (81 | 13.3%) accounting for the largest median family size of 3.4 persons per family. On the other hand, single male/father families (85 | 13.9%) represent the smallest median family size with 2.49 persons per family.
| Family Type | # Families | Family Size |
| Married-Couple | 445 (72.8%) | 2.94 |
| Single Male/Father | 85 (13.9%) | 2.49 |
| Single Female/Mother | 81 (13.3%) | 3.40 |
| Total Families | 611 (100.0%) | 2.94 |
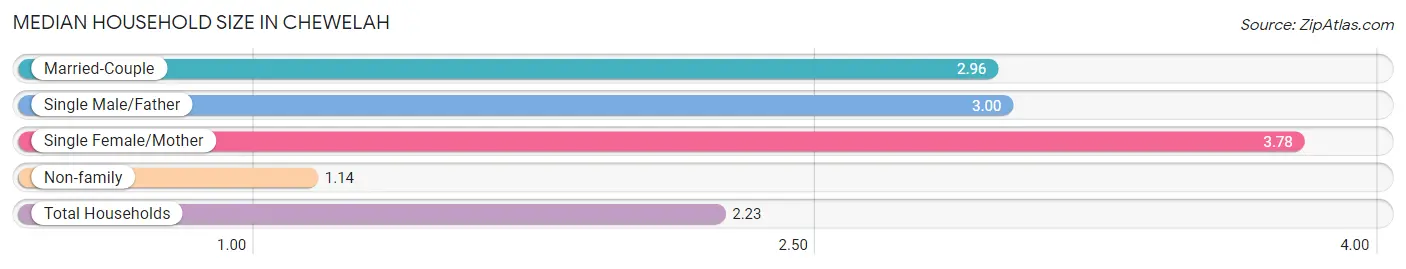
Median Household Size in Chewelah
The median household size in Chewelah is 2.23 persons per household, with single female/mother households (81 | 7.5%) accounting for the largest median household size of 3.78 persons per household. non-family households (474 | 43.7%) represent the smallest median household size with 1.14 persons per household.
| Household Type | # Households | Household Size |
| Married-Couple | 445 (41.0%) | 2.96 |
| Single Male/Father | 85 (7.8%) | 3.00 |
| Single Female/Mother | 81 (7.5%) | 3.78 |
| Non-family | 474 (43.7%) | 1.14 |
| Total Households | 1,085 (100.0%) | 2.23 |
Household Size by Marriage Status in Chewelah
Out of a total of 1,085 households in Chewelah, 611 (56.3%) are family households, while 474 (43.7%) are nonfamily households. The most numerous type of family households are 2-person households, comprising 342, and the most common type of nonfamily households are 1-person households, comprising 419.
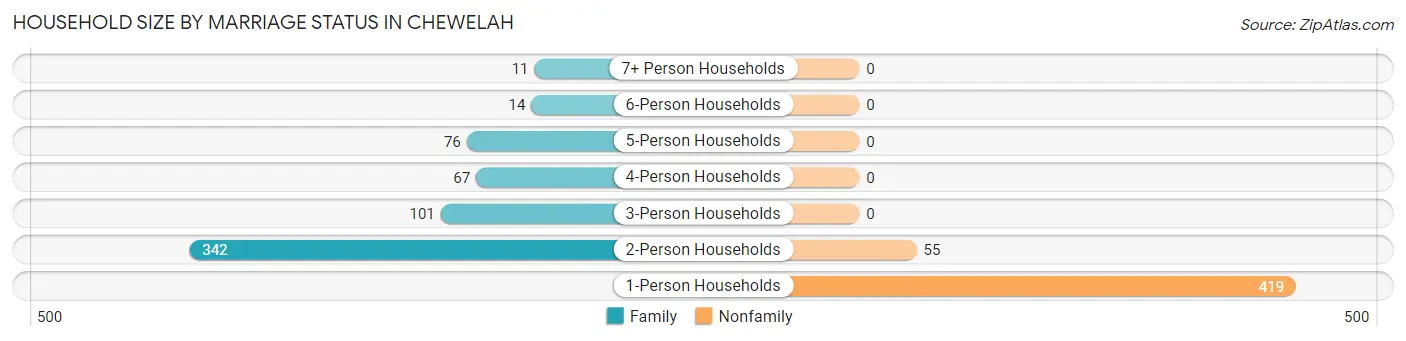
| Household Size | Family Households | Nonfamily Households |
| 1-Person Households | - | 419 (38.6%) |
| 2-Person Households | 342 (31.5%) | 55 (5.1%) |
| 3-Person Households | 101 (9.3%) | 0 (0.0%) |
| 4-Person Households | 67 (6.2%) | 0 (0.0%) |
| 5-Person Households | 76 (7.0%) | 0 (0.0%) |
| 6-Person Households | 14 (1.3%) | 0 (0.0%) |
| 7+ Person Households | 11 (1.0%) | 0 (0.0%) |
| Total | 611 (56.3%) | 474 (43.7%) |
Female Fertility in Chewelah
Fertility by Age in Chewelah
Average fertility rate in Chewelah is 35.0 births per 1,000 women. Women in the age bracket of 20 to 34 years have the highest fertility rate with 61.0 births per 1,000 women. Women in the age bracket of 20 to 34 years acount for 62.5% of all women with births.
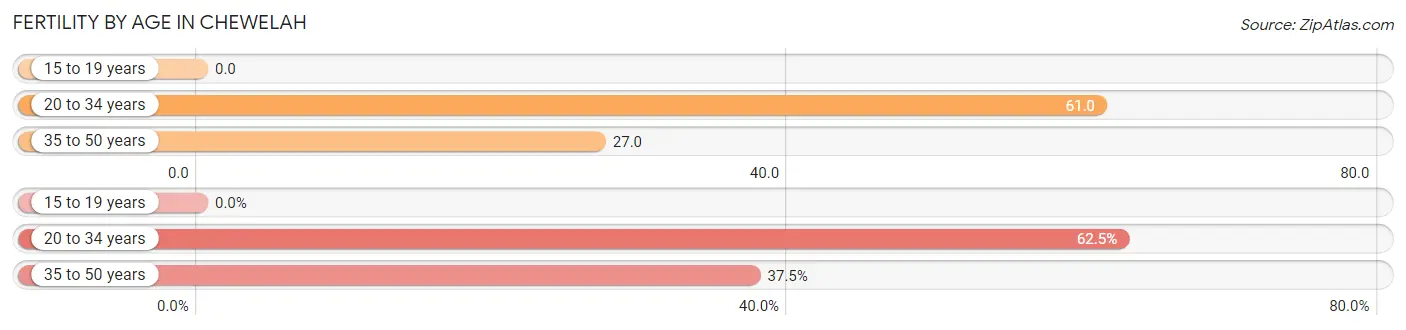
| Age Bracket | Women with Births | Births / 1,000 Women |
| 15 to 19 years | 0 (0.0%) | 0.0 |
| 20 to 34 years | 10 (62.5%) | 61.0 |
| 35 to 50 years | 6 (37.5%) | 27.0 |
| Total | 16 (100.0%) | 35.0 |
Fertility by Age by Marriage Status in Chewelah
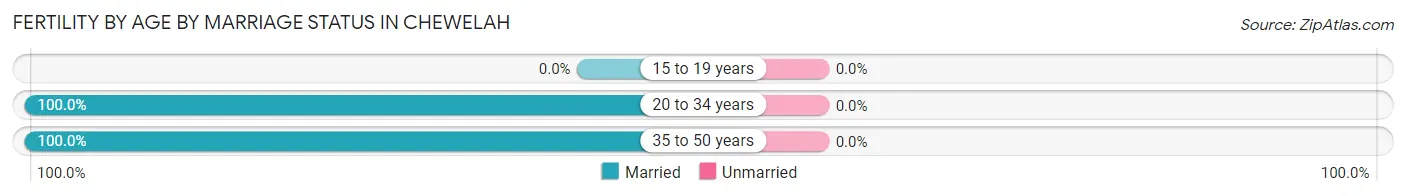
| Age Bracket | Married | Unmarried |
| 15 to 19 years | 0 (0.0%) | 0 (0.0%) |
| 20 to 34 years | 10 (100.0%) | 0 (0.0%) |
| 35 to 50 years | 6 (100.0%) | 0 (0.0%) |
| Total | 16 (100.0%) | 0 (0.0%) |
Fertility by Education in Chewelah
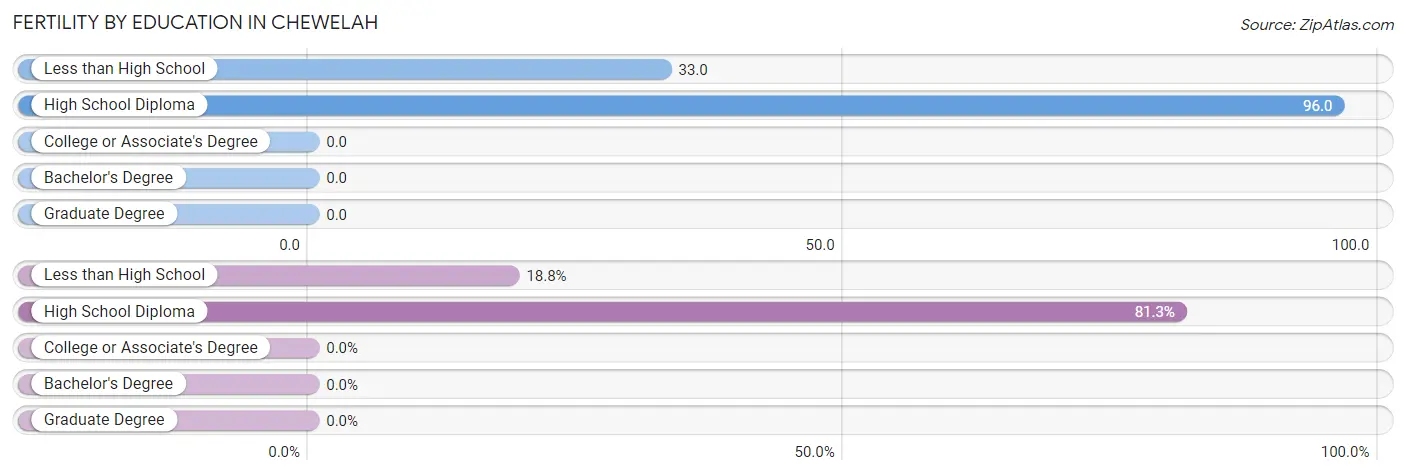
| Educational Attainment | Women with Births | Births / 1,000 Women |
| Less than High School | 3 (18.8%) | 33.0 |
| High School Diploma | 13 (81.2%) | 96.0 |
| College or Associate's Degree | 0 (0.0%) | 0.0 |
| Bachelor's Degree | 0 (0.0%) | 0.0 |
| Graduate Degree | 0 (0.0%) | 0.0 |
| Total | 16 (100.0%) | 35.0 |
Fertility by Education by Marriage Status in Chewelah
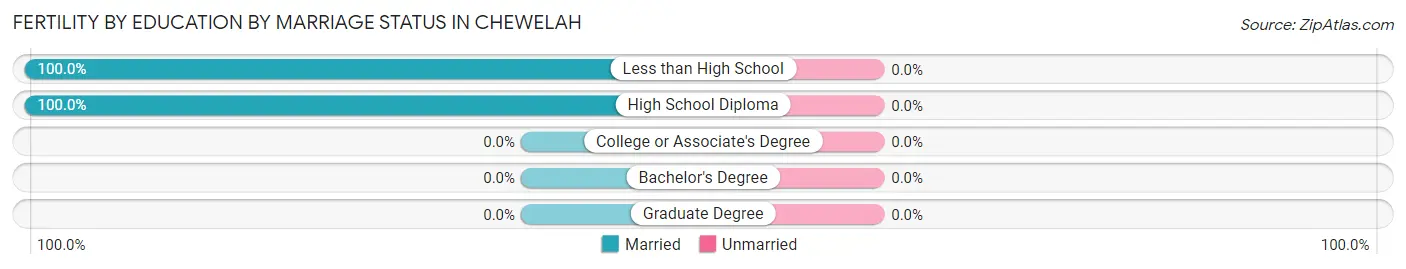
| Educational Attainment | Married | Unmarried |
| Less than High School | 3 (100.0%) | 0 (0.0%) |
| High School Diploma | 13 (100.0%) | 0 (0.0%) |
| College or Associate's Degree | 0 (0.0%) | 0 (0.0%) |
| Bachelor's Degree | 0 (0.0%) | 0 (0.0%) |
| Graduate Degree | 0 (0.0%) | 0 (0.0%) |
| Total | 16 (100.0%) | 0 (0.0%) |
Employment Characteristics in Chewelah
Employment by Class of Employer in Chewelah
Among the 983 employed individuals in Chewelah, private company employees (507 | 51.6%), local government employees (153 | 15.6%), and self-employed (not incorporated) (109 | 11.1%) make up the most common classes of employment.
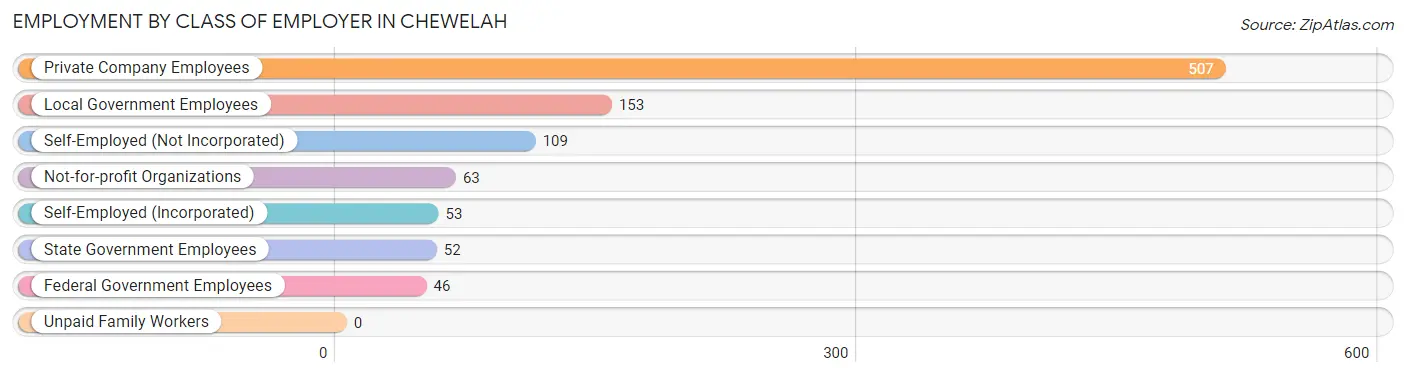
| Employer Class | # Employees | % Employees |
| Private Company Employees | 507 | 51.6% |
| Self-Employed (Incorporated) | 53 | 5.4% |
| Self-Employed (Not Incorporated) | 109 | 11.1% |
| Not-for-profit Organizations | 63 | 6.4% |
| Local Government Employees | 153 | 15.6% |
| State Government Employees | 52 | 5.3% |
| Federal Government Employees | 46 | 4.7% |
| Unpaid Family Workers | 0 | 0.0% |
| Total | 983 | 100.0% |
Employment Status by Age in Chewelah
According to the labor force statistics for Chewelah, out of the total population over 16 years of age (2,114), 50.4% or 1,065 individuals are in the labor force, with 7.6% or 81 of them unemployed. The age group with the highest labor force participation rate is 20 to 24 years, with 100.0% or 139 individuals in the labor force. Within the labor force, the 20 to 24 years age range has the highest percentage of unemployed individuals, with 23.7% or 33 of them being unemployed.
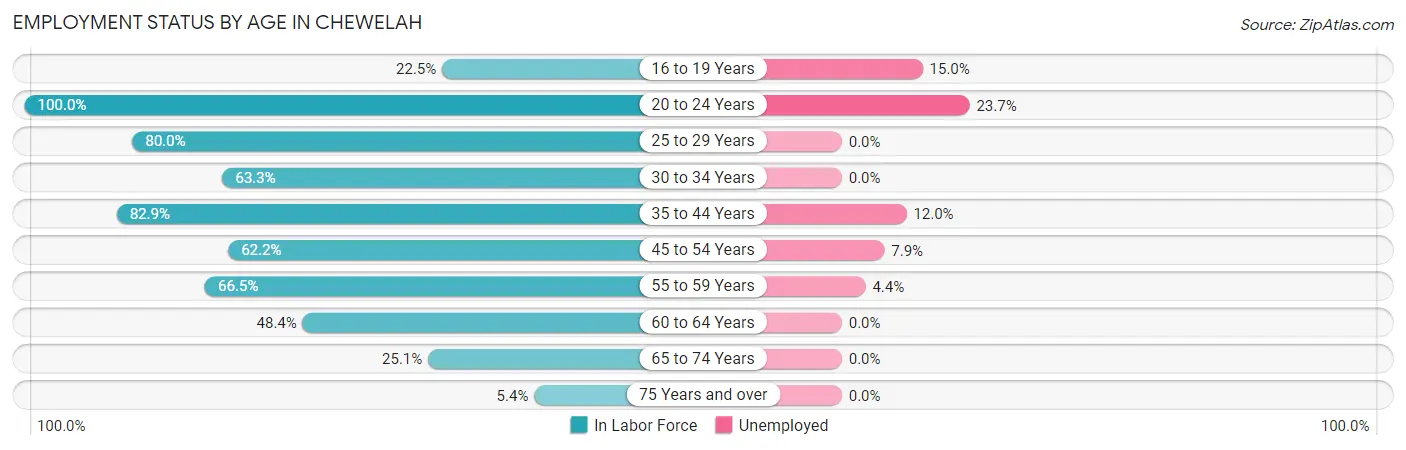
| Age Bracket | In Labor Force | Unemployed |
| 16 to 19 Years | 20 (22.5%) | 3 (15.0%) |
| 20 to 24 Years | 139 (100.0%) | 33 (23.7%) |
| 25 to 29 Years | 76 (80.0%) | 0 (0.0%) |
| 30 to 34 Years | 76 (63.3%) | 0 (0.0%) |
| 35 to 44 Years | 208 (82.9%) | 25 (12.0%) |
| 45 to 54 Years | 191 (62.2%) | 15 (7.9%) |
| 55 to 59 Years | 113 (66.5%) | 5 (4.4%) |
| 60 to 64 Years | 136 (48.4%) | 0 (0.0%) |
| 65 to 74 Years | 91 (25.1%) | 0 (0.0%) |
| 75 Years and over | 16 (5.4%) | 0 (0.0%) |
| Total | 1,065 (50.4%) | 81 (7.6%) |
Employment Status by Educational Attainment in Chewelah
According to labor force statistics for Chewelah, 65.4% of individuals (800) out of the total population between 25 and 64 years of age (1,224) are in the labor force, with 5.6% or 45 of them being unemployed. The group with the highest labor force participation rate are those with the educational attainment of bachelor's degree or higher, with 93.2% or 206 individuals in the labor force. Within the labor force, individuals with less than high school education have the highest percentage of unemployment, with 12.2% or 6 of them being unemployed.
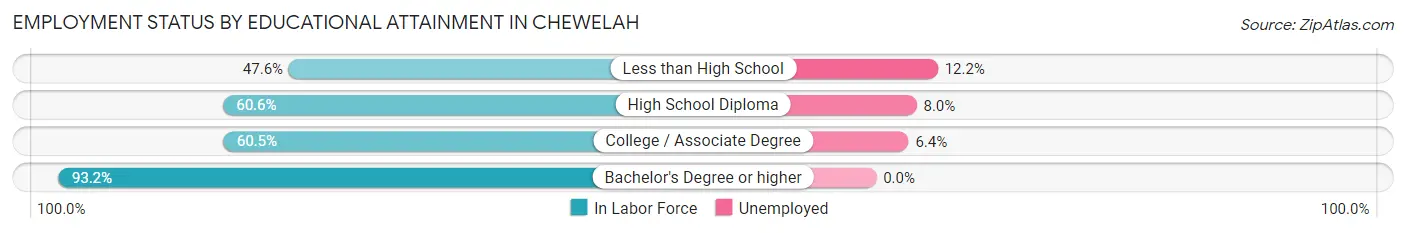
| Educational Attainment | In Labor Force | Unemployed |
| Less than High School | 49 (47.6%) | 13 (12.2%) |
| High School Diploma | 249 (60.6%) | 33 (8.0%) |
| College / Associate Degree | 296 (60.5%) | 31 (6.4%) |
| Bachelor's Degree or higher | 206 (93.2%) | 0 (0.0%) |
| Total | 800 (65.4%) | 69 (5.6%) |
Employment Occupations by Sex in Chewelah
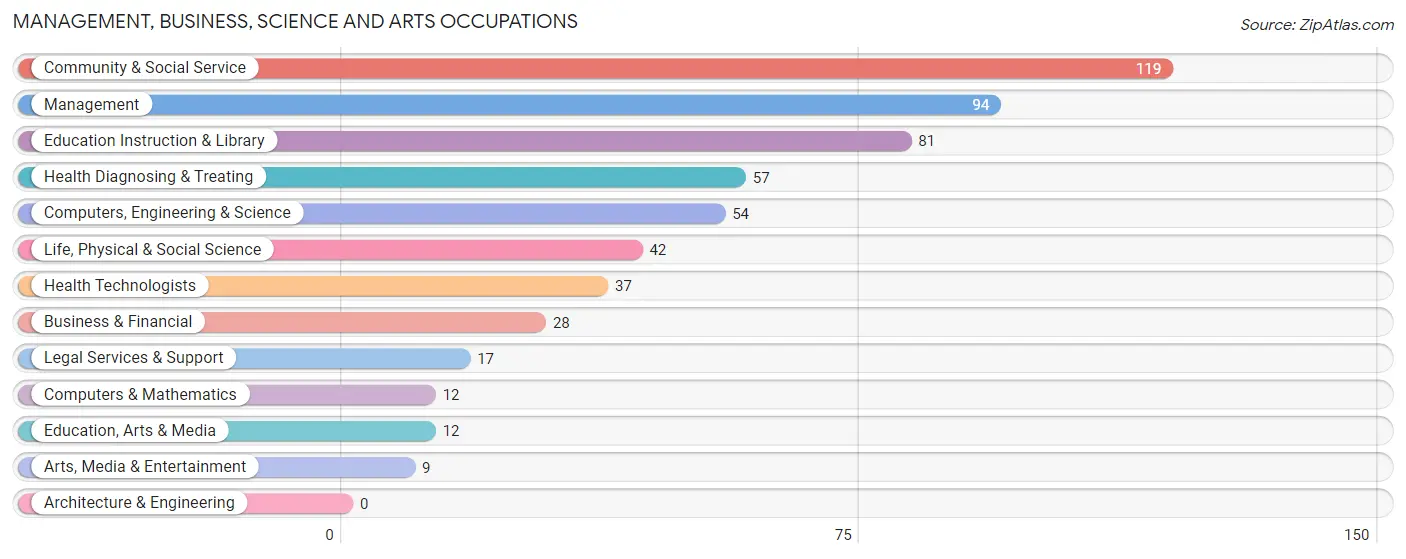
Management, Business, Science and Arts Occupations
The most common Management, Business, Science and Arts occupations in Chewelah are Community & Social Service (119 | 12.1%), Management (94 | 9.5%), Education Instruction & Library (81 | 8.2%), Health Diagnosing & Treating (57 | 5.8%), and Computers, Engineering & Science (54 | 5.5%).
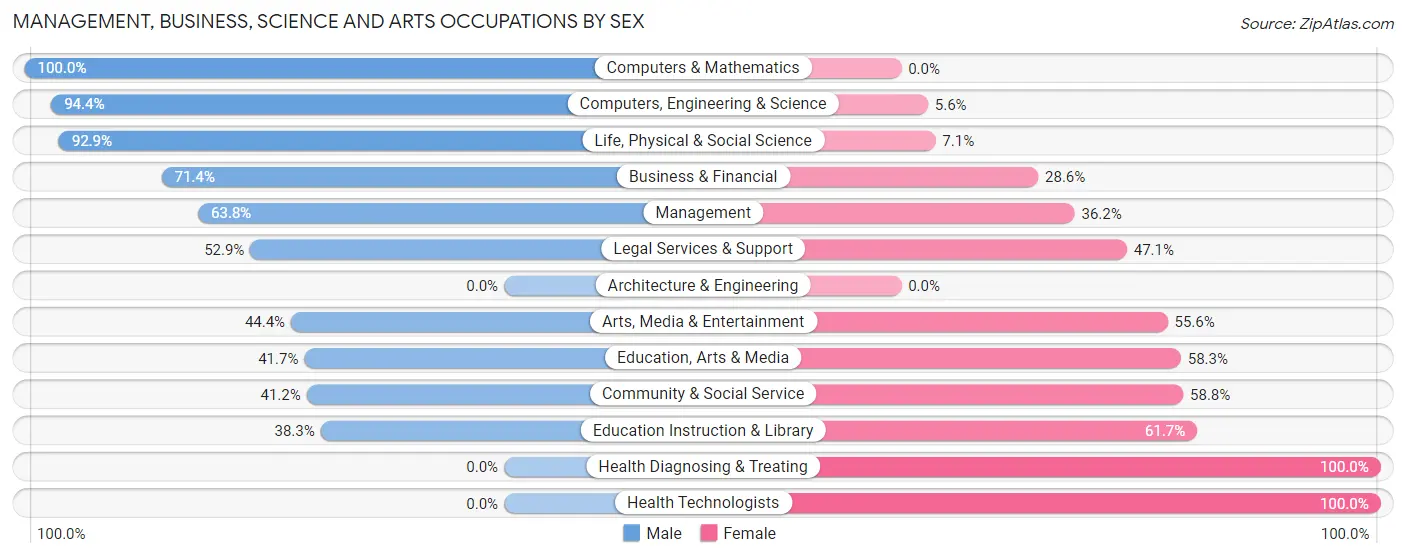
Management, Business, Science and Arts Occupations by Sex
Within the Management, Business, Science and Arts occupations in Chewelah, the most male-oriented occupations are Computers & Mathematics (100.0%), Computers, Engineering & Science (94.4%), and Life, Physical & Social Science (92.9%), while the most female-oriented occupations are Health Diagnosing & Treating (100.0%), Health Technologists (100.0%), and Education Instruction & Library (61.7%).
| Occupation | Male | Female |
| Management | 60 (63.8%) | 34 (36.2%) |
| Business & Financial | 20 (71.4%) | 8 (28.6%) |
| Computers, Engineering & Science | 51 (94.4%) | 3 (5.6%) |
| Computers & Mathematics | 12 (100.0%) | 0 (0.0%) |
| Architecture & Engineering | 0 (0.0%) | 0 (0.0%) |
| Life, Physical & Social Science | 39 (92.9%) | 3 (7.1%) |
| Community & Social Service | 49 (41.2%) | 70 (58.8%) |
| Education, Arts & Media | 5 (41.7%) | 7 (58.3%) |
| Legal Services & Support | 9 (52.9%) | 8 (47.1%) |
| Education Instruction & Library | 31 (38.3%) | 50 (61.7%) |
| Arts, Media & Entertainment | 4 (44.4%) | 5 (55.6%) |
| Health Diagnosing & Treating | 0 (0.0%) | 57 (100.0%) |
| Health Technologists | 0 (0.0%) | 37 (100.0%) |
| Total (Category) | 180 (51.1%) | 172 (48.9%) |
| Total (Overall) | 537 (54.5%) | 448 (45.5%) |
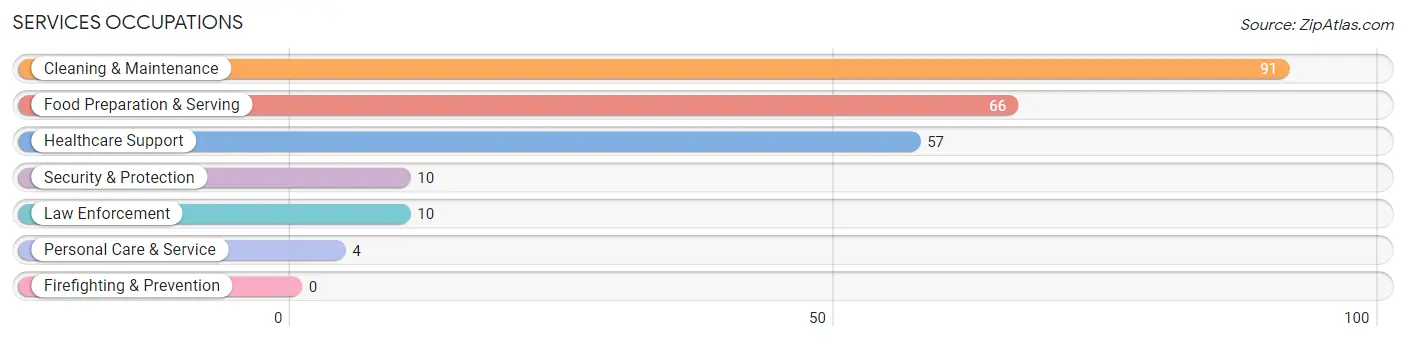
Services Occupations
The most common Services occupations in Chewelah are Cleaning & Maintenance (91 | 9.2%), Food Preparation & Serving (66 | 6.7%), Healthcare Support (57 | 5.8%), Security & Protection (10 | 1.0%), and Law Enforcement (10 | 1.0%).
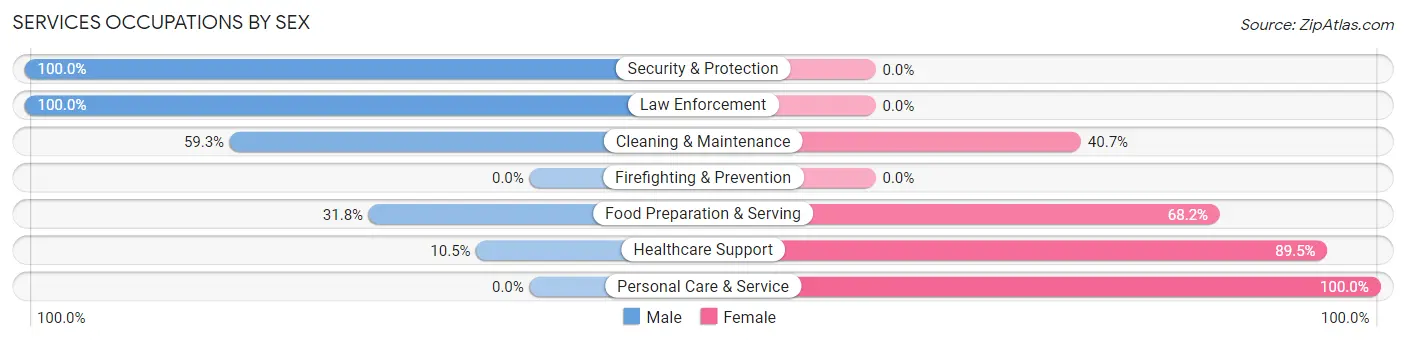
Services Occupations by Sex
Within the Services occupations in Chewelah, the most male-oriented occupations are Security & Protection (100.0%), Law Enforcement (100.0%), and Cleaning & Maintenance (59.3%), while the most female-oriented occupations are Personal Care & Service (100.0%), Healthcare Support (89.5%), and Food Preparation & Serving (68.2%).
| Occupation | Male | Female |
| Healthcare Support | 6 (10.5%) | 51 (89.5%) |
| Security & Protection | 10 (100.0%) | 0 (0.0%) |
| Firefighting & Prevention | 0 (0.0%) | 0 (0.0%) |
| Law Enforcement | 10 (100.0%) | 0 (0.0%) |
| Food Preparation & Serving | 21 (31.8%) | 45 (68.2%) |
| Cleaning & Maintenance | 54 (59.3%) | 37 (40.7%) |
| Personal Care & Service | 0 (0.0%) | 4 (100.0%) |
| Total (Category) | 91 (39.9%) | 137 (60.1%) |
| Total (Overall) | 537 (54.5%) | 448 (45.5%) |
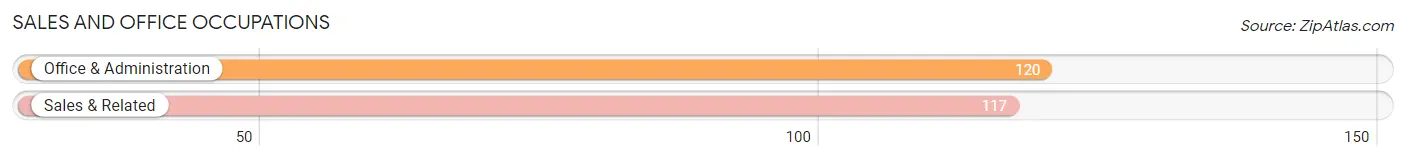
Sales and Office Occupations
The most common Sales and Office occupations in Chewelah are Office & Administration (120 | 12.2%), and Sales & Related (117 | 11.9%).
Sales and Office Occupations by Sex
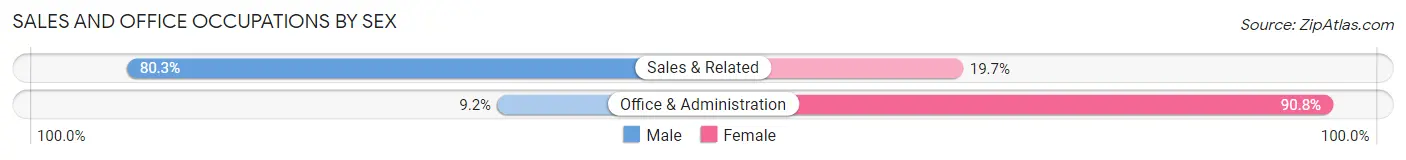
| Occupation | Male | Female |
| Sales & Related | 94 (80.3%) | 23 (19.7%) |
| Office & Administration | 11 (9.2%) | 109 (90.8%) |
| Total (Category) | 105 (44.3%) | 132 (55.7%) |
| Total (Overall) | 537 (54.5%) | 448 (45.5%) |
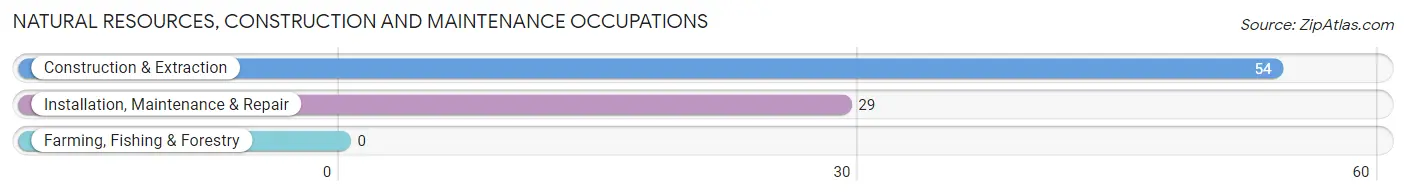
Natural Resources, Construction and Maintenance Occupations
The most common Natural Resources, Construction and Maintenance occupations in Chewelah are Construction & Extraction (54 | 5.5%), and Installation, Maintenance & Repair (29 | 2.9%).
Natural Resources, Construction and Maintenance Occupations by Sex
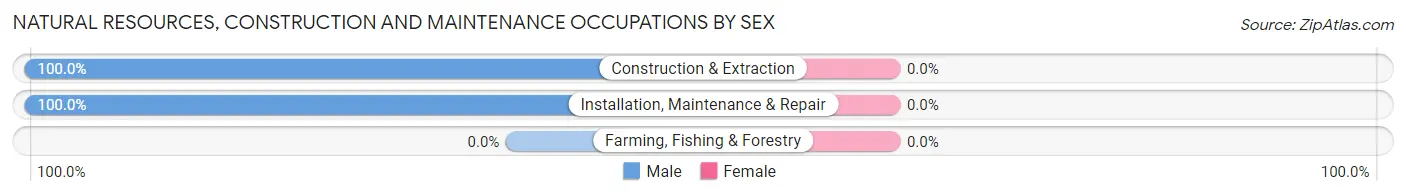
| Occupation | Male | Female |
| Farming, Fishing & Forestry | 0 (0.0%) | 0 (0.0%) |
| Construction & Extraction | 54 (100.0%) | 0 (0.0%) |
| Installation, Maintenance & Repair | 29 (100.0%) | 0 (0.0%) |
| Total (Category) | 83 (100.0%) | 0 (0.0%) |
| Total (Overall) | 537 (54.5%) | 448 (45.5%) |
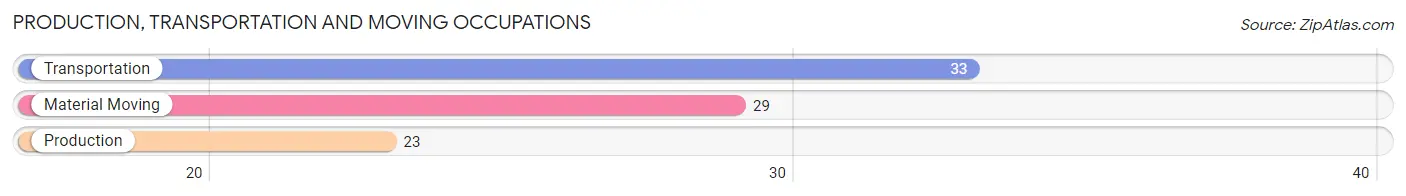
Production, Transportation and Moving Occupations
The most common Production, Transportation and Moving occupations in Chewelah are Transportation (33 | 3.4%), Material Moving (29 | 2.9%), and Production (23 | 2.3%).
Production, Transportation and Moving Occupations by Sex
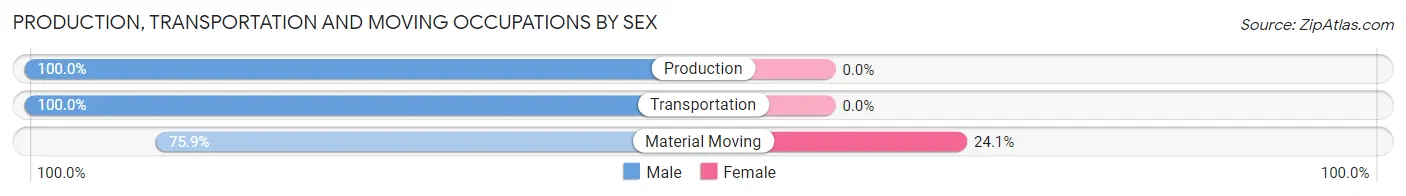
| Occupation | Male | Female |
| Production | 23 (100.0%) | 0 (0.0%) |
| Transportation | 33 (100.0%) | 0 (0.0%) |
| Material Moving | 22 (75.9%) | 7 (24.1%) |
| Total (Category) | 78 (91.8%) | 7 (8.2%) |
| Total (Overall) | 537 (54.5%) | 448 (45.5%) |
Employment Industries by Sex in Chewelah
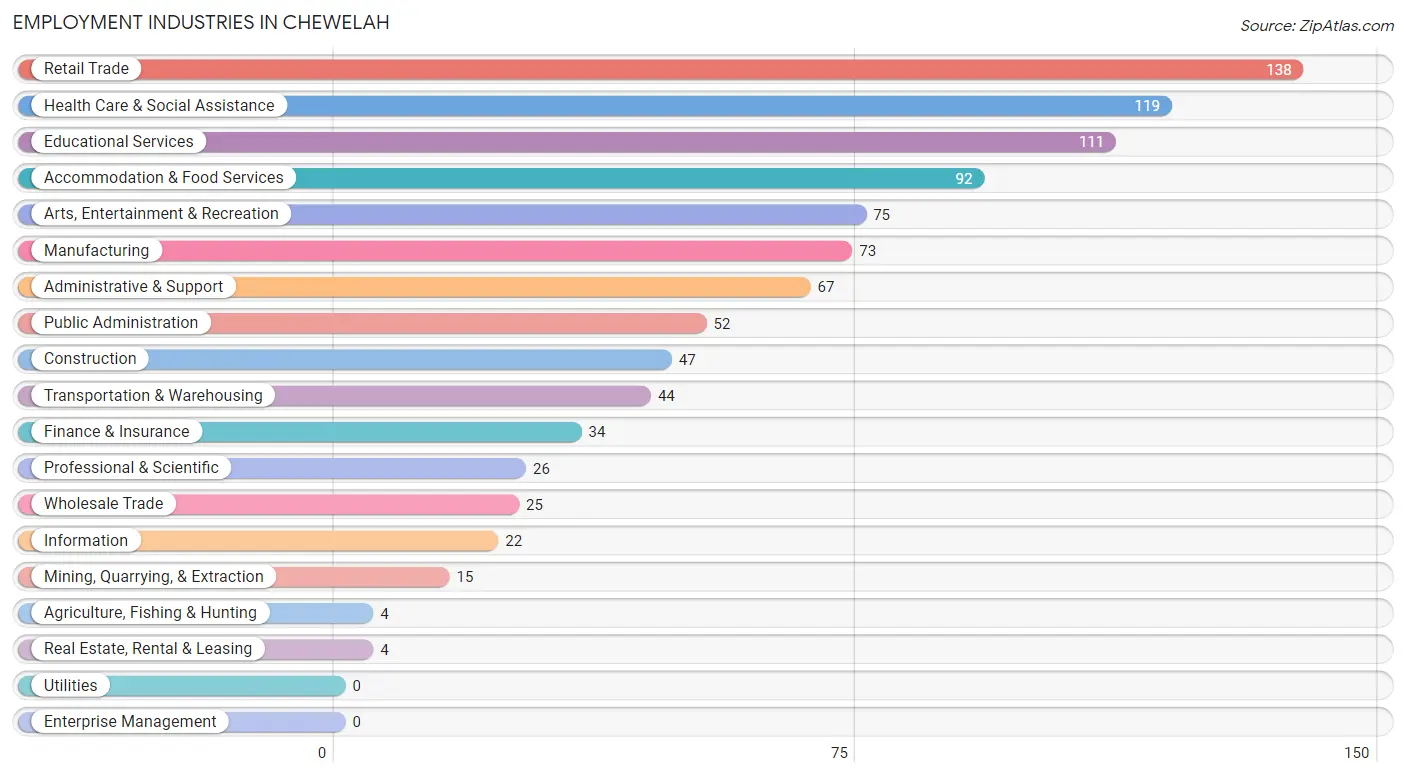
Employment Industries in Chewelah
The major employment industries in Chewelah include Retail Trade (138 | 14.0%), Health Care & Social Assistance (119 | 12.1%), Educational Services (111 | 11.3%), Accommodation & Food Services (92 | 9.3%), and Arts, Entertainment & Recreation (75 | 7.6%).
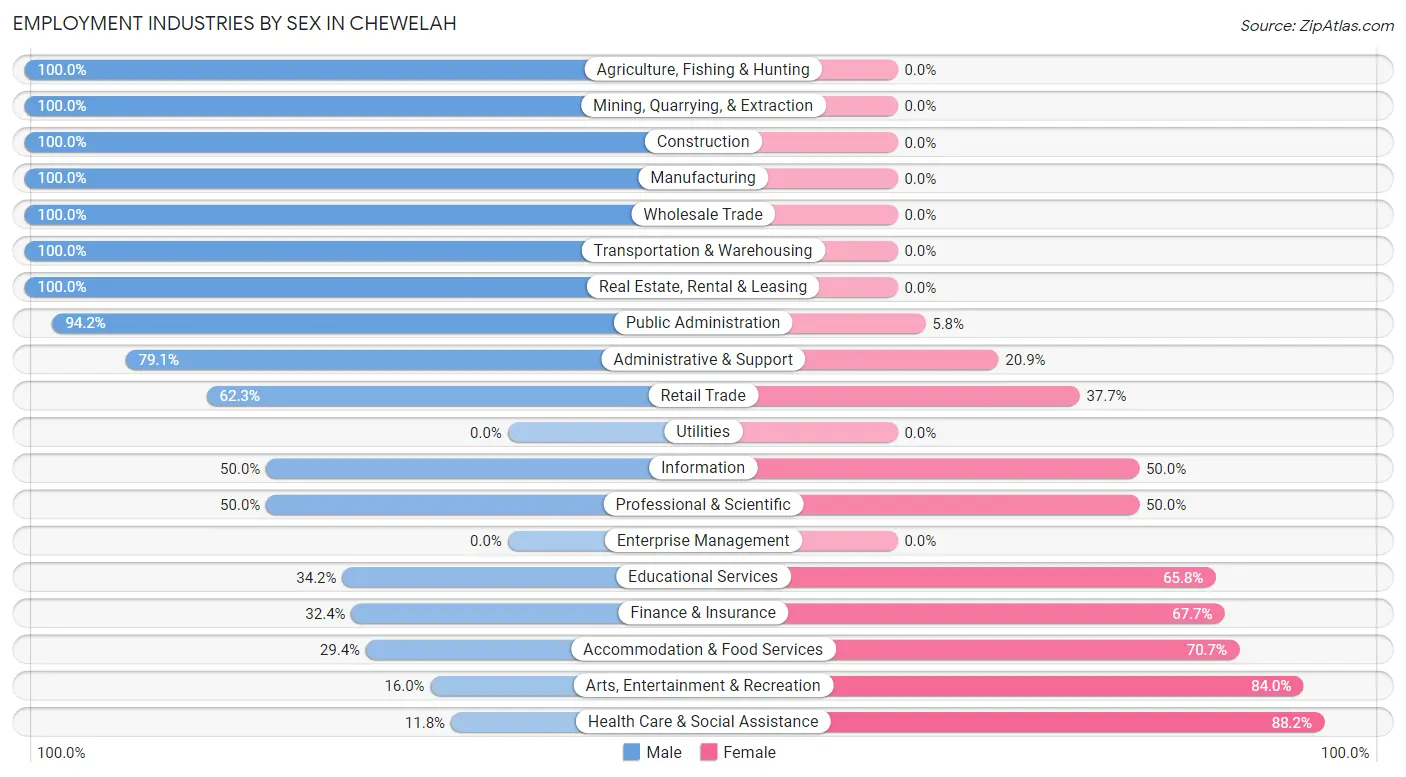
Employment Industries by Sex in Chewelah
The Chewelah industries that see more men than women are Agriculture, Fishing & Hunting (100.0%), Mining, Quarrying, & Extraction (100.0%), and Construction (100.0%), whereas the industries that tend to have a higher number of women are Health Care & Social Assistance (88.2%), Arts, Entertainment & Recreation (84.0%), and Accommodation & Food Services (70.7%).
| Industry | Male | Female |
| Agriculture, Fishing & Hunting | 4 (100.0%) | 0 (0.0%) |
| Mining, Quarrying, & Extraction | 15 (100.0%) | 0 (0.0%) |
| Construction | 47 (100.0%) | 0 (0.0%) |
| Manufacturing | 73 (100.0%) | 0 (0.0%) |
| Wholesale Trade | 25 (100.0%) | 0 (0.0%) |
| Retail Trade | 86 (62.3%) | 52 (37.7%) |
| Transportation & Warehousing | 44 (100.0%) | 0 (0.0%) |
| Utilities | 0 (0.0%) | 0 (0.0%) |
| Information | 11 (50.0%) | 11 (50.0%) |
| Finance & Insurance | 11 (32.4%) | 23 (67.6%) |
| Real Estate, Rental & Leasing | 4 (100.0%) | 0 (0.0%) |
| Professional & Scientific | 13 (50.0%) | 13 (50.0%) |
| Enterprise Management | 0 (0.0%) | 0 (0.0%) |
| Administrative & Support | 53 (79.1%) | 14 (20.9%) |
| Educational Services | 38 (34.2%) | 73 (65.8%) |
| Health Care & Social Assistance | 14 (11.8%) | 105 (88.2%) |
| Arts, Entertainment & Recreation | 12 (16.0%) | 63 (84.0%) |
| Accommodation & Food Services | 27 (29.3%) | 65 (70.7%) |
| Public Administration | 49 (94.2%) | 3 (5.8%) |
| Total | 537 (54.5%) | 448 (45.5%) |
Education in Chewelah
School Enrollment in Chewelah
The most common levels of schooling among the 407 students in Chewelah are high school (115 | 28.3%), elementary school (101 | 24.8%), and kindergarten (68 | 16.7%).
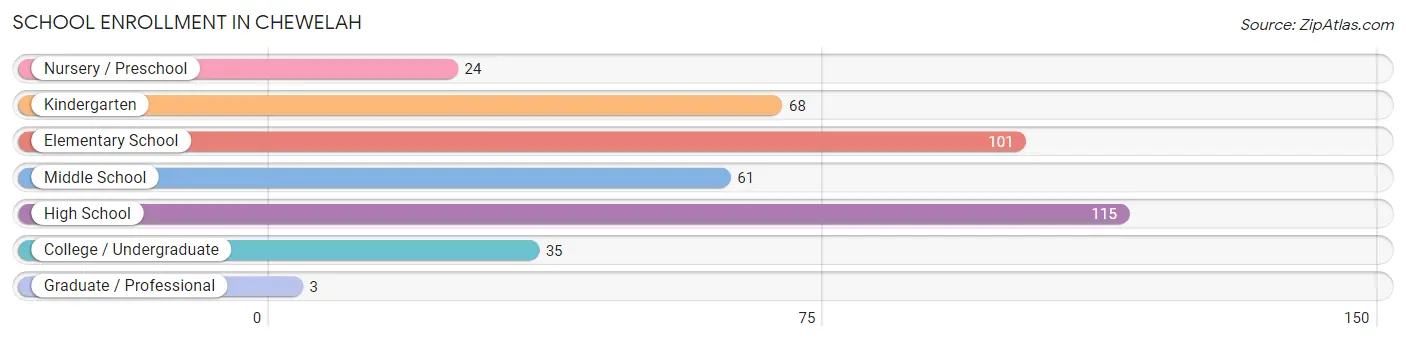
| School Level | # Students | % Students |
| Nursery / Preschool | 24 | 5.9% |
| Kindergarten | 68 | 16.7% |
| Elementary School | 101 | 24.8% |
| Middle School | 61 | 15.0% |
| High School | 115 | 28.3% |
| College / Undergraduate | 35 | 8.6% |
| Graduate / Professional | 3 | 0.7% |
| Total | 407 | 100.0% |
School Enrollment by Age by Funding Source in Chewelah
Out of a total of 407 students who are enrolled in schools in Chewelah, 59 (14.5%) attend a private institution, while the remaining 348 (85.5%) are enrolled in public schools. The age group of 25 to 34 year olds has the highest likelihood of being enrolled in private schools, with 18 (85.7% in the age bracket) enrolled. Conversely, the age group of 18 to 19 year olds has the lowest likelihood of being enrolled in a private school, with 14 (100.0% in the age bracket) attending a public institution.
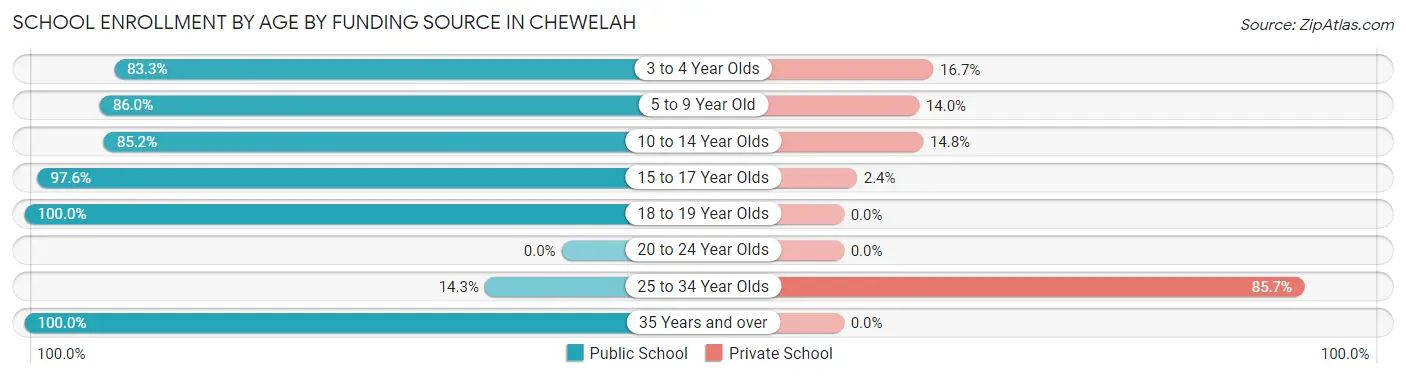
| Age Bracket | Public School | Private School |
| 3 to 4 Year Olds | 15 (83.3%) | 3 (16.7%) |
| 5 to 9 Year Old | 141 (86.0%) | 23 (14.0%) |
| 10 to 14 Year Olds | 75 (85.2%) | 13 (14.8%) |
| 15 to 17 Year Olds | 80 (97.6%) | 2 (2.4%) |
| 18 to 19 Year Olds | 14 (100.0%) | 0 (0.0%) |
| 20 to 24 Year Olds | 0 (0.0%) | 0 (0.0%) |
| 25 to 34 Year Olds | 3 (14.3%) | 18 (85.7%) |
| 35 Years and over | 20 (100.0%) | 0 (0.0%) |
| Total | 348 (85.5%) | 59 (14.5%) |
Educational Attainment by Field of Study in Chewelah
Education (78 | 19.9%), bio, nature & agricultural (74 | 18.8%), science & technology (59 | 15.0%), arts & humanities (29 | 7.4%), and physical & health sciences (28 | 7.1%) are the most common fields of study among 393 individuals in Chewelah who have obtained a bachelor's degree or higher.
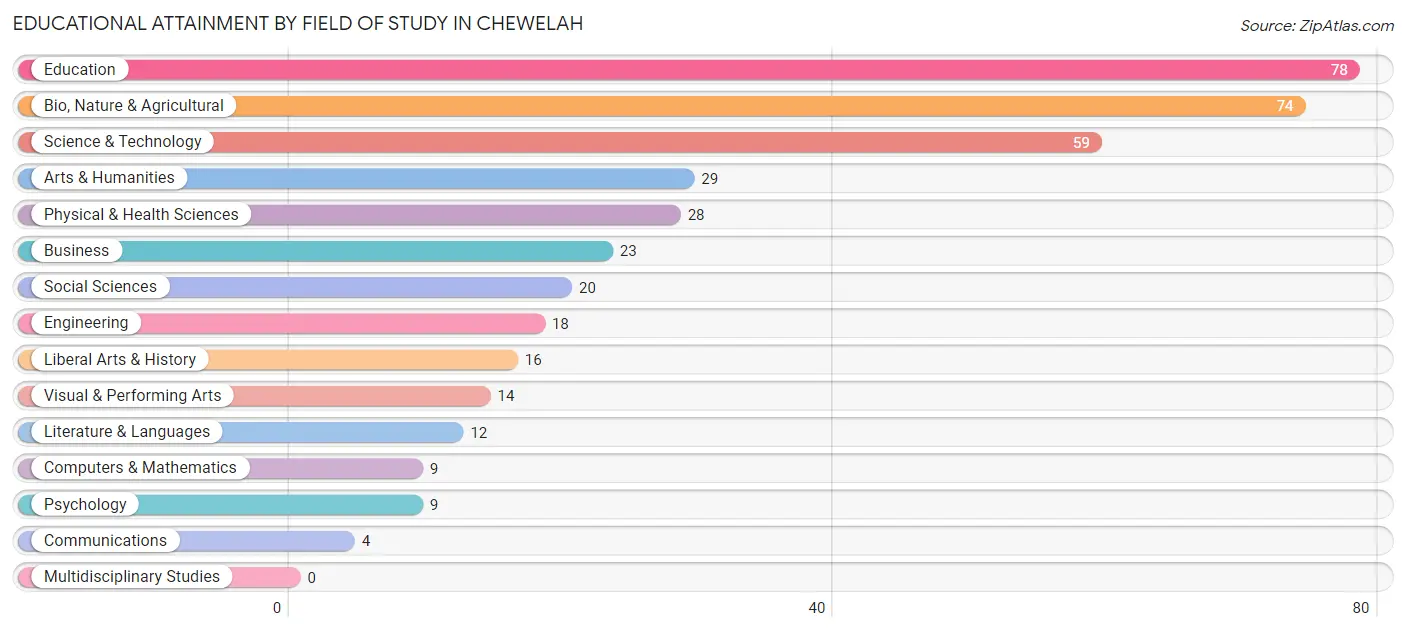
| Field of Study | # Graduates | % Graduates |
| Computers & Mathematics | 9 | 2.3% |
| Bio, Nature & Agricultural | 74 | 18.8% |
| Physical & Health Sciences | 28 | 7.1% |
| Psychology | 9 | 2.3% |
| Social Sciences | 20 | 5.1% |
| Engineering | 18 | 4.6% |
| Multidisciplinary Studies | 0 | 0.0% |
| Science & Technology | 59 | 15.0% |
| Business | 23 | 5.9% |
| Education | 78 | 19.9% |
| Literature & Languages | 12 | 3.0% |
| Liberal Arts & History | 16 | 4.1% |
| Visual & Performing Arts | 14 | 3.6% |
| Communications | 4 | 1.0% |
| Arts & Humanities | 29 | 7.4% |
| Total | 393 | 100.0% |
Transportation & Commute in Chewelah
Vehicle Availability by Sex in Chewelah
The most prevalent vehicle ownership categories in Chewelah are males with 3 vehicles (150, accounting for 28.0%) and females with 3 vehicles (127, making up 33.5%).
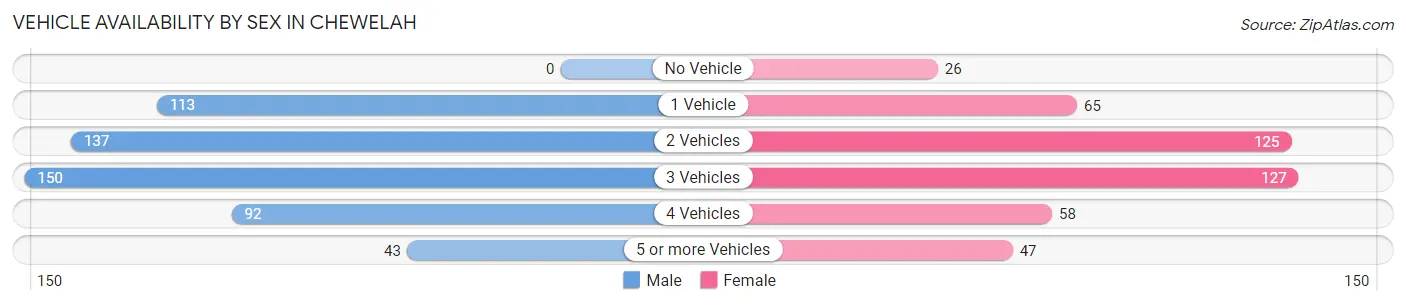
| Vehicles Available | Male | Female |
| No Vehicle | 0 (0.0%) | 26 (5.8%) |
| 1 Vehicle | 113 (21.1%) | 65 (14.5%) |
| 2 Vehicles | 137 (25.6%) | 125 (27.9%) |
| 3 Vehicles | 150 (28.0%) | 127 (28.3%) |
| 4 Vehicles | 92 (17.2%) | 58 (13.0%) |
| 5 or more Vehicles | 43 (8.0%) | 47 (10.5%) |
| Total | 535 (100.0%) | 448 (100.0%) |
Commute Time in Chewelah
The most frequently occuring commute durations in Chewelah are 5 to 9 minutes (246 commuters, 28.1%), 30 to 34 minutes (135 commuters, 15.4%), and 25 to 29 minutes (114 commuters, 13.0%).
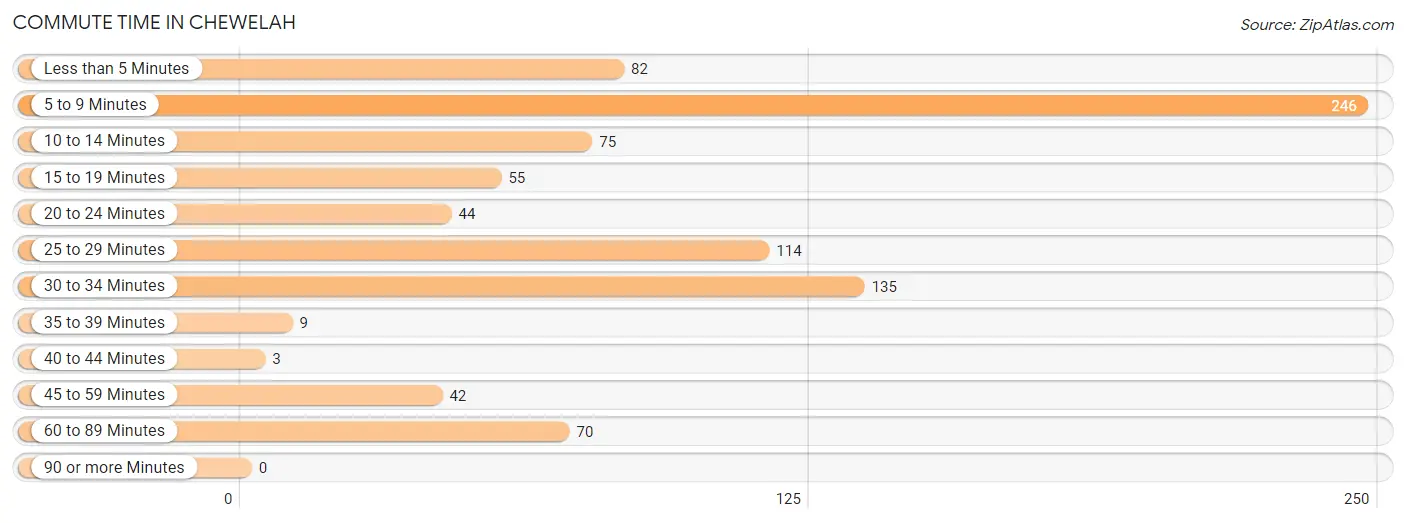
| Commute Time | # Commuters | % Commuters |
| Less than 5 Minutes | 82 | 9.4% |
| 5 to 9 Minutes | 246 | 28.1% |
| 10 to 14 Minutes | 75 | 8.6% |
| 15 to 19 Minutes | 55 | 6.3% |
| 20 to 24 Minutes | 44 | 5.0% |
| 25 to 29 Minutes | 114 | 13.0% |
| 30 to 34 Minutes | 135 | 15.4% |
| 35 to 39 Minutes | 9 | 1.0% |
| 40 to 44 Minutes | 3 | 0.3% |
| 45 to 59 Minutes | 42 | 4.8% |
| 60 to 89 Minutes | 70 | 8.0% |
| 90 or more Minutes | 0 | 0.0% |
Commute Time by Sex in Chewelah
The most common commute times in Chewelah are 25 to 29 minutes (101 commuters, 20.6%) for males and 5 to 9 minutes (156 commuters, 40.6%) for females.
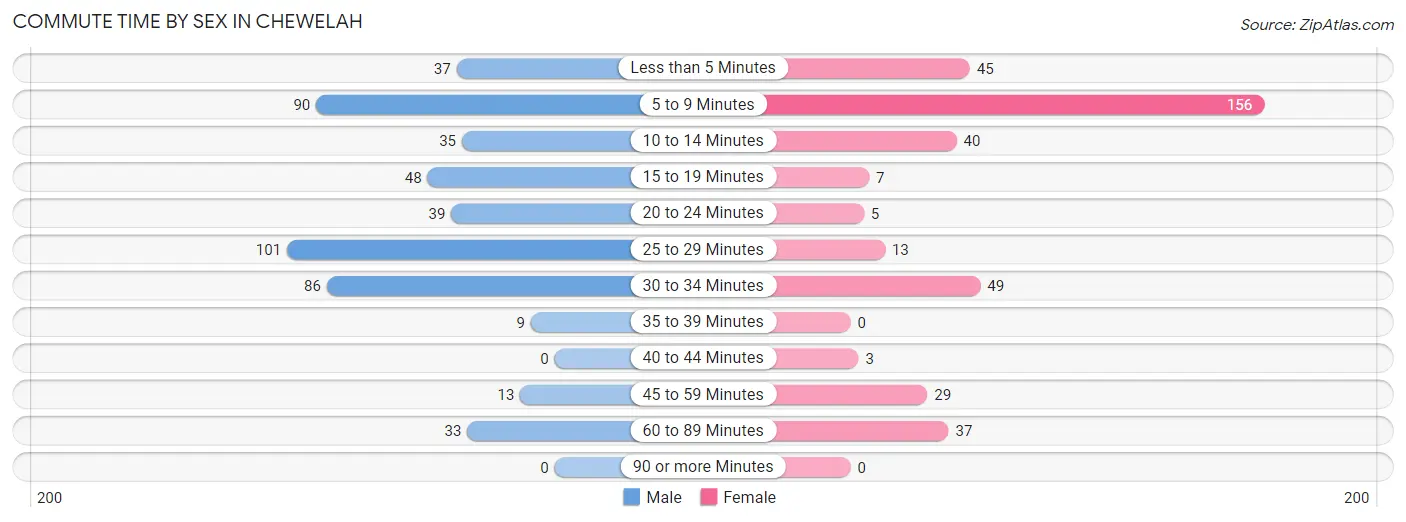
| Commute Time | Male | Female |
| Less than 5 Minutes | 37 (7.5%) | 45 (11.7%) |
| 5 to 9 Minutes | 90 (18.3%) | 156 (40.6%) |
| 10 to 14 Minutes | 35 (7.1%) | 40 (10.4%) |
| 15 to 19 Minutes | 48 (9.8%) | 7 (1.8%) |
| 20 to 24 Minutes | 39 (7.9%) | 5 (1.3%) |
| 25 to 29 Minutes | 101 (20.6%) | 13 (3.4%) |
| 30 to 34 Minutes | 86 (17.5%) | 49 (12.8%) |
| 35 to 39 Minutes | 9 (1.8%) | 0 (0.0%) |
| 40 to 44 Minutes | 0 (0.0%) | 3 (0.8%) |
| 45 to 59 Minutes | 13 (2.6%) | 29 (7.5%) |
| 60 to 89 Minutes | 33 (6.7%) | 37 (9.6%) |
| 90 or more Minutes | 0 (0.0%) | 0 (0.0%) |
Time of Departure to Work by Sex in Chewelah
The most frequent times of departure to work in Chewelah are 7:00 AM to 7:29 AM (142, 28.9%) for males and 8:00 AM to 8:29 AM (80, 20.8%) for females.
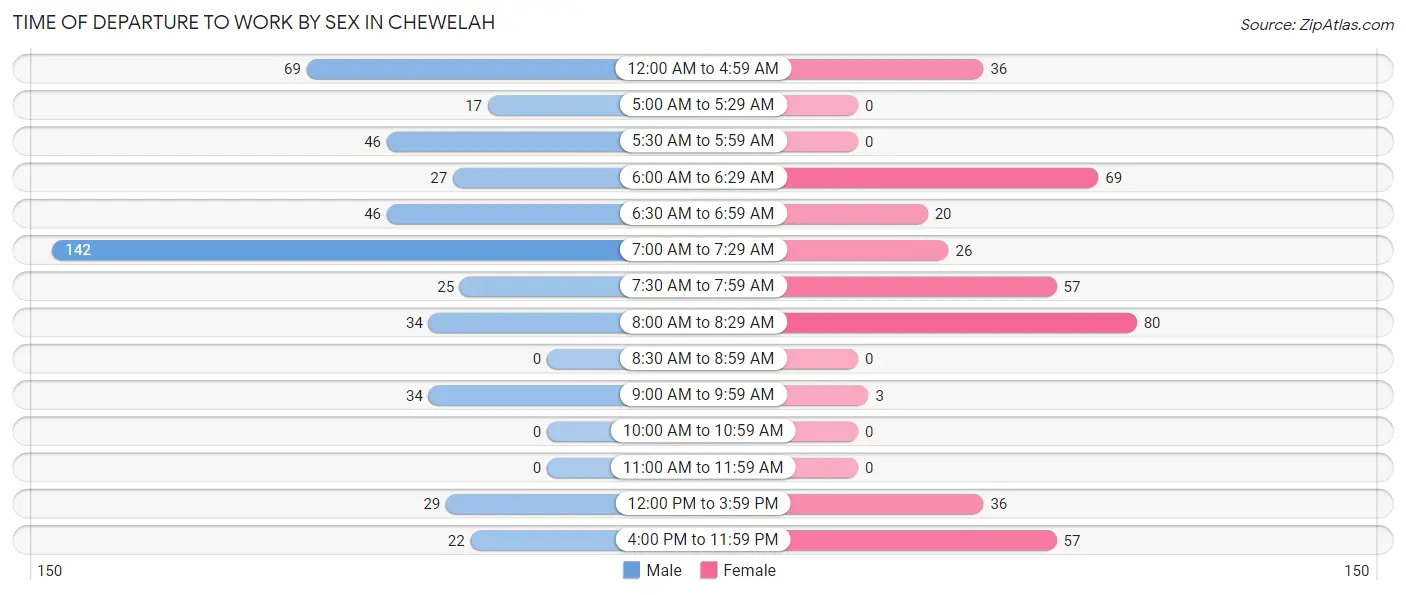
| Time of Departure | Male | Female |
| 12:00 AM to 4:59 AM | 69 (14.1%) | 36 (9.4%) |
| 5:00 AM to 5:29 AM | 17 (3.5%) | 0 (0.0%) |
| 5:30 AM to 5:59 AM | 46 (9.4%) | 0 (0.0%) |
| 6:00 AM to 6:29 AM | 27 (5.5%) | 69 (18.0%) |
| 6:30 AM to 6:59 AM | 46 (9.4%) | 20 (5.2%) |
| 7:00 AM to 7:29 AM | 142 (28.9%) | 26 (6.8%) |
| 7:30 AM to 7:59 AM | 25 (5.1%) | 57 (14.8%) |
| 8:00 AM to 8:29 AM | 34 (6.9%) | 80 (20.8%) |
| 8:30 AM to 8:59 AM | 0 (0.0%) | 0 (0.0%) |
| 9:00 AM to 9:59 AM | 34 (6.9%) | 3 (0.8%) |
| 10:00 AM to 10:59 AM | 0 (0.0%) | 0 (0.0%) |
| 11:00 AM to 11:59 AM | 0 (0.0%) | 0 (0.0%) |
| 12:00 PM to 3:59 PM | 29 (5.9%) | 36 (9.4%) |
| 4:00 PM to 11:59 PM | 22 (4.5%) | 57 (14.8%) |
| Total | 491 (100.0%) | 384 (100.0%) |
Housing Occupancy in Chewelah
Occupancy by Ownership in Chewelah
Of the total 1,085 dwellings in Chewelah, owner-occupied units account for 742 (68.4%), while renter-occupied units make up 343 (31.6%).
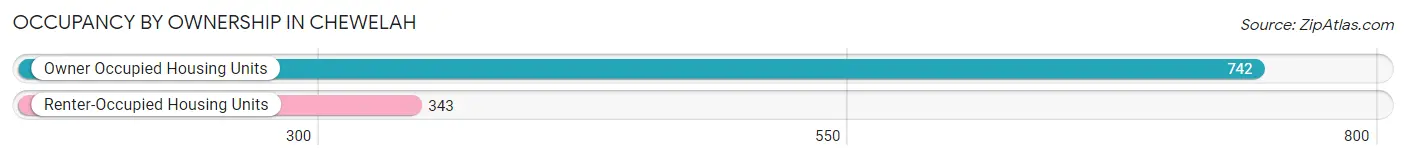
| Occupancy | # Housing Units | % Housing Units |
| Owner Occupied Housing Units | 742 | 68.4% |
| Renter-Occupied Housing Units | 343 | 31.6% |
| Total Occupied Housing Units | 1,085 | 100.0% |
Occupancy by Household Size in Chewelah
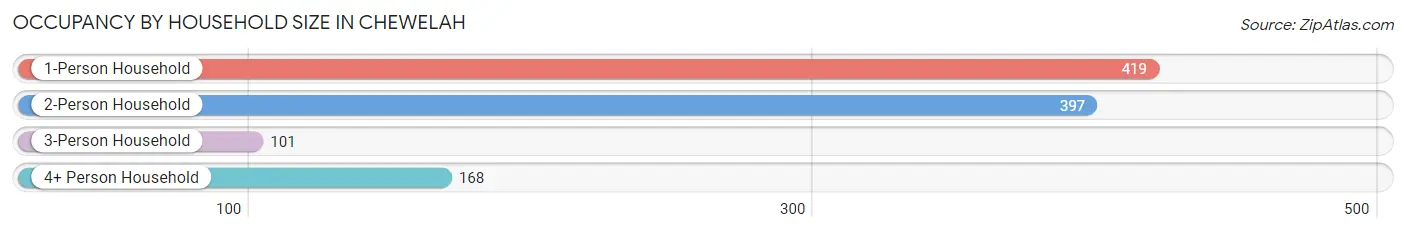
| Household Size | # Housing Units | % Housing Units |
| 1-Person Household | 419 | 38.6% |
| 2-Person Household | 397 | 36.6% |
| 3-Person Household | 101 | 9.3% |
| 4+ Person Household | 168 | 15.5% |
| Total Housing Units | 1,085 | 100.0% |
Occupancy by Ownership by Household Size in Chewelah
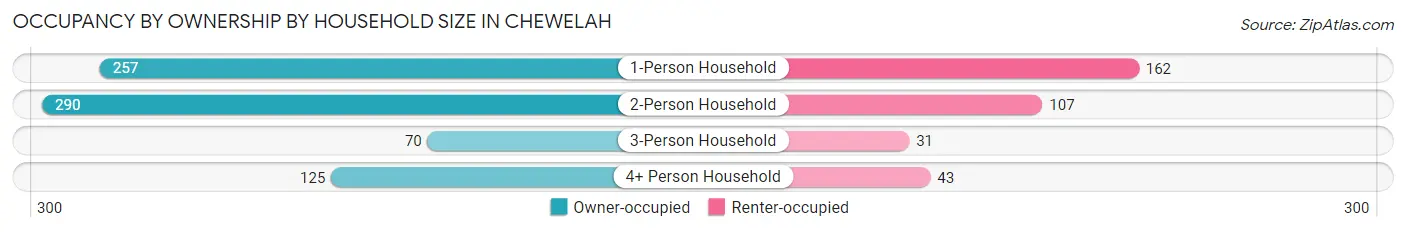
| Household Size | Owner-occupied | Renter-occupied |
| 1-Person Household | 257 (61.3%) | 162 (38.7%) |
| 2-Person Household | 290 (73.1%) | 107 (27.0%) |
| 3-Person Household | 70 (69.3%) | 31 (30.7%) |
| 4+ Person Household | 125 (74.4%) | 43 (25.6%) |
| Total Housing Units | 742 (68.4%) | 343 (31.6%) |
Occupancy by Educational Attainment in Chewelah
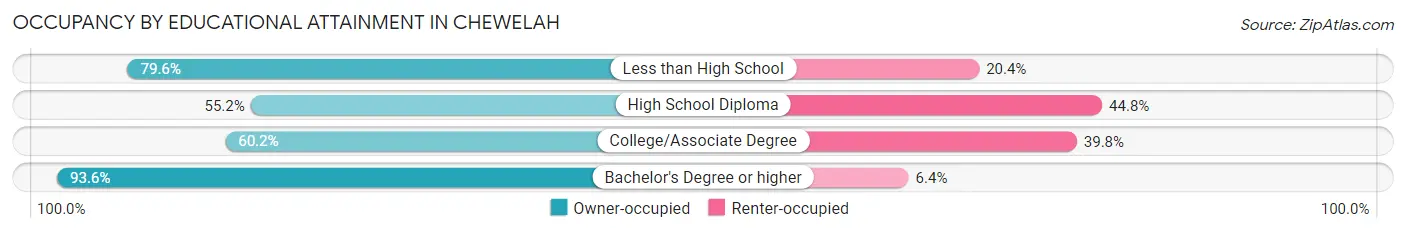
| Household Size | Owner-occupied | Renter-occupied |
| Less than High School | 74 (79.6%) | 19 (20.4%) |
| High School Diploma | 191 (55.2%) | 155 (44.8%) |
| College/Associate Degree | 230 (60.2%) | 152 (39.8%) |
| Bachelor's Degree or higher | 247 (93.6%) | 17 (6.4%) |
Occupancy by Age of Householder in Chewelah
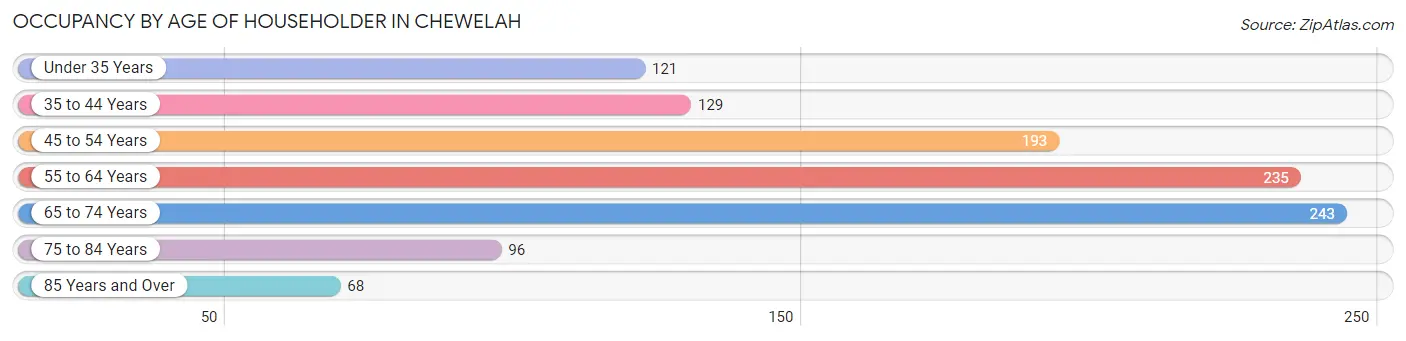
| Age Bracket | # Households | % Households |
| Under 35 Years | 121 | 11.2% |
| 35 to 44 Years | 129 | 11.9% |
| 45 to 54 Years | 193 | 17.8% |
| 55 to 64 Years | 235 | 21.7% |
| 65 to 74 Years | 243 | 22.4% |
| 75 to 84 Years | 96 | 8.8% |
| 85 Years and Over | 68 | 6.3% |
| Total | 1,085 | 100.0% |
Housing Finances in Chewelah
Median Income by Occupancy in Chewelah
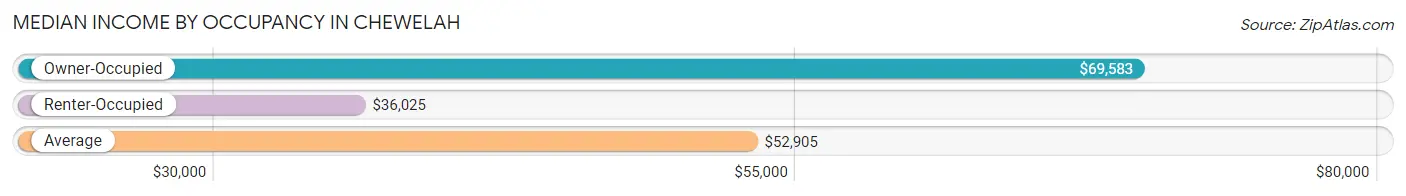
| Occupancy Type | # Households | Median Income |
| Owner-Occupied | 742 (68.4%) | $69,583 |
| Renter-Occupied | 343 (31.6%) | $36,025 |
| Average | 1,085 (100.0%) | $52,905 |
Occupancy by Householder Income Bracket in Chewelah
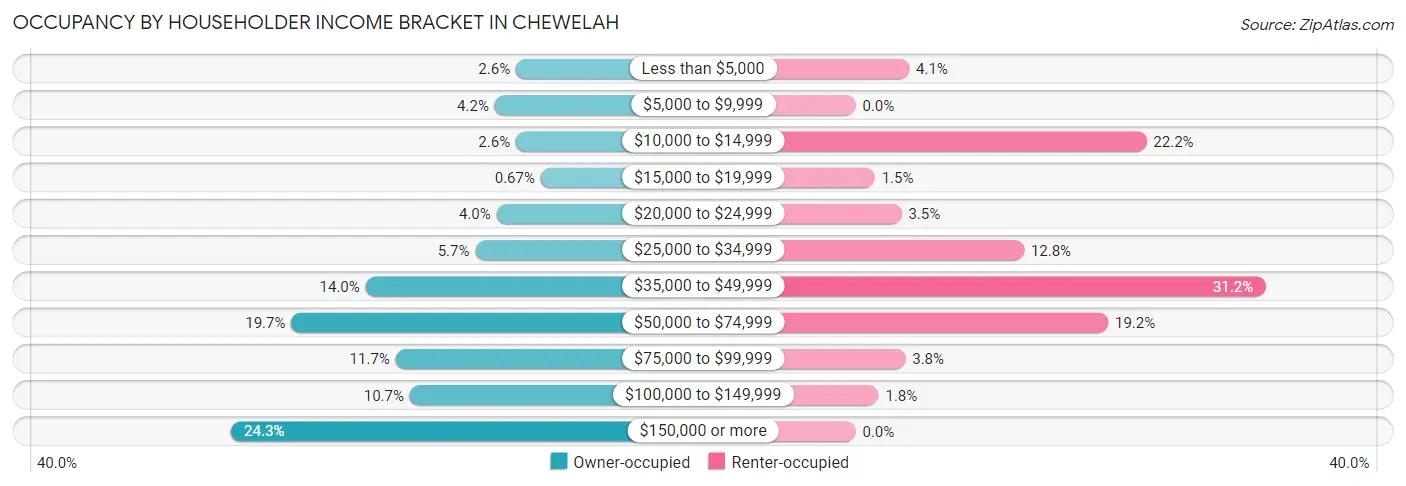
| Income Bracket | Owner-occupied | Renter-occupied |
| Less than $5,000 | 19 (2.6%) | 14 (4.1%) |
| $5,000 to $9,999 | 31 (4.2%) | 0 (0.0%) |
| $10,000 to $14,999 | 19 (2.6%) | 76 (22.2%) |
| $15,000 to $19,999 | 5 (0.7%) | 5 (1.5%) |
| $20,000 to $24,999 | 30 (4.0%) | 12 (3.5%) |
| $25,000 to $34,999 | 42 (5.7%) | 44 (12.8%) |
| $35,000 to $49,999 | 104 (14.0%) | 107 (31.2%) |
| $50,000 to $74,999 | 146 (19.7%) | 66 (19.2%) |
| $75,000 to $99,999 | 87 (11.7%) | 13 (3.8%) |
| $100,000 to $149,999 | 79 (10.6%) | 6 (1.8%) |
| $150,000 or more | 180 (24.3%) | 0 (0.0%) |
| Total | 742 (100.0%) | 343 (100.0%) |
Monthly Housing Cost Tiers in Chewelah
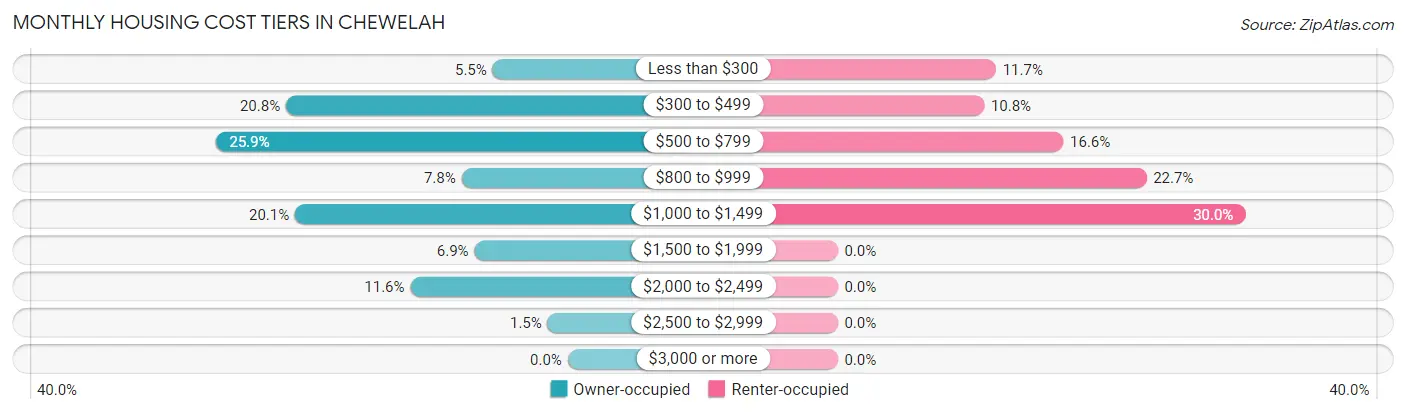
| Monthly Cost | Owner-occupied | Renter-occupied |
| Less than $300 | 41 (5.5%) | 40 (11.7%) |
| $300 to $499 | 154 (20.7%) | 37 (10.8%) |
| $500 to $799 | 192 (25.9%) | 57 (16.6%) |
| $800 to $999 | 58 (7.8%) | 78 (22.7%) |
| $1,000 to $1,499 | 149 (20.1%) | 103 (30.0%) |
| $1,500 to $1,999 | 51 (6.9%) | 0 (0.0%) |
| $2,000 to $2,499 | 86 (11.6%) | 0 (0.0%) |
| $2,500 to $2,999 | 11 (1.5%) | 0 (0.0%) |
| $3,000 or more | 0 (0.0%) | 0 (0.0%) |
| Total | 742 (100.0%) | 343 (100.0%) |
Physical Housing Characteristics in Chewelah
Housing Structures in Chewelah
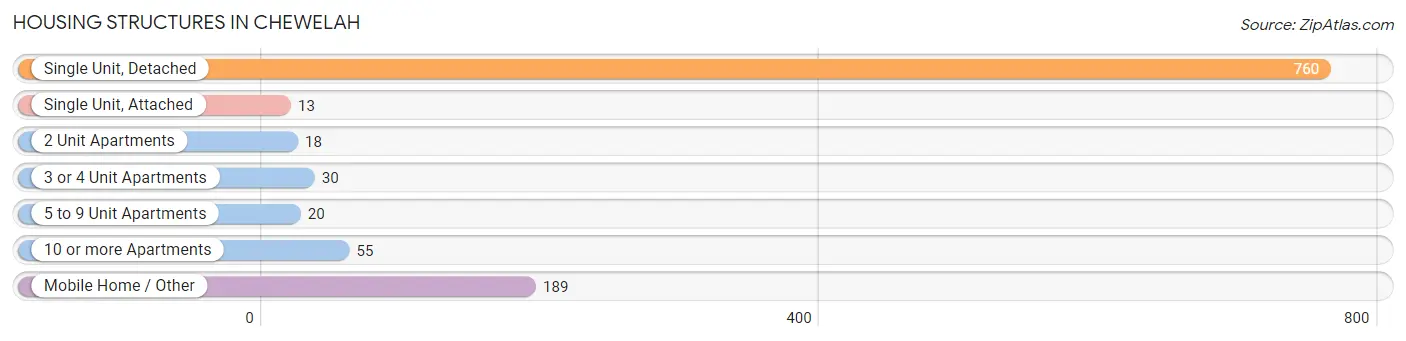
| Structure Type | # Housing Units | % Housing Units |
| Single Unit, Detached | 760 | 70.1% |
| Single Unit, Attached | 13 | 1.2% |
| 2 Unit Apartments | 18 | 1.7% |
| 3 or 4 Unit Apartments | 30 | 2.8% |
| 5 to 9 Unit Apartments | 20 | 1.8% |
| 10 or more Apartments | 55 | 5.1% |
| Mobile Home / Other | 189 | 17.4% |
| Total | 1,085 | 100.0% |
Housing Structures by Occupancy in Chewelah
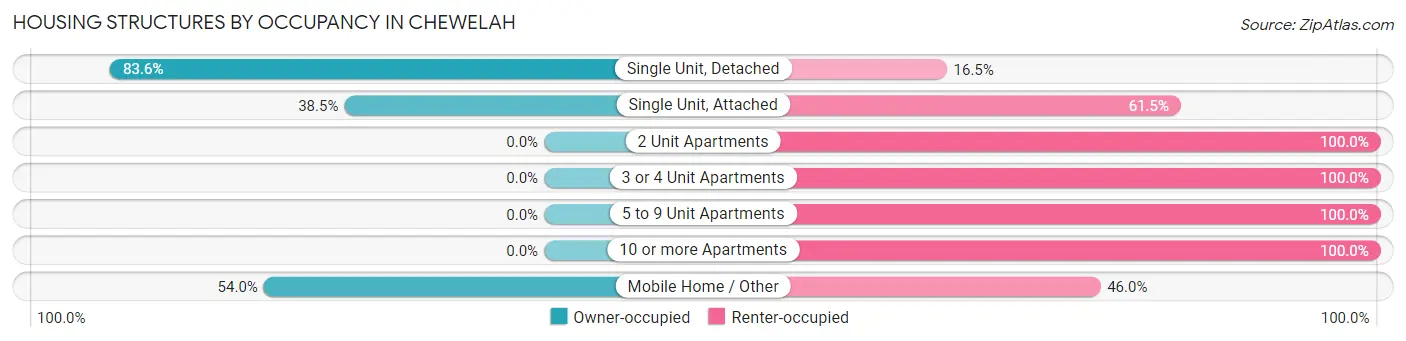
| Structure Type | Owner-occupied | Renter-occupied |
| Single Unit, Detached | 635 (83.6%) | 125 (16.5%) |
| Single Unit, Attached | 5 (38.5%) | 8 (61.5%) |
| 2 Unit Apartments | 0 (0.0%) | 18 (100.0%) |
| 3 or 4 Unit Apartments | 0 (0.0%) | 30 (100.0%) |
| 5 to 9 Unit Apartments | 0 (0.0%) | 20 (100.0%) |
| 10 or more Apartments | 0 (0.0%) | 55 (100.0%) |
| Mobile Home / Other | 102 (54.0%) | 87 (46.0%) |
| Total | 742 (68.4%) | 343 (31.6%) |
Housing Structures by Number of Rooms in Chewelah
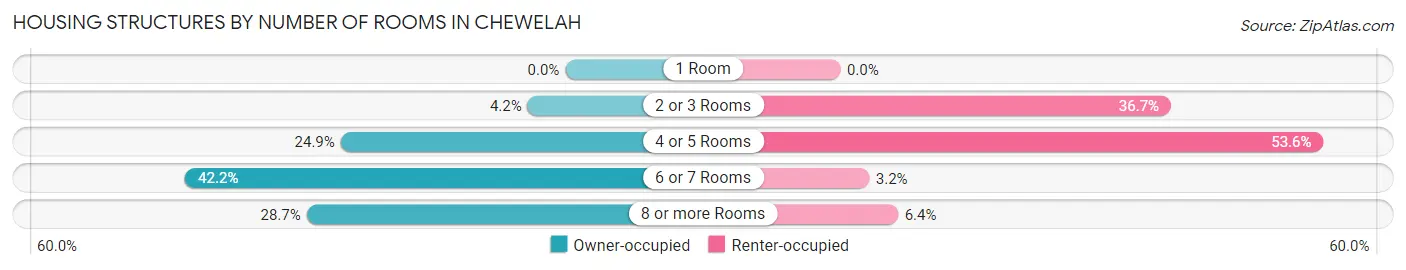
| Number of Rooms | Owner-occupied | Renter-occupied |
| 1 Room | 0 (0.0%) | 0 (0.0%) |
| 2 or 3 Rooms | 31 (4.2%) | 126 (36.7%) |
| 4 or 5 Rooms | 185 (24.9%) | 184 (53.6%) |
| 6 or 7 Rooms | 313 (42.2%) | 11 (3.2%) |
| 8 or more Rooms | 213 (28.7%) | 22 (6.4%) |
| Total | 742 (100.0%) | 343 (100.0%) |
Housing Structure by Heating Type in Chewelah
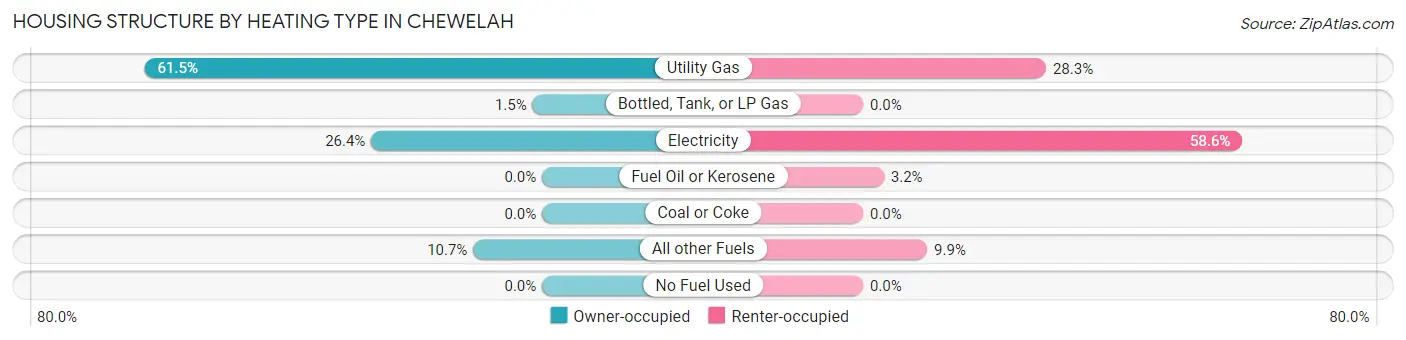
| Heating Type | Owner-occupied | Renter-occupied |
| Utility Gas | 456 (61.5%) | 97 (28.3%) |
| Bottled, Tank, or LP Gas | 11 (1.5%) | 0 (0.0%) |
| Electricity | 196 (26.4%) | 201 (58.6%) |
| Fuel Oil or Kerosene | 0 (0.0%) | 11 (3.2%) |
| Coal or Coke | 0 (0.0%) | 0 (0.0%) |
| All other Fuels | 79 (10.6%) | 34 (9.9%) |
| No Fuel Used | 0 (0.0%) | 0 (0.0%) |
| Total | 742 (100.0%) | 343 (100.0%) |
Household Vehicle Usage in Chewelah
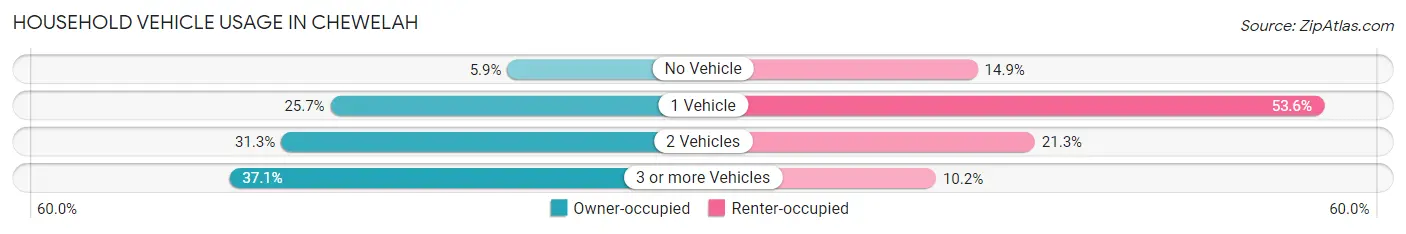
| Vehicles per Household | Owner-occupied | Renter-occupied |
| No Vehicle | 44 (5.9%) | 51 (14.9%) |
| 1 Vehicle | 191 (25.7%) | 184 (53.6%) |
| 2 Vehicles | 232 (31.3%) | 73 (21.3%) |
| 3 or more Vehicles | 275 (37.1%) | 35 (10.2%) |
| Total | 742 (100.0%) | 343 (100.0%) |
Real Estate & Mortgages in Chewelah
Real Estate and Mortgage Overview in Chewelah
| Characteristic | Without Mortgage | With Mortgage |
| Housing Units | 381 | 361 |
| Median Property Value | $184,900 | $263,600 |
| Median Household Income | $53,984 | $118 |
| Monthly Housing Costs | $493 | $0 |
| Real Estate Taxes | $1,233 | $0 |
Property Value by Mortgage Status in Chewelah
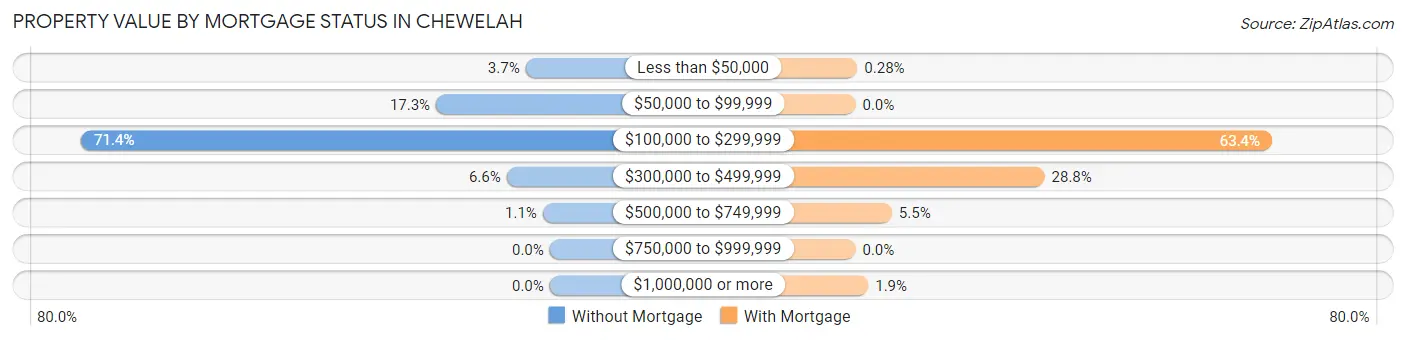
| Property Value | Without Mortgage | With Mortgage |
| Less than $50,000 | 14 (3.7%) | 1 (0.3%) |
| $50,000 to $99,999 | 66 (17.3%) | 0 (0.0%) |
| $100,000 to $299,999 | 272 (71.4%) | 229 (63.4%) |
| $300,000 to $499,999 | 25 (6.6%) | 104 (28.8%) |
| $500,000 to $749,999 | 4 (1.1%) | 20 (5.5%) |
| $750,000 to $999,999 | 0 (0.0%) | 0 (0.0%) |
| $1,000,000 or more | 0 (0.0%) | 7 (1.9%) |
| Total | 381 (100.0%) | 361 (100.0%) |
Household Income by Mortgage Status in Chewelah
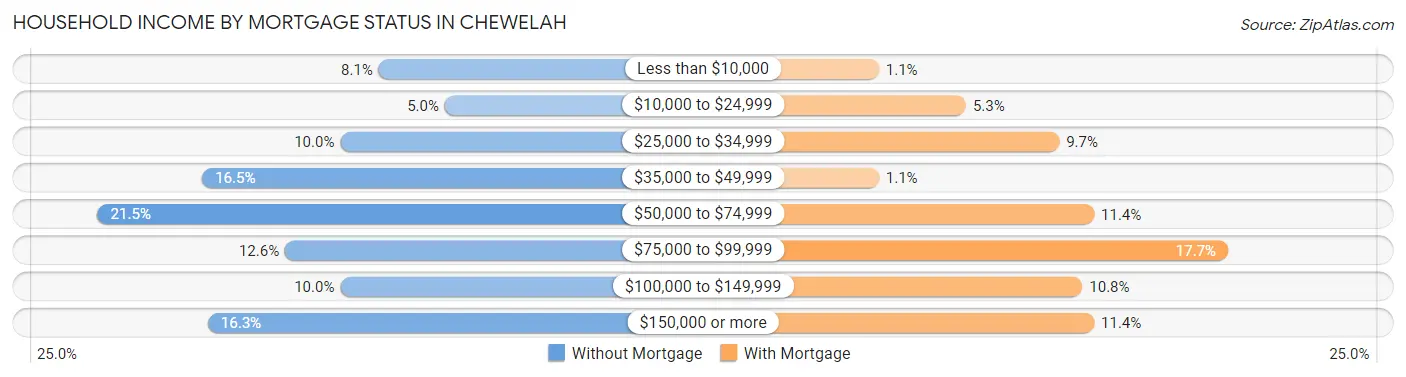
| Household Income | Without Mortgage | With Mortgage |
| Less than $10,000 | 31 (8.1%) | 4 (1.1%) |
| $10,000 to $24,999 | 19 (5.0%) | 19 (5.3%) |
| $25,000 to $34,999 | 38 (10.0%) | 35 (9.7%) |
| $35,000 to $49,999 | 63 (16.5%) | 4 (1.1%) |
| $50,000 to $74,999 | 82 (21.5%) | 41 (11.4%) |
| $75,000 to $99,999 | 48 (12.6%) | 64 (17.7%) |
| $100,000 to $149,999 | 38 (10.0%) | 39 (10.8%) |
| $150,000 or more | 62 (16.3%) | 41 (11.4%) |
| Total | 381 (100.0%) | 361 (100.0%) |
Property Value to Household Income Ratio in Chewelah
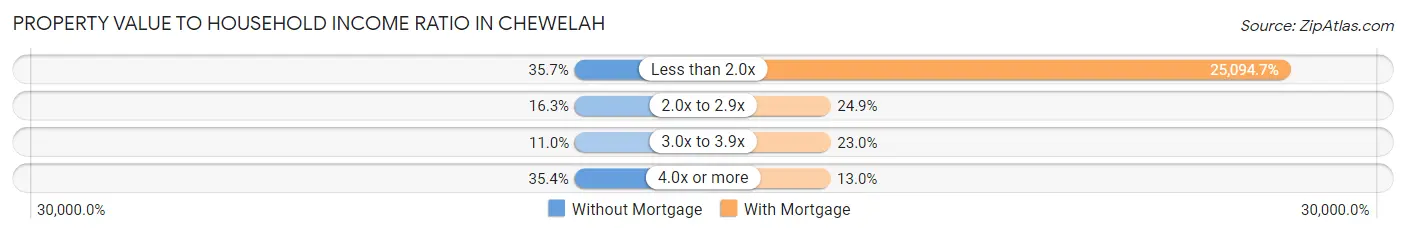
| Value-to-Income Ratio | Without Mortgage | With Mortgage |
| Less than 2.0x | 136 (35.7%) | 90,592 (25,094.7%) |
| 2.0x to 2.9x | 62 (16.3%) | 90 (24.9%) |
| 3.0x to 3.9x | 42 (11.0%) | 83 (23.0%) |
| 4.0x or more | 135 (35.4%) | 47 (13.0%) |
| Total | 381 (100.0%) | 361 (100.0%) |
Real Estate Taxes by Mortgage Status in Chewelah
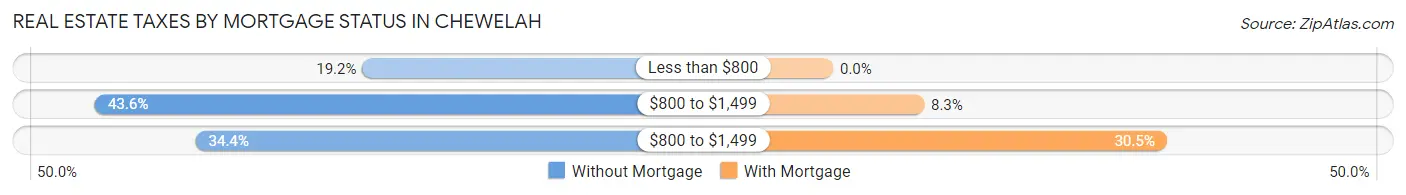
| Property Taxes | Without Mortgage | With Mortgage |
| Less than $800 | 73 (19.2%) | 0 (0.0%) |
| $800 to $1,499 | 166 (43.6%) | 30 (8.3%) |
| $800 to $1,499 | 131 (34.4%) | 110 (30.5%) |
| Total | 381 (100.0%) | 361 (100.0%) |
Health & Disability in Chewelah
Health Insurance Coverage by Age in Chewelah
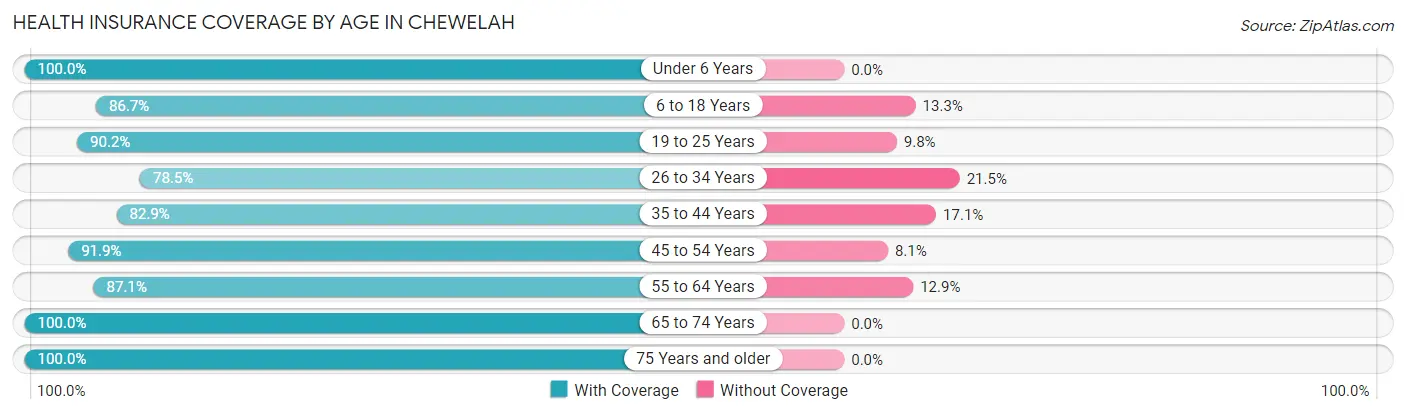
| Age Bracket | With Coverage | Without Coverage |
| Under 6 Years | 167 (100.0%) | 0 (0.0%) |
| 6 to 18 Years | 267 (86.7%) | 41 (13.3%) |
| 19 to 25 Years | 138 (90.2%) | 15 (9.8%) |
| 26 to 34 Years | 164 (78.5%) | 45 (21.5%) |
| 35 to 44 Years | 208 (82.9%) | 43 (17.1%) |
| 45 to 54 Years | 282 (91.9%) | 25 (8.1%) |
| 55 to 64 Years | 393 (87.1%) | 58 (12.9%) |
| 65 to 74 Years | 363 (100.0%) | 0 (0.0%) |
| 75 Years and older | 264 (100.0%) | 0 (0.0%) |
| Total | 2,246 (90.8%) | 227 (9.2%) |
Health Insurance Coverage by Citizenship Status in Chewelah
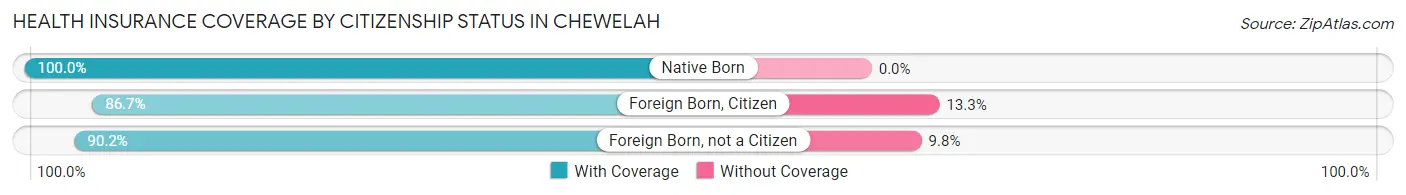
| Citizenship Status | With Coverage | Without Coverage |
| Native Born | 167 (100.0%) | 0 (0.0%) |
| Foreign Born, Citizen | 267 (86.7%) | 41 (13.3%) |
| Foreign Born, not a Citizen | 138 (90.2%) | 15 (9.8%) |
Health Insurance Coverage by Household Income in Chewelah
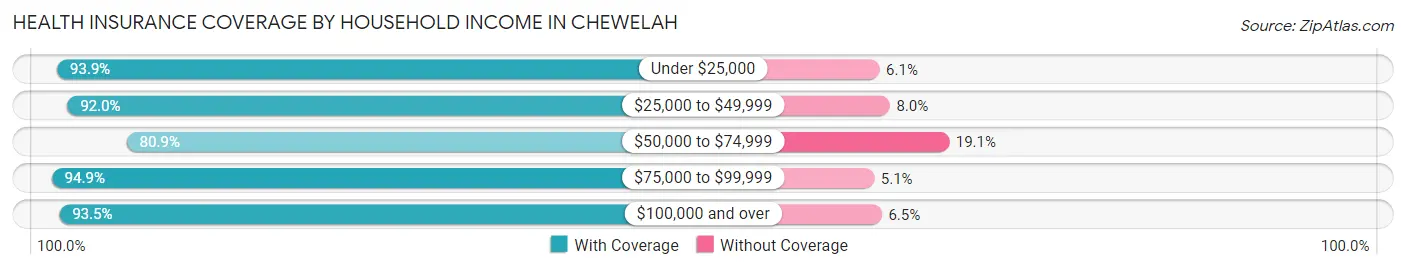
| Household Income | With Coverage | Without Coverage |
| Under $25,000 | 217 (93.9%) | 14 (6.1%) |
| $25,000 to $49,999 | 610 (92.0%) | 53 (8.0%) |
| $50,000 to $74,999 | 419 (80.9%) | 99 (19.1%) |
| $75,000 to $99,999 | 281 (94.9%) | 15 (5.1%) |
| $100,000 and over | 663 (93.5%) | 46 (6.5%) |
Public vs Private Health Insurance Coverage by Age in Chewelah
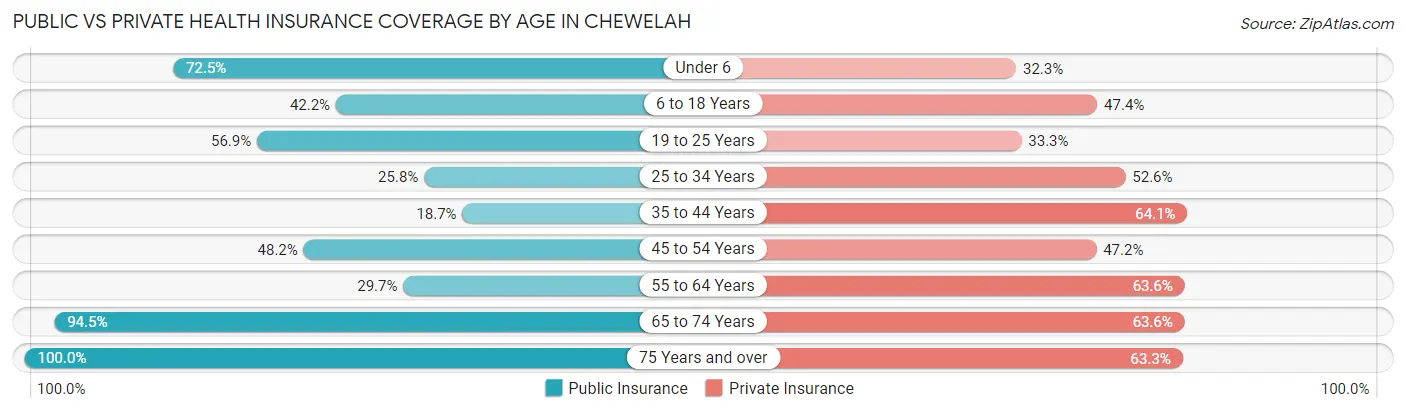
| Age Bracket | Public Insurance | Private Insurance |
| Under 6 | 121 (72.5%) | 54 (32.3%) |
| 6 to 18 Years | 130 (42.2%) | 146 (47.4%) |
| 19 to 25 Years | 87 (56.9%) | 51 (33.3%) |
| 25 to 34 Years | 54 (25.8%) | 110 (52.6%) |
| 35 to 44 Years | 47 (18.7%) | 161 (64.1%) |
| 45 to 54 Years | 148 (48.2%) | 145 (47.2%) |
| 55 to 64 Years | 134 (29.7%) | 287 (63.6%) |
| 65 to 74 Years | 343 (94.5%) | 231 (63.6%) |
| 75 Years and over | 264 (100.0%) | 167 (63.3%) |
| Total | 1,328 (53.7%) | 1,352 (54.7%) |
Disability Status by Sex by Age in Chewelah
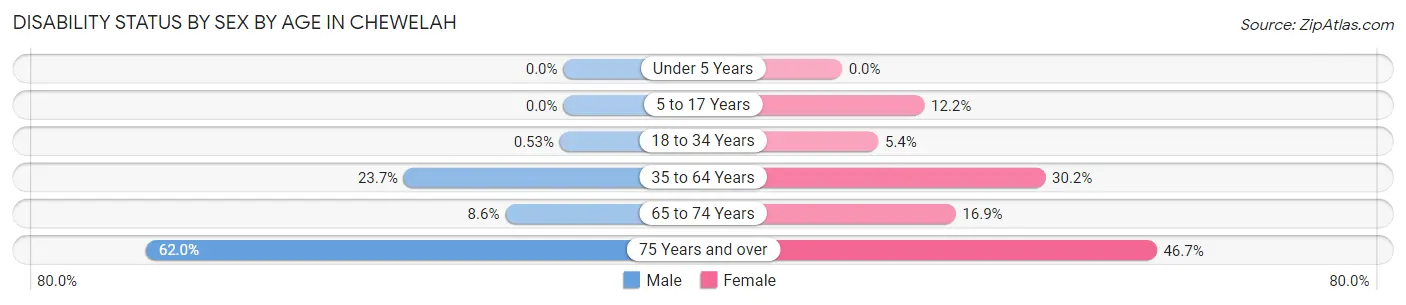
| Age Bracket | Male | Female |
| Under 5 Years | 0 (0.0%) | 0 (0.0%) |
| 5 to 17 Years | 0 (0.0%) | 22 (12.2%) |
| 18 to 34 Years | 1 (0.5%) | 10 (5.4%) |
| 35 to 64 Years | 111 (23.7%) | 163 (30.2%) |
| 65 to 74 Years | 17 (8.6%) | 28 (16.9%) |
| 75 Years and over | 31 (62.0%) | 100 (46.7%) |
Disability Class by Sex by Age in Chewelah
Disability Class: Hearing Difficulty
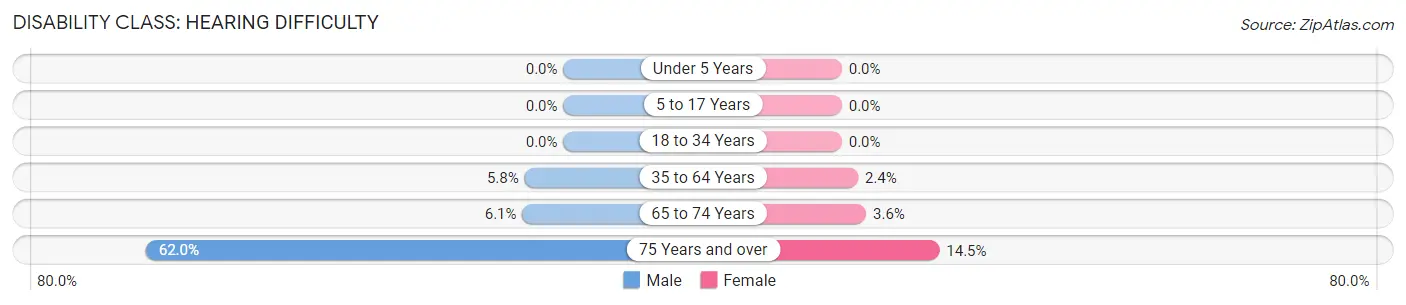
| Age Bracket | Male | Female |
| Under 5 Years | 0 (0.0%) | 0 (0.0%) |
| 5 to 17 Years | 0 (0.0%) | 0 (0.0%) |
| 18 to 34 Years | 0 (0.0%) | 0 (0.0%) |
| 35 to 64 Years | 27 (5.8%) | 13 (2.4%) |
| 65 to 74 Years | 12 (6.1%) | 6 (3.6%) |
| 75 Years and over | 31 (62.0%) | 31 (14.5%) |
Disability Class: Vision Difficulty
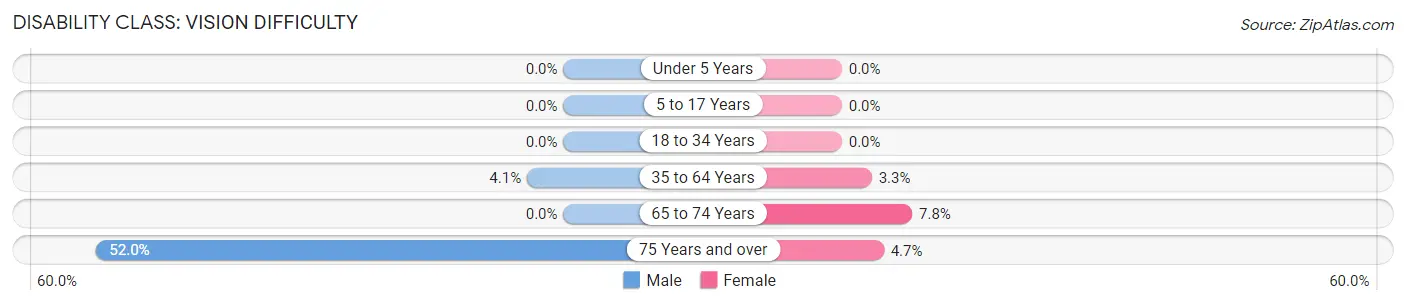
| Age Bracket | Male | Female |
| Under 5 Years | 0 (0.0%) | 0 (0.0%) |
| 5 to 17 Years | 0 (0.0%) | 0 (0.0%) |
| 18 to 34 Years | 0 (0.0%) | 0 (0.0%) |
| 35 to 64 Years | 19 (4.1%) | 18 (3.3%) |
| 65 to 74 Years | 0 (0.0%) | 13 (7.8%) |
| 75 Years and over | 26 (52.0%) | 10 (4.7%) |
Disability Class: Cognitive Difficulty
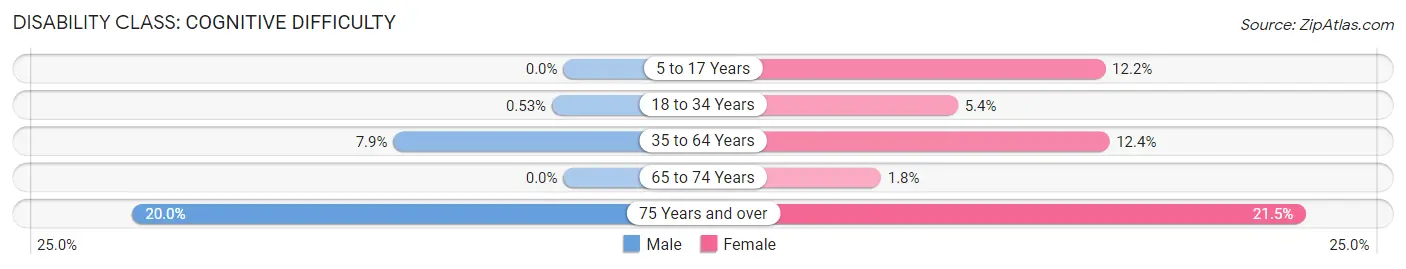
| Age Bracket | Male | Female |
| 5 to 17 Years | 0 (0.0%) | 22 (12.2%) |
| 18 to 34 Years | 1 (0.5%) | 10 (5.4%) |
| 35 to 64 Years | 37 (7.9%) | 67 (12.4%) |
| 65 to 74 Years | 0 (0.0%) | 3 (1.8%) |
| 75 Years and over | 10 (20.0%) | 46 (21.5%) |
Disability Class: Ambulatory Difficulty
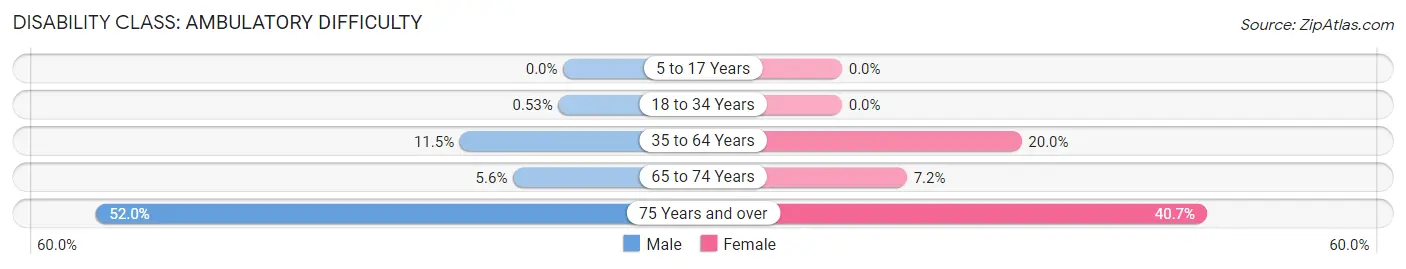
| Age Bracket | Male | Female |
| 5 to 17 Years | 0 (0.0%) | 0 (0.0%) |
| 18 to 34 Years | 1 (0.5%) | 0 (0.0%) |
| 35 to 64 Years | 54 (11.5%) | 108 (20.0%) |
| 65 to 74 Years | 11 (5.6%) | 12 (7.2%) |
| 75 Years and over | 26 (52.0%) | 87 (40.6%) |
Disability Class: Self-Care Difficulty
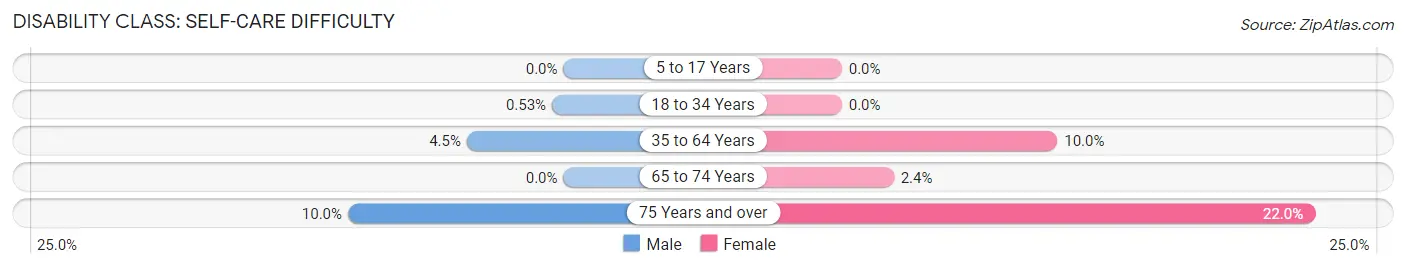
| Age Bracket | Male | Female |
| 5 to 17 Years | 0 (0.0%) | 0 (0.0%) |
| 18 to 34 Years | 1 (0.5%) | 0 (0.0%) |
| 35 to 64 Years | 21 (4.5%) | 54 (10.0%) |
| 65 to 74 Years | 0 (0.0%) | 4 (2.4%) |
| 75 Years and over | 5 (10.0%) | 47 (22.0%) |
Technology Access in Chewelah
Computing Device Access in Chewelah
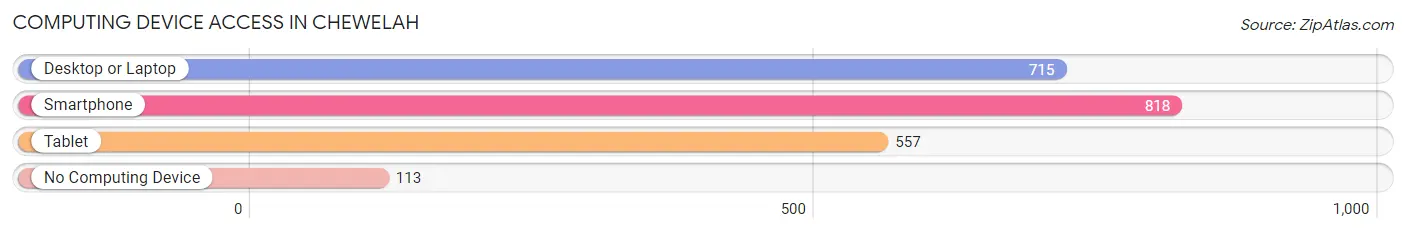
| Device Type | # Households | % Households |
| Desktop or Laptop | 715 | 65.9% |
| Smartphone | 818 | 75.4% |
| Tablet | 557 | 51.3% |
| No Computing Device | 113 | 10.4% |
| Total | 1,085 | 100.0% |
Internet Access in Chewelah
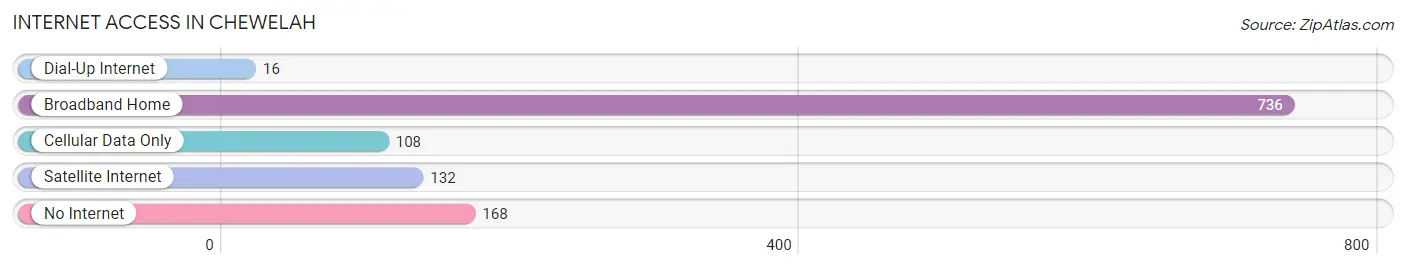
| Internet Type | # Households | % Households |
| Dial-Up Internet | 16 | 1.5% |
| Broadband Home | 736 | 67.8% |
| Cellular Data Only | 108 | 10.0% |
| Satellite Internet | 132 | 12.2% |
| No Internet | 168 | 15.5% |
| Total | 1,085 | 100.0% |
Chewelah Summary
Chewelah is a small city located in Stevens County, Washington, United States. The population was 2,605 at the 2010 census. It is the county seat of Stevens County. Chewelah is located in the northeast corner of the state, approximately 50 miles north of Spokane.
History
The area around Chewelah was first inhabited by the Spokane tribe of Native Americans. The first white settlers arrived in the area in the late 1800s. The town was officially founded in 1883 and was named after the Chewelah tribe of Native Americans. The town was originally a mining town, but it soon became a farming and logging community.
The town was incorporated in 1891 and the first mayor was elected in 1892. The town grew rapidly in the early 1900s, and by 1910 the population had reached 1,000. The town continued to grow throughout the 20th century, and by 2000 the population had reached 2,605.
Geography
Chewelah is located at 48°17′N 117°45′W (48.28, -117.75). According to the United States Census Bureau, the city has a total area of 2.2 square miles (5.7 km2), all of it land.
The city is located in the northeast corner of Washington, approximately 50 miles north of Spokane. The city is surrounded by rolling hills and is situated in a valley. The nearby Colville National Forest provides a variety of outdoor activities, including camping, hiking, fishing, and hunting.
Economy
Chewelah’s economy is largely based on agriculture and timber. The city is home to several large farms, as well as several small family-owned farms. The city is also home to several timber companies, which provide jobs for many of the city’s residents.
The city is also home to several small businesses, including restaurants, retail stores, and service providers. The city is also home to several manufacturing companies, including a furniture manufacturer and a metal fabrication company.
Demographics
As of the 2010 census, there were 2,605 people, 1,093 households, and 690 families residing in the city. The population density was 1,170.2 people per square mile (451.7/km2). There were 1,193 housing units at an average density of 537.2 per square mile (207.3/km2). The racial makeup of the city was 94.2% White, 0.2% African American, 1.2% Native American, 0.4% Asian, 0.1% Pacific Islander, 1.2% from other races, and 2.7% from two or more races. Hispanic or Latino of any race were 3.7% of the population.
There were 1,093 households, out of which 28.2% had children under the age of 18 living with them, 48.2% were married couples living together, 11.2% had a female householder with no husband present, and 36.2% were non-families. 30.7% of all households were made up of individuals, and 14.2% had someone living alone who was 65 years of age or older. The average household size was 2.37 and the average family size was 2.94.
In the city, the population was spread out, with 24.7% under the age of 18, 8.2% from 18 to 24, 24.2% from 25 to 44, 25.2% from 45 to 64, and 17.7% who were 65 years of age or older. The median age was 40 years. For every 100 females, there were 92.2 males. For every 100 females age 18 and over, there were 88.2 males.
The median income for a household in the city was $30,938, and the median income for a family was $37,917. Males had a median income of $30,000 versus $21,250 for females. The per capita income for the city was $16,845. About 11.2% of families and 14.2% of the population were below the poverty line, including 19.2% of those under age 18 and 8.2% of those age 65 or over.
Common Questions
What is Per Capita Income in Chewelah?
Per Capita income in Chewelah is $32,235.
What is the Median Family Income in Chewelah?
Median Family Income in Chewelah is $83,125.
What is the Median Household income in Chewelah?
Median Household Income in Chewelah is $52,905.
What is Income or Wage Gap in Chewelah?
Income or Wage Gap in Chewelah is 42.2%.
Women in Chewelah earn 57.8 cents for every dollar earned by a man.
What is Inequality or Gini Index in Chewelah?
Inequality or Gini Index in Chewelah is 0.43.
What is the Total Population of Chewelah?
Total Population of Chewelah is 2,508.
What is the Total Male Population of Chewelah?
Total Male Population of Chewelah is 1,119.
What is the Total Female Population of Chewelah?
Total Female Population of Chewelah is 1,389.
What is the Ratio of Males per 100 Females in Chewelah?
There are 80.56 Males per 100 Females in Chewelah.
What is the Ratio of Females per 100 Males in Chewelah?
There are 124.13 Females per 100 Males in Chewelah.
What is the Median Population Age in Chewelah?
Median Population Age in Chewelah is 49.0 Years.
What is the Average Family Size in Chewelah
Average Family Size in Chewelah is 2.9 People.
What is the Average Household Size in Chewelah
Average Household Size in Chewelah is 2.2 People.
How Large is the Labor Force in Chewelah?
There are 1,065 People in the Labor Forcein in Chewelah.
What is the Percentage of People in the Labor Force in Chewelah?
50.4% of People are in the Labor Force in Chewelah.
What is the Unemployment Rate in Chewelah?
Unemployment Rate in Chewelah is 7.6%.