Port Angeles East, WA Map & Demographics
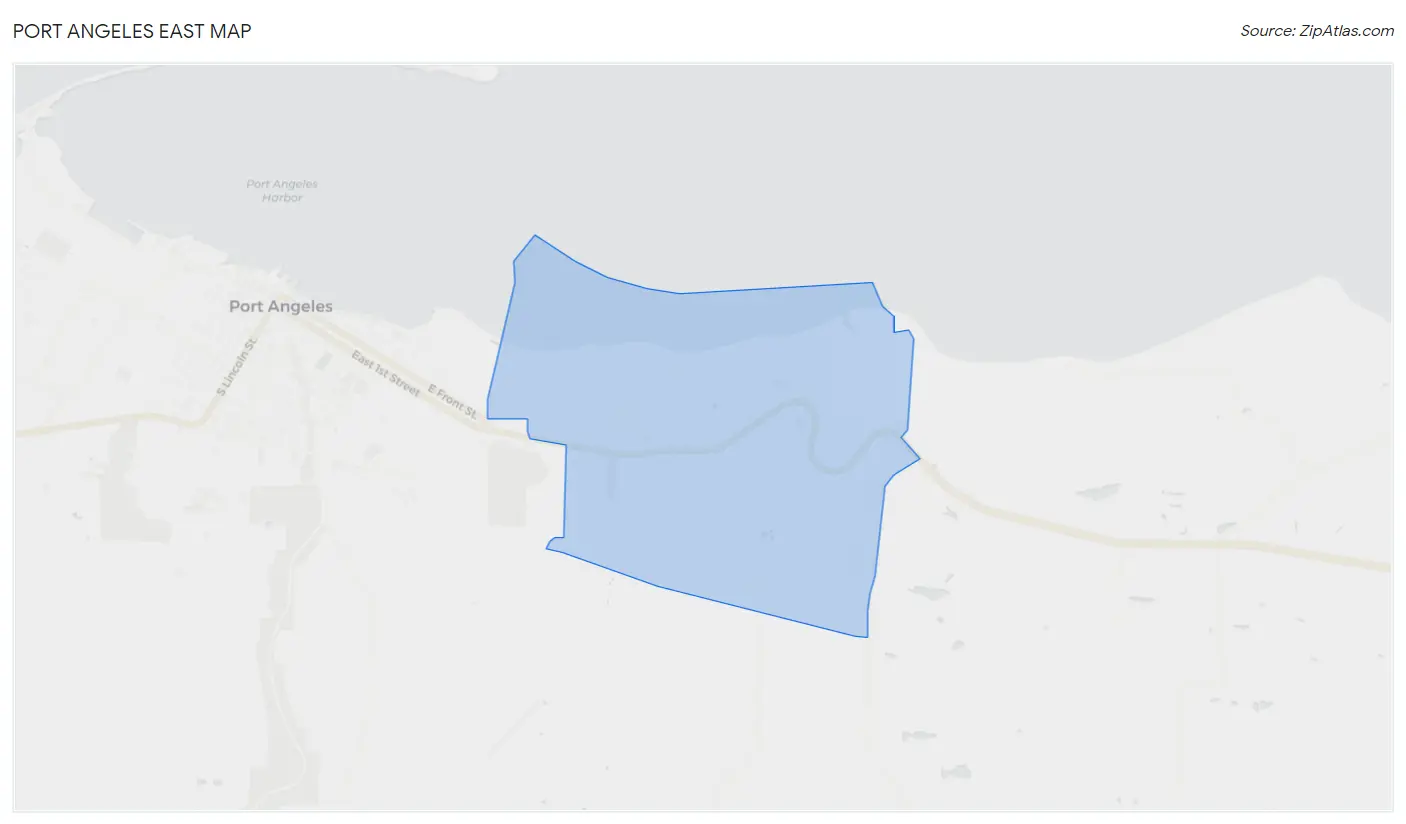
Port Angeles East Map
Port Angeles East Overview
$34,794
PER CAPITA INCOME
$83,242
AVG FAMILY INCOME
$60,417
AVG HOUSEHOLD INCOME
42.8%
WAGE / INCOME GAP [ % ]
57.2¢/ $1
WAGE / INCOME GAP [ $ ]
0.40
INEQUALITY / GINI INDEX
3,035
TOTAL POPULATION
1,550
MALE POPULATION
1,485
FEMALE POPULATION
104.38
MALES / 100 FEMALES
95.81
FEMALES / 100 MALES
45.9
MEDIAN AGE
2.8
AVG FAMILY SIZE
2.2
AVG HOUSEHOLD SIZE
1,401
LABOR FORCE [ PEOPLE ]
54.3%
PERCENT IN LABOR FORCE
3.6%
UNEMPLOYMENT RATE
Income in Port Angeles East
Income Overview in Port Angeles East
Per Capita Income in Port Angeles East is $34,794, while median incomes of families and households are $83,242 and $60,417 respectively.
| Characteristic | Number | Measure |
| Per Capita Income | 3,035 | $34,794 |
| Median Family Income | 835 | $83,242 |
| Mean Family Income | 835 | $92,536 |
| Median Household Income | 1,370 | $60,417 |
| Mean Household Income | 1,370 | $76,766 |
| Income Deficit | 835 | $0 |
| Wage / Income Gap (%) | 3,035 | 42.78% |
| Wage / Income Gap ($) | 3,035 | 57.22¢ per $1 |
| Gini / Inequality Index | 3,035 | 0.40 |
Earnings by Sex in Port Angeles East
Average Earnings in Port Angeles East are $45,367, $54,125 for men and $30,972 for women, a difference of 42.8%.
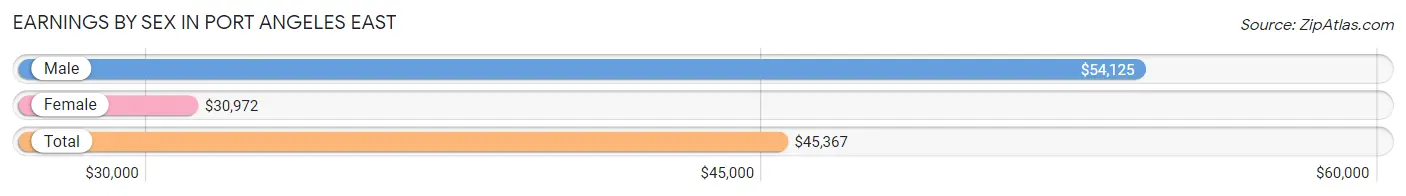
| Sex | Number | Average Earnings |
| Male | 819 (57.3%) | $54,125 |
| Female | 611 (42.7%) | $30,972 |
| Total | 1,430 (100.0%) | $45,367 |
Earnings by Sex by Income Bracket in Port Angeles East
The most common earnings brackets in Port Angeles East are $35,000 to $39,999 for men (134 | 16.4%) and $45,000 to $49,999 for women (87 | 14.2%).
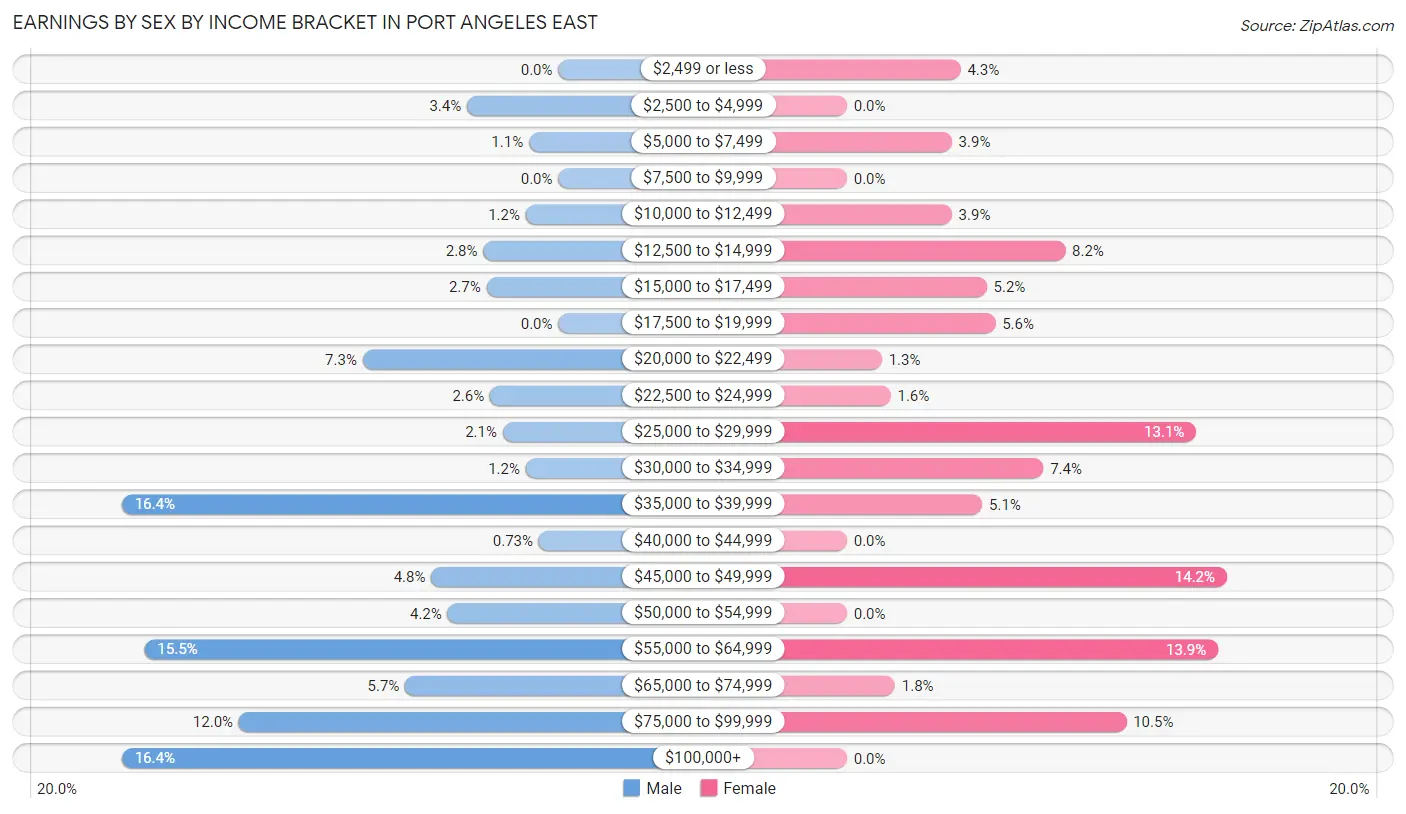
| Income | Male | Female |
| $2,499 or less | 0 (0.0%) | 26 (4.3%) |
| $2,500 to $4,999 | 28 (3.4%) | 0 (0.0%) |
| $5,000 to $7,499 | 9 (1.1%) | 24 (3.9%) |
| $7,500 to $9,999 | 0 (0.0%) | 0 (0.0%) |
| $10,000 to $12,499 | 10 (1.2%) | 24 (3.9%) |
| $12,500 to $14,999 | 23 (2.8%) | 50 (8.2%) |
| $15,000 to $17,499 | 22 (2.7%) | 32 (5.2%) |
| $17,500 to $19,999 | 0 (0.0%) | 34 (5.6%) |
| $20,000 to $22,499 | 60 (7.3%) | 8 (1.3%) |
| $22,500 to $24,999 | 21 (2.6%) | 10 (1.6%) |
| $25,000 to $29,999 | 17 (2.1%) | 80 (13.1%) |
| $30,000 to $34,999 | 10 (1.2%) | 45 (7.4%) |
| $35,000 to $39,999 | 134 (16.4%) | 31 (5.1%) |
| $40,000 to $44,999 | 6 (0.7%) | 0 (0.0%) |
| $45,000 to $49,999 | 39 (4.8%) | 87 (14.2%) |
| $50,000 to $54,999 | 34 (4.2%) | 0 (0.0%) |
| $55,000 to $64,999 | 127 (15.5%) | 85 (13.9%) |
| $65,000 to $74,999 | 47 (5.7%) | 11 (1.8%) |
| $75,000 to $99,999 | 98 (12.0%) | 64 (10.5%) |
| $100,000+ | 134 (16.4%) | 0 (0.0%) |
| Total | 819 (100.0%) | 611 (100.0%) |
Earnings by Sex by Educational Attainment in Port Angeles East
Average earnings in Port Angeles East are $55,213 for men and $32,250 for women, a difference of 41.6%. Men with an educational attainment of high school diploma enjoy the highest average annual earnings of $56,940, while those with less than high school education earn the least with $22,375. Women with an educational attainment of high school diploma earn the most with the average annual earnings of $45,795, while those with bachelor's degree education have the smallest earnings of $28,654.
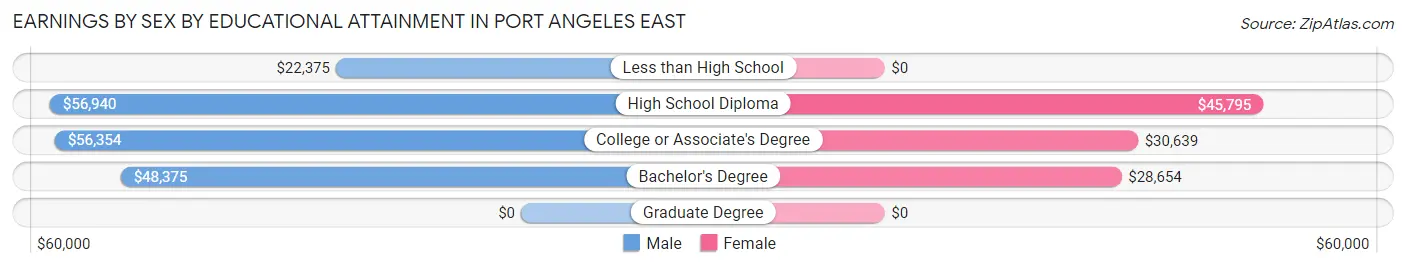
| Educational Attainment | Male Income | Female Income |
| Less than High School | $22,375 | $0 |
| High School Diploma | $56,940 | $45,795 |
| College or Associate's Degree | $56,354 | $30,639 |
| Bachelor's Degree | $48,375 | $28,654 |
| Graduate Degree | - | - |
| Total | $55,213 | $32,250 |
Family Income in Port Angeles East
Family Income Brackets in Port Angeles East
According to the Port Angeles East family income data, there are 205 families falling into the $100,000 to $149,999 income range, which is the most common income bracket and makes up 24.5% of all families.
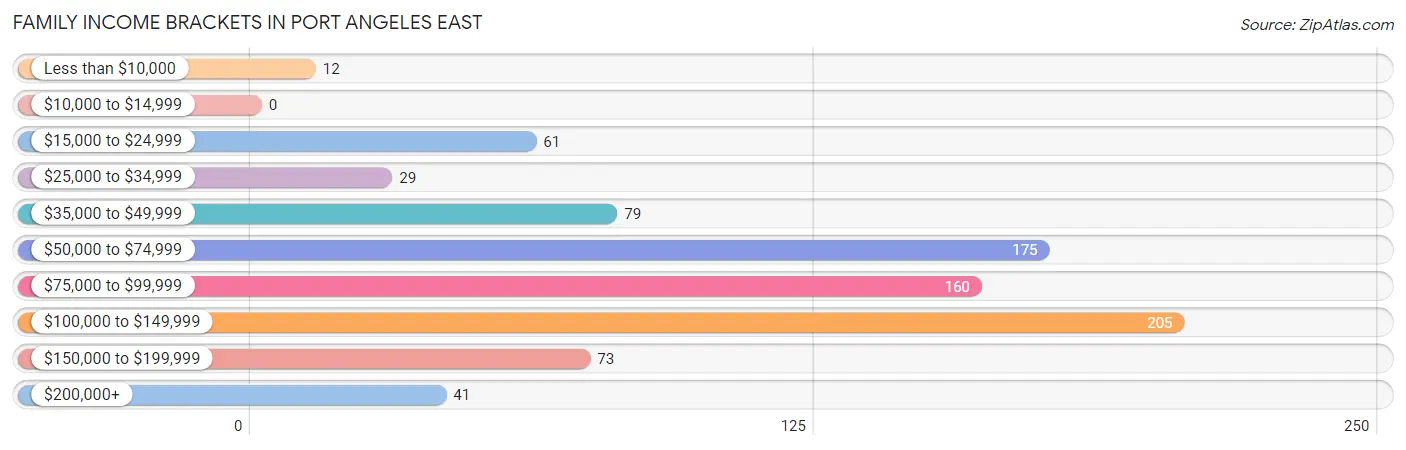
| Income Bracket | # Families | % Families |
| Less than $10,000 | 12 | 1.4% |
| $10,000 to $14,999 | 0 | 0.0% |
| $15,000 to $24,999 | 61 | 7.3% |
| $25,000 to $34,999 | 29 | 3.5% |
| $35,000 to $49,999 | 79 | 9.5% |
| $50,000 to $74,999 | 175 | 21.0% |
| $75,000 to $99,999 | 160 | 19.2% |
| $100,000 to $149,999 | 205 | 24.6% |
| $150,000 to $199,999 | 73 | 8.7% |
| $200,000+ | 41 | 4.9% |
Family Income by Famaliy Size in Port Angeles East
5-person families (82 | 9.8%) account for the highest median family income in Port Angeles East with $145,365 per family, while 2-person families (540 | 64.7%) have the highest median income of $29,837 per family member.
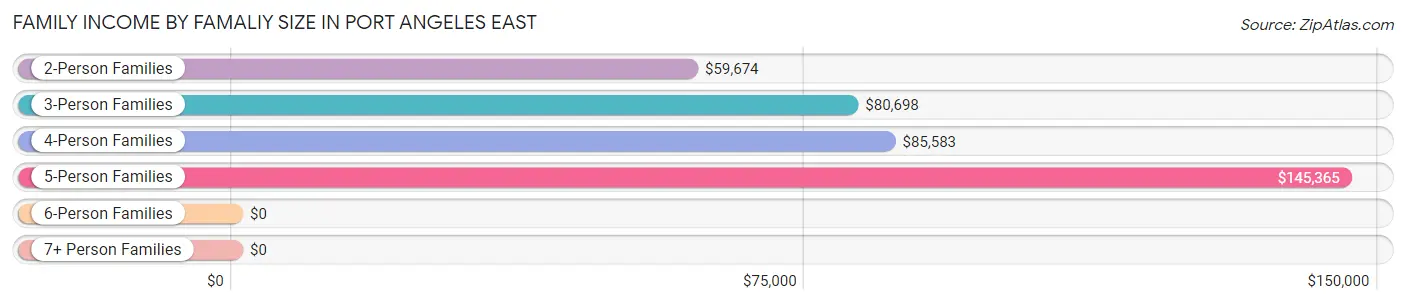
| Income Bracket | # Families | Median Income |
| 2-Person Families | 540 (64.7%) | $59,674 |
| 3-Person Families | 132 (15.8%) | $80,698 |
| 4-Person Families | 65 (7.8%) | $85,583 |
| 5-Person Families | 82 (9.8%) | $145,365 |
| 6-Person Families | 16 (1.9%) | $0 |
| 7+ Person Families | 0 (0.0%) | $0 |
| Total | 835 (100.0%) | $83,242 |
Family Income by Number of Earners in Port Angeles East
The median family income in Port Angeles East is $83,242, with families comprising 3+ earners (39) having the highest median family income of $125,875, while families with no earners (202) have the lowest median family income of $47,500, accounting for 4.7% and 24.2% of families, respectively.
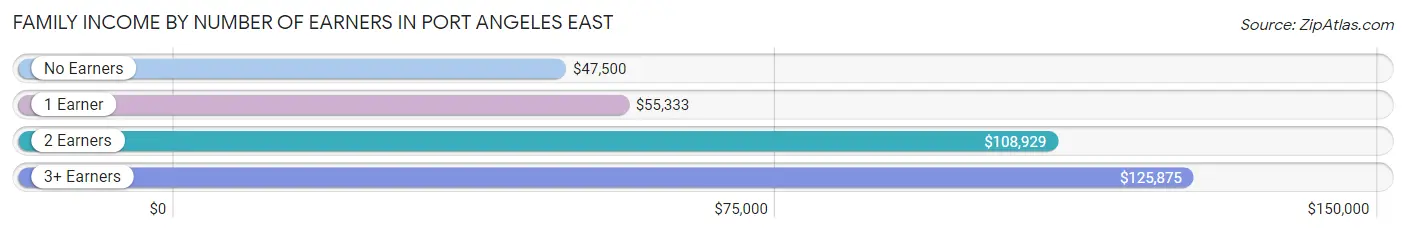
| Number of Earners | # Families | Median Income |
| No Earners | 202 (24.2%) | $47,500 |
| 1 Earner | 338 (40.5%) | $55,333 |
| 2 Earners | 256 (30.7%) | $108,929 |
| 3+ Earners | 39 (4.7%) | $125,875 |
| Total | 835 (100.0%) | $83,242 |
Household Income in Port Angeles East
Household Income Brackets in Port Angeles East
With 249 households falling in the category, the $100,000 to $149,999 income range is the most frequent in Port Angeles East, accounting for 18.2% of all households. In contrast, only 36 households (2.6%) fall into the $10,000 to $14,999 income bracket, making it the least populous group.
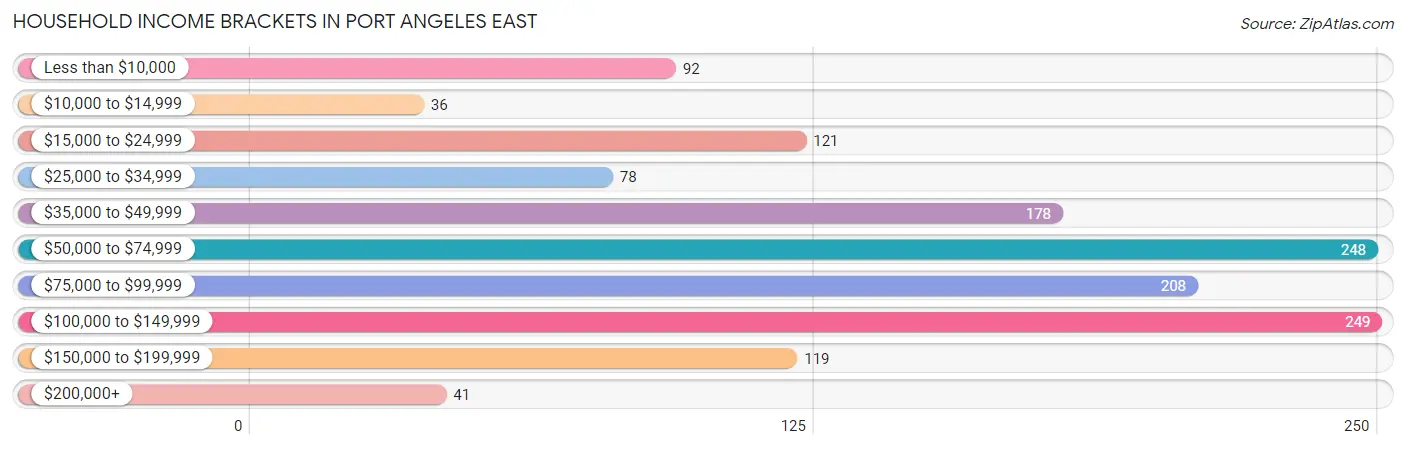
| Income Bracket | # Households | % Households |
| Less than $10,000 | 92 | 6.7% |
| $10,000 to $14,999 | 36 | 2.6% |
| $15,000 to $24,999 | 121 | 8.8% |
| $25,000 to $34,999 | 78 | 5.7% |
| $35,000 to $49,999 | 178 | 13.0% |
| $50,000 to $74,999 | 248 | 18.1% |
| $75,000 to $99,999 | 208 | 15.2% |
| $100,000 to $149,999 | 249 | 18.2% |
| $150,000 to $199,999 | 119 | 8.7% |
| $200,000+ | 41 | 3.0% |
Household Income by Householder Age in Port Angeles East
The median household income in Port Angeles East is $60,417, with the highest median household income of $104,015 found in the 25 to 44 years age bracket for the primary householder. A total of 378 households (27.6%) fall into this category. Meanwhile, the 15 to 24 years age bracket for the primary householder has the lowest median household income of $0, with 25 households (1.8%) in this group.
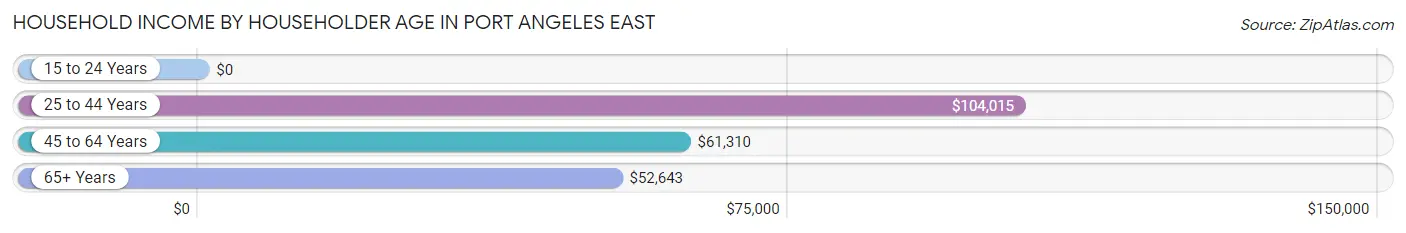
| Income Bracket | # Households | Median Income |
| 15 to 24 Years | 25 (1.8%) | $0 |
| 25 to 44 Years | 378 (27.6%) | $104,015 |
| 45 to 64 Years | 454 (33.1%) | $61,310 |
| 65+ Years | 513 (37.4%) | $52,643 |
| Total | 1,370 (100.0%) | $60,417 |
Poverty in Port Angeles East
Income Below Poverty by Sex and Age in Port Angeles East
With 7.7% poverty level for males and 3.9% for females among the residents of Port Angeles East, 6 to 11 year old males and under 5 year old females are the most vulnerable to poverty, with 13 males (46.4%) and 15 females (23.8%) in their respective age groups living below the poverty level.
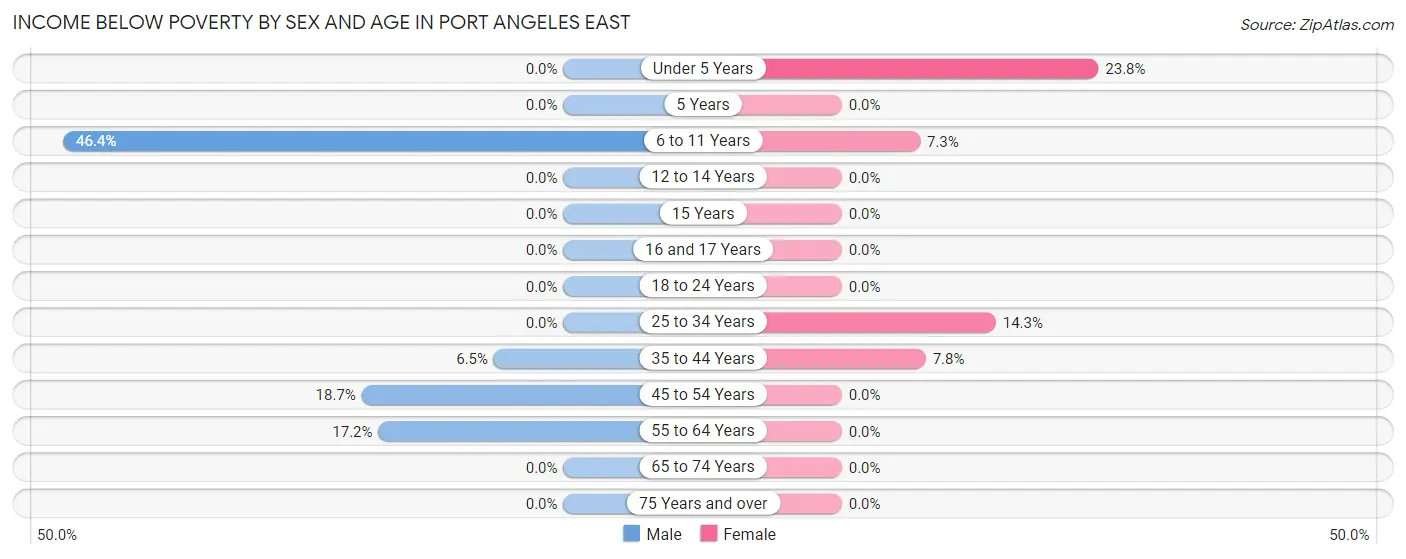
| Age Bracket | Male | Female |
| Under 5 Years | 0 (0.0%) | 15 (23.8%) |
| 5 Years | 0 (0.0%) | 0 (0.0%) |
| 6 to 11 Years | 13 (46.4%) | 9 (7.3%) |
| 12 to 14 Years | 0 (0.0%) | 0 (0.0%) |
| 15 Years | 0 (0.0%) | 0 (0.0%) |
| 16 and 17 Years | 0 (0.0%) | 0 (0.0%) |
| 18 to 24 Years | 0 (0.0%) | 0 (0.0%) |
| 25 to 34 Years | 0 (0.0%) | 22 (14.3%) |
| 35 to 44 Years | 28 (6.5%) | 12 (7.8%) |
| 45 to 54 Years | 44 (18.7%) | 0 (0.0%) |
| 55 to 64 Years | 34 (17.2%) | 0 (0.0%) |
| 65 to 74 Years | 0 (0.0%) | 0 (0.0%) |
| 75 Years and over | 0 (0.0%) | 0 (0.0%) |
| Total | 119 (7.7%) | 58 (3.9%) |
Income Above Poverty by Sex and Age in Port Angeles East
According to the poverty statistics in Port Angeles East, males aged under 5 years and females aged 5 years are the age groups that are most secure financially, with 100.0% of males and 100.0% of females in these age groups living above the poverty line.
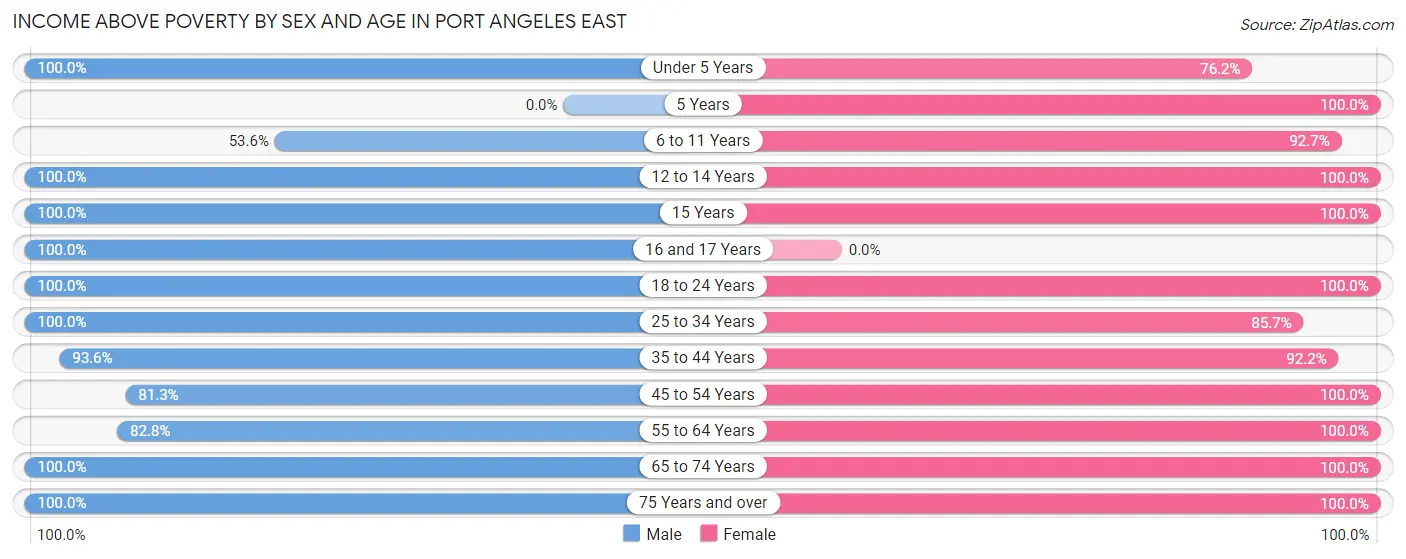
| Age Bracket | Male | Female |
| Under 5 Years | 97 (100.0%) | 48 (76.2%) |
| 5 Years | 0 (0.0%) | 13 (100.0%) |
| 6 to 11 Years | 15 (53.6%) | 115 (92.7%) |
| 12 to 14 Years | 34 (100.0%) | 42 (100.0%) |
| 15 Years | 14 (100.0%) | 40 (100.0%) |
| 16 and 17 Years | 18 (100.0%) | 0 (0.0%) |
| 18 to 24 Years | 24 (100.0%) | 70 (100.0%) |
| 25 to 34 Years | 134 (100.0%) | 132 (85.7%) |
| 35 to 44 Years | 406 (93.5%) | 142 (92.2%) |
| 45 to 54 Years | 191 (81.3%) | 201 (100.0%) |
| 55 to 64 Years | 164 (82.8%) | 187 (100.0%) |
| 65 to 74 Years | 262 (100.0%) | 237 (100.0%) |
| 75 Years and over | 72 (100.0%) | 200 (100.0%) |
| Total | 1,431 (92.3%) | 1,427 (96.1%) |
Income Below Poverty Among Married-Couple Families in Port Angeles East
| Children | Above Poverty | Below Poverty |
| No Children | 444 (100.0%) | 0 (0.0%) |
| 1 or 2 Children | 62 (100.0%) | 0 (0.0%) |
| 3 or 4 Children | 98 (100.0%) | 0 (0.0%) |
| 5 or more Children | 0 (0.0%) | 0 (0.0%) |
| Total | 604 (100.0%) | 0 (0.0%) |
Income Below Poverty Among Single-Parent Households in Port Angeles East
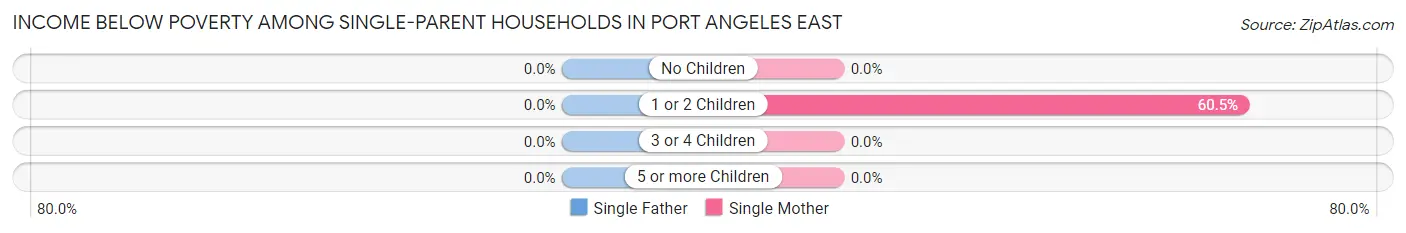
| Children | Single Father | Single Mother |
| No Children | 0 (0.0%) | 0 (0.0%) |
| 1 or 2 Children | 0 (0.0%) | 23 (60.5%) |
| 3 or 4 Children | 0 (0.0%) | 0 (0.0%) |
| 5 or more Children | 0 (0.0%) | 0 (0.0%) |
| Total | 0 (0.0%) | 23 (11.8%) |
Income Below Poverty Among Married-Couple vs Single-Parent Households in Port Angeles East
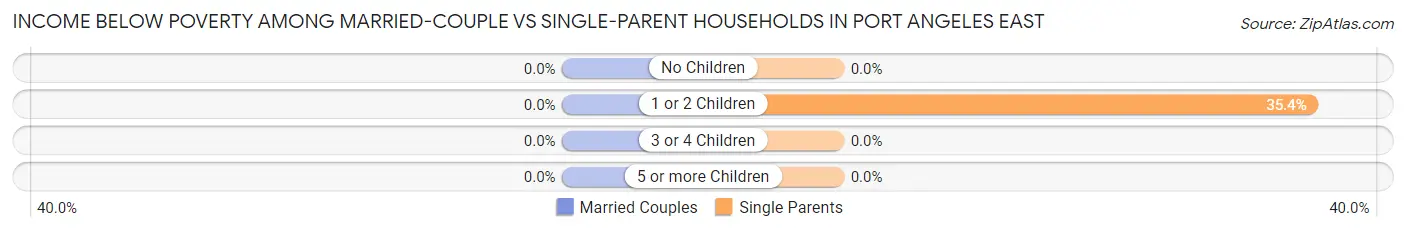
| Children | Married-Couple Families | Single-Parent Households |
| No Children | 0 (0.0%) | 0 (0.0%) |
| 1 or 2 Children | 0 (0.0%) | 23 (35.4%) |
| 3 or 4 Children | 0 (0.0%) | 0 (0.0%) |
| 5 or more Children | 0 (0.0%) | 0 (0.0%) |
| Total | 0 (0.0%) | 23 (10.0%) |
Race in Port Angeles East
The most populous races in Port Angeles East are White / Caucasian (2,668 | 87.9%), Two or more Races (326 | 10.7%), and Native / Alaskan (22 | 0.7%).
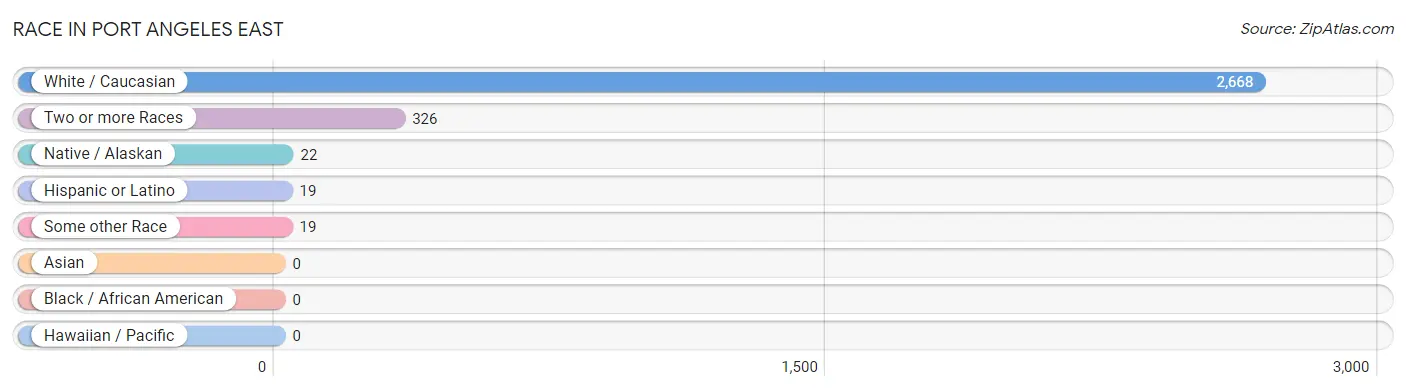
| Race | # Population | % Population |
| Asian | 0 | 0.0% |
| Black / African American | 0 | 0.0% |
| Hawaiian / Pacific | 0 | 0.0% |
| Hispanic or Latino | 19 | 0.6% |
| Native / Alaskan | 22 | 0.7% |
| White / Caucasian | 2,668 | 87.9% |
| Two or more Races | 326 | 10.7% |
| Some other Race | 19 | 0.6% |
| Total | 3,035 | 100.0% |
Ancestry in Port Angeles East
The most populous ancestries reported in Port Angeles East are English (793 | 26.1%), German (604 | 19.9%), Irish (445 | 14.7%), Swedish (292 | 9.6%), and American (204 | 6.7%), together accounting for 77.0% of all Port Angeles East residents.
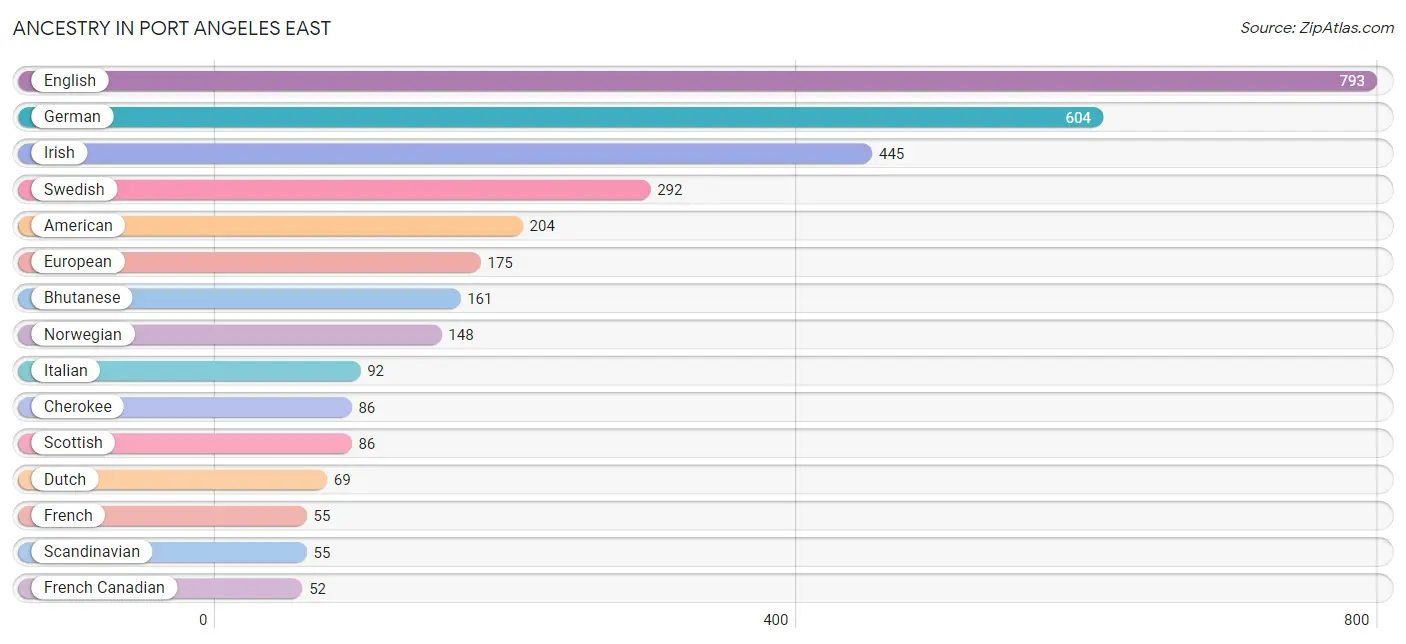
| Ancestry | # Population | % Population |
| American | 204 | 6.7% |
| Apache | 20 | 0.7% |
| Bhutanese | 161 | 5.3% |
| Cherokee | 86 | 2.8% |
| Croatian | 34 | 1.1% |
| Dutch | 69 | 2.3% |
| English | 793 | 26.1% |
| European | 175 | 5.8% |
| Finnish | 10 | 0.3% |
| French | 55 | 1.8% |
| French Canadian | 52 | 1.7% |
| German | 604 | 19.9% |
| Irish | 445 | 14.7% |
| Italian | 92 | 3.0% |
| Mexican | 19 | 0.6% |
| Norwegian | 148 | 4.9% |
| Pennsylvania German | 9 | 0.3% |
| Polish | 42 | 1.4% |
| Portuguese | 8 | 0.3% |
| Romanian | 40 | 1.3% |
| Russian | 30 | 1.0% |
| Scandinavian | 55 | 1.8% |
| Scotch-Irish | 9 | 0.3% |
| Scottish | 86 | 2.8% |
| Swedish | 292 | 9.6% |
| Swiss | 24 | 0.8% |
| Turkish | 25 | 0.8% |
| Ukrainian | 45 | 1.5% |
| Welsh | 18 | 0.6% | View All 29 Rows |
Immigrants in Port Angeles East
The most numerous immigrant groups reported in Port Angeles East came from Europe (27 | 0.9%), Germany (18 | 0.6%), Western Europe (18 | 0.6%), Canada (12 | 0.4%), and Northern Europe (9 | 0.3%), together accounting for 2.8% of all Port Angeles East residents.
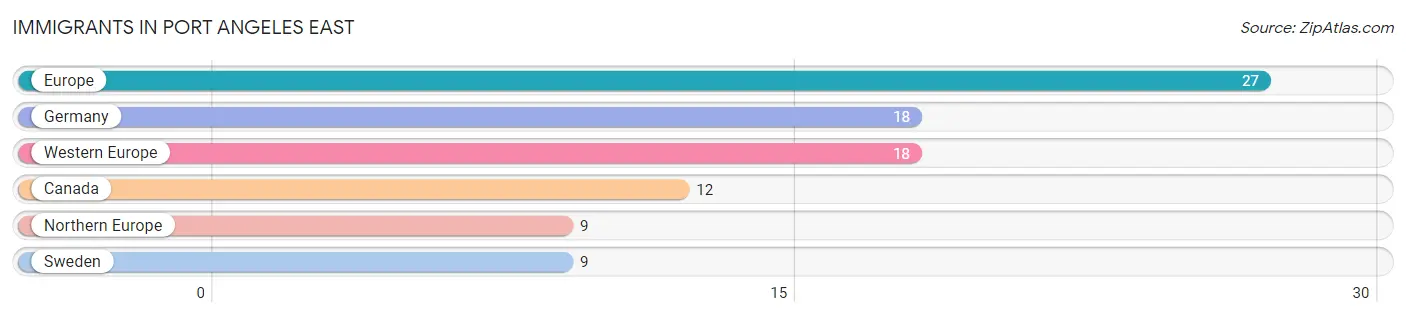
| Immigration Origin | # Population | % Population |
| Canada | 12 | 0.4% |
| Europe | 27 | 0.9% |
| Germany | 18 | 0.6% |
| Northern Europe | 9 | 0.3% |
| Sweden | 9 | 0.3% |
| Western Europe | 18 | 0.6% | View All 6 Rows |
Sex and Age in Port Angeles East
Sex and Age in Port Angeles East
The most populous age groups in Port Angeles East are 40 to 44 Years (341 | 22.0%) for men and 70 to 74 Years (148 | 10.0%) for women.
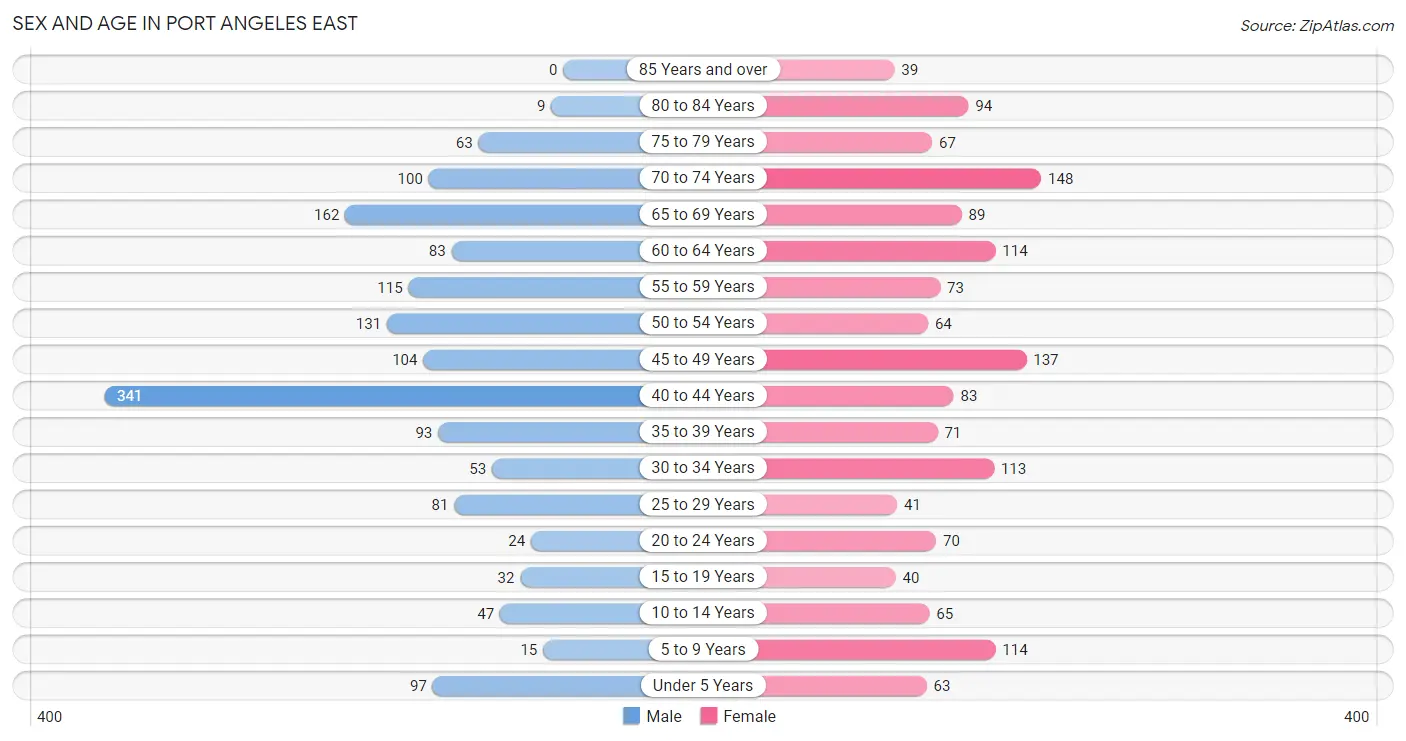
| Age Bracket | Male | Female |
| Under 5 Years | 97 (6.3%) | 63 (4.2%) |
| 5 to 9 Years | 15 (1.0%) | 114 (7.7%) |
| 10 to 14 Years | 47 (3.0%) | 65 (4.4%) |
| 15 to 19 Years | 32 (2.1%) | 40 (2.7%) |
| 20 to 24 Years | 24 (1.5%) | 70 (4.7%) |
| 25 to 29 Years | 81 (5.2%) | 41 (2.8%) |
| 30 to 34 Years | 53 (3.4%) | 113 (7.6%) |
| 35 to 39 Years | 93 (6.0%) | 71 (4.8%) |
| 40 to 44 Years | 341 (22.0%) | 83 (5.6%) |
| 45 to 49 Years | 104 (6.7%) | 137 (9.2%) |
| 50 to 54 Years | 131 (8.5%) | 64 (4.3%) |
| 55 to 59 Years | 115 (7.4%) | 73 (4.9%) |
| 60 to 64 Years | 83 (5.3%) | 114 (7.7%) |
| 65 to 69 Years | 162 (10.4%) | 89 (6.0%) |
| 70 to 74 Years | 100 (6.5%) | 148 (10.0%) |
| 75 to 79 Years | 63 (4.1%) | 67 (4.5%) |
| 80 to 84 Years | 9 (0.6%) | 94 (6.3%) |
| 85 Years and over | 0 (0.0%) | 39 (2.6%) |
| Total | 1,550 (100.0%) | 1,485 (100.0%) |
Families and Households in Port Angeles East
Median Family Size in Port Angeles East
The median family size in Port Angeles East is 2.77 persons per family, with single female/mother families (195 | 23.4%) accounting for the largest median family size of 3.18 persons per family. On the other hand, married-couple families (604 | 72.3%) represent the smallest median family size with 2.63 persons per family.
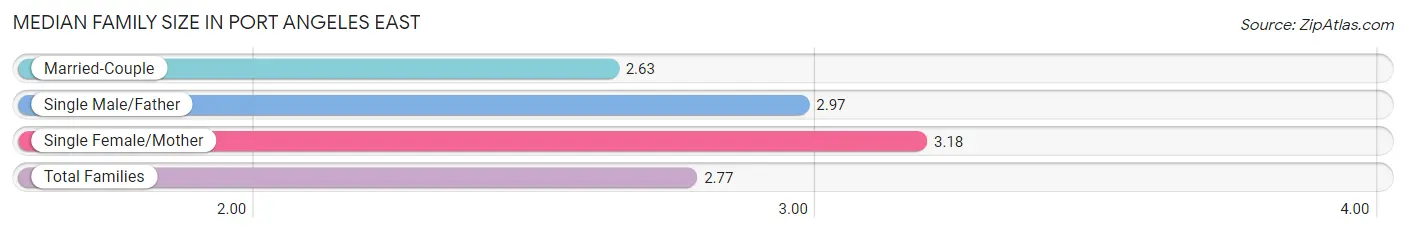
| Family Type | # Families | Family Size |
| Married-Couple | 604 (72.3%) | 2.63 |
| Single Male/Father | 36 (4.3%) | 2.97 |
| Single Female/Mother | 195 (23.4%) | 3.18 |
| Total Families | 835 (100.0%) | 2.77 |
Median Household Size in Port Angeles East
The median household size in Port Angeles East is 2.22 persons per household, with single female/mother households (195 | 14.2%) accounting for the largest median household size of 3.38 persons per household. non-family households (535 | 39.1%) represent the smallest median household size with 1.27 persons per household.
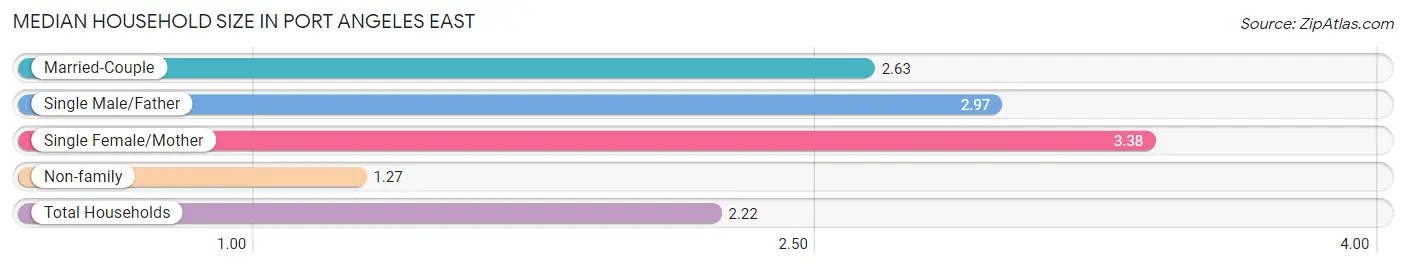
| Household Type | # Households | Household Size |
| Married-Couple | 604 (44.1%) | 2.63 |
| Single Male/Father | 36 (2.6%) | 2.97 |
| Single Female/Mother | 195 (14.2%) | 3.38 |
| Non-family | 535 (39.1%) | 1.27 |
| Total Households | 1,370 (100.0%) | 2.22 |
Household Size by Marriage Status in Port Angeles East
Out of a total of 1,370 households in Port Angeles East, 835 (61.0%) are family households, while 535 (39.1%) are nonfamily households. The most numerous type of family households are 2-person households, comprising 540, and the most common type of nonfamily households are 1-person households, comprising 418.
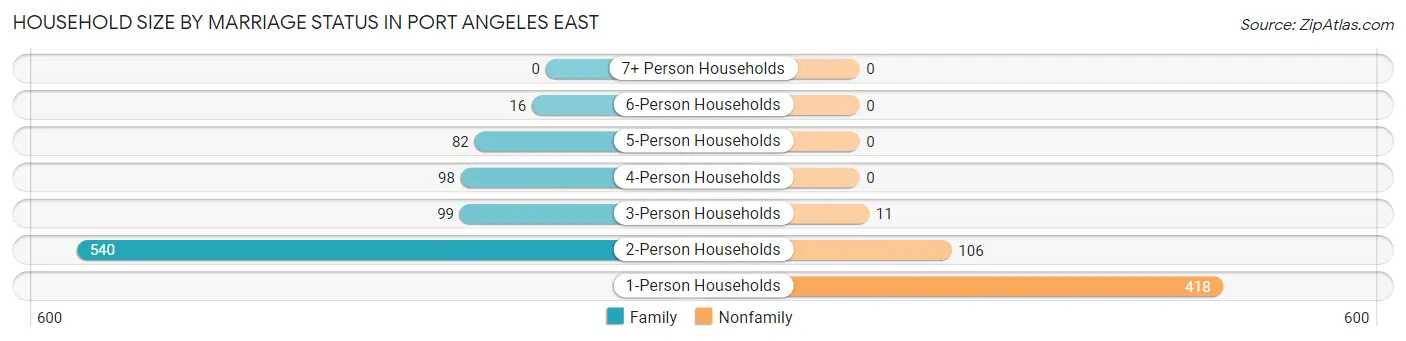
| Household Size | Family Households | Nonfamily Households |
| 1-Person Households | - | 418 (30.5%) |
| 2-Person Households | 540 (39.4%) | 106 (7.7%) |
| 3-Person Households | 99 (7.2%) | 11 (0.8%) |
| 4-Person Households | 98 (7.1%) | 0 (0.0%) |
| 5-Person Households | 82 (6.0%) | 0 (0.0%) |
| 6-Person Households | 16 (1.2%) | 0 (0.0%) |
| 7+ Person Households | 0 (0.0%) | 0 (0.0%) |
| Total | 835 (61.0%) | 535 (39.1%) |
Female Fertility in Port Angeles East
Fertility by Age in Port Angeles East
Average fertility rate in Port Angeles East is 25.0 births per 1,000 women. Women in the age bracket of 20 to 34 years have the highest fertility rate with 63.0 births per 1,000 women. Women in the age bracket of 20 to 34 years acount for 100.0% of all women with births.
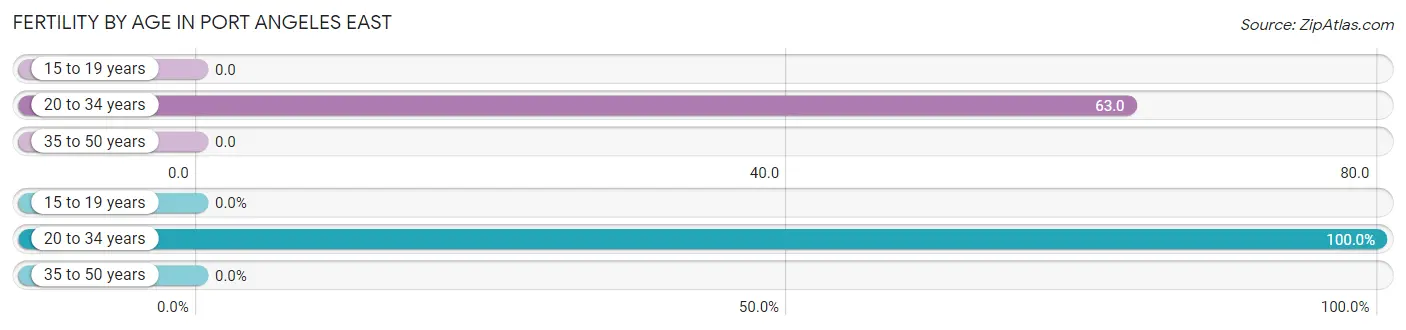
| Age Bracket | Women with Births | Births / 1,000 Women |
| 15 to 19 years | 0 (0.0%) | 0.0 |
| 20 to 34 years | 14 (100.0%) | 63.0 |
| 35 to 50 years | 0 (0.0%) | 0.0 |
| Total | 14 (100.0%) | 25.0 |
Fertility by Age by Marriage Status in Port Angeles East

| Age Bracket | Married | Unmarried |
| 15 to 19 years | 0 (0.0%) | 0 (0.0%) |
| 20 to 34 years | 14 (100.0%) | 0 (0.0%) |
| 35 to 50 years | 0 (0.0%) | 0 (0.0%) |
| Total | 14 (100.0%) | 0 (0.0%) |
Fertility by Education in Port Angeles East
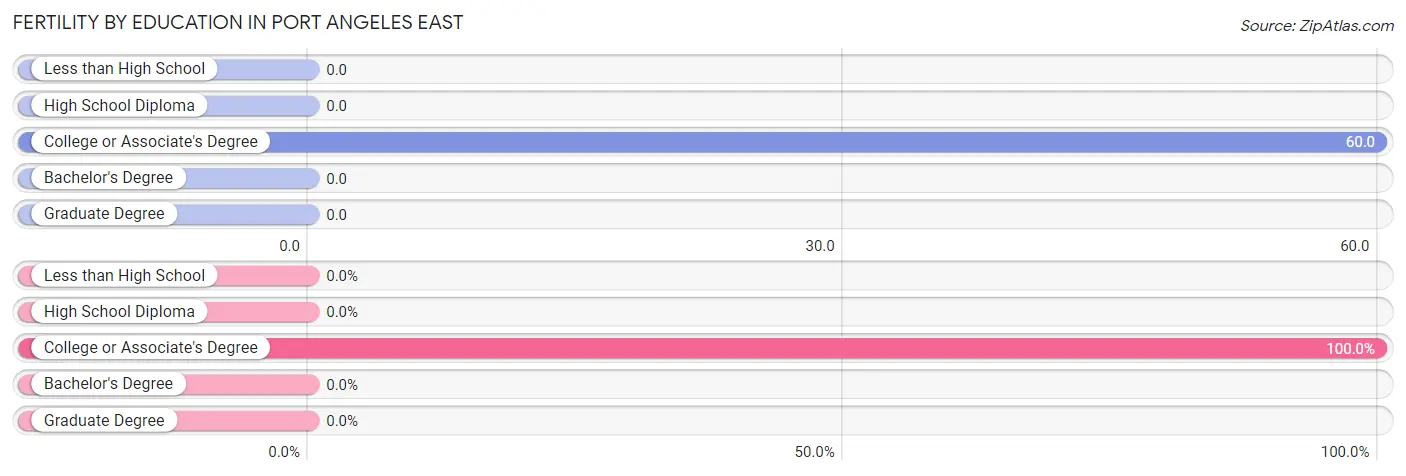
| Educational Attainment | Women with Births | Births / 1,000 Women |
| Less than High School | 0 (0.0%) | 0.0 |
| High School Diploma | 0 (0.0%) | 0.0 |
| College or Associate's Degree | 14 (100.0%) | 60.0 |
| Bachelor's Degree | 0 (0.0%) | 0.0 |
| Graduate Degree | 0 (0.0%) | 0.0 |
| Total | 14 (100.0%) | 25.0 |
Fertility by Education by Marriage Status in Port Angeles East
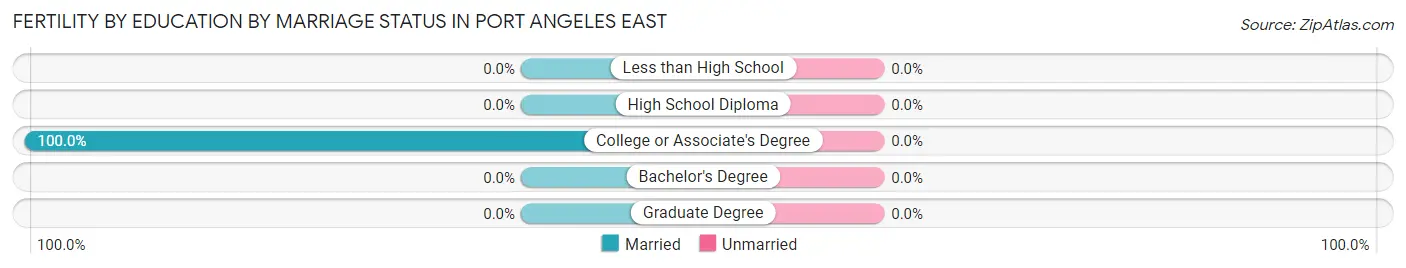
| Educational Attainment | Married | Unmarried |
| Less than High School | 0 (0.0%) | 0 (0.0%) |
| High School Diploma | 0 (0.0%) | 0 (0.0%) |
| College or Associate's Degree | 14 (100.0%) | 0 (0.0%) |
| Bachelor's Degree | 0 (0.0%) | 0 (0.0%) |
| Graduate Degree | 0 (0.0%) | 0 (0.0%) |
| Total | 14 (100.0%) | 0 (0.0%) |
Employment Characteristics in Port Angeles East
Employment by Class of Employer in Port Angeles East
Among the 1,287 employed individuals in Port Angeles East, private company employees (815 | 63.3%), local government employees (186 | 14.4%), and self-employed (incorporated) (85 | 6.6%) make up the most common classes of employment.
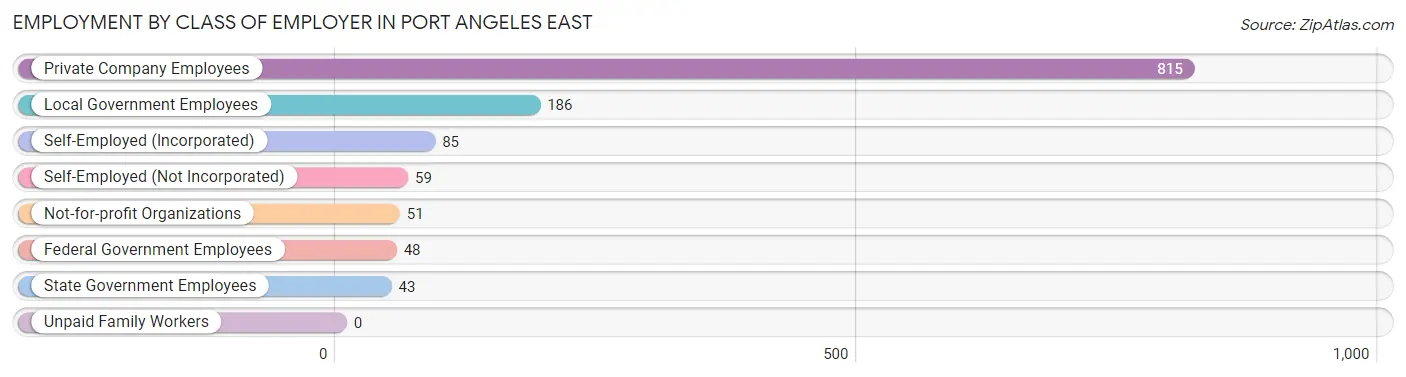
| Employer Class | # Employees | % Employees |
| Private Company Employees | 815 | 63.3% |
| Self-Employed (Incorporated) | 85 | 6.6% |
| Self-Employed (Not Incorporated) | 59 | 4.6% |
| Not-for-profit Organizations | 51 | 4.0% |
| Local Government Employees | 186 | 14.4% |
| State Government Employees | 43 | 3.3% |
| Federal Government Employees | 48 | 3.7% |
| Unpaid Family Workers | 0 | 0.0% |
| Total | 1,287 | 100.0% |
Employment Status by Age in Port Angeles East
According to the labor force statistics for Port Angeles East, out of the total population over 16 years of age (2,580), 54.3% or 1,401 individuals are in the labor force, with 3.6% or 50 of them unemployed. The age group with the highest labor force participation rate is 20 to 24 years, with 100.0% or 94 individuals in the labor force. Within the labor force, the 25 to 29 years age range has the highest percentage of unemployed individuals, with 18.3% or 17 of them being unemployed.
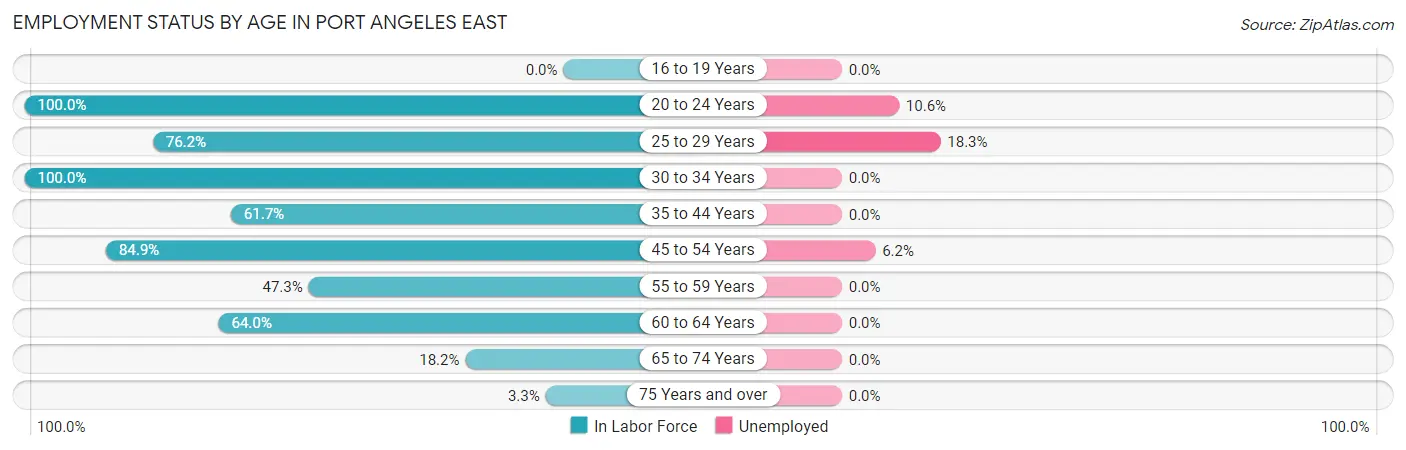
| Age Bracket | In Labor Force | Unemployed |
| 16 to 19 Years | 0 (0.0%) | 0 (0.0%) |
| 20 to 24 Years | 94 (100.0%) | 10 (10.6%) |
| 25 to 29 Years | 93 (76.2%) | 17 (18.3%) |
| 30 to 34 Years | 166 (100.0%) | 0 (0.0%) |
| 35 to 44 Years | 363 (61.7%) | 0 (0.0%) |
| 45 to 54 Years | 370 (84.9%) | 23 (6.2%) |
| 55 to 59 Years | 89 (47.3%) | 0 (0.0%) |
| 60 to 64 Years | 126 (64.0%) | 0 (0.0%) |
| 65 to 74 Years | 91 (18.2%) | 0 (0.0%) |
| 75 Years and over | 9 (3.3%) | 0 (0.0%) |
| Total | 1,401 (54.3%) | 50 (3.6%) |
Employment Status by Educational Attainment in Port Angeles East
According to labor force statistics for Port Angeles East, 71.1% of individuals (1,207) out of the total population between 25 and 64 years of age (1,697) are in the labor force, with 3.3% or 40 of them being unemployed. The group with the highest labor force participation rate are those with the educational attainment of bachelor's degree or higher, with 88.8% or 371 individuals in the labor force. Within the labor force, individuals with less than high school education have the highest percentage of unemployment, with 15.2% or 17 of them being unemployed.
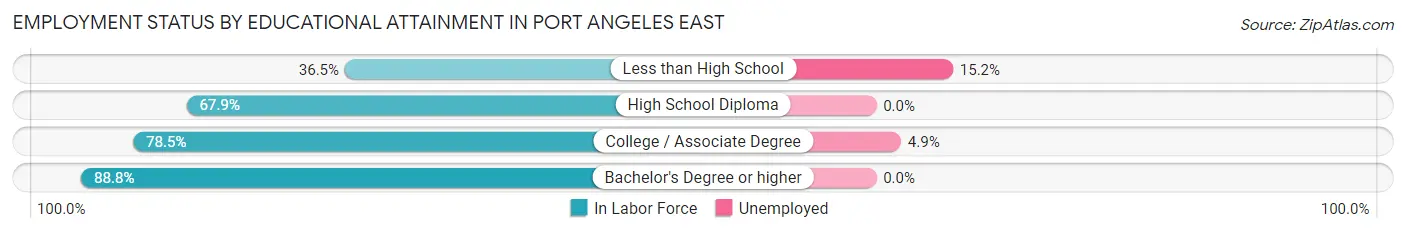
| Educational Attainment | In Labor Force | Unemployed |
| Less than High School | 112 (36.5%) | 47 (15.2%) |
| High School Diploma | 250 (67.9%) | 0 (0.0%) |
| College / Associate Degree | 474 (78.5%) | 30 (4.9%) |
| Bachelor's Degree or higher | 371 (88.8%) | 0 (0.0%) |
| Total | 1,207 (71.1%) | 56 (3.3%) |
Employment Occupations by Sex in Port Angeles East
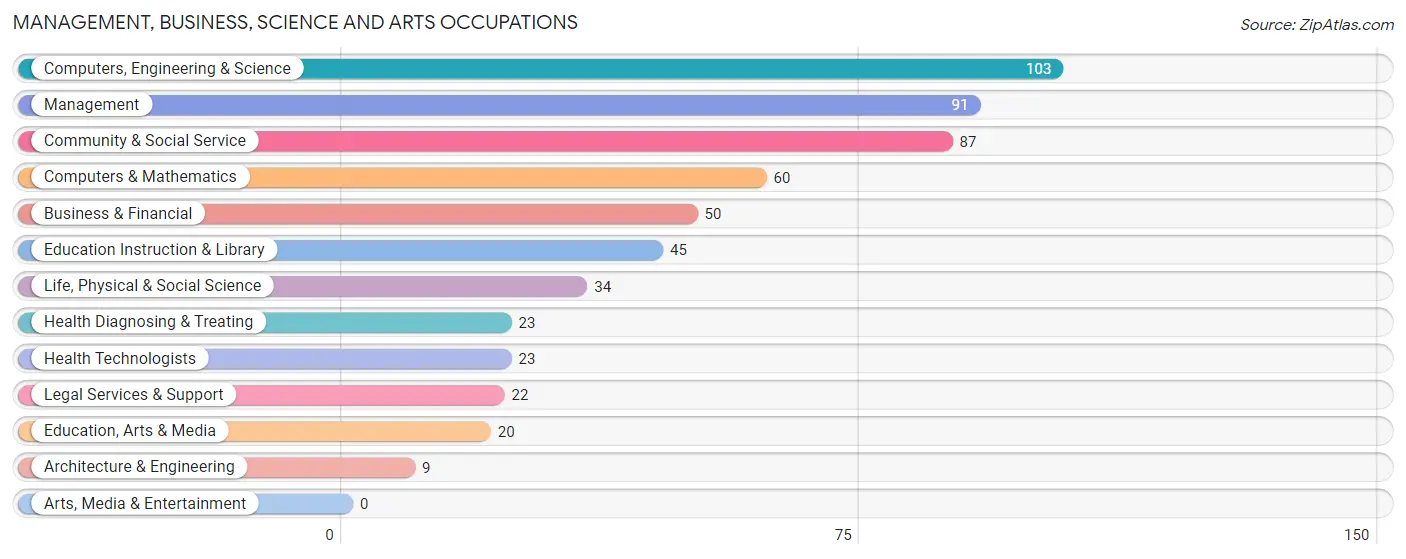
Management, Business, Science and Arts Occupations
The most common Management, Business, Science and Arts occupations in Port Angeles East are Computers, Engineering & Science (103 | 7.6%), Management (91 | 6.7%), Community & Social Service (87 | 6.4%), Computers & Mathematics (60 | 4.4%), and Business & Financial (50 | 3.7%).
Management, Business, Science and Arts Occupations by Sex
Within the Management, Business, Science and Arts occupations in Port Angeles East, the most male-oriented occupations are Architecture & Engineering (100.0%), Education, Arts & Media (100.0%), and Business & Financial (80.0%), while the most female-oriented occupations are Life, Physical & Social Science (100.0%), Legal Services & Support (100.0%), and Health Diagnosing & Treating (60.9%).
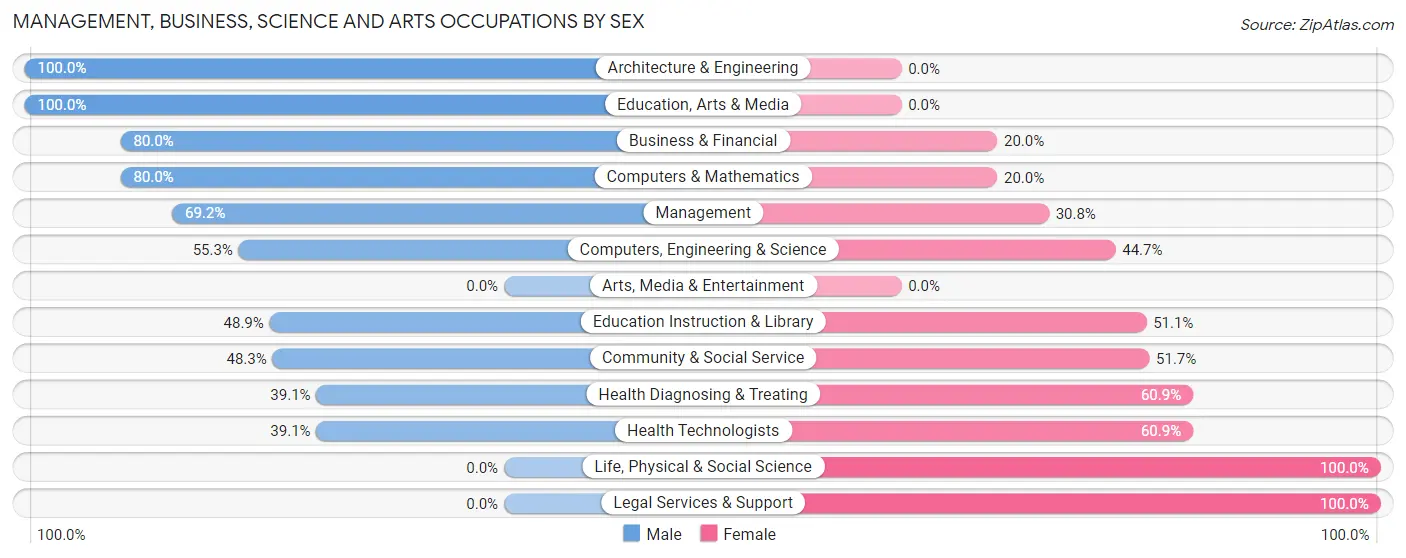
| Occupation | Male | Female |
| Management | 63 (69.2%) | 28 (30.8%) |
| Business & Financial | 40 (80.0%) | 10 (20.0%) |
| Computers, Engineering & Science | 57 (55.3%) | 46 (44.7%) |
| Computers & Mathematics | 48 (80.0%) | 12 (20.0%) |
| Architecture & Engineering | 9 (100.0%) | 0 (0.0%) |
| Life, Physical & Social Science | 0 (0.0%) | 34 (100.0%) |
| Community & Social Service | 42 (48.3%) | 45 (51.7%) |
| Education, Arts & Media | 20 (100.0%) | 0 (0.0%) |
| Legal Services & Support | 0 (0.0%) | 22 (100.0%) |
| Education Instruction & Library | 22 (48.9%) | 23 (51.1%) |
| Arts, Media & Entertainment | 0 (0.0%) | 0 (0.0%) |
| Health Diagnosing & Treating | 9 (39.1%) | 14 (60.9%) |
| Health Technologists | 9 (39.1%) | 14 (60.9%) |
| Total (Category) | 211 (59.6%) | 143 (40.4%) |
| Total (Overall) | 783 (58.0%) | 568 (42.0%) |
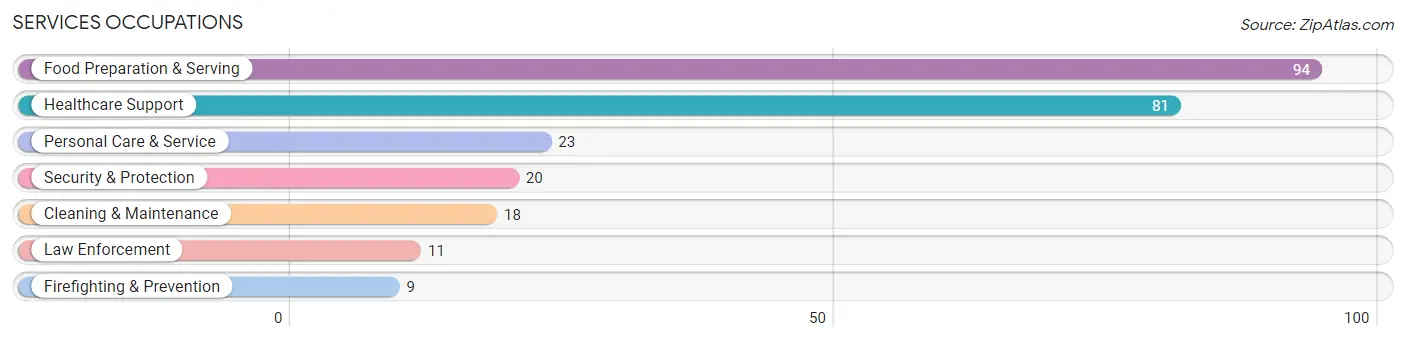
Services Occupations
The most common Services occupations in Port Angeles East are Food Preparation & Serving (94 | 7.0%), Healthcare Support (81 | 6.0%), Personal Care & Service (23 | 1.7%), Security & Protection (20 | 1.5%), and Cleaning & Maintenance (18 | 1.3%).
Services Occupations by Sex
Within the Services occupations in Port Angeles East, the most male-oriented occupations are Security & Protection (100.0%), Firefighting & Prevention (100.0%), and Law Enforcement (100.0%), while the most female-oriented occupations are Personal Care & Service (100.0%), Food Preparation & Serving (85.1%), and Healthcare Support (81.5%).
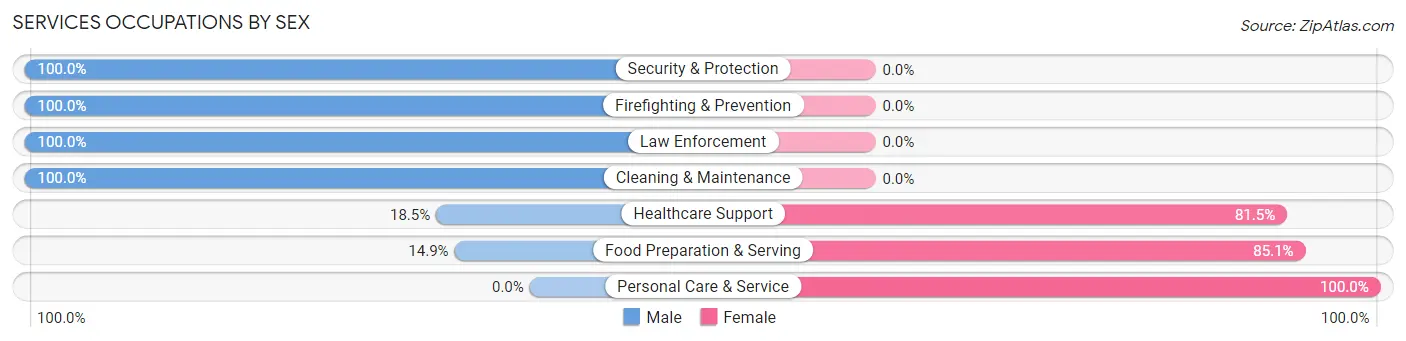
| Occupation | Male | Female |
| Healthcare Support | 15 (18.5%) | 66 (81.5%) |
| Security & Protection | 20 (100.0%) | 0 (0.0%) |
| Firefighting & Prevention | 9 (100.0%) | 0 (0.0%) |
| Law Enforcement | 11 (100.0%) | 0 (0.0%) |
| Food Preparation & Serving | 14 (14.9%) | 80 (85.1%) |
| Cleaning & Maintenance | 18 (100.0%) | 0 (0.0%) |
| Personal Care & Service | 0 (0.0%) | 23 (100.0%) |
| Total (Category) | 67 (28.4%) | 169 (71.6%) |
| Total (Overall) | 783 (58.0%) | 568 (42.0%) |
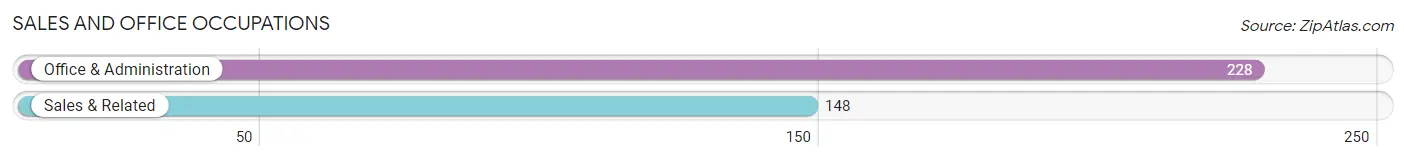
Sales and Office Occupations
The most common Sales and Office occupations in Port Angeles East are Office & Administration (228 | 16.9%), and Sales & Related (148 | 11.0%).
Sales and Office Occupations by Sex
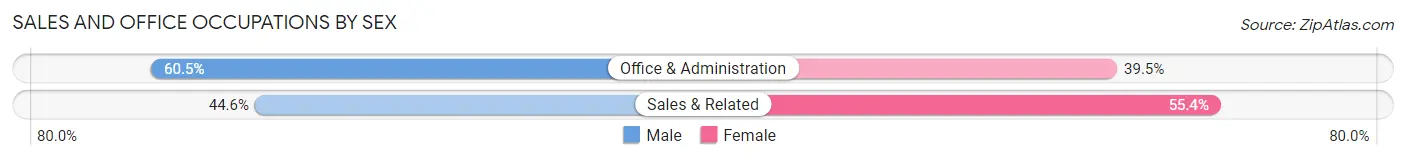
| Occupation | Male | Female |
| Sales & Related | 66 (44.6%) | 82 (55.4%) |
| Office & Administration | 138 (60.5%) | 90 (39.5%) |
| Total (Category) | 204 (54.3%) | 172 (45.7%) |
| Total (Overall) | 783 (58.0%) | 568 (42.0%) |
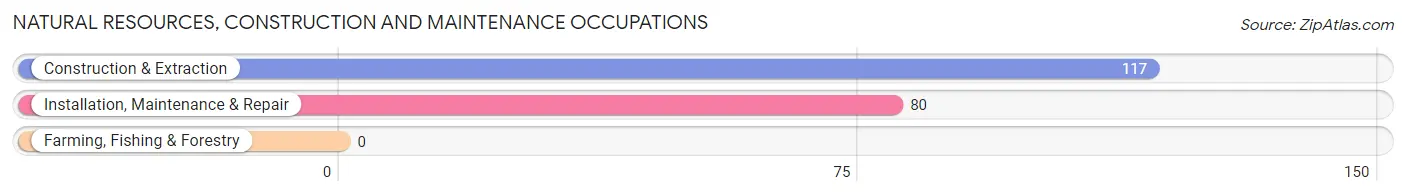
Natural Resources, Construction and Maintenance Occupations
The most common Natural Resources, Construction and Maintenance occupations in Port Angeles East are Construction & Extraction (117 | 8.7%), and Installation, Maintenance & Repair (80 | 5.9%).
Natural Resources, Construction and Maintenance Occupations by Sex
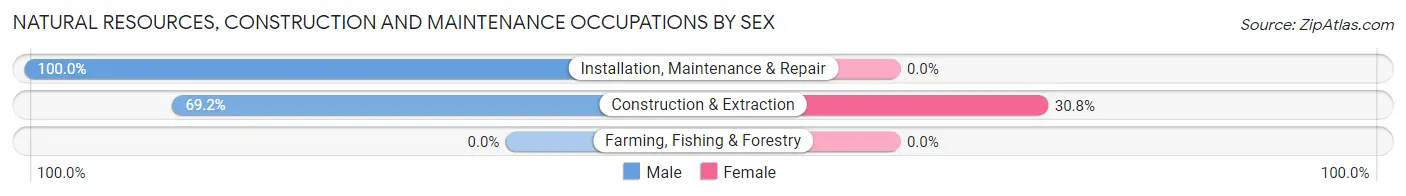
| Occupation | Male | Female |
| Farming, Fishing & Forestry | 0 (0.0%) | 0 (0.0%) |
| Construction & Extraction | 81 (69.2%) | 36 (30.8%) |
| Installation, Maintenance & Repair | 80 (100.0%) | 0 (0.0%) |
| Total (Category) | 161 (81.7%) | 36 (18.3%) |
| Total (Overall) | 783 (58.0%) | 568 (42.0%) |
Production, Transportation and Moving Occupations
The most common Production, Transportation and Moving occupations in Port Angeles East are Production (82 | 6.1%), Material Moving (57 | 4.2%), and Transportation (49 | 3.6%).
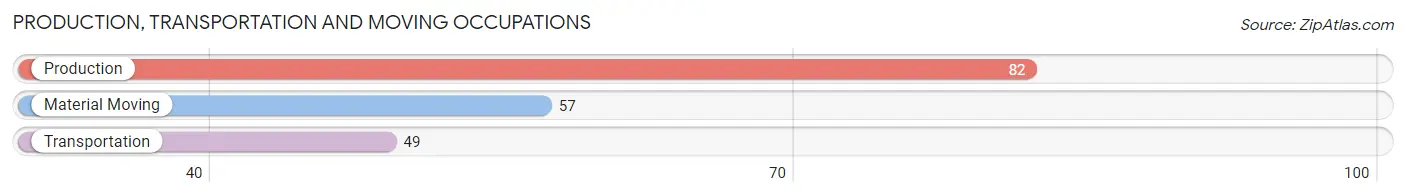
Production, Transportation and Moving Occupations by Sex
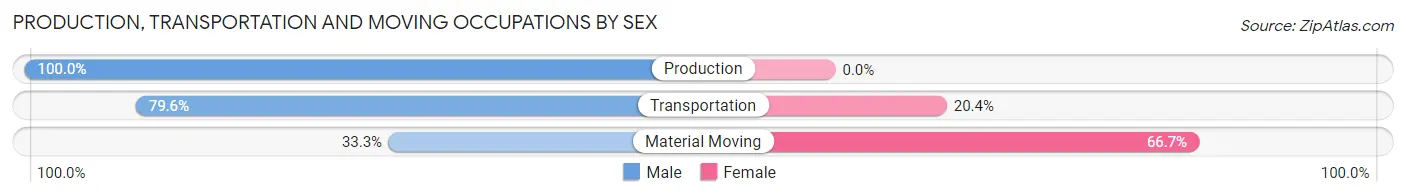
| Occupation | Male | Female |
| Production | 82 (100.0%) | 0 (0.0%) |
| Transportation | 39 (79.6%) | 10 (20.4%) |
| Material Moving | 19 (33.3%) | 38 (66.7%) |
| Total (Category) | 140 (74.5%) | 48 (25.5%) |
| Total (Overall) | 783 (58.0%) | 568 (42.0%) |
Employment Industries by Sex in Port Angeles East
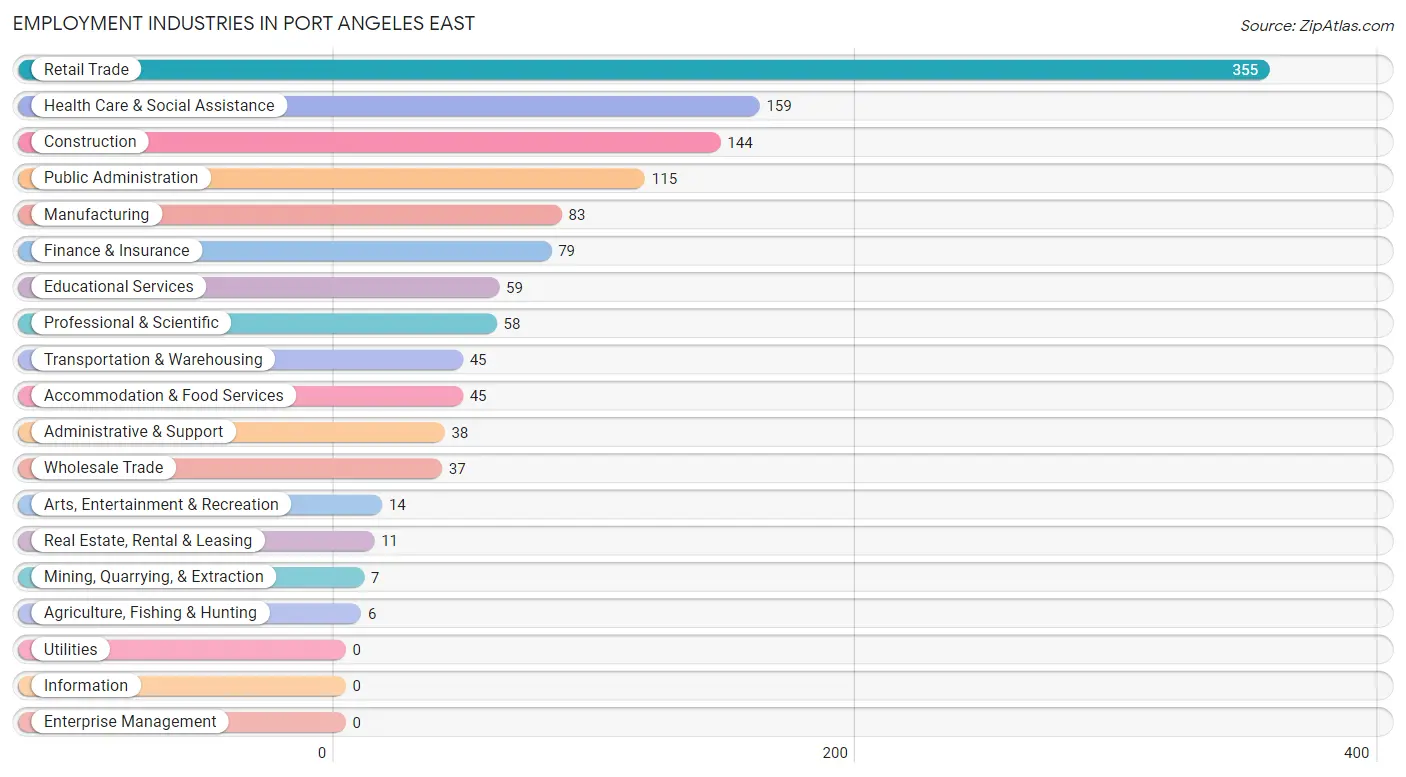
Employment Industries in Port Angeles East
The major employment industries in Port Angeles East include Retail Trade (355 | 26.3%), Health Care & Social Assistance (159 | 11.8%), Construction (144 | 10.7%), Public Administration (115 | 8.5%), and Manufacturing (83 | 6.1%).
Employment Industries by Sex in Port Angeles East
The Port Angeles East industries that see more men than women are Mining, Quarrying, & Extraction (100.0%), Wholesale Trade (100.0%), and Transportation & Warehousing (100.0%), whereas the industries that tend to have a higher number of women are Agriculture, Fishing & Hunting (100.0%), Real Estate, Rental & Leasing (100.0%), and Accommodation & Food Services (77.8%).
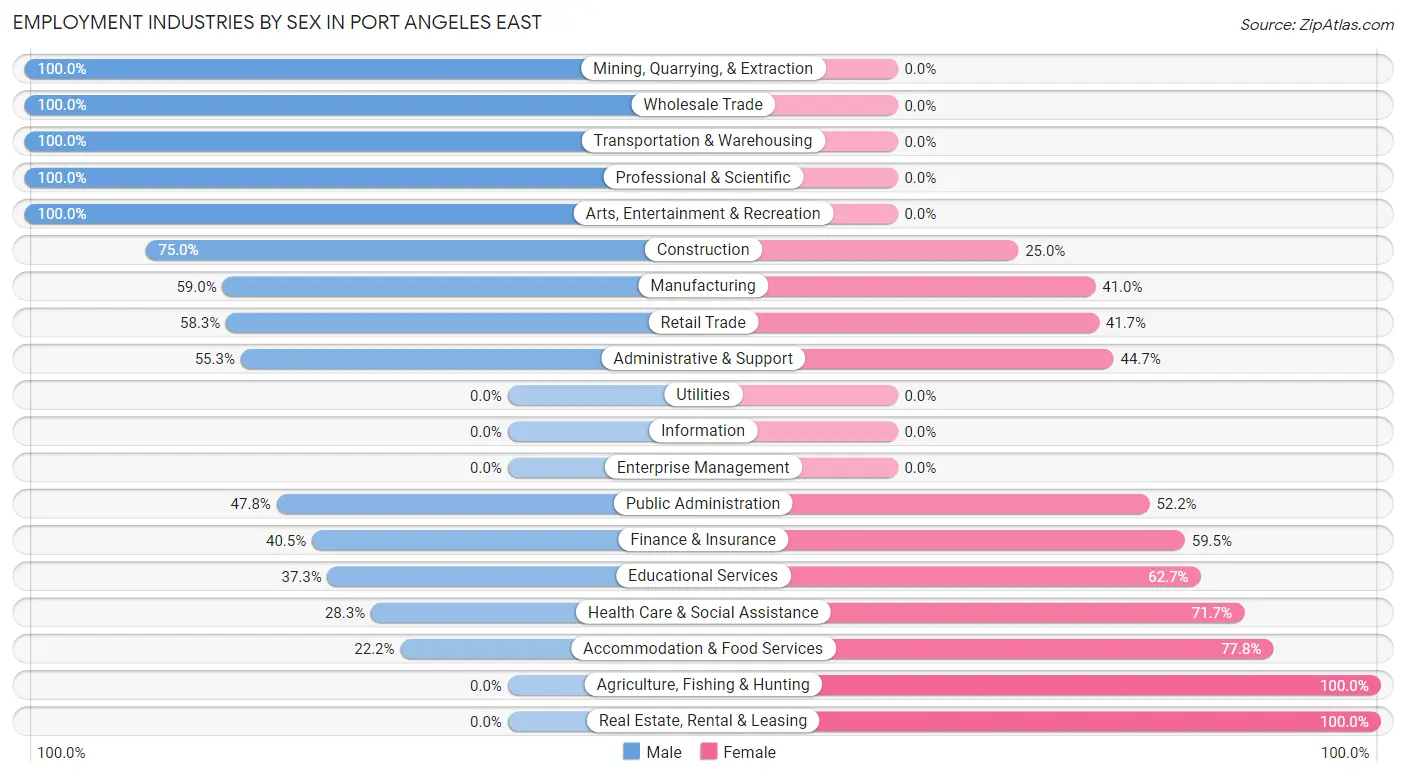
| Industry | Male | Female |
| Agriculture, Fishing & Hunting | 0 (0.0%) | 6 (100.0%) |
| Mining, Quarrying, & Extraction | 7 (100.0%) | 0 (0.0%) |
| Construction | 108 (75.0%) | 36 (25.0%) |
| Manufacturing | 49 (59.0%) | 34 (41.0%) |
| Wholesale Trade | 37 (100.0%) | 0 (0.0%) |
| Retail Trade | 207 (58.3%) | 148 (41.7%) |
| Transportation & Warehousing | 45 (100.0%) | 0 (0.0%) |
| Utilities | 0 (0.0%) | 0 (0.0%) |
| Information | 0 (0.0%) | 0 (0.0%) |
| Finance & Insurance | 32 (40.5%) | 47 (59.5%) |
| Real Estate, Rental & Leasing | 0 (0.0%) | 11 (100.0%) |
| Professional & Scientific | 58 (100.0%) | 0 (0.0%) |
| Enterprise Management | 0 (0.0%) | 0 (0.0%) |
| Administrative & Support | 21 (55.3%) | 17 (44.7%) |
| Educational Services | 22 (37.3%) | 37 (62.7%) |
| Health Care & Social Assistance | 45 (28.3%) | 114 (71.7%) |
| Arts, Entertainment & Recreation | 14 (100.0%) | 0 (0.0%) |
| Accommodation & Food Services | 10 (22.2%) | 35 (77.8%) |
| Public Administration | 55 (47.8%) | 60 (52.2%) |
| Total | 783 (58.0%) | 568 (42.0%) |
Education in Port Angeles East
School Enrollment in Port Angeles East
The most common levels of schooling among the 441 students in Port Angeles East are elementary school (99 | 22.5%), nursery / preschool (88 | 20.0%), and college / undergraduate (78 | 17.7%).
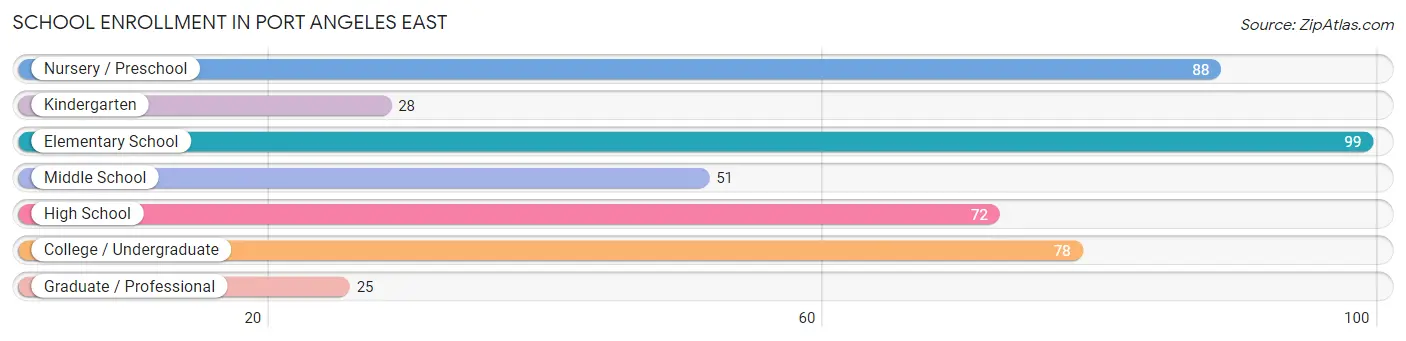
| School Level | # Students | % Students |
| Nursery / Preschool | 88 | 20.0% |
| Kindergarten | 28 | 6.4% |
| Elementary School | 99 | 22.5% |
| Middle School | 51 | 11.6% |
| High School | 72 | 16.3% |
| College / Undergraduate | 78 | 17.7% |
| Graduate / Professional | 25 | 5.7% |
| Total | 441 | 100.0% |
School Enrollment by Age by Funding Source in Port Angeles East
Out of a total of 441 students who are enrolled in schools in Port Angeles East, 87 (19.7%) attend a private institution, while the remaining 354 (80.3%) are enrolled in public schools. The age group of 35 years and over has the highest likelihood of being enrolled in private schools, with 41 (77.4% in the age bracket) enrolled. Conversely, the age group of 10 to 14 year olds has the lowest likelihood of being enrolled in a private school, with 64 (100.0% in the age bracket) attending a public institution.
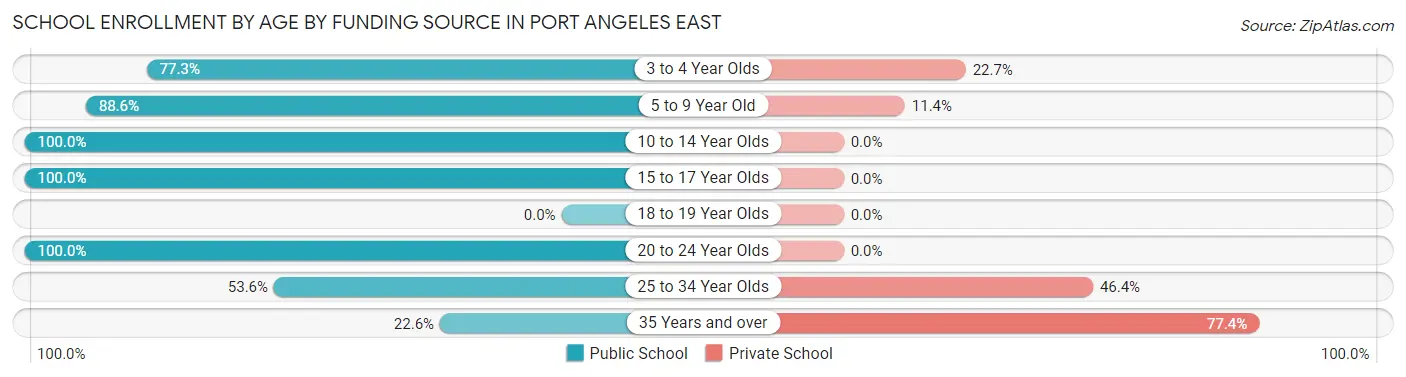
| Age Bracket | Public School | Private School |
| 3 to 4 Year Olds | 68 (77.3%) | 20 (22.7%) |
| 5 to 9 Year Old | 101 (88.6%) | 13 (11.4%) |
| 10 to 14 Year Olds | 64 (100.0%) | 0 (0.0%) |
| 15 to 17 Year Olds | 72 (100.0%) | 0 (0.0%) |
| 18 to 19 Year Olds | 0 (0.0%) | 0 (0.0%) |
| 20 to 24 Year Olds | 22 (100.0%) | 0 (0.0%) |
| 25 to 34 Year Olds | 15 (53.6%) | 13 (46.4%) |
| 35 Years and over | 12 (22.6%) | 41 (77.4%) |
| Total | 354 (80.3%) | 87 (19.7%) |
Educational Attainment by Field of Study in Port Angeles East
Business (142 | 17.9%), education (110 | 13.9%), communications (106 | 13.4%), literature & languages (78 | 9.8%), and visual & performing arts (75 | 9.5%) are the most common fields of study among 794 individuals in Port Angeles East who have obtained a bachelor's degree or higher.
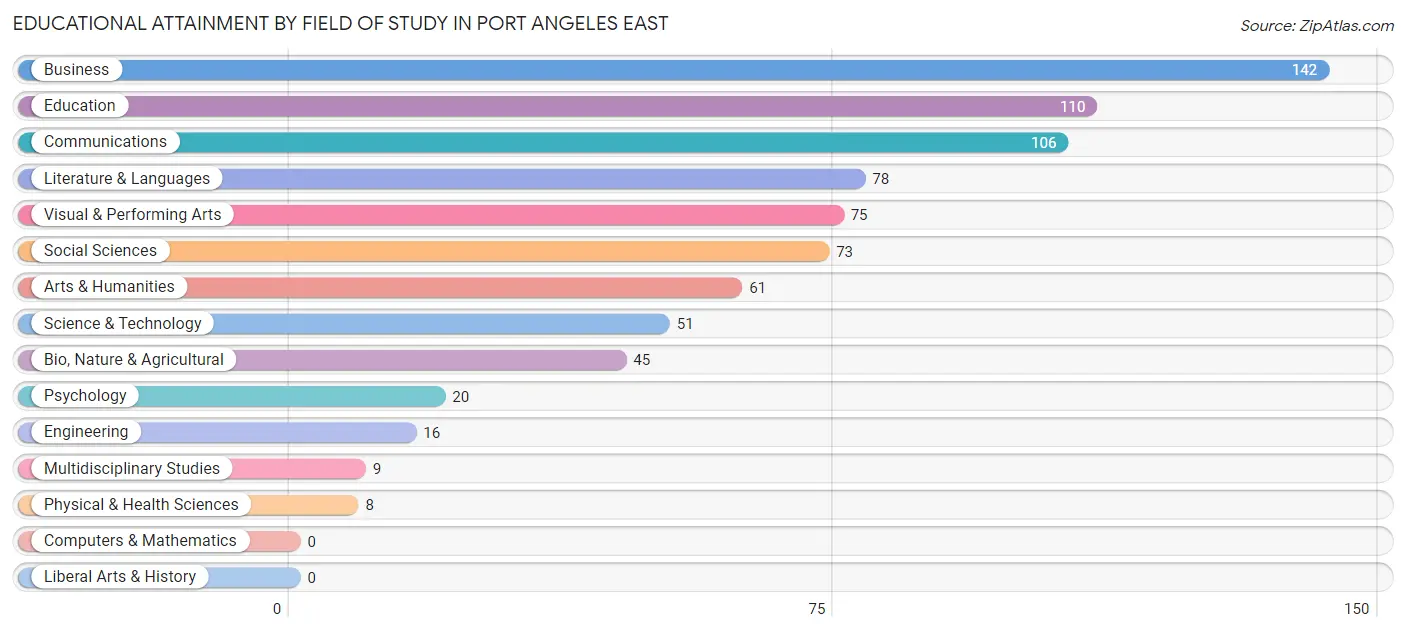
| Field of Study | # Graduates | % Graduates |
| Computers & Mathematics | 0 | 0.0% |
| Bio, Nature & Agricultural | 45 | 5.7% |
| Physical & Health Sciences | 8 | 1.0% |
| Psychology | 20 | 2.5% |
| Social Sciences | 73 | 9.2% |
| Engineering | 16 | 2.0% |
| Multidisciplinary Studies | 9 | 1.1% |
| Science & Technology | 51 | 6.4% |
| Business | 142 | 17.9% |
| Education | 110 | 13.9% |
| Literature & Languages | 78 | 9.8% |
| Liberal Arts & History | 0 | 0.0% |
| Visual & Performing Arts | 75 | 9.5% |
| Communications | 106 | 13.4% |
| Arts & Humanities | 61 | 7.7% |
| Total | 794 | 100.0% |
Transportation & Commute in Port Angeles East
Vehicle Availability by Sex in Port Angeles East
The most prevalent vehicle ownership categories in Port Angeles East are males with 2 vehicles (498, accounting for 67.1%) and females with 2 vehicles (284, making up 91.4%).
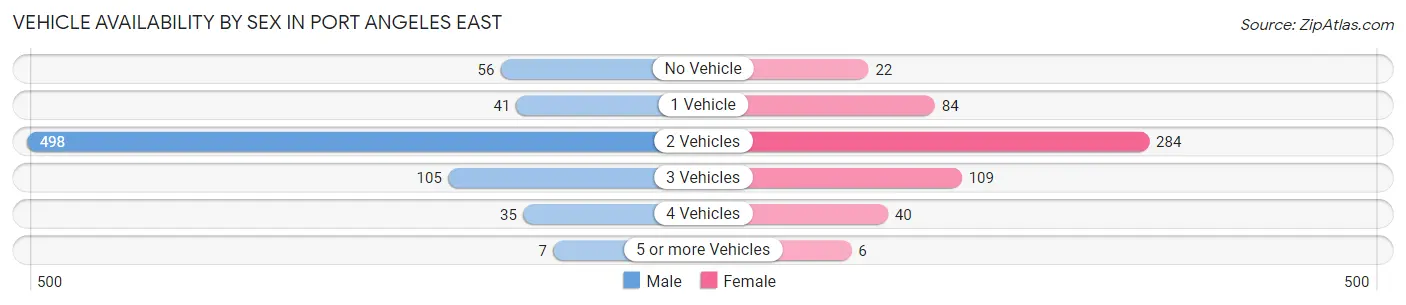
| Vehicles Available | Male | Female |
| No Vehicle | 56 (7.5%) | 22 (4.0%) |
| 1 Vehicle | 41 (5.5%) | 84 (15.4%) |
| 2 Vehicles | 498 (67.1%) | 284 (52.1%) |
| 3 Vehicles | 105 (14.1%) | 109 (20.0%) |
| 4 Vehicles | 35 (4.7%) | 40 (7.3%) |
| 5 or more Vehicles | 7 (0.9%) | 6 (1.1%) |
| Total | 742 (100.0%) | 545 (100.0%) |
Commute Time in Port Angeles East
The most frequently occuring commute durations in Port Angeles East are 10 to 14 minutes (319 commuters, 26.0%), 5 to 9 minutes (179 commuters, 14.6%), and 20 to 24 minutes (162 commuters, 13.2%).
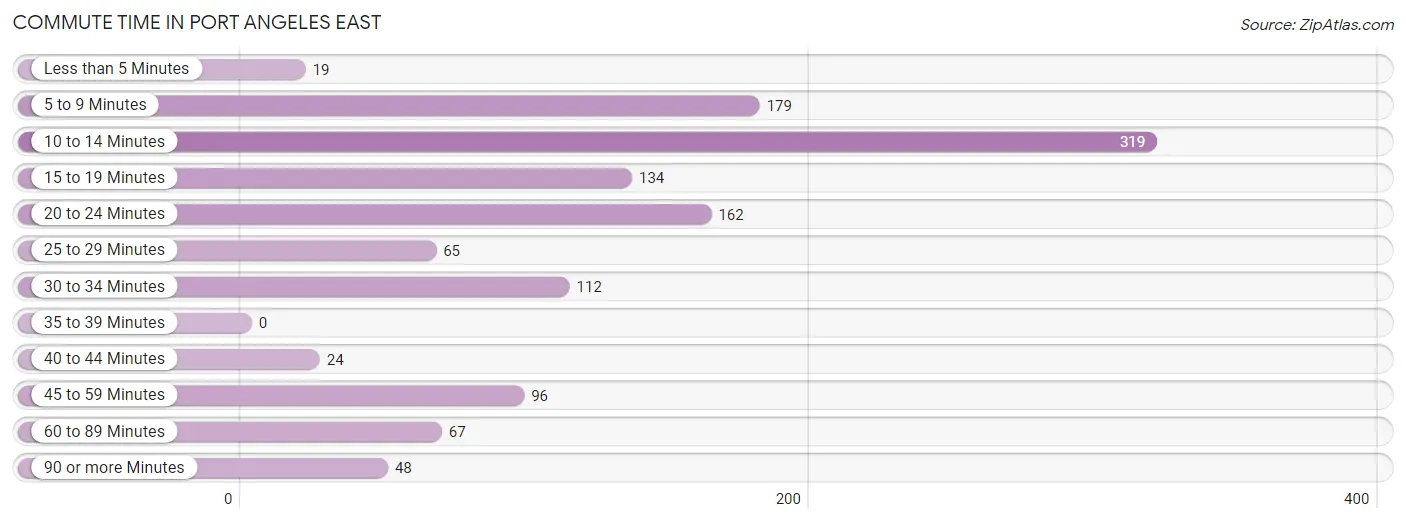
| Commute Time | # Commuters | % Commuters |
| Less than 5 Minutes | 19 | 1.5% |
| 5 to 9 Minutes | 179 | 14.6% |
| 10 to 14 Minutes | 319 | 26.0% |
| 15 to 19 Minutes | 134 | 10.9% |
| 20 to 24 Minutes | 162 | 13.2% |
| 25 to 29 Minutes | 65 | 5.3% |
| 30 to 34 Minutes | 112 | 9.1% |
| 35 to 39 Minutes | 0 | 0.0% |
| 40 to 44 Minutes | 24 | 2.0% |
| 45 to 59 Minutes | 96 | 7.8% |
| 60 to 89 Minutes | 67 | 5.5% |
| 90 or more Minutes | 48 | 3.9% |
Commute Time by Sex in Port Angeles East
The most common commute times in Port Angeles East are 10 to 14 minutes (238 commuters, 32.1%) for males and 10 to 14 minutes (81 commuters, 16.8%) for females.
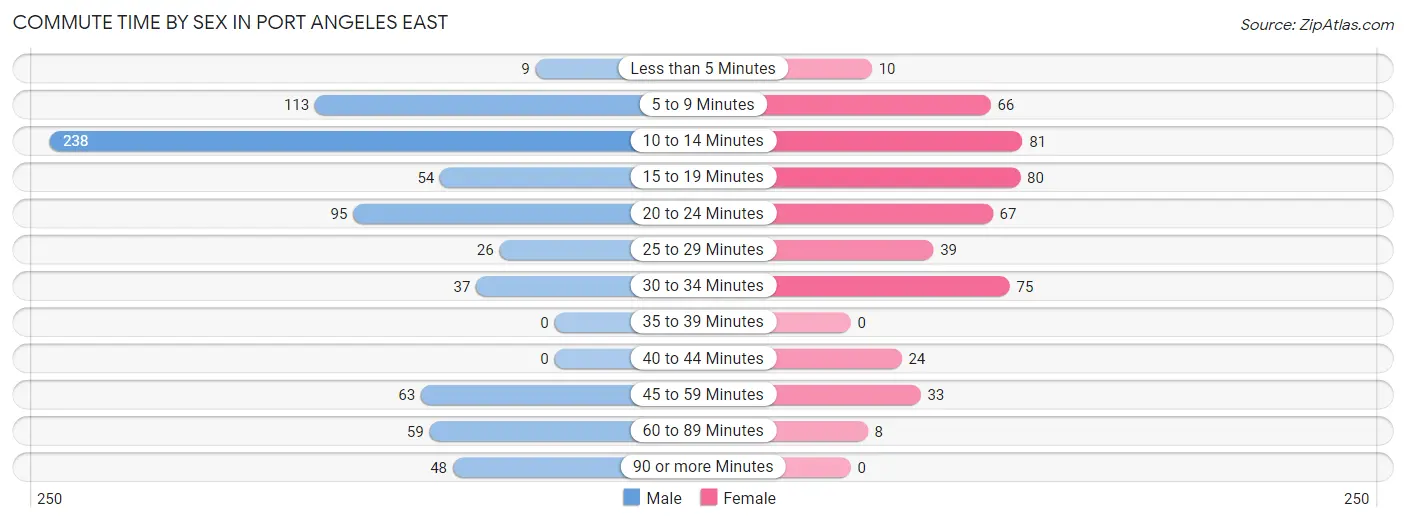
| Commute Time | Male | Female |
| Less than 5 Minutes | 9 (1.2%) | 10 (2.1%) |
| 5 to 9 Minutes | 113 (15.2%) | 66 (13.7%) |
| 10 to 14 Minutes | 238 (32.1%) | 81 (16.8%) |
| 15 to 19 Minutes | 54 (7.3%) | 80 (16.6%) |
| 20 to 24 Minutes | 95 (12.8%) | 67 (13.9%) |
| 25 to 29 Minutes | 26 (3.5%) | 39 (8.1%) |
| 30 to 34 Minutes | 37 (5.0%) | 75 (15.5%) |
| 35 to 39 Minutes | 0 (0.0%) | 0 (0.0%) |
| 40 to 44 Minutes | 0 (0.0%) | 24 (5.0%) |
| 45 to 59 Minutes | 63 (8.5%) | 33 (6.8%) |
| 60 to 89 Minutes | 59 (8.0%) | 8 (1.7%) |
| 90 or more Minutes | 48 (6.5%) | 0 (0.0%) |
Time of Departure to Work by Sex in Port Angeles East
The most frequent times of departure to work in Port Angeles East are 8:00 AM to 8:29 AM (207, 27.9%) for males and 7:00 AM to 7:29 AM (103, 21.3%) for females.
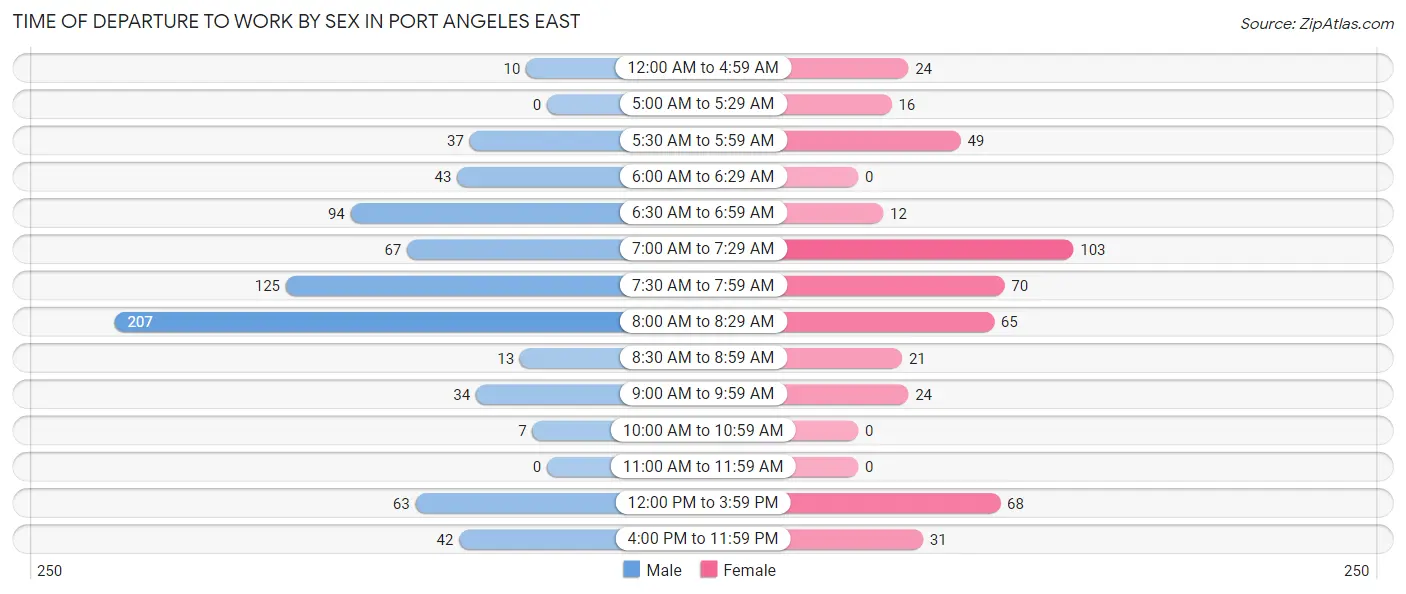
| Time of Departure | Male | Female |
| 12:00 AM to 4:59 AM | 10 (1.3%) | 24 (5.0%) |
| 5:00 AM to 5:29 AM | 0 (0.0%) | 16 (3.3%) |
| 5:30 AM to 5:59 AM | 37 (5.0%) | 49 (10.1%) |
| 6:00 AM to 6:29 AM | 43 (5.8%) | 0 (0.0%) |
| 6:30 AM to 6:59 AM | 94 (12.7%) | 12 (2.5%) |
| 7:00 AM to 7:29 AM | 67 (9.0%) | 103 (21.3%) |
| 7:30 AM to 7:59 AM | 125 (16.9%) | 70 (14.5%) |
| 8:00 AM to 8:29 AM | 207 (27.9%) | 65 (13.5%) |
| 8:30 AM to 8:59 AM | 13 (1.8%) | 21 (4.3%) |
| 9:00 AM to 9:59 AM | 34 (4.6%) | 24 (5.0%) |
| 10:00 AM to 10:59 AM | 7 (0.9%) | 0 (0.0%) |
| 11:00 AM to 11:59 AM | 0 (0.0%) | 0 (0.0%) |
| 12:00 PM to 3:59 PM | 63 (8.5%) | 68 (14.1%) |
| 4:00 PM to 11:59 PM | 42 (5.7%) | 31 (6.4%) |
| Total | 742 (100.0%) | 483 (100.0%) |
Housing Occupancy in Port Angeles East
Occupancy by Ownership in Port Angeles East
Of the total 1,370 dwellings in Port Angeles East, owner-occupied units account for 1,152 (84.1%), while renter-occupied units make up 218 (15.9%).
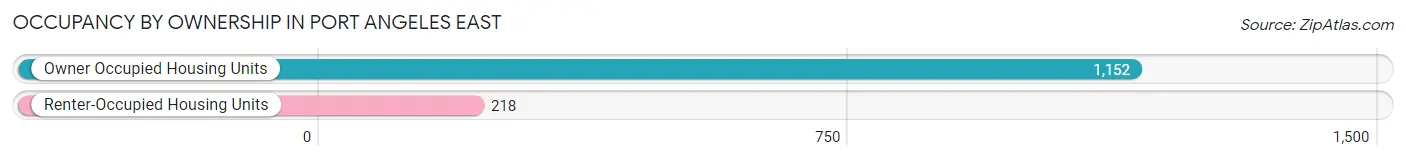
| Occupancy | # Housing Units | % Housing Units |
| Owner Occupied Housing Units | 1,152 | 84.1% |
| Renter-Occupied Housing Units | 218 | 15.9% |
| Total Occupied Housing Units | 1,370 | 100.0% |
Occupancy by Household Size in Port Angeles East
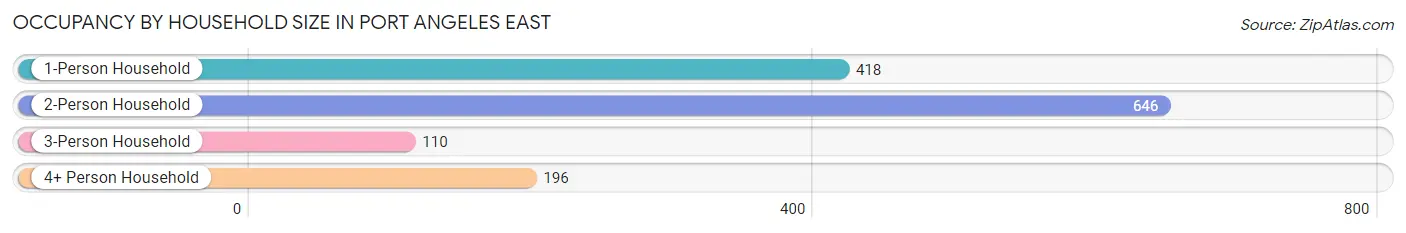
| Household Size | # Housing Units | % Housing Units |
| 1-Person Household | 418 | 30.5% |
| 2-Person Household | 646 | 47.1% |
| 3-Person Household | 110 | 8.0% |
| 4+ Person Household | 196 | 14.3% |
| Total Housing Units | 1,370 | 100.0% |
Occupancy by Ownership by Household Size in Port Angeles East
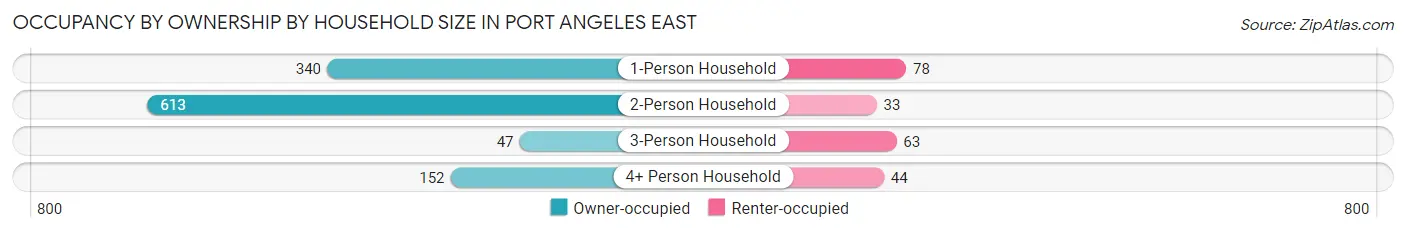
| Household Size | Owner-occupied | Renter-occupied |
| 1-Person Household | 340 (81.3%) | 78 (18.7%) |
| 2-Person Household | 613 (94.9%) | 33 (5.1%) |
| 3-Person Household | 47 (42.7%) | 63 (57.3%) |
| 4+ Person Household | 152 (77.5%) | 44 (22.5%) |
| Total Housing Units | 1,152 (84.1%) | 218 (15.9%) |
Occupancy by Educational Attainment in Port Angeles East
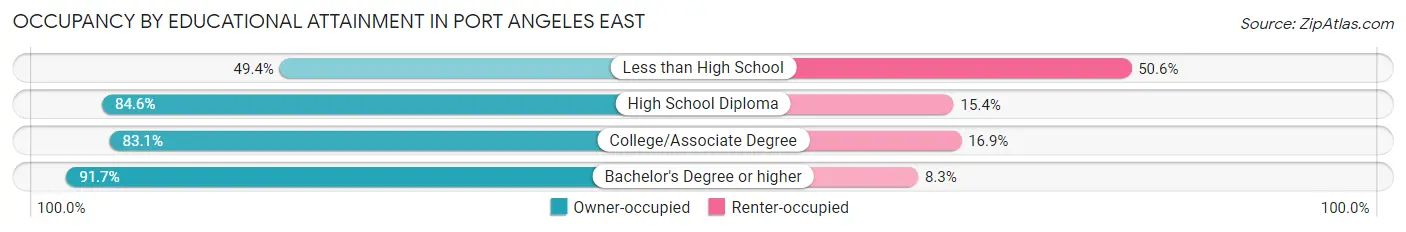
| Household Size | Owner-occupied | Renter-occupied |
| Less than High School | 43 (49.4%) | 44 (50.6%) |
| High School Diploma | 281 (84.6%) | 51 (15.4%) |
| College/Associate Degree | 429 (83.1%) | 87 (16.9%) |
| Bachelor's Degree or higher | 399 (91.7%) | 36 (8.3%) |
Occupancy by Age of Householder in Port Angeles East
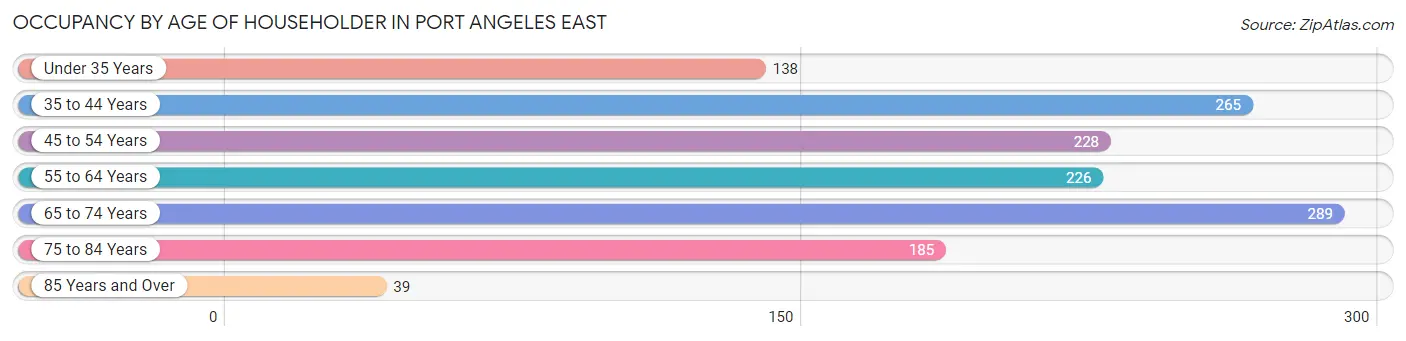
| Age Bracket | # Households | % Households |
| Under 35 Years | 138 | 10.1% |
| 35 to 44 Years | 265 | 19.3% |
| 45 to 54 Years | 228 | 16.6% |
| 55 to 64 Years | 226 | 16.5% |
| 65 to 74 Years | 289 | 21.1% |
| 75 to 84 Years | 185 | 13.5% |
| 85 Years and Over | 39 | 2.9% |
| Total | 1,370 | 100.0% |
Housing Finances in Port Angeles East
Median Income by Occupancy in Port Angeles East
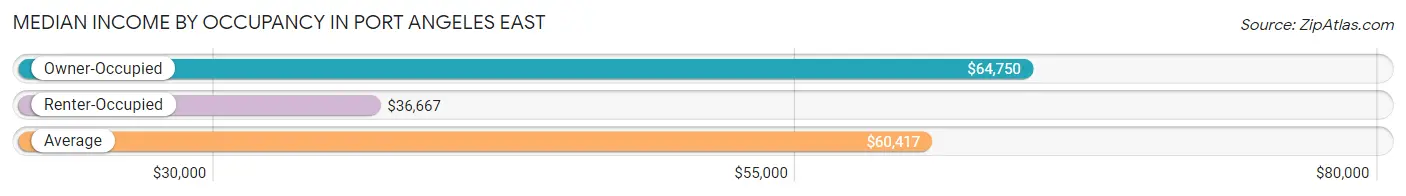
| Occupancy Type | # Households | Median Income |
| Owner-Occupied | 1,152 (84.1%) | $64,750 |
| Renter-Occupied | 218 (15.9%) | $36,667 |
| Average | 1,370 (100.0%) | $60,417 |
Occupancy by Householder Income Bracket in Port Angeles East
| Income Bracket | Owner-occupied | Renter-occupied |
| Less than $5,000 | 36 (3.1%) | 12 (5.5%) |
| $5,000 to $9,999 | 0 (0.0%) | 44 (20.2%) |
| $10,000 to $14,999 | 35 (3.0%) | 0 (0.0%) |
| $15,000 to $19,999 | 21 (1.8%) | 21 (9.6%) |
| $20,000 to $24,999 | 69 (6.0%) | 10 (4.6%) |
| $25,000 to $34,999 | 66 (5.7%) | 12 (5.5%) |
| $35,000 to $49,999 | 150 (13.0%) | 28 (12.8%) |
| $50,000 to $74,999 | 208 (18.1%) | 40 (18.3%) |
| $75,000 to $99,999 | 170 (14.8%) | 38 (17.4%) |
| $100,000 to $149,999 | 250 (21.7%) | 0 (0.0%) |
| $150,000 or more | 147 (12.8%) | 13 (6.0%) |
| Total | 1,152 (100.0%) | 218 (100.0%) |
Monthly Housing Cost Tiers in Port Angeles East
| Monthly Cost | Owner-occupied | Renter-occupied |
| Less than $300 | 195 (16.9%) | 0 (0.0%) |
| $300 to $499 | 66 (5.7%) | 10 (4.6%) |
| $500 to $799 | 269 (23.4%) | 44 (20.2%) |
| $800 to $999 | 65 (5.6%) | 61 (28.0%) |
| $1,000 to $1,499 | 215 (18.7%) | 58 (26.6%) |
| $1,500 to $1,999 | 162 (14.1%) | 11 (5.1%) |
| $2,000 to $2,499 | 103 (8.9%) | 13 (6.0%) |
| $2,500 to $2,999 | 8 (0.7%) | 0 (0.0%) |
| $3,000 or more | 69 (6.0%) | 0 (0.0%) |
| Total | 1,152 (100.0%) | 218 (100.0%) |
Physical Housing Characteristics in Port Angeles East
Housing Structures in Port Angeles East
| Structure Type | # Housing Units | % Housing Units |
| Single Unit, Detached | 1,041 | 76.0% |
| Single Unit, Attached | 25 | 1.8% |
| 2 Unit Apartments | 0 | 0.0% |
| 3 or 4 Unit Apartments | 12 | 0.9% |
| 5 to 9 Unit Apartments | 15 | 1.1% |
| 10 or more Apartments | 0 | 0.0% |
| Mobile Home / Other | 277 | 20.2% |
| Total | 1,370 | 100.0% |
Housing Structures by Occupancy in Port Angeles East
| Structure Type | Owner-occupied | Renter-occupied |
| Single Unit, Detached | 922 (88.6%) | 119 (11.4%) |
| Single Unit, Attached | 11 (44.0%) | 14 (56.0%) |
| 2 Unit Apartments | 0 (0.0%) | 0 (0.0%) |
| 3 or 4 Unit Apartments | 0 (0.0%) | 12 (100.0%) |
| 5 to 9 Unit Apartments | 0 (0.0%) | 15 (100.0%) |
| 10 or more Apartments | 0 (0.0%) | 0 (0.0%) |
| Mobile Home / Other | 219 (79.1%) | 58 (20.9%) |
| Total | 1,152 (84.1%) | 218 (15.9%) |
Housing Structures by Number of Rooms in Port Angeles East
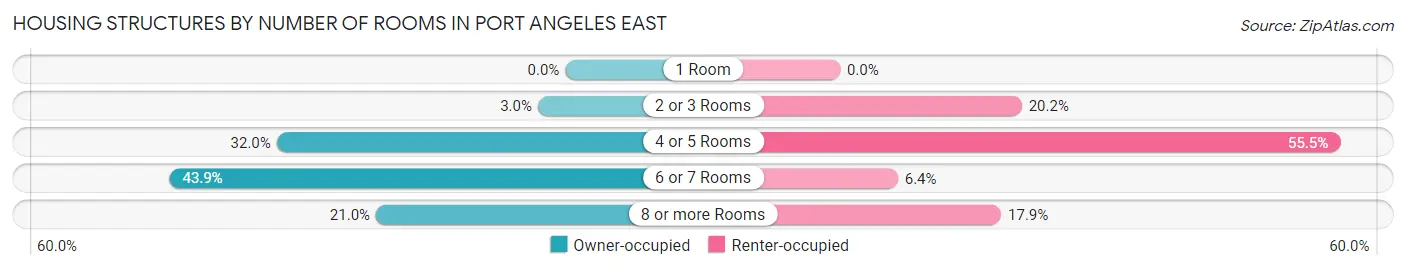
| Number of Rooms | Owner-occupied | Renter-occupied |
| 1 Room | 0 (0.0%) | 0 (0.0%) |
| 2 or 3 Rooms | 35 (3.0%) | 44 (20.2%) |
| 4 or 5 Rooms | 369 (32.0%) | 121 (55.5%) |
| 6 or 7 Rooms | 506 (43.9%) | 14 (6.4%) |
| 8 or more Rooms | 242 (21.0%) | 39 (17.9%) |
| Total | 1,152 (100.0%) | 218 (100.0%) |
Housing Structure by Heating Type in Port Angeles East
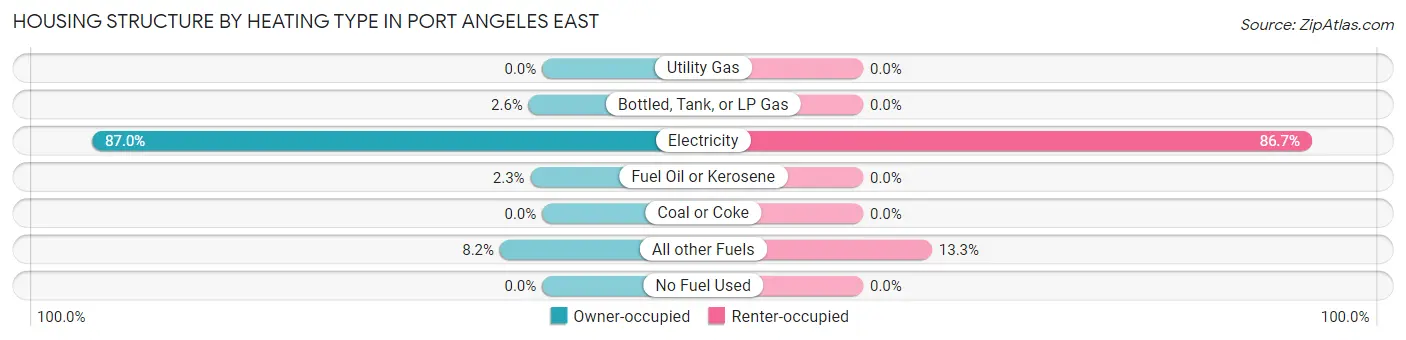
| Heating Type | Owner-occupied | Renter-occupied |
| Utility Gas | 0 (0.0%) | 0 (0.0%) |
| Bottled, Tank, or LP Gas | 30 (2.6%) | 0 (0.0%) |
| Electricity | 1,002 (87.0%) | 189 (86.7%) |
| Fuel Oil or Kerosene | 26 (2.3%) | 0 (0.0%) |
| Coal or Coke | 0 (0.0%) | 0 (0.0%) |
| All other Fuels | 94 (8.2%) | 29 (13.3%) |
| No Fuel Used | 0 (0.0%) | 0 (0.0%) |
| Total | 1,152 (100.0%) | 218 (100.0%) |
Household Vehicle Usage in Port Angeles East
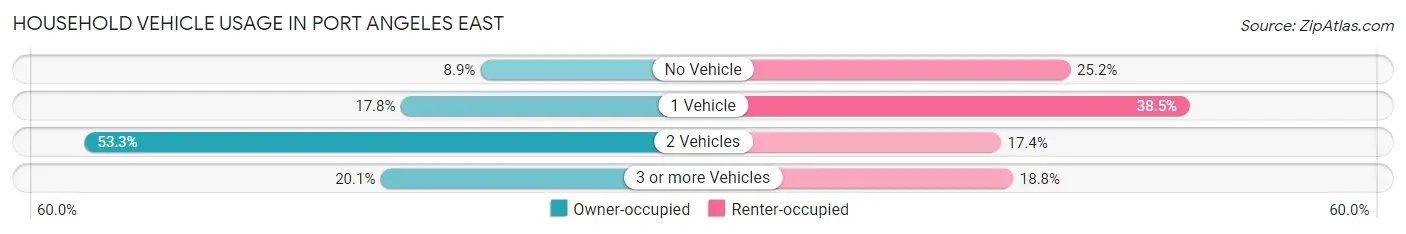
| Vehicles per Household | Owner-occupied | Renter-occupied |
| No Vehicle | 102 (8.8%) | 55 (25.2%) |
| 1 Vehicle | 205 (17.8%) | 84 (38.5%) |
| 2 Vehicles | 614 (53.3%) | 38 (17.4%) |
| 3 or more Vehicles | 231 (20.1%) | 41 (18.8%) |
| Total | 1,152 (100.0%) | 218 (100.0%) |
Real Estate & Mortgages in Port Angeles East
Real Estate and Mortgage Overview in Port Angeles East
| Characteristic | Without Mortgage | With Mortgage |
| Housing Units | 561 | 591 |
| Median Property Value | $285,900 | $326,200 |
| Median Household Income | $53,467 | $68 |
| Monthly Housing Costs | $513 | $69 |
| Real Estate Taxes | - | - |
Property Value by Mortgage Status in Port Angeles East
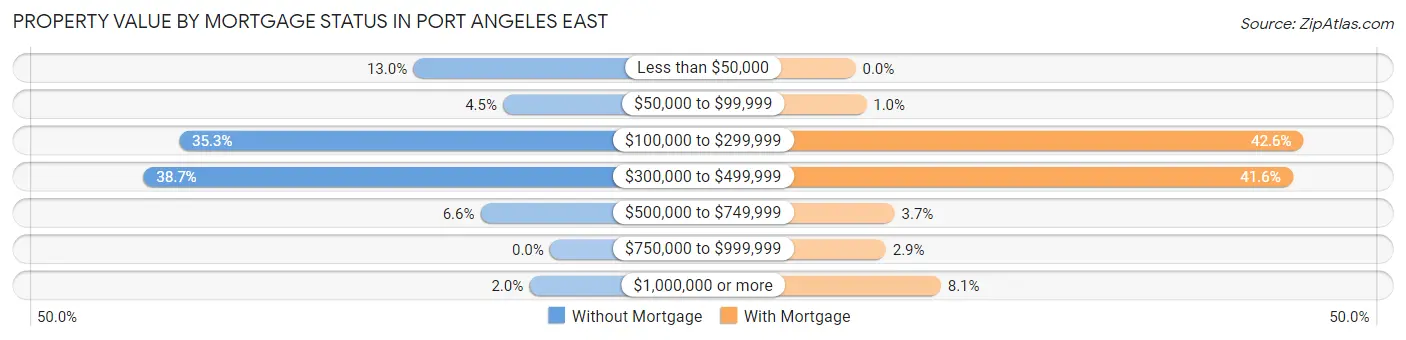
| Property Value | Without Mortgage | With Mortgage |
| Less than $50,000 | 73 (13.0%) | 0 (0.0%) |
| $50,000 to $99,999 | 25 (4.5%) | 6 (1.0%) |
| $100,000 to $299,999 | 198 (35.3%) | 252 (42.6%) |
| $300,000 to $499,999 | 217 (38.7%) | 246 (41.6%) |
| $500,000 to $749,999 | 37 (6.6%) | 22 (3.7%) |
| $750,000 to $999,999 | 0 (0.0%) | 17 (2.9%) |
| $1,000,000 or more | 11 (2.0%) | 48 (8.1%) |
| Total | 561 (100.0%) | 591 (100.0%) |
Household Income by Mortgage Status in Port Angeles East
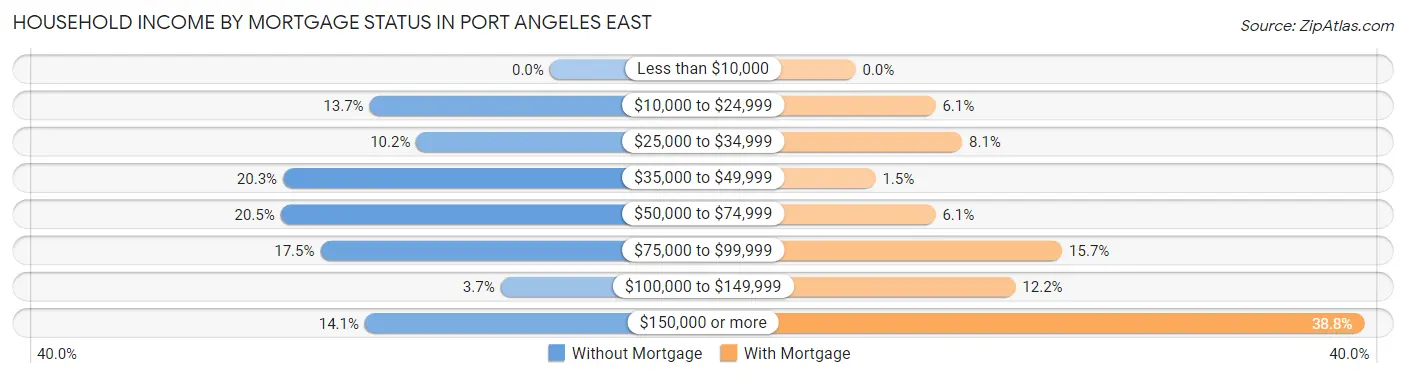
| Household Income | Without Mortgage | With Mortgage |
| Less than $10,000 | 0 (0.0%) | 0 (0.0%) |
| $10,000 to $24,999 | 77 (13.7%) | 36 (6.1%) |
| $25,000 to $34,999 | 57 (10.2%) | 48 (8.1%) |
| $35,000 to $49,999 | 114 (20.3%) | 9 (1.5%) |
| $50,000 to $74,999 | 115 (20.5%) | 36 (6.1%) |
| $75,000 to $99,999 | 98 (17.5%) | 93 (15.7%) |
| $100,000 to $149,999 | 21 (3.7%) | 72 (12.2%) |
| $150,000 or more | 79 (14.1%) | 229 (38.8%) |
| Total | 561 (100.0%) | 591 (100.0%) |
Property Value to Household Income Ratio in Port Angeles East
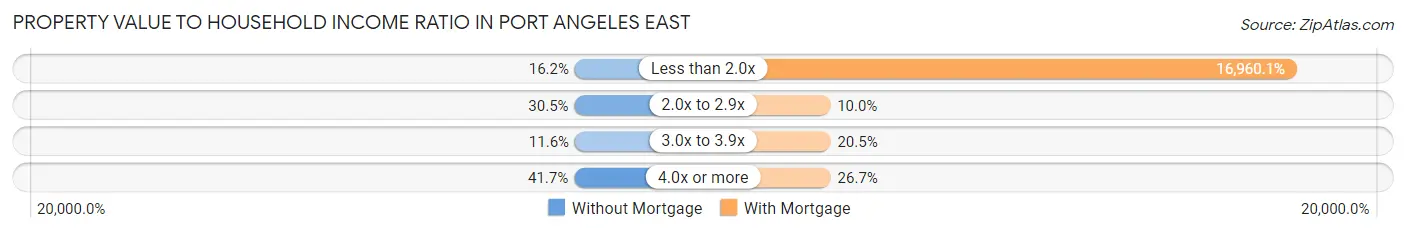
| Value-to-Income Ratio | Without Mortgage | With Mortgage |
| Less than 2.0x | 91 (16.2%) | 100,234 (16,960.1%) |
| 2.0x to 2.9x | 171 (30.5%) | 59 (10.0%) |
| 3.0x to 3.9x | 65 (11.6%) | 121 (20.5%) |
| 4.0x or more | 234 (41.7%) | 158 (26.7%) |
| Total | 561 (100.0%) | 591 (100.0%) |
Real Estate Taxes by Mortgage Status in Port Angeles East
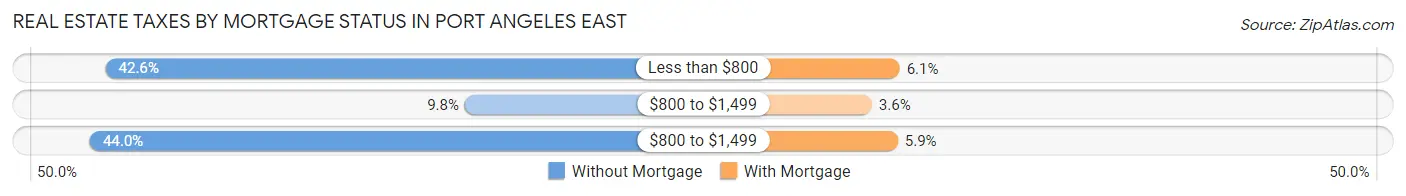
| Property Taxes | Without Mortgage | With Mortgage |
| Less than $800 | 239 (42.6%) | 36 (6.1%) |
| $800 to $1,499 | 55 (9.8%) | 21 (3.5%) |
| $800 to $1,499 | 247 (44.0%) | 35 (5.9%) |
| Total | 561 (100.0%) | 591 (100.0%) |
Health & Disability in Port Angeles East
Health Insurance Coverage by Age in Port Angeles East
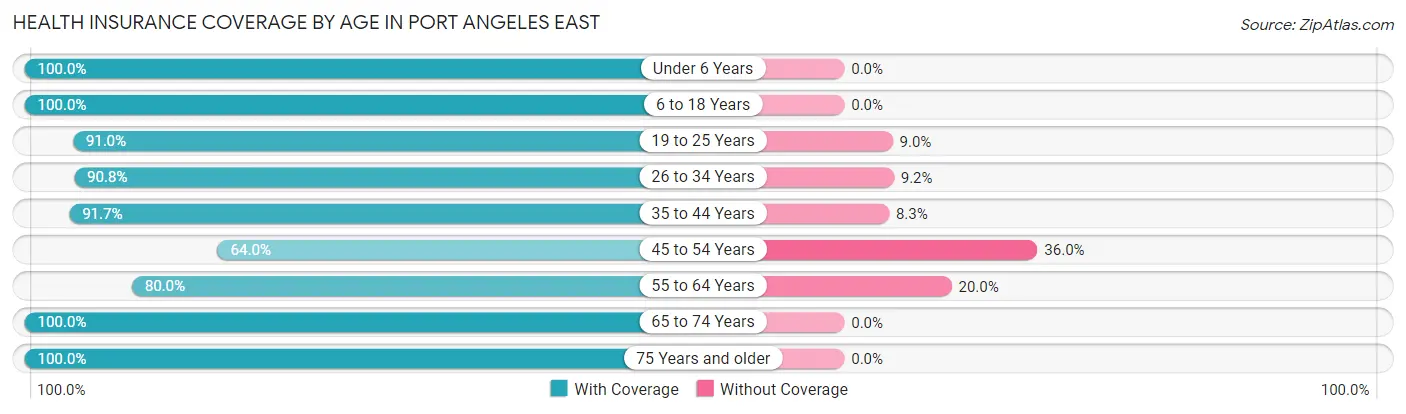
| Age Bracket | With Coverage | Without Coverage |
| Under 6 Years | 173 (100.0%) | 0 (0.0%) |
| 6 to 18 Years | 300 (100.0%) | 0 (0.0%) |
| 19 to 25 Years | 101 (91.0%) | 10 (9.0%) |
| 26 to 34 Years | 246 (90.8%) | 25 (9.2%) |
| 35 to 44 Years | 539 (91.7%) | 49 (8.3%) |
| 45 to 54 Years | 279 (64.0%) | 157 (36.0%) |
| 55 to 64 Years | 308 (80.0%) | 77 (20.0%) |
| 65 to 74 Years | 499 (100.0%) | 0 (0.0%) |
| 75 Years and older | 272 (100.0%) | 0 (0.0%) |
| Total | 2,717 (89.5%) | 318 (10.5%) |
Health Insurance Coverage by Citizenship Status in Port Angeles East
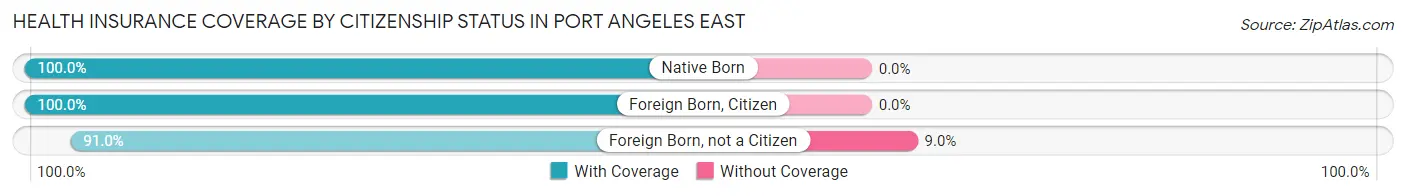
| Citizenship Status | With Coverage | Without Coverage |
| Native Born | 173 (100.0%) | 0 (0.0%) |
| Foreign Born, Citizen | 300 (100.0%) | 0 (0.0%) |
| Foreign Born, not a Citizen | 101 (91.0%) | 10 (9.0%) |
Health Insurance Coverage by Household Income in Port Angeles East
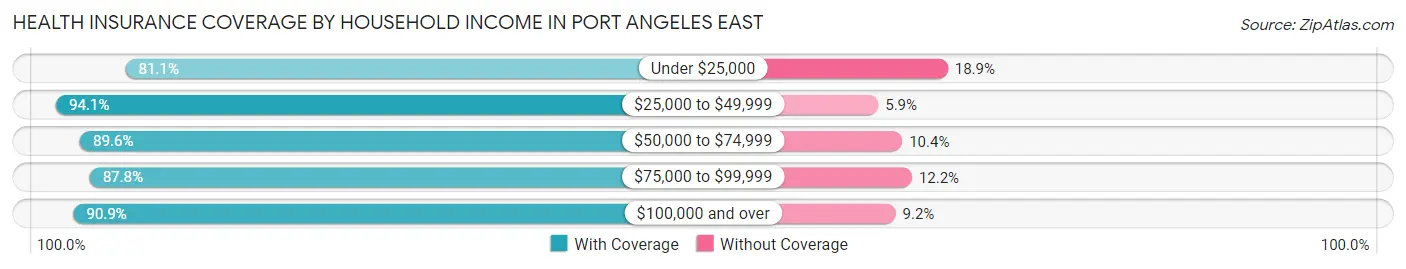
| Household Income | With Coverage | Without Coverage |
| Under $25,000 | 270 (81.1%) | 63 (18.9%) |
| $25,000 to $49,999 | 431 (94.1%) | 27 (5.9%) |
| $50,000 to $74,999 | 500 (89.6%) | 58 (10.4%) |
| $75,000 to $99,999 | 453 (87.8%) | 63 (12.2%) |
| $100,000 and over | 1,063 (90.8%) | 107 (9.1%) |
Public vs Private Health Insurance Coverage by Age in Port Angeles East
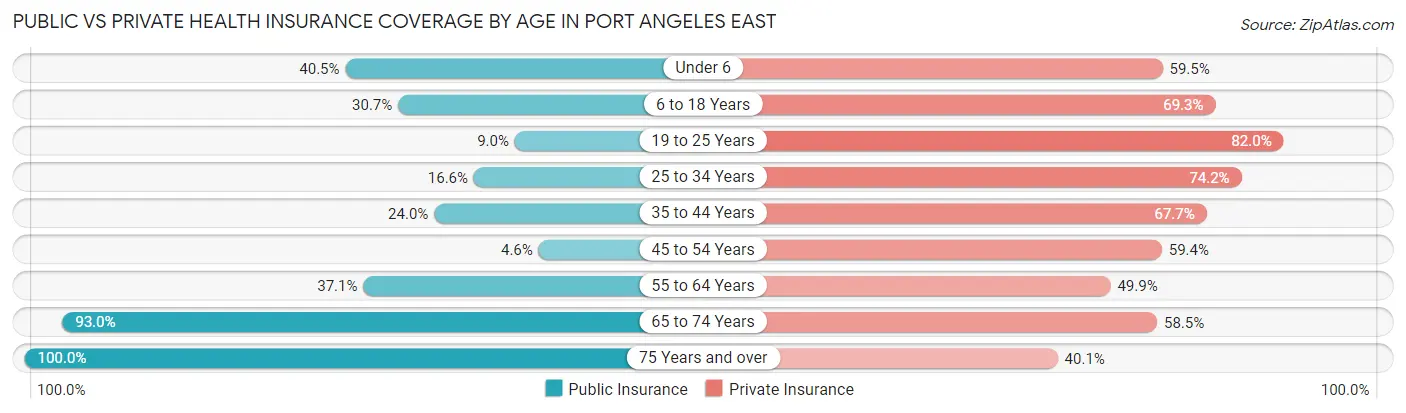
| Age Bracket | Public Insurance | Private Insurance |
| Under 6 | 70 (40.5%) | 103 (59.5%) |
| 6 to 18 Years | 92 (30.7%) | 208 (69.3%) |
| 19 to 25 Years | 10 (9.0%) | 91 (82.0%) |
| 25 to 34 Years | 45 (16.6%) | 201 (74.2%) |
| 35 to 44 Years | 141 (24.0%) | 398 (67.7%) |
| 45 to 54 Years | 20 (4.6%) | 259 (59.4%) |
| 55 to 64 Years | 143 (37.1%) | 192 (49.9%) |
| 65 to 74 Years | 464 (93.0%) | 292 (58.5%) |
| 75 Years and over | 272 (100.0%) | 109 (40.1%) |
| Total | 1,257 (41.4%) | 1,853 (61.1%) |
Disability Status by Sex by Age in Port Angeles East
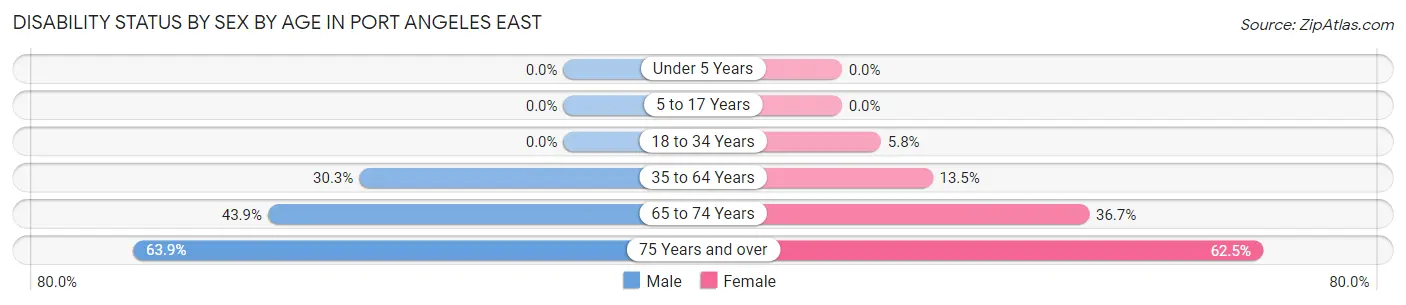
| Age Bracket | Male | Female |
| Under 5 Years | 0 (0.0%) | 0 (0.0%) |
| 5 to 17 Years | 0 (0.0%) | 0 (0.0%) |
| 18 to 34 Years | 0 (0.0%) | 13 (5.8%) |
| 35 to 64 Years | 263 (30.3%) | 73 (13.5%) |
| 65 to 74 Years | 115 (43.9%) | 87 (36.7%) |
| 75 Years and over | 46 (63.9%) | 125 (62.5%) |
Disability Class by Sex by Age in Port Angeles East
Disability Class: Hearing Difficulty
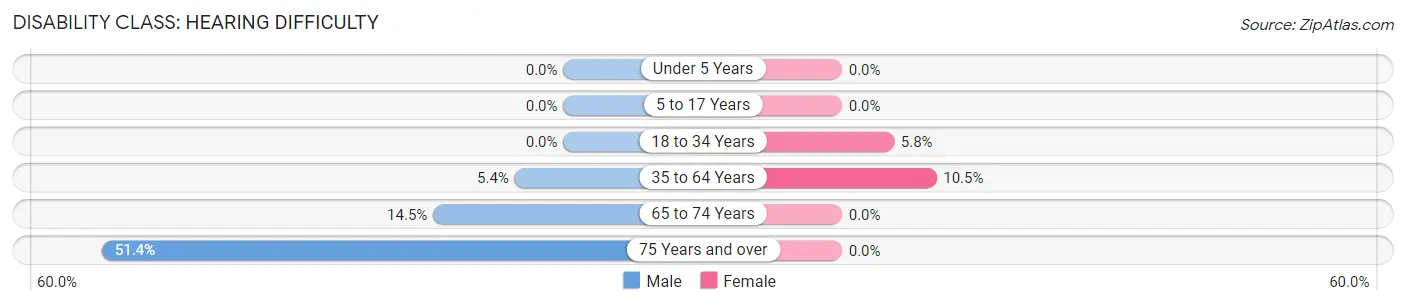
| Age Bracket | Male | Female |
| Under 5 Years | 0 (0.0%) | 0 (0.0%) |
| 5 to 17 Years | 0 (0.0%) | 0 (0.0%) |
| 18 to 34 Years | 0 (0.0%) | 13 (5.8%) |
| 35 to 64 Years | 47 (5.4%) | 57 (10.5%) |
| 65 to 74 Years | 38 (14.5%) | 0 (0.0%) |
| 75 Years and over | 37 (51.4%) | 0 (0.0%) |
Disability Class: Vision Difficulty
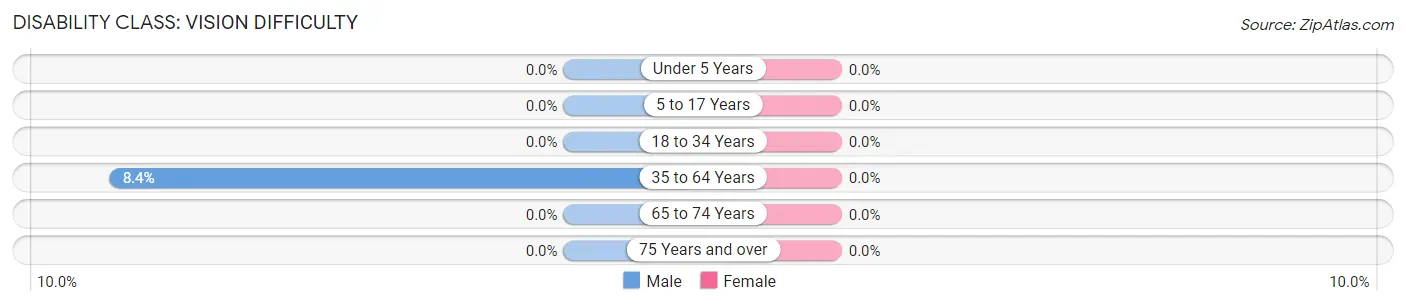
| Age Bracket | Male | Female |
| Under 5 Years | 0 (0.0%) | 0 (0.0%) |
| 5 to 17 Years | 0 (0.0%) | 0 (0.0%) |
| 18 to 34 Years | 0 (0.0%) | 0 (0.0%) |
| 35 to 64 Years | 73 (8.4%) | 0 (0.0%) |
| 65 to 74 Years | 0 (0.0%) | 0 (0.0%) |
| 75 Years and over | 0 (0.0%) | 0 (0.0%) |
Disability Class: Cognitive Difficulty
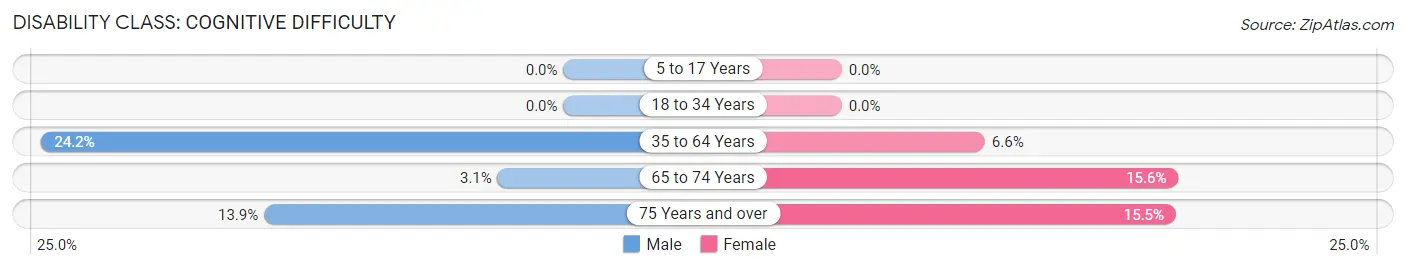
| Age Bracket | Male | Female |
| 5 to 17 Years | 0 (0.0%) | 0 (0.0%) |
| 18 to 34 Years | 0 (0.0%) | 0 (0.0%) |
| 35 to 64 Years | 210 (24.2%) | 36 (6.6%) |
| 65 to 74 Years | 8 (3.0%) | 37 (15.6%) |
| 75 Years and over | 10 (13.9%) | 31 (15.5%) |
Disability Class: Ambulatory Difficulty
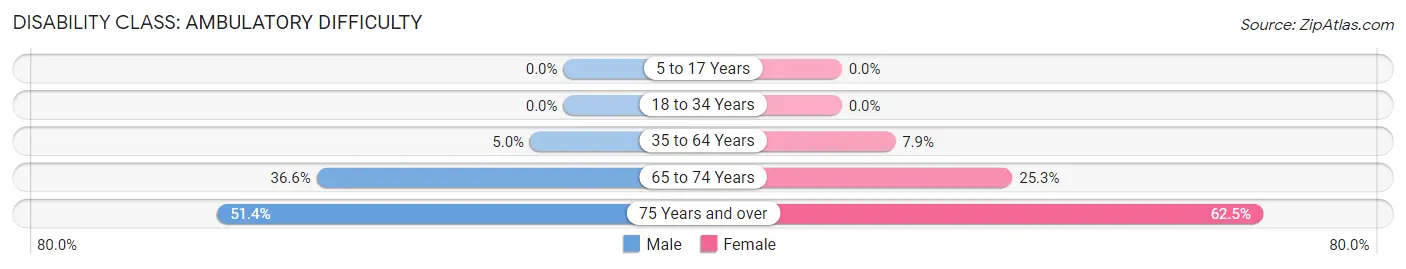
| Age Bracket | Male | Female |
| 5 to 17 Years | 0 (0.0%) | 0 (0.0%) |
| 18 to 34 Years | 0 (0.0%) | 0 (0.0%) |
| 35 to 64 Years | 43 (5.0%) | 43 (7.9%) |
| 65 to 74 Years | 96 (36.6%) | 60 (25.3%) |
| 75 Years and over | 37 (51.4%) | 125 (62.5%) |
Disability Class: Self-Care Difficulty
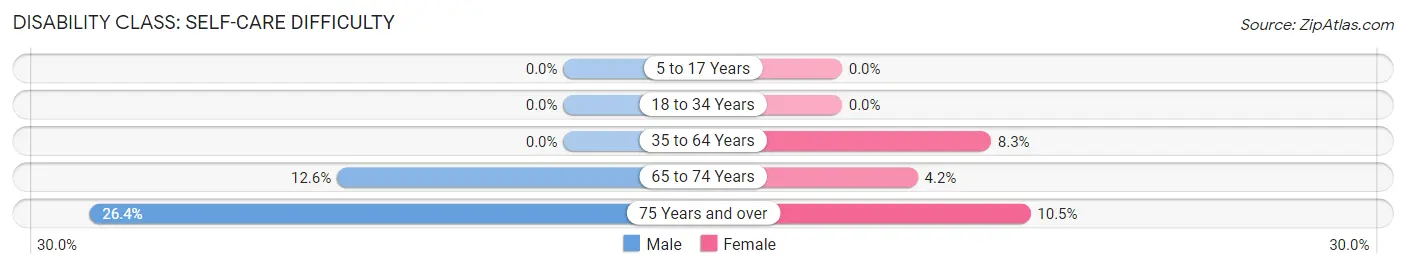
| Age Bracket | Male | Female |
| 5 to 17 Years | 0 (0.0%) | 0 (0.0%) |
| 18 to 34 Years | 0 (0.0%) | 0 (0.0%) |
| 35 to 64 Years | 0 (0.0%) | 45 (8.3%) |
| 65 to 74 Years | 33 (12.6%) | 10 (4.2%) |
| 75 Years and over | 19 (26.4%) | 21 (10.5%) |
Technology Access in Port Angeles East
Computing Device Access in Port Angeles East
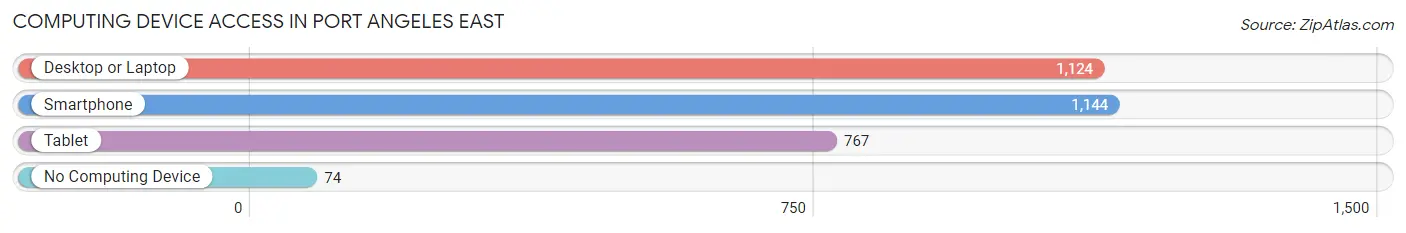
| Device Type | # Households | % Households |
| Desktop or Laptop | 1,124 | 82.0% |
| Smartphone | 1,144 | 83.5% |
| Tablet | 767 | 56.0% |
| No Computing Device | 74 | 5.4% |
| Total | 1,370 | 100.0% |
Internet Access in Port Angeles East
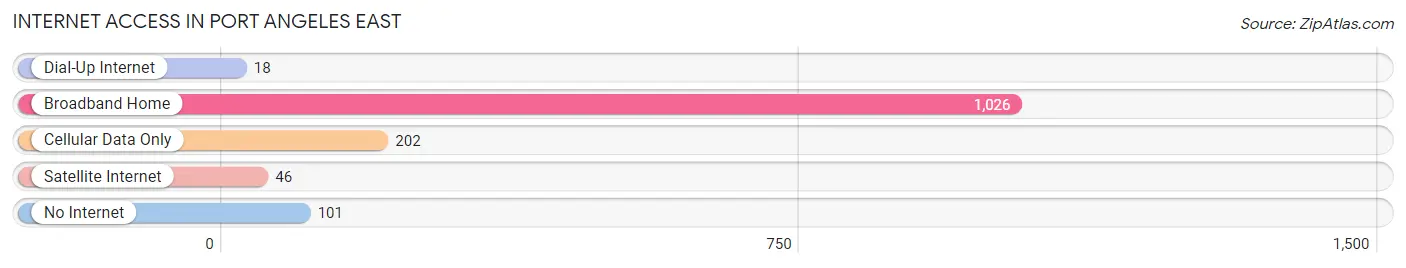
| Internet Type | # Households | % Households |
| Dial-Up Internet | 18 | 1.3% |
| Broadband Home | 1,026 | 74.9% |
| Cellular Data Only | 202 | 14.7% |
| Satellite Internet | 46 | 3.4% |
| No Internet | 101 | 7.4% |
| Total | 1,370 | 100.0% |
Port Angeles East Summary
Port Angeles East, Washington is a small city located in the Olympic Peninsula of Washington State. It is situated on the Strait of Juan de Fuca, and is the county seat of Clallam County. The city has a population of 19,038, according to the 2010 census.
History
The area that is now Port Angeles East was first inhabited by the Klallam people, who lived in the area for thousands of years before the arrival of Europeans. The first Europeans to explore the area were Spanish explorers, who arrived in 1790. The area was later explored by the British, who named it Port Angeles in 1792.
In 1859, the area was officially incorporated as a city. The city was named after the Spanish explorer, Juan de Fuca, who explored the area in the late 16th century.
The city grew rapidly in the late 19th century, due to the logging industry. The city was also a major port for the shipping of lumber and other goods.
In the early 20th century, the city was a major center for the fishing industry. The city was also a major tourist destination, due to its proximity to the Olympic National Park.
Geography
Port Angeles East is located on the Olympic Peninsula of Washington State. It is situated on the Strait of Juan de Fuca, and is the county seat of Clallam County. The city is located at the mouth of the Elwha River, and is surrounded by the Olympic Mountains to the east and the Strait of Juan de Fuca to the west.
The city has a total area of 8.3 square miles, of which 8.2 square miles is land and 0.1 square miles is water. The city has a mild climate, with temperatures ranging from the mid-30s in the winter to the mid-70s in the summer.
Economy
The economy of Port Angeles East is largely based on tourism, fishing, and logging. The city is a major tourist destination, due to its proximity to the Olympic National Park. The city is also a major port for the shipping of lumber and other goods.
The city is home to several major employers, including the Port of Port Angeles, the Clallam County Public Utility District, and the Olympic Medical Center. The city is also home to several smaller businesses, including restaurants, retail stores, and hotels.
Demographics
According to the 2010 census, the population of Port Angeles East was 19,038. The racial makeup of the city was 87.3% White, 1.2% African American, 0.7% Native American, 4.2% Asian, 0.2% Pacific Islander, 2.3% from other races, and 4.3% from two or more races. Hispanic or Latino of any race were 8.2% of the population.
The median income for a household in the city was $41,945, and the median income for a family was $50,945. The per capita income for the city was $21,945. About 11.3% of families and 15.2% of the population were below the poverty line, including 22.2% of those under age 18 and 8.2% of those age 65 or over.
Common Questions
What is Per Capita Income in Port Angeles East?
Per Capita income in Port Angeles East is $34,794.
What is the Median Family Income in Port Angeles East?
Median Family Income in Port Angeles East is $83,242.
What is the Median Household income in Port Angeles East?
Median Household Income in Port Angeles East is $60,417.
What is Income or Wage Gap in Port Angeles East?
Income or Wage Gap in Port Angeles East is 42.8%.
Women in Port Angeles East earn 57.2 cents for every dollar earned by a man.
What is Inequality or Gini Index in Port Angeles East?
Inequality or Gini Index in Port Angeles East is 0.40.
What is the Total Population of Port Angeles East?
Total Population of Port Angeles East is 3,035.
What is the Total Male Population of Port Angeles East?
Total Male Population of Port Angeles East is 1,550.
What is the Total Female Population of Port Angeles East?
Total Female Population of Port Angeles East is 1,485.
What is the Ratio of Males per 100 Females in Port Angeles East?
There are 104.38 Males per 100 Females in Port Angeles East.
What is the Ratio of Females per 100 Males in Port Angeles East?
There are 95.81 Females per 100 Males in Port Angeles East.
What is the Median Population Age in Port Angeles East?
Median Population Age in Port Angeles East is 45.9 Years.
What is the Average Family Size in Port Angeles East
Average Family Size in Port Angeles East is 2.8 People.
What is the Average Household Size in Port Angeles East
Average Household Size in Port Angeles East is 2.2 People.
How Large is the Labor Force in Port Angeles East?
There are 1,401 People in the Labor Forcein in Port Angeles East.
What is the Percentage of People in the Labor Force in Port Angeles East?
54.3% of People are in the Labor Force in Port Angeles East.
What is the Unemployment Rate in Port Angeles East?
Unemployment Rate in Port Angeles East is 3.6%.