Home, WA Map & Demographics
Home Map
Home Overview
$33,608
PER CAPITA INCOME
$120,128
AVG FAMILY INCOME
$89,444
AVG HOUSEHOLD INCOME
6.6%
WAGE / INCOME GAP [ % ]
93.4¢/ $1
WAGE / INCOME GAP [ $ ]
0.36
INEQUALITY / GINI INDEX
1,692
TOTAL POPULATION
885
MALE POPULATION
807
FEMALE POPULATION
109.67
MALES / 100 FEMALES
91.19
FEMALES / 100 MALES
31.3
MEDIAN AGE
4.0
AVG FAMILY SIZE
3.0
AVG HOUSEHOLD SIZE
699
LABOR FORCE [ PEOPLE ]
62.5%
PERCENT IN LABOR FORCE
Home Area Codes
Income in Home
Income Overview in Home
Per Capita Income in Home is $33,608, while median incomes of families and households are $120,128 and $89,444 respectively.
| Characteristic | Number | Measure |
| Per Capita Income | 1,692 | $33,608 |
| Median Family Income | 356 | $120,128 |
| Mean Family Income | 356 | $123,003 |
| Median Household Income | 554 | $89,444 |
| Mean Household Income | 554 | $101,956 |
| Income Deficit | 356 | $0 |
| Wage / Income Gap (%) | 1,692 | 6.56% |
| Wage / Income Gap ($) | 1,692 | 93.44¢ per $1 |
| Gini / Inequality Index | 1,692 | 0.36 |
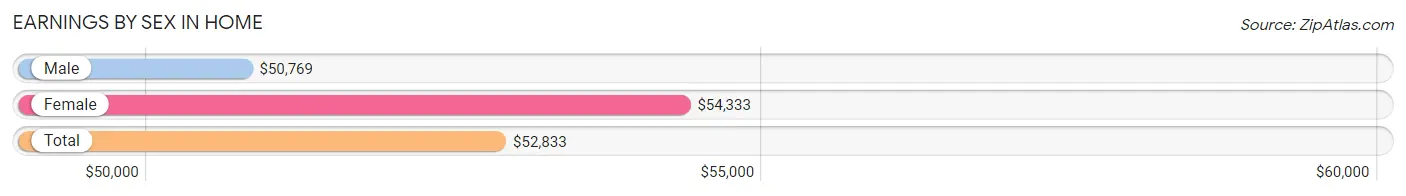
Earnings by Sex in Home
Average Earnings in Home are $52,833, $50,769 for men and $54,333 for women, a difference of 6.6%.
| Sex | Number | Average Earnings |
| Male | 406 (58.0%) | $50,769 |
| Female | 294 (42.0%) | $54,333 |
| Total | 700 (100.0%) | $52,833 |
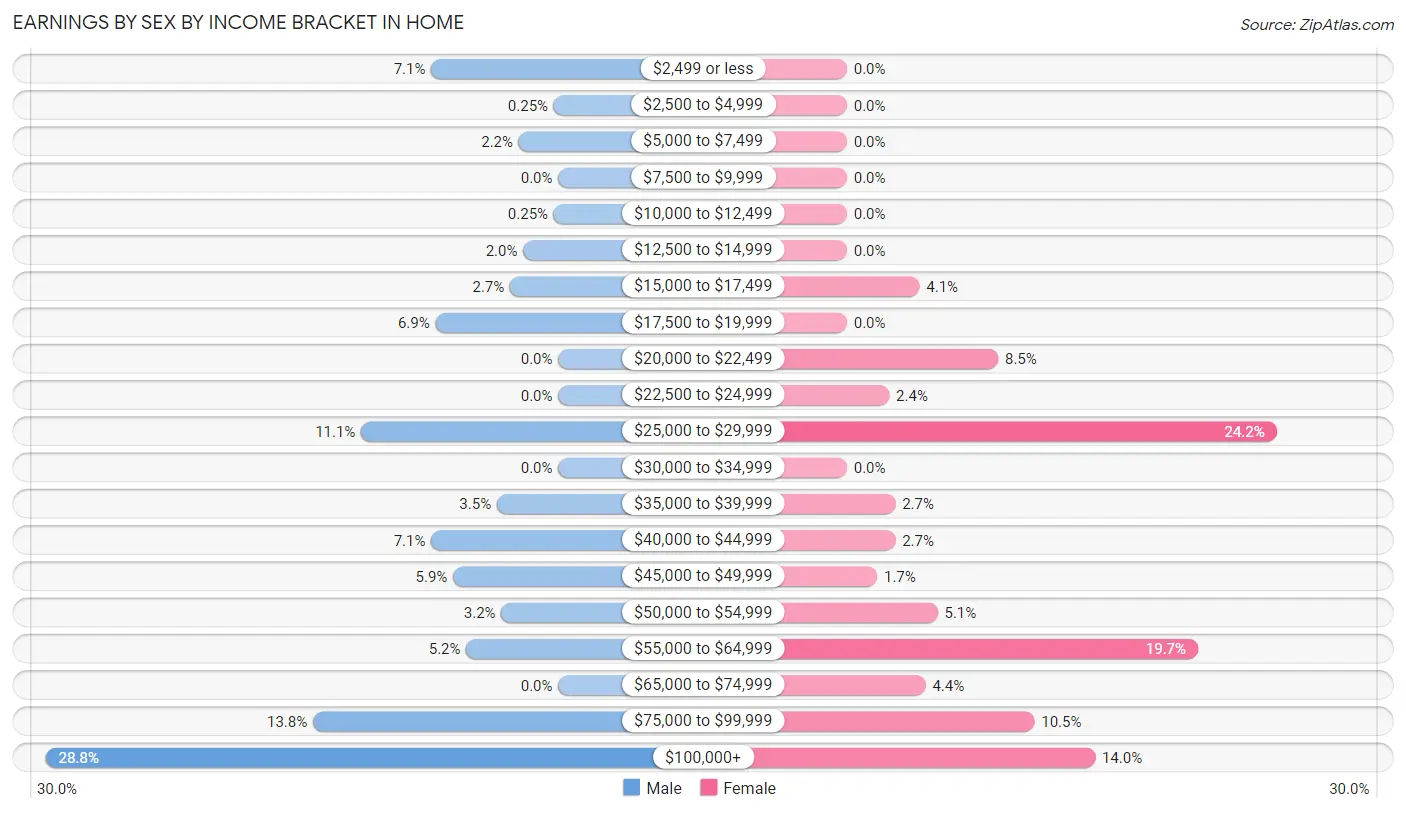
Earnings by Sex by Income Bracket in Home
The most common earnings brackets in Home are $100,000+ for men (117 | 28.8%) and $25,000 to $29,999 for women (71 | 24.1%).
| Income | Male | Female |
| $2,499 or less | 29 (7.1%) | 0 (0.0%) |
| $2,500 to $4,999 | 1 (0.3%) | 0 (0.0%) |
| $5,000 to $7,499 | 9 (2.2%) | 0 (0.0%) |
| $7,500 to $9,999 | 0 (0.0%) | 0 (0.0%) |
| $10,000 to $12,499 | 1 (0.3%) | 0 (0.0%) |
| $12,500 to $14,999 | 8 (2.0%) | 0 (0.0%) |
| $15,000 to $17,499 | 11 (2.7%) | 12 (4.1%) |
| $17,500 to $19,999 | 28 (6.9%) | 0 (0.0%) |
| $20,000 to $22,499 | 0 (0.0%) | 25 (8.5%) |
| $22,500 to $24,999 | 0 (0.0%) | 7 (2.4%) |
| $25,000 to $29,999 | 45 (11.1%) | 71 (24.1%) |
| $30,000 to $34,999 | 0 (0.0%) | 0 (0.0%) |
| $35,000 to $39,999 | 14 (3.5%) | 8 (2.7%) |
| $40,000 to $44,999 | 29 (7.1%) | 8 (2.7%) |
| $45,000 to $49,999 | 24 (5.9%) | 5 (1.7%) |
| $50,000 to $54,999 | 13 (3.2%) | 15 (5.1%) |
| $55,000 to $64,999 | 21 (5.2%) | 58 (19.7%) |
| $65,000 to $74,999 | 0 (0.0%) | 13 (4.4%) |
| $75,000 to $99,999 | 56 (13.8%) | 31 (10.5%) |
| $100,000+ | 117 (28.8%) | 41 (14.0%) |
| Total | 406 (100.0%) | 294 (100.0%) |
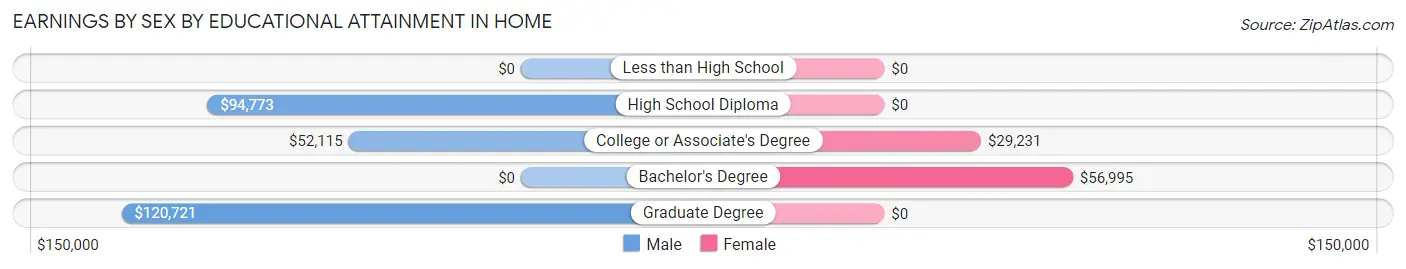
Earnings by Sex by Educational Attainment in Home
Average earnings in Home are $57,333 for men and $55,452 for women, a difference of 3.3%. Men with an educational attainment of graduate degree enjoy the highest average annual earnings of $120,721, while those with college or associate's degree education earn the least with $52,115. Women with an educational attainment of bachelor's degree earn the most with the average annual earnings of $56,995, while those with college or associate's degree education have the smallest earnings of $29,231.
| Educational Attainment | Male Income | Female Income |
| Less than High School | - | - |
| High School Diploma | $94,773 | $0 |
| College or Associate's Degree | $52,115 | $29,231 |
| Bachelor's Degree | - | - |
| Graduate Degree | $120,721 | $0 |
| Total | $57,333 | $55,452 |
Family Income in Home
Family Income Brackets in Home
According to the Home family income data, there are 129 families falling into the $100,000 to $149,999 income range, which is the most common income bracket and makes up 36.2% of all families.
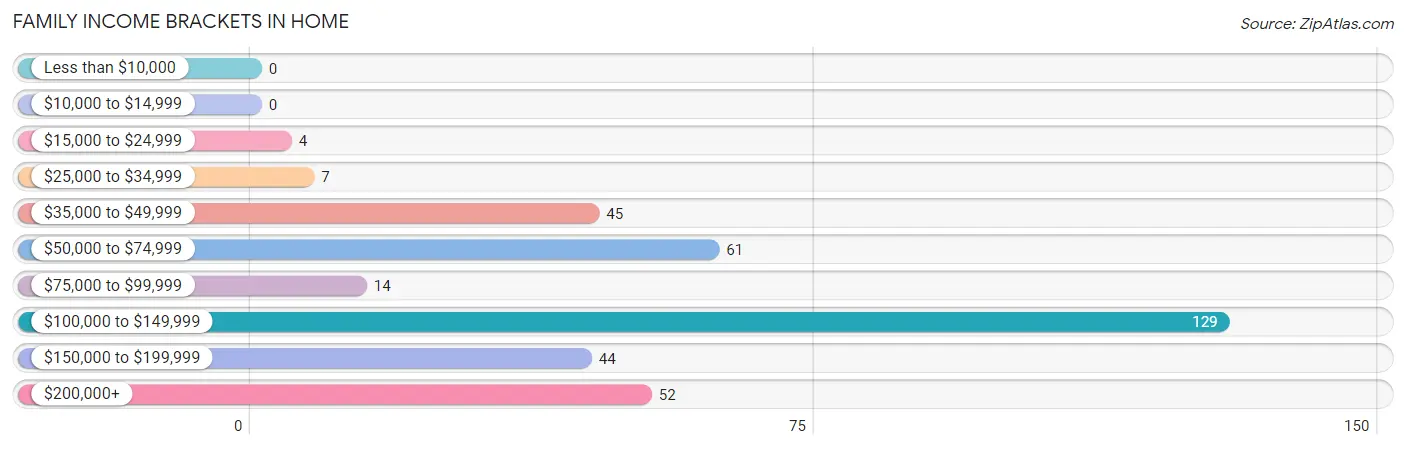
| Income Bracket | # Families | % Families |
| Less than $10,000 | 0 | 0.0% |
| $10,000 to $14,999 | 0 | 0.0% |
| $15,000 to $24,999 | 4 | 1.1% |
| $25,000 to $34,999 | 7 | 2.0% |
| $35,000 to $49,999 | 45 | 12.6% |
| $50,000 to $74,999 | 61 | 17.1% |
| $75,000 to $99,999 | 14 | 3.9% |
| $100,000 to $149,999 | 129 | 36.2% |
| $150,000 to $199,999 | 44 | 12.4% |
| $200,000+ | 52 | 14.6% |
Family Income by Famaliy Size in Home
2-person families (100 | 28.1%) account for the highest median family income in Home with $108,553 per family, while 2-person families (100 | 28.1%) have the highest median income of $54,276 per family member.
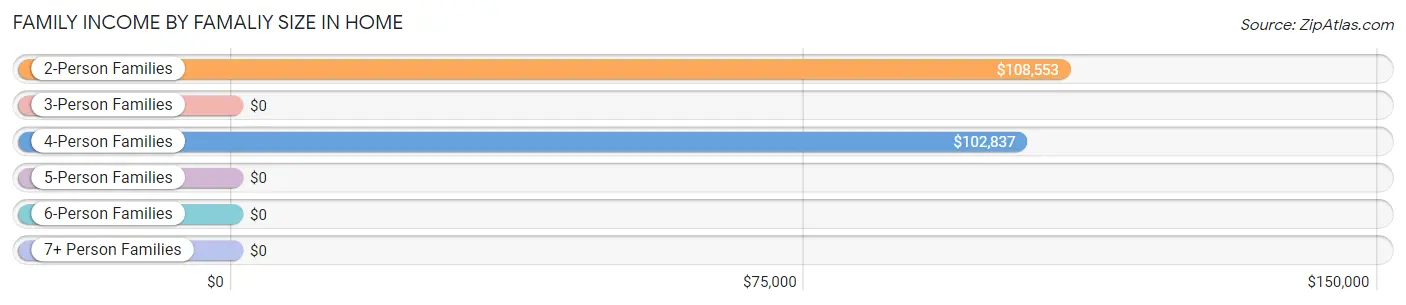
| Income Bracket | # Families | Median Income |
| 2-Person Families | 100 (28.1%) | $108,553 |
| 3-Person Families | 78 (21.9%) | $0 |
| 4-Person Families | 105 (29.5%) | $102,837 |
| 5-Person Families | 15 (4.2%) | $0 |
| 6-Person Families | 39 (11.0%) | $0 |
| 7+ Person Families | 19 (5.3%) | $0 |
| Total | 356 (100.0%) | $120,128 |
Family Income by Number of Earners in Home
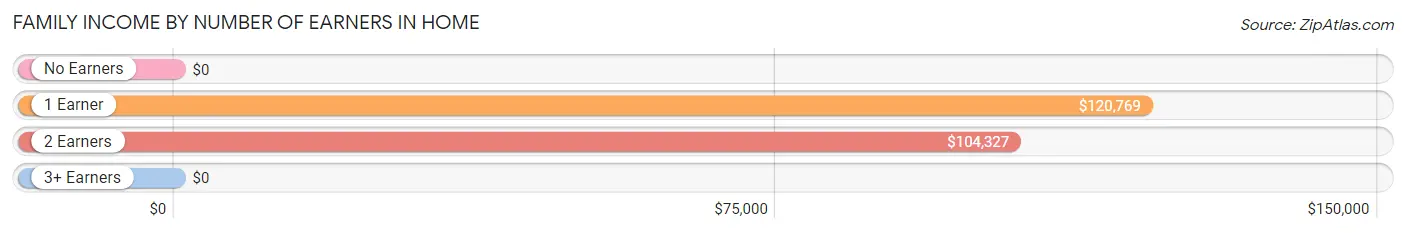
| Number of Earners | # Families | Median Income |
| No Earners | 37 (10.4%) | $0 |
| 1 Earner | 140 (39.3%) | $120,769 |
| 2 Earners | 148 (41.6%) | $104,327 |
| 3+ Earners | 31 (8.7%) | $0 |
| Total | 356 (100.0%) | $120,128 |
Household Income in Home
Household Income Brackets in Home
With 148 households falling in the category, the $100,000 to $149,999 income range is the most frequent in Home, accounting for 26.7% of all households.
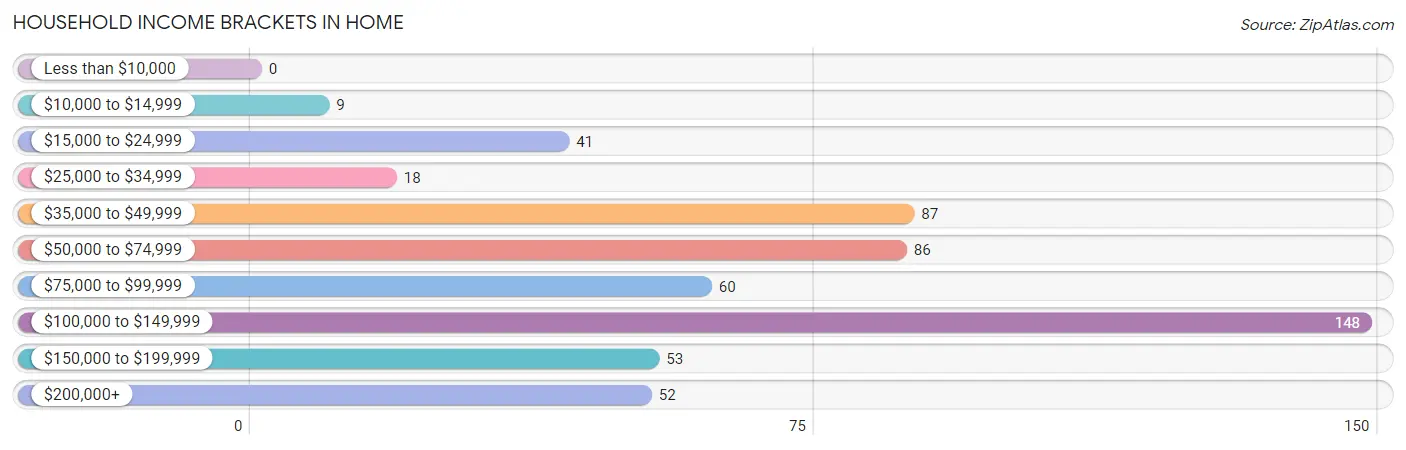
| Income Bracket | # Households | % Households |
| Less than $10,000 | 0 | 0.0% |
| $10,000 to $14,999 | 9 | 1.6% |
| $15,000 to $24,999 | 41 | 7.4% |
| $25,000 to $34,999 | 18 | 3.2% |
| $35,000 to $49,999 | 87 | 15.7% |
| $50,000 to $74,999 | 86 | 15.5% |
| $75,000 to $99,999 | 60 | 10.8% |
| $100,000 to $149,999 | 148 | 26.7% |
| $150,000 to $199,999 | 53 | 9.6% |
| $200,000+ | 52 | 9.4% |
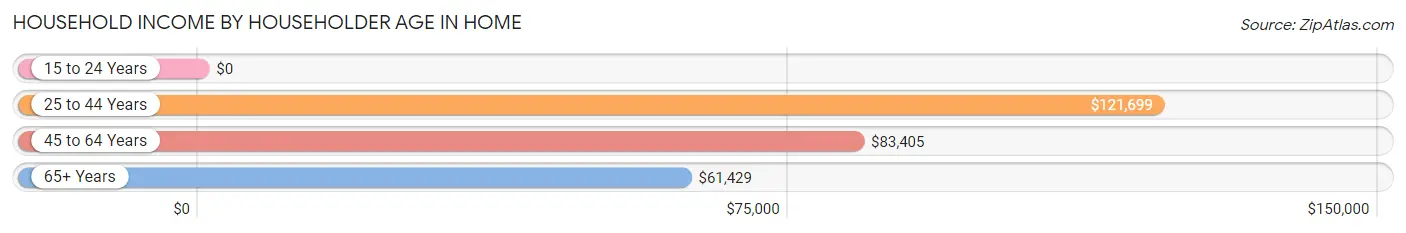
Household Income by Householder Age in Home
The median household income in Home is $89,444, with the highest median household income of $121,699 found in the 25 to 44 years age bracket for the primary householder. A total of 199 households (35.9%) fall into this category. Meanwhile, the 15 to 24 years age bracket for the primary householder has the lowest median household income of $0, with 28 households (5.1%) in this group.
| Income Bracket | # Households | Median Income |
| 15 to 24 Years | 28 (5.1%) | $0 |
| 25 to 44 Years | 199 (35.9%) | $121,699 |
| 45 to 64 Years | 195 (35.2%) | $83,405 |
| 65+ Years | 132 (23.8%) | $61,429 |
| Total | 554 (100.0%) | $89,444 |
Poverty in Home
Income Below Poverty by Sex and Age in Home
With 4.1% poverty level for males and 1.1% for females among the residents of Home, 16 and 17 year old males and 75 year old and over females are the most vulnerable to poverty, with 1 males (100.0%) and 9 females (9.6%) in their respective age groups living below the poverty level.
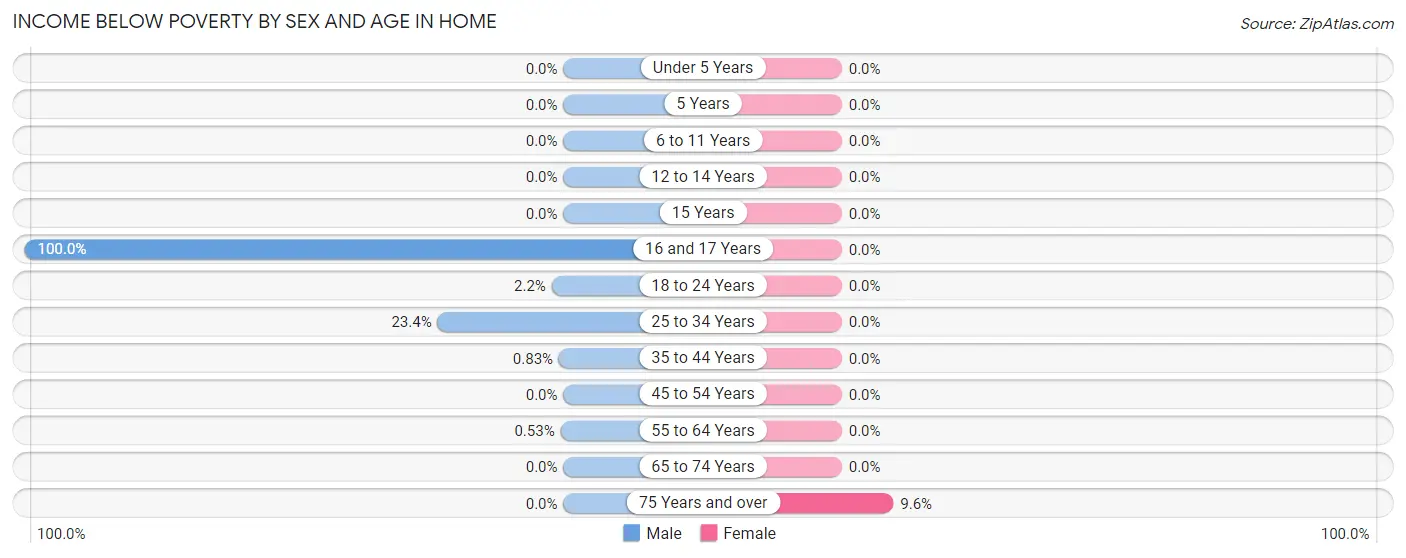
| Age Bracket | Male | Female |
| Under 5 Years | 0 (0.0%) | 0 (0.0%) |
| 5 Years | 0 (0.0%) | 0 (0.0%) |
| 6 to 11 Years | 0 (0.0%) | 0 (0.0%) |
| 12 to 14 Years | 0 (0.0%) | 0 (0.0%) |
| 15 Years | 0 (0.0%) | 0 (0.0%) |
| 16 and 17 Years | 1 (100.0%) | 0 (0.0%) |
| 18 to 24 Years | 1 (2.2%) | 0 (0.0%) |
| 25 to 34 Years | 32 (23.4%) | 0 (0.0%) |
| 35 to 44 Years | 1 (0.8%) | 0 (0.0%) |
| 45 to 54 Years | 0 (0.0%) | 0 (0.0%) |
| 55 to 64 Years | 1 (0.5%) | 0 (0.0%) |
| 65 to 74 Years | 0 (0.0%) | 0 (0.0%) |
| 75 Years and over | 0 (0.0%) | 9 (9.6%) |
| Total | 36 (4.1%) | 9 (1.1%) |
Income Above Poverty by Sex and Age in Home
According to the poverty statistics in Home, males aged under 5 years and females aged under 5 years are the age groups that are most secure financially, with 100.0% of males and 100.0% of females in these age groups living above the poverty line.
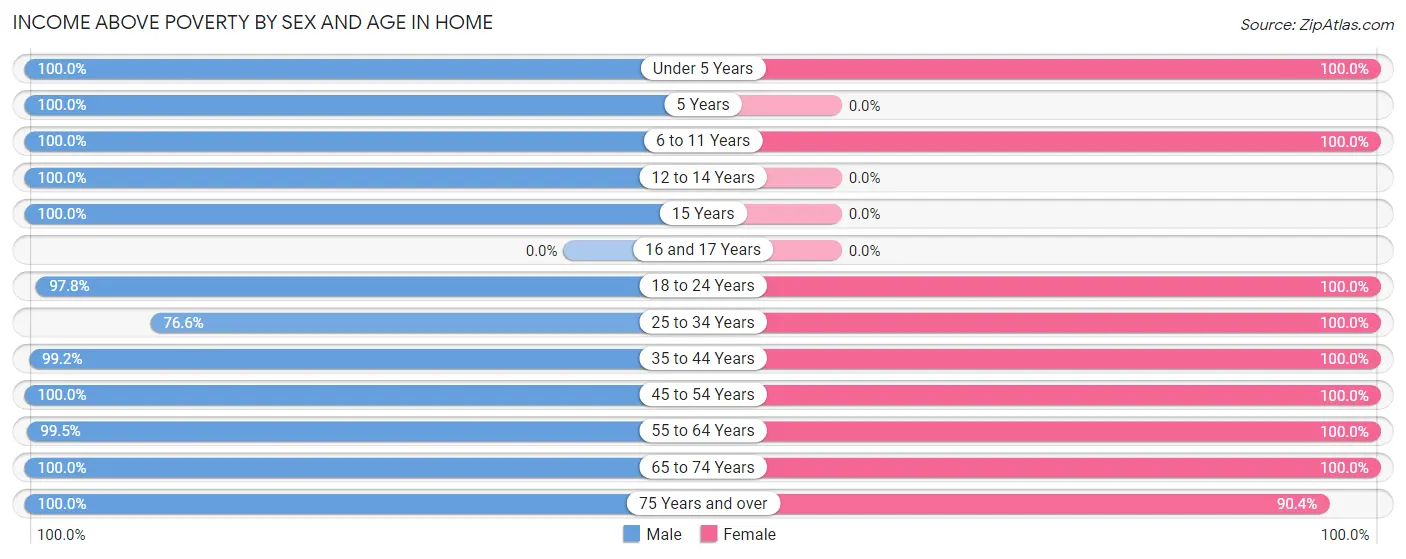
| Age Bracket | Male | Female |
| Under 5 Years | 41 (100.0%) | 95 (100.0%) |
| 5 Years | 15 (100.0%) | 0 (0.0%) |
| 6 to 11 Years | 189 (100.0%) | 183 (100.0%) |
| 12 to 14 Years | 42 (100.0%) | 0 (0.0%) |
| 15 Years | 8 (100.0%) | 0 (0.0%) |
| 16 and 17 Years | 0 (0.0%) | 0 (0.0%) |
| 18 to 24 Years | 45 (97.8%) | 25 (100.0%) |
| 25 to 34 Years | 105 (76.6%) | 146 (100.0%) |
| 35 to 44 Years | 120 (99.2%) | 56 (100.0%) |
| 45 to 54 Years | 24 (100.0%) | 69 (100.0%) |
| 55 to 64 Years | 187 (99.5%) | 85 (100.0%) |
| 65 to 74 Years | 47 (100.0%) | 53 (100.0%) |
| 75 Years and over | 26 (100.0%) | 85 (90.4%) |
| Total | 849 (95.9%) | 797 (98.9%) |
Income Below Poverty Among Married-Couple Families in Home
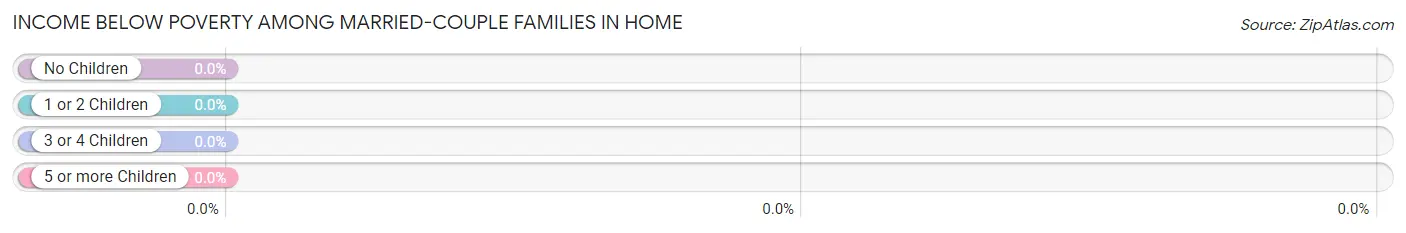
| Children | Above Poverty | Below Poverty |
| No Children | 120 (100.0%) | 0 (0.0%) |
| 1 or 2 Children | 79 (100.0%) | 0 (0.0%) |
| 3 or 4 Children | 73 (100.0%) | 0 (0.0%) |
| 5 or more Children | 0 (0.0%) | 0 (0.0%) |
| Total | 272 (100.0%) | 0 (0.0%) |
Income Below Poverty Among Single-Parent Households in Home
| Children | Single Father | Single Mother |
| No Children | 0 (0.0%) | 0 (0.0%) |
| 1 or 2 Children | 0 (0.0%) | 0 (0.0%) |
| 3 or 4 Children | 0 (0.0%) | 0 (0.0%) |
| 5 or more Children | 0 (0.0%) | 0 (0.0%) |
| Total | 0 (0.0%) | 0 (0.0%) |
Income Below Poverty Among Married-Couple vs Single-Parent Households in Home
| Children | Married-Couple Families | Single-Parent Households |
| No Children | 0 (0.0%) | 0 (0.0%) |
| 1 or 2 Children | 0 (0.0%) | 0 (0.0%) |
| 3 or 4 Children | 0 (0.0%) | 0 (0.0%) |
| 5 or more Children | 0 (0.0%) | 0 (0.0%) |
| Total | 0 (0.0%) | 0 (0.0%) |
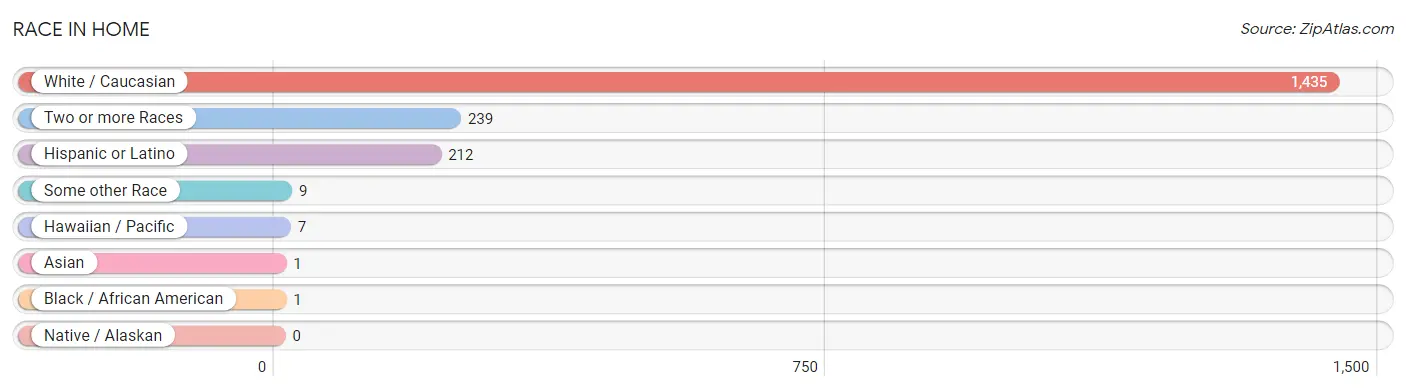
Race in Home
The most populous races in Home are White / Caucasian (1,435 | 84.8%), Two or more Races (239 | 14.1%), and Hispanic or Latino (212 | 12.5%).
| Race | # Population | % Population |
| Asian | 1 | 0.1% |
| Black / African American | 1 | 0.1% |
| Hawaiian / Pacific | 7 | 0.4% |
| Hispanic or Latino | 212 | 12.5% |
| Native / Alaskan | 0 | 0.0% |
| White / Caucasian | 1,435 | 84.8% |
| Two or more Races | 239 | 14.1% |
| Some other Race | 9 | 0.5% |
| Total | 1,692 | 100.0% |
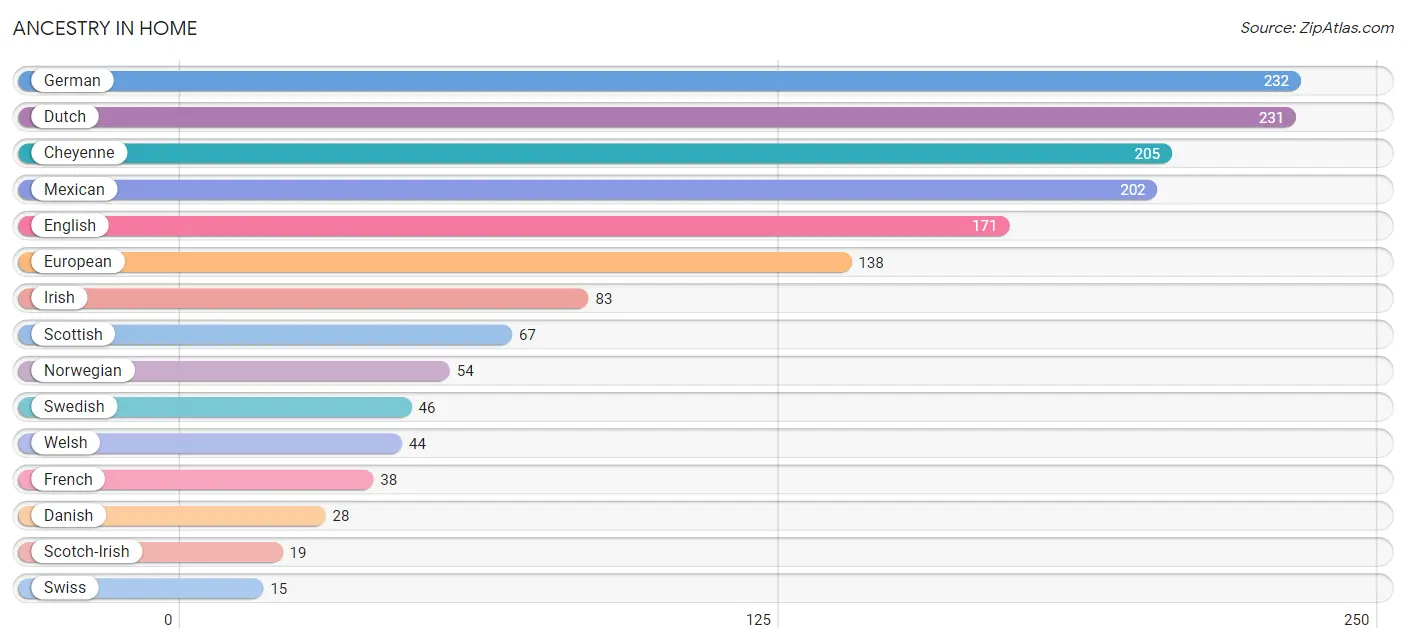
Ancestry in Home
The most populous ancestries reported in Home are German (232 | 13.7%), Dutch (231 | 13.7%), Cheyenne (205 | 12.1%), Mexican (202 | 11.9%), and English (171 | 10.1%), together accounting for 61.5% of all Home residents.
| Ancestry | # Population | % Population |
| Bhutanese | 13 | 0.8% |
| Central American | 9 | 0.5% |
| Cherokee | 1 | 0.1% |
| Cheyenne | 205 | 12.1% |
| Danish | 28 | 1.7% |
| Dutch | 231 | 13.7% |
| English | 171 | 10.1% |
| European | 138 | 8.2% |
| French | 38 | 2.2% |
| French Canadian | 7 | 0.4% |
| German | 232 | 13.7% |
| Honduran | 9 | 0.5% |
| Irish | 83 | 4.9% |
| Jamaican | 1 | 0.1% |
| Korean | 9 | 0.5% |
| Mexican | 202 | 11.9% |
| Native Hawaiian | 7 | 0.4% |
| Norwegian | 54 | 3.2% |
| Puerto Rican | 1 | 0.1% |
| Russian | 12 | 0.7% |
| Scotch-Irish | 19 | 1.1% |
| Scottish | 67 | 4.0% |
| Swedish | 46 | 2.7% |
| Swiss | 15 | 0.9% |
| Welsh | 44 | 2.6% |
| Yugoslavian | 1 | 0.1% | View All 26 Rows |
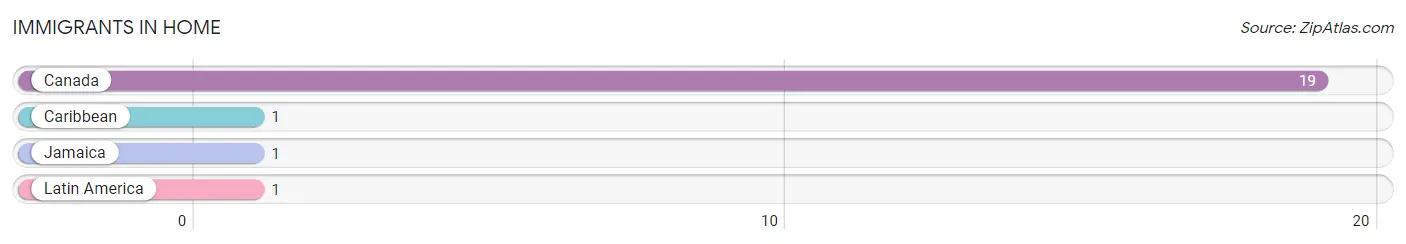
Immigrants in Home
The most numerous immigrant groups reported in Home came from Canada (19 | 1.1%), Caribbean (1 | 0.1%), Jamaica (1 | 0.1%), and Latin America (1 | 0.1%), together accounting for 1.3% of all Home residents.
| Immigration Origin | # Population | % Population |
| Canada | 19 | 1.1% |
| Caribbean | 1 | 0.1% |
| Jamaica | 1 | 0.1% |
| Latin America | 1 | 0.1% | View All 4 Rows |
Sex and Age in Home
Sex and Age in Home
The most populous age groups in Home are 10 to 14 Years (130 | 14.7%) for men and 5 to 9 Years (114 | 14.1%) for women.

| Age Bracket | Male | Female |
| Under 5 Years | 41 (4.6%) | 95 (11.8%) |
| 5 to 9 Years | 116 (13.1%) | 114 (14.1%) |
| 10 to 14 Years | 130 (14.7%) | 69 (8.6%) |
| 15 to 19 Years | 26 (2.9%) | 0 (0.0%) |
| 20 to 24 Years | 29 (3.3%) | 25 (3.1%) |
| 25 to 29 Years | 14 (1.6%) | 73 (9.0%) |
| 30 to 34 Years | 123 (13.9%) | 73 (9.0%) |
| 35 to 39 Years | 43 (4.9%) | 48 (5.9%) |
| 40 to 44 Years | 78 (8.8%) | 8 (1.0%) |
| 45 to 49 Years | 0 (0.0%) | 45 (5.6%) |
| 50 to 54 Years | 24 (2.7%) | 24 (3.0%) |
| 55 to 59 Years | 104 (11.7%) | 56 (6.9%) |
| 60 to 64 Years | 84 (9.5%) | 29 (3.6%) |
| 65 to 69 Years | 32 (3.6%) | 43 (5.3%) |
| 70 to 74 Years | 15 (1.7%) | 10 (1.2%) |
| 75 to 79 Years | 7 (0.8%) | 36 (4.5%) |
| 80 to 84 Years | 0 (0.0%) | 23 (2.9%) |
| 85 Years and over | 19 (2.1%) | 36 (4.5%) |
| Total | 885 (100.0%) | 807 (100.0%) |
Families and Households in Home
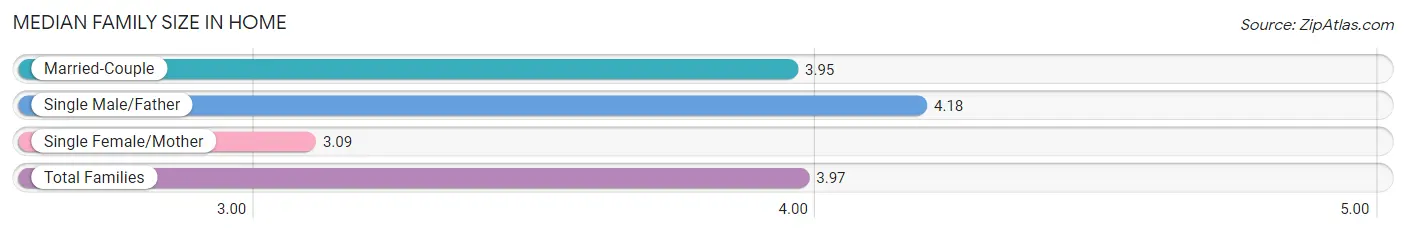
Median Family Size in Home
The median family size in Home is 3.97 persons per family, with single male/father families (73 | 20.5%) accounting for the largest median family size of 4.18 persons per family. On the other hand, single female/mother families (11 | 3.1%) represent the smallest median family size with 3.09 persons per family.
| Family Type | # Families | Family Size |
| Married-Couple | 272 (76.4%) | 3.95 |
| Single Male/Father | 73 (20.5%) | 4.18 |
| Single Female/Mother | 11 (3.1%) | 3.09 |
| Total Families | 356 (100.0%) | 3.97 |
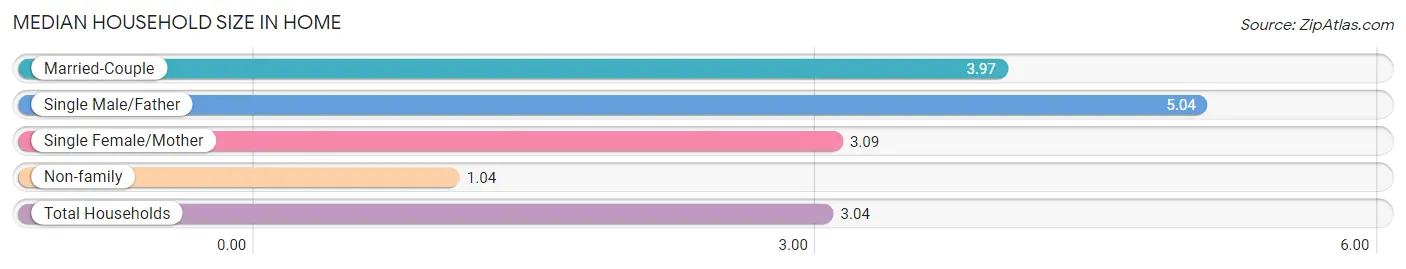
Median Household Size in Home
The median household size in Home is 3.04 persons per household, with single male/father households (73 | 13.2%) accounting for the largest median household size of 5.04 persons per household. non-family households (198 | 35.7%) represent the smallest median household size with 1.04 persons per household.
| Household Type | # Households | Household Size |
| Married-Couple | 272 (49.1%) | 3.97 |
| Single Male/Father | 73 (13.2%) | 5.04 |
| Single Female/Mother | 11 (2.0%) | 3.09 |
| Non-family | 198 (35.7%) | 1.04 |
| Total Households | 554 (100.0%) | 3.04 |
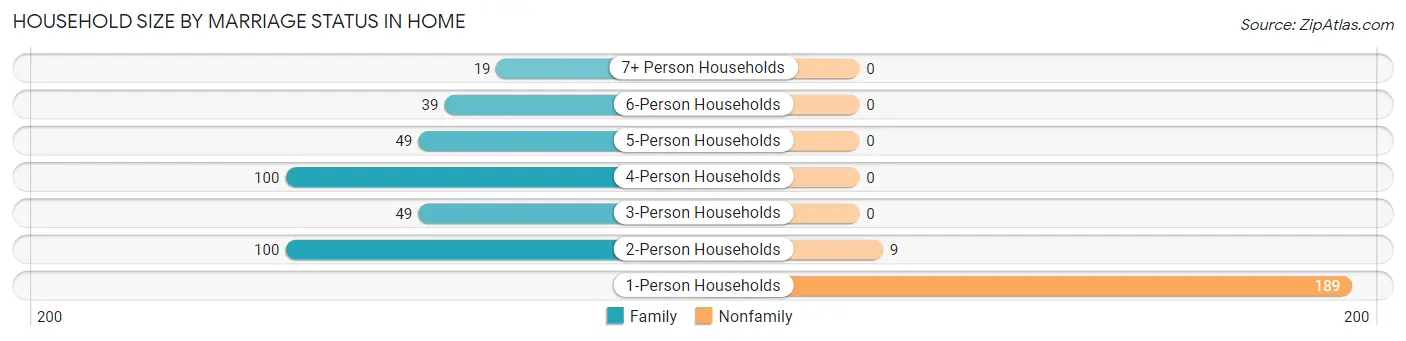
Household Size by Marriage Status in Home
Out of a total of 554 households in Home, 356 (64.3%) are family households, while 198 (35.7%) are nonfamily households. The most numerous type of family households are 2-person households, comprising 100, and the most common type of nonfamily households are 1-person households, comprising 189.
| Household Size | Family Households | Nonfamily Households |
| 1-Person Households | - | 189 (34.1%) |
| 2-Person Households | 100 (18.0%) | 9 (1.6%) |
| 3-Person Households | 49 (8.8%) | 0 (0.0%) |
| 4-Person Households | 100 (18.0%) | 0 (0.0%) |
| 5-Person Households | 49 (8.8%) | 0 (0.0%) |
| 6-Person Households | 39 (7.0%) | 0 (0.0%) |
| 7+ Person Households | 19 (3.4%) | 0 (0.0%) |
| Total | 356 (64.3%) | 198 (35.7%) |
Female Fertility in Home
Fertility by Age in Home
| Age Bracket | Women with Births | Births / 1,000 Women |
| 15 to 19 years | 0 (0.0%) | 0.0 |
| 20 to 34 years | 0 (0.0%) | 0.0 |
| 35 to 50 years | 0 (0.0%) | 0.0 |
| Total | 0 (0.0%) | 0.0 |
Fertility by Age by Marriage Status in Home
| Age Bracket | Married | Unmarried |
| 15 to 19 years | 0 (0.0%) | 0 (0.0%) |
| 20 to 34 years | 0 (0.0%) | 0 (0.0%) |
| 35 to 50 years | 0 (0.0%) | 0 (0.0%) |
| Total | 0 (0.0%) | 0 (0.0%) |
Fertility by Education in Home
| Educational Attainment | Women with Births | Births / 1,000 Women |
| Less than High School | 0 (0.0%) | 0.0 |
| High School Diploma | 0 (0.0%) | 0.0 |
| College or Associate's Degree | 0 (0.0%) | 0.0 |
| Bachelor's Degree | 0 (0.0%) | 0.0 |
| Graduate Degree | 0 (0.0%) | 0.0 |
| Total | 0 (0.0%) | 0.0 |
Fertility by Education by Marriage Status in Home
| Educational Attainment | Married | Unmarried |
| Less than High School | 0 (0.0%) | 0 (0.0%) |
| High School Diploma | 0 (0.0%) | 0 (0.0%) |
| College or Associate's Degree | 0 (0.0%) | 0 (0.0%) |
| Bachelor's Degree | 0 (0.0%) | 0 (0.0%) |
| Graduate Degree | 0 (0.0%) | 0 (0.0%) |
| Total | 0 (0.0%) | 0 (0.0%) |
Employment Characteristics in Home
Employment by Class of Employer in Home
Among the 615 employed individuals in Home, private company employees (322 | 52.4%), not-for-profit organizations (118 | 19.2%), and state government employees (112 | 18.2%) make up the most common classes of employment.
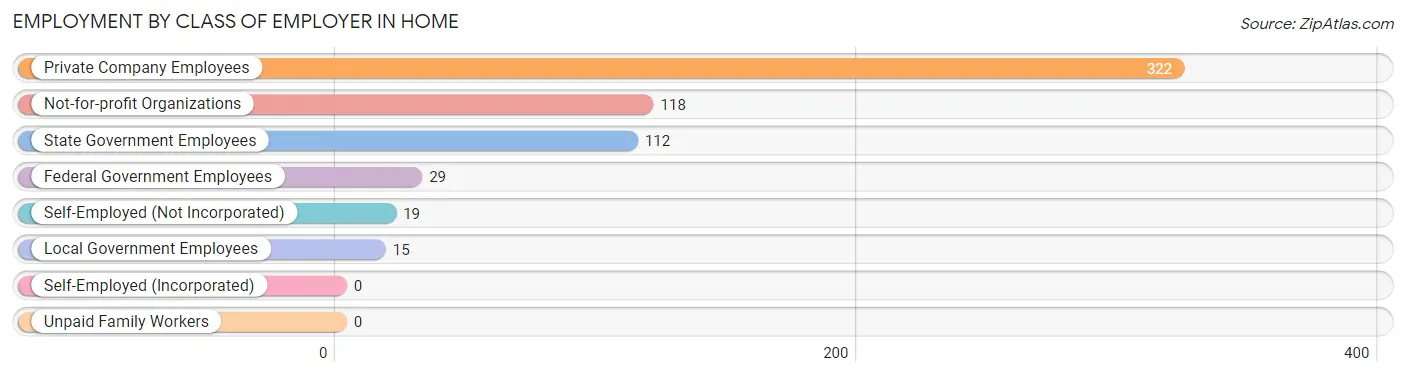
| Employer Class | # Employees | % Employees |
| Private Company Employees | 322 | 52.4% |
| Self-Employed (Incorporated) | 0 | 0.0% |
| Self-Employed (Not Incorporated) | 19 | 3.1% |
| Not-for-profit Organizations | 118 | 19.2% |
| Local Government Employees | 15 | 2.4% |
| State Government Employees | 112 | 18.2% |
| Federal Government Employees | 29 | 4.7% |
| Unpaid Family Workers | 0 | 0.0% |
| Total | 615 | 100.0% |
Employment Status by Age in Home
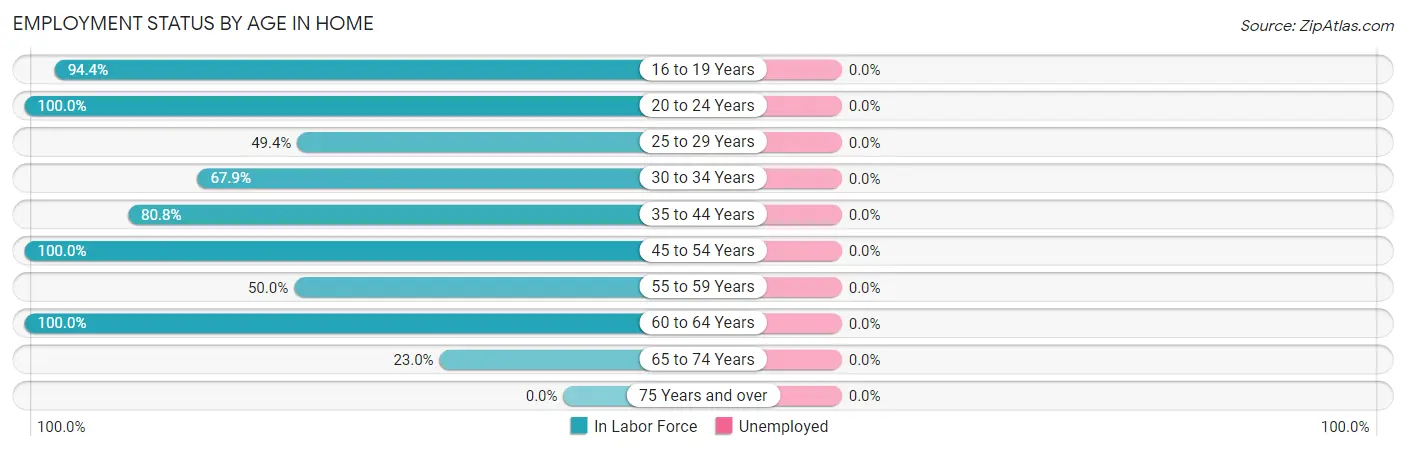
| Age Bracket | In Labor Force | Unemployed |
| 16 to 19 Years | 17 (94.4%) | 0 (0.0%) |
| 20 to 24 Years | 54 (100.0%) | 0 (0.0%) |
| 25 to 29 Years | 43 (49.4%) | 0 (0.0%) |
| 30 to 34 Years | 133 (67.9%) | 0 (0.0%) |
| 35 to 44 Years | 143 (80.8%) | 0 (0.0%) |
| 45 to 54 Years | 93 (100.0%) | 0 (0.0%) |
| 55 to 59 Years | 80 (50.0%) | 0 (0.0%) |
| 60 to 64 Years | 113 (100.0%) | 0 (0.0%) |
| 65 to 74 Years | 23 (23.0%) | 0 (0.0%) |
| 75 Years and over | 0 (0.0%) | 0 (0.0%) |
| Total | 699 (62.5%) | 0 (0.0%) |
Employment Status by Educational Attainment in Home
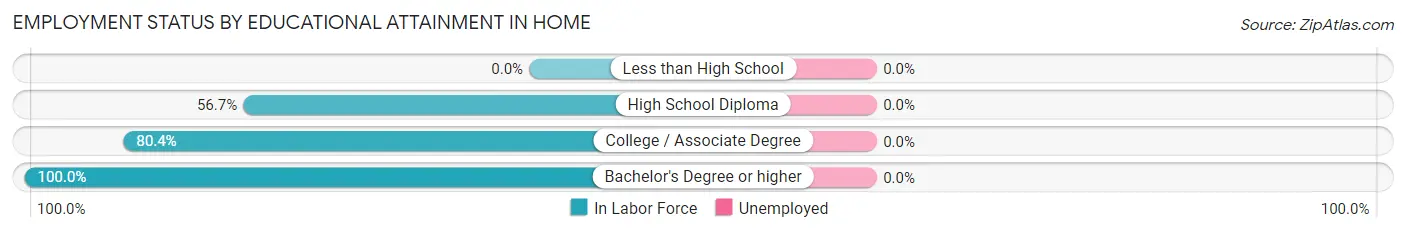
| Educational Attainment | In Labor Force | Unemployed |
| Less than High School | 0 (0.0%) | 0 (0.0%) |
| High School Diploma | 131 (56.7%) | 0 (0.0%) |
| College / Associate Degree | 251 (80.4%) | 0 (0.0%) |
| Bachelor's Degree or higher | 223 (100.0%) | 0 (0.0%) |
| Total | 605 (73.2%) | 0 (0.0%) |
Employment Occupations by Sex in Home
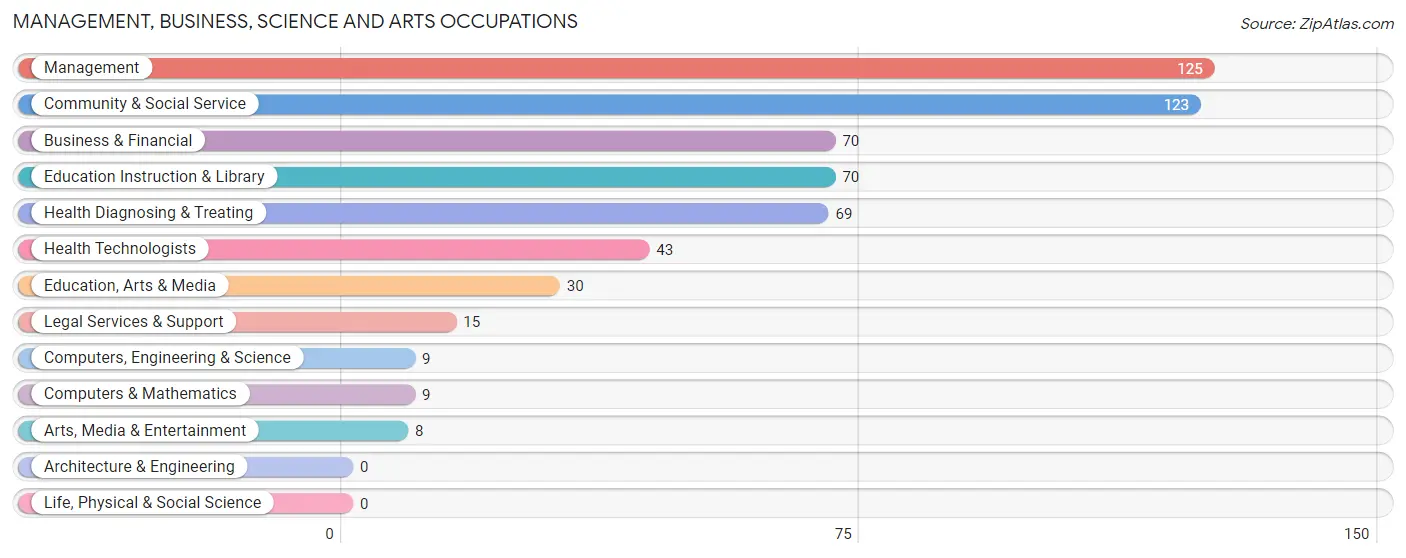
Management, Business, Science and Arts Occupations
The most common Management, Business, Science and Arts occupations in Home are Management (125 | 17.9%), Community & Social Service (123 | 17.6%), Business & Financial (70 | 10.0%), Education Instruction & Library (70 | 10.0%), and Health Diagnosing & Treating (69 | 9.9%).
Management, Business, Science and Arts Occupations by Sex
Within the Management, Business, Science and Arts occupations in Home, the most male-oriented occupations are Business & Financial (100.0%), Arts, Media & Entertainment (100.0%), and Health Technologists (60.5%), while the most female-oriented occupations are Computers, Engineering & Science (100.0%), Computers & Mathematics (100.0%), and Legal Services & Support (100.0%).
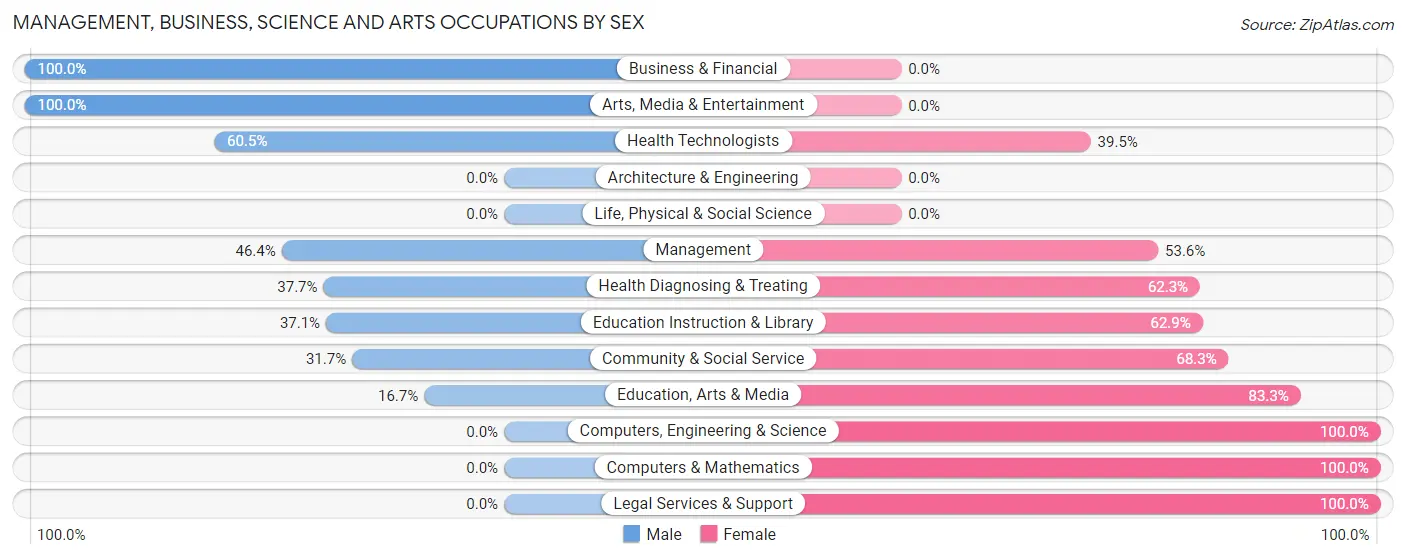
| Occupation | Male | Female |
| Management | 58 (46.4%) | 67 (53.6%) |
| Business & Financial | 70 (100.0%) | 0 (0.0%) |
| Computers, Engineering & Science | 0 (0.0%) | 9 (100.0%) |
| Computers & Mathematics | 0 (0.0%) | 9 (100.0%) |
| Architecture & Engineering | 0 (0.0%) | 0 (0.0%) |
| Life, Physical & Social Science | 0 (0.0%) | 0 (0.0%) |
| Community & Social Service | 39 (31.7%) | 84 (68.3%) |
| Education, Arts & Media | 5 (16.7%) | 25 (83.3%) |
| Legal Services & Support | 0 (0.0%) | 15 (100.0%) |
| Education Instruction & Library | 26 (37.1%) | 44 (62.9%) |
| Arts, Media & Entertainment | 8 (100.0%) | 0 (0.0%) |
| Health Diagnosing & Treating | 26 (37.7%) | 43 (62.3%) |
| Health Technologists | 26 (60.5%) | 17 (39.5%) |
| Total (Category) | 193 (48.7%) | 203 (51.3%) |
| Total (Overall) | 405 (57.9%) | 294 (42.1%) |
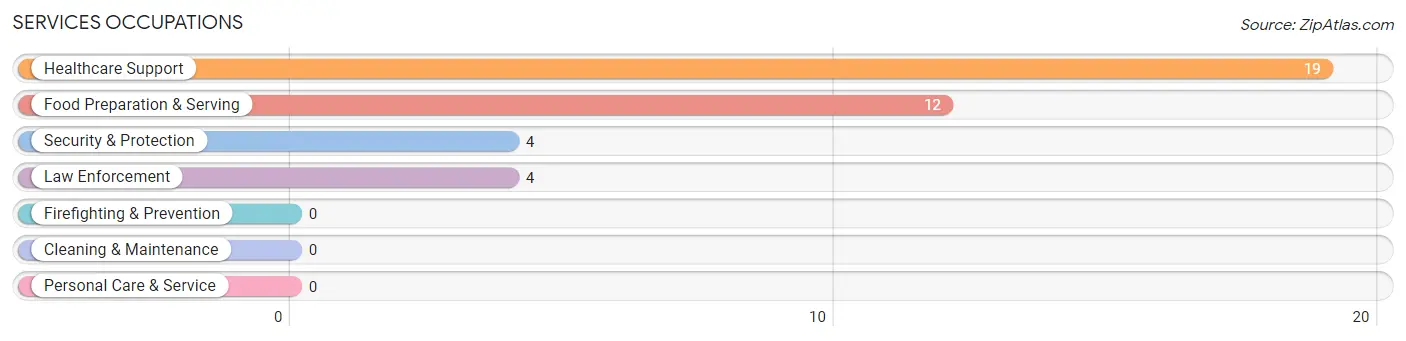
Services Occupations
The most common Services occupations in Home are Healthcare Support (19 | 2.7%), Food Preparation & Serving (12 | 1.7%), Security & Protection (4 | 0.6%), and Law Enforcement (4 | 0.6%).
Services Occupations by Sex
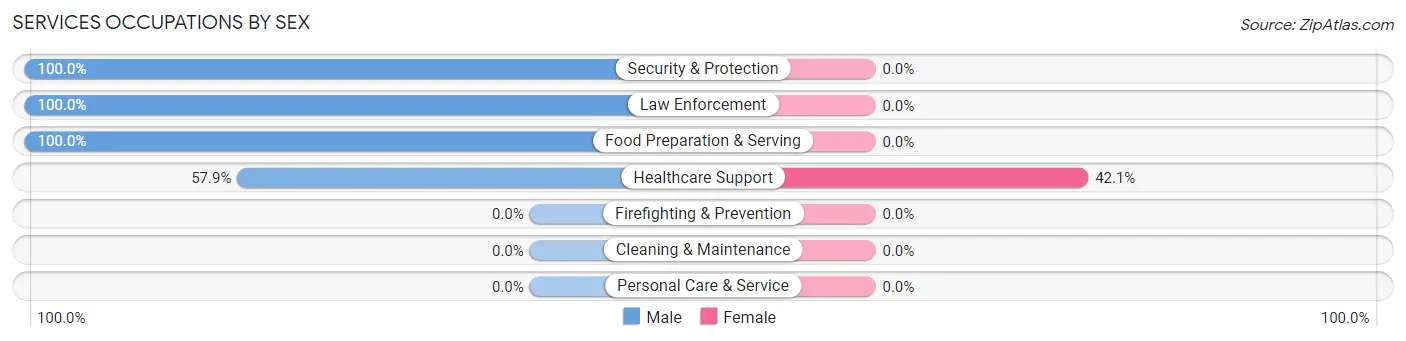
| Occupation | Male | Female |
| Healthcare Support | 11 (57.9%) | 8 (42.1%) |
| Security & Protection | 4 (100.0%) | 0 (0.0%) |
| Firefighting & Prevention | 0 (0.0%) | 0 (0.0%) |
| Law Enforcement | 4 (100.0%) | 0 (0.0%) |
| Food Preparation & Serving | 12 (100.0%) | 0 (0.0%) |
| Cleaning & Maintenance | 0 (0.0%) | 0 (0.0%) |
| Personal Care & Service | 0 (0.0%) | 0 (0.0%) |
| Total (Category) | 27 (77.1%) | 8 (22.9%) |
| Total (Overall) | 405 (57.9%) | 294 (42.1%) |
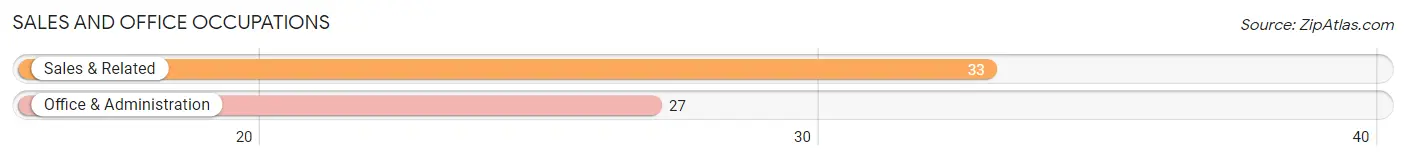
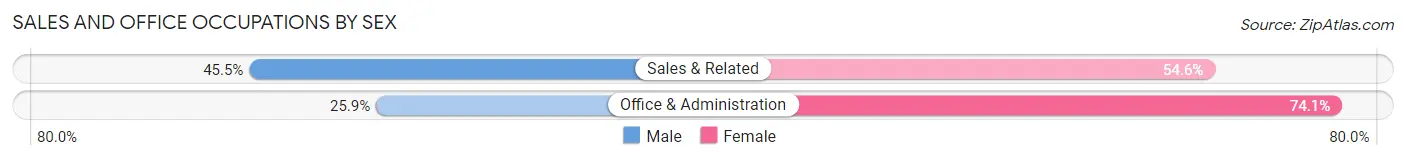
Sales and Office Occupations
The most common Sales and Office occupations in Home are Sales & Related (33 | 4.7%), and Office & Administration (27 | 3.9%).
Sales and Office Occupations by Sex
| Occupation | Male | Female |
| Sales & Related | 15 (45.5%) | 18 (54.5%) |
| Office & Administration | 7 (25.9%) | 20 (74.1%) |
| Total (Category) | 22 (36.7%) | 38 (63.3%) |
| Total (Overall) | 405 (57.9%) | 294 (42.1%) |
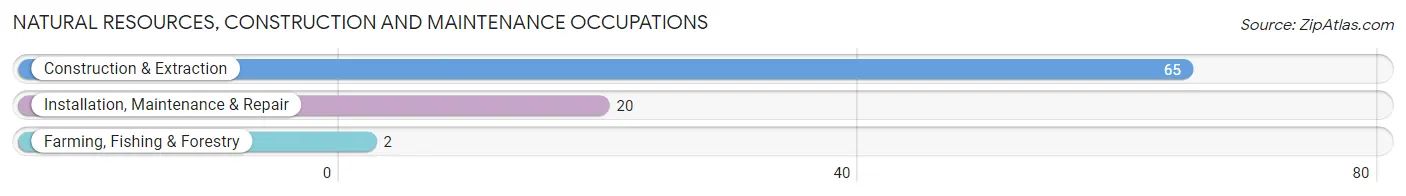
Natural Resources, Construction and Maintenance Occupations
The most common Natural Resources, Construction and Maintenance occupations in Home are Construction & Extraction (65 | 9.3%), Installation, Maintenance & Repair (20 | 2.9%), and Farming, Fishing & Forestry (2 | 0.3%).
Natural Resources, Construction and Maintenance Occupations by Sex
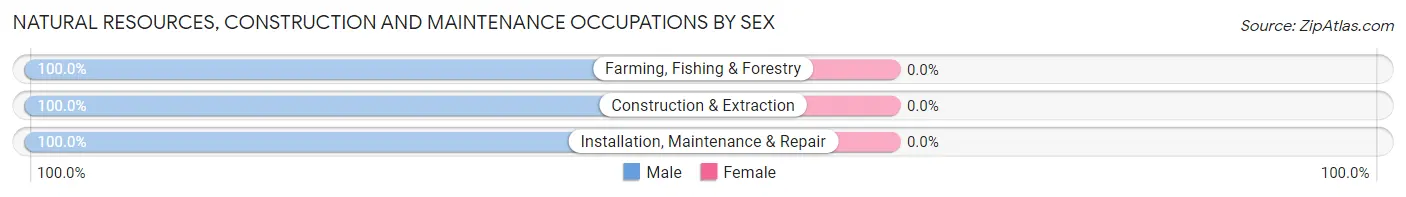
| Occupation | Male | Female |
| Farming, Fishing & Forestry | 2 (100.0%) | 0 (0.0%) |
| Construction & Extraction | 65 (100.0%) | 0 (0.0%) |
| Installation, Maintenance & Repair | 20 (100.0%) | 0 (0.0%) |
| Total (Category) | 87 (100.0%) | 0 (0.0%) |
| Total (Overall) | 405 (57.9%) | 294 (42.1%) |
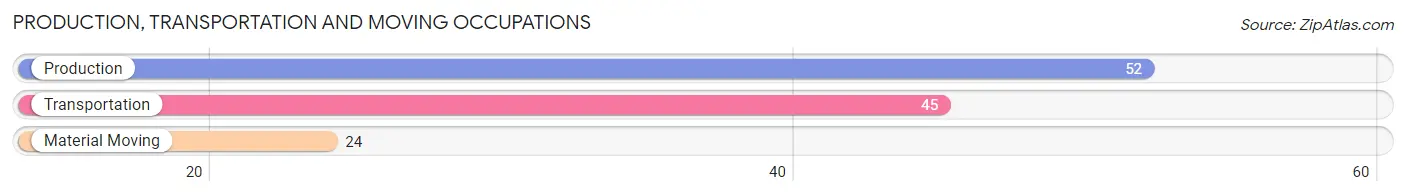
Production, Transportation and Moving Occupations
The most common Production, Transportation and Moving occupations in Home are Production (52 | 7.4%), Transportation (45 | 6.4%), and Material Moving (24 | 3.4%).
Production, Transportation and Moving Occupations by Sex
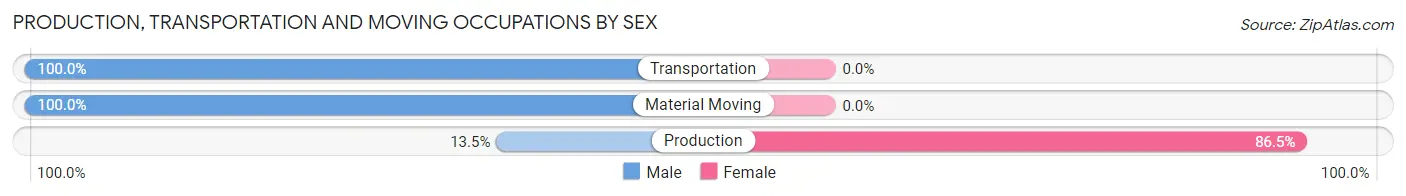
| Occupation | Male | Female |
| Production | 7 (13.5%) | 45 (86.5%) |
| Transportation | 45 (100.0%) | 0 (0.0%) |
| Material Moving | 24 (100.0%) | 0 (0.0%) |
| Total (Category) | 76 (62.8%) | 45 (37.2%) |
| Total (Overall) | 405 (57.9%) | 294 (42.1%) |
Employment Industries by Sex in Home
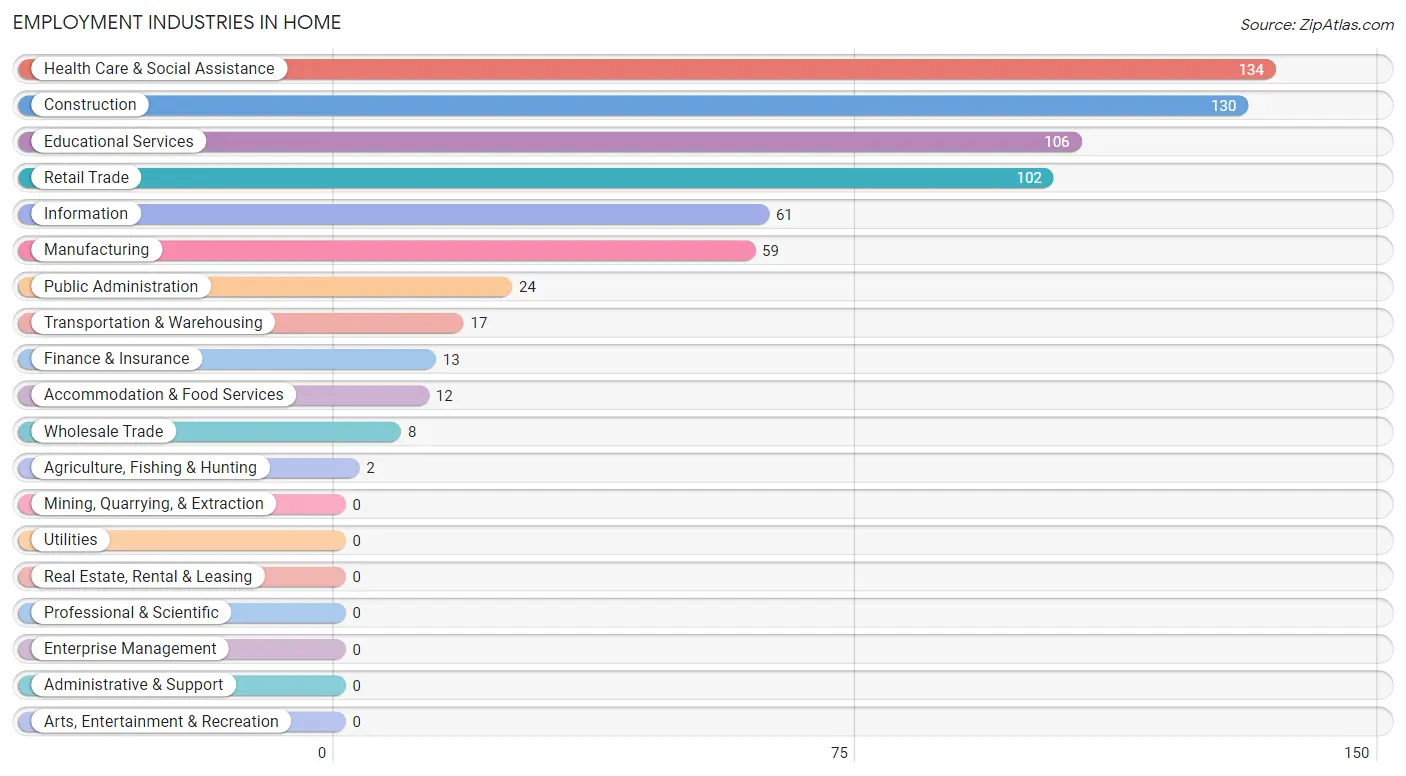
Employment Industries in Home
The major employment industries in Home include Health Care & Social Assistance (134 | 19.2%), Construction (130 | 18.6%), Educational Services (106 | 15.2%), Retail Trade (102 | 14.6%), and Information (61 | 8.7%).
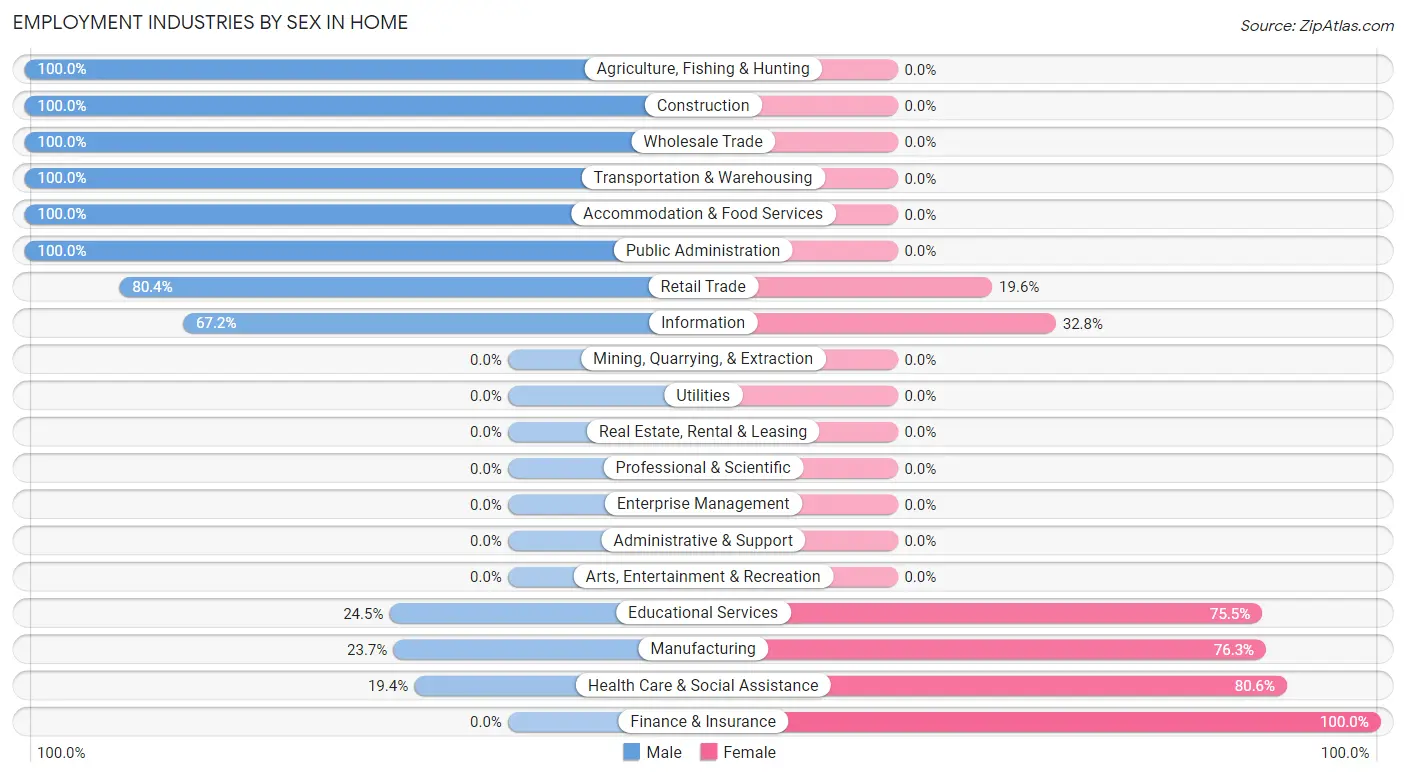
Employment Industries by Sex in Home
The Home industries that see more men than women are Agriculture, Fishing & Hunting (100.0%), Construction (100.0%), and Wholesale Trade (100.0%), whereas the industries that tend to have a higher number of women are Finance & Insurance (100.0%), Health Care & Social Assistance (80.6%), and Manufacturing (76.3%).
| Industry | Male | Female |
| Agriculture, Fishing & Hunting | 2 (100.0%) | 0 (0.0%) |
| Mining, Quarrying, & Extraction | 0 (0.0%) | 0 (0.0%) |
| Construction | 130 (100.0%) | 0 (0.0%) |
| Manufacturing | 14 (23.7%) | 45 (76.3%) |
| Wholesale Trade | 8 (100.0%) | 0 (0.0%) |
| Retail Trade | 82 (80.4%) | 20 (19.6%) |
| Transportation & Warehousing | 17 (100.0%) | 0 (0.0%) |
| Utilities | 0 (0.0%) | 0 (0.0%) |
| Information | 41 (67.2%) | 20 (32.8%) |
| Finance & Insurance | 0 (0.0%) | 13 (100.0%) |
| Real Estate, Rental & Leasing | 0 (0.0%) | 0 (0.0%) |
| Professional & Scientific | 0 (0.0%) | 0 (0.0%) |
| Enterprise Management | 0 (0.0%) | 0 (0.0%) |
| Administrative & Support | 0 (0.0%) | 0 (0.0%) |
| Educational Services | 26 (24.5%) | 80 (75.5%) |
| Health Care & Social Assistance | 26 (19.4%) | 108 (80.6%) |
| Arts, Entertainment & Recreation | 0 (0.0%) | 0 (0.0%) |
| Accommodation & Food Services | 12 (100.0%) | 0 (0.0%) |
| Public Administration | 24 (100.0%) | 0 (0.0%) |
| Total | 405 (57.9%) | 294 (42.1%) |
Education in Home
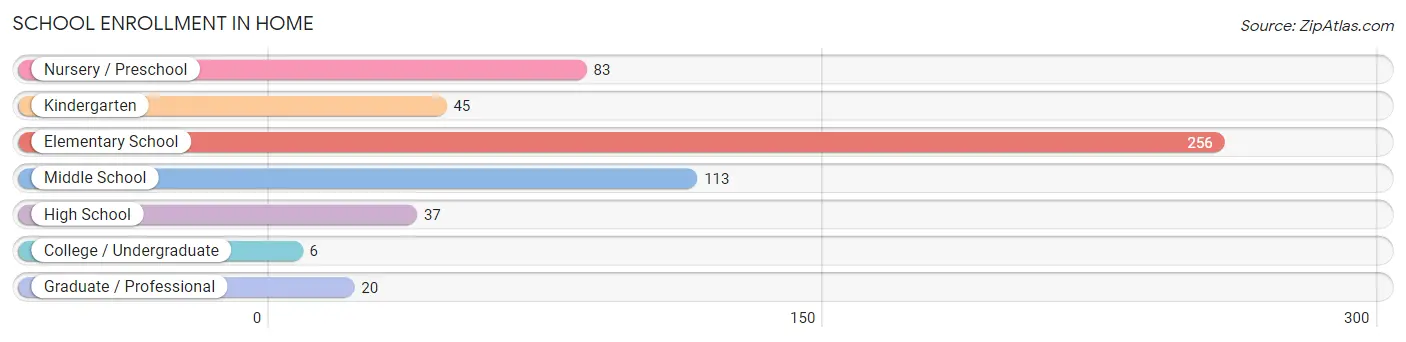
School Enrollment in Home
The most common levels of schooling among the 560 students in Home are elementary school (256 | 45.7%), middle school (113 | 20.2%), and nursery / preschool (83 | 14.8%).
| School Level | # Students | % Students |
| Nursery / Preschool | 83 | 14.8% |
| Kindergarten | 45 | 8.0% |
| Elementary School | 256 | 45.7% |
| Middle School | 113 | 20.2% |
| High School | 37 | 6.6% |
| College / Undergraduate | 6 | 1.1% |
| Graduate / Professional | 20 | 3.6% |
| Total | 560 | 100.0% |
School Enrollment by Age by Funding Source in Home
Out of a total of 560 students who are enrolled in schools in Home, 216 (38.6%) attend a private institution, while the remaining 344 (61.4%) are enrolled in public schools. The age group of 3 to 4 year olds has the highest likelihood of being enrolled in private schools, with 61 (89.7% in the age bracket) enrolled. Conversely, the age group of 20 to 24 year olds has the lowest likelihood of being enrolled in a private school, with 28 (100.0% in the age bracket) attending a public institution.
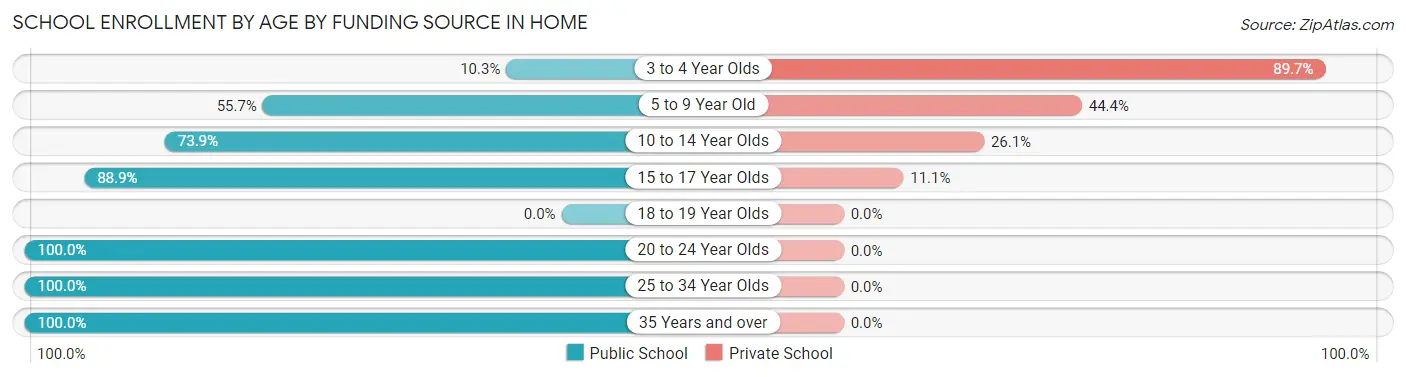
| Age Bracket | Public School | Private School |
| 3 to 4 Year Olds | 7 (10.3%) | 61 (89.7%) |
| 5 to 9 Year Old | 128 (55.6%) | 102 (44.4%) |
| 10 to 14 Year Olds | 147 (73.9%) | 52 (26.1%) |
| 15 to 17 Year Olds | 8 (88.9%) | 1 (11.1%) |
| 18 to 19 Year Olds | 0 (0.0%) | 0 (0.0%) |
| 20 to 24 Year Olds | 28 (100.0%) | 0 (0.0%) |
| 25 to 34 Year Olds | 20 (100.0%) | 0 (0.0%) |
| 35 Years and over | 6 (100.0%) | 0 (0.0%) |
| Total | 344 (61.4%) | 216 (38.6%) |
Educational Attainment by Field of Study in Home
Arts & humanities (82 | 24.5%), education (50 | 15.0%), psychology (42 | 12.6%), social sciences (40 | 12.0%), and bio, nature & agricultural (28 | 8.4%) are the most common fields of study among 334 individuals in Home who have obtained a bachelor's degree or higher.
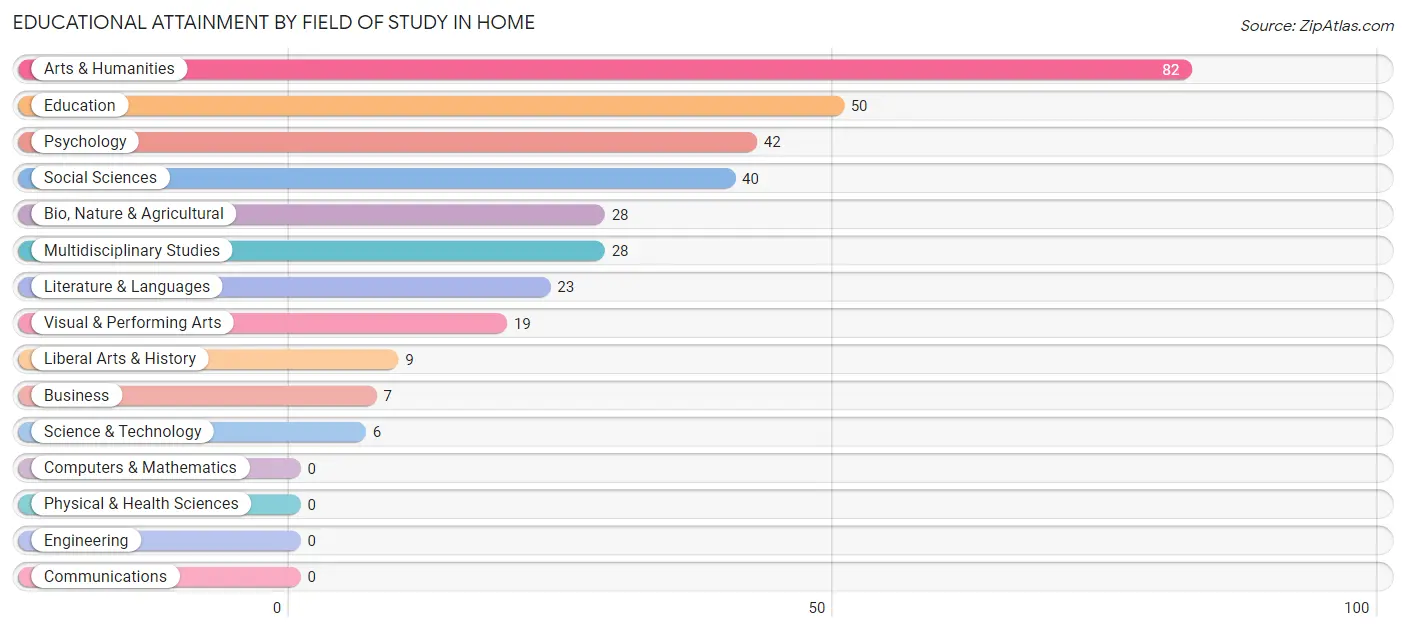
| Field of Study | # Graduates | % Graduates |
| Computers & Mathematics | 0 | 0.0% |
| Bio, Nature & Agricultural | 28 | 8.4% |
| Physical & Health Sciences | 0 | 0.0% |
| Psychology | 42 | 12.6% |
| Social Sciences | 40 | 12.0% |
| Engineering | 0 | 0.0% |
| Multidisciplinary Studies | 28 | 8.4% |
| Science & Technology | 6 | 1.8% |
| Business | 7 | 2.1% |
| Education | 50 | 15.0% |
| Literature & Languages | 23 | 6.9% |
| Liberal Arts & History | 9 | 2.7% |
| Visual & Performing Arts | 19 | 5.7% |
| Communications | 0 | 0.0% |
| Arts & Humanities | 82 | 24.5% |
| Total | 334 | 100.0% |
Transportation & Commute in Home
Vehicle Availability by Sex in Home
The most prevalent vehicle ownership categories in Home are males with 3 vehicles (131, accounting for 41.1%) and females with 3 vehicles (55, making up 44.7%).
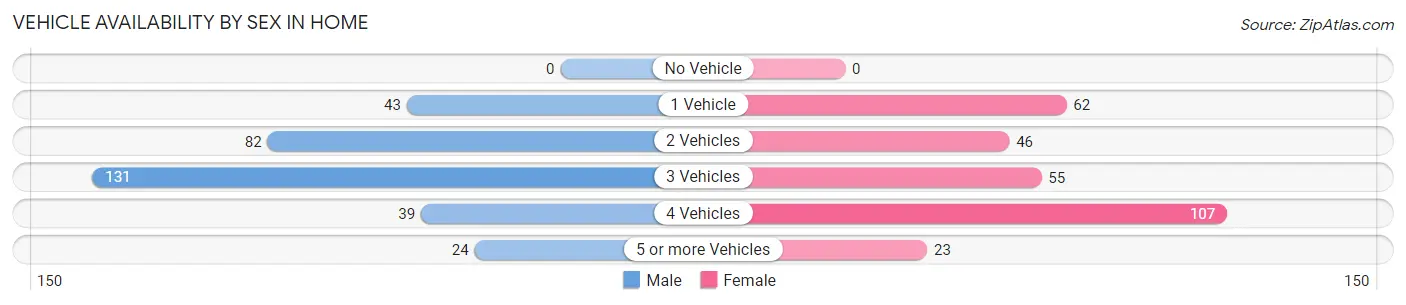
| Vehicles Available | Male | Female |
| No Vehicle | 0 (0.0%) | 0 (0.0%) |
| 1 Vehicle | 43 (13.5%) | 62 (21.2%) |
| 2 Vehicles | 82 (25.7%) | 46 (15.7%) |
| 3 Vehicles | 131 (41.1%) | 55 (18.8%) |
| 4 Vehicles | 39 (12.2%) | 107 (36.5%) |
| 5 or more Vehicles | 24 (7.5%) | 23 (7.9%) |
| Total | 319 (100.0%) | 293 (100.0%) |
Commute Time in Home
The most frequently occuring commute durations in Home are 45 to 59 minutes (207 commuters, 35.6%), 30 to 34 minutes (116 commuters, 20.0%), and 25 to 29 minutes (100 commuters, 17.2%).
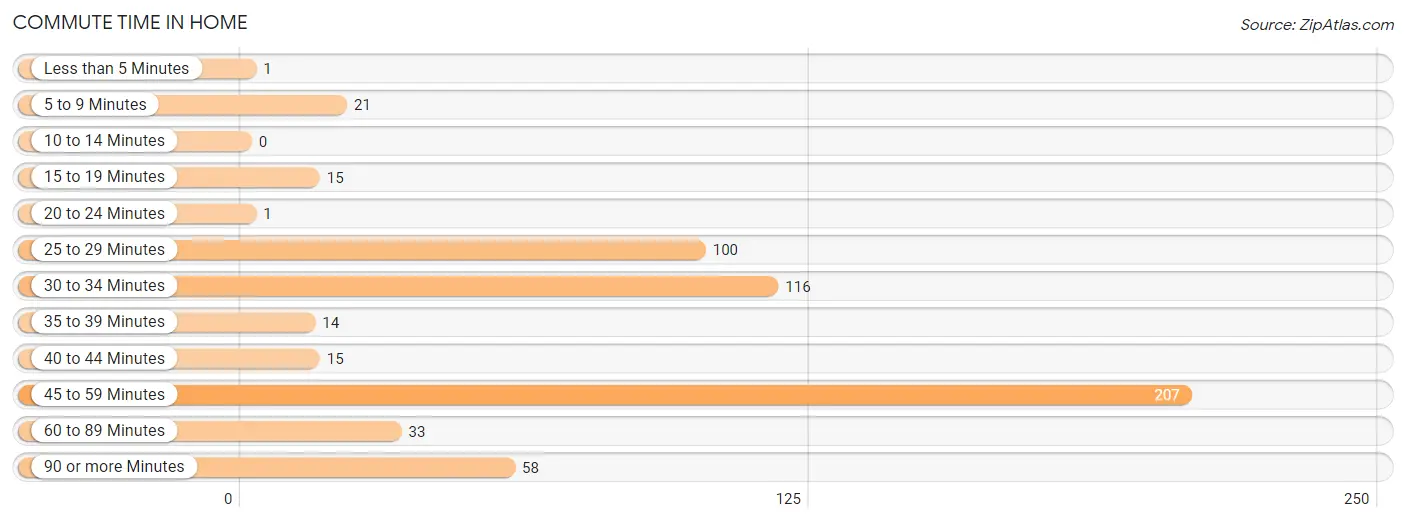
| Commute Time | # Commuters | % Commuters |
| Less than 5 Minutes | 1 | 0.2% |
| 5 to 9 Minutes | 21 | 3.6% |
| 10 to 14 Minutes | 0 | 0.0% |
| 15 to 19 Minutes | 15 | 2.6% |
| 20 to 24 Minutes | 1 | 0.2% |
| 25 to 29 Minutes | 100 | 17.2% |
| 30 to 34 Minutes | 116 | 20.0% |
| 35 to 39 Minutes | 14 | 2.4% |
| 40 to 44 Minutes | 15 | 2.6% |
| 45 to 59 Minutes | 207 | 35.6% |
| 60 to 89 Minutes | 33 | 5.7% |
| 90 or more Minutes | 58 | 10.0% |
Commute Time by Sex in Home
The most common commute times in Home are 45 to 59 minutes (86 commuters, 27.1%) for males and 45 to 59 minutes (121 commuters, 45.8%) for females.
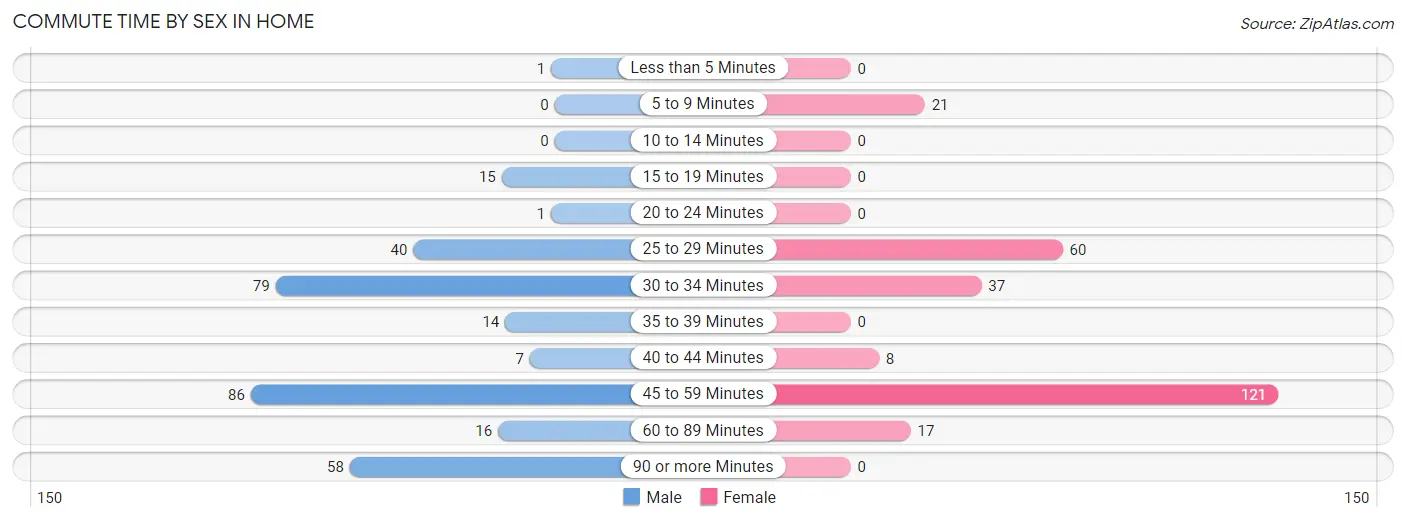
| Commute Time | Male | Female |
| Less than 5 Minutes | 1 (0.3%) | 0 (0.0%) |
| 5 to 9 Minutes | 0 (0.0%) | 21 (8.0%) |
| 10 to 14 Minutes | 0 (0.0%) | 0 (0.0%) |
| 15 to 19 Minutes | 15 (4.7%) | 0 (0.0%) |
| 20 to 24 Minutes | 1 (0.3%) | 0 (0.0%) |
| 25 to 29 Minutes | 40 (12.6%) | 60 (22.7%) |
| 30 to 34 Minutes | 79 (24.9%) | 37 (14.0%) |
| 35 to 39 Minutes | 14 (4.4%) | 0 (0.0%) |
| 40 to 44 Minutes | 7 (2.2%) | 8 (3.0%) |
| 45 to 59 Minutes | 86 (27.1%) | 121 (45.8%) |
| 60 to 89 Minutes | 16 (5.1%) | 17 (6.4%) |
| 90 or more Minutes | 58 (18.3%) | 0 (0.0%) |
Time of Departure to Work by Sex in Home
The most frequent times of departure to work in Home are 7:00 AM to 7:29 AM (67, 21.1%) for males and 12:00 PM to 3:59 PM (58, 22.0%) for females.
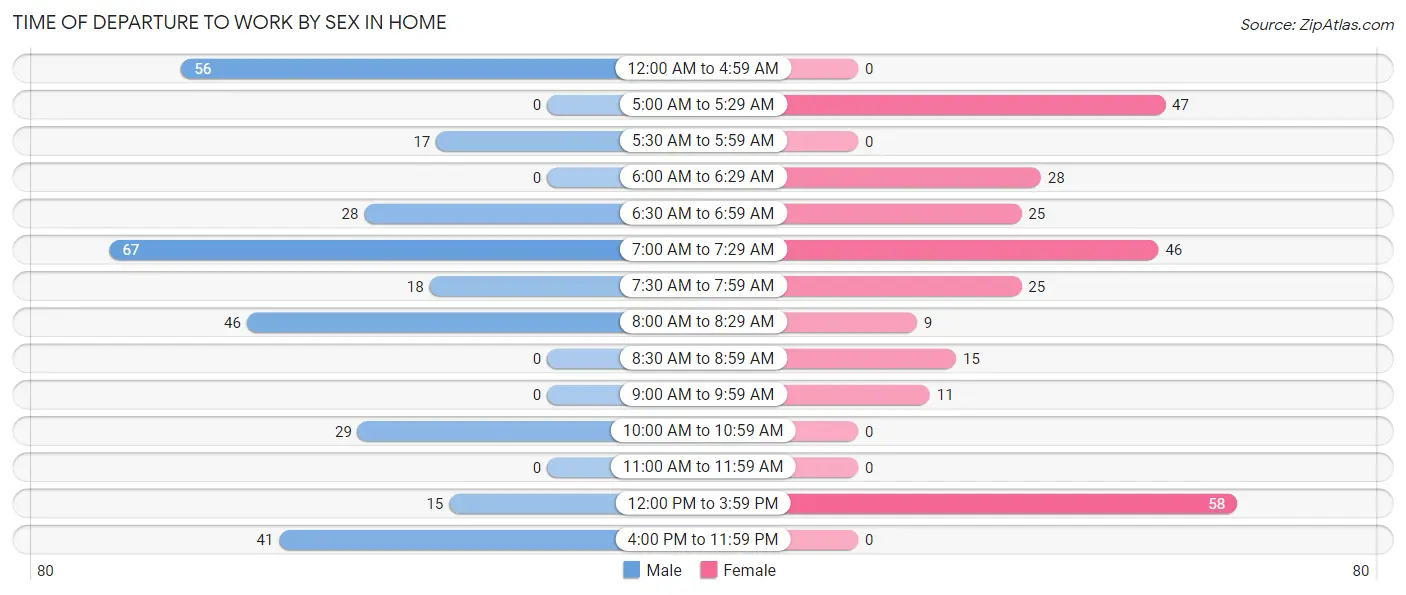
| Time of Departure | Male | Female |
| 12:00 AM to 4:59 AM | 56 (17.7%) | 0 (0.0%) |
| 5:00 AM to 5:29 AM | 0 (0.0%) | 47 (17.8%) |
| 5:30 AM to 5:59 AM | 17 (5.4%) | 0 (0.0%) |
| 6:00 AM to 6:29 AM | 0 (0.0%) | 28 (10.6%) |
| 6:30 AM to 6:59 AM | 28 (8.8%) | 25 (9.5%) |
| 7:00 AM to 7:29 AM | 67 (21.1%) | 46 (17.4%) |
| 7:30 AM to 7:59 AM | 18 (5.7%) | 25 (9.5%) |
| 8:00 AM to 8:29 AM | 46 (14.5%) | 9 (3.4%) |
| 8:30 AM to 8:59 AM | 0 (0.0%) | 15 (5.7%) |
| 9:00 AM to 9:59 AM | 0 (0.0%) | 11 (4.2%) |
| 10:00 AM to 10:59 AM | 29 (9.1%) | 0 (0.0%) |
| 11:00 AM to 11:59 AM | 0 (0.0%) | 0 (0.0%) |
| 12:00 PM to 3:59 PM | 15 (4.7%) | 58 (22.0%) |
| 4:00 PM to 11:59 PM | 41 (12.9%) | 0 (0.0%) |
| Total | 317 (100.0%) | 264 (100.0%) |
Housing Occupancy in Home
Occupancy by Ownership in Home
Of the total 554 dwellings in Home, owner-occupied units account for 505 (91.2%), while renter-occupied units make up 49 (8.8%).
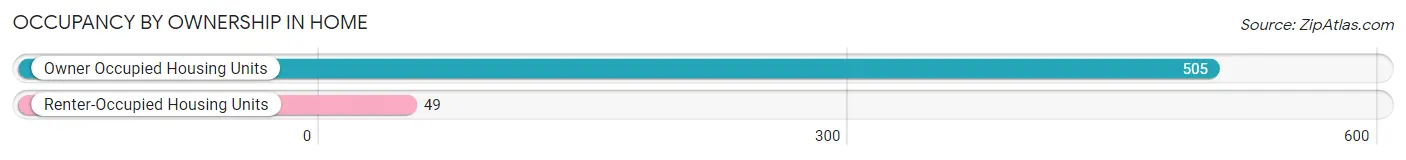
| Occupancy | # Housing Units | % Housing Units |
| Owner Occupied Housing Units | 505 | 91.2% |
| Renter-Occupied Housing Units | 49 | 8.8% |
| Total Occupied Housing Units | 554 | 100.0% |
Occupancy by Household Size in Home

| Household Size | # Housing Units | % Housing Units |
| 1-Person Household | 189 | 34.1% |
| 2-Person Household | 109 | 19.7% |
| 3-Person Household | 49 | 8.8% |
| 4+ Person Household | 207 | 37.4% |
| Total Housing Units | 554 | 100.0% |
Occupancy by Ownership by Household Size in Home
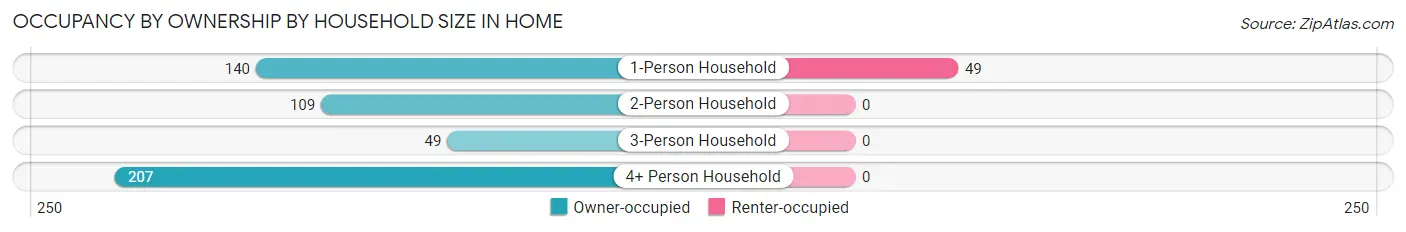
| Household Size | Owner-occupied | Renter-occupied |
| 1-Person Household | 140 (74.1%) | 49 (25.9%) |
| 2-Person Household | 109 (100.0%) | 0 (0.0%) |
| 3-Person Household | 49 (100.0%) | 0 (0.0%) |
| 4+ Person Household | 207 (100.0%) | 0 (0.0%) |
| Total Housing Units | 505 (91.2%) | 49 (8.8%) |
Occupancy by Educational Attainment in Home
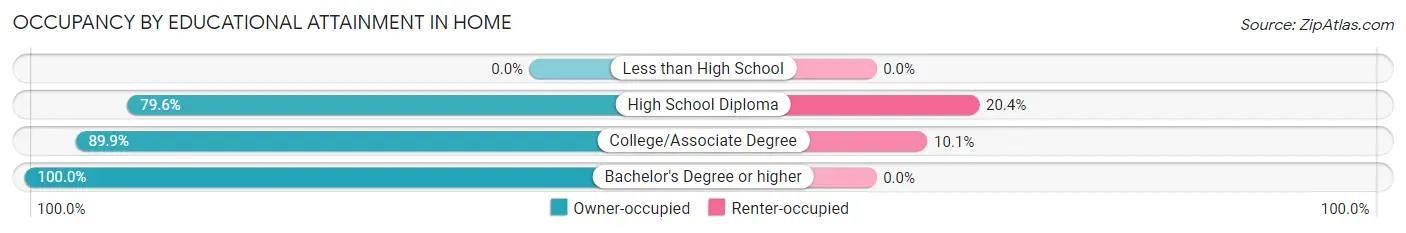
| Household Size | Owner-occupied | Renter-occupied |
| Less than High School | 0 (0.0%) | 0 (0.0%) |
| High School Diploma | 82 (79.6%) | 21 (20.4%) |
| College/Associate Degree | 249 (89.9%) | 28 (10.1%) |
| Bachelor's Degree or higher | 174 (100.0%) | 0 (0.0%) |
Occupancy by Age of Householder in Home
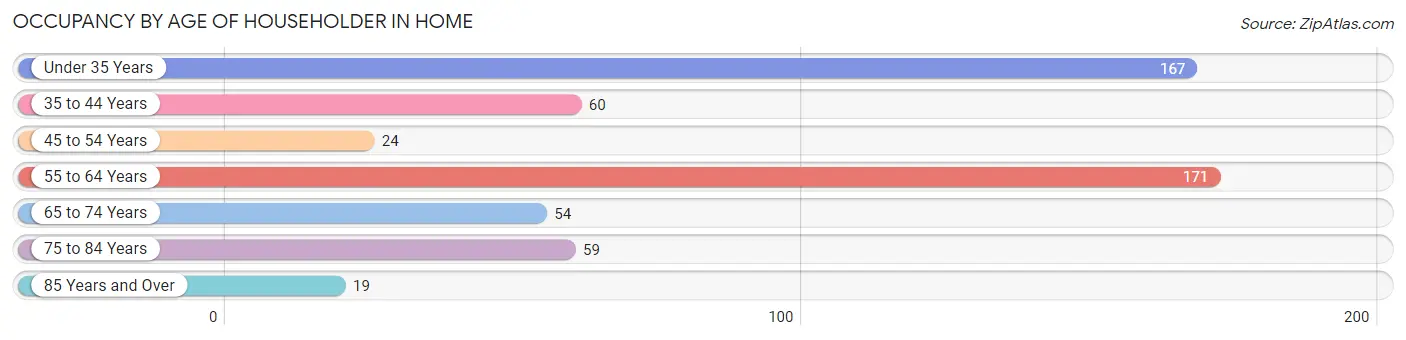
| Age Bracket | # Households | % Households |
| Under 35 Years | 167 | 30.1% |
| 35 to 44 Years | 60 | 10.8% |
| 45 to 54 Years | 24 | 4.3% |
| 55 to 64 Years | 171 | 30.9% |
| 65 to 74 Years | 54 | 9.8% |
| 75 to 84 Years | 59 | 10.6% |
| 85 Years and Over | 19 | 3.4% |
| Total | 554 | 100.0% |
Housing Finances in Home
Median Income by Occupancy in Home
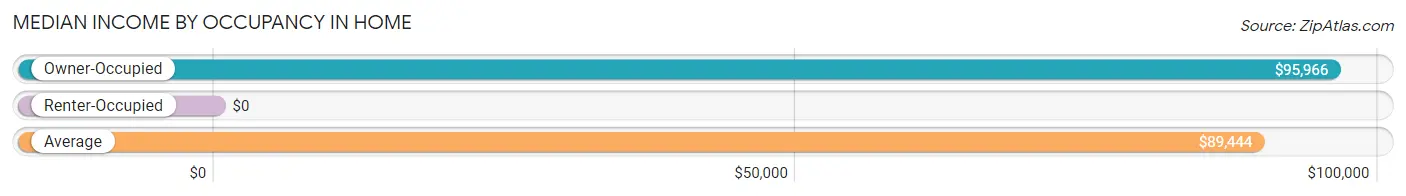
| Occupancy Type | # Households | Median Income |
| Owner-Occupied | 505 (91.2%) | $95,966 |
| Renter-Occupied | 49 (8.8%) | $0 |
| Average | 554 (100.0%) | $89,444 |
Occupancy by Householder Income Bracket in Home
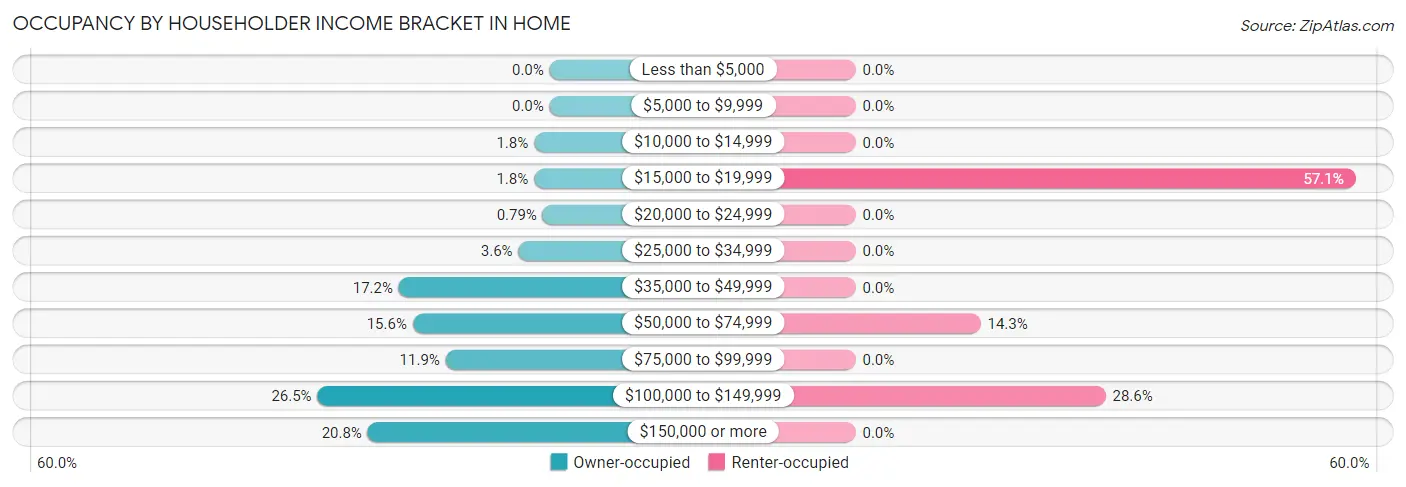
| Income Bracket | Owner-occupied | Renter-occupied |
| Less than $5,000 | 0 (0.0%) | 0 (0.0%) |
| $5,000 to $9,999 | 0 (0.0%) | 0 (0.0%) |
| $10,000 to $14,999 | 9 (1.8%) | 0 (0.0%) |
| $15,000 to $19,999 | 9 (1.8%) | 28 (57.1%) |
| $20,000 to $24,999 | 4 (0.8%) | 0 (0.0%) |
| $25,000 to $34,999 | 18 (3.6%) | 0 (0.0%) |
| $35,000 to $49,999 | 87 (17.2%) | 0 (0.0%) |
| $50,000 to $74,999 | 79 (15.6%) | 7 (14.3%) |
| $75,000 to $99,999 | 60 (11.9%) | 0 (0.0%) |
| $100,000 to $149,999 | 134 (26.5%) | 14 (28.6%) |
| $150,000 or more | 105 (20.8%) | 0 (0.0%) |
| Total | 505 (100.0%) | 49 (100.0%) |
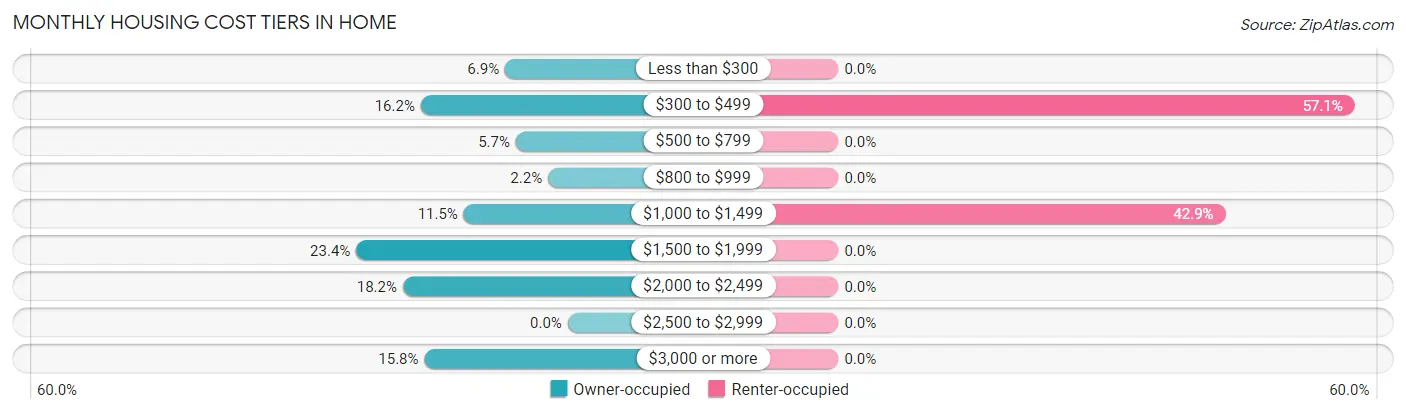
Monthly Housing Cost Tiers in Home
| Monthly Cost | Owner-occupied | Renter-occupied |
| Less than $300 | 35 (6.9%) | 0 (0.0%) |
| $300 to $499 | 82 (16.2%) | 28 (57.1%) |
| $500 to $799 | 29 (5.7%) | 0 (0.0%) |
| $800 to $999 | 11 (2.2%) | 0 (0.0%) |
| $1,000 to $1,499 | 58 (11.5%) | 21 (42.9%) |
| $1,500 to $1,999 | 118 (23.4%) | 0 (0.0%) |
| $2,000 to $2,499 | 92 (18.2%) | 0 (0.0%) |
| $2,500 to $2,999 | 0 (0.0%) | 0 (0.0%) |
| $3,000 or more | 80 (15.8%) | 0 (0.0%) |
| Total | 505 (100.0%) | 49 (100.0%) |
Physical Housing Characteristics in Home
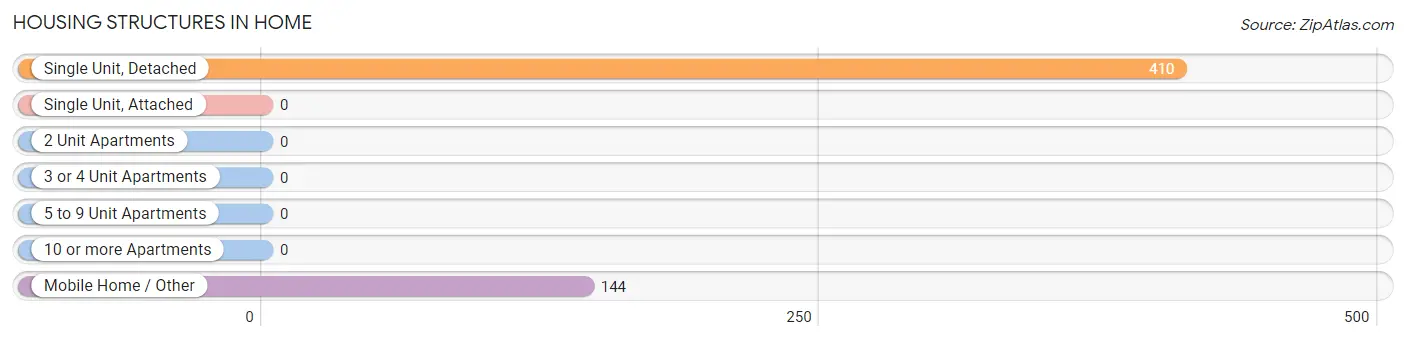
Housing Structures in Home
| Structure Type | # Housing Units | % Housing Units |
| Single Unit, Detached | 410 | 74.0% |
| Single Unit, Attached | 0 | 0.0% |
| 2 Unit Apartments | 0 | 0.0% |
| 3 or 4 Unit Apartments | 0 | 0.0% |
| 5 to 9 Unit Apartments | 0 | 0.0% |
| 10 or more Apartments | 0 | 0.0% |
| Mobile Home / Other | 144 | 26.0% |
| Total | 554 | 100.0% |
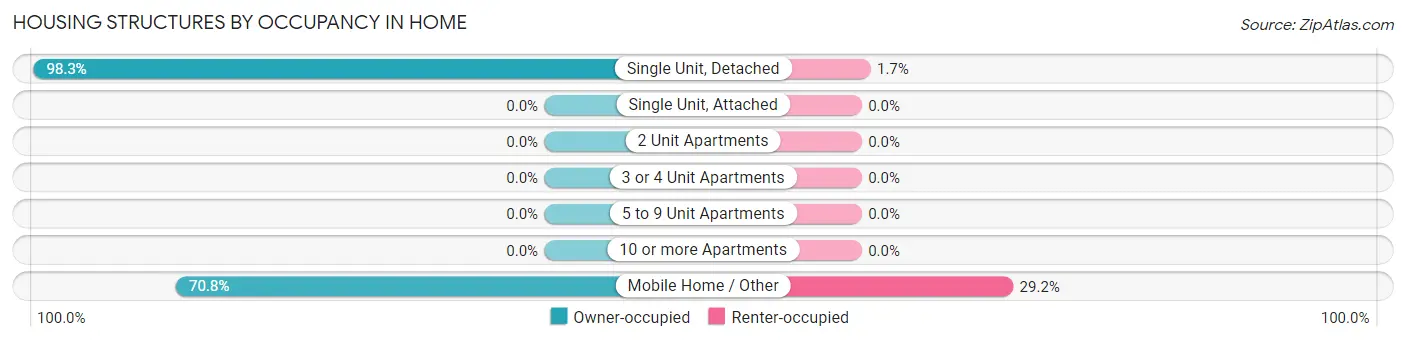
Housing Structures by Occupancy in Home
| Structure Type | Owner-occupied | Renter-occupied |
| Single Unit, Detached | 403 (98.3%) | 7 (1.7%) |
| Single Unit, Attached | 0 (0.0%) | 0 (0.0%) |
| 2 Unit Apartments | 0 (0.0%) | 0 (0.0%) |
| 3 or 4 Unit Apartments | 0 (0.0%) | 0 (0.0%) |
| 5 to 9 Unit Apartments | 0 (0.0%) | 0 (0.0%) |
| 10 or more Apartments | 0 (0.0%) | 0 (0.0%) |
| Mobile Home / Other | 102 (70.8%) | 42 (29.2%) |
| Total | 505 (91.2%) | 49 (8.8%) |
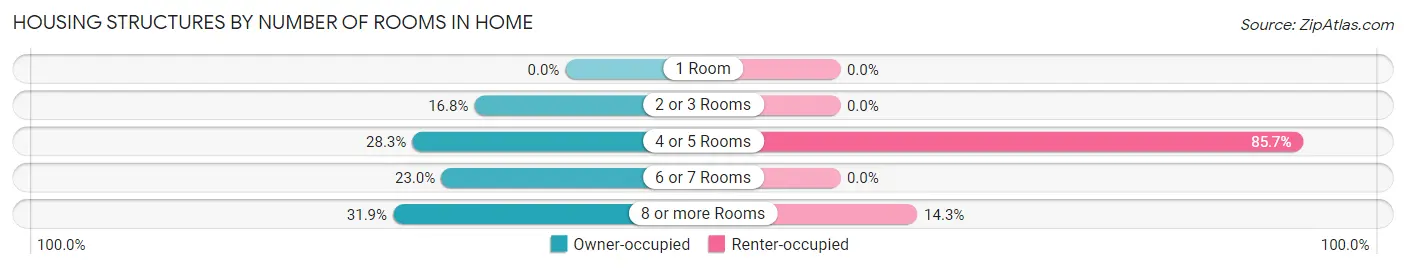
Housing Structures by Number of Rooms in Home
| Number of Rooms | Owner-occupied | Renter-occupied |
| 1 Room | 0 (0.0%) | 0 (0.0%) |
| 2 or 3 Rooms | 85 (16.8%) | 0 (0.0%) |
| 4 or 5 Rooms | 143 (28.3%) | 42 (85.7%) |
| 6 or 7 Rooms | 116 (23.0%) | 0 (0.0%) |
| 8 or more Rooms | 161 (31.9%) | 7 (14.3%) |
| Total | 505 (100.0%) | 49 (100.0%) |
Housing Structure by Heating Type in Home
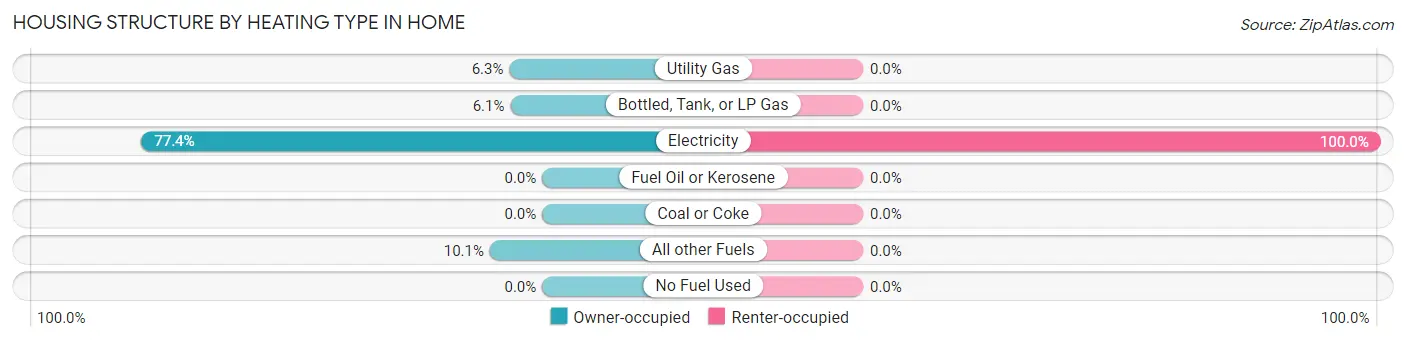
| Heating Type | Owner-occupied | Renter-occupied |
| Utility Gas | 32 (6.3%) | 0 (0.0%) |
| Bottled, Tank, or LP Gas | 31 (6.1%) | 0 (0.0%) |
| Electricity | 391 (77.4%) | 49 (100.0%) |
| Fuel Oil or Kerosene | 0 (0.0%) | 0 (0.0%) |
| Coal or Coke | 0 (0.0%) | 0 (0.0%) |
| All other Fuels | 51 (10.1%) | 0 (0.0%) |
| No Fuel Used | 0 (0.0%) | 0 (0.0%) |
| Total | 505 (100.0%) | 49 (100.0%) |
Household Vehicle Usage in Home
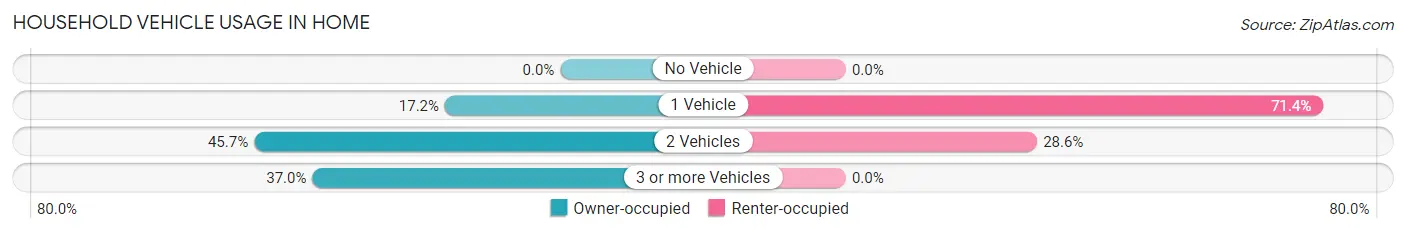
| Vehicles per Household | Owner-occupied | Renter-occupied |
| No Vehicle | 0 (0.0%) | 0 (0.0%) |
| 1 Vehicle | 87 (17.2%) | 35 (71.4%) |
| 2 Vehicles | 231 (45.7%) | 14 (28.6%) |
| 3 or more Vehicles | 187 (37.0%) | 0 (0.0%) |
| Total | 505 (100.0%) | 49 (100.0%) |
Real Estate & Mortgages in Home
Real Estate and Mortgage Overview in Home
| Characteristic | Without Mortgage | With Mortgage |
| Housing Units | 165 | 340 |
| Median Property Value | $338,600 | $412,400 |
| Median Household Income | $62,232 | $87 |
| Monthly Housing Costs | $407 | $80 |
| Real Estate Taxes | $1,527 | $0 |
Property Value by Mortgage Status in Home
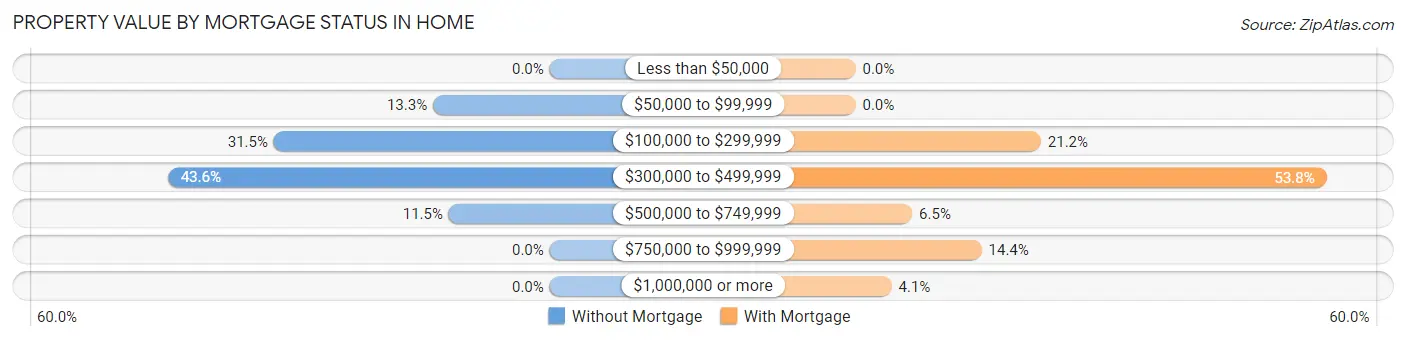
| Property Value | Without Mortgage | With Mortgage |
| Less than $50,000 | 0 (0.0%) | 0 (0.0%) |
| $50,000 to $99,999 | 22 (13.3%) | 0 (0.0%) |
| $100,000 to $299,999 | 52 (31.5%) | 72 (21.2%) |
| $300,000 to $499,999 | 72 (43.6%) | 183 (53.8%) |
| $500,000 to $749,999 | 19 (11.5%) | 22 (6.5%) |
| $750,000 to $999,999 | 0 (0.0%) | 49 (14.4%) |
| $1,000,000 or more | 0 (0.0%) | 14 (4.1%) |
| Total | 165 (100.0%) | 340 (100.0%) |
Household Income by Mortgage Status in Home
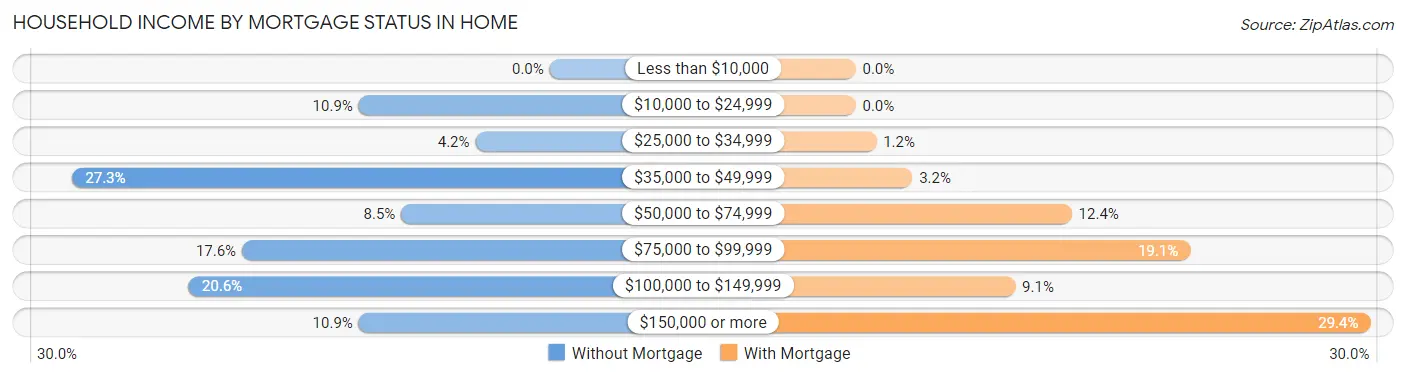
| Household Income | Without Mortgage | With Mortgage |
| Less than $10,000 | 0 (0.0%) | 0 (0.0%) |
| $10,000 to $24,999 | 18 (10.9%) | 0 (0.0%) |
| $25,000 to $34,999 | 7 (4.2%) | 4 (1.2%) |
| $35,000 to $49,999 | 45 (27.3%) | 11 (3.2%) |
| $50,000 to $74,999 | 14 (8.5%) | 42 (12.3%) |
| $75,000 to $99,999 | 29 (17.6%) | 65 (19.1%) |
| $100,000 to $149,999 | 34 (20.6%) | 31 (9.1%) |
| $150,000 or more | 18 (10.9%) | 100 (29.4%) |
| Total | 165 (100.0%) | 340 (100.0%) |
Property Value to Household Income Ratio in Home
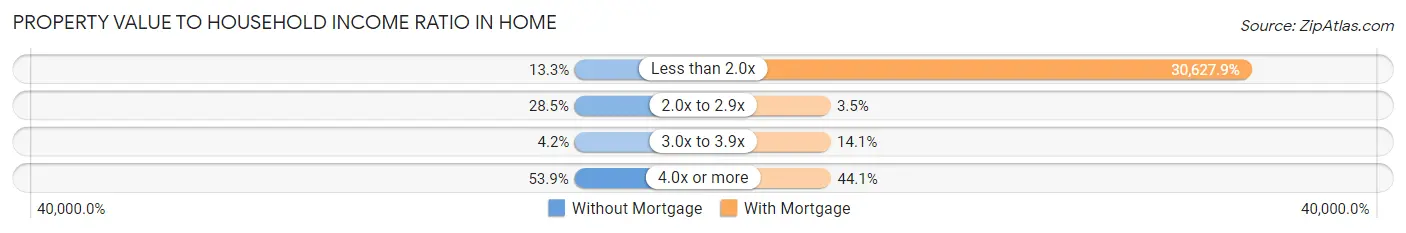
| Value-to-Income Ratio | Without Mortgage | With Mortgage |
| Less than 2.0x | 22 (13.3%) | 104,135 (30,627.9%) |
| 2.0x to 2.9x | 47 (28.5%) | 12 (3.5%) |
| 3.0x to 3.9x | 7 (4.2%) | 48 (14.1%) |
| 4.0x or more | 89 (53.9%) | 150 (44.1%) |
| Total | 165 (100.0%) | 340 (100.0%) |
Real Estate Taxes by Mortgage Status in Home
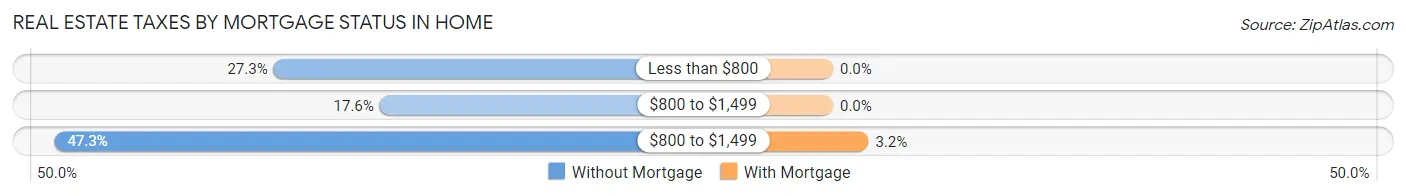
| Property Taxes | Without Mortgage | With Mortgage |
| Less than $800 | 45 (27.3%) | 0 (0.0%) |
| $800 to $1,499 | 29 (17.6%) | 0 (0.0%) |
| $800 to $1,499 | 78 (47.3%) | 11 (3.2%) |
| Total | 165 (100.0%) | 340 (100.0%) |
Health & Disability in Home
Health Insurance Coverage by Age in Home
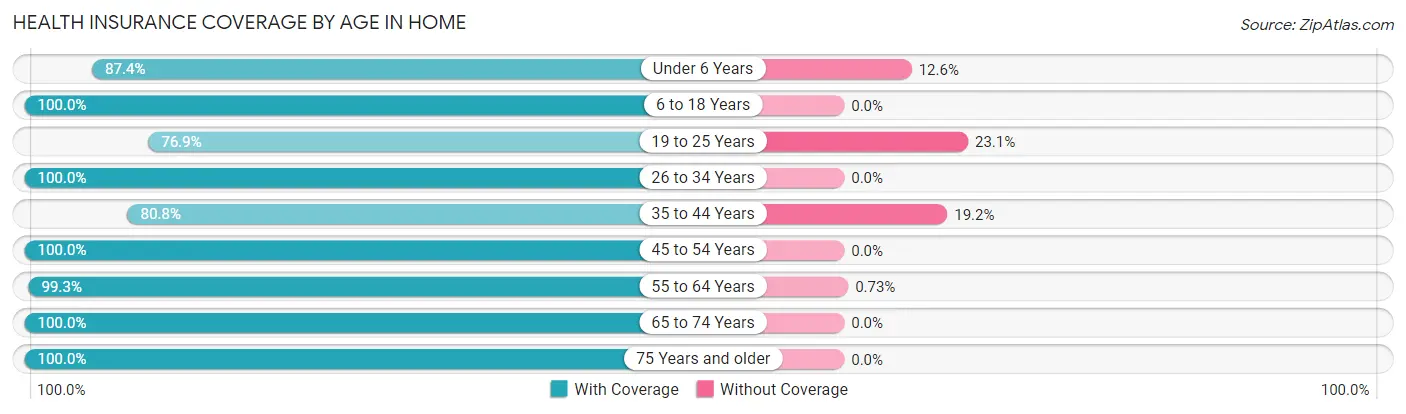
| Age Bracket | With Coverage | Without Coverage |
| Under 6 Years | 132 (87.4%) | 19 (12.6%) |
| 6 to 18 Years | 423 (100.0%) | 0 (0.0%) |
| 19 to 25 Years | 60 (76.9%) | 18 (23.1%) |
| 26 to 34 Years | 276 (100.0%) | 0 (0.0%) |
| 35 to 44 Years | 143 (80.8%) | 34 (19.2%) |
| 45 to 54 Years | 93 (100.0%) | 0 (0.0%) |
| 55 to 64 Years | 271 (99.3%) | 2 (0.7%) |
| 65 to 74 Years | 100 (100.0%) | 0 (0.0%) |
| 75 Years and older | 120 (100.0%) | 0 (0.0%) |
| Total | 1,618 (95.7%) | 73 (4.3%) |
Health Insurance Coverage by Citizenship Status in Home
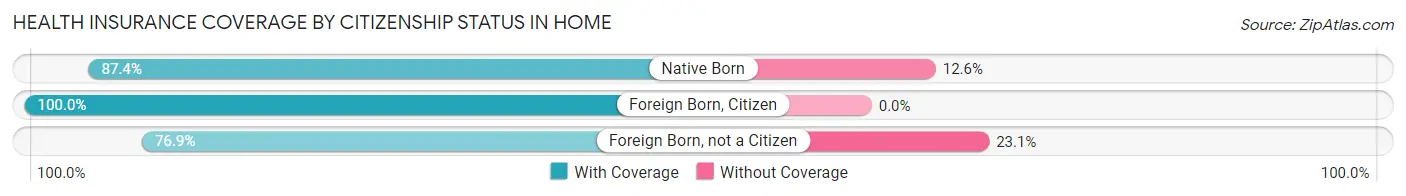
| Citizenship Status | With Coverage | Without Coverage |
| Native Born | 132 (87.4%) | 19 (12.6%) |
| Foreign Born, Citizen | 423 (100.0%) | 0 (0.0%) |
| Foreign Born, not a Citizen | 60 (76.9%) | 18 (23.1%) |
Health Insurance Coverage by Household Income in Home
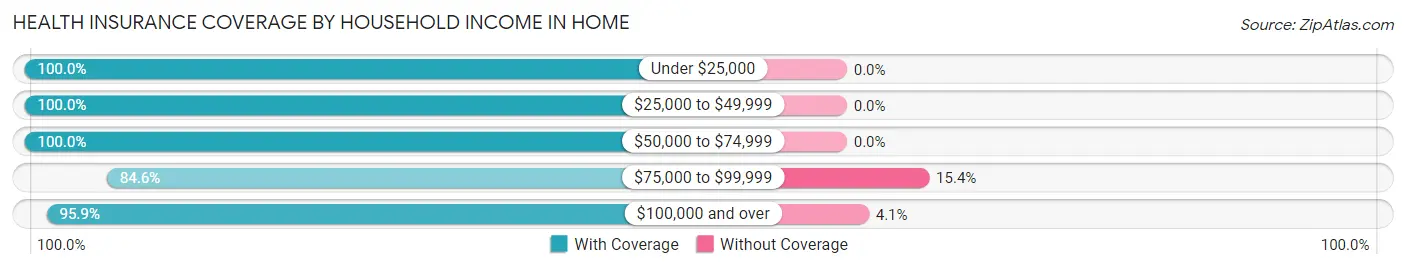
| Household Income | With Coverage | Without Coverage |
| Under $25,000 | 57 (100.0%) | 0 (0.0%) |
| $25,000 to $49,999 | 288 (100.0%) | 0 (0.0%) |
| $50,000 to $74,999 | 158 (100.0%) | 0 (0.0%) |
| $75,000 to $99,999 | 159 (84.6%) | 29 (15.4%) |
| $100,000 and over | 954 (95.9%) | 41 (4.1%) |
Public vs Private Health Insurance Coverage by Age in Home
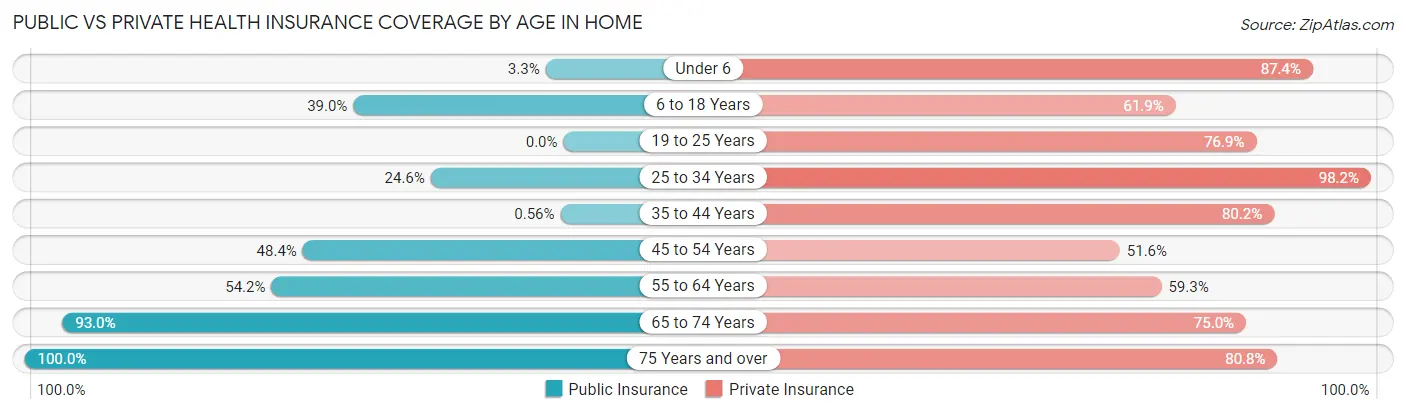
| Age Bracket | Public Insurance | Private Insurance |
| Under 6 | 5 (3.3%) | 132 (87.4%) |
| 6 to 18 Years | 165 (39.0%) | 262 (61.9%) |
| 19 to 25 Years | 0 (0.0%) | 60 (76.9%) |
| 25 to 34 Years | 68 (24.6%) | 271 (98.2%) |
| 35 to 44 Years | 1 (0.6%) | 142 (80.2%) |
| 45 to 54 Years | 45 (48.4%) | 48 (51.6%) |
| 55 to 64 Years | 148 (54.2%) | 162 (59.3%) |
| 65 to 74 Years | 93 (93.0%) | 75 (75.0%) |
| 75 Years and over | 120 (100.0%) | 97 (80.8%) |
| Total | 645 (38.1%) | 1,249 (73.9%) |
Disability Status by Sex by Age in Home
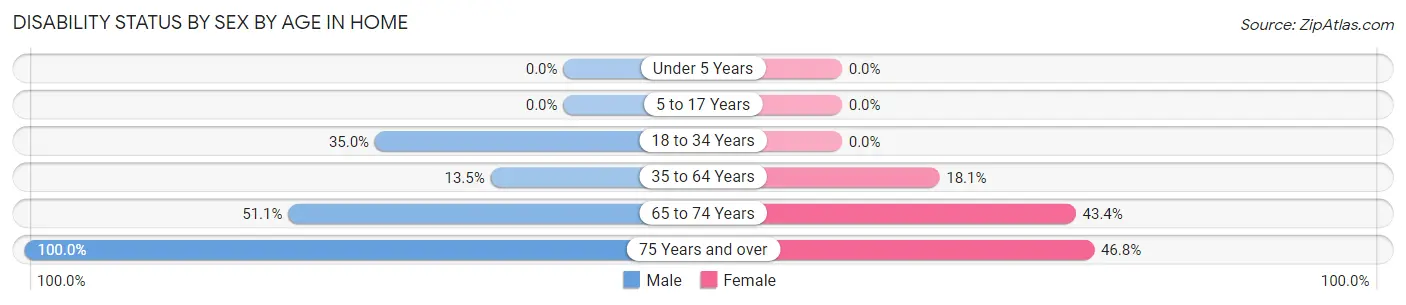
| Age Bracket | Male | Female |
| Under 5 Years | 0 (0.0%) | 0 (0.0%) |
| 5 to 17 Years | 0 (0.0%) | 0 (0.0%) |
| 18 to 34 Years | 64 (35.0%) | 0 (0.0%) |
| 35 to 64 Years | 45 (13.5%) | 38 (18.1%) |
| 65 to 74 Years | 24 (51.1%) | 23 (43.4%) |
| 75 Years and over | 26 (100.0%) | 44 (46.8%) |
Disability Class by Sex by Age in Home
Disability Class: Hearing Difficulty
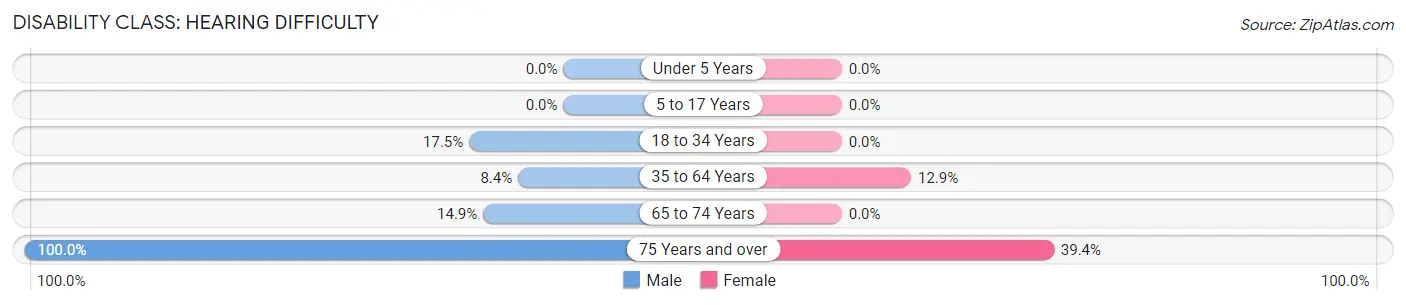
| Age Bracket | Male | Female |
| Under 5 Years | 0 (0.0%) | 0 (0.0%) |
| 5 to 17 Years | 0 (0.0%) | 0 (0.0%) |
| 18 to 34 Years | 32 (17.5%) | 0 (0.0%) |
| 35 to 64 Years | 28 (8.4%) | 27 (12.9%) |
| 65 to 74 Years | 7 (14.9%) | 0 (0.0%) |
| 75 Years and over | 26 (100.0%) | 37 (39.4%) |
Disability Class: Vision Difficulty
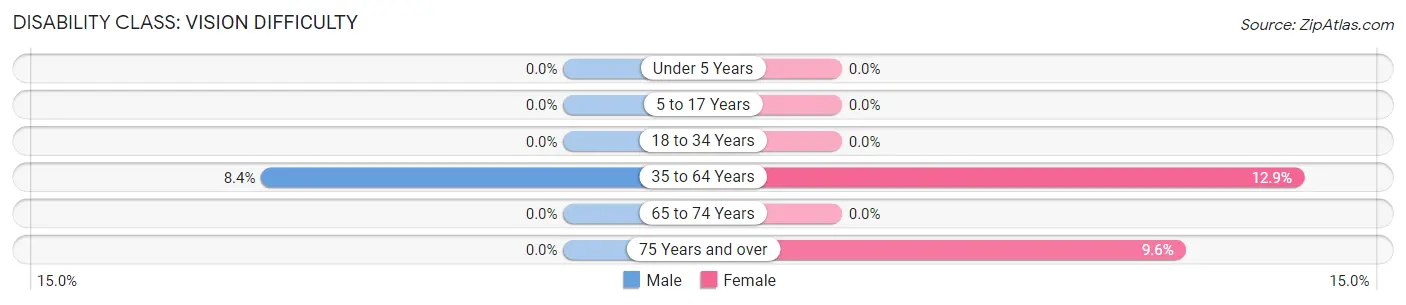
| Age Bracket | Male | Female |
| Under 5 Years | 0 (0.0%) | 0 (0.0%) |
| 5 to 17 Years | 0 (0.0%) | 0 (0.0%) |
| 18 to 34 Years | 0 (0.0%) | 0 (0.0%) |
| 35 to 64 Years | 28 (8.4%) | 27 (12.9%) |
| 65 to 74 Years | 0 (0.0%) | 0 (0.0%) |
| 75 Years and over | 0 (0.0%) | 9 (9.6%) |
Disability Class: Cognitive Difficulty
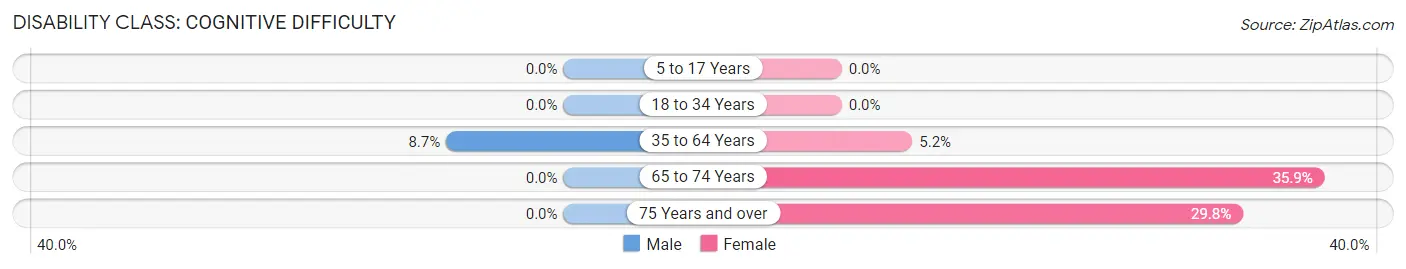
| Age Bracket | Male | Female |
| 5 to 17 Years | 0 (0.0%) | 0 (0.0%) |
| 18 to 34 Years | 0 (0.0%) | 0 (0.0%) |
| 35 to 64 Years | 29 (8.7%) | 11 (5.2%) |
| 65 to 74 Years | 0 (0.0%) | 19 (35.8%) |
| 75 Years and over | 0 (0.0%) | 28 (29.8%) |
Disability Class: Ambulatory Difficulty
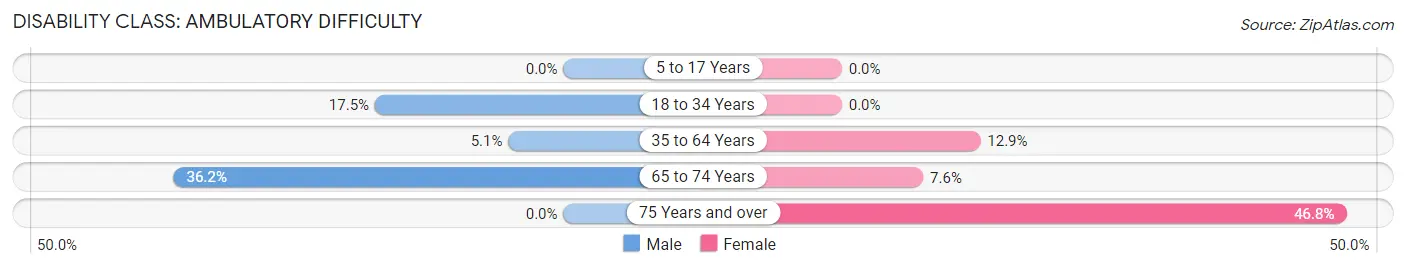
| Age Bracket | Male | Female |
| 5 to 17 Years | 0 (0.0%) | 0 (0.0%) |
| 18 to 34 Years | 32 (17.5%) | 0 (0.0%) |
| 35 to 64 Years | 17 (5.1%) | 27 (12.9%) |
| 65 to 74 Years | 17 (36.2%) | 4 (7.5%) |
| 75 Years and over | 0 (0.0%) | 44 (46.8%) |
Disability Class: Self-Care Difficulty
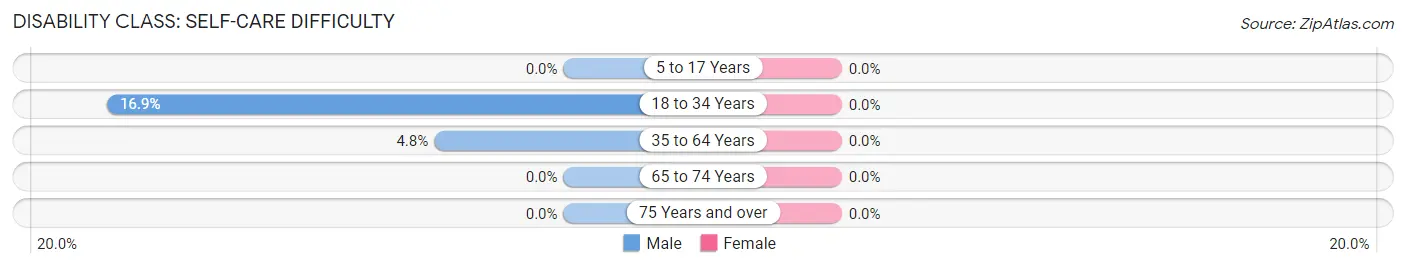
| Age Bracket | Male | Female |
| 5 to 17 Years | 0 (0.0%) | 0 (0.0%) |
| 18 to 34 Years | 31 (16.9%) | 0 (0.0%) |
| 35 to 64 Years | 16 (4.8%) | 0 (0.0%) |
| 65 to 74 Years | 0 (0.0%) | 0 (0.0%) |
| 75 Years and over | 0 (0.0%) | 0 (0.0%) |
Technology Access in Home
Computing Device Access in Home
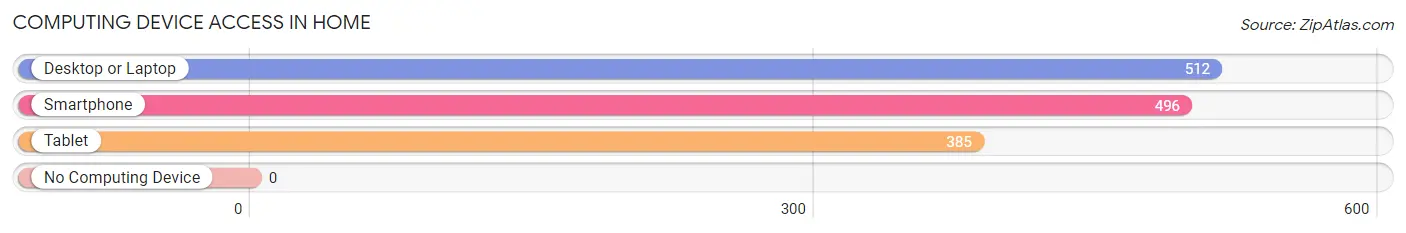
| Device Type | # Households | % Households |
| Desktop or Laptop | 512 | 92.4% |
| Smartphone | 496 | 89.5% |
| Tablet | 385 | 69.5% |
| No Computing Device | 0 | 0.0% |
| Total | 554 | 100.0% |
Internet Access in Home
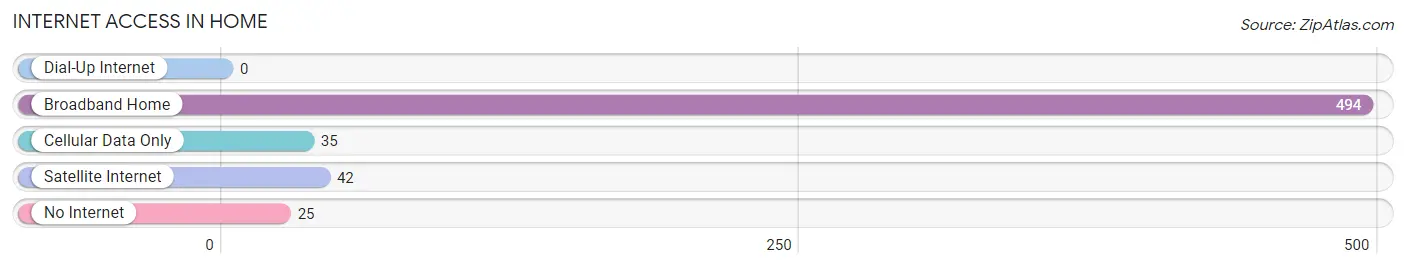
| Internet Type | # Households | % Households |
| Dial-Up Internet | 0 | 0.0% |
| Broadband Home | 494 | 89.2% |
| Cellular Data Only | 35 | 6.3% |
| Satellite Internet | 42 | 7.6% |
| No Internet | 25 | 4.5% |
| Total | 554 | 100.0% |
Home Summary
Washington is a state located in the Pacific Northwest region of the United States. It is bordered by Oregon to the south, Idaho to the east, and the Canadian province of British Columbia to the north. Washington is the 18th largest state in the United States, with an area of 71,362 square miles, and the 13th most populous state, with a population of 7.6 million as of 2019. The state capital is Olympia, and the largest city is Seattle.
History
The area that is now Washington was first inhabited by Native American tribes, including the Chinook, Nisqually, and Klickitat. The first European to explore the area was British explorer George Vancouver in 1792. The area was part of the Oregon Country, a disputed region between the United States and Great Britain, until 1846 when the Oregon Treaty established the 49th parallel as the border between the two countries.
Washington became a U.S. territory in 1853 and was admitted to the Union as the 42nd state in 1889. The state was named after George Washington, the first president of the United States.
Geography
Washington is located in the Pacific Northwest region of the United States. It is bordered by Oregon to the south, Idaho to the east, and the Canadian province of British Columbia to the north. The state has a diverse landscape, ranging from the Cascade Mountains in the west to the Rocky Mountains in the east. The Olympic Mountains are located in the northwest corner of the state, and the Columbia River forms much of the state's eastern border.
The climate of Washington is generally mild, with warm summers and cool winters. The western part of the state is generally wetter than the eastern part, and the Cascade Mountains act as a rain shadow, creating a drier climate in the east.
Economy
Washington has a diverse economy, with major industries including aerospace, agriculture, technology, and tourism. The state is home to several major companies, including Microsoft, Amazon, Boeing, and Starbucks.
Agriculture is an important part of the state's economy, with major crops including apples, wheat, potatoes, and hay. Washington is the leading producer of apples in the United States, and the state is also a major producer of wine.
The state is also home to several major ports, including the Port of Seattle and the Port of Tacoma. These ports are important for international trade and are major hubs for the shipping industry.
Demographics
As of 2019, the population of Washington was estimated to be 7.6 million. The state is ethnically diverse, with the largest ethnic groups being White (77.2%), Hispanic or Latino (11.2%), and Asian (7.2%).
The median household income in Washington is $71,835, and the median home value is $372,400. The state has a poverty rate of 11.2%, and the unemployment rate is 4.3%.
Washington is home to several major cities, including Seattle, Spokane, Tacoma, and Vancouver. Seattle is the largest city in the state, with a population of 744,955. Spokane is the second largest city, with a population of 217,108.
Common Questions
What is Per Capita Income in Home?
Per Capita income in Home is $33,608.
What is the Median Family Income in Home?
Median Family Income in Home is $120,128.
What is the Median Household income in Home?
Median Household Income in Home is $89,444.
What is Income or Wage Gap in Home?
Income or Wage Gap in Home is 6.6%.
Women in Home earn 93.4 cents for every dollar earned by a man.
What is Inequality or Gini Index in Home?
Inequality or Gini Index in Home is 0.36.
What is the Total Population of Home?
Total Population of Home is 1,692.
What is the Total Male Population of Home?
Total Male Population of Home is 885.
What is the Total Female Population of Home?
Total Female Population of Home is 807.
What is the Ratio of Males per 100 Females in Home?
There are 109.67 Males per 100 Females in Home.
What is the Ratio of Females per 100 Males in Home?
There are 91.19 Females per 100 Males in Home.
What is the Median Population Age in Home?
Median Population Age in Home is 31.3 Years.
What is the Average Family Size in Home
Average Family Size in Home is 4.0 People.
What is the Average Household Size in Home
Average Household Size in Home is 3.0 People.
How Large is the Labor Force in Home?
There are 699 People in the Labor Forcein in Home.
What is the Percentage of People in the Labor Force in Home?
62.5% of People are in the Labor Force in Home.