White Center, WA Map & Demographics
White Center Map
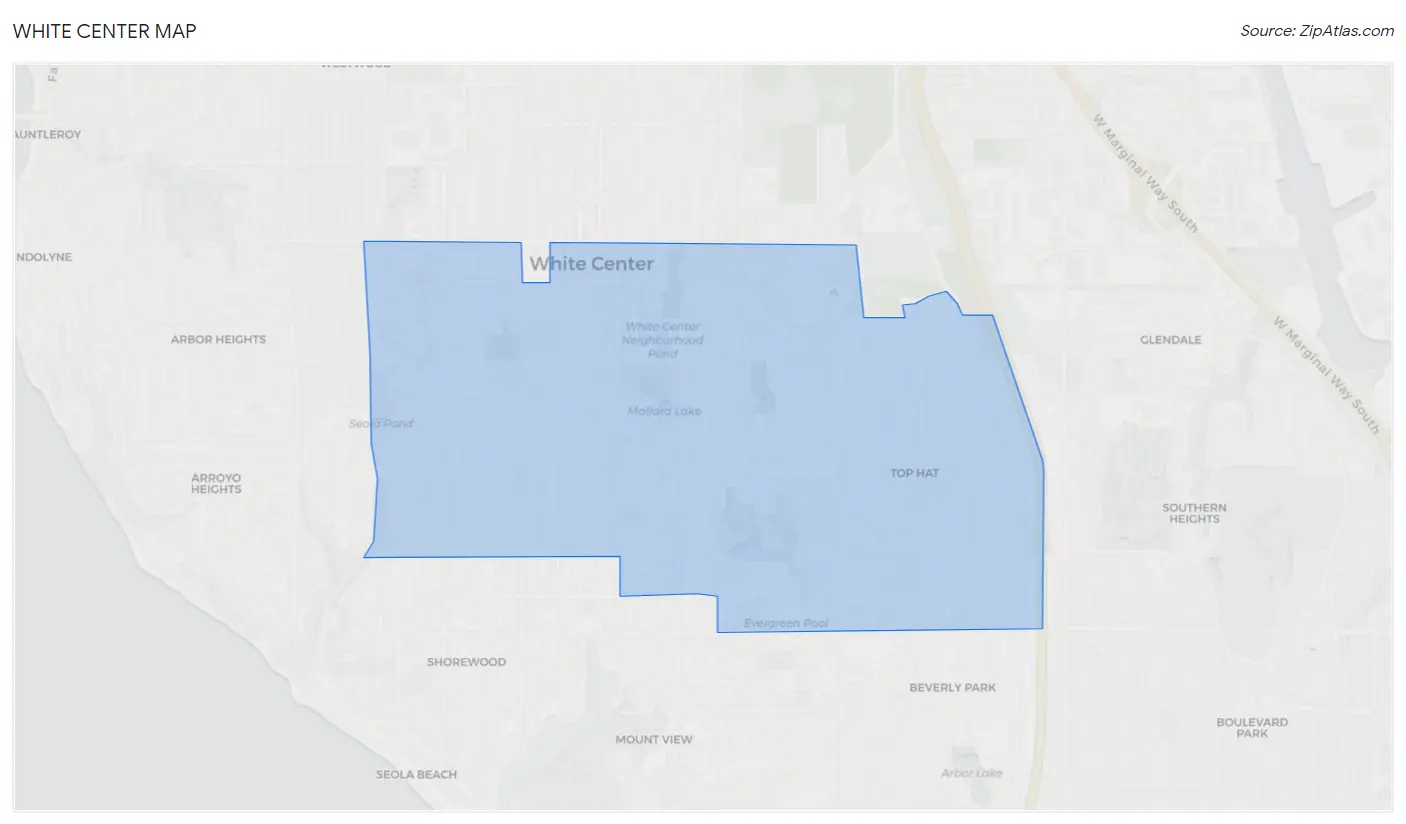
White Center Overview
$40,370
PER CAPITA INCOME
$83,045
AVG FAMILY INCOME
$79,432
AVG HOUSEHOLD INCOME
32.7%
WAGE / INCOME GAP [ % ]
67.3¢/ $1
WAGE / INCOME GAP [ $ ]
0.45
INEQUALITY / GINI INDEX
15,479
TOTAL POPULATION
7,840
MALE POPULATION
7,639
FEMALE POPULATION
102.63
MALES / 100 FEMALES
97.44
FEMALES / 100 MALES
36.1
MEDIAN AGE
3.1
AVG FAMILY SIZE
2.6
AVG HOUSEHOLD SIZE
8,888
LABOR FORCE [ PEOPLE ]
71.1%
PERCENT IN LABOR FORCE
5.6%
UNEMPLOYMENT RATE
Income in White Center
Income Overview in White Center
Per Capita Income in White Center is $40,370, while median incomes of families and households are $83,045 and $79,432 respectively.
| Characteristic | Number | Measure |
| Per Capita Income | 15,479 | $40,370 |
| Median Family Income | 3,735 | $83,045 |
| Mean Family Income | 3,735 | $106,339 |
| Median Household Income | 5,850 | $79,432 |
| Mean Household Income | 5,850 | $107,239 |
| Income Deficit | 3,735 | $0 |
| Wage / Income Gap (%) | 15,479 | 32.65% |
| Wage / Income Gap ($) | 15,479 | 67.35¢ per $1 |
| Gini / Inequality Index | 15,479 | 0.45 |
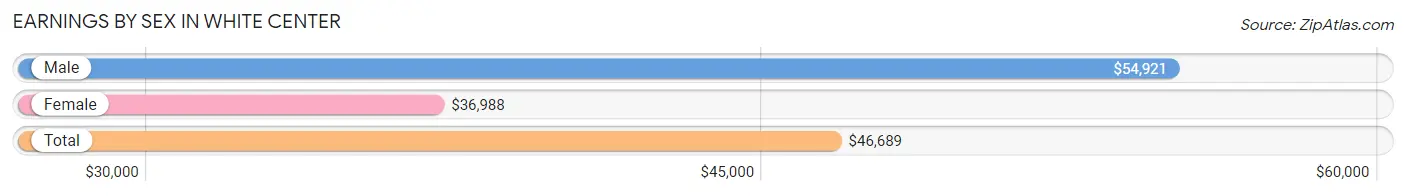
Earnings by Sex in White Center
Average Earnings in White Center are $46,689, $54,921 for men and $36,988 for women, a difference of 32.7%.
| Sex | Number | Average Earnings |
| Male | 4,811 (52.8%) | $54,921 |
| Female | 4,292 (47.1%) | $36,988 |
| Total | 9,103 (100.0%) | $46,689 |
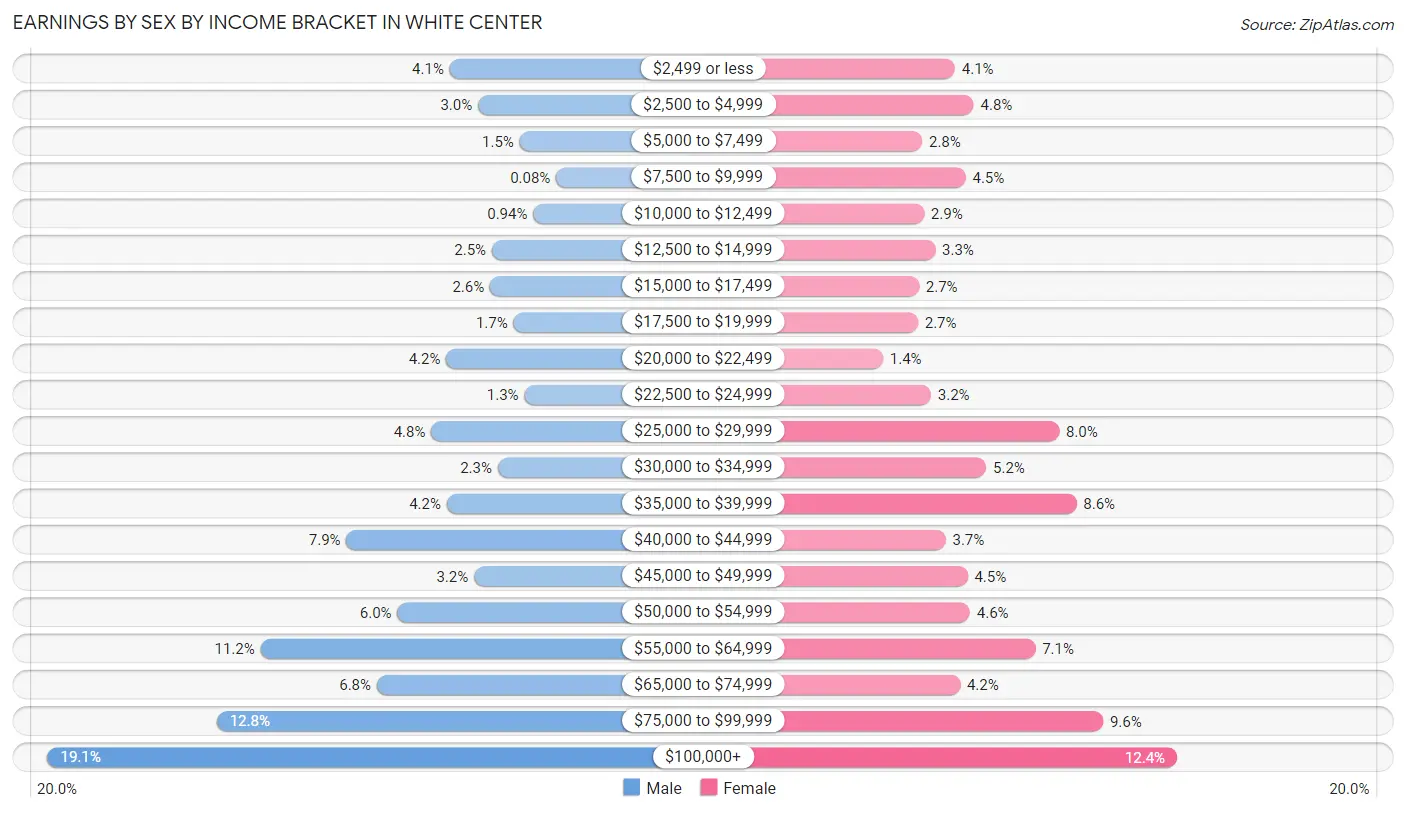
Earnings by Sex by Income Bracket in White Center
The most common earnings brackets in White Center are $100,000+ for men (921 | 19.1%) and $100,000+ for women (531 | 12.4%).
| Income | Male | Female |
| $2,499 or less | 196 (4.1%) | 174 (4.1%) |
| $2,500 to $4,999 | 145 (3.0%) | 204 (4.8%) |
| $5,000 to $7,499 | 70 (1.5%) | 121 (2.8%) |
| $7,500 to $9,999 | 4 (0.1%) | 191 (4.4%) |
| $10,000 to $12,499 | 45 (0.9%) | 124 (2.9%) |
| $12,500 to $14,999 | 120 (2.5%) | 142 (3.3%) |
| $15,000 to $17,499 | 123 (2.6%) | 116 (2.7%) |
| $17,500 to $19,999 | 81 (1.7%) | 114 (2.7%) |
| $20,000 to $22,499 | 202 (4.2%) | 58 (1.3%) |
| $22,500 to $24,999 | 61 (1.3%) | 135 (3.2%) |
| $25,000 to $29,999 | 229 (4.8%) | 341 (8.0%) |
| $30,000 to $34,999 | 109 (2.3%) | 224 (5.2%) |
| $35,000 to $39,999 | 201 (4.2%) | 369 (8.6%) |
| $40,000 to $44,999 | 382 (7.9%) | 159 (3.7%) |
| $45,000 to $49,999 | 152 (3.2%) | 194 (4.5%) |
| $50,000 to $54,999 | 290 (6.0%) | 198 (4.6%) |
| $55,000 to $64,999 | 537 (11.2%) | 303 (7.1%) |
| $65,000 to $74,999 | 327 (6.8%) | 182 (4.2%) |
| $75,000 to $99,999 | 616 (12.8%) | 412 (9.6%) |
| $100,000+ | 921 (19.1%) | 531 (12.4%) |
| Total | 4,811 (100.0%) | 4,292 (100.0%) |
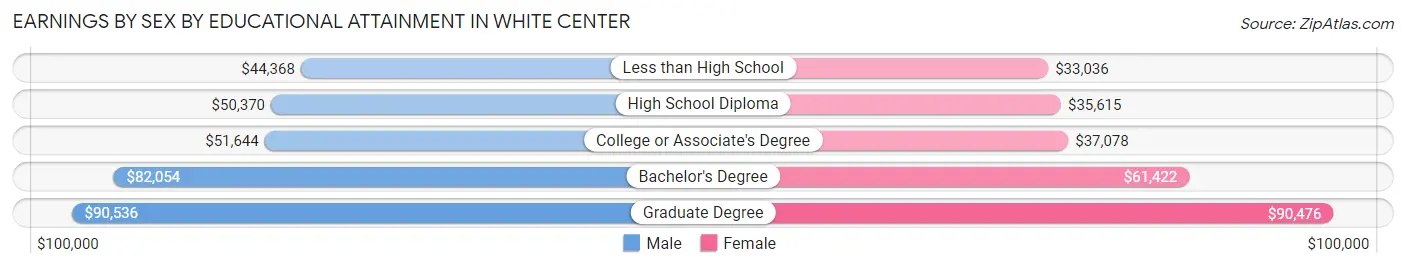
Earnings by Sex by Educational Attainment in White Center
Average earnings in White Center are $57,609 for men and $44,297 for women, a difference of 23.1%. Men with an educational attainment of graduate degree enjoy the highest average annual earnings of $90,536, while those with less than high school education earn the least with $44,368. Women with an educational attainment of graduate degree earn the most with the average annual earnings of $90,476, while those with less than high school education have the smallest earnings of $33,036.
| Educational Attainment | Male Income | Female Income |
| Less than High School | $44,368 | $33,036 |
| High School Diploma | $50,370 | $35,615 |
| College or Associate's Degree | $51,644 | $37,078 |
| Bachelor's Degree | $82,054 | $61,422 |
| Graduate Degree | $90,536 | $90,476 |
| Total | $57,609 | $44,297 |
Family Income in White Center
Family Income Brackets in White Center
According to the White Center family income data, there are 840 families falling into the $100,000 to $149,999 income range, which is the most common income bracket and makes up 22.5% of all families. Conversely, the $10,000 to $14,999 income bracket is the least frequent group with only 105 families (2.8%) belonging to this category.
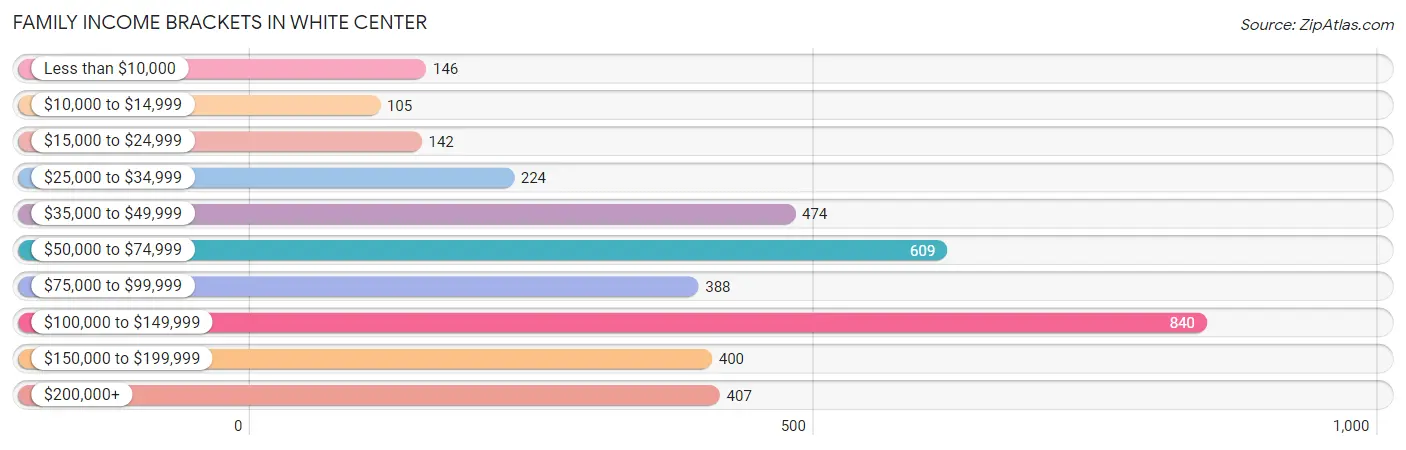
| Income Bracket | # Families | % Families |
| Less than $10,000 | 146 | 3.9% |
| $10,000 to $14,999 | 105 | 2.8% |
| $15,000 to $24,999 | 142 | 3.8% |
| $25,000 to $34,999 | 224 | 6.0% |
| $35,000 to $49,999 | 474 | 12.7% |
| $50,000 to $74,999 | 609 | 16.3% |
| $75,000 to $99,999 | 388 | 10.4% |
| $100,000 to $149,999 | 840 | 22.5% |
| $150,000 to $199,999 | 400 | 10.7% |
| $200,000+ | 407 | 10.9% |
Family Income by Famaliy Size in White Center
7+ person families (106 | 2.8%) account for the highest median family income in White Center with $107,045 per family, while 2-person families (1,735 | 46.5%) have the highest median income of $49,940 per family member.
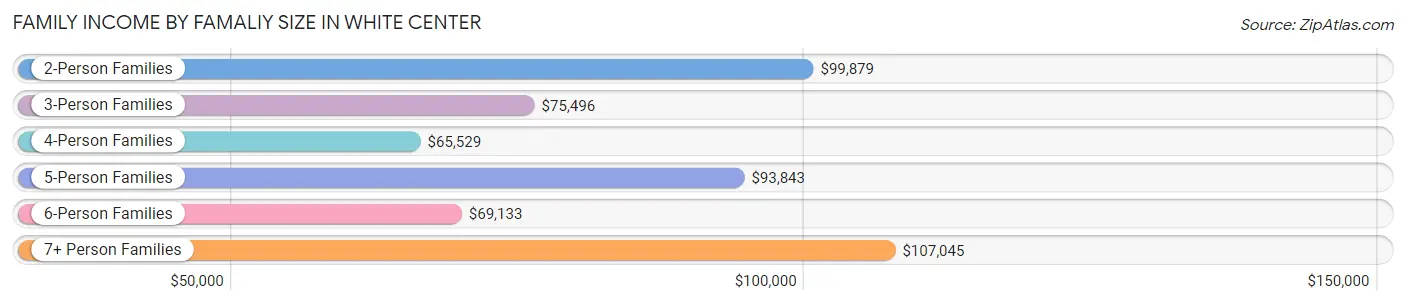
| Income Bracket | # Families | Median Income |
| 2-Person Families | 1,735 (46.5%) | $99,879 |
| 3-Person Families | 821 (22.0%) | $75,496 |
| 4-Person Families | 673 (18.0%) | $65,529 |
| 5-Person Families | 207 (5.5%) | $93,843 |
| 6-Person Families | 193 (5.2%) | $69,133 |
| 7+ Person Families | 106 (2.8%) | $107,045 |
| Total | 3,735 (100.0%) | $83,045 |
Family Income by Number of Earners in White Center
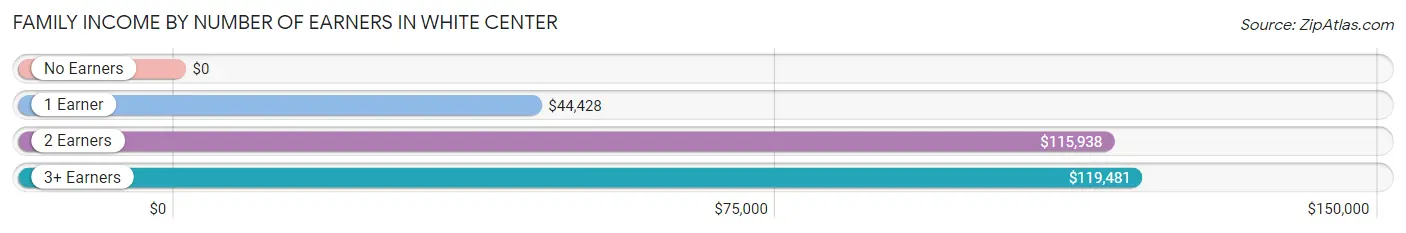
| Number of Earners | # Families | Median Income |
| No Earners | 334 (8.9%) | $0 |
| 1 Earner | 1,178 (31.5%) | $44,428 |
| 2 Earners | 1,749 (46.8%) | $115,938 |
| 3+ Earners | 474 (12.7%) | $119,481 |
| Total | 3,735 (100.0%) | $83,045 |
Household Income in White Center
Household Income Brackets in White Center
With 1,223 households falling in the category, the $100,000 to $149,999 income range is the most frequent in White Center, accounting for 20.9% of all households. In contrast, only 199 households (3.4%) fall into the $15,000 to $24,999 income bracket, making it the least populous group.
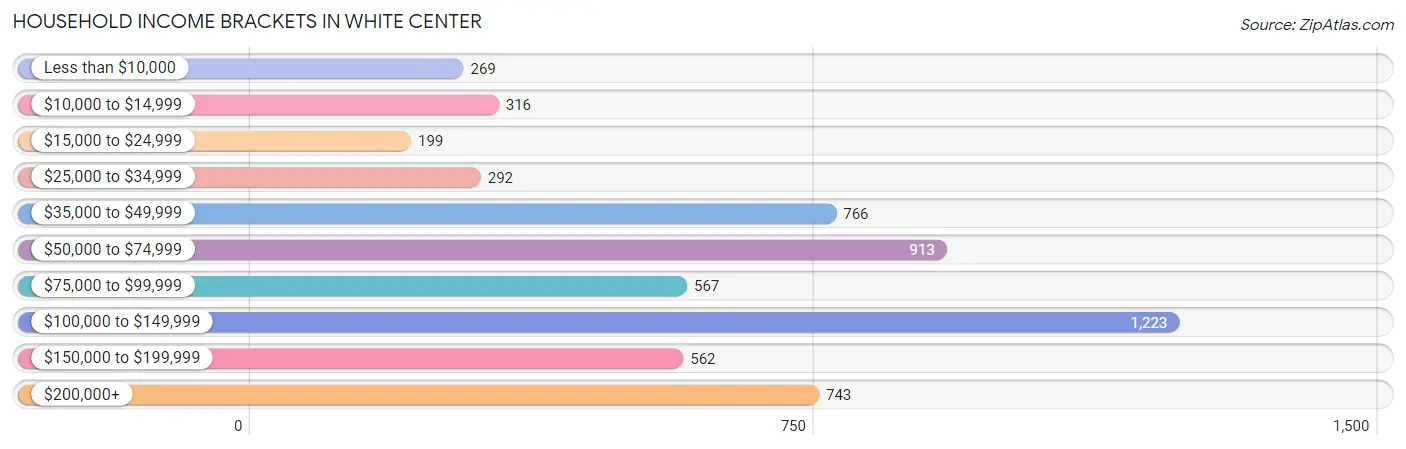
| Income Bracket | # Households | % Households |
| Less than $10,000 | 269 | 4.6% |
| $10,000 to $14,999 | 316 | 5.4% |
| $15,000 to $24,999 | 199 | 3.4% |
| $25,000 to $34,999 | 292 | 5.0% |
| $35,000 to $49,999 | 766 | 13.1% |
| $50,000 to $74,999 | 913 | 15.6% |
| $75,000 to $99,999 | 567 | 9.7% |
| $100,000 to $149,999 | 1,223 | 20.9% |
| $150,000 to $199,999 | 562 | 9.6% |
| $200,000+ | 743 | 12.7% |
Household Income by Householder Age in White Center
The median household income in White Center is $79,432, with the highest median household income of $104,773 found in the 25 to 44 years age bracket for the primary householder. A total of 2,500 households (42.7%) fall into this category. Meanwhile, the 15 to 24 years age bracket for the primary householder has the lowest median household income of $0, with 189 households (3.2%) in this group.
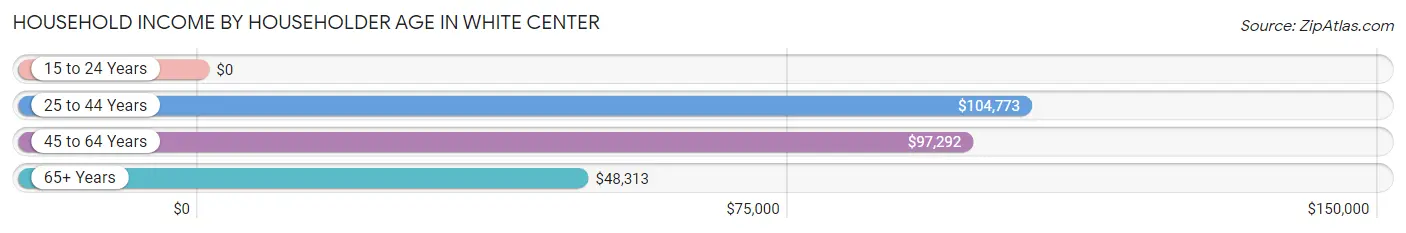
| Income Bracket | # Households | Median Income |
| 15 to 24 Years | 189 (3.2%) | $0 |
| 25 to 44 Years | 2,500 (42.7%) | $104,773 |
| 45 to 64 Years | 2,000 (34.2%) | $97,292 |
| 65+ Years | 1,161 (19.9%) | $48,313 |
| Total | 5,850 (100.0%) | $79,432 |
Poverty in White Center
Income Below Poverty by Sex and Age in White Center
With 14.2% poverty level for males and 18.6% for females among the residents of White Center, 5 year old males and 12 to 14 year old females are the most vulnerable to poverty, with 45 males (62.5%) and 143 females (41.4%) in their respective age groups living below the poverty level.
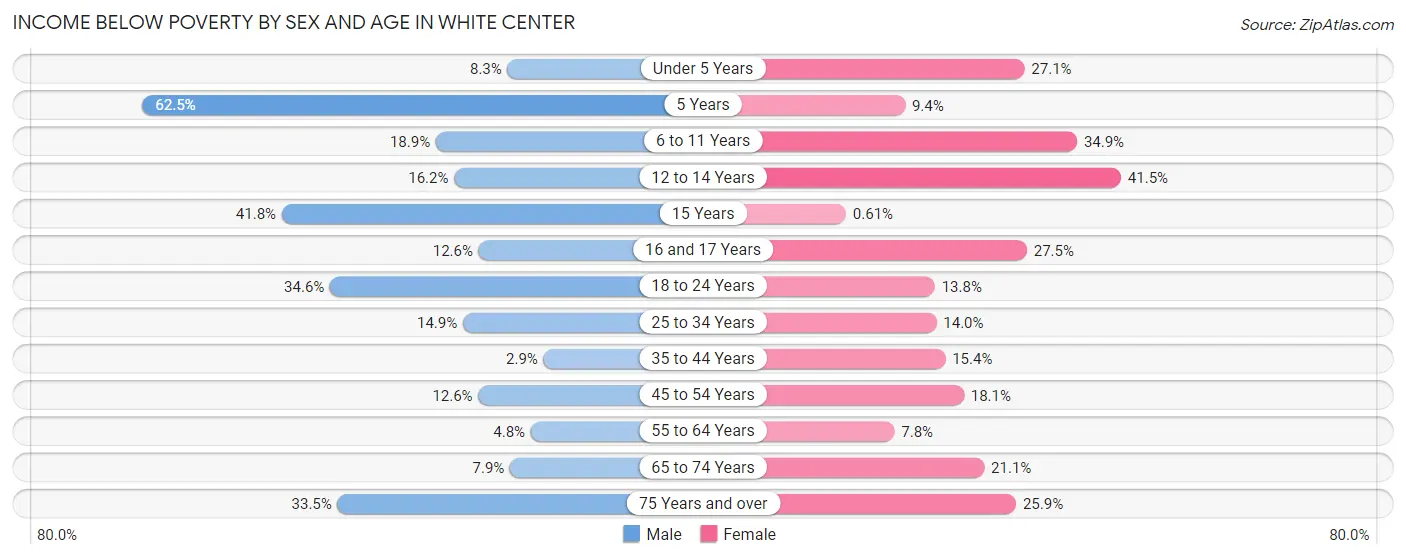
| Age Bracket | Male | Female |
| Under 5 Years | 37 (8.3%) | 80 (27.1%) |
| 5 Years | 45 (62.5%) | 9 (9.4%) |
| 6 to 11 Years | 97 (18.9%) | 257 (34.9%) |
| 12 to 14 Years | 35 (16.2%) | 143 (41.4%) |
| 15 Years | 28 (41.8%) | 1 (0.6%) |
| 16 and 17 Years | 25 (12.6%) | 25 (27.5%) |
| 18 to 24 Years | 321 (34.6%) | 93 (13.8%) |
| 25 to 34 Years | 193 (14.9%) | 178 (14.0%) |
| 35 to 44 Years | 40 (2.9%) | 151 (15.4%) |
| 45 to 54 Years | 138 (12.6%) | 164 (18.1%) |
| 55 to 64 Years | 37 (4.8%) | 79 (7.8%) |
| 65 to 74 Years | 55 (7.9%) | 148 (21.1%) |
| 75 Years and over | 60 (33.5%) | 89 (25.9%) |
| Total | 1,111 (14.2%) | 1,417 (18.6%) |
Income Above Poverty by Sex and Age in White Center
According to the poverty statistics in White Center, males aged 35 to 44 years and females aged 15 years are the age groups that are most secure financially, with 97.1% of males and 99.4% of females in these age groups living above the poverty line.
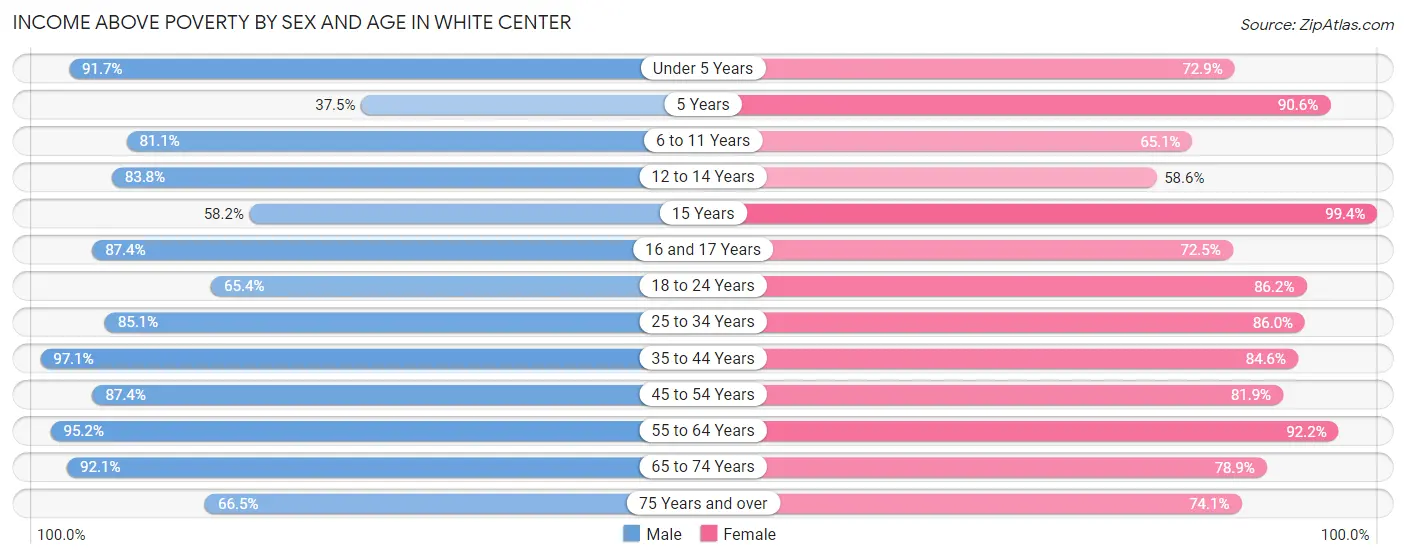
| Age Bracket | Male | Female |
| Under 5 Years | 410 (91.7%) | 215 (72.9%) |
| 5 Years | 27 (37.5%) | 87 (90.6%) |
| 6 to 11 Years | 416 (81.1%) | 479 (65.1%) |
| 12 to 14 Years | 181 (83.8%) | 202 (58.6%) |
| 15 Years | 39 (58.2%) | 164 (99.4%) |
| 16 and 17 Years | 174 (87.4%) | 66 (72.5%) |
| 18 to 24 Years | 606 (65.4%) | 581 (86.2%) |
| 25 to 34 Years | 1,102 (85.1%) | 1,090 (86.0%) |
| 35 to 44 Years | 1,328 (97.1%) | 832 (84.6%) |
| 45 to 54 Years | 956 (87.4%) | 741 (81.9%) |
| 55 to 64 Years | 730 (95.2%) | 932 (92.2%) |
| 65 to 74 Years | 641 (92.1%) | 552 (78.9%) |
| 75 Years and over | 119 (66.5%) | 255 (74.1%) |
| Total | 6,729 (85.8%) | 6,196 (81.4%) |
Income Below Poverty Among Married-Couple Families in White Center
The poverty statistics for married-couple families in White Center show that 10.4% or 255 of the total 2,451 families live below the poverty line. Families with 5 or more children have the highest poverty rate of 39.3%, comprising of 24 families. On the other hand, families with no children have the lowest poverty rate of 5.4%, which includes 79 families.
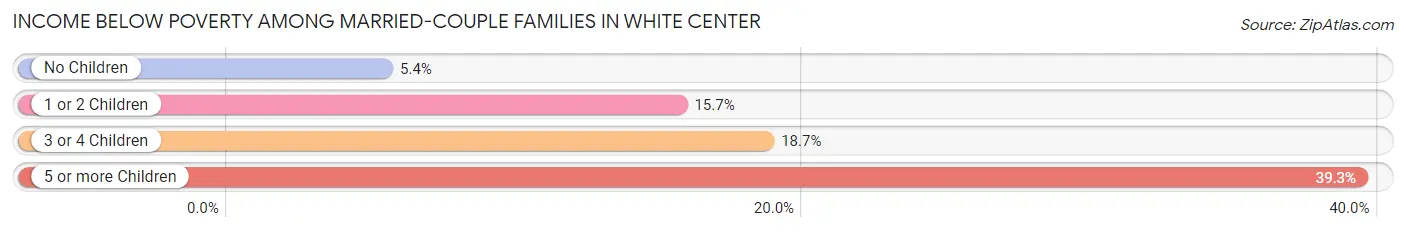
| Children | Above Poverty | Below Poverty |
| No Children | 1,383 (94.6%) | 79 (5.4%) |
| 1 or 2 Children | 593 (84.4%) | 110 (15.7%) |
| 3 or 4 Children | 183 (81.3%) | 42 (18.7%) |
| 5 or more Children | 37 (60.7%) | 24 (39.3%) |
| Total | 2,196 (89.6%) | 255 (10.4%) |
Income Below Poverty Among Single-Parent Households in White Center
According to the poverty data in White Center, 13.7% or 71 single-father households and 21.4% or 164 single-mother households are living below the poverty line. Among single-father households, those with 1 or 2 children have the highest poverty rate, with 71 households (22.1%) experiencing poverty. Likewise, among single-mother households, those with 3 or 4 children have the highest poverty rate, with 54 households (47.4%) falling below the poverty line.
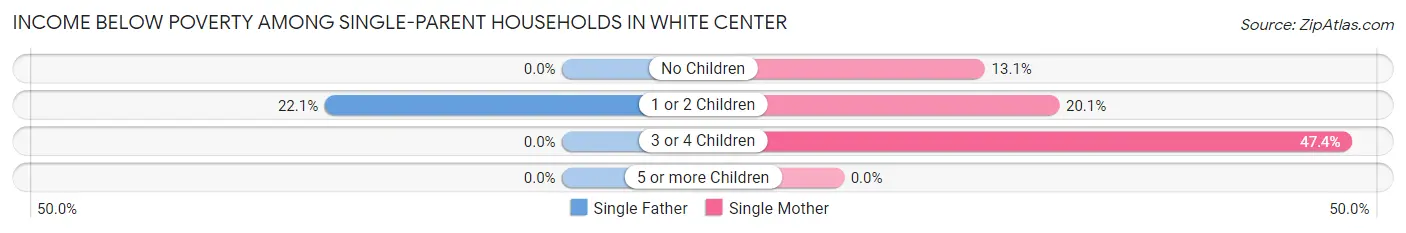
| Children | Single Father | Single Mother |
| No Children | 0 (0.0%) | 39 (13.1%) |
| 1 or 2 Children | 71 (22.1%) | 71 (20.1%) |
| 3 or 4 Children | 0 (0.0%) | 54 (47.4%) |
| 5 or more Children | 0 (0.0%) | 0 (0.0%) |
| Total | 71 (13.7%) | 164 (21.4%) |
Income Below Poverty Among Married-Couple vs Single-Parent Households in White Center
The poverty data for White Center shows that 255 of the married-couple family households (10.4%) and 235 of the single-parent households (18.3%) are living below the poverty level. Within the married-couple family households, those with 5 or more children have the highest poverty rate, with 24 households (39.3%) falling below the poverty line. Among the single-parent households, those with 3 or 4 children have the highest poverty rate, with 54 household (43.9%) living below poverty.
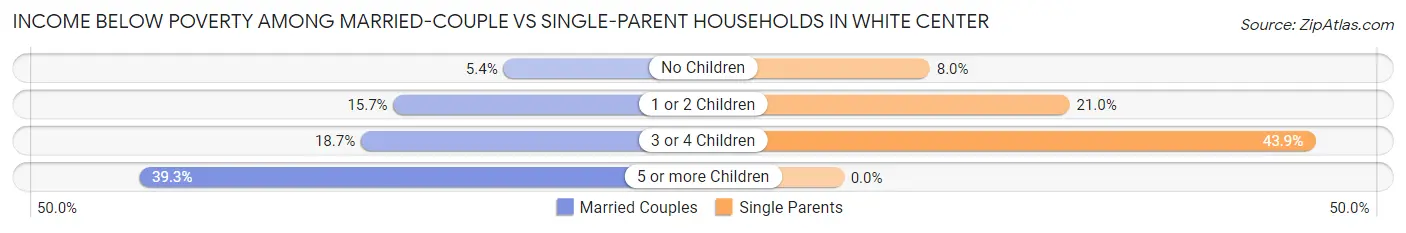
| Children | Married-Couple Families | Single-Parent Households |
| No Children | 79 (5.4%) | 39 (8.0%) |
| 1 or 2 Children | 110 (15.7%) | 142 (21.0%) |
| 3 or 4 Children | 42 (18.7%) | 54 (43.9%) |
| 5 or more Children | 24 (39.3%) | 0 (0.0%) |
| Total | 255 (10.4%) | 235 (18.3%) |
Race in White Center
The most populous races in White Center are White / Caucasian (6,719 | 43.4%), Hispanic or Latino (3,604 | 23.3%), and Asian (3,280 | 21.2%).
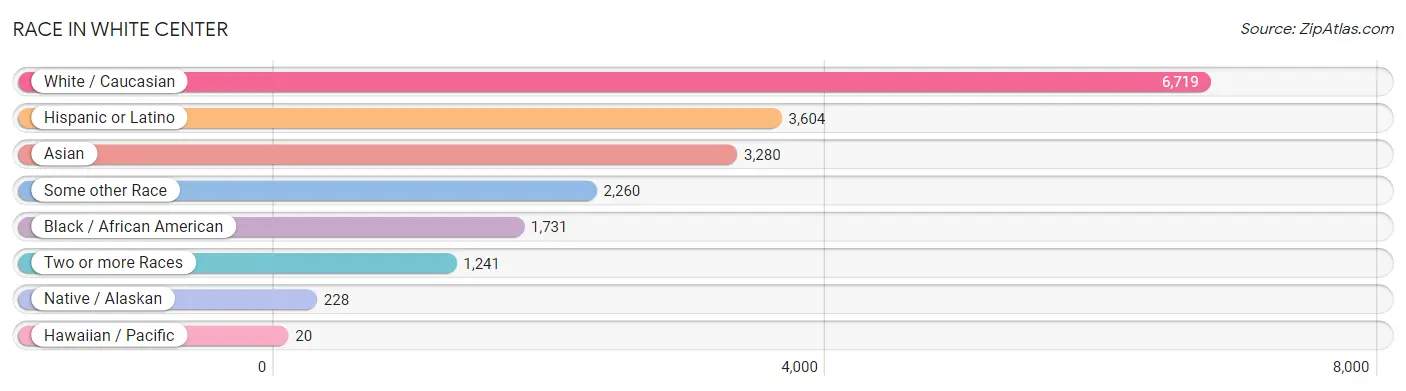
| Race | # Population | % Population |
| Asian | 3,280 | 21.2% |
| Black / African American | 1,731 | 11.2% |
| Hawaiian / Pacific | 20 | 0.1% |
| Hispanic or Latino | 3,604 | 23.3% |
| Native / Alaskan | 228 | 1.5% |
| White / Caucasian | 6,719 | 43.4% |
| Two or more Races | 1,241 | 8.0% |
| Some other Race | 2,260 | 14.6% |
| Total | 15,479 | 100.0% |
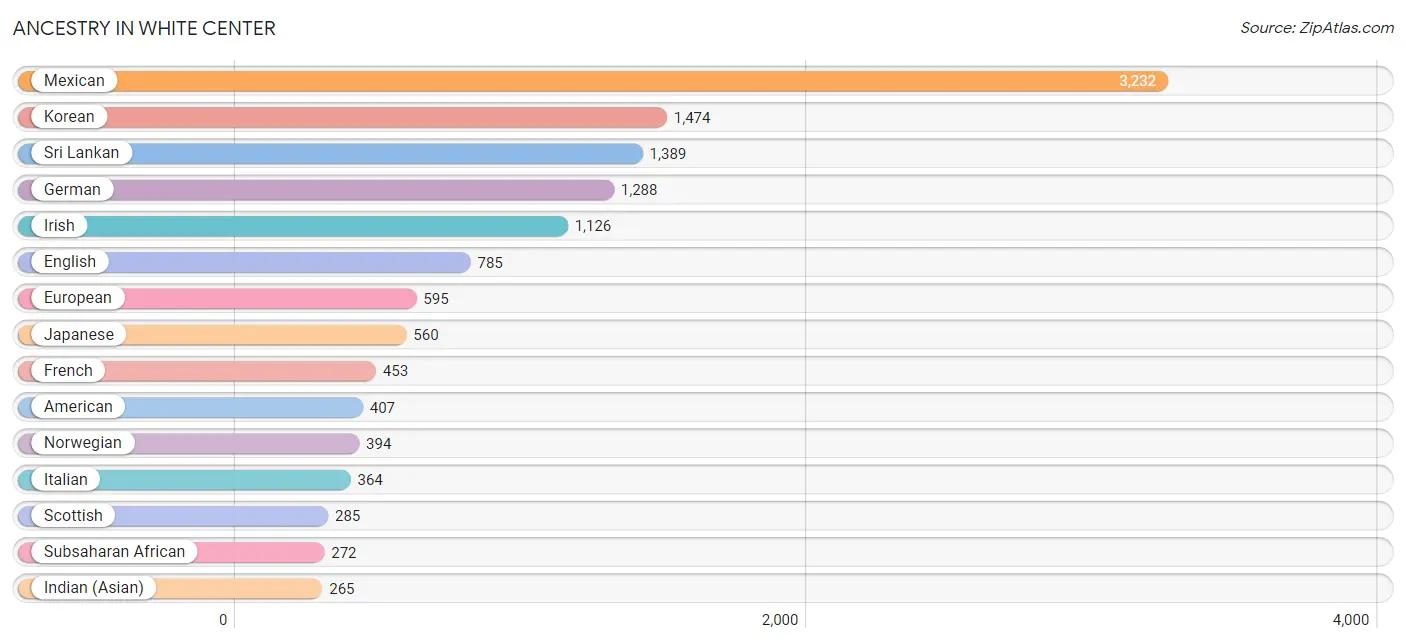
Ancestry in White Center
The most populous ancestries reported in White Center are Mexican (3,232 | 20.9%), Korean (1,474 | 9.5%), Sri Lankan (1,389 | 9.0%), German (1,288 | 8.3%), and Irish (1,126 | 7.3%), together accounting for 55.0% of all White Center residents.
| Ancestry | # Population | % Population |
| African | 45 | 0.3% |
| Aleut | 17 | 0.1% |
| American | 407 | 2.6% |
| Arab | 106 | 0.7% |
| Argentinean | 15 | 0.1% |
| Armenian | 10 | 0.1% |
| Austrian | 30 | 0.2% |
| Basque | 6 | 0.0% |
| Belgian | 47 | 0.3% |
| Bhutanese | 66 | 0.4% |
| Blackfeet | 5 | 0.0% |
| Bolivian | 17 | 0.1% |
| Brazilian | 83 | 0.5% |
| British | 59 | 0.4% |
| Burmese | 20 | 0.1% |
| Canadian | 32 | 0.2% |
| Celtic | 110 | 0.7% |
| Central American | 197 | 1.3% |
| Central American Indian | 36 | 0.2% |
| Cherokee | 47 | 0.3% |
| Chilean | 2 | 0.0% |
| Chippewa | 10 | 0.1% |
| Colombian | 13 | 0.1% |
| Costa Rican | 8 | 0.1% |
| Cree | 9 | 0.1% |
| Cuban | 31 | 0.2% |
| Czech | 39 | 0.3% |
| Czechoslovakian | 4 | 0.0% |
| Danish | 65 | 0.4% |
| Dutch | 199 | 1.3% |
| English | 785 | 5.1% |
| Ethiopian | 32 | 0.2% |
| European | 595 | 3.8% |
| Finnish | 93 | 0.6% |
| French | 453 | 2.9% |
| French Canadian | 29 | 0.2% |
| German | 1,288 | 8.3% |
| Guamanian / Chamorro | 8 | 0.1% |
| Guatemalan | 75 | 0.5% |
| Honduran | 3 | 0.0% |
| Hopi | 86 | 0.6% |
| Hungarian | 11 | 0.1% |
| Icelander | 16 | 0.1% |
| Indian (Asian) | 265 | 1.7% |
| Indonesian | 18 | 0.1% |
| Iraqi | 90 | 0.6% |
| Irish | 1,126 | 7.3% |
| Iroquois | 31 | 0.2% |
| Italian | 364 | 2.4% |
| Japanese | 560 | 3.6% |
| Korean | 1,474 | 9.5% |
| Laotian | 37 | 0.2% |
| Latvian | 39 | 0.3% |
| Lebanese | 13 | 0.1% |
| Lithuanian | 25 | 0.2% |
| Malaysian | 24 | 0.2% |
| Mexican | 3,232 | 20.9% |
| Native Hawaiian | 57 | 0.4% |
| Nigerian | 99 | 0.6% |
| Norwegian | 394 | 2.5% |
| Pakistani | 34 | 0.2% |
| Pima | 19 | 0.1% |
| Polish | 249 | 1.6% |
| Portuguese | 6 | 0.0% |
| Pueblo | 20 | 0.1% |
| Puerto Rican | 71 | 0.5% |
| Puget Sound Salish | 37 | 0.2% |
| Romanian | 5 | 0.0% |
| Russian | 3 | 0.0% |
| Salvadoran | 111 | 0.7% |
| Samoan | 13 | 0.1% |
| Scandinavian | 67 | 0.4% |
| Scotch-Irish | 164 | 1.1% |
| Scottish | 285 | 1.8% |
| Sioux | 34 | 0.2% |
| Slavic | 36 | 0.2% |
| Slovene | 77 | 0.5% |
| Somali | 85 | 0.5% |
| South American | 47 | 0.3% |
| Spanish | 3 | 0.0% |
| Sri Lankan | 1,389 | 9.0% |
| Subsaharan African | 272 | 1.8% |
| Swedish | 212 | 1.4% |
| Swiss | 5 | 0.0% |
| Thai | 64 | 0.4% |
| Tohono O'Odham | 9 | 0.1% |
| Ukrainian | 51 | 0.3% |
| Welsh | 221 | 1.4% |
| Yugoslavian | 13 | 0.1% | View All 89 Rows |
Immigrants in White Center
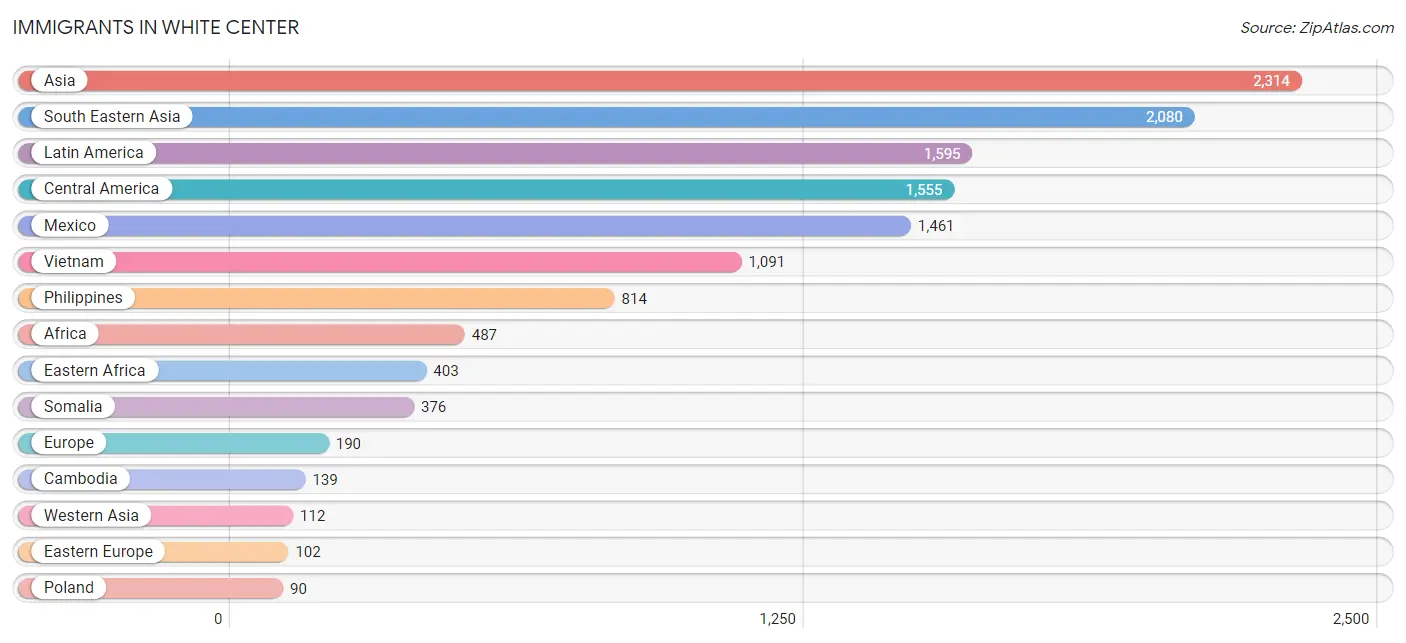
The most numerous immigrant groups reported in White Center came from Asia (2,314 | 14.9%), South Eastern Asia (2,080 | 13.4%), Latin America (1,595 | 10.3%), Central America (1,555 | 10.1%), and Mexico (1,461 | 9.4%), together accounting for 58.2% of all White Center residents.
| Immigration Origin | # Population | % Population |
| Africa | 487 | 3.2% |
| Asia | 2,314 | 14.9% |
| Brazil | 19 | 0.1% |
| Cambodia | 139 | 0.9% |
| Canada | 39 | 0.3% |
| Caribbean | 6 | 0.0% |
| Central America | 1,555 | 10.1% |
| Chile | 2 | 0.0% |
| China | 41 | 0.3% |
| Colombia | 13 | 0.1% |
| Cuba | 6 | 0.0% |
| Eastern Africa | 403 | 2.6% |
| Eastern Asia | 50 | 0.3% |
| Eastern Europe | 102 | 0.7% |
| El Salvador | 35 | 0.2% |
| Ethiopia | 27 | 0.2% |
| Europe | 190 | 1.2% |
| Fiji | 3 | 0.0% |
| France | 43 | 0.3% |
| Greece | 20 | 0.1% |
| Guatemala | 59 | 0.4% |
| India | 26 | 0.2% |
| Indonesia | 20 | 0.1% |
| Iraq | 84 | 0.5% |
| Israel | 19 | 0.1% |
| Korea | 9 | 0.1% |
| Laos | 12 | 0.1% |
| Latin America | 1,595 | 10.3% |
| Lithuania | 12 | 0.1% |
| Malaysia | 4 | 0.0% |
| Mexico | 1,461 | 9.4% |
| Micronesia | 4 | 0.0% |
| Morocco | 14 | 0.1% |
| Nepal | 9 | 0.1% |
| Netherlands | 16 | 0.1% |
| Nigeria | 9 | 0.1% |
| Northern Africa | 14 | 0.1% |
| Northern Europe | 9 | 0.1% |
| Oceania | 15 | 0.1% |
| Pakistan | 37 | 0.2% |
| Philippines | 814 | 5.3% |
| Poland | 90 | 0.6% |
| Somalia | 376 | 2.4% |
| South America | 34 | 0.2% |
| South Central Asia | 72 | 0.5% |
| South Eastern Asia | 2,080 | 13.4% |
| Southern Europe | 20 | 0.1% |
| Syria | 6 | 0.0% |
| Vietnam | 1,091 | 7.0% |
| Western Africa | 9 | 0.1% |
| Western Asia | 112 | 0.7% |
| Western Europe | 59 | 0.4% |
| Yemen | 3 | 0.0% | View All 53 Rows |
Sex and Age in White Center
Sex and Age in White Center
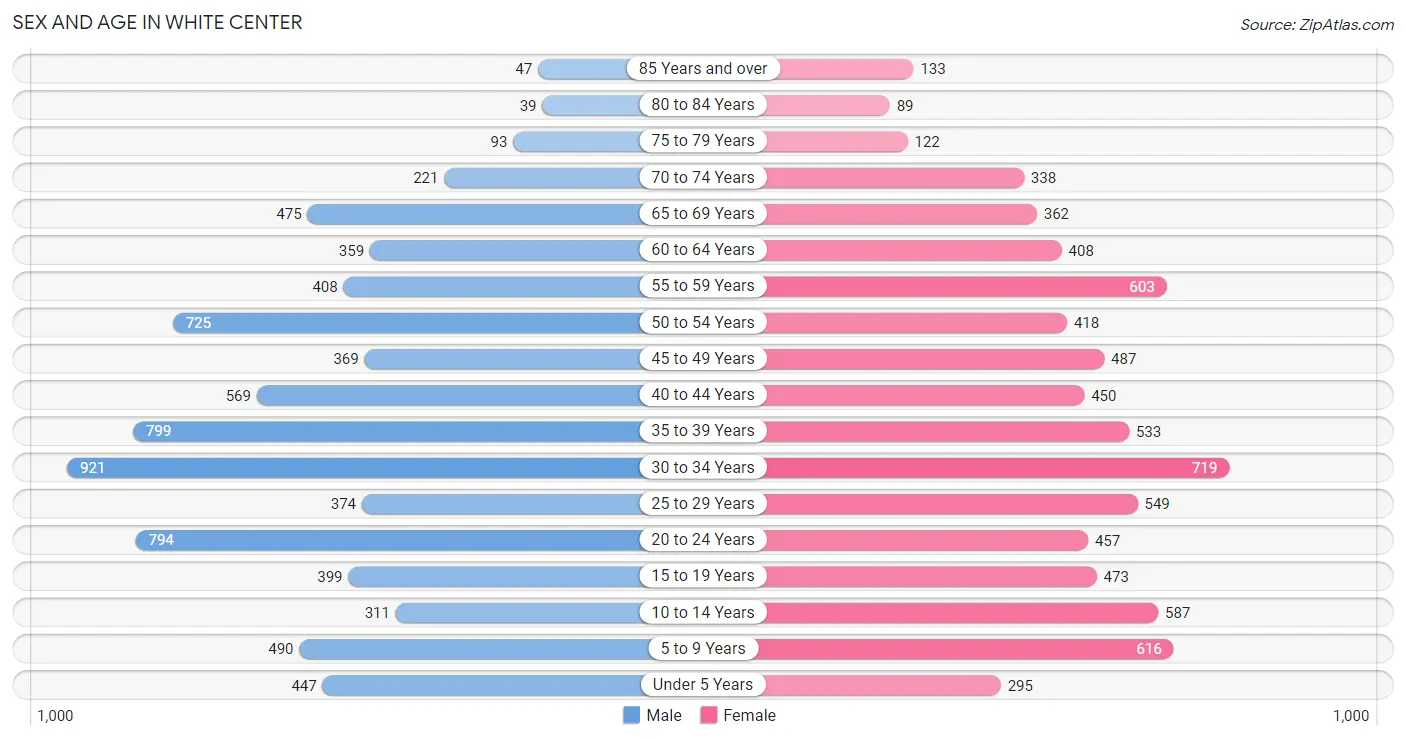
The most populous age groups in White Center are 30 to 34 Years (921 | 11.7%) for men and 30 to 34 Years (719 | 9.4%) for women.
| Age Bracket | Male | Female |
| Under 5 Years | 447 (5.7%) | 295 (3.9%) |
| 5 to 9 Years | 490 (6.2%) | 616 (8.1%) |
| 10 to 14 Years | 311 (4.0%) | 587 (7.7%) |
| 15 to 19 Years | 399 (5.1%) | 473 (6.2%) |
| 20 to 24 Years | 794 (10.1%) | 457 (6.0%) |
| 25 to 29 Years | 374 (4.8%) | 549 (7.2%) |
| 30 to 34 Years | 921 (11.7%) | 719 (9.4%) |
| 35 to 39 Years | 799 (10.2%) | 533 (7.0%) |
| 40 to 44 Years | 569 (7.3%) | 450 (5.9%) |
| 45 to 49 Years | 369 (4.7%) | 487 (6.4%) |
| 50 to 54 Years | 725 (9.2%) | 418 (5.5%) |
| 55 to 59 Years | 408 (5.2%) | 603 (7.9%) |
| 60 to 64 Years | 359 (4.6%) | 408 (5.3%) |
| 65 to 69 Years | 475 (6.1%) | 362 (4.7%) |
| 70 to 74 Years | 221 (2.8%) | 338 (4.4%) |
| 75 to 79 Years | 93 (1.2%) | 122 (1.6%) |
| 80 to 84 Years | 39 (0.5%) | 89 (1.2%) |
| 85 Years and over | 47 (0.6%) | 133 (1.7%) |
| Total | 7,840 (100.0%) | 7,639 (100.0%) |
Families and Households in White Center
Median Family Size in White Center
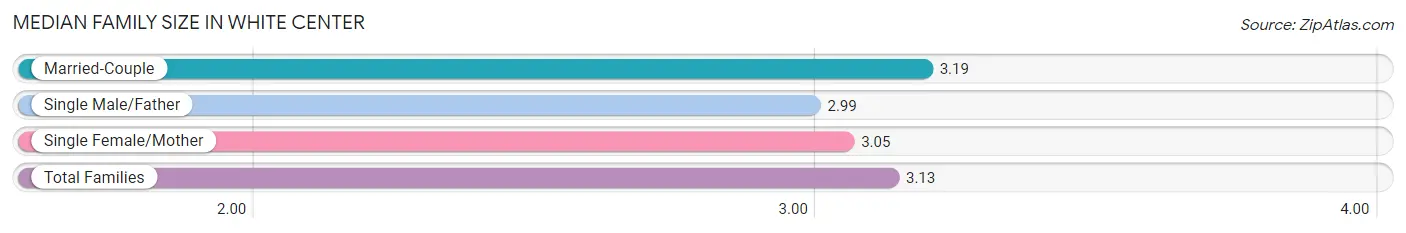
The median family size in White Center is 3.13 persons per family, with married-couple families (2,451 | 65.6%) accounting for the largest median family size of 3.19 persons per family. On the other hand, single male/father families (519 | 13.9%) represent the smallest median family size with 2.99 persons per family.
| Family Type | # Families | Family Size |
| Married-Couple | 2,451 (65.6%) | 3.19 |
| Single Male/Father | 519 (13.9%) | 2.99 |
| Single Female/Mother | 765 (20.5%) | 3.05 |
| Total Families | 3,735 (100.0%) | 3.13 |
Median Household Size in White Center
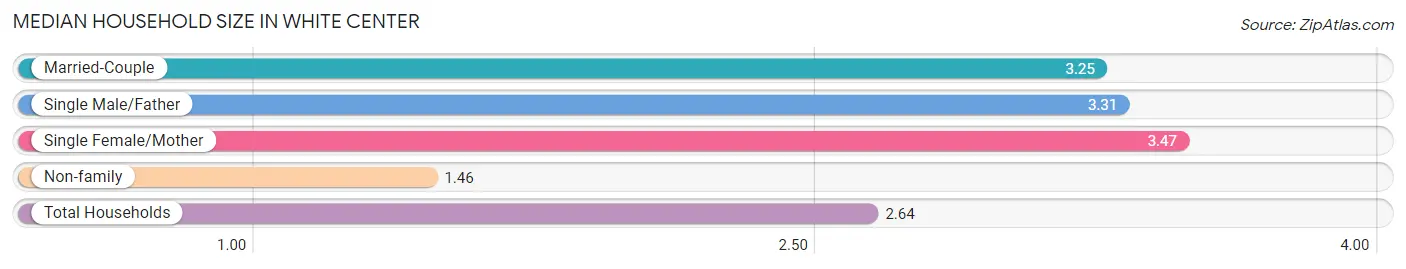
The median household size in White Center is 2.64 persons per household, with single female/mother households (765 | 13.1%) accounting for the largest median household size of 3.47 persons per household. non-family households (2,115 | 36.1%) represent the smallest median household size with 1.46 persons per household.
| Household Type | # Households | Household Size |
| Married-Couple | 2,451 (41.9%) | 3.25 |
| Single Male/Father | 519 (8.9%) | 3.31 |
| Single Female/Mother | 765 (13.1%) | 3.47 |
| Non-family | 2,115 (36.1%) | 1.46 |
| Total Households | 5,850 (100.0%) | 2.64 |
Household Size by Marriage Status in White Center
Out of a total of 5,850 households in White Center, 3,735 (63.8%) are family households, while 2,115 (36.1%) are nonfamily households. The most numerous type of family households are 2-person households, comprising 1,461, and the most common type of nonfamily households are 1-person households, comprising 1,352.
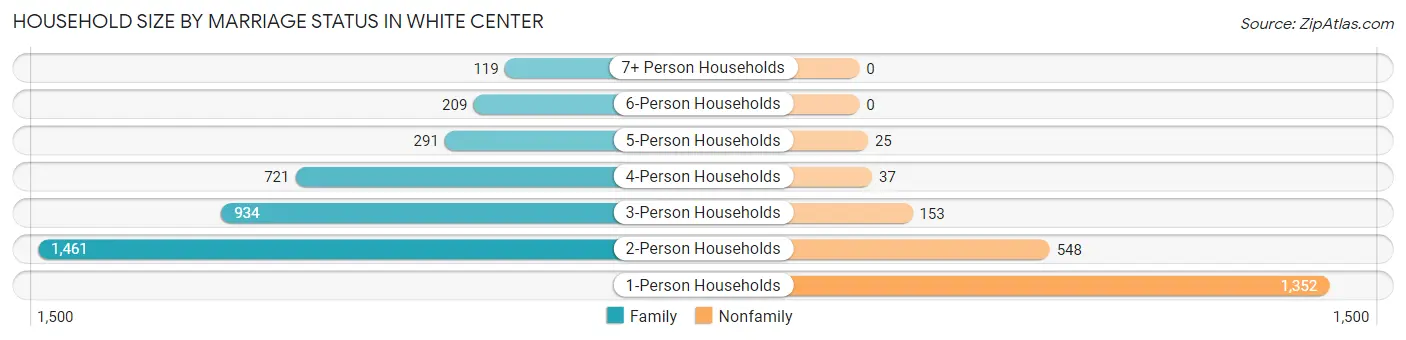
| Household Size | Family Households | Nonfamily Households |
| 1-Person Households | - | 1,352 (23.1%) |
| 2-Person Households | 1,461 (25.0%) | 548 (9.4%) |
| 3-Person Households | 934 (16.0%) | 153 (2.6%) |
| 4-Person Households | 721 (12.3%) | 37 (0.6%) |
| 5-Person Households | 291 (5.0%) | 25 (0.4%) |
| 6-Person Households | 209 (3.6%) | 0 (0.0%) |
| 7+ Person Households | 119 (2.0%) | 0 (0.0%) |
| Total | 3,735 (63.8%) | 2,115 (36.1%) |
Female Fertility in White Center
Fertility by Age in White Center
Average fertility rate in White Center is 41.0 births per 1,000 women. Women in the age bracket of 20 to 34 years have the highest fertility rate with 74.0 births per 1,000 women. Women in the age bracket of 20 to 34 years acount for 84.8% of all women with births.
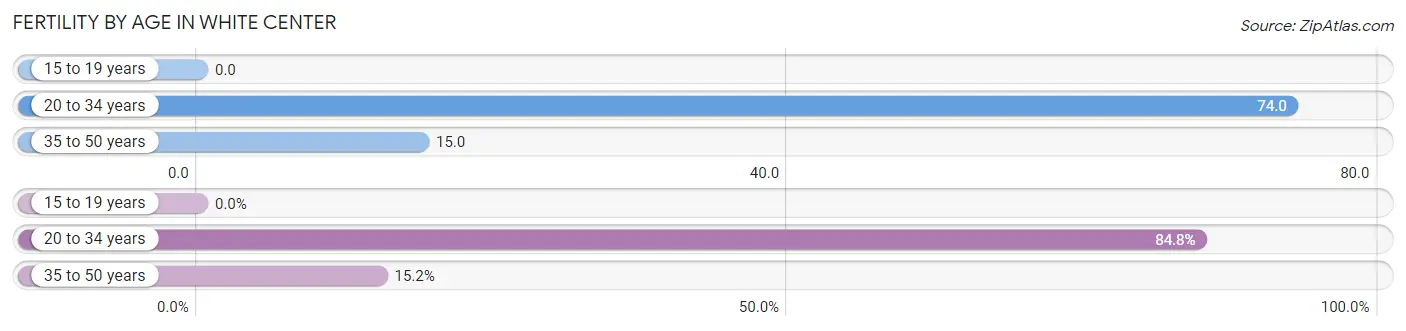
| Age Bracket | Women with Births | Births / 1,000 Women |
| 15 to 19 years | 0 (0.0%) | 0.0 |
| 20 to 34 years | 128 (84.8%) | 74.0 |
| 35 to 50 years | 23 (15.2%) | 15.0 |
| Total | 151 (100.0%) | 41.0 |
Fertility by Age by Marriage Status in White Center
63.6% of women with births (151) in White Center are married. The highest percentage of unmarried women with births falls into 20 to 34 years age bracket with 43.0% of them unmarried at the time of birth, while the lowest percentage of unmarried women with births belong to 35 to 50 years age bracket with 0.0% of them unmarried.
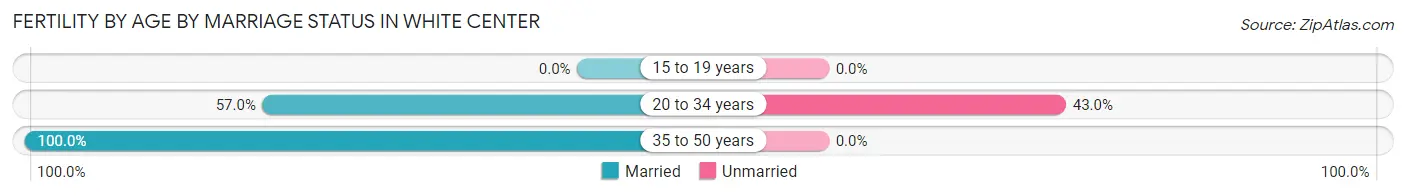
| Age Bracket | Married | Unmarried |
| 15 to 19 years | 0 (0.0%) | 0 (0.0%) |
| 20 to 34 years | 73 (57.0%) | 55 (43.0%) |
| 35 to 50 years | 23 (100.0%) | 0 (0.0%) |
| Total | 96 (63.6%) | 55 (36.4%) |
Fertility by Education in White Center
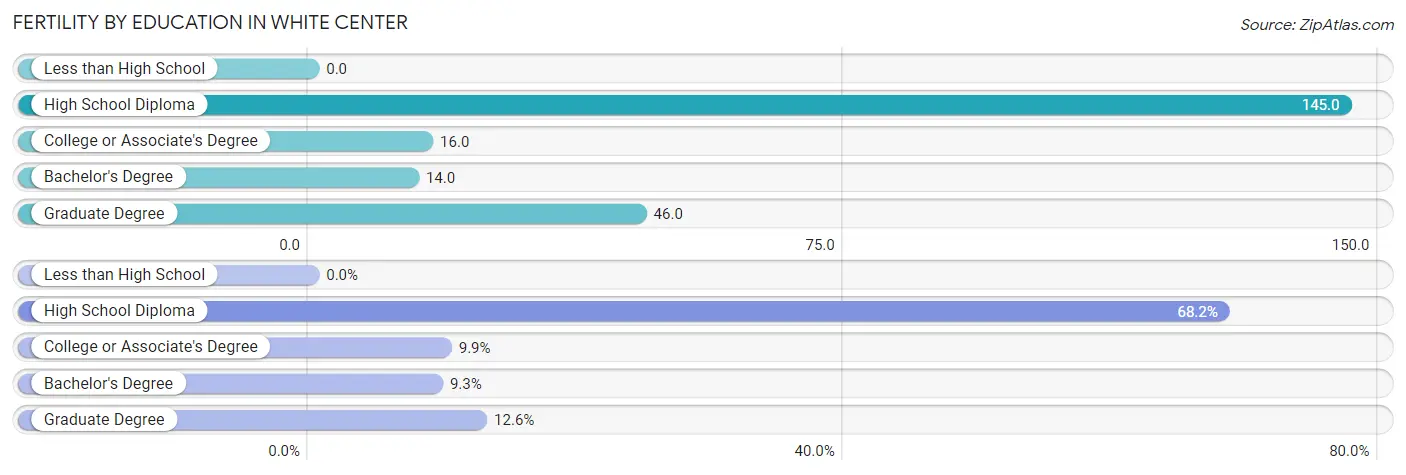
| Educational Attainment | Women with Births | Births / 1,000 Women |
| Less than High School | 0 (0.0%) | 0.0 |
| High School Diploma | 103 (68.2%) | 145.0 |
| College or Associate's Degree | 15 (9.9%) | 16.0 |
| Bachelor's Degree | 14 (9.3%) | 14.0 |
| Graduate Degree | 19 (12.6%) | 46.0 |
| Total | 151 (100.0%) | 41.0 |
Fertility by Education by Marriage Status in White Center
36.4% of women with births in White Center are unmarried. Women with the educational attainment of college or associate's degree are most likely to be married with 100.0% of them married at childbirth, while women with the educational attainment of high school diploma are least likely to be married with 53.4% of them unmarried at childbirth.
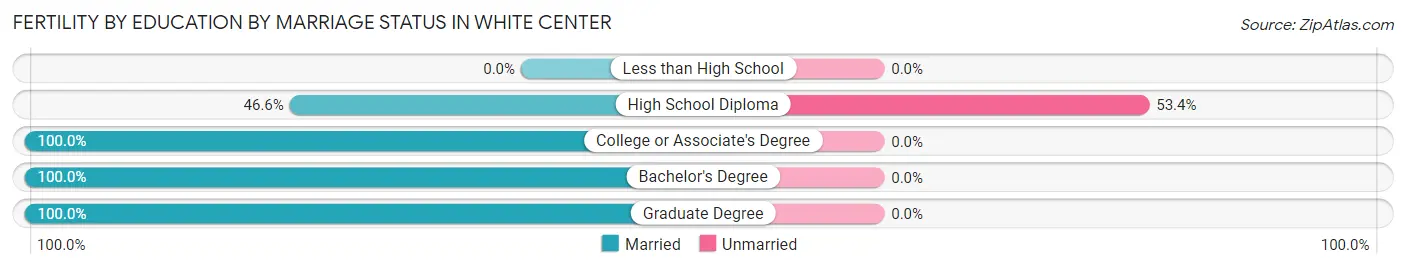
| Educational Attainment | Married | Unmarried |
| Less than High School | 0 (0.0%) | 0 (0.0%) |
| High School Diploma | 48 (46.6%) | 55 (53.4%) |
| College or Associate's Degree | 15 (100.0%) | 0 (0.0%) |
| Bachelor's Degree | 14 (100.0%) | 0 (0.0%) |
| Graduate Degree | 19 (100.0%) | 0 (0.0%) |
| Total | 96 (63.6%) | 55 (36.4%) |
Employment Characteristics in White Center
Employment by Class of Employer in White Center
Among the 8,249 employed individuals in White Center, private company employees (5,577 | 67.6%), not-for-profit organizations (882 | 10.7%), and local government employees (486 | 5.9%) make up the most common classes of employment.
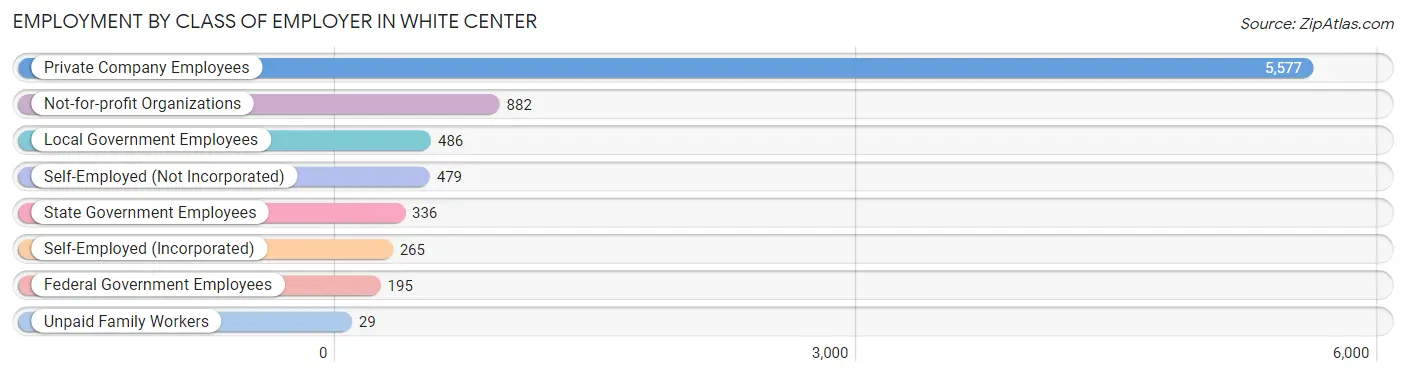
| Employer Class | # Employees | % Employees |
| Private Company Employees | 5,577 | 67.6% |
| Self-Employed (Incorporated) | 265 | 3.2% |
| Self-Employed (Not Incorporated) | 479 | 5.8% |
| Not-for-profit Organizations | 882 | 10.7% |
| Local Government Employees | 486 | 5.9% |
| State Government Employees | 336 | 4.1% |
| Federal Government Employees | 195 | 2.4% |
| Unpaid Family Workers | 29 | 0.4% |
| Total | 8,249 | 100.0% |
Employment Status by Age in White Center
According to the labor force statistics for White Center, out of the total population over 16 years of age (12,501), 71.1% or 8,888 individuals are in the labor force, with 5.6% or 498 of them unemployed. The age group with the highest labor force participation rate is 35 to 44 years, with 94.5% or 2,222 individuals in the labor force. Within the labor force, the 20 to 24 years age range has the highest percentage of unemployed individuals, with 20.3% or 163 of them being unemployed.
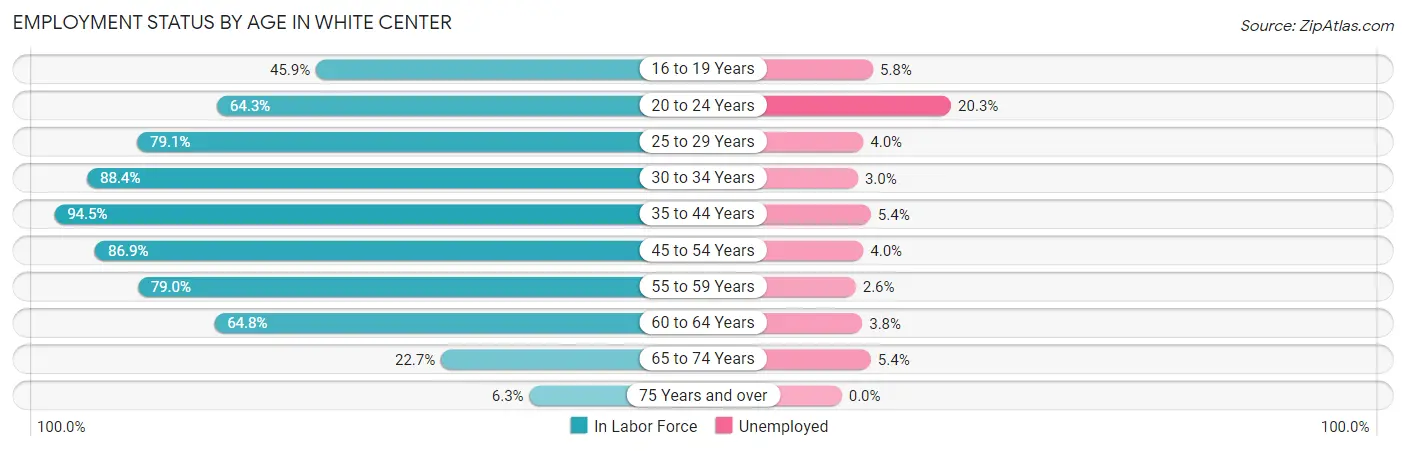
| Age Bracket | In Labor Force | Unemployed |
| 16 to 19 Years | 294 (45.9%) | 17 (5.8%) |
| 20 to 24 Years | 804 (64.3%) | 163 (20.3%) |
| 25 to 29 Years | 730 (79.1%) | 29 (4.0%) |
| 30 to 34 Years | 1,450 (88.4%) | 44 (3.0%) |
| 35 to 44 Years | 2,222 (94.5%) | 120 (5.4%) |
| 45 to 54 Years | 1,737 (86.9%) | 69 (4.0%) |
| 55 to 59 Years | 799 (79.0%) | 21 (2.6%) |
| 60 to 64 Years | 497 (64.8%) | 19 (3.8%) |
| 65 to 74 Years | 317 (22.7%) | 17 (5.4%) |
| 75 Years and over | 33 (6.3%) | 0 (0.0%) |
| Total | 8,888 (71.1%) | 498 (5.6%) |
Employment Status by Educational Attainment in White Center
According to labor force statistics for White Center, 85.6% of individuals (7,439) out of the total population between 25 and 64 years of age (8,691) are in the labor force, with 4.0% or 298 of them being unemployed. The group with the highest labor force participation rate are those with the educational attainment of bachelor's degree or higher, with 93.0% or 2,975 individuals in the labor force. Within the labor force, individuals with less than high school education have the highest percentage of unemployment, with 5.9% or 60 of them being unemployed.
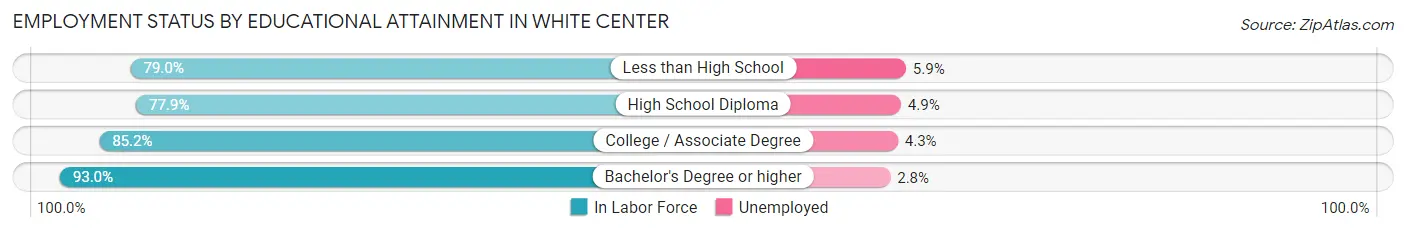
| Educational Attainment | In Labor Force | Unemployed |
| Less than High School | 1,021 (79.0%) | 76 (5.9%) |
| High School Diploma | 1,483 (77.9%) | 93 (4.9%) |
| College / Associate Degree | 1,956 (85.2%) | 99 (4.3%) |
| Bachelor's Degree or higher | 2,975 (93.0%) | 90 (2.8%) |
| Total | 7,439 (85.6%) | 348 (4.0%) |
Employment Occupations by Sex in White Center
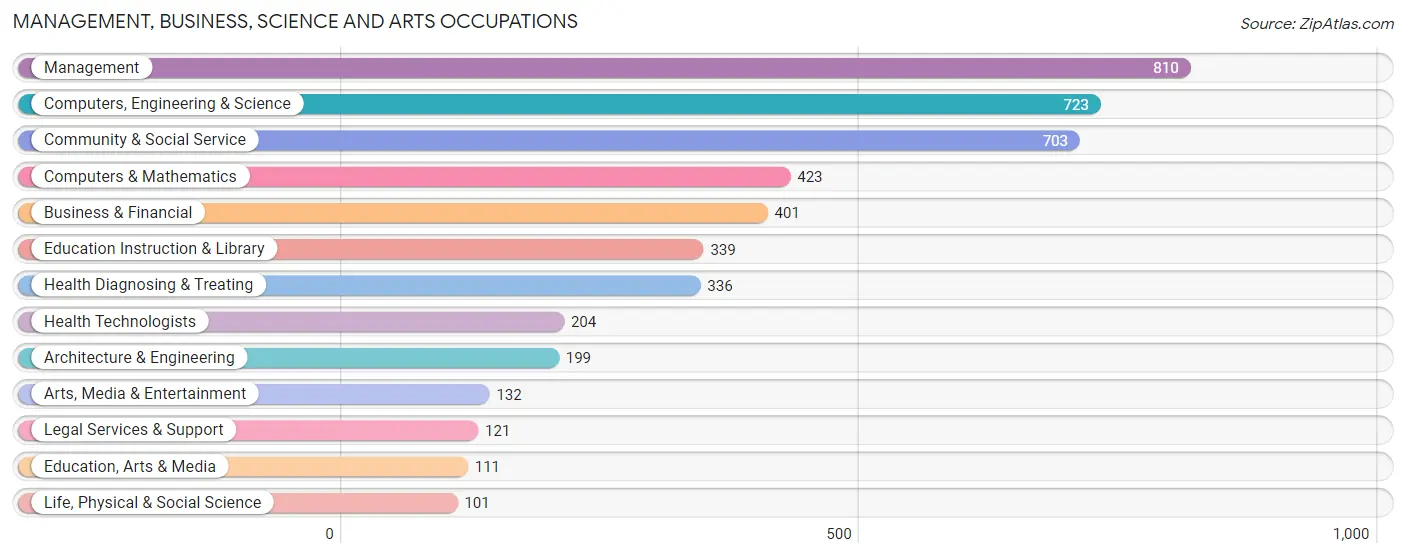
Management, Business, Science and Arts Occupations
The most common Management, Business, Science and Arts occupations in White Center are Management (810 | 9.7%), Computers, Engineering & Science (723 | 8.6%), Community & Social Service (703 | 8.4%), Computers & Mathematics (423 | 5.0%), and Business & Financial (401 | 4.8%).
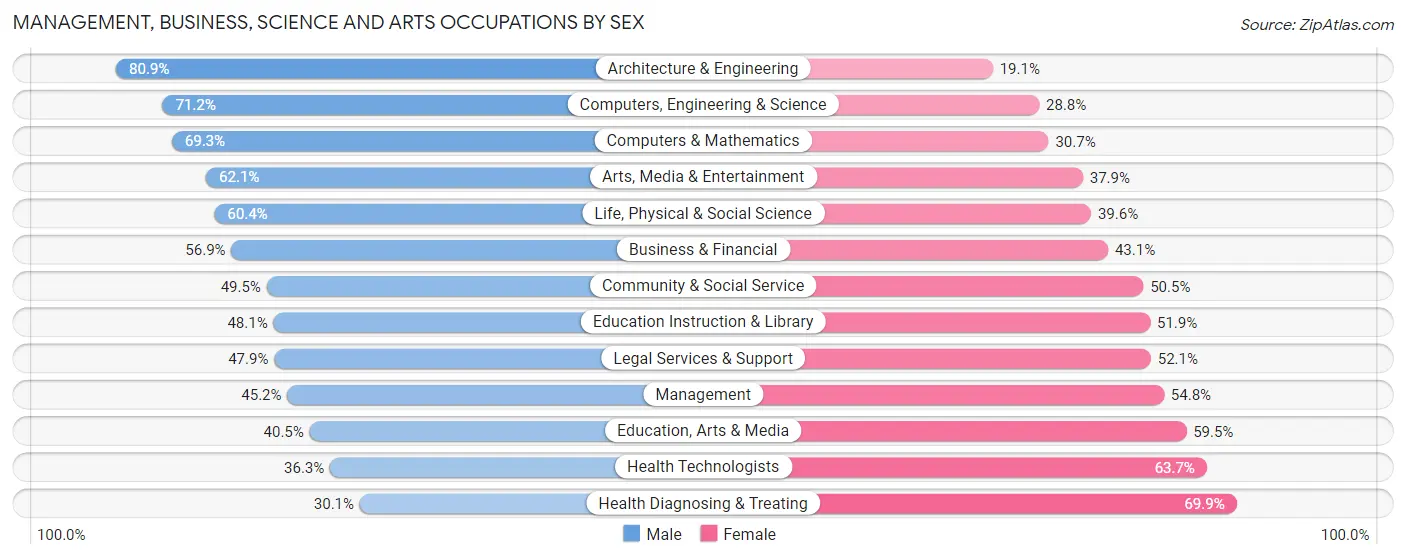
Management, Business, Science and Arts Occupations by Sex
Within the Management, Business, Science and Arts occupations in White Center, the most male-oriented occupations are Architecture & Engineering (80.9%), Computers, Engineering & Science (71.2%), and Computers & Mathematics (69.3%), while the most female-oriented occupations are Health Diagnosing & Treating (69.9%), Health Technologists (63.7%), and Education, Arts & Media (59.5%).
| Occupation | Male | Female |
| Management | 366 (45.2%) | 444 (54.8%) |
| Business & Financial | 228 (56.9%) | 173 (43.1%) |
| Computers, Engineering & Science | 515 (71.2%) | 208 (28.8%) |
| Computers & Mathematics | 293 (69.3%) | 130 (30.7%) |
| Architecture & Engineering | 161 (80.9%) | 38 (19.1%) |
| Life, Physical & Social Science | 61 (60.4%) | 40 (39.6%) |
| Community & Social Service | 348 (49.5%) | 355 (50.5%) |
| Education, Arts & Media | 45 (40.5%) | 66 (59.5%) |
| Legal Services & Support | 58 (47.9%) | 63 (52.1%) |
| Education Instruction & Library | 163 (48.1%) | 176 (51.9%) |
| Arts, Media & Entertainment | 82 (62.1%) | 50 (37.9%) |
| Health Diagnosing & Treating | 101 (30.1%) | 235 (69.9%) |
| Health Technologists | 74 (36.3%) | 130 (63.7%) |
| Total (Category) | 1,558 (52.4%) | 1,415 (47.6%) |
| Total (Overall) | 4,398 (52.4%) | 3,988 (47.6%) |
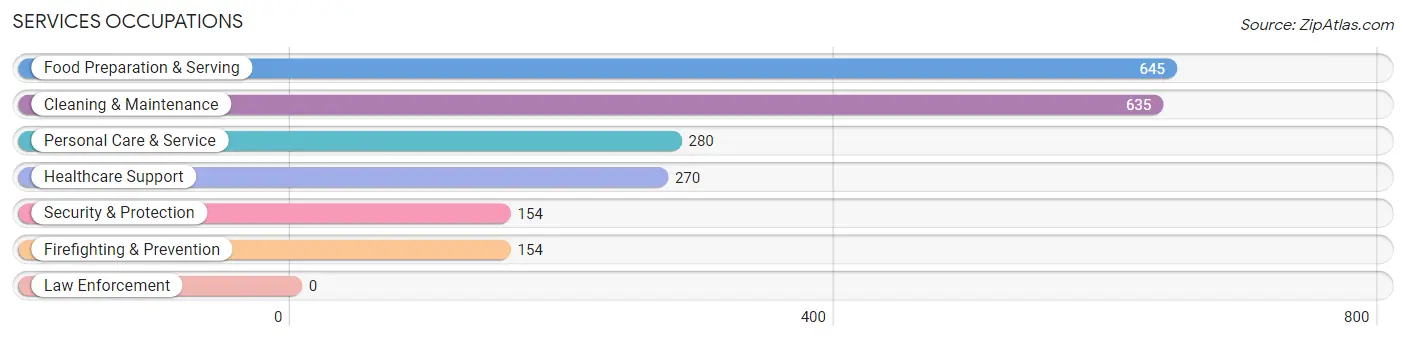
Services Occupations
The most common Services occupations in White Center are Food Preparation & Serving (645 | 7.7%), Cleaning & Maintenance (635 | 7.6%), Personal Care & Service (280 | 3.3%), Healthcare Support (270 | 3.2%), and Security & Protection (154 | 1.8%).
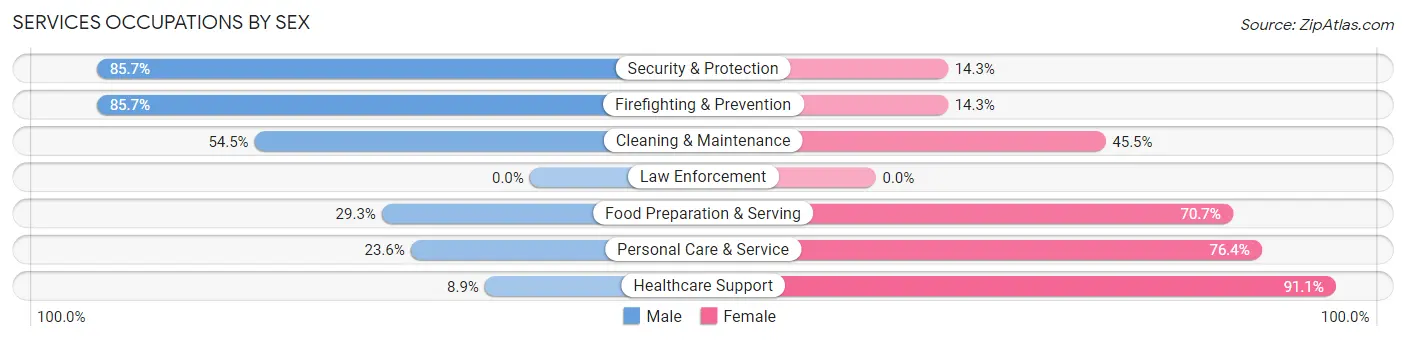
Services Occupations by Sex
Within the Services occupations in White Center, the most male-oriented occupations are Security & Protection (85.7%), Firefighting & Prevention (85.7%), and Cleaning & Maintenance (54.5%), while the most female-oriented occupations are Healthcare Support (91.1%), Personal Care & Service (76.4%), and Food Preparation & Serving (70.7%).
| Occupation | Male | Female |
| Healthcare Support | 24 (8.9%) | 246 (91.1%) |
| Security & Protection | 132 (85.7%) | 22 (14.3%) |
| Firefighting & Prevention | 132 (85.7%) | 22 (14.3%) |
| Law Enforcement | 0 (0.0%) | 0 (0.0%) |
| Food Preparation & Serving | 189 (29.3%) | 456 (70.7%) |
| Cleaning & Maintenance | 346 (54.5%) | 289 (45.5%) |
| Personal Care & Service | 66 (23.6%) | 214 (76.4%) |
| Total (Category) | 757 (38.2%) | 1,227 (61.8%) |
| Total (Overall) | 4,398 (52.4%) | 3,988 (47.6%) |
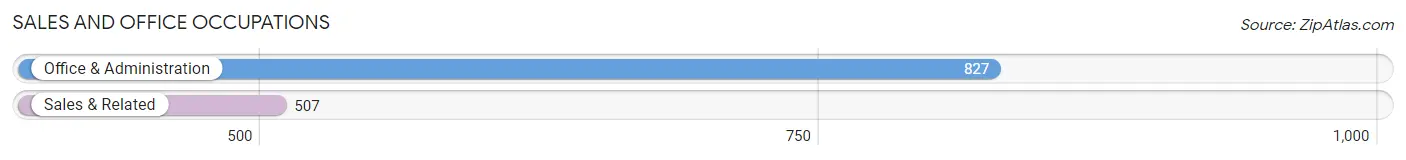
Sales and Office Occupations
The most common Sales and Office occupations in White Center are Office & Administration (827 | 9.9%), and Sales & Related (507 | 6.0%).
Sales and Office Occupations by Sex
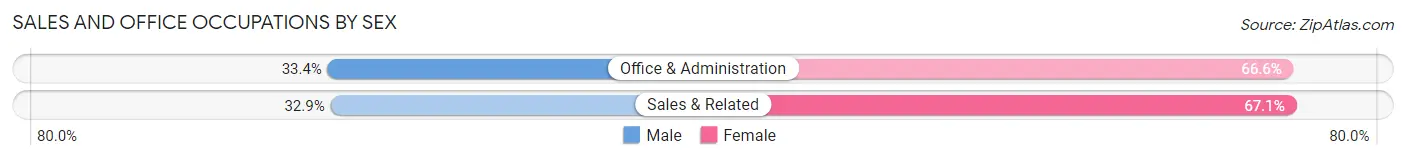
| Occupation | Male | Female |
| Sales & Related | 167 (32.9%) | 340 (67.1%) |
| Office & Administration | 276 (33.4%) | 551 (66.6%) |
| Total (Category) | 443 (33.2%) | 891 (66.8%) |
| Total (Overall) | 4,398 (52.4%) | 3,988 (47.6%) |
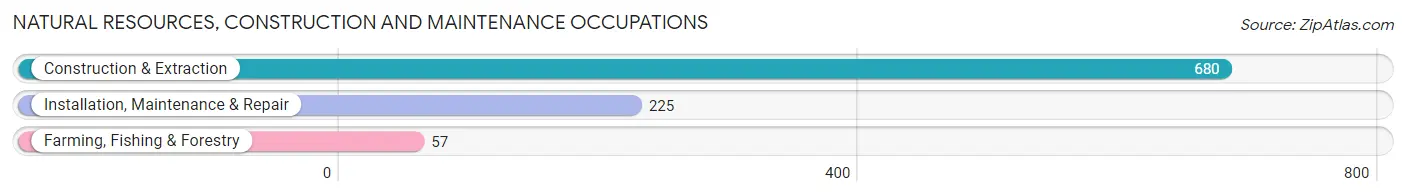
Natural Resources, Construction and Maintenance Occupations
The most common Natural Resources, Construction and Maintenance occupations in White Center are Construction & Extraction (680 | 8.1%), Installation, Maintenance & Repair (225 | 2.7%), and Farming, Fishing & Forestry (57 | 0.7%).
Natural Resources, Construction and Maintenance Occupations by Sex
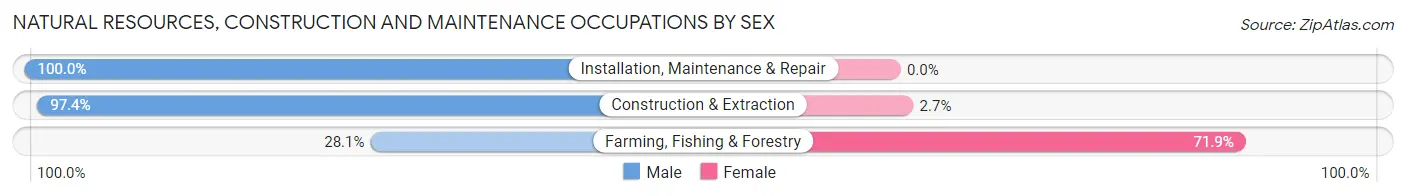
| Occupation | Male | Female |
| Farming, Fishing & Forestry | 16 (28.1%) | 41 (71.9%) |
| Construction & Extraction | 662 (97.4%) | 18 (2.6%) |
| Installation, Maintenance & Repair | 225 (100.0%) | 0 (0.0%) |
| Total (Category) | 903 (93.9%) | 59 (6.1%) |
| Total (Overall) | 4,398 (52.4%) | 3,988 (47.6%) |
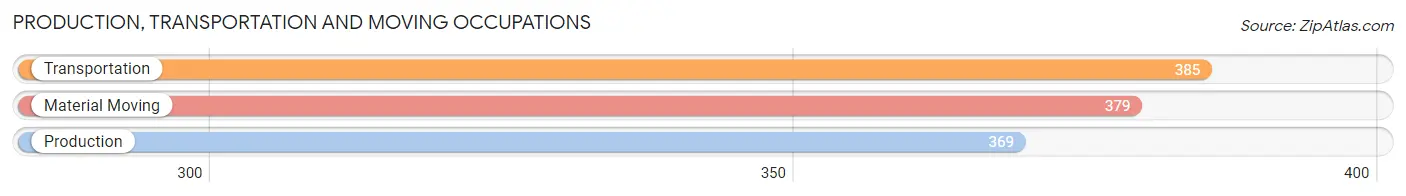
Production, Transportation and Moving Occupations
The most common Production, Transportation and Moving occupations in White Center are Transportation (385 | 4.6%), Material Moving (379 | 4.5%), and Production (369 | 4.4%).
Production, Transportation and Moving Occupations by Sex
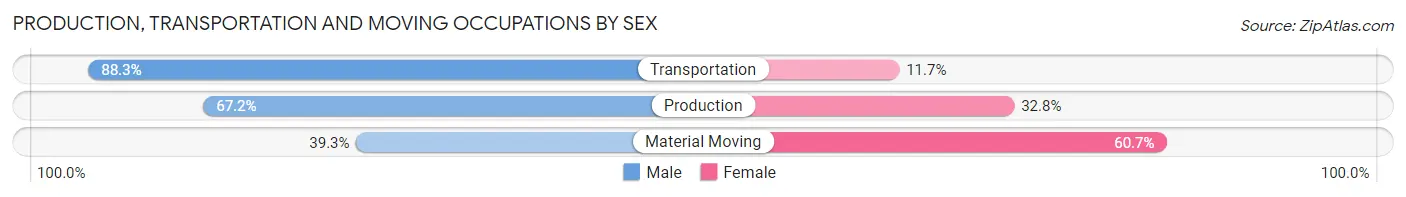
| Occupation | Male | Female |
| Production | 248 (67.2%) | 121 (32.8%) |
| Transportation | 340 (88.3%) | 45 (11.7%) |
| Material Moving | 149 (39.3%) | 230 (60.7%) |
| Total (Category) | 737 (65.0%) | 396 (34.9%) |
| Total (Overall) | 4,398 (52.4%) | 3,988 (47.6%) |
Employment Industries by Sex in White Center
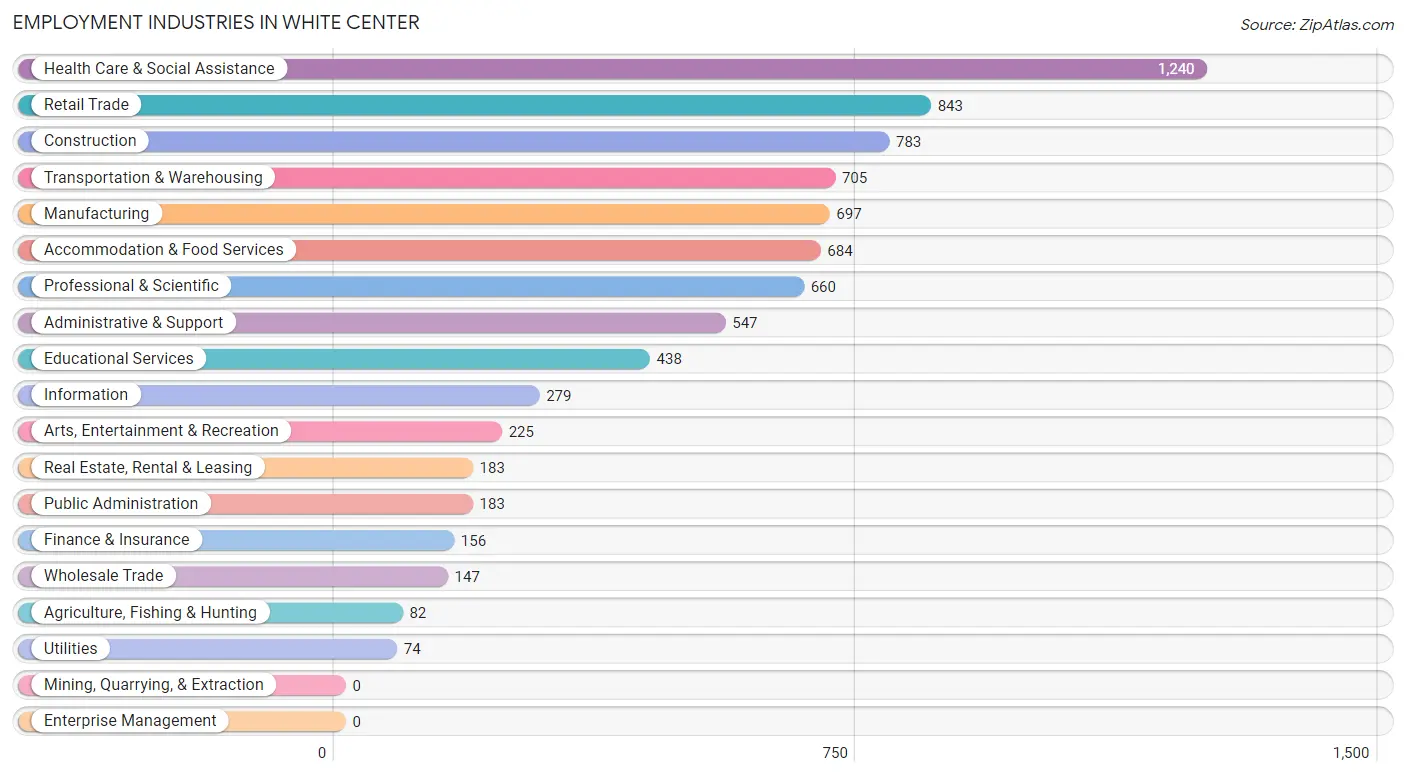
Employment Industries in White Center
The major employment industries in White Center include Health Care & Social Assistance (1,240 | 14.8%), Retail Trade (843 | 10.1%), Construction (783 | 9.3%), Transportation & Warehousing (705 | 8.4%), and Manufacturing (697 | 8.3%).
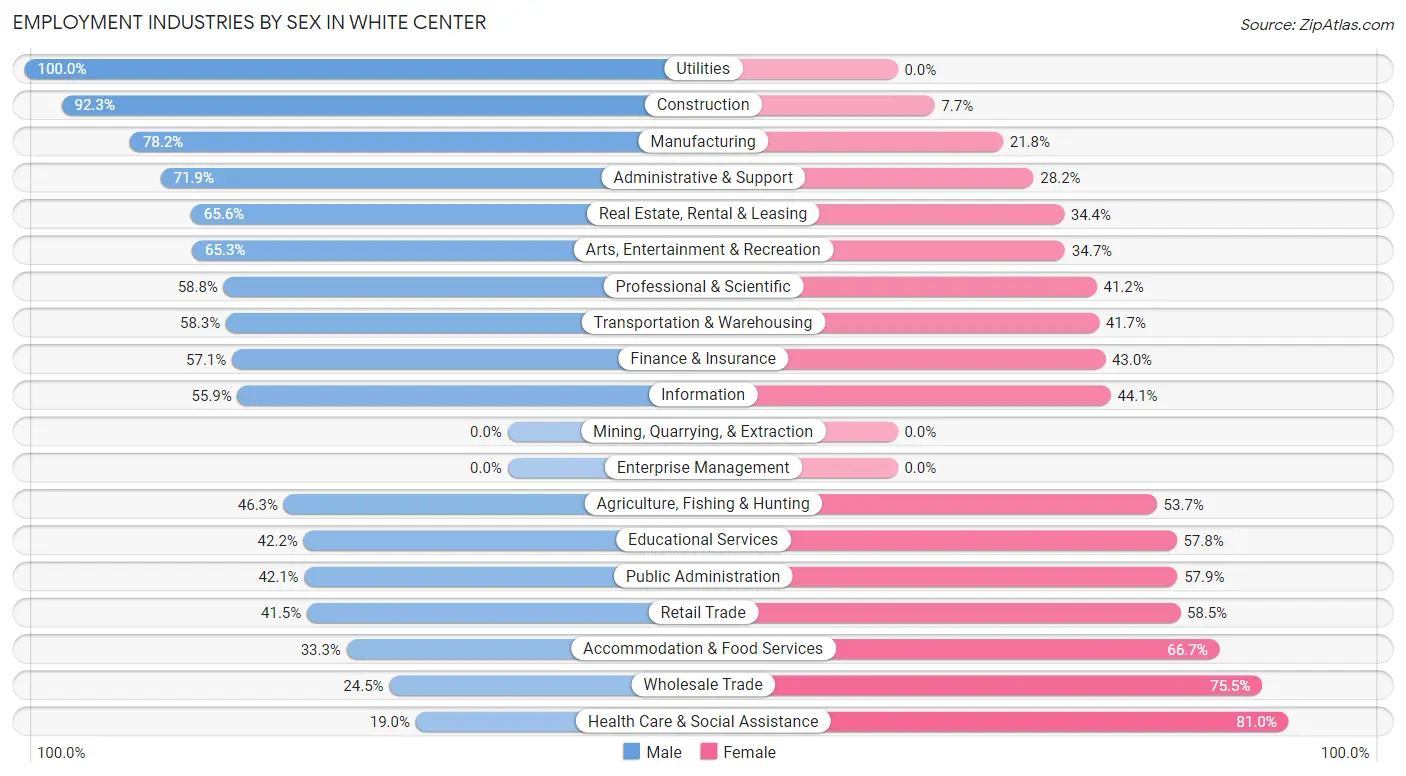
Employment Industries by Sex in White Center
The White Center industries that see more men than women are Utilities (100.0%), Construction (92.3%), and Manufacturing (78.2%), whereas the industries that tend to have a higher number of women are Health Care & Social Assistance (81.0%), Wholesale Trade (75.5%), and Accommodation & Food Services (66.7%).
| Industry | Male | Female |
| Agriculture, Fishing & Hunting | 38 (46.3%) | 44 (53.7%) |
| Mining, Quarrying, & Extraction | 0 (0.0%) | 0 (0.0%) |
| Construction | 723 (92.3%) | 60 (7.7%) |
| Manufacturing | 545 (78.2%) | 152 (21.8%) |
| Wholesale Trade | 36 (24.5%) | 111 (75.5%) |
| Retail Trade | 350 (41.5%) | 493 (58.5%) |
| Transportation & Warehousing | 411 (58.3%) | 294 (41.7%) |
| Utilities | 74 (100.0%) | 0 (0.0%) |
| Information | 156 (55.9%) | 123 (44.1%) |
| Finance & Insurance | 89 (57.1%) | 67 (42.9%) |
| Real Estate, Rental & Leasing | 120 (65.6%) | 63 (34.4%) |
| Professional & Scientific | 388 (58.8%) | 272 (41.2%) |
| Enterprise Management | 0 (0.0%) | 0 (0.0%) |
| Administrative & Support | 393 (71.9%) | 154 (28.1%) |
| Educational Services | 185 (42.2%) | 253 (57.8%) |
| Health Care & Social Assistance | 236 (19.0%) | 1,004 (81.0%) |
| Arts, Entertainment & Recreation | 147 (65.3%) | 78 (34.7%) |
| Accommodation & Food Services | 228 (33.3%) | 456 (66.7%) |
| Public Administration | 77 (42.1%) | 106 (57.9%) |
| Total | 4,398 (52.4%) | 3,988 (47.6%) |
Education in White Center
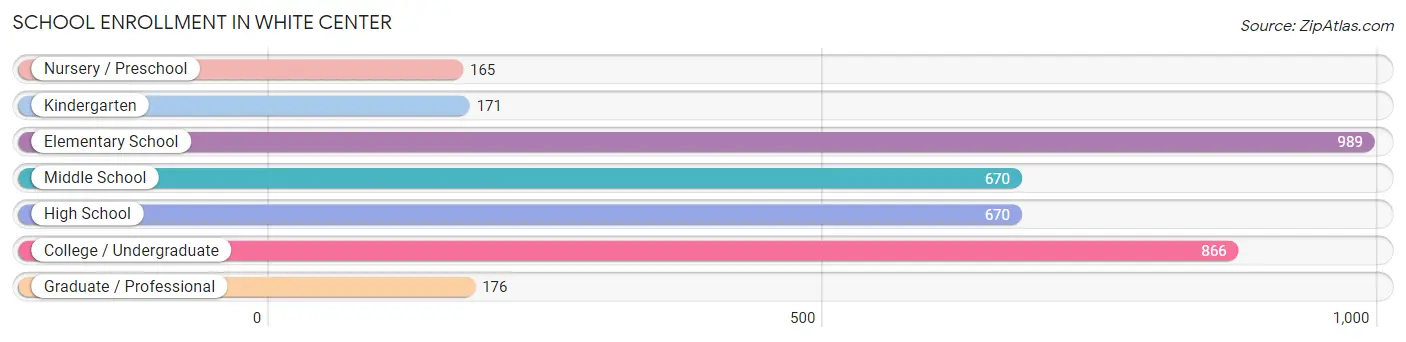
School Enrollment in White Center
The most common levels of schooling among the 3,707 students in White Center are elementary school (989 | 26.7%), college / undergraduate (866 | 23.4%), and middle school (670 | 18.1%).
| School Level | # Students | % Students |
| Nursery / Preschool | 165 | 4.4% |
| Kindergarten | 171 | 4.6% |
| Elementary School | 989 | 26.7% |
| Middle School | 670 | 18.1% |
| High School | 670 | 18.1% |
| College / Undergraduate | 866 | 23.4% |
| Graduate / Professional | 176 | 4.8% |
| Total | 3,707 | 100.0% |
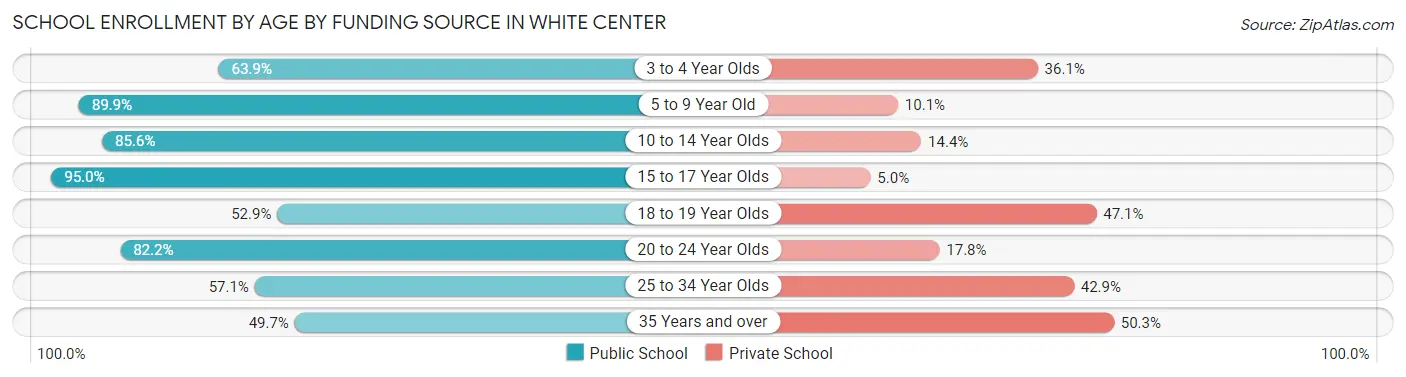
School Enrollment by Age by Funding Source in White Center
Out of a total of 3,707 students who are enrolled in schools in White Center, 682 (18.4%) attend a private institution, while the remaining 3,025 (81.6%) are enrolled in public schools. The age group of 35 years and over has the highest likelihood of being enrolled in private schools, with 82 (50.3% in the age bracket) enrolled. Conversely, the age group of 15 to 17 year olds has the lowest likelihood of being enrolled in a private school, with 496 (95.0% in the age bracket) attending a public institution.
| Age Bracket | Public School | Private School |
| 3 to 4 Year Olds | 76 (63.9%) | 43 (36.1%) |
| 5 to 9 Year Old | 979 (89.9%) | 110 (10.1%) |
| 10 to 14 Year Olds | 753 (85.6%) | 127 (14.4%) |
| 15 to 17 Year Olds | 496 (95.0%) | 26 (5.0%) |
| 18 to 19 Year Olds | 153 (52.9%) | 136 (47.1%) |
| 20 to 24 Year Olds | 392 (82.2%) | 85 (17.8%) |
| 25 to 34 Year Olds | 96 (57.1%) | 72 (42.9%) |
| 35 Years and over | 81 (49.7%) | 82 (50.3%) |
| Total | 3,025 (81.6%) | 682 (18.4%) |
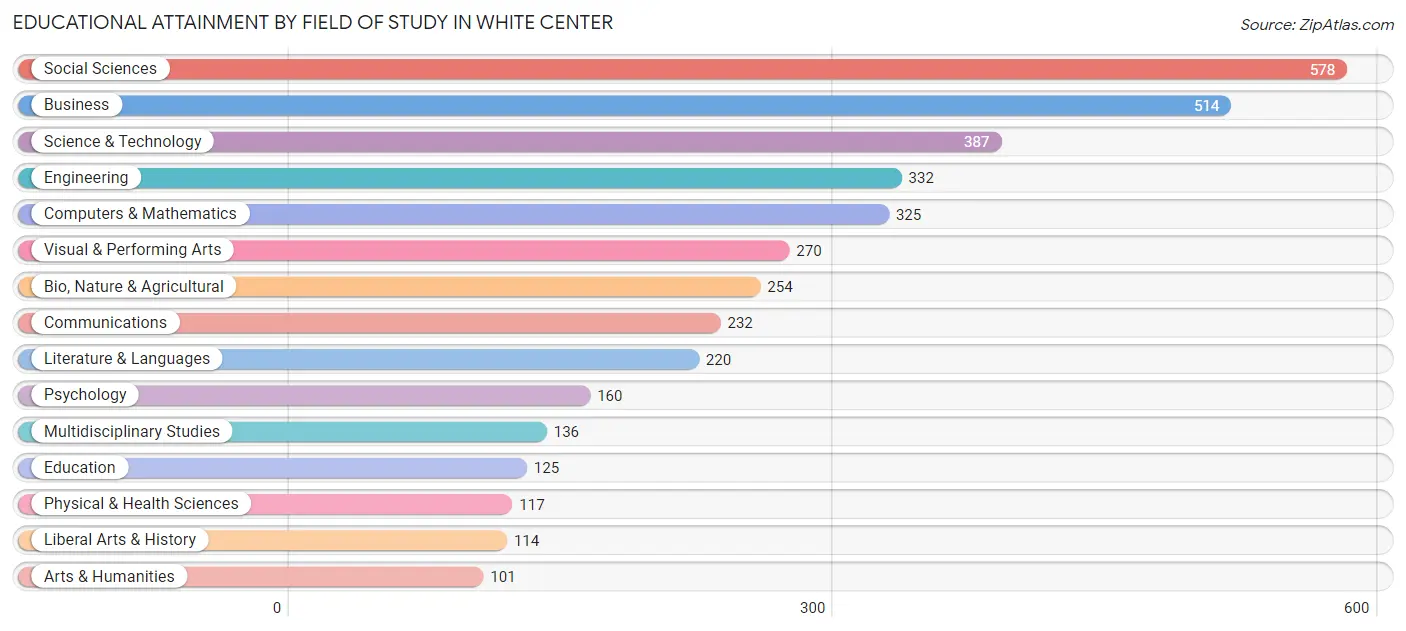
Educational Attainment by Field of Study in White Center
Social sciences (578 | 14.9%), business (514 | 13.3%), science & technology (387 | 10.0%), engineering (332 | 8.6%), and computers & mathematics (325 | 8.4%) are the most common fields of study among 3,865 individuals in White Center who have obtained a bachelor's degree or higher.
| Field of Study | # Graduates | % Graduates |
| Computers & Mathematics | 325 | 8.4% |
| Bio, Nature & Agricultural | 254 | 6.6% |
| Physical & Health Sciences | 117 | 3.0% |
| Psychology | 160 | 4.1% |
| Social Sciences | 578 | 14.9% |
| Engineering | 332 | 8.6% |
| Multidisciplinary Studies | 136 | 3.5% |
| Science & Technology | 387 | 10.0% |
| Business | 514 | 13.3% |
| Education | 125 | 3.2% |
| Literature & Languages | 220 | 5.7% |
| Liberal Arts & History | 114 | 2.9% |
| Visual & Performing Arts | 270 | 7.0% |
| Communications | 232 | 6.0% |
| Arts & Humanities | 101 | 2.6% |
| Total | 3,865 | 100.0% |
Transportation & Commute in White Center
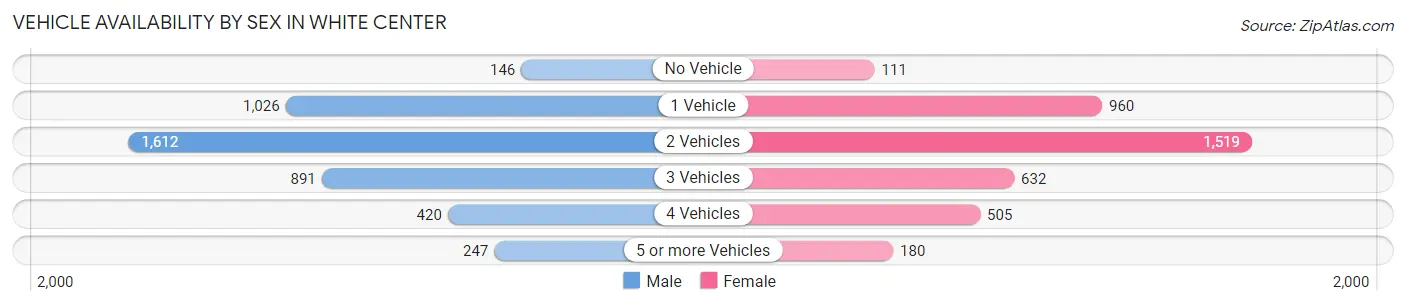
Vehicle Availability by Sex in White Center
The most prevalent vehicle ownership categories in White Center are males with 2 vehicles (1,612, accounting for 37.1%) and females with 2 vehicles (1,519, making up 41.3%).
| Vehicles Available | Male | Female |
| No Vehicle | 146 (3.4%) | 111 (2.8%) |
| 1 Vehicle | 1,026 (23.6%) | 960 (24.6%) |
| 2 Vehicles | 1,612 (37.1%) | 1,519 (38.9%) |
| 3 Vehicles | 891 (20.5%) | 632 (16.2%) |
| 4 Vehicles | 420 (9.7%) | 505 (12.9%) |
| 5 or more Vehicles | 247 (5.7%) | 180 (4.6%) |
| Total | 4,342 (100.0%) | 3,907 (100.0%) |
Commute Time in White Center
The most frequently occuring commute durations in White Center are 30 to 34 minutes (1,439 commuters, 20.0%), 45 to 59 minutes (1,013 commuters, 14.1%), and 20 to 24 minutes (977 commuters, 13.6%).
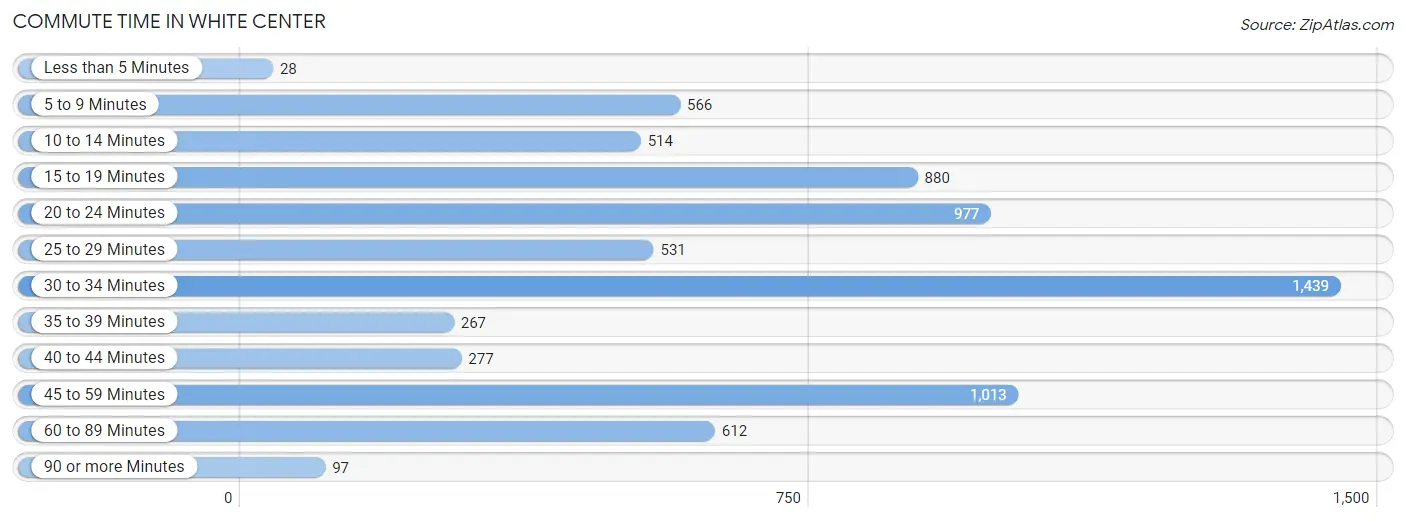
| Commute Time | # Commuters | % Commuters |
| Less than 5 Minutes | 28 | 0.4% |
| 5 to 9 Minutes | 566 | 7.9% |
| 10 to 14 Minutes | 514 | 7.1% |
| 15 to 19 Minutes | 880 | 12.2% |
| 20 to 24 Minutes | 977 | 13.6% |
| 25 to 29 Minutes | 531 | 7.4% |
| 30 to 34 Minutes | 1,439 | 20.0% |
| 35 to 39 Minutes | 267 | 3.7% |
| 40 to 44 Minutes | 277 | 3.8% |
| 45 to 59 Minutes | 1,013 | 14.1% |
| 60 to 89 Minutes | 612 | 8.5% |
| 90 or more Minutes | 97 | 1.3% |
Commute Time by Sex in White Center
The most common commute times in White Center are 30 to 34 minutes (830 commuters, 21.8%) for males and 20 to 24 minutes (656 commuters, 19.3%) for females.
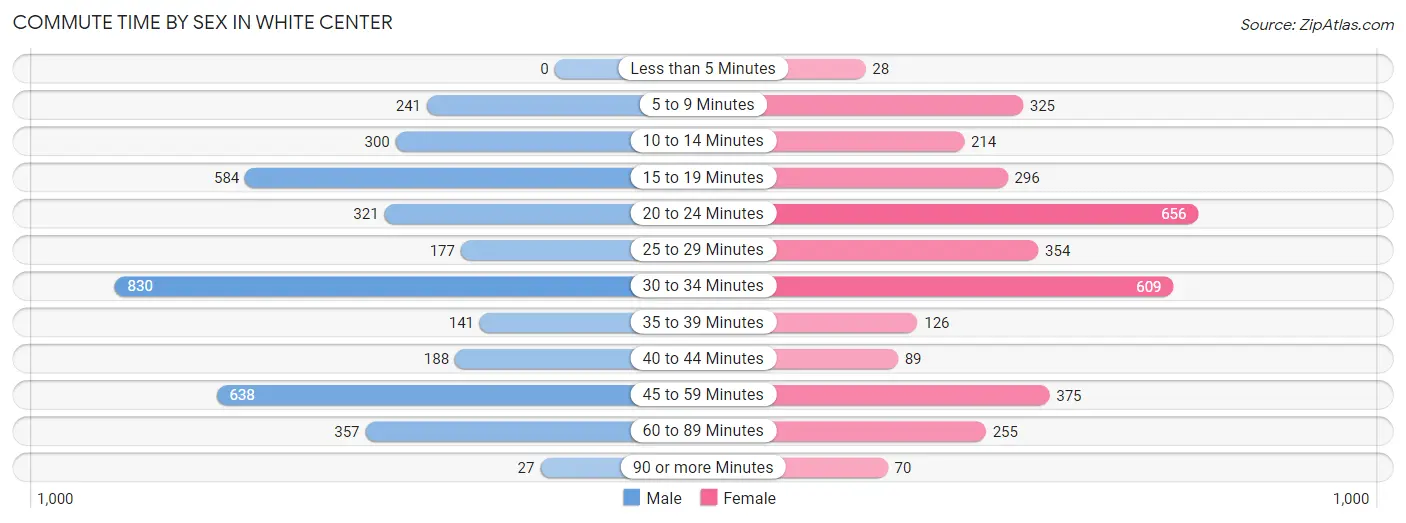
| Commute Time | Male | Female |
| Less than 5 Minutes | 0 (0.0%) | 28 (0.8%) |
| 5 to 9 Minutes | 241 (6.3%) | 325 (9.6%) |
| 10 to 14 Minutes | 300 (7.9%) | 214 (6.3%) |
| 15 to 19 Minutes | 584 (15.3%) | 296 (8.7%) |
| 20 to 24 Minutes | 321 (8.4%) | 656 (19.3%) |
| 25 to 29 Minutes | 177 (4.6%) | 354 (10.4%) |
| 30 to 34 Minutes | 830 (21.8%) | 609 (17.9%) |
| 35 to 39 Minutes | 141 (3.7%) | 126 (3.7%) |
| 40 to 44 Minutes | 188 (4.9%) | 89 (2.6%) |
| 45 to 59 Minutes | 638 (16.8%) | 375 (11.0%) |
| 60 to 89 Minutes | 357 (9.4%) | 255 (7.5%) |
| 90 or more Minutes | 27 (0.7%) | 70 (2.1%) |
Time of Departure to Work by Sex in White Center
The most frequent times of departure to work in White Center are 7:00 AM to 7:29 AM (791, 20.8%) for males and 8:00 AM to 8:29 AM (468, 13.8%) for females.
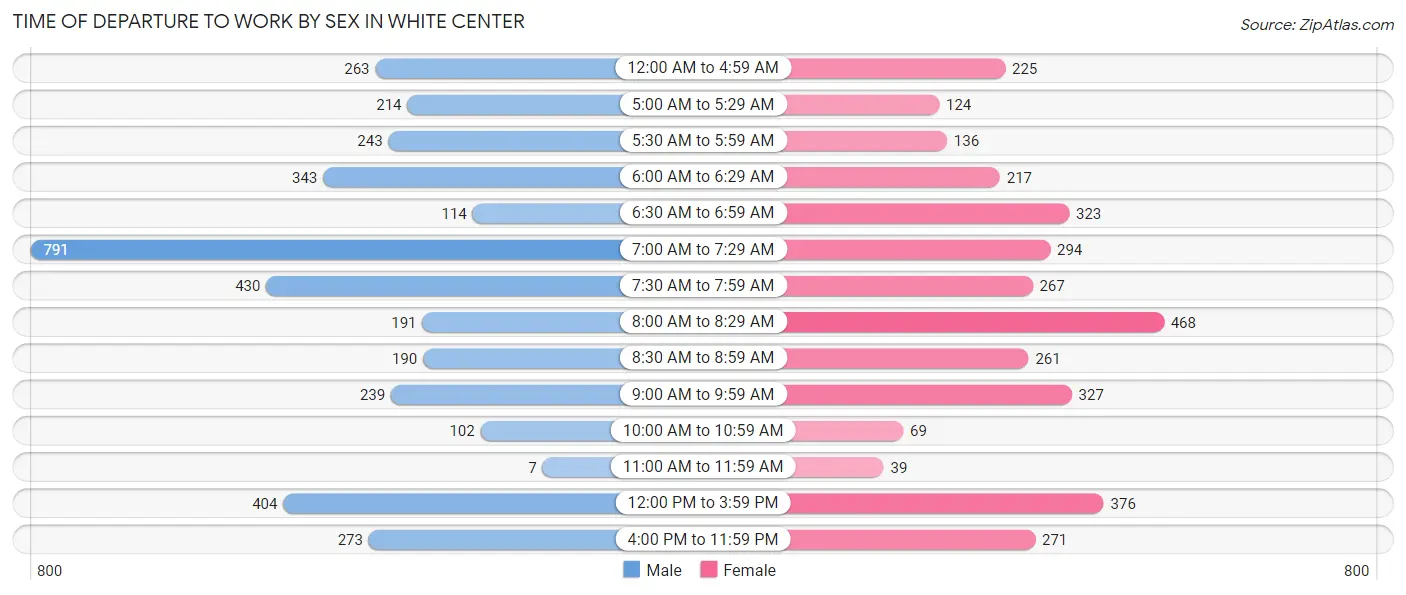
| Time of Departure | Male | Female |
| 12:00 AM to 4:59 AM | 263 (6.9%) | 225 (6.6%) |
| 5:00 AM to 5:29 AM | 214 (5.6%) | 124 (3.6%) |
| 5:30 AM to 5:59 AM | 243 (6.4%) | 136 (4.0%) |
| 6:00 AM to 6:29 AM | 343 (9.0%) | 217 (6.4%) |
| 6:30 AM to 6:59 AM | 114 (3.0%) | 323 (9.5%) |
| 7:00 AM to 7:29 AM | 791 (20.8%) | 294 (8.6%) |
| 7:30 AM to 7:59 AM | 430 (11.3%) | 267 (7.9%) |
| 8:00 AM to 8:29 AM | 191 (5.0%) | 468 (13.8%) |
| 8:30 AM to 8:59 AM | 190 (5.0%) | 261 (7.7%) |
| 9:00 AM to 9:59 AM | 239 (6.3%) | 327 (9.6%) |
| 10:00 AM to 10:59 AM | 102 (2.7%) | 69 (2.0%) |
| 11:00 AM to 11:59 AM | 7 (0.2%) | 39 (1.1%) |
| 12:00 PM to 3:59 PM | 404 (10.6%) | 376 (11.1%) |
| 4:00 PM to 11:59 PM | 273 (7.2%) | 271 (8.0%) |
| Total | 3,804 (100.0%) | 3,397 (100.0%) |
Housing Occupancy in White Center
Occupancy by Ownership in White Center
Of the total 5,850 dwellings in White Center, owner-occupied units account for 3,191 (54.5%), while renter-occupied units make up 2,659 (45.5%).
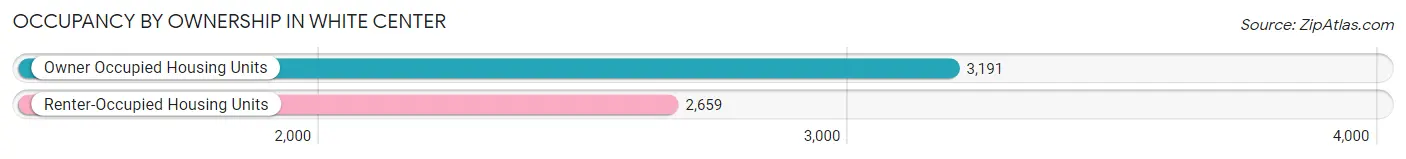
| Occupancy | # Housing Units | % Housing Units |
| Owner Occupied Housing Units | 3,191 | 54.5% |
| Renter-Occupied Housing Units | 2,659 | 45.5% |
| Total Occupied Housing Units | 5,850 | 100.0% |
Occupancy by Household Size in White Center
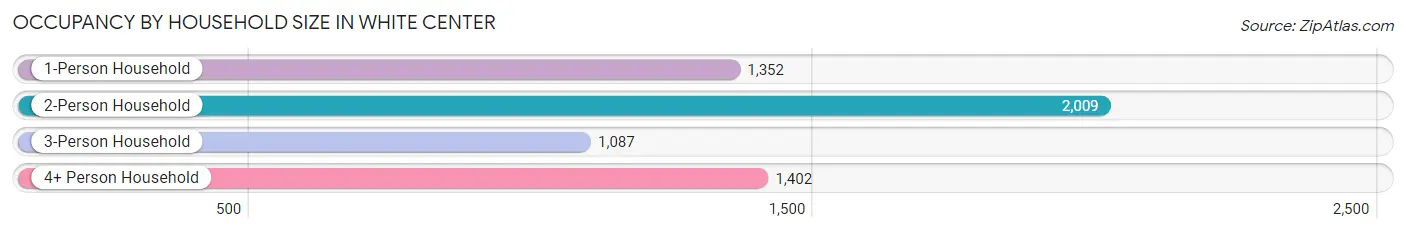
| Household Size | # Housing Units | % Housing Units |
| 1-Person Household | 1,352 | 23.1% |
| 2-Person Household | 2,009 | 34.3% |
| 3-Person Household | 1,087 | 18.6% |
| 4+ Person Household | 1,402 | 24.0% |
| Total Housing Units | 5,850 | 100.0% |
Occupancy by Ownership by Household Size in White Center
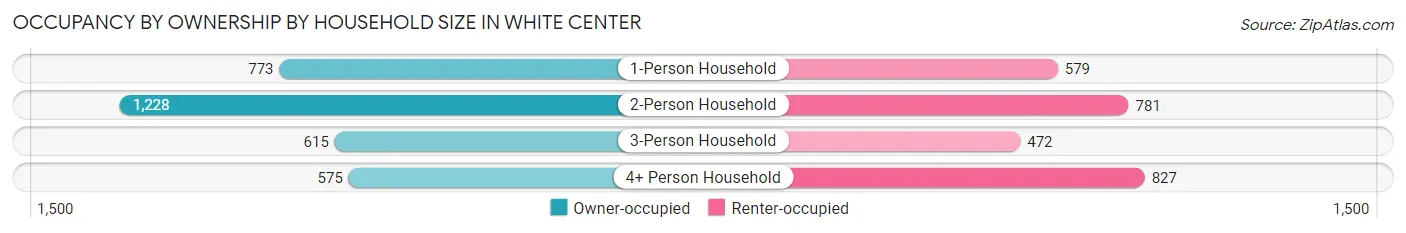
| Household Size | Owner-occupied | Renter-occupied |
| 1-Person Household | 773 (57.2%) | 579 (42.8%) |
| 2-Person Household | 1,228 (61.1%) | 781 (38.9%) |
| 3-Person Household | 615 (56.6%) | 472 (43.4%) |
| 4+ Person Household | 575 (41.0%) | 827 (59.0%) |
| Total Housing Units | 3,191 (54.5%) | 2,659 (45.5%) |
Occupancy by Educational Attainment in White Center
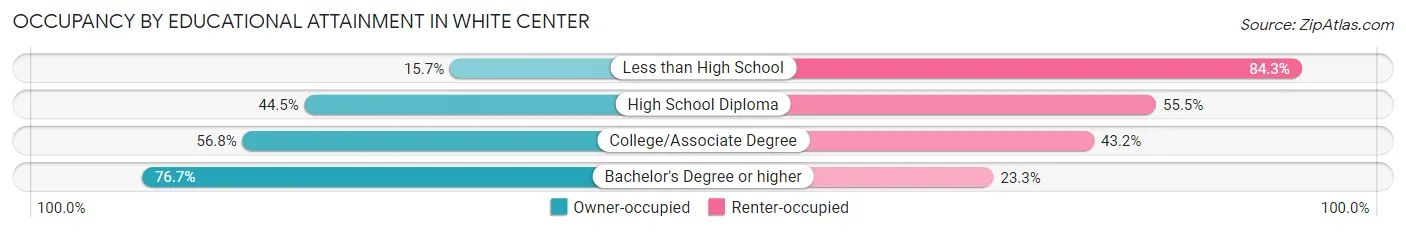
| Household Size | Owner-occupied | Renter-occupied |
| Less than High School | 138 (15.7%) | 743 (84.3%) |
| High School Diploma | 558 (44.5%) | 696 (55.5%) |
| College/Associate Degree | 1,012 (56.8%) | 770 (43.2%) |
| Bachelor's Degree or higher | 1,483 (76.7%) | 450 (23.3%) |
Occupancy by Age of Householder in White Center
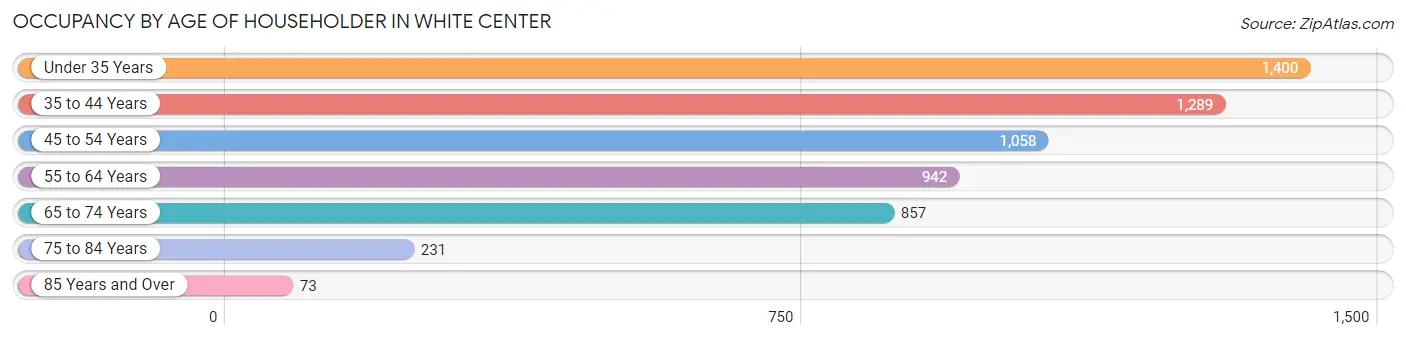
| Age Bracket | # Households | % Households |
| Under 35 Years | 1,400 | 23.9% |
| 35 to 44 Years | 1,289 | 22.0% |
| 45 to 54 Years | 1,058 | 18.1% |
| 55 to 64 Years | 942 | 16.1% |
| 65 to 74 Years | 857 | 14.6% |
| 75 to 84 Years | 231 | 4.0% |
| 85 Years and Over | 73 | 1.3% |
| Total | 5,850 | 100.0% |
Housing Finances in White Center
Median Income by Occupancy in White Center
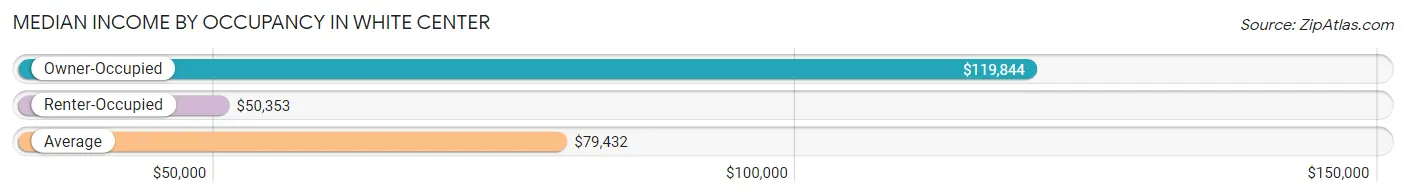
| Occupancy Type | # Households | Median Income |
| Owner-Occupied | 3,191 (54.5%) | $119,844 |
| Renter-Occupied | 2,659 (45.5%) | $50,353 |
| Average | 5,850 (100.0%) | $79,432 |
Occupancy by Householder Income Bracket in White Center
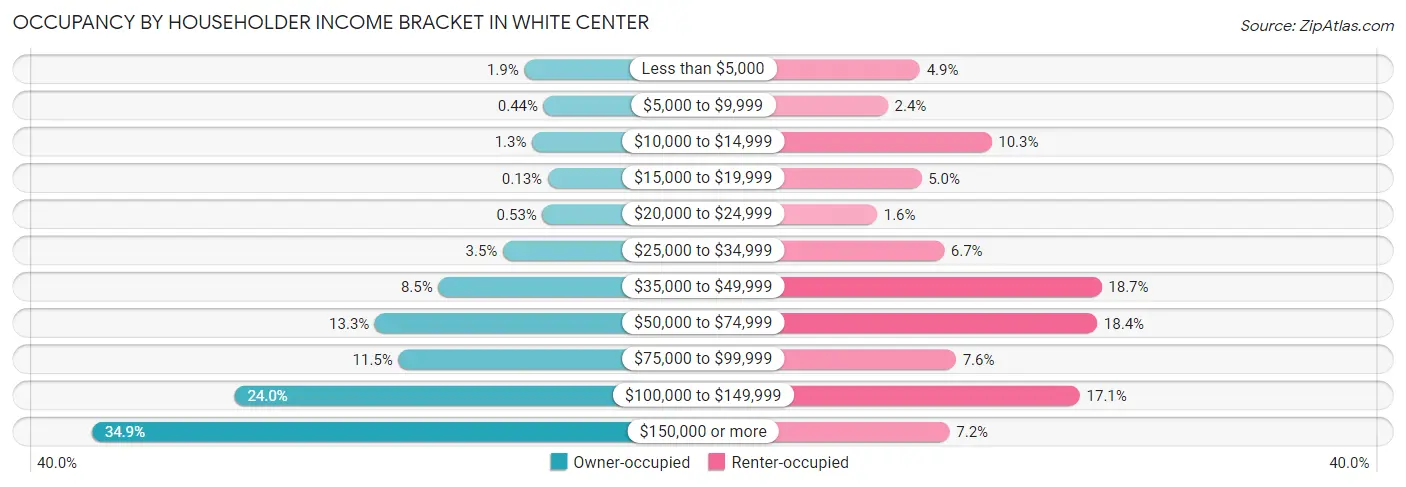
| Income Bracket | Owner-occupied | Renter-occupied |
| Less than $5,000 | 61 (1.9%) | 130 (4.9%) |
| $5,000 to $9,999 | 14 (0.4%) | 65 (2.4%) |
| $10,000 to $14,999 | 42 (1.3%) | 275 (10.3%) |
| $15,000 to $19,999 | 4 (0.1%) | 133 (5.0%) |
| $20,000 to $24,999 | 17 (0.5%) | 43 (1.6%) |
| $25,000 to $34,999 | 113 (3.5%) | 179 (6.7%) |
| $35,000 to $49,999 | 270 (8.5%) | 498 (18.7%) |
| $50,000 to $74,999 | 424 (13.3%) | 489 (18.4%) |
| $75,000 to $99,999 | 367 (11.5%) | 203 (7.6%) |
| $100,000 to $149,999 | 766 (24.0%) | 454 (17.1%) |
| $150,000 or more | 1,113 (34.9%) | 190 (7.1%) |
| Total | 3,191 (100.0%) | 2,659 (100.0%) |
Monthly Housing Cost Tiers in White Center
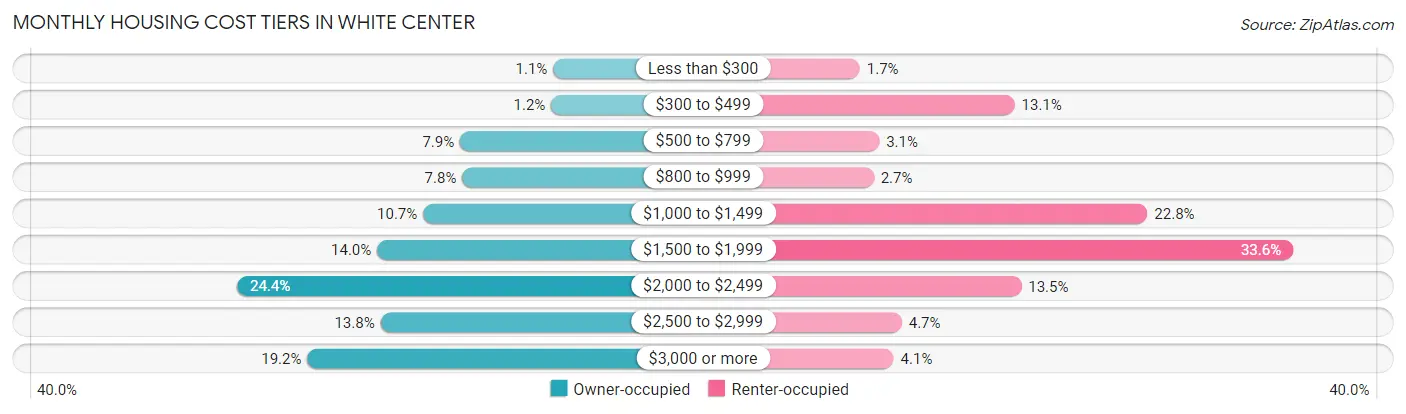
| Monthly Cost | Owner-occupied | Renter-occupied |
| Less than $300 | 34 (1.1%) | 44 (1.7%) |
| $300 to $499 | 39 (1.2%) | 347 (13.1%) |
| $500 to $799 | 253 (7.9%) | 82 (3.1%) |
| $800 to $999 | 248 (7.8%) | 71 (2.7%) |
| $1,000 to $1,499 | 340 (10.6%) | 607 (22.8%) |
| $1,500 to $1,999 | 448 (14.0%) | 892 (33.6%) |
| $2,000 to $2,499 | 777 (24.3%) | 360 (13.5%) |
| $2,500 to $2,999 | 440 (13.8%) | 126 (4.7%) |
| $3,000 or more | 612 (19.2%) | 110 (4.1%) |
| Total | 3,191 (100.0%) | 2,659 (100.0%) |
Physical Housing Characteristics in White Center
Housing Structures in White Center
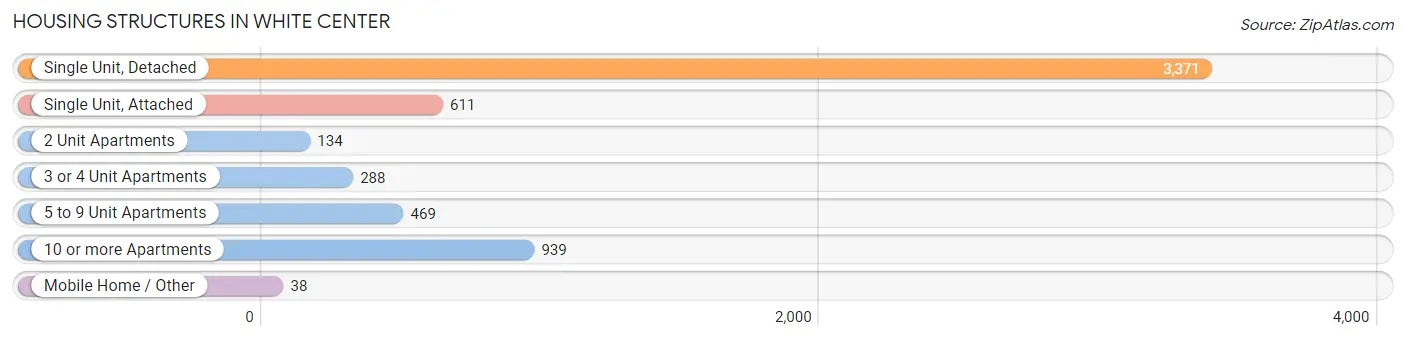
| Structure Type | # Housing Units | % Housing Units |
| Single Unit, Detached | 3,371 | 57.6% |
| Single Unit, Attached | 611 | 10.4% |
| 2 Unit Apartments | 134 | 2.3% |
| 3 or 4 Unit Apartments | 288 | 4.9% |
| 5 to 9 Unit Apartments | 469 | 8.0% |
| 10 or more Apartments | 939 | 16.1% |
| Mobile Home / Other | 38 | 0.6% |
| Total | 5,850 | 100.0% |
Housing Structures by Occupancy in White Center
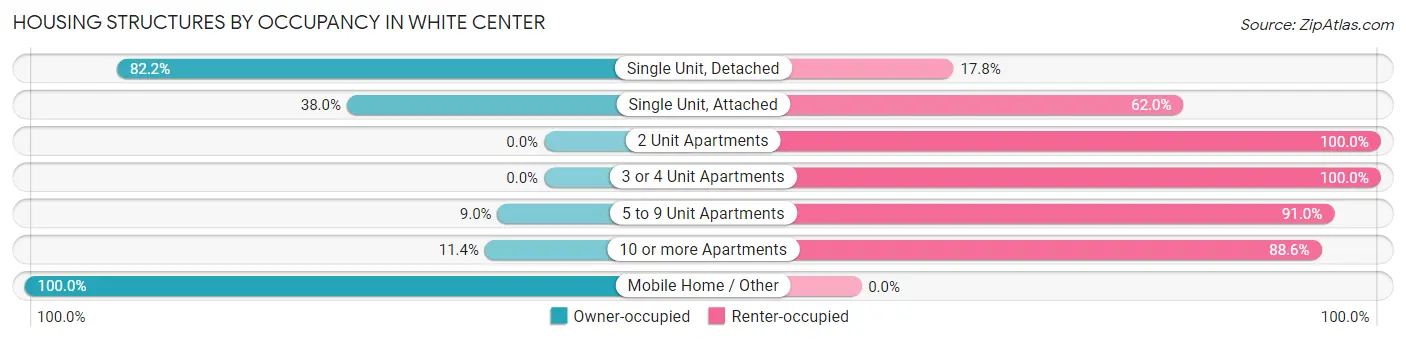
| Structure Type | Owner-occupied | Renter-occupied |
| Single Unit, Detached | 2,772 (82.2%) | 599 (17.8%) |
| Single Unit, Attached | 232 (38.0%) | 379 (62.0%) |
| 2 Unit Apartments | 0 (0.0%) | 134 (100.0%) |
| 3 or 4 Unit Apartments | 0 (0.0%) | 288 (100.0%) |
| 5 to 9 Unit Apartments | 42 (9.0%) | 427 (91.0%) |
| 10 or more Apartments | 107 (11.4%) | 832 (88.6%) |
| Mobile Home / Other | 38 (100.0%) | 0 (0.0%) |
| Total | 3,191 (54.5%) | 2,659 (45.5%) |
Housing Structures by Number of Rooms in White Center
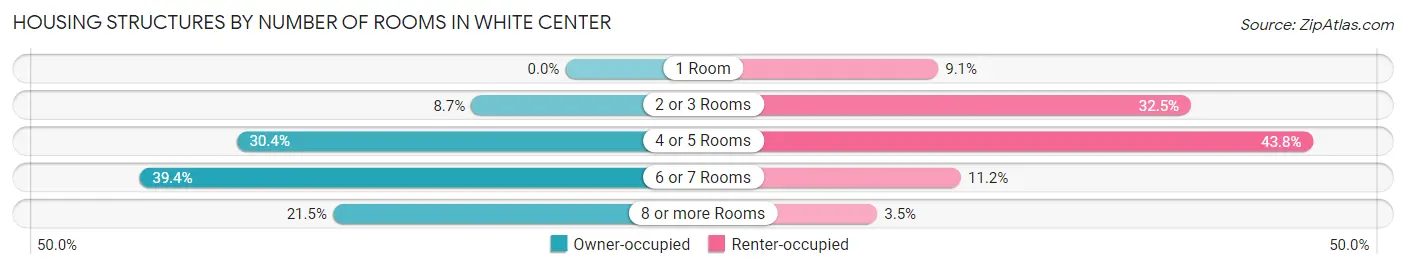
| Number of Rooms | Owner-occupied | Renter-occupied |
| 1 Room | 0 (0.0%) | 242 (9.1%) |
| 2 or 3 Rooms | 278 (8.7%) | 863 (32.5%) |
| 4 or 5 Rooms | 970 (30.4%) | 1,164 (43.8%) |
| 6 or 7 Rooms | 1,257 (39.4%) | 298 (11.2%) |
| 8 or more Rooms | 686 (21.5%) | 92 (3.5%) |
| Total | 3,191 (100.0%) | 2,659 (100.0%) |
Housing Structure by Heating Type in White Center
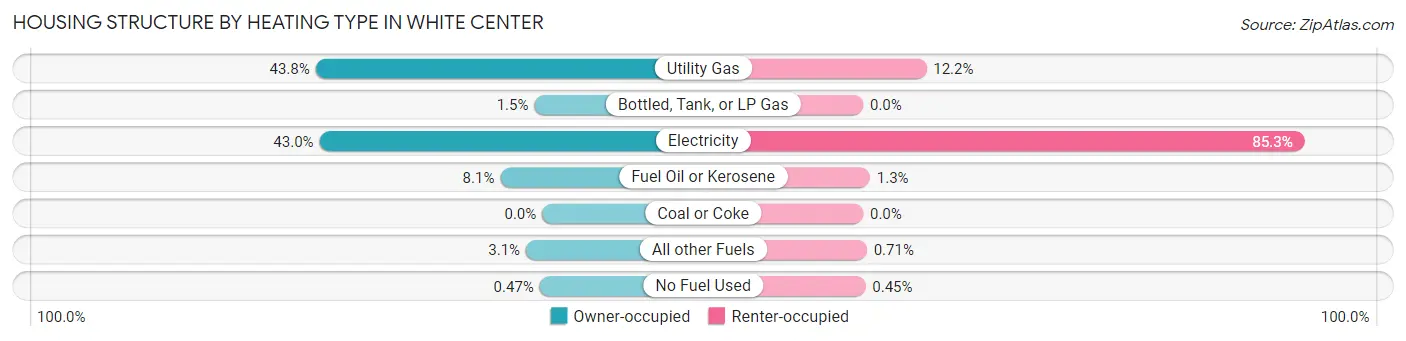
| Heating Type | Owner-occupied | Renter-occupied |
| Utility Gas | 1,397 (43.8%) | 325 (12.2%) |
| Bottled, Tank, or LP Gas | 48 (1.5%) | 0 (0.0%) |
| Electricity | 1,373 (43.0%) | 2,268 (85.3%) |
| Fuel Oil or Kerosene | 258 (8.1%) | 35 (1.3%) |
| Coal or Coke | 0 (0.0%) | 0 (0.0%) |
| All other Fuels | 100 (3.1%) | 19 (0.7%) |
| No Fuel Used | 15 (0.5%) | 12 (0.4%) |
| Total | 3,191 (100.0%) | 2,659 (100.0%) |
Household Vehicle Usage in White Center
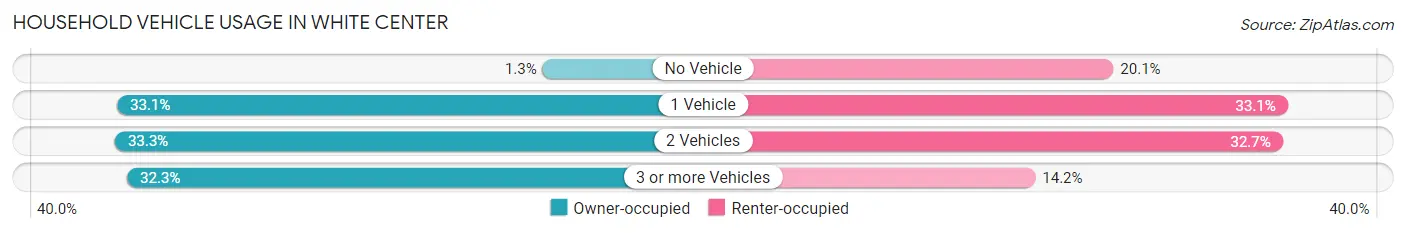
| Vehicles per Household | Owner-occupied | Renter-occupied |
| No Vehicle | 42 (1.3%) | 533 (20.1%) |
| 1 Vehicle | 1,056 (33.1%) | 879 (33.1%) |
| 2 Vehicles | 1,061 (33.3%) | 869 (32.7%) |
| 3 or more Vehicles | 1,032 (32.3%) | 378 (14.2%) |
| Total | 3,191 (100.0%) | 2,659 (100.0%) |
Real Estate & Mortgages in White Center
Real Estate and Mortgage Overview in White Center
| Characteristic | Without Mortgage | With Mortgage |
| Housing Units | 729 | 2,462 |
| Median Property Value | $476,600 | $574,400 |
| Median Household Income | $104,219 | $866 |
| Monthly Housing Costs | $913 | $612 |
| Real Estate Taxes | $4,876 | $33 |
Property Value by Mortgage Status in White Center
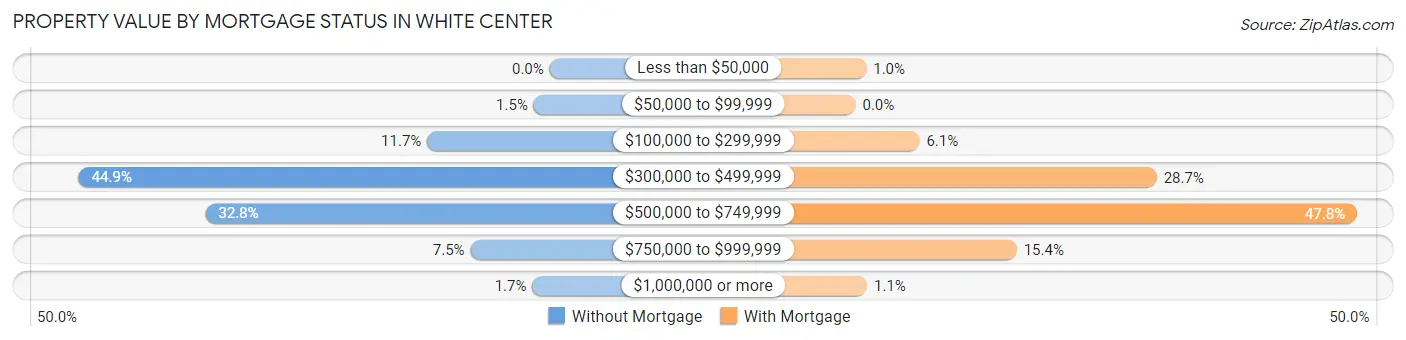
| Property Value | Without Mortgage | With Mortgage |
| Less than $50,000 | 0 (0.0%) | 25 (1.0%) |
| $50,000 to $99,999 | 11 (1.5%) | 0 (0.0%) |
| $100,000 to $299,999 | 85 (11.7%) | 150 (6.1%) |
| $300,000 to $499,999 | 327 (44.9%) | 706 (28.7%) |
| $500,000 to $749,999 | 239 (32.8%) | 1,176 (47.8%) |
| $750,000 to $999,999 | 55 (7.5%) | 378 (15.3%) |
| $1,000,000 or more | 12 (1.7%) | 27 (1.1%) |
| Total | 729 (100.0%) | 2,462 (100.0%) |
Household Income by Mortgage Status in White Center
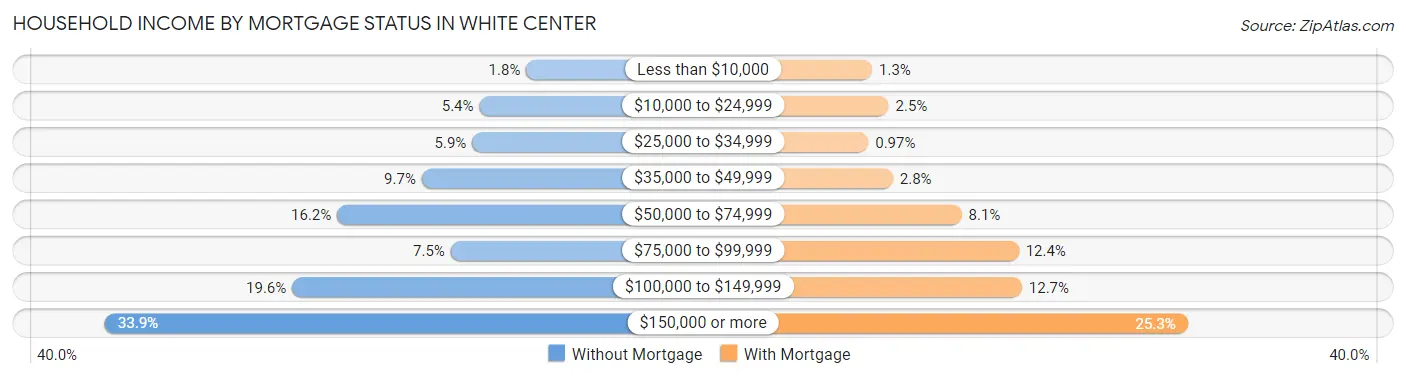
| Household Income | Without Mortgage | With Mortgage |
| Less than $10,000 | 13 (1.8%) | 31 (1.3%) |
| $10,000 to $24,999 | 39 (5.3%) | 62 (2.5%) |
| $25,000 to $34,999 | 43 (5.9%) | 24 (1.0%) |
| $35,000 to $49,999 | 71 (9.7%) | 70 (2.8%) |
| $50,000 to $74,999 | 118 (16.2%) | 199 (8.1%) |
| $75,000 to $99,999 | 55 (7.5%) | 306 (12.4%) |
| $100,000 to $149,999 | 143 (19.6%) | 312 (12.7%) |
| $150,000 or more | 247 (33.9%) | 623 (25.3%) |
| Total | 729 (100.0%) | 2,462 (100.0%) |
Property Value to Household Income Ratio in White Center
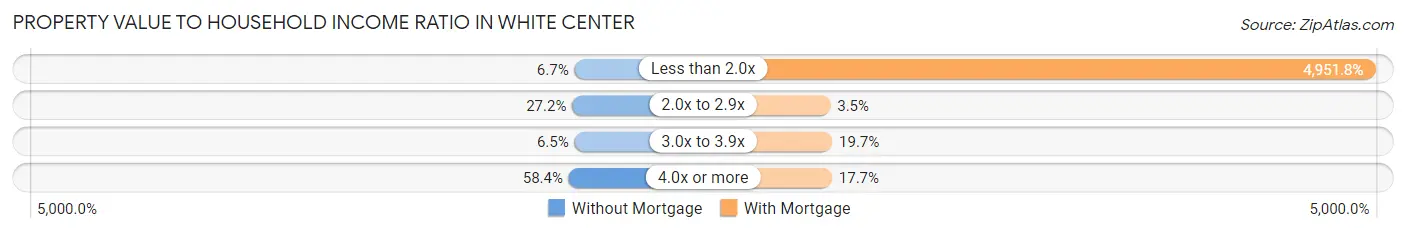
| Value-to-Income Ratio | Without Mortgage | With Mortgage |
| Less than 2.0x | 49 (6.7%) | 121,912 (4,951.7%) |
| 2.0x to 2.9x | 198 (27.2%) | 85 (3.5%) |
| 3.0x to 3.9x | 47 (6.5%) | 485 (19.7%) |
| 4.0x or more | 426 (58.4%) | 436 (17.7%) |
| Total | 729 (100.0%) | 2,462 (100.0%) |
Real Estate Taxes by Mortgage Status in White Center
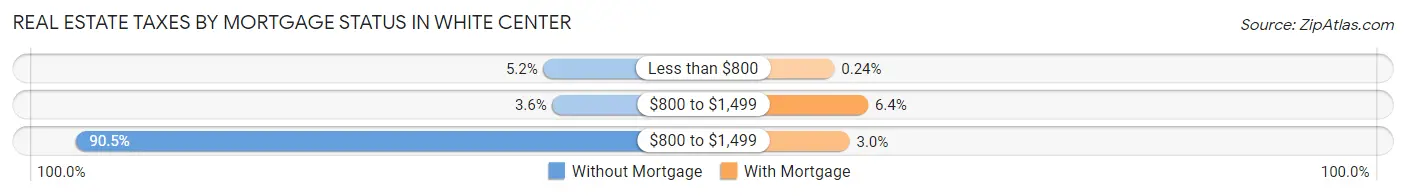
| Property Taxes | Without Mortgage | With Mortgage |
| Less than $800 | 38 (5.2%) | 6 (0.2%) |
| $800 to $1,499 | 26 (3.6%) | 157 (6.4%) |
| $800 to $1,499 | 660 (90.5%) | 74 (3.0%) |
| Total | 729 (100.0%) | 2,462 (100.0%) |
Health & Disability in White Center
Health Insurance Coverage by Age in White Center
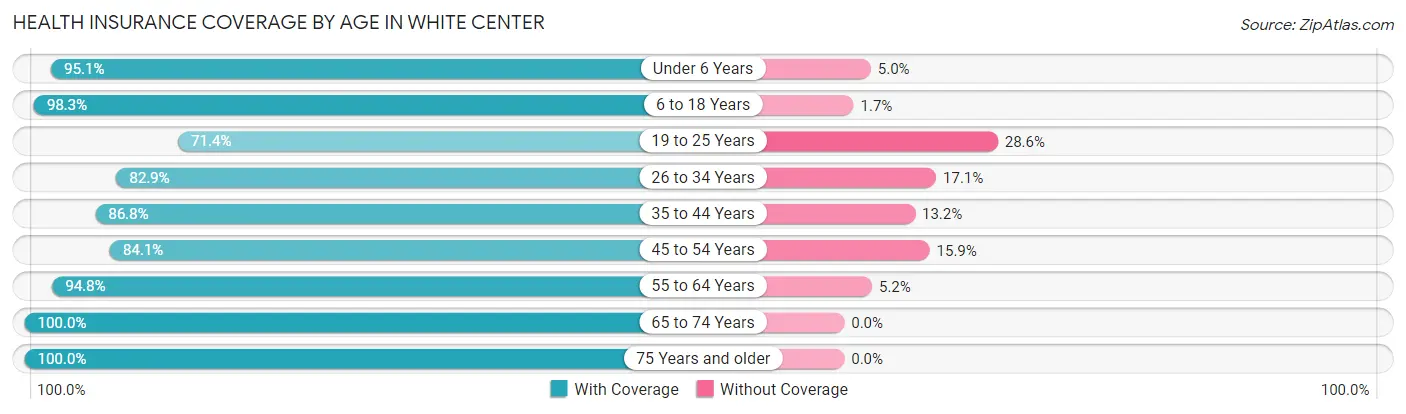
| Age Bracket | With Coverage | Without Coverage |
| Under 6 Years | 865 (95.1%) | 45 (5.0%) |
| 6 to 18 Years | 2,439 (98.3%) | 43 (1.7%) |
| 19 to 25 Years | 1,124 (71.4%) | 451 (28.6%) |
| 26 to 34 Years | 2,043 (82.9%) | 422 (17.1%) |
| 35 to 44 Years | 2,041 (86.8%) | 310 (13.2%) |
| 45 to 54 Years | 1,681 (84.1%) | 318 (15.9%) |
| 55 to 64 Years | 1,686 (94.8%) | 92 (5.2%) |
| 65 to 74 Years | 1,396 (100.0%) | 0 (0.0%) |
| 75 Years and older | 523 (100.0%) | 0 (0.0%) |
| Total | 13,798 (89.1%) | 1,681 (10.9%) |
Health Insurance Coverage by Citizenship Status in White Center
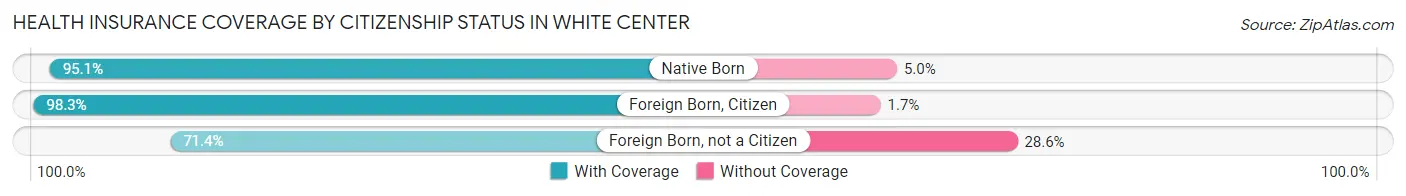
| Citizenship Status | With Coverage | Without Coverage |
| Native Born | 865 (95.1%) | 45 (5.0%) |
| Foreign Born, Citizen | 2,439 (98.3%) | 43 (1.7%) |
| Foreign Born, not a Citizen | 1,124 (71.4%) | 451 (28.6%) |
Health Insurance Coverage by Household Income in White Center
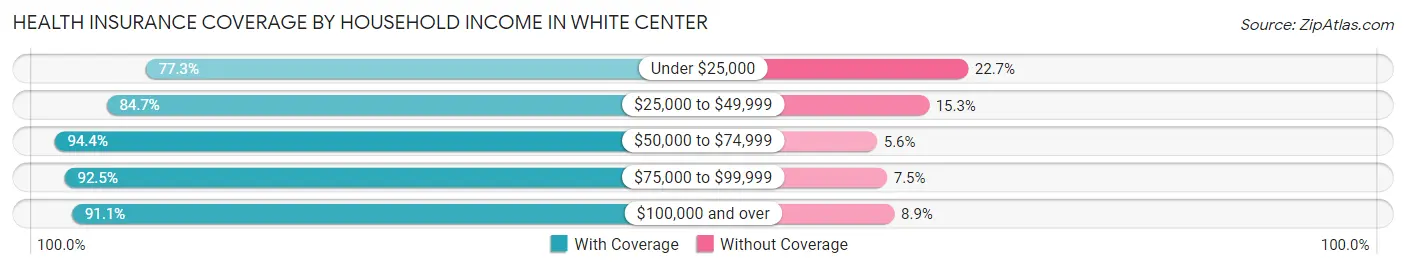
| Household Income | With Coverage | Without Coverage |
| Under $25,000 | 1,200 (77.3%) | 352 (22.7%) |
| $25,000 to $49,999 | 2,351 (84.7%) | 426 (15.3%) |
| $50,000 to $74,999 | 2,185 (94.4%) | 130 (5.6%) |
| $75,000 to $99,999 | 1,297 (92.5%) | 105 (7.5%) |
| $100,000 and over | 6,718 (91.1%) | 654 (8.9%) |
Public vs Private Health Insurance Coverage by Age in White Center
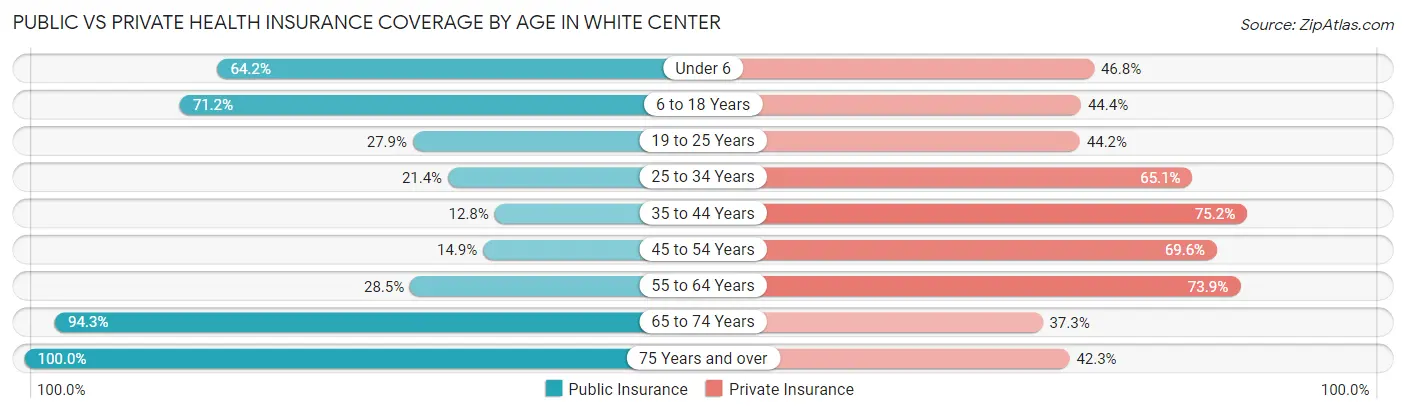
| Age Bracket | Public Insurance | Private Insurance |
| Under 6 | 584 (64.2%) | 426 (46.8%) |
| 6 to 18 Years | 1,767 (71.2%) | 1,102 (44.4%) |
| 19 to 25 Years | 440 (27.9%) | 696 (44.2%) |
| 25 to 34 Years | 528 (21.4%) | 1,604 (65.1%) |
| 35 to 44 Years | 300 (12.8%) | 1,768 (75.2%) |
| 45 to 54 Years | 298 (14.9%) | 1,392 (69.6%) |
| 55 to 64 Years | 506 (28.5%) | 1,314 (73.9%) |
| 65 to 74 Years | 1,317 (94.3%) | 520 (37.2%) |
| 75 Years and over | 523 (100.0%) | 221 (42.3%) |
| Total | 6,263 (40.5%) | 9,043 (58.4%) |
Disability Status by Sex by Age in White Center
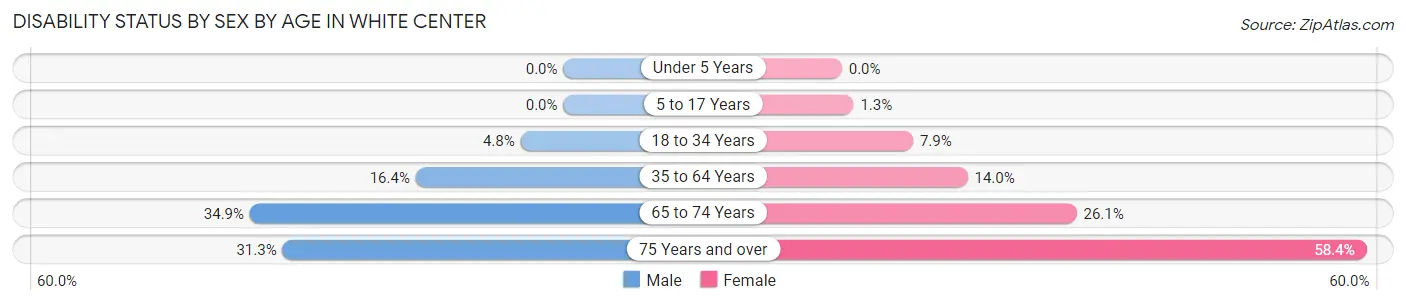
| Age Bracket | Male | Female |
| Under 5 Years | 0 (0.0%) | 0 (0.0%) |
| 5 to 17 Years | 0 (0.0%) | 19 (1.3%) |
| 18 to 34 Years | 106 (4.8%) | 154 (7.9%) |
| 35 to 64 Years | 531 (16.4%) | 406 (14.0%) |
| 65 to 74 Years | 243 (34.9%) | 183 (26.1%) |
| 75 Years and over | 56 (31.3%) | 201 (58.4%) |
Disability Class by Sex by Age in White Center
Disability Class: Hearing Difficulty
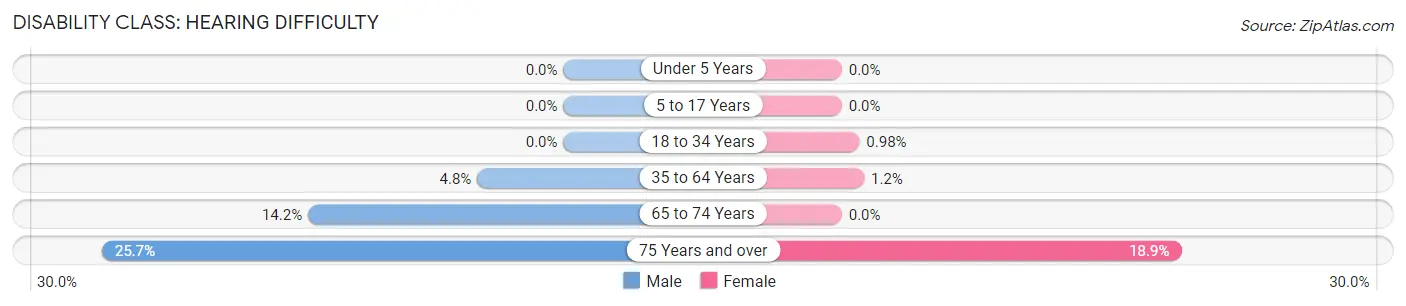
| Age Bracket | Male | Female |
| Under 5 Years | 0 (0.0%) | 0 (0.0%) |
| 5 to 17 Years | 0 (0.0%) | 0 (0.0%) |
| 18 to 34 Years | 0 (0.0%) | 19 (1.0%) |
| 35 to 64 Years | 155 (4.8%) | 36 (1.2%) |
| 65 to 74 Years | 99 (14.2%) | 0 (0.0%) |
| 75 Years and over | 46 (25.7%) | 65 (18.9%) |
Disability Class: Vision Difficulty
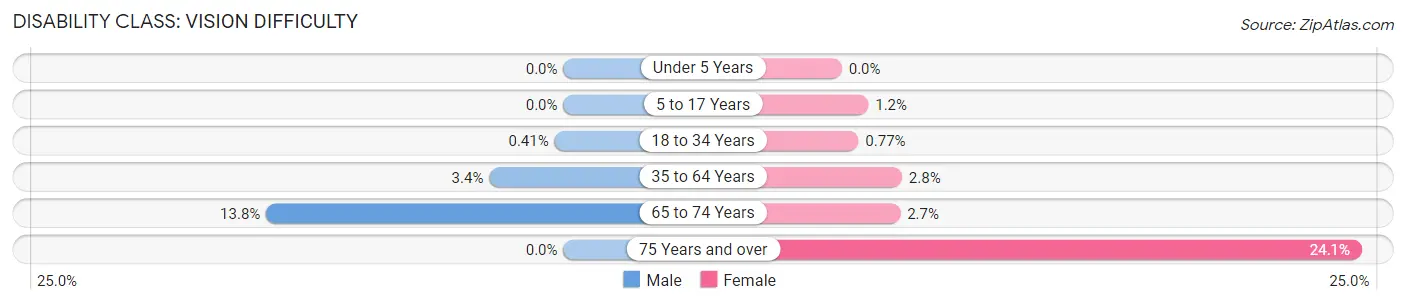
| Age Bracket | Male | Female |
| Under 5 Years | 0 (0.0%) | 0 (0.0%) |
| 5 to 17 Years | 0 (0.0%) | 18 (1.2%) |
| 18 to 34 Years | 9 (0.4%) | 15 (0.8%) |
| 35 to 64 Years | 111 (3.4%) | 81 (2.8%) |
| 65 to 74 Years | 96 (13.8%) | 19 (2.7%) |
| 75 Years and over | 0 (0.0%) | 83 (24.1%) |
Disability Class: Cognitive Difficulty
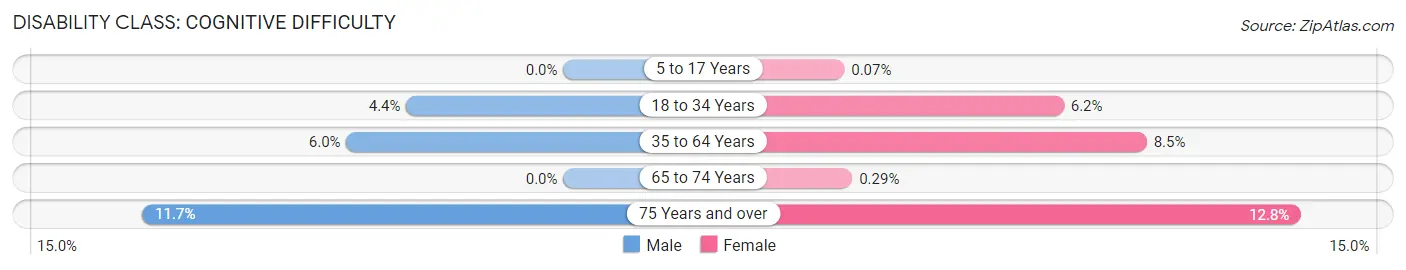
| Age Bracket | Male | Female |
| 5 to 17 Years | 0 (0.0%) | 1 (0.1%) |
| 18 to 34 Years | 97 (4.4%) | 120 (6.2%) |
| 35 to 64 Years | 195 (6.0%) | 246 (8.5%) |
| 65 to 74 Years | 0 (0.0%) | 2 (0.3%) |
| 75 Years and over | 21 (11.7%) | 44 (12.8%) |
Disability Class: Ambulatory Difficulty
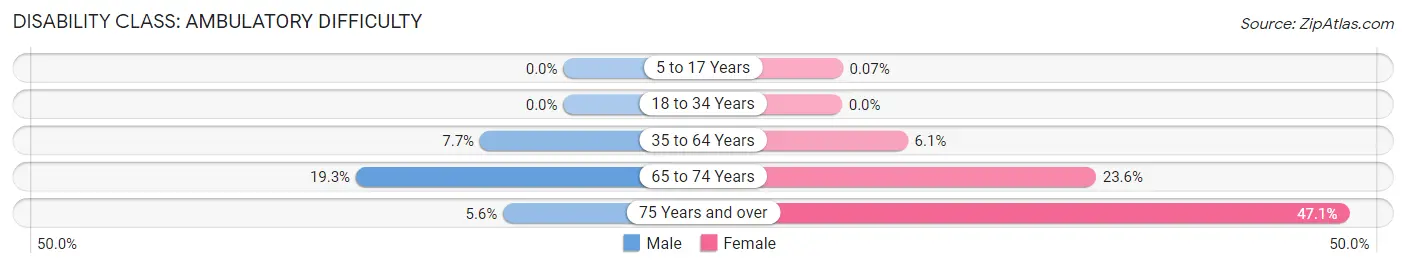
| Age Bracket | Male | Female |
| 5 to 17 Years | 0 (0.0%) | 1 (0.1%) |
| 18 to 34 Years | 0 (0.0%) | 0 (0.0%) |
| 35 to 64 Years | 250 (7.7%) | 177 (6.1%) |
| 65 to 74 Years | 134 (19.3%) | 165 (23.6%) |
| 75 Years and over | 10 (5.6%) | 162 (47.1%) |
Disability Class: Self-Care Difficulty
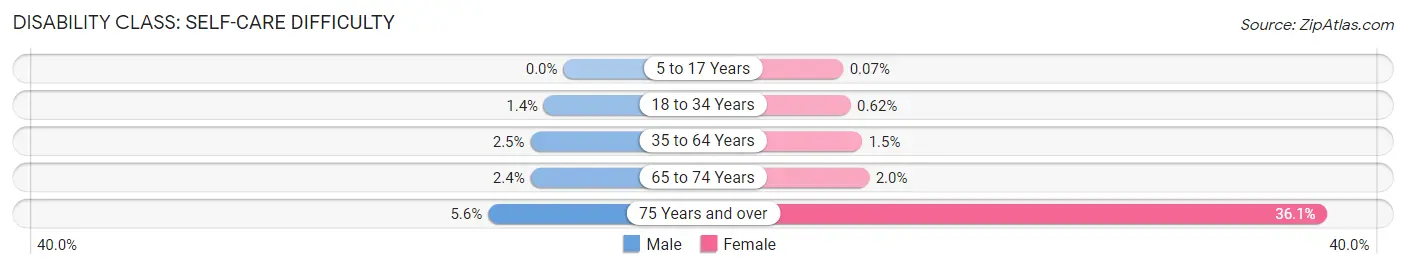
| Age Bracket | Male | Female |
| 5 to 17 Years | 0 (0.0%) | 1 (0.1%) |
| 18 to 34 Years | 32 (1.4%) | 12 (0.6%) |
| 35 to 64 Years | 79 (2.5%) | 43 (1.5%) |
| 65 to 74 Years | 17 (2.4%) | 14 (2.0%) |
| 75 Years and over | 10 (5.6%) | 124 (36.0%) |
Technology Access in White Center
Computing Device Access in White Center
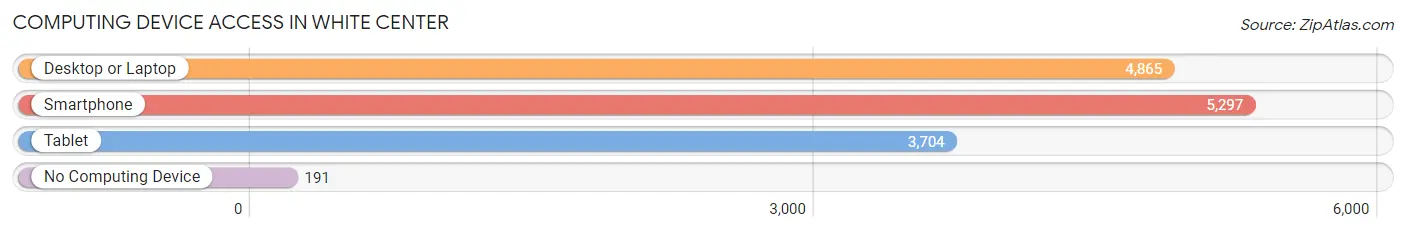
| Device Type | # Households | % Households |
| Desktop or Laptop | 4,865 | 83.2% |
| Smartphone | 5,297 | 90.5% |
| Tablet | 3,704 | 63.3% |
| No Computing Device | 191 | 3.3% |
| Total | 5,850 | 100.0% |
Internet Access in White Center
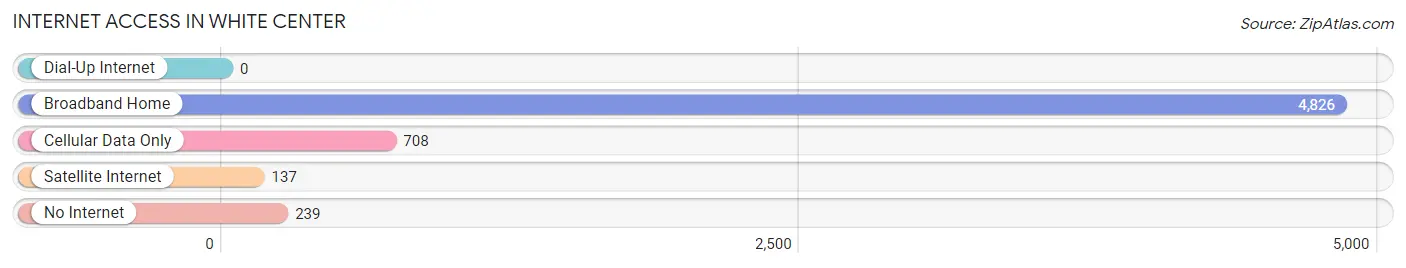
| Internet Type | # Households | % Households |
| Dial-Up Internet | 0 | 0.0% |
| Broadband Home | 4,826 | 82.5% |
| Cellular Data Only | 708 | 12.1% |
| Satellite Internet | 137 | 2.3% |
| No Internet | 239 | 4.1% |
| Total | 5,850 | 100.0% |
White Center Summary
History
White Center is a neighborhood located in the south of Seattle, Washington. It is bordered by West Seattle to the south, Burien to the north, and the Duwamish River to the east. The area was originally inhabited by the Duwamish people, who were the first to settle in the area. The first non-native settlers arrived in the late 1800s, and the area was officially incorporated as White Center in 1910.
The area was originally known as "White Center" due to the white sand that was found in the area. The sand was used to make bricks, which were used to build many of the homes in the area. The area was also known for its dairy farms, which provided milk and other dairy products to the Seattle area.
In the early 1900s, the area began to experience rapid growth due to the influx of immigrants from Europe and Asia. This growth was further fueled by the construction of the Seattle-Tacoma Interurban Railway in 1910, which connected White Center to Seattle and Tacoma.
The area experienced a period of decline in the mid-1900s, as many of the dairy farms closed and the population began to decline. However, the area has seen a resurgence in recent years, as new businesses and housing developments have been built in the area.
Geography
White Center is located in the south of Seattle, Washington. It is bordered by West Seattle to the south, Burien to the north, and the Duwamish River to the east. The area is located on a flat plain, with an elevation of approximately 200 feet.
The area is home to several parks, including White Center Park, which is located in the center of the neighborhood. The park features a playground, picnic areas, and a walking path. The area is also home to several lakes, including Lake Burien, which is located just north of White Center.
Economy
White Center is home to a variety of businesses, including restaurants, retail stores, and professional services. The area is also home to several industrial businesses, including a lumber mill and a metal fabrication plant.
The area is also home to several educational institutions, including Highline Community College and the Seattle Vocational Institute.
Demographics
As of the 2010 census, the population of White Center was 10,854. The racial makeup of the area was 57.3% White, 16.2% Asian, 15.2% Hispanic or Latino, and 11.3% African American. The median household income was $45,837, and the median age was 33.7 years.
Conclusion
White Center is a neighborhood located in the south of Seattle, Washington. It is bordered by West Seattle to the south, Burien to the north, and the Duwamish River to the east. The area was originally inhabited by the Duwamish people, and was later settled by non-native settlers in the late 1800s. The area is home to a variety of businesses, including restaurants, retail stores, and professional services. The population of White Center was 10,854 as of the 2010 census, and the median household income was $45,837. White Center is a vibrant and diverse neighborhood that has seen a resurgence in recent years.
Common Questions
What is Per Capita Income in White Center?
Per Capita income in White Center is $40,370.
What is the Median Family Income in White Center?
Median Family Income in White Center is $83,045.
What is the Median Household income in White Center?
Median Household Income in White Center is $79,432.
What is Income or Wage Gap in White Center?
Income or Wage Gap in White Center is 32.7%.
Women in White Center earn 67.3 cents for every dollar earned by a man.
What is Inequality or Gini Index in White Center?
Inequality or Gini Index in White Center is 0.45.
What is the Total Population of White Center?
Total Population of White Center is 15,479.
What is the Total Male Population of White Center?
Total Male Population of White Center is 7,840.
What is the Total Female Population of White Center?
Total Female Population of White Center is 7,639.
What is the Ratio of Males per 100 Females in White Center?
There are 102.63 Males per 100 Females in White Center.
What is the Ratio of Females per 100 Males in White Center?
There are 97.44 Females per 100 Males in White Center.
What is the Median Population Age in White Center?
Median Population Age in White Center is 36.1 Years.
What is the Average Family Size in White Center
Average Family Size in White Center is 3.1 People.
What is the Average Household Size in White Center
Average Household Size in White Center is 2.6 People.
How Large is the Labor Force in White Center?
There are 8,888 People in the Labor Forcein in White Center.
What is the Percentage of People in the Labor Force in White Center?
71.1% of People are in the Labor Force in White Center.
What is the Unemployment Rate in White Center?
Unemployment Rate in White Center is 5.6%.