Winthrop, WA Map & Demographics
Winthrop Map
Winthrop Overview
$43,202
PER CAPITA INCOME
$80,417
AVG FAMILY INCOME
$60,263
AVG HOUSEHOLD INCOME
0.47
INEQUALITY / GINI INDEX
408
TOTAL POPULATION
222
MALE POPULATION
186
FEMALE POPULATION
119.35
MALES / 100 FEMALES
83.78
FEMALES / 100 MALES
38.5
MEDIAN AGE
3.2
AVG FAMILY SIZE
2.2
AVG HOUSEHOLD SIZE
199
LABOR FORCE [ PEOPLE ]
64.6%
PERCENT IN LABOR FORCE
1.5%
UNEMPLOYMENT RATE
Winthrop Zip Codes
Winthrop Area Codes
Income in Winthrop
Income Overview in Winthrop
Per Capita Income in Winthrop is $43,202, while median incomes of families and households are $80,417 and $60,263 respectively.
| Characteristic | Number | Measure |
| Per Capita Income | 408 | $43,202 |
| Median Family Income | 89 | $80,417 |
| Mean Family Income | 89 | $148,620 |
| Median Household Income | 184 | $60,263 |
| Mean Household Income | 184 | $101,233 |
| Income Deficit | 89 | $0 |
| Wage / Income Gap (%) | 408 | 0.00% |
| Wage / Income Gap ($) | 408 | 100.00¢ per $1 |
| Gini / Inequality Index | 408 | 0.47 |
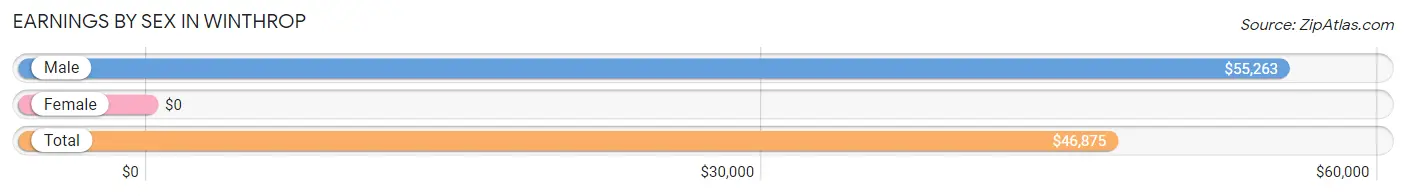
Earnings by Sex in Winthrop
| Sex | Number | Average Earnings |
| Male | 144 (62.3%) | $55,263 |
| Female | 87 (37.7%) | $0 |
| Total | 231 (100.0%) | $46,875 |
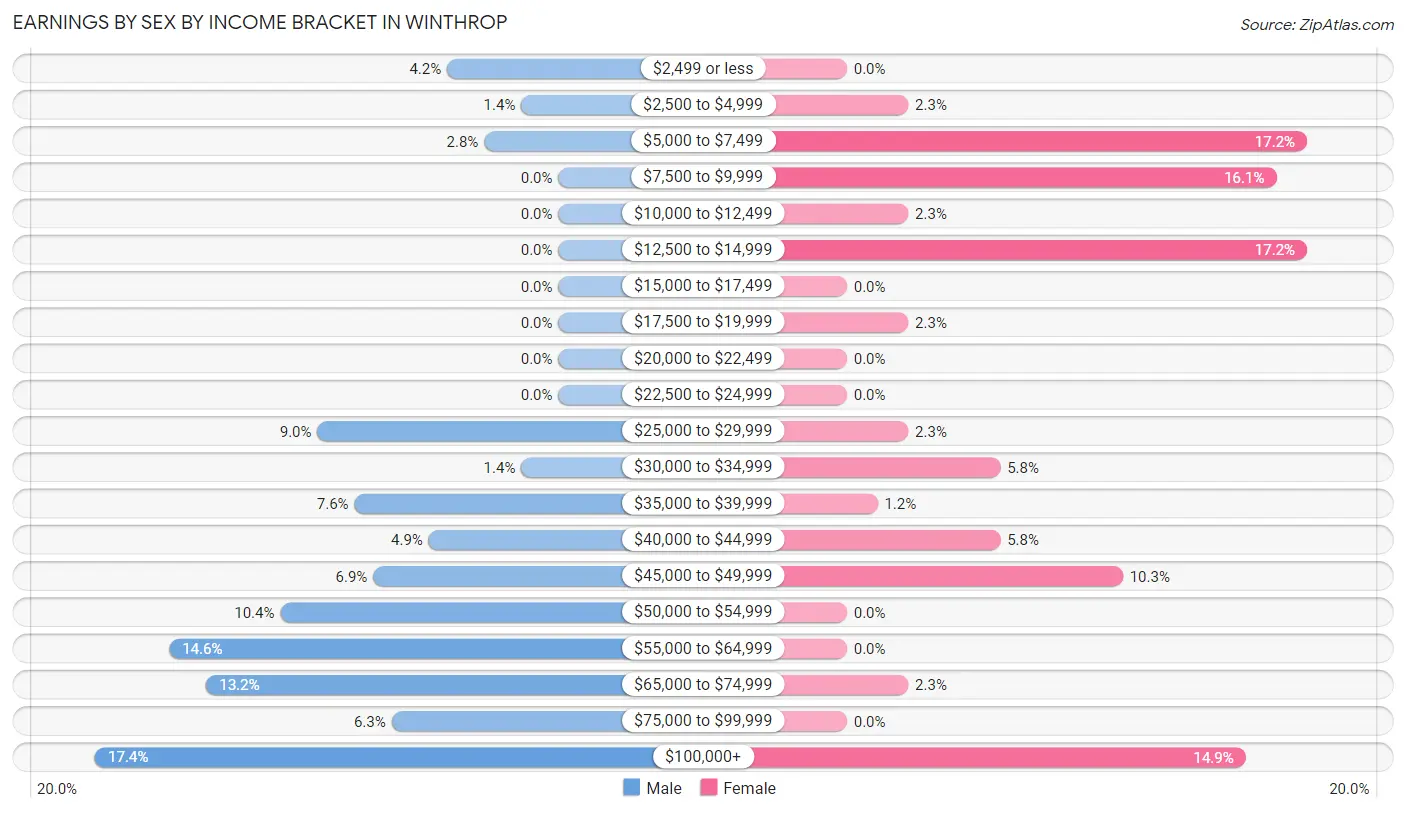
Earnings by Sex by Income Bracket in Winthrop
The most common earnings brackets in Winthrop are $100,000+ for men (25 | 17.4%) and $5,000 to $7,499 for women (15 | 17.2%).
| Income | Male | Female |
| $2,499 or less | 6 (4.2%) | 0 (0.0%) |
| $2,500 to $4,999 | 2 (1.4%) | 2 (2.3%) |
| $5,000 to $7,499 | 4 (2.8%) | 15 (17.2%) |
| $7,500 to $9,999 | 0 (0.0%) | 14 (16.1%) |
| $10,000 to $12,499 | 0 (0.0%) | 2 (2.3%) |
| $12,500 to $14,999 | 0 (0.0%) | 15 (17.2%) |
| $15,000 to $17,499 | 0 (0.0%) | 0 (0.0%) |
| $17,500 to $19,999 | 0 (0.0%) | 2 (2.3%) |
| $20,000 to $22,499 | 0 (0.0%) | 0 (0.0%) |
| $22,500 to $24,999 | 0 (0.0%) | 0 (0.0%) |
| $25,000 to $29,999 | 13 (9.0%) | 2 (2.3%) |
| $30,000 to $34,999 | 2 (1.4%) | 5 (5.8%) |
| $35,000 to $39,999 | 11 (7.6%) | 1 (1.1%) |
| $40,000 to $44,999 | 7 (4.9%) | 5 (5.8%) |
| $45,000 to $49,999 | 10 (6.9%) | 9 (10.3%) |
| $50,000 to $54,999 | 15 (10.4%) | 0 (0.0%) |
| $55,000 to $64,999 | 21 (14.6%) | 0 (0.0%) |
| $65,000 to $74,999 | 19 (13.2%) | 2 (2.3%) |
| $75,000 to $99,999 | 9 (6.2%) | 0 (0.0%) |
| $100,000+ | 25 (17.4%) | 13 (14.9%) |
| Total | 144 (100.0%) | 87 (100.0%) |
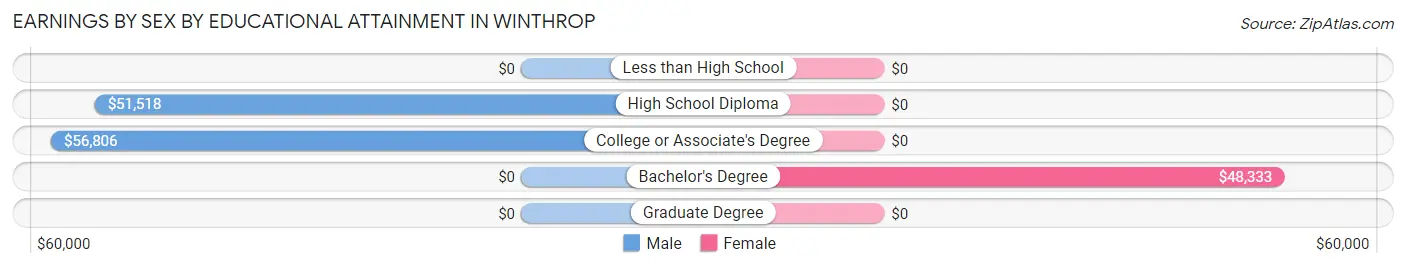
Earnings by Sex by Educational Attainment in Winthrop
| Educational Attainment | Male Income | Female Income |
| Less than High School | - | - |
| High School Diploma | $51,518 | $0 |
| College or Associate's Degree | $56,806 | $0 |
| Bachelor's Degree | - | - |
| Graduate Degree | - | - |
| Total | $55,789 | $0 |
Family Income in Winthrop
Family Income Brackets in Winthrop
According to the Winthrop family income data, there are 33 families falling into the $50,000 to $74,999 income range, which is the most common income bracket and makes up 37.1% of all families.
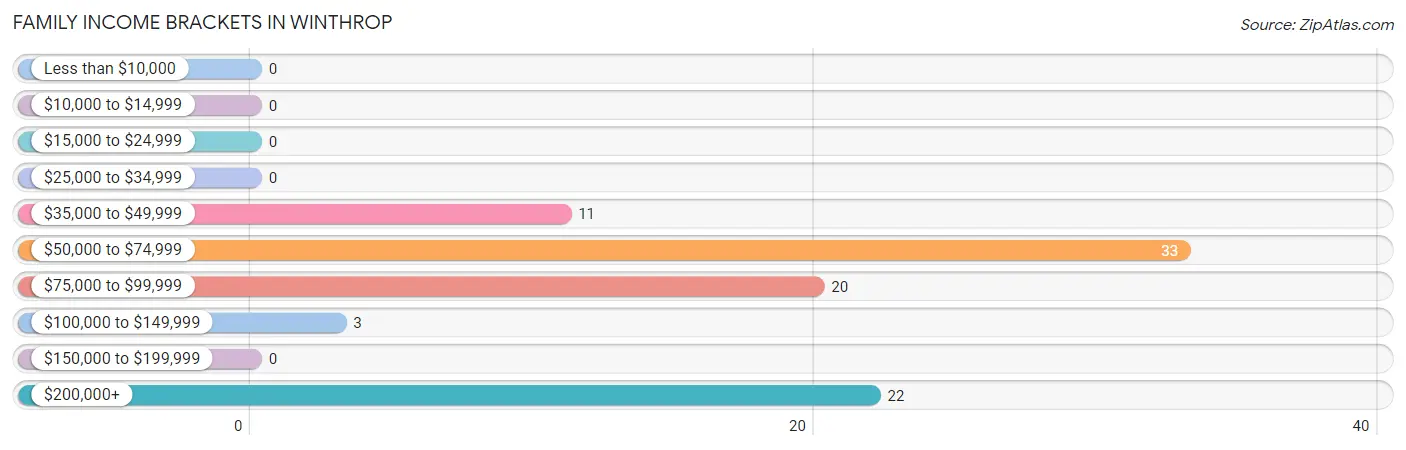
| Income Bracket | # Families | % Families |
| Less than $10,000 | 0 | 0.0% |
| $10,000 to $14,999 | 0 | 0.0% |
| $15,000 to $24,999 | 0 | 0.0% |
| $25,000 to $34,999 | 0 | 0.0% |
| $35,000 to $49,999 | 11 | 12.4% |
| $50,000 to $74,999 | 33 | 37.1% |
| $75,000 to $99,999 | 20 | 22.5% |
| $100,000 to $149,999 | 3 | 3.4% |
| $150,000 to $199,999 | 0 | 0.0% |
| $200,000+ | 22 | 24.7% |
Family Income by Famaliy Size in Winthrop
4-person families (11 | 12.4%) account for the highest median family income in Winthrop with $250,001 per family, while 4-person families (11 | 12.4%) have the highest median income of $62,500 per family member.
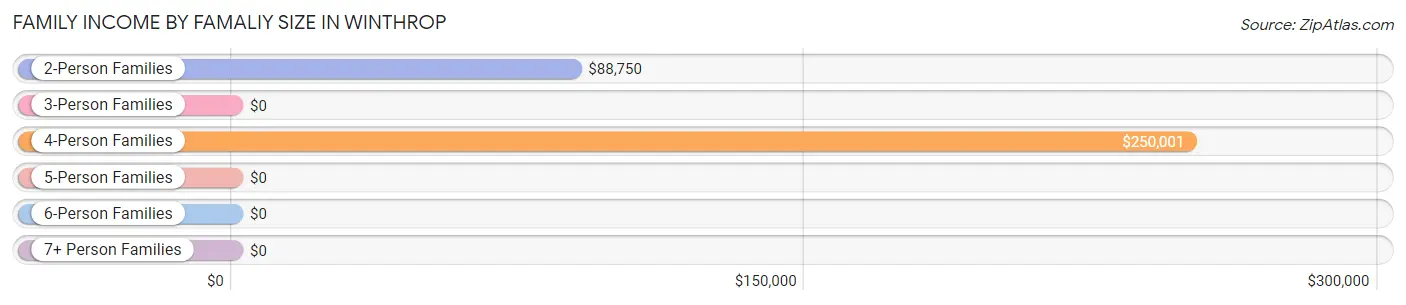
| Income Bracket | # Families | Median Income |
| 2-Person Families | 58 (65.2%) | $88,750 |
| 3-Person Families | 3 (3.4%) | $0 |
| 4-Person Families | 11 (12.4%) | $250,001 |
| 5-Person Families | 9 (10.1%) | $0 |
| 6-Person Families | 8 (9.0%) | $0 |
| 7+ Person Families | 0 (0.0%) | $0 |
| Total | 89 (100.0%) | $80,417 |
Family Income by Number of Earners in Winthrop
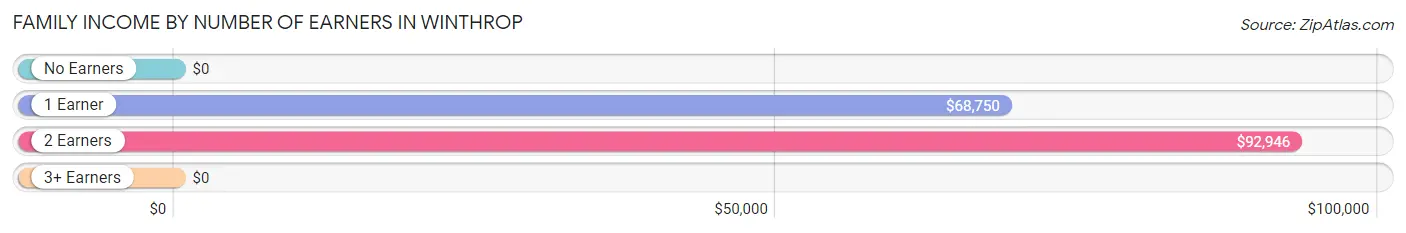
| Number of Earners | # Families | Median Income |
| No Earners | 2 (2.2%) | $0 |
| 1 Earner | 14 (15.7%) | $68,750 |
| 2 Earners | 73 (82.0%) | $92,946 |
| 3+ Earners | 0 (0.0%) | $0 |
| Total | 89 (100.0%) | $80,417 |
Household Income in Winthrop
Household Income Brackets in Winthrop
With 77 households falling in the category, the $50,000 to $74,999 income range is the most frequent in Winthrop, accounting for 41.8% of all households.
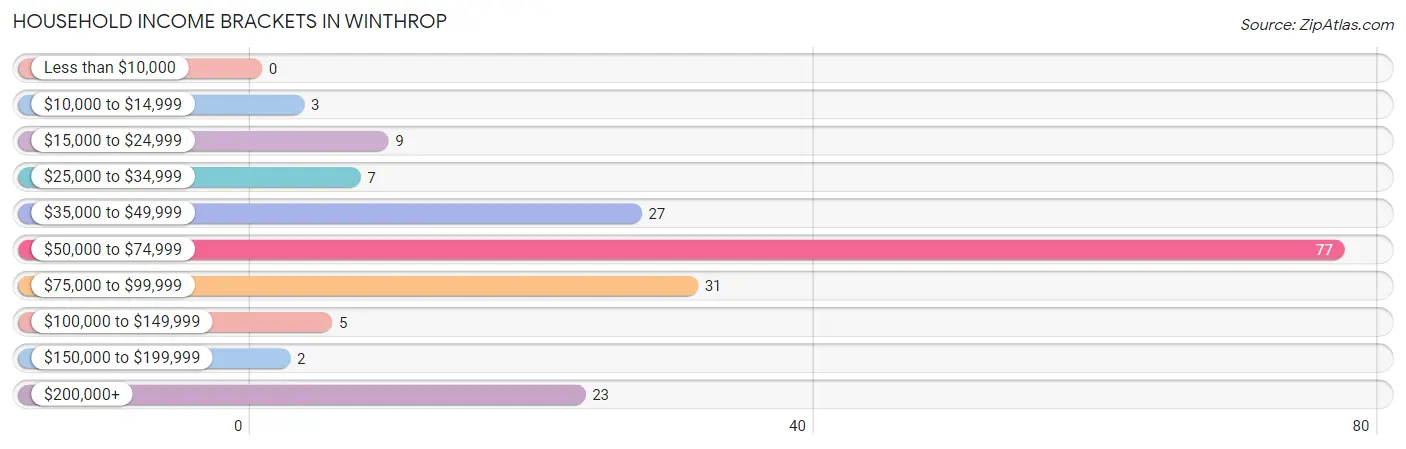
| Income Bracket | # Households | % Households |
| Less than $10,000 | 0 | 0.0% |
| $10,000 to $14,999 | 3 | 1.6% |
| $15,000 to $24,999 | 9 | 4.9% |
| $25,000 to $34,999 | 7 | 3.8% |
| $35,000 to $49,999 | 27 | 14.7% |
| $50,000 to $74,999 | 77 | 41.8% |
| $75,000 to $99,999 | 31 | 16.8% |
| $100,000 to $149,999 | 5 | 2.7% |
| $150,000 to $199,999 | 2 | 1.1% |
| $200,000+ | 23 | 12.5% |
Household Income by Householder Age in Winthrop
The median household income in Winthrop is $60,263, with the highest median household income of $61,645 found in the 25 to 44 years age bracket for the primary householder. A total of 67 households (36.4%) fall into this category.
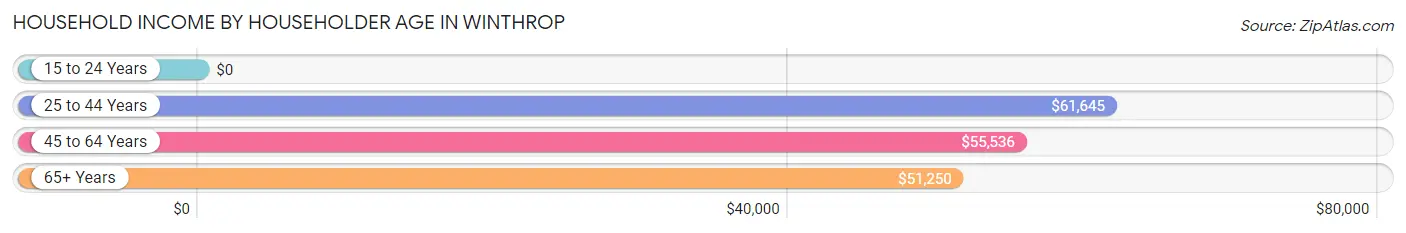
| Income Bracket | # Households | Median Income |
| 15 to 24 Years | 0 (0.0%) | $0 |
| 25 to 44 Years | 67 (36.4%) | $61,645 |
| 45 to 64 Years | 79 (42.9%) | $55,536 |
| 65+ Years | 38 (20.6%) | $51,250 |
| Total | 184 (100.0%) | $60,263 |
Poverty in Winthrop
Income Below Poverty by Sex and Age in Winthrop
With 2.3% poverty level for males and 4.3% for females among the residents of Winthrop, 75 year old and over males and 35 to 44 year old females are the most vulnerable to poverty, with 3 males (25.0%) and 5 females (19.2%) in their respective age groups living below the poverty level.
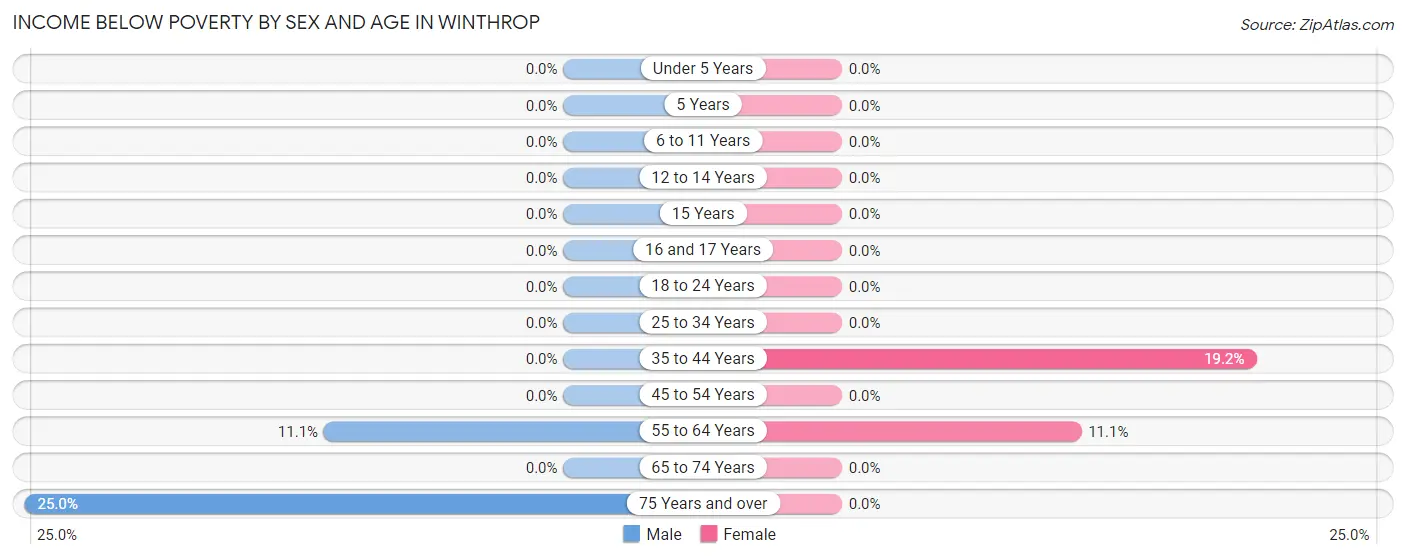
| Age Bracket | Male | Female |
| Under 5 Years | 0 (0.0%) | 0 (0.0%) |
| 5 Years | 0 (0.0%) | 0 (0.0%) |
| 6 to 11 Years | 0 (0.0%) | 0 (0.0%) |
| 12 to 14 Years | 0 (0.0%) | 0 (0.0%) |
| 15 Years | 0 (0.0%) | 0 (0.0%) |
| 16 and 17 Years | 0 (0.0%) | 0 (0.0%) |
| 18 to 24 Years | 0 (0.0%) | 0 (0.0%) |
| 25 to 34 Years | 0 (0.0%) | 0 (0.0%) |
| 35 to 44 Years | 0 (0.0%) | 5 (19.2%) |
| 45 to 54 Years | 0 (0.0%) | 0 (0.0%) |
| 55 to 64 Years | 2 (11.1%) | 3 (11.1%) |
| 65 to 74 Years | 0 (0.0%) | 0 (0.0%) |
| 75 Years and over | 3 (25.0%) | 0 (0.0%) |
| Total | 5 (2.3%) | 8 (4.3%) |
Income Above Poverty by Sex and Age in Winthrop
According to the poverty statistics in Winthrop, males aged under 5 years and females aged under 5 years are the age groups that are most secure financially, with 100.0% of males and 100.0% of females in these age groups living above the poverty line.
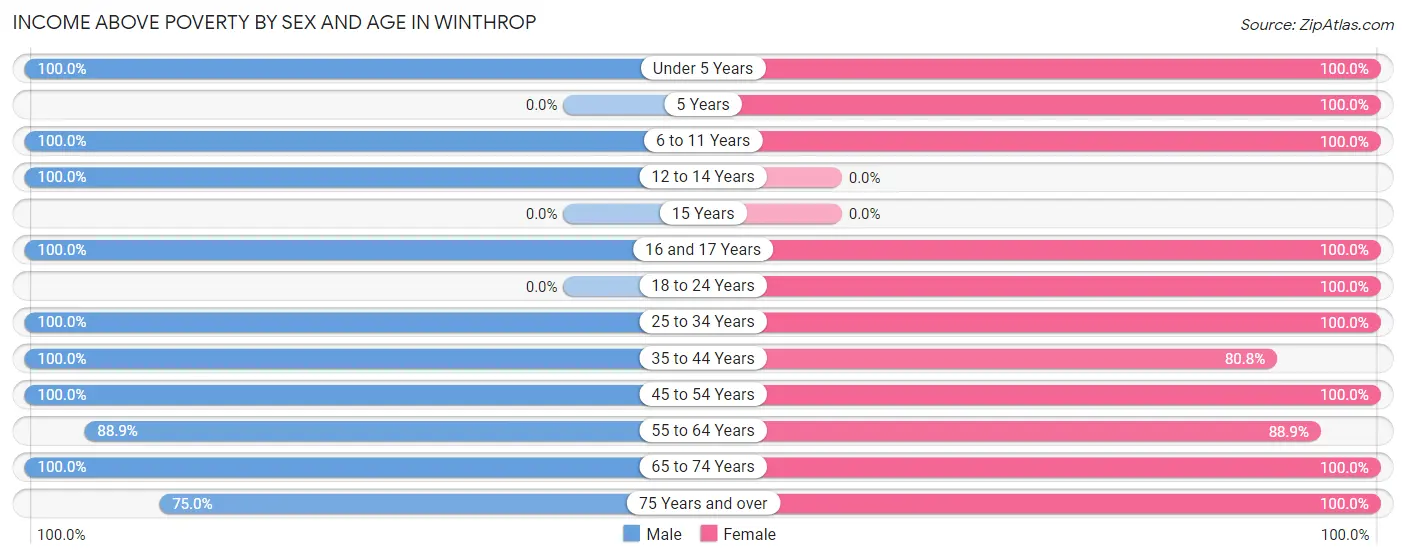
| Age Bracket | Male | Female |
| Under 5 Years | 32 (100.0%) | 6 (100.0%) |
| 5 Years | 0 (0.0%) | 6 (100.0%) |
| 6 to 11 Years | 11 (100.0%) | 35 (100.0%) |
| 12 to 14 Years | 10 (100.0%) | 0 (0.0%) |
| 15 Years | 0 (0.0%) | 0 (0.0%) |
| 16 and 17 Years | 8 (100.0%) | 5 (100.0%) |
| 18 to 24 Years | 0 (0.0%) | 12 (100.0%) |
| 25 to 34 Years | 15 (100.0%) | 15 (100.0%) |
| 35 to 44 Years | 55 (100.0%) | 21 (80.8%) |
| 45 to 54 Years | 48 (100.0%) | 28 (100.0%) |
| 55 to 64 Years | 16 (88.9%) | 24 (88.9%) |
| 65 to 74 Years | 8 (100.0%) | 10 (100.0%) |
| 75 Years and over | 9 (75.0%) | 16 (100.0%) |
| Total | 212 (97.7%) | 178 (95.7%) |
Income Below Poverty Among Married-Couple Families in Winthrop
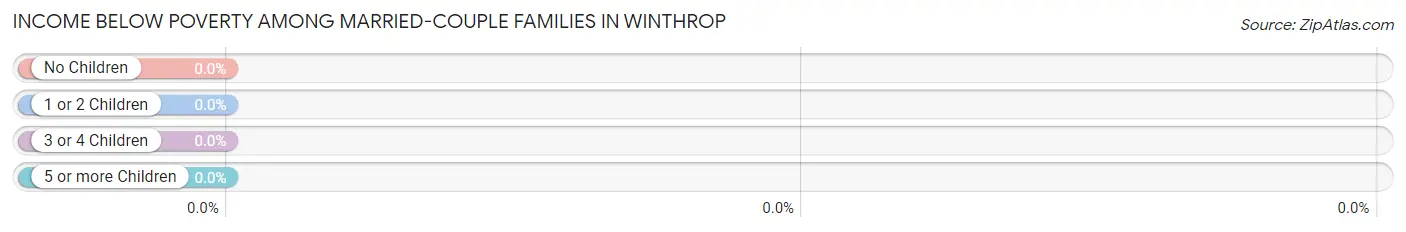
| Children | Above Poverty | Below Poverty |
| No Children | 47 (100.0%) | 0 (0.0%) |
| 1 or 2 Children | 14 (100.0%) | 0 (0.0%) |
| 3 or 4 Children | 17 (100.0%) | 0 (0.0%) |
| 5 or more Children | 0 (0.0%) | 0 (0.0%) |
| Total | 78 (100.0%) | 0 (0.0%) |
Income Below Poverty Among Single-Parent Households in Winthrop
| Children | Single Father | Single Mother |
| No Children | 0 (0.0%) | 0 (0.0%) |
| 1 or 2 Children | 0 (0.0%) | 0 (0.0%) |
| 3 or 4 Children | 0 (0.0%) | 0 (0.0%) |
| 5 or more Children | 0 (0.0%) | 0 (0.0%) |
| Total | 0 (0.0%) | 0 (0.0%) |
Income Below Poverty Among Married-Couple vs Single-Parent Households in Winthrop
| Children | Married-Couple Families | Single-Parent Households |
| No Children | 0 (0.0%) | 0 (0.0%) |
| 1 or 2 Children | 0 (0.0%) | 0 (0.0%) |
| 3 or 4 Children | 0 (0.0%) | 0 (0.0%) |
| 5 or more Children | 0 (0.0%) | 0 (0.0%) |
| Total | 0 (0.0%) | 0 (0.0%) |
Race in Winthrop
The most populous races in Winthrop are White / Caucasian (247 | 60.5%), Two or more Races (145 | 35.5%), and Hispanic or Latino (135 | 33.1%).
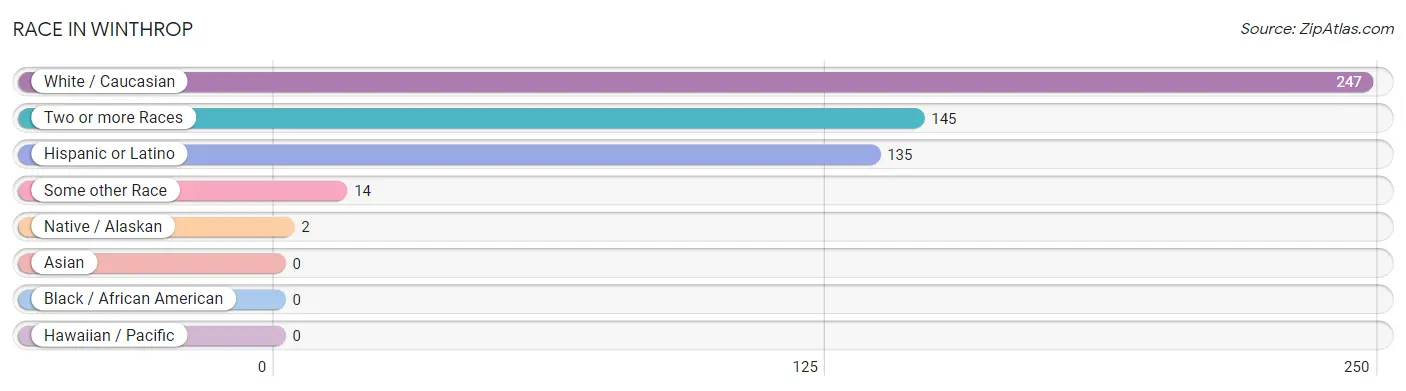
| Race | # Population | % Population |
| Asian | 0 | 0.0% |
| Black / African American | 0 | 0.0% |
| Hawaiian / Pacific | 0 | 0.0% |
| Hispanic or Latino | 135 | 33.1% |
| Native / Alaskan | 2 | 0.5% |
| White / Caucasian | 247 | 60.5% |
| Two or more Races | 145 | 35.5% |
| Some other Race | 14 | 3.4% |
| Total | 408 | 100.0% |
Ancestry in Winthrop
The most populous ancestries reported in Winthrop are Mexican (126 | 30.9%), English (111 | 27.2%), Apache (51 | 12.5%), German (43 | 10.5%), and Irish (32 | 7.8%), together accounting for 89.0% of all Winthrop residents.
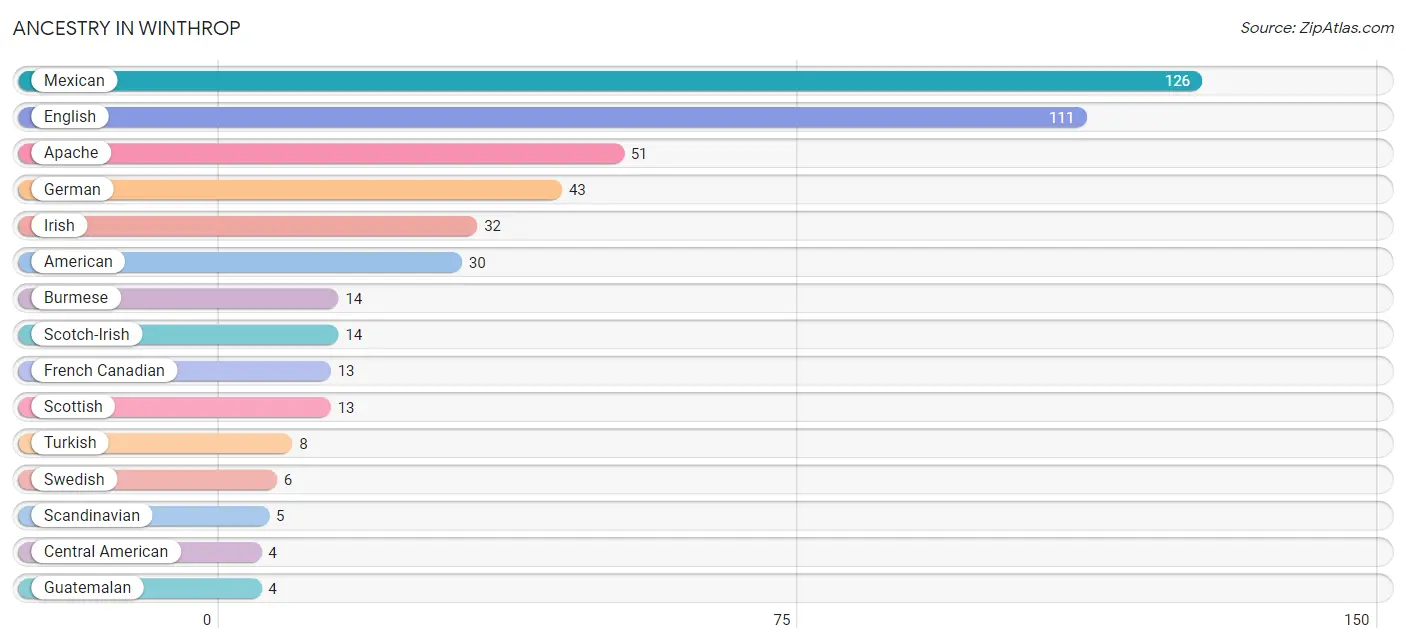
| Ancestry | # Population | % Population |
| Alaska Native | 2 | 0.5% |
| American | 30 | 7.3% |
| Apache | 51 | 12.5% |
| Basque | 2 | 0.5% |
| British | 2 | 0.5% |
| Burmese | 14 | 3.4% |
| Central American | 4 | 1.0% |
| Dutch | 1 | 0.3% |
| English | 111 | 27.2% |
| Finnish | 2 | 0.5% |
| French Canadian | 13 | 3.2% |
| German | 43 | 10.5% |
| Guatemalan | 4 | 1.0% |
| Icelander | 2 | 0.5% |
| Irish | 32 | 7.8% |
| Italian | 2 | 0.5% |
| Mexican | 126 | 30.9% |
| Norwegian | 3 | 0.7% |
| Polish | 1 | 0.3% |
| Scandinavian | 5 | 1.2% |
| Scotch-Irish | 14 | 3.4% |
| Scottish | 13 | 3.2% |
| Swedish | 6 | 1.5% |
| Swiss | 3 | 0.7% |
| Turkish | 8 | 2.0% | View All 25 Rows |
Immigrants in Winthrop
The most numerous immigrant groups reported in Winthrop came from Central America (24 | 5.9%), Latin America (24 | 5.9%), Mexico (23 | 5.6%), Asia (14 | 3.4%), and Eastern Asia (14 | 3.4%), together accounting for 24.3% of all Winthrop residents.
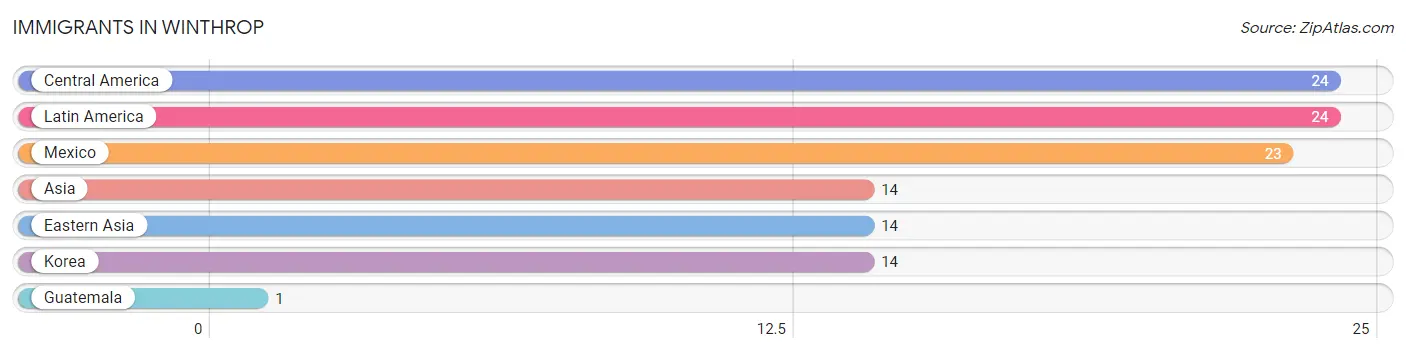
| Immigration Origin | # Population | % Population |
| Asia | 14 | 3.4% |
| Central America | 24 | 5.9% |
| Eastern Asia | 14 | 3.4% |
| Guatemala | 1 | 0.3% |
| Korea | 14 | 3.4% |
| Latin America | 24 | 5.9% |
| Mexico | 23 | 5.6% | View All 7 Rows |
Sex and Age in Winthrop
Sex and Age in Winthrop
The most populous age groups in Winthrop are 35 to 39 Years (38 | 17.1%) for men and 5 to 9 Years (29 | 15.6%) for women.
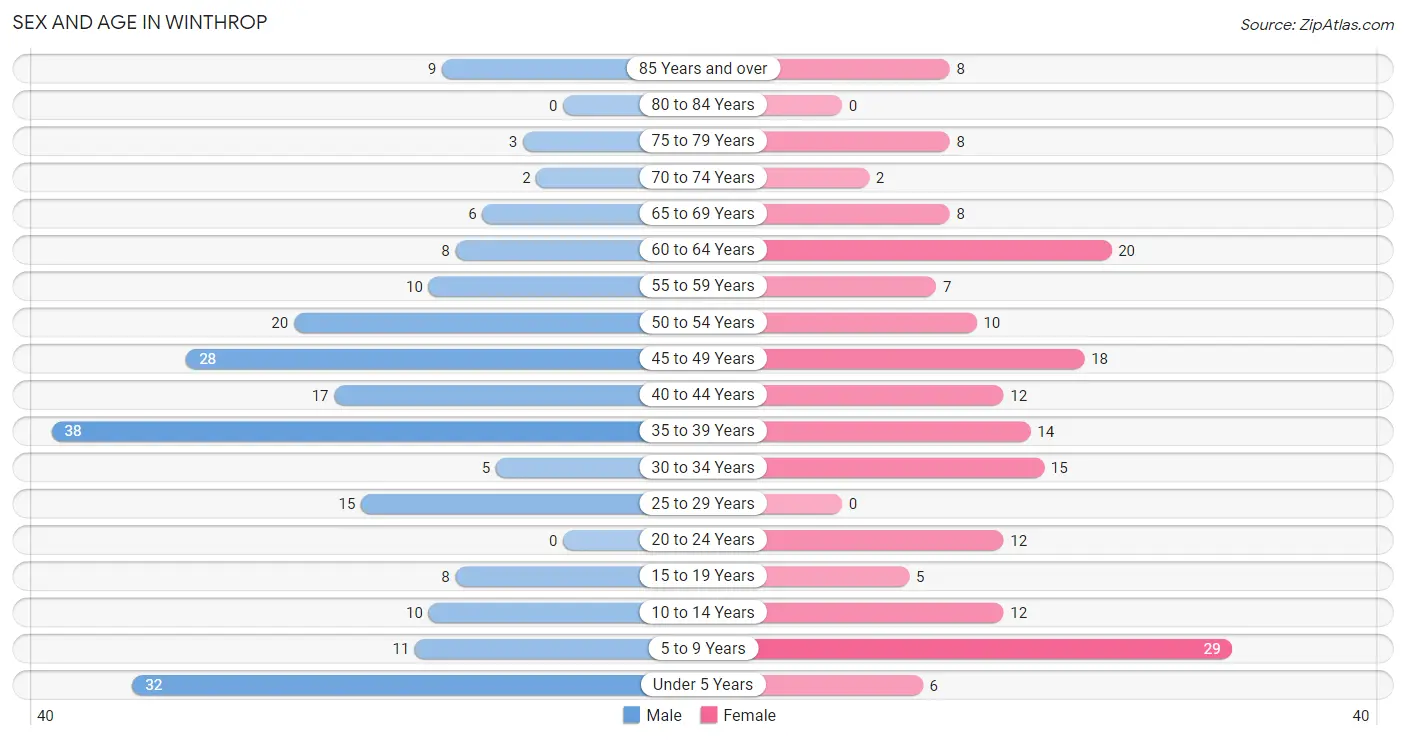
| Age Bracket | Male | Female |
| Under 5 Years | 32 (14.4%) | 6 (3.2%) |
| 5 to 9 Years | 11 (5.0%) | 29 (15.6%) |
| 10 to 14 Years | 10 (4.5%) | 12 (6.5%) |
| 15 to 19 Years | 8 (3.6%) | 5 (2.7%) |
| 20 to 24 Years | 0 (0.0%) | 12 (6.5%) |
| 25 to 29 Years | 15 (6.8%) | 0 (0.0%) |
| 30 to 34 Years | 5 (2.2%) | 15 (8.1%) |
| 35 to 39 Years | 38 (17.1%) | 14 (7.5%) |
| 40 to 44 Years | 17 (7.7%) | 12 (6.5%) |
| 45 to 49 Years | 28 (12.6%) | 18 (9.7%) |
| 50 to 54 Years | 20 (9.0%) | 10 (5.4%) |
| 55 to 59 Years | 10 (4.5%) | 7 (3.8%) |
| 60 to 64 Years | 8 (3.6%) | 20 (10.7%) |
| 65 to 69 Years | 6 (2.7%) | 8 (4.3%) |
| 70 to 74 Years | 2 (0.9%) | 2 (1.1%) |
| 75 to 79 Years | 3 (1.3%) | 8 (4.3%) |
| 80 to 84 Years | 0 (0.0%) | 0 (0.0%) |
| 85 Years and over | 9 (4.1%) | 8 (4.3%) |
| Total | 222 (100.0%) | 186 (100.0%) |
Families and Households in Winthrop
Median Family Size in Winthrop
The median family size in Winthrop is 3.20 persons per family, with married-couple families (78 | 87.6%) accounting for the largest median family size of 3.37 persons per family. On the other hand, single male/father families (9 | 10.1%) represent the smallest median family size with 2.00 persons per family.
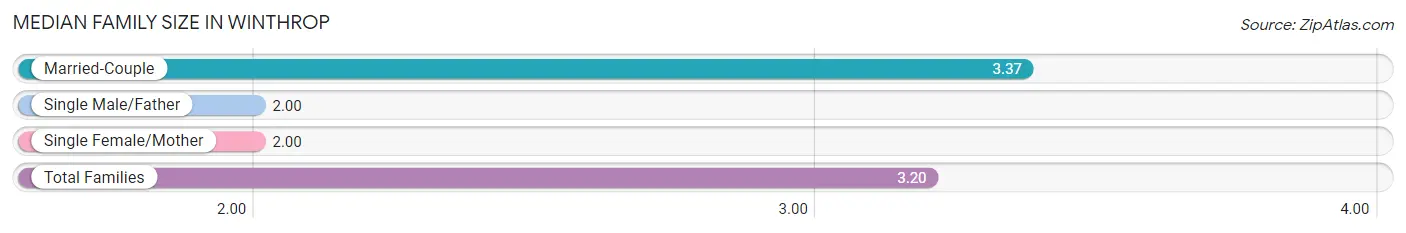
| Family Type | # Families | Family Size |
| Married-Couple | 78 (87.6%) | 3.37 |
| Single Male/Father | 9 (10.1%) | 2.00 |
| Single Female/Mother | 2 (2.2%) | 2.00 |
| Total Families | 89 (100.0%) | 3.20 |
Median Household Size in Winthrop
The median household size in Winthrop is 2.19 persons per household, with married-couple households (78 | 42.4%) accounting for the largest median household size of 3.37 persons per household. non-family households (95 | 51.6%) represent the smallest median household size with 1.22 persons per household.
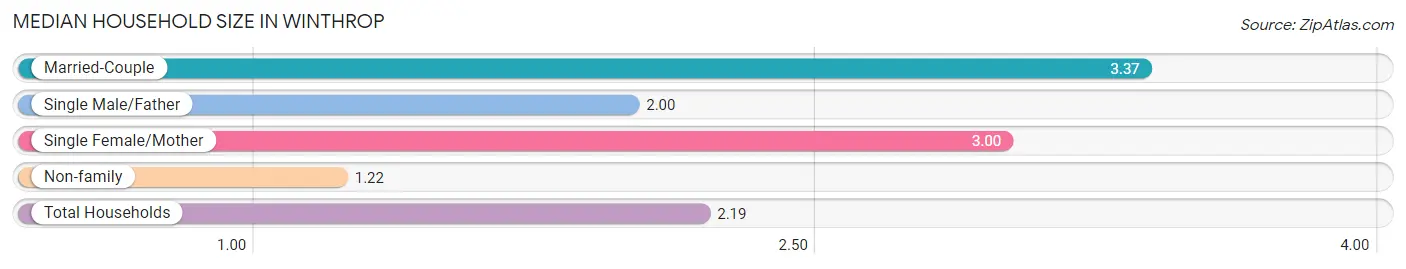
| Household Type | # Households | Household Size |
| Married-Couple | 78 (42.4%) | 3.37 |
| Single Male/Father | 9 (4.9%) | 2.00 |
| Single Female/Mother | 2 (1.1%) | 3.00 |
| Non-family | 95 (51.6%) | 1.22 |
| Total Households | 184 (100.0%) | 2.19 |
Household Size by Marriage Status in Winthrop
Out of a total of 184 households in Winthrop, 89 (48.4%) are family households, while 95 (51.6%) are nonfamily households. The most numerous type of family households are 2-person households, comprising 56, and the most common type of nonfamily households are 1-person households, comprising 79.
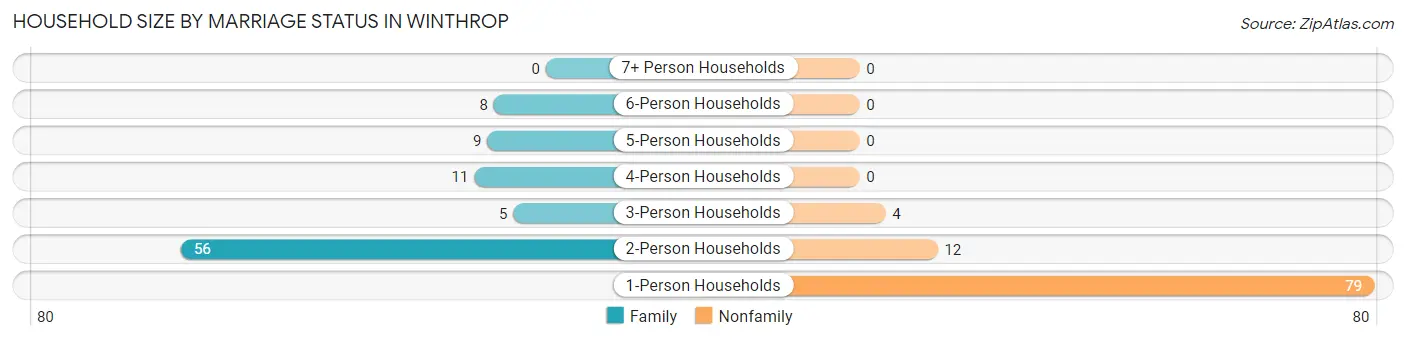
| Household Size | Family Households | Nonfamily Households |
| 1-Person Households | - | 79 (42.9%) |
| 2-Person Households | 56 (30.4%) | 12 (6.5%) |
| 3-Person Households | 5 (2.7%) | 4 (2.2%) |
| 4-Person Households | 11 (6.0%) | 0 (0.0%) |
| 5-Person Households | 9 (4.9%) | 0 (0.0%) |
| 6-Person Households | 8 (4.3%) | 0 (0.0%) |
| 7+ Person Households | 0 (0.0%) | 0 (0.0%) |
| Total | 89 (48.4%) | 95 (51.6%) |
Female Fertility in Winthrop
Fertility by Age in Winthrop
Average fertility rate in Winthrop is 158.0 births per 1,000 women. Women in the age bracket of 20 to 34 years have the highest fertility rate with 444.0 births per 1,000 women. Women in the age bracket of 20 to 34 years acount for 100.0% of all women with births.
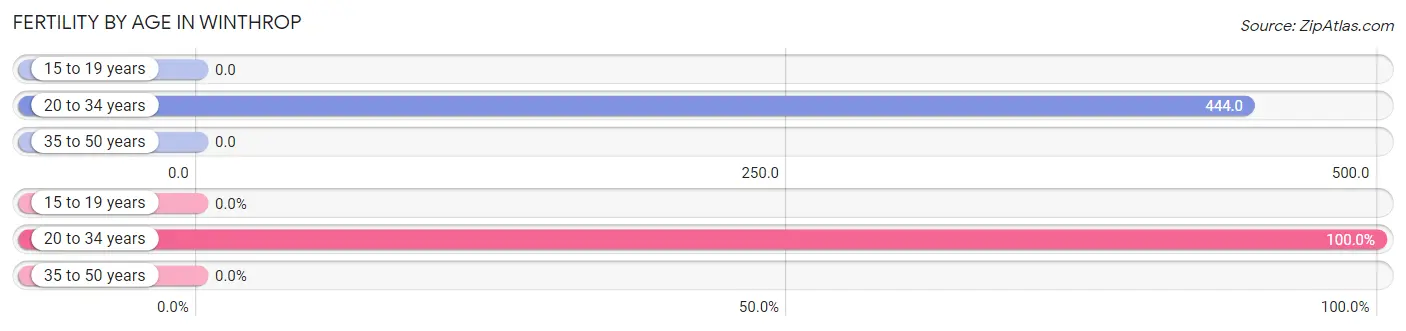
| Age Bracket | Women with Births | Births / 1,000 Women |
| 15 to 19 years | 0 (0.0%) | 0.0 |
| 20 to 34 years | 12 (100.0%) | 444.0 |
| 35 to 50 years | 0 (0.0%) | 0.0 |
| Total | 12 (100.0%) | 158.0 |
Fertility by Age by Marriage Status in Winthrop
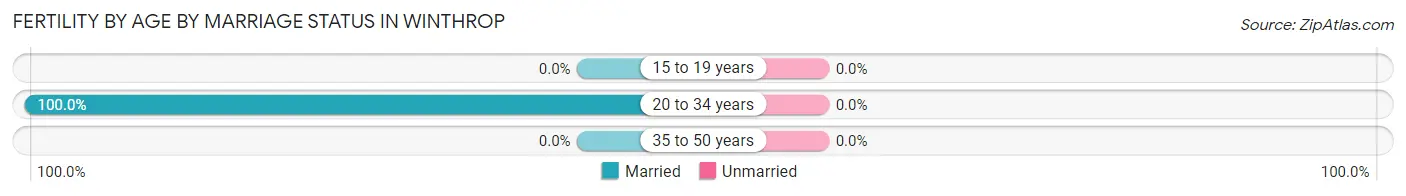
| Age Bracket | Married | Unmarried |
| 15 to 19 years | 0 (0.0%) | 0 (0.0%) |
| 20 to 34 years | 12 (100.0%) | 0 (0.0%) |
| 35 to 50 years | 0 (0.0%) | 0 (0.0%) |
| Total | 12 (100.0%) | 0 (0.0%) |
Fertility by Education in Winthrop
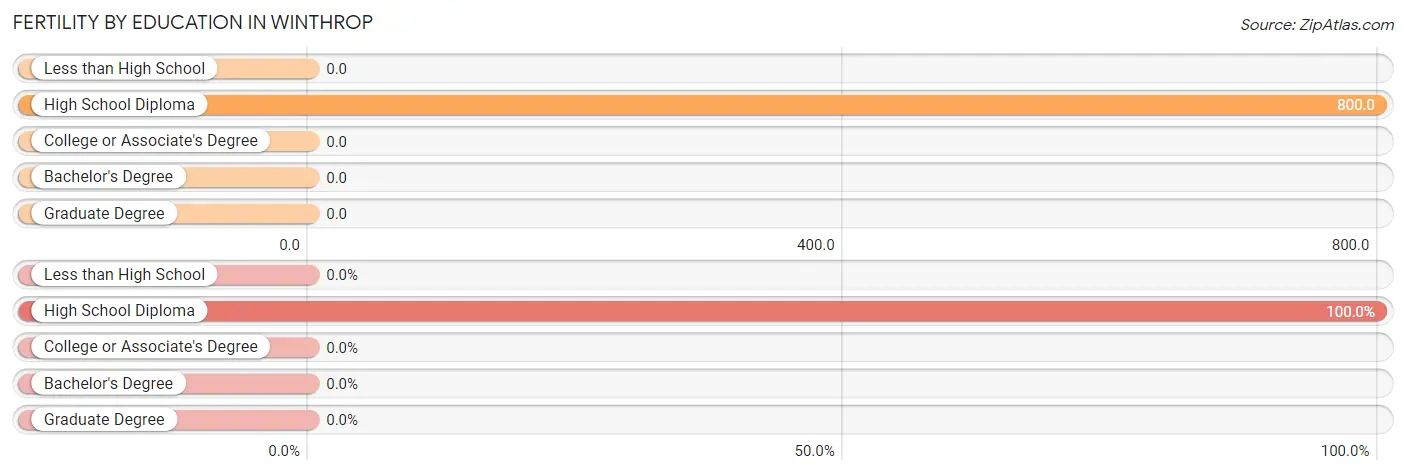
| Educational Attainment | Women with Births | Births / 1,000 Women |
| Less than High School | 0 (0.0%) | 0.0 |
| High School Diploma | 12 (100.0%) | 800.0 |
| College or Associate's Degree | 0 (0.0%) | 0.0 |
| Bachelor's Degree | 0 (0.0%) | 0.0 |
| Graduate Degree | 0 (0.0%) | 0.0 |
| Total | 12 (100.0%) | 158.0 |
Fertility by Education by Marriage Status in Winthrop
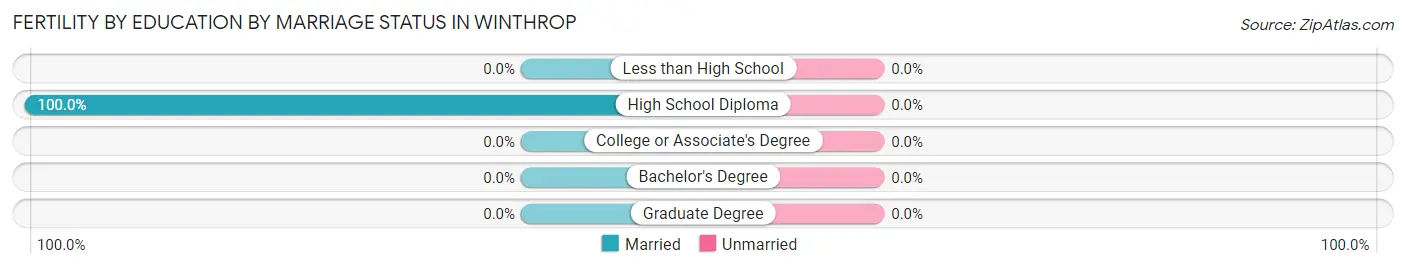
| Educational Attainment | Married | Unmarried |
| Less than High School | 0 (0.0%) | 0 (0.0%) |
| High School Diploma | 12 (100.0%) | 0 (0.0%) |
| College or Associate's Degree | 0 (0.0%) | 0 (0.0%) |
| Bachelor's Degree | 0 (0.0%) | 0 (0.0%) |
| Graduate Degree | 0 (0.0%) | 0 (0.0%) |
| Total | 12 (100.0%) | 0 (0.0%) |
Employment Characteristics in Winthrop
Employment by Class of Employer in Winthrop
Among the 178 employed individuals in Winthrop, private company employees (89 | 50.0%), self-employed (incorporated) (34 | 19.1%), and state government employees (21 | 11.8%) make up the most common classes of employment.
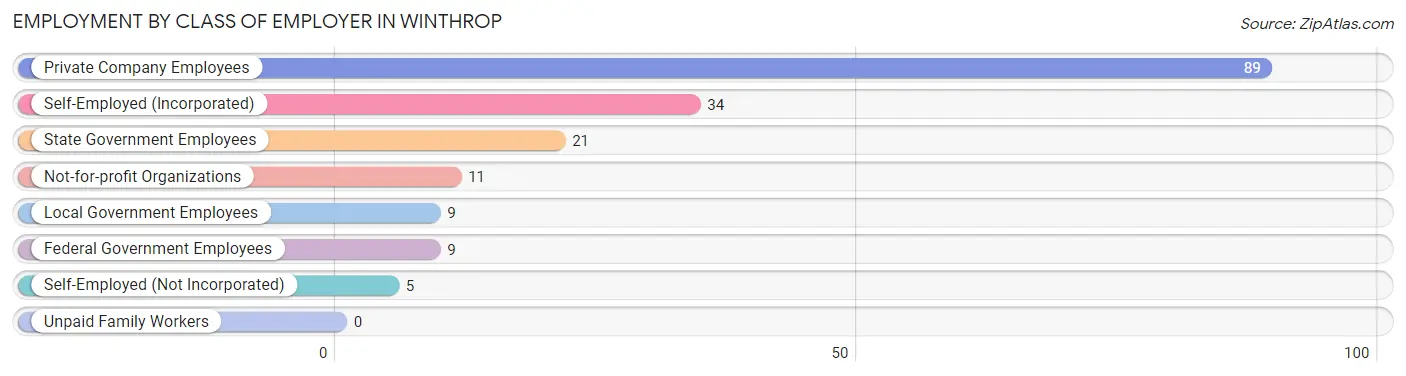
| Employer Class | # Employees | % Employees |
| Private Company Employees | 89 | 50.0% |
| Self-Employed (Incorporated) | 34 | 19.1% |
| Self-Employed (Not Incorporated) | 5 | 2.8% |
| Not-for-profit Organizations | 11 | 6.2% |
| Local Government Employees | 9 | 5.1% |
| State Government Employees | 21 | 11.8% |
| Federal Government Employees | 9 | 5.1% |
| Unpaid Family Workers | 0 | 0.0% |
| Total | 178 | 100.0% |
Employment Status by Age in Winthrop
According to the labor force statistics for Winthrop, out of the total population over 16 years of age (308), 64.6% or 199 individuals are in the labor force, with 1.5% or 3 of them unemployed. The age group with the highest labor force participation rate is 20 to 24 years, with 100.0% or 12 individuals in the labor force. Within the labor force, the 35 to 44 years age range has the highest percentage of unemployed individuals, with 4.9% or 3 of them being unemployed.
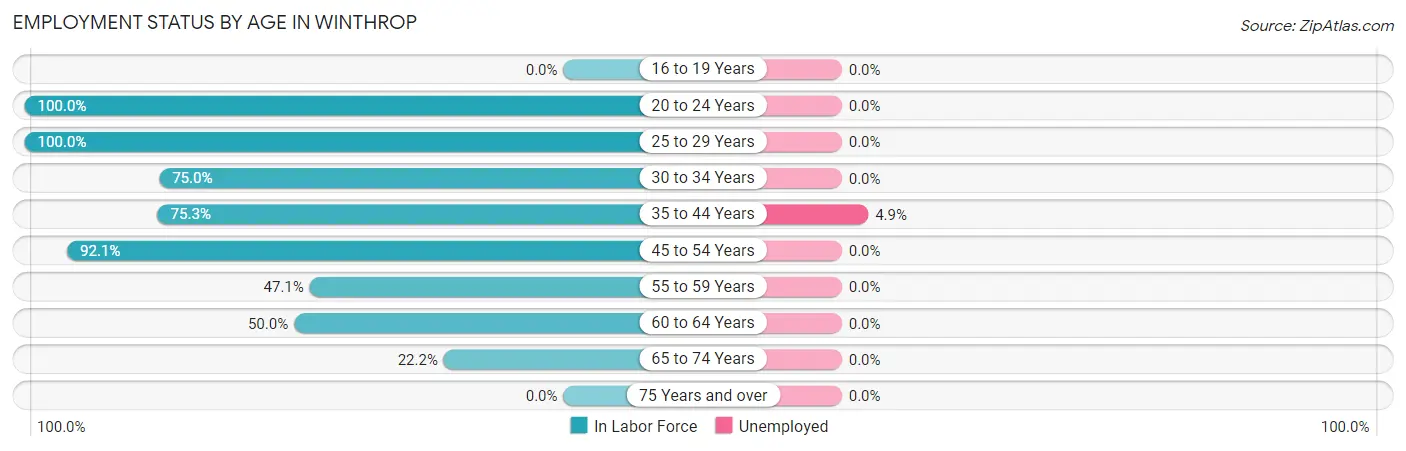
| Age Bracket | In Labor Force | Unemployed |
| 16 to 19 Years | 0 (0.0%) | 0 (0.0%) |
| 20 to 24 Years | 12 (100.0%) | 0 (0.0%) |
| 25 to 29 Years | 15 (100.0%) | 0 (0.0%) |
| 30 to 34 Years | 15 (75.0%) | 0 (0.0%) |
| 35 to 44 Years | 61 (75.3%) | 3 (4.9%) |
| 45 to 54 Years | 70 (92.1%) | 0 (0.0%) |
| 55 to 59 Years | 8 (47.1%) | 0 (0.0%) |
| 60 to 64 Years | 14 (50.0%) | 0 (0.0%) |
| 65 to 74 Years | 4 (22.2%) | 0 (0.0%) |
| 75 Years and over | 0 (0.0%) | 0 (0.0%) |
| Total | 199 (64.6%) | 3 (1.5%) |
Employment Status by Educational Attainment in Winthrop
According to labor force statistics for Winthrop, 77.2% of individuals (183) out of the total population between 25 and 64 years of age (237) are in the labor force, with 1.6% or 3 of them being unemployed. The group with the highest labor force participation rate are those with the educational attainment of high school diploma, with 86.2% or 56 individuals in the labor force. Within the labor force, individuals with college / associate degree education have the highest percentage of unemployment, with 5.5% or 3 of them being unemployed.
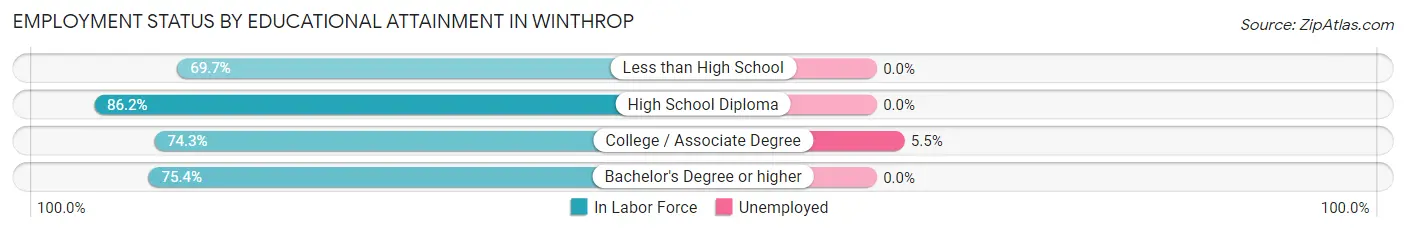
| Educational Attainment | In Labor Force | Unemployed |
| Less than High School | 23 (69.7%) | 0 (0.0%) |
| High School Diploma | 56 (86.2%) | 0 (0.0%) |
| College / Associate Degree | 55 (74.3%) | 4 (5.5%) |
| Bachelor's Degree or higher | 49 (75.4%) | 0 (0.0%) |
| Total | 183 (77.2%) | 4 (1.6%) |
Employment Occupations by Sex in Winthrop
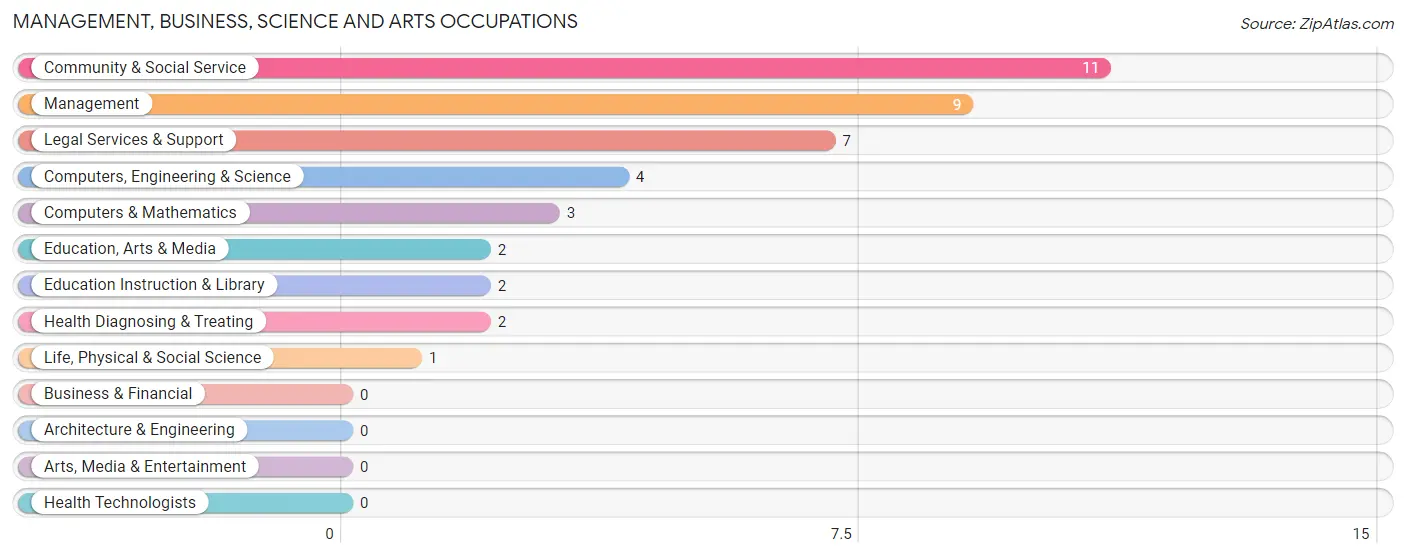
Management, Business, Science and Arts Occupations
The most common Management, Business, Science and Arts occupations in Winthrop are Community & Social Service (11 | 5.6%), Management (9 | 4.6%), Legal Services & Support (7 | 3.6%), Computers, Engineering & Science (4 | 2.0%), and Computers & Mathematics (3 | 1.5%).
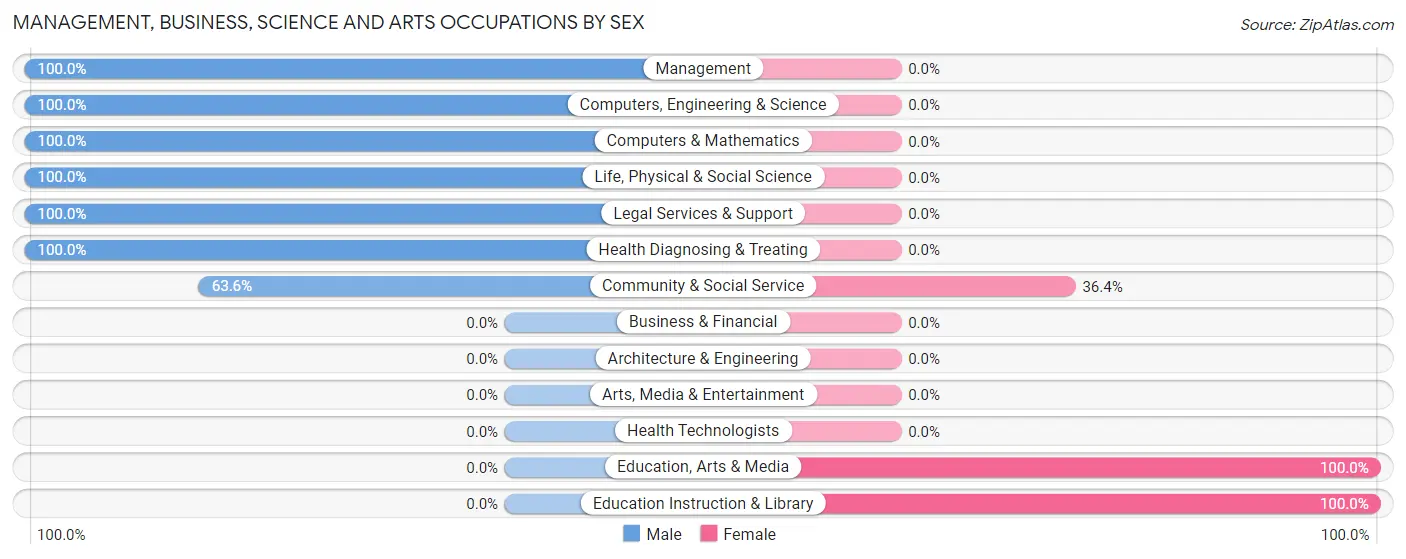
Management, Business, Science and Arts Occupations by Sex
Within the Management, Business, Science and Arts occupations in Winthrop, the most male-oriented occupations are Management (100.0%), Computers, Engineering & Science (100.0%), and Computers & Mathematics (100.0%), while the most female-oriented occupations are Education, Arts & Media (100.0%), Education Instruction & Library (100.0%), and Community & Social Service (36.4%).
| Occupation | Male | Female |
| Management | 9 (100.0%) | 0 (0.0%) |
| Business & Financial | 0 (0.0%) | 0 (0.0%) |
| Computers, Engineering & Science | 4 (100.0%) | 0 (0.0%) |
| Computers & Mathematics | 3 (100.0%) | 0 (0.0%) |
| Architecture & Engineering | 0 (0.0%) | 0 (0.0%) |
| Life, Physical & Social Science | 1 (100.0%) | 0 (0.0%) |
| Community & Social Service | 7 (63.6%) | 4 (36.4%) |
| Education, Arts & Media | 0 (0.0%) | 2 (100.0%) |
| Legal Services & Support | 7 (100.0%) | 0 (0.0%) |
| Education Instruction & Library | 0 (0.0%) | 2 (100.0%) |
| Arts, Media & Entertainment | 0 (0.0%) | 0 (0.0%) |
| Health Diagnosing & Treating | 2 (100.0%) | 0 (0.0%) |
| Health Technologists | 0 (0.0%) | 0 (0.0%) |
| Total (Category) | 22 (84.6%) | 4 (15.4%) |
| Total (Overall) | 123 (62.8%) | 73 (37.2%) |
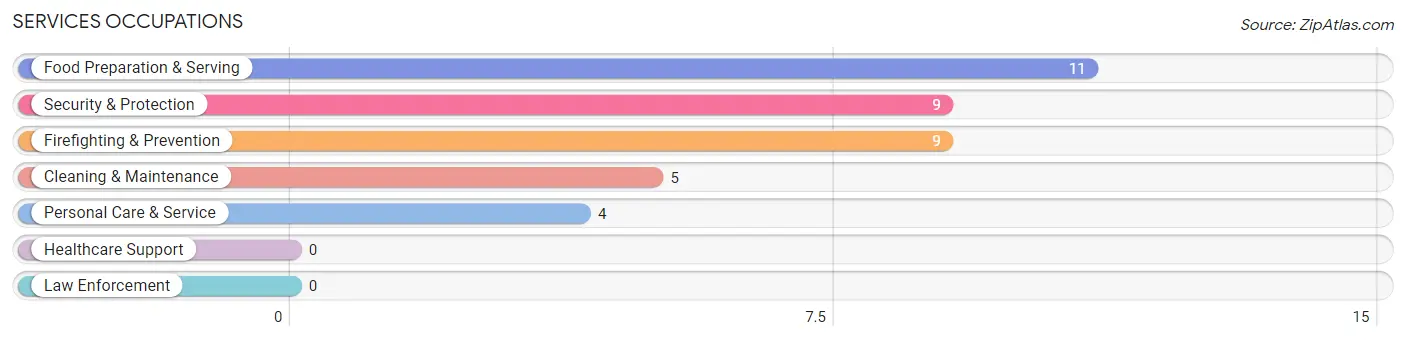
Services Occupations
The most common Services occupations in Winthrop are Food Preparation & Serving (11 | 5.6%), Security & Protection (9 | 4.6%), Firefighting & Prevention (9 | 4.6%), Cleaning & Maintenance (5 | 2.5%), and Personal Care & Service (4 | 2.0%).
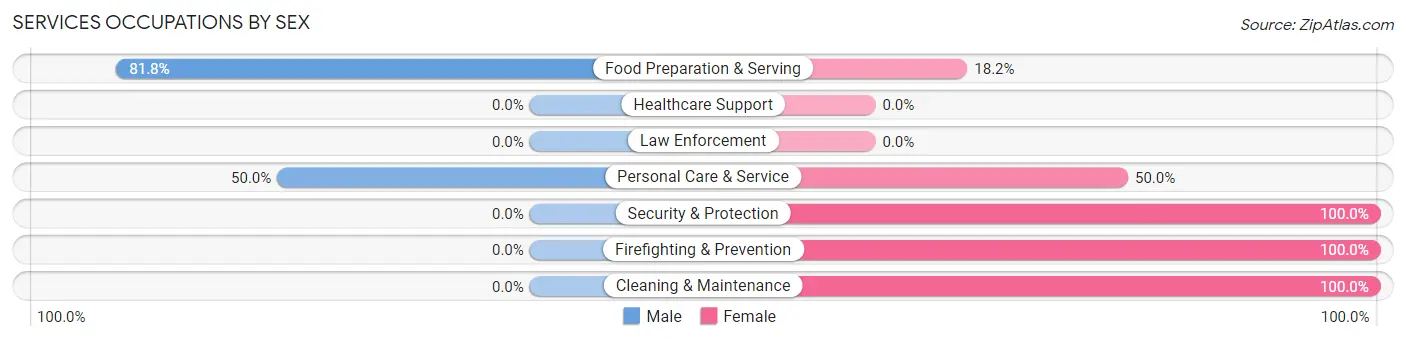
Services Occupations by Sex
Within the Services occupations in Winthrop, the most male-oriented occupations are Food Preparation & Serving (81.8%), and Personal Care & Service (50.0%), while the most female-oriented occupations are Security & Protection (100.0%), Firefighting & Prevention (100.0%), and Cleaning & Maintenance (100.0%).
| Occupation | Male | Female |
| Healthcare Support | 0 (0.0%) | 0 (0.0%) |
| Security & Protection | 0 (0.0%) | 9 (100.0%) |
| Firefighting & Prevention | 0 (0.0%) | 9 (100.0%) |
| Law Enforcement | 0 (0.0%) | 0 (0.0%) |
| Food Preparation & Serving | 9 (81.8%) | 2 (18.2%) |
| Cleaning & Maintenance | 0 (0.0%) | 5 (100.0%) |
| Personal Care & Service | 2 (50.0%) | 2 (50.0%) |
| Total (Category) | 11 (37.9%) | 18 (62.1%) |
| Total (Overall) | 123 (62.8%) | 73 (37.2%) |
Sales and Office Occupations
The most common Sales and Office occupations in Winthrop are Sales & Related (33 | 16.8%), and Office & Administration (9 | 4.6%).
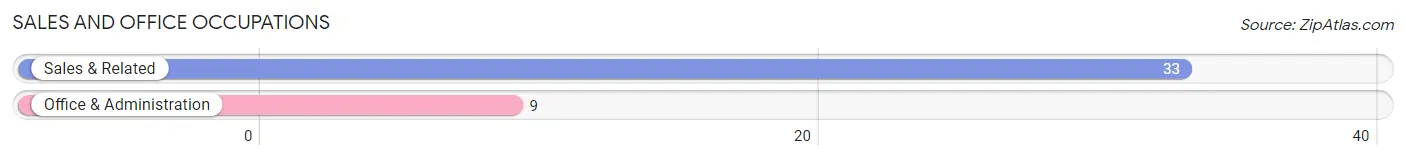
Sales and Office Occupations by Sex
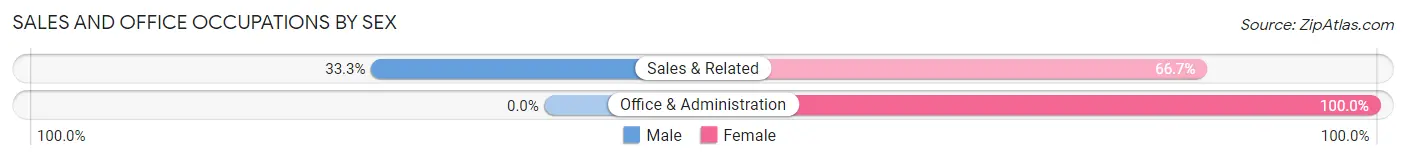
| Occupation | Male | Female |
| Sales & Related | 11 (33.3%) | 22 (66.7%) |
| Office & Administration | 0 (0.0%) | 9 (100.0%) |
| Total (Category) | 11 (26.2%) | 31 (73.8%) |
| Total (Overall) | 123 (62.8%) | 73 (37.2%) |
Natural Resources, Construction and Maintenance Occupations
The most common Natural Resources, Construction and Maintenance occupations in Winthrop are Construction & Extraction (43 | 21.9%), Installation, Maintenance & Repair (10 | 5.1%), and Farming, Fishing & Forestry (9 | 4.6%).
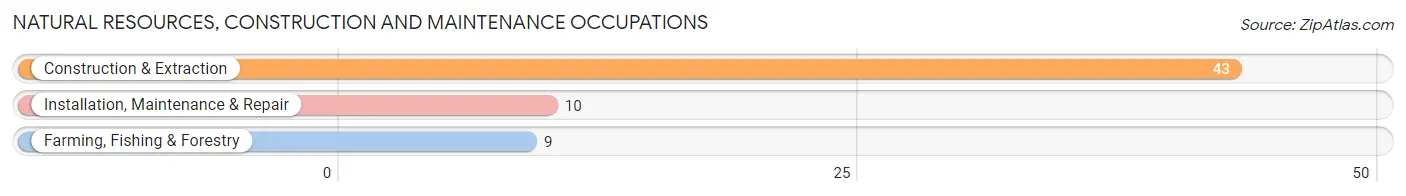
Natural Resources, Construction and Maintenance Occupations by Sex
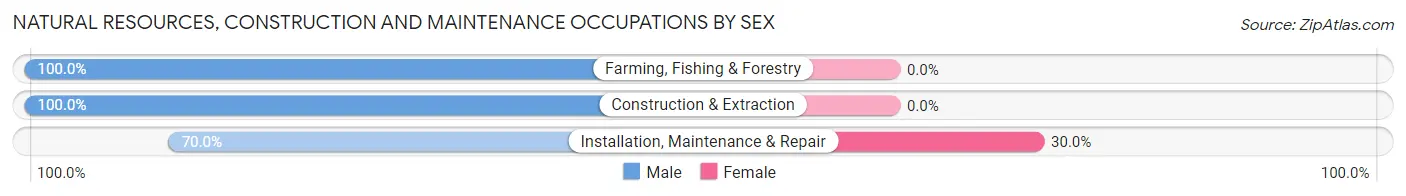
| Occupation | Male | Female |
| Farming, Fishing & Forestry | 9 (100.0%) | 0 (0.0%) |
| Construction & Extraction | 43 (100.0%) | 0 (0.0%) |
| Installation, Maintenance & Repair | 7 (70.0%) | 3 (30.0%) |
| Total (Category) | 59 (95.2%) | 3 (4.8%) |
| Total (Overall) | 123 (62.8%) | 73 (37.2%) |
Production, Transportation and Moving Occupations
The most common Production, Transportation and Moving occupations in Winthrop are Material Moving (31 | 15.8%), Production (5 | 2.5%), and Transportation (1 | 0.5%).
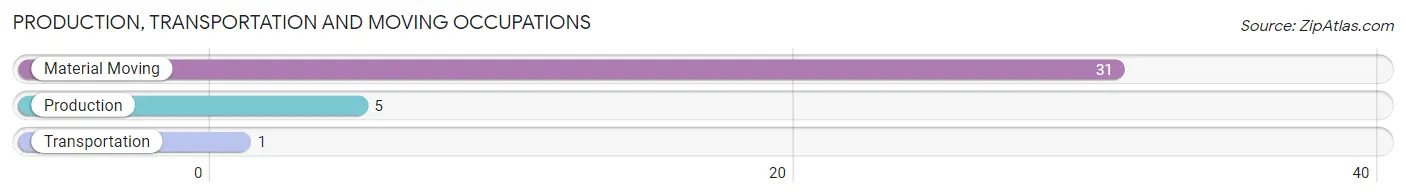
Production, Transportation and Moving Occupations by Sex
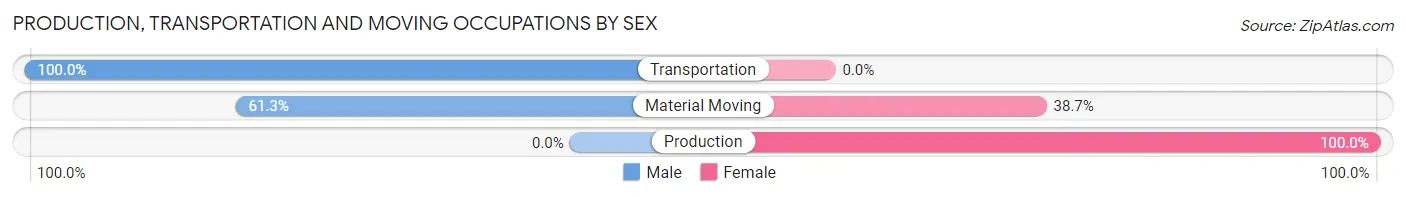
| Occupation | Male | Female |
| Production | 0 (0.0%) | 5 (100.0%) |
| Transportation | 1 (100.0%) | 0 (0.0%) |
| Material Moving | 19 (61.3%) | 12 (38.7%) |
| Total (Category) | 20 (54.0%) | 17 (46.0%) |
| Total (Overall) | 123 (62.8%) | 73 (37.2%) |
Employment Industries by Sex in Winthrop
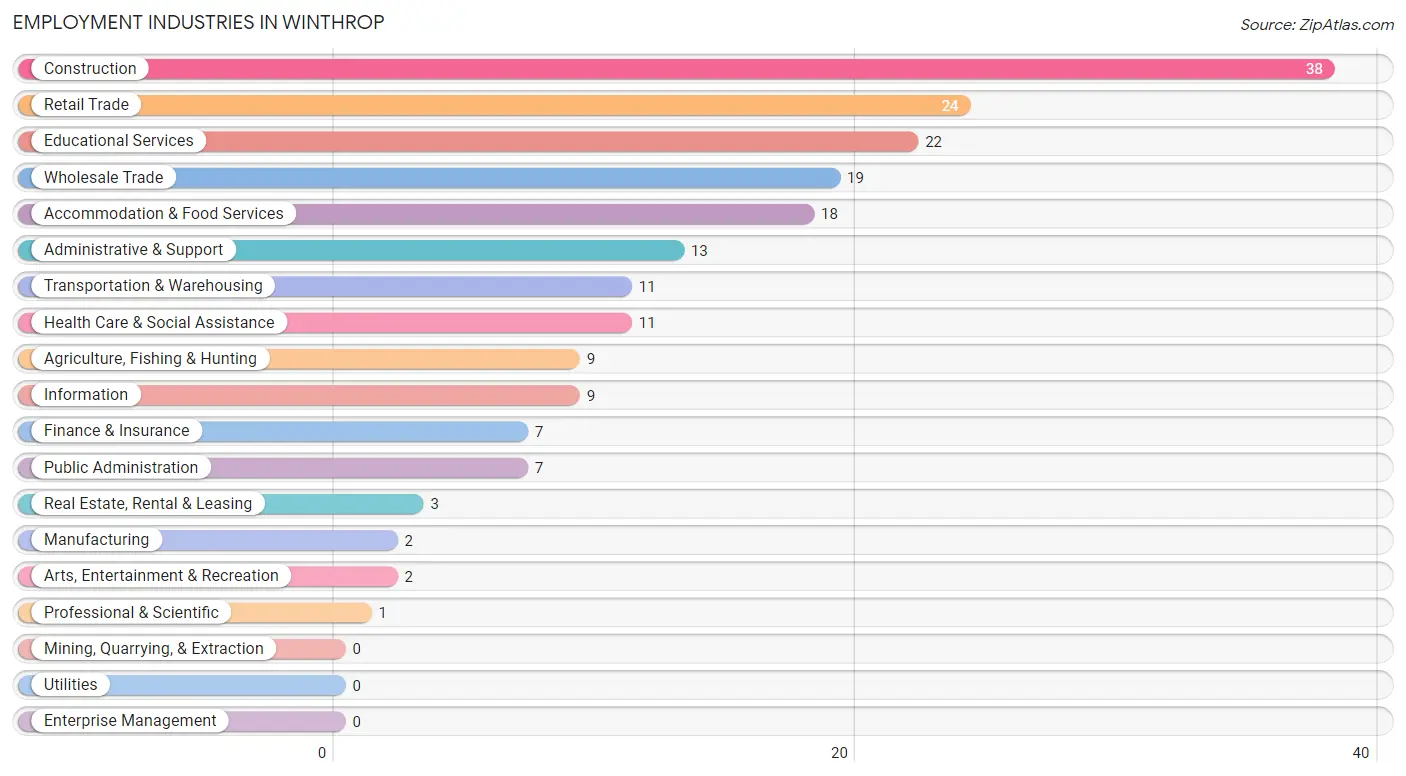
Employment Industries in Winthrop
The major employment industries in Winthrop include Construction (38 | 19.4%), Retail Trade (24 | 12.2%), Educational Services (22 | 11.2%), Wholesale Trade (19 | 9.7%), and Accommodation & Food Services (18 | 9.2%).
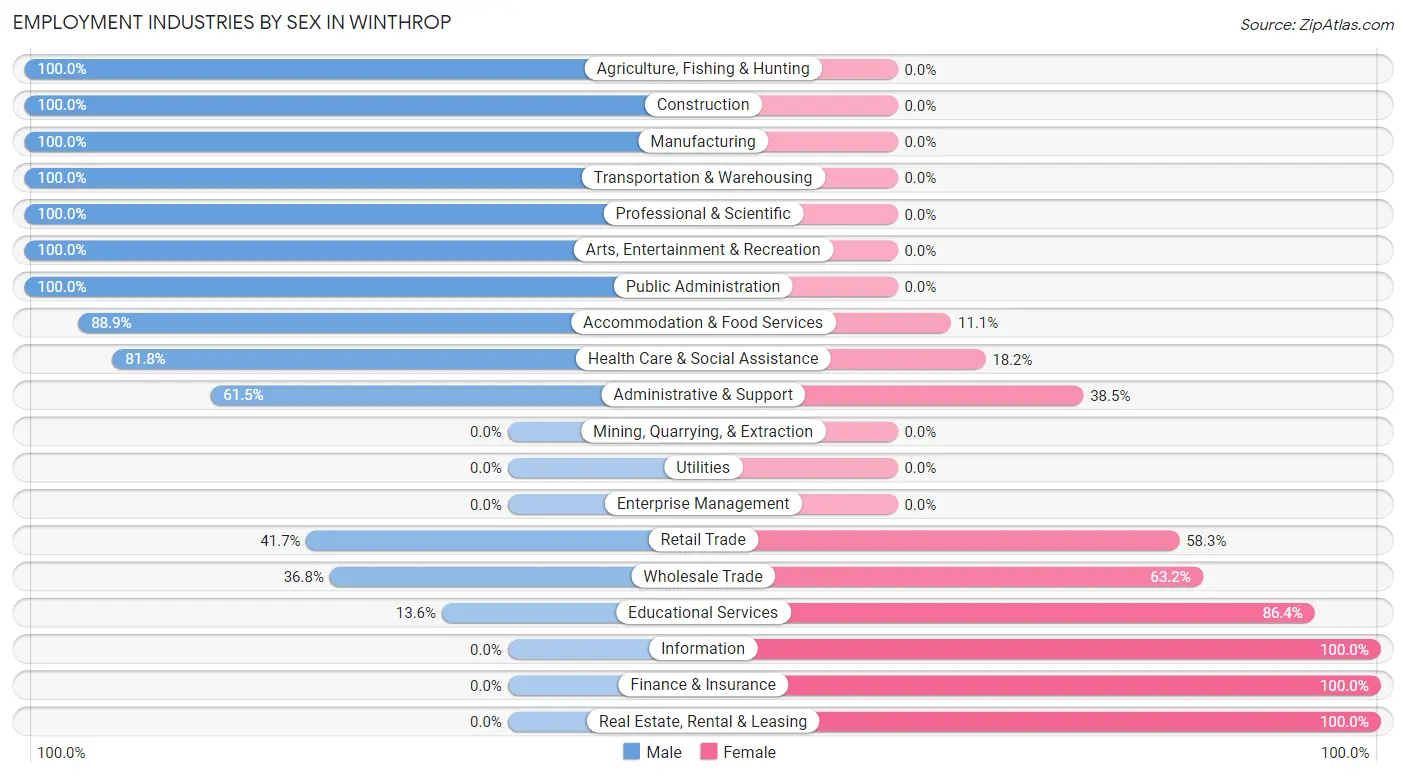
Employment Industries by Sex in Winthrop
The Winthrop industries that see more men than women are Agriculture, Fishing & Hunting (100.0%), Construction (100.0%), and Manufacturing (100.0%), whereas the industries that tend to have a higher number of women are Information (100.0%), Finance & Insurance (100.0%), and Real Estate, Rental & Leasing (100.0%).
| Industry | Male | Female |
| Agriculture, Fishing & Hunting | 9 (100.0%) | 0 (0.0%) |
| Mining, Quarrying, & Extraction | 0 (0.0%) | 0 (0.0%) |
| Construction | 38 (100.0%) | 0 (0.0%) |
| Manufacturing | 2 (100.0%) | 0 (0.0%) |
| Wholesale Trade | 7 (36.8%) | 12 (63.2%) |
| Retail Trade | 10 (41.7%) | 14 (58.3%) |
| Transportation & Warehousing | 11 (100.0%) | 0 (0.0%) |
| Utilities | 0 (0.0%) | 0 (0.0%) |
| Information | 0 (0.0%) | 9 (100.0%) |
| Finance & Insurance | 0 (0.0%) | 7 (100.0%) |
| Real Estate, Rental & Leasing | 0 (0.0%) | 3 (100.0%) |
| Professional & Scientific | 1 (100.0%) | 0 (0.0%) |
| Enterprise Management | 0 (0.0%) | 0 (0.0%) |
| Administrative & Support | 8 (61.5%) | 5 (38.5%) |
| Educational Services | 3 (13.6%) | 19 (86.4%) |
| Health Care & Social Assistance | 9 (81.8%) | 2 (18.2%) |
| Arts, Entertainment & Recreation | 2 (100.0%) | 0 (0.0%) |
| Accommodation & Food Services | 16 (88.9%) | 2 (11.1%) |
| Public Administration | 7 (100.0%) | 0 (0.0%) |
| Total | 123 (62.8%) | 73 (37.2%) |
Education in Winthrop
School Enrollment in Winthrop
The most common levels of schooling among the 85 students in Winthrop are elementary school (34 | 40.0%), high school (21 | 24.7%), and middle school (14 | 16.5%).
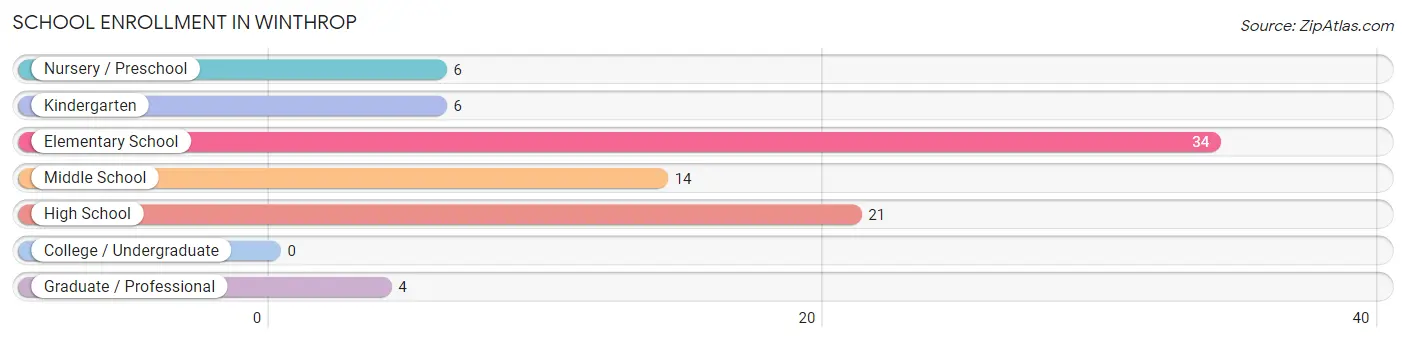
| School Level | # Students | % Students |
| Nursery / Preschool | 6 | 7.1% |
| Kindergarten | 6 | 7.1% |
| Elementary School | 34 | 40.0% |
| Middle School | 14 | 16.5% |
| High School | 21 | 24.7% |
| College / Undergraduate | 0 | 0.0% |
| Graduate / Professional | 4 | 4.7% |
| Total | 85 | 100.0% |
School Enrollment by Age by Funding Source in Winthrop
Out of a total of 85 students who are enrolled in schools in Winthrop, 10 (11.8%) attend a private institution, while the remaining 75 (88.2%) are enrolled in public schools. The age group of 3 to 4 year olds has the highest likelihood of being enrolled in private schools, with 6 (100.0% in the age bracket) enrolled. Conversely, the age group of 5 to 9 year old has the lowest likelihood of being enrolled in a private school, with 40 (100.0% in the age bracket) attending a public institution.
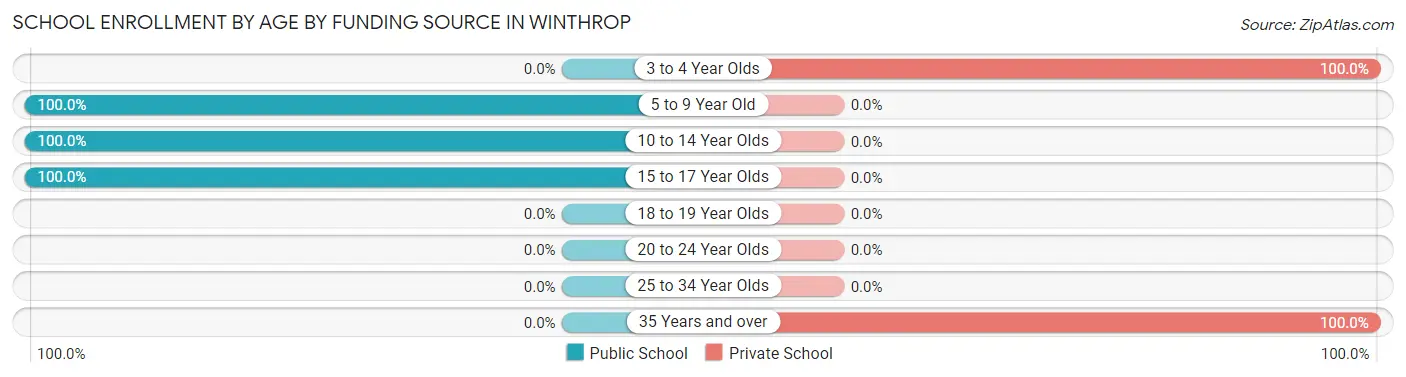
| Age Bracket | Public School | Private School |
| 3 to 4 Year Olds | 0 (0.0%) | 6 (100.0%) |
| 5 to 9 Year Old | 40 (100.0%) | 0 (0.0%) |
| 10 to 14 Year Olds | 22 (100.0%) | 0 (0.0%) |
| 15 to 17 Year Olds | 13 (100.0%) | 0 (0.0%) |
| 18 to 19 Year Olds | 0 (0.0%) | 0 (0.0%) |
| 20 to 24 Year Olds | 0 (0.0%) | 0 (0.0%) |
| 25 to 34 Year Olds | 0 (0.0%) | 0 (0.0%) |
| 35 Years and over | 0 (0.0%) | 4 (100.0%) |
| Total | 75 (88.2%) | 10 (11.8%) |
Educational Attainment by Field of Study in Winthrop
Business (25 | 27.2%), social sciences (16 | 17.4%), arts & humanities (13 | 14.1%), liberal arts & history (9 | 9.8%), and bio, nature & agricultural (7 | 7.6%) are the most common fields of study among 92 individuals in Winthrop who have obtained a bachelor's degree or higher.
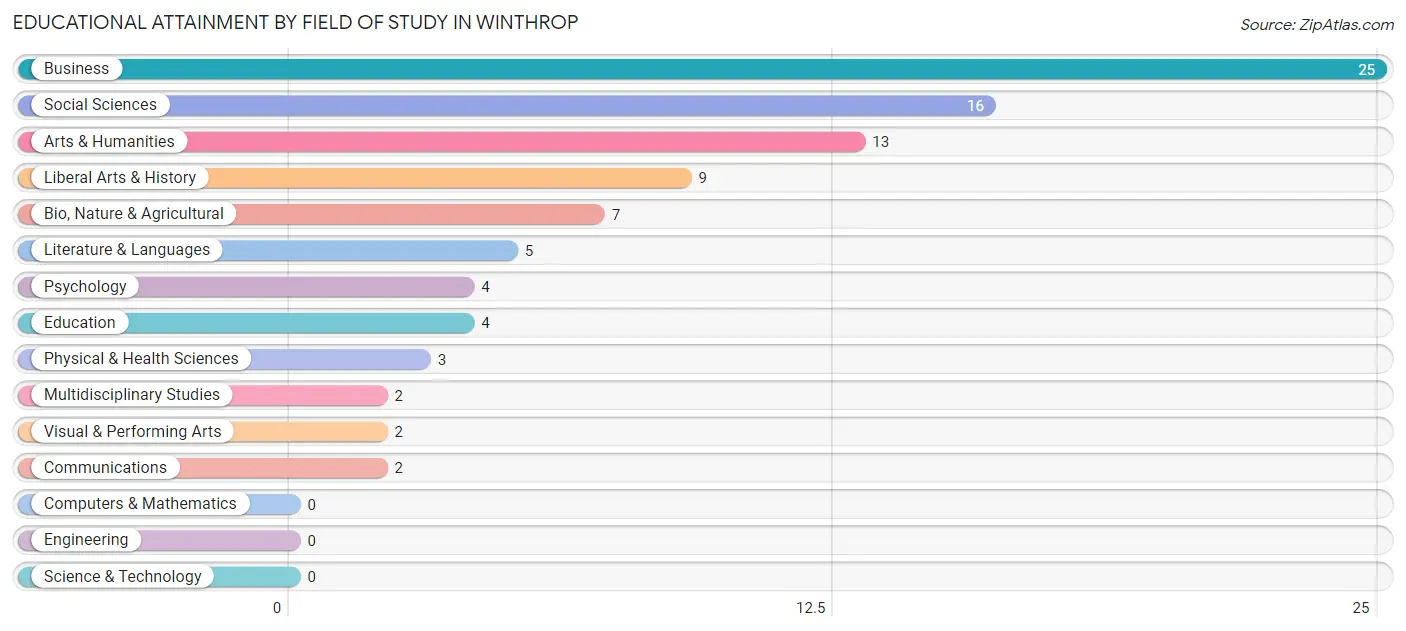
| Field of Study | # Graduates | % Graduates |
| Computers & Mathematics | 0 | 0.0% |
| Bio, Nature & Agricultural | 7 | 7.6% |
| Physical & Health Sciences | 3 | 3.3% |
| Psychology | 4 | 4.3% |
| Social Sciences | 16 | 17.4% |
| Engineering | 0 | 0.0% |
| Multidisciplinary Studies | 2 | 2.2% |
| Science & Technology | 0 | 0.0% |
| Business | 25 | 27.2% |
| Education | 4 | 4.3% |
| Literature & Languages | 5 | 5.4% |
| Liberal Arts & History | 9 | 9.8% |
| Visual & Performing Arts | 2 | 2.2% |
| Communications | 2 | 2.2% |
| Arts & Humanities | 13 | 14.1% |
| Total | 92 | 100.0% |
Transportation & Commute in Winthrop
Vehicle Availability by Sex in Winthrop
The most prevalent vehicle ownership categories in Winthrop are males with 2 vehicles (41, accounting for 33.3%) and females with 2 vehicles (19, making up 74.6%).
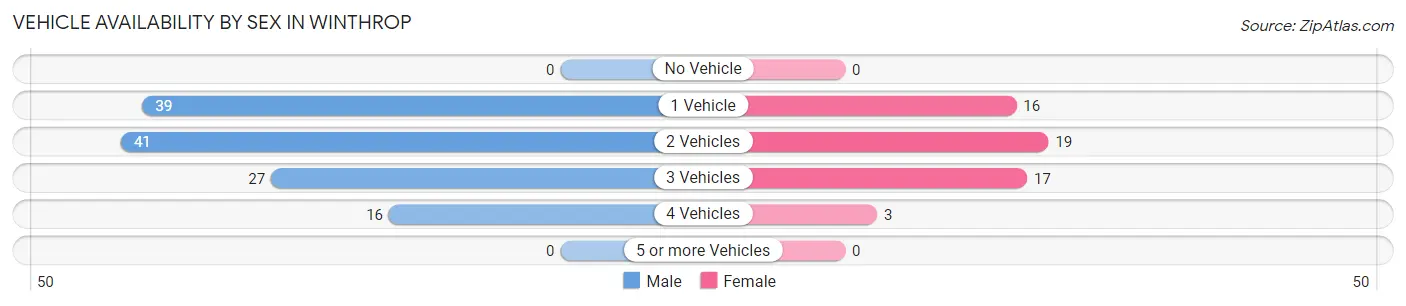
| Vehicles Available | Male | Female |
| No Vehicle | 0 (0.0%) | 0 (0.0%) |
| 1 Vehicle | 39 (31.7%) | 16 (29.1%) |
| 2 Vehicles | 41 (33.3%) | 19 (34.5%) |
| 3 Vehicles | 27 (22.0%) | 17 (30.9%) |
| 4 Vehicles | 16 (13.0%) | 3 (5.4%) |
| 5 or more Vehicles | 0 (0.0%) | 0 (0.0%) |
| Total | 123 (100.0%) | 55 (100.0%) |
Commute Time in Winthrop
The most frequently occuring commute durations in Winthrop are 5 to 9 minutes (61 commuters, 35.1%), less than 5 minutes (42 commuters, 24.1%), and 15 to 19 minutes (28 commuters, 16.1%).
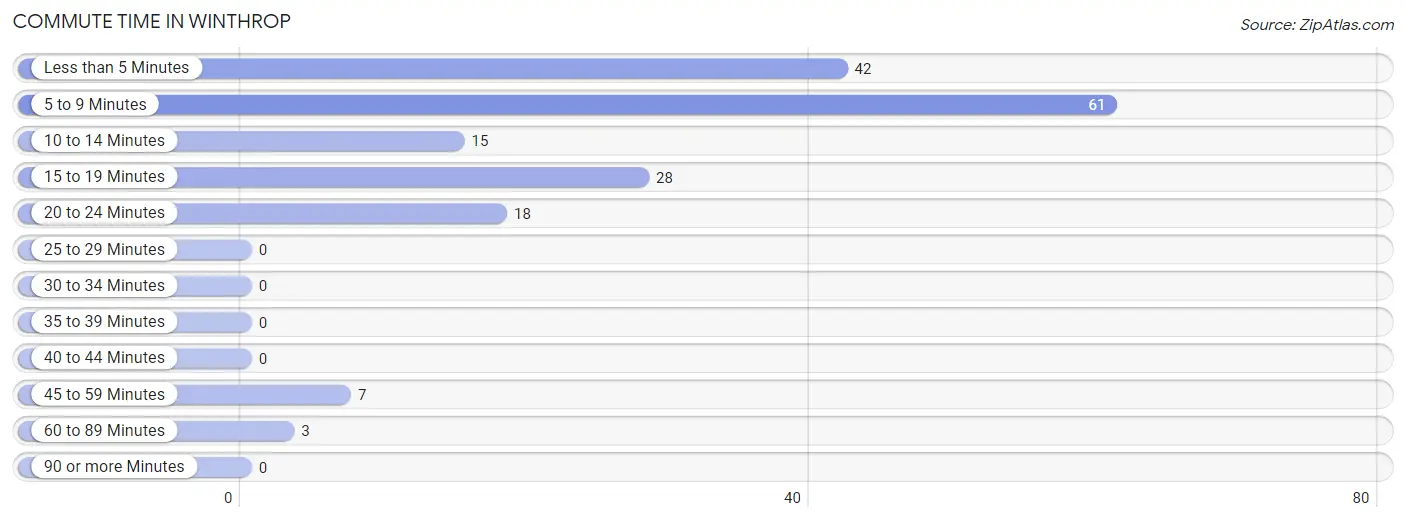
| Commute Time | # Commuters | % Commuters |
| Less than 5 Minutes | 42 | 24.1% |
| 5 to 9 Minutes | 61 | 35.1% |
| 10 to 14 Minutes | 15 | 8.6% |
| 15 to 19 Minutes | 28 | 16.1% |
| 20 to 24 Minutes | 18 | 10.3% |
| 25 to 29 Minutes | 0 | 0.0% |
| 30 to 34 Minutes | 0 | 0.0% |
| 35 to 39 Minutes | 0 | 0.0% |
| 40 to 44 Minutes | 0 | 0.0% |
| 45 to 59 Minutes | 7 | 4.0% |
| 60 to 89 Minutes | 3 | 1.7% |
| 90 or more Minutes | 0 | 0.0% |
Commute Time by Sex in Winthrop
The most common commute times in Winthrop are 5 to 9 minutes (40 commuters, 33.6%) for males and 5 to 9 minutes (21 commuters, 38.2%) for females.
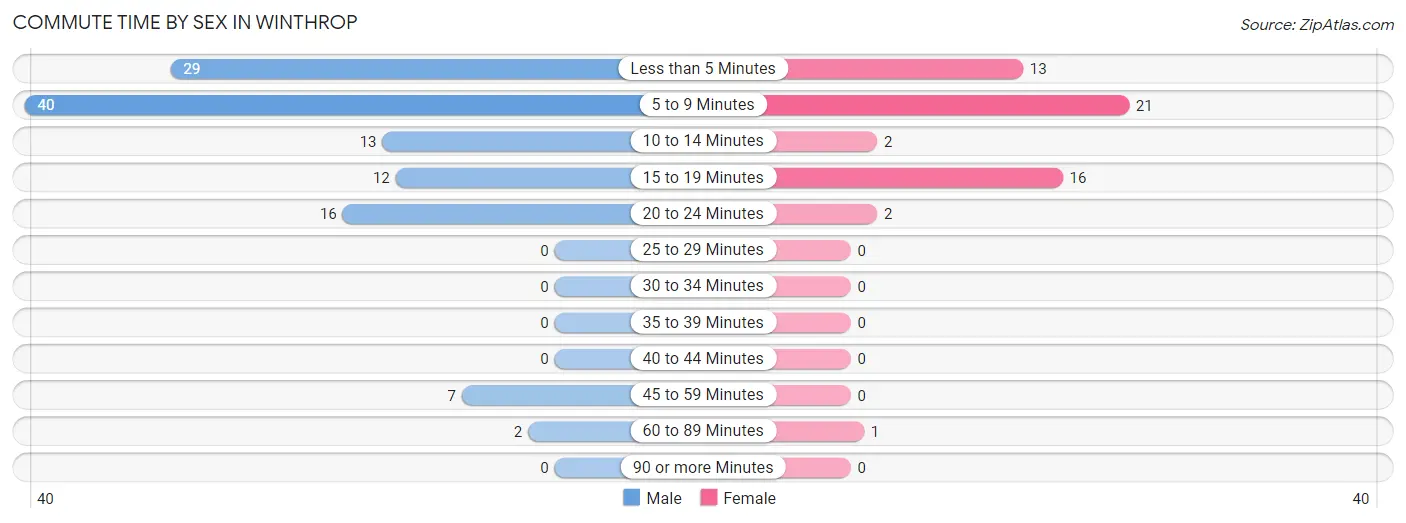
| Commute Time | Male | Female |
| Less than 5 Minutes | 29 (24.4%) | 13 (23.6%) |
| 5 to 9 Minutes | 40 (33.6%) | 21 (38.2%) |
| 10 to 14 Minutes | 13 (10.9%) | 2 (3.6%) |
| 15 to 19 Minutes | 12 (10.1%) | 16 (29.1%) |
| 20 to 24 Minutes | 16 (13.5%) | 2 (3.6%) |
| 25 to 29 Minutes | 0 (0.0%) | 0 (0.0%) |
| 30 to 34 Minutes | 0 (0.0%) | 0 (0.0%) |
| 35 to 39 Minutes | 0 (0.0%) | 0 (0.0%) |
| 40 to 44 Minutes | 0 (0.0%) | 0 (0.0%) |
| 45 to 59 Minutes | 7 (5.9%) | 0 (0.0%) |
| 60 to 89 Minutes | 2 (1.7%) | 1 (1.8%) |
| 90 or more Minutes | 0 (0.0%) | 0 (0.0%) |
Time of Departure to Work by Sex in Winthrop
The most frequent times of departure to work in Winthrop are 8:00 AM to 8:29 AM (26, 21.8%) for males and 8:00 AM to 8:29 AM (18, 32.7%) for females.
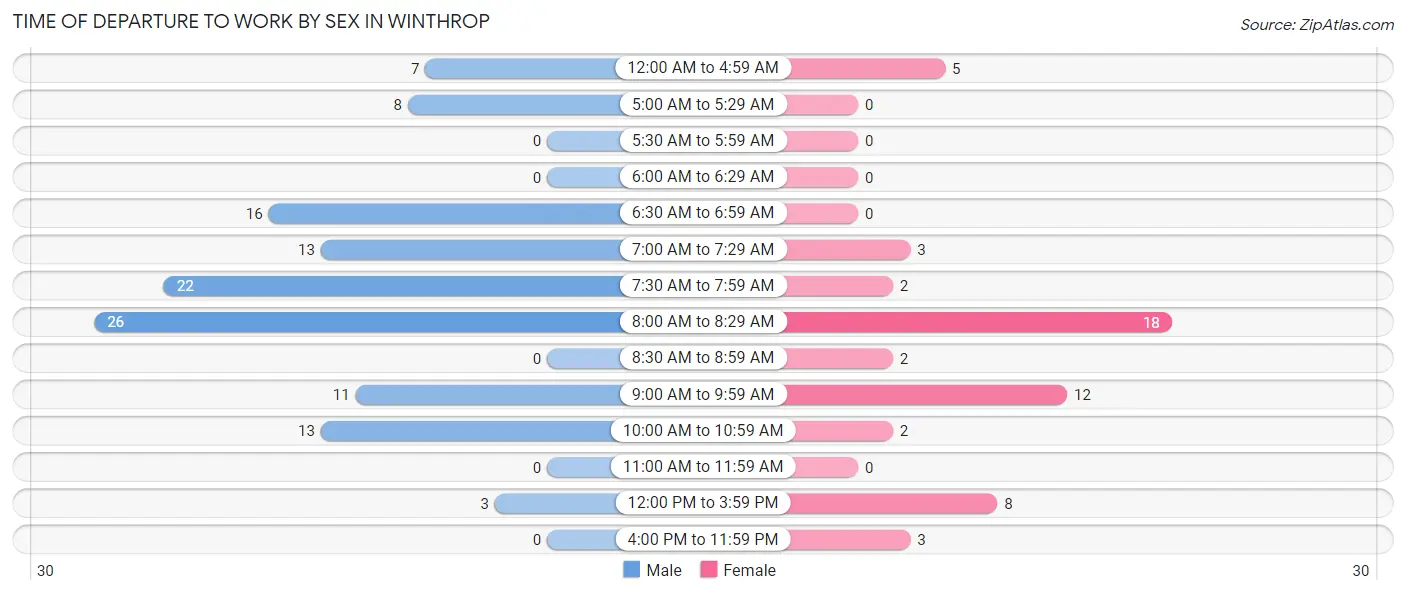
| Time of Departure | Male | Female |
| 12:00 AM to 4:59 AM | 7 (5.9%) | 5 (9.1%) |
| 5:00 AM to 5:29 AM | 8 (6.7%) | 0 (0.0%) |
| 5:30 AM to 5:59 AM | 0 (0.0%) | 0 (0.0%) |
| 6:00 AM to 6:29 AM | 0 (0.0%) | 0 (0.0%) |
| 6:30 AM to 6:59 AM | 16 (13.5%) | 0 (0.0%) |
| 7:00 AM to 7:29 AM | 13 (10.9%) | 3 (5.4%) |
| 7:30 AM to 7:59 AM | 22 (18.5%) | 2 (3.6%) |
| 8:00 AM to 8:29 AM | 26 (21.8%) | 18 (32.7%) |
| 8:30 AM to 8:59 AM | 0 (0.0%) | 2 (3.6%) |
| 9:00 AM to 9:59 AM | 11 (9.2%) | 12 (21.8%) |
| 10:00 AM to 10:59 AM | 13 (10.9%) | 2 (3.6%) |
| 11:00 AM to 11:59 AM | 0 (0.0%) | 0 (0.0%) |
| 12:00 PM to 3:59 PM | 3 (2.5%) | 8 (14.5%) |
| 4:00 PM to 11:59 PM | 0 (0.0%) | 3 (5.4%) |
| Total | 119 (100.0%) | 55 (100.0%) |
Housing Occupancy in Winthrop
Occupancy by Ownership in Winthrop
Of the total 184 dwellings in Winthrop, owner-occupied units account for 116 (63.0%), while renter-occupied units make up 68 (37.0%).
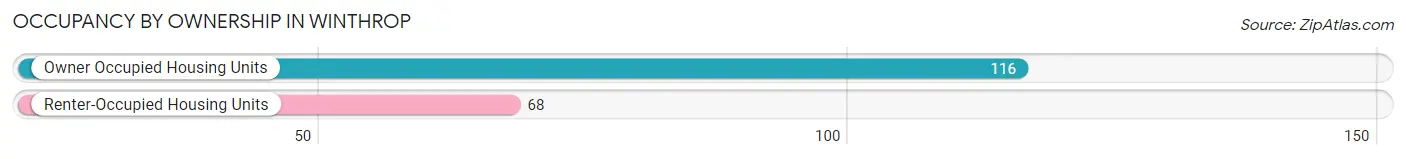
| Occupancy | # Housing Units | % Housing Units |
| Owner Occupied Housing Units | 116 | 63.0% |
| Renter-Occupied Housing Units | 68 | 37.0% |
| Total Occupied Housing Units | 184 | 100.0% |
Occupancy by Household Size in Winthrop
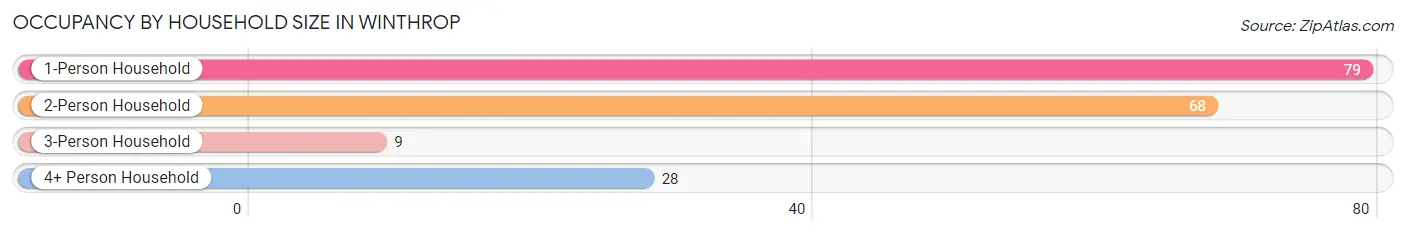
| Household Size | # Housing Units | % Housing Units |
| 1-Person Household | 79 | 42.9% |
| 2-Person Household | 68 | 37.0% |
| 3-Person Household | 9 | 4.9% |
| 4+ Person Household | 28 | 15.2% |
| Total Housing Units | 184 | 100.0% |
Occupancy by Ownership by Household Size in Winthrop
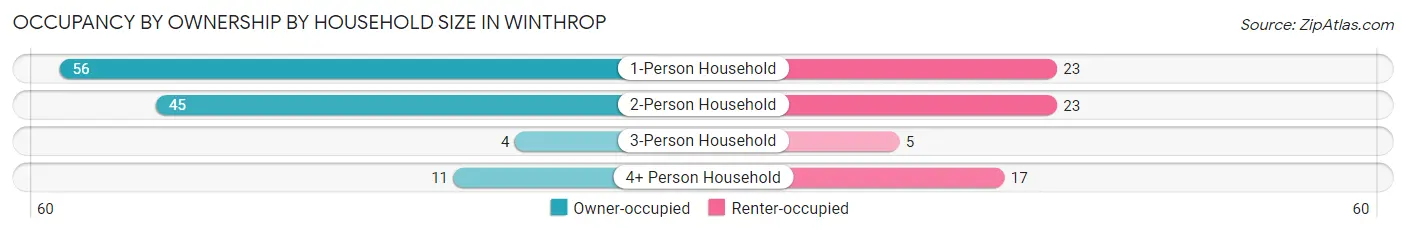
| Household Size | Owner-occupied | Renter-occupied |
| 1-Person Household | 56 (70.9%) | 23 (29.1%) |
| 2-Person Household | 45 (66.2%) | 23 (33.8%) |
| 3-Person Household | 4 (44.4%) | 5 (55.6%) |
| 4+ Person Household | 11 (39.3%) | 17 (60.7%) |
| Total Housing Units | 116 (63.0%) | 68 (37.0%) |
Occupancy by Educational Attainment in Winthrop
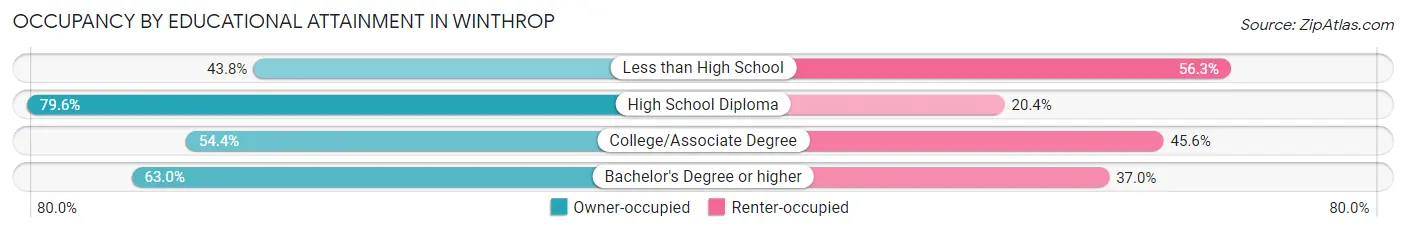
| Household Size | Owner-occupied | Renter-occupied |
| Less than High School | 7 (43.8%) | 9 (56.2%) |
| High School Diploma | 43 (79.6%) | 11 (20.4%) |
| College/Associate Degree | 37 (54.4%) | 31 (45.6%) |
| Bachelor's Degree or higher | 29 (63.0%) | 17 (37.0%) |
Occupancy by Age of Householder in Winthrop
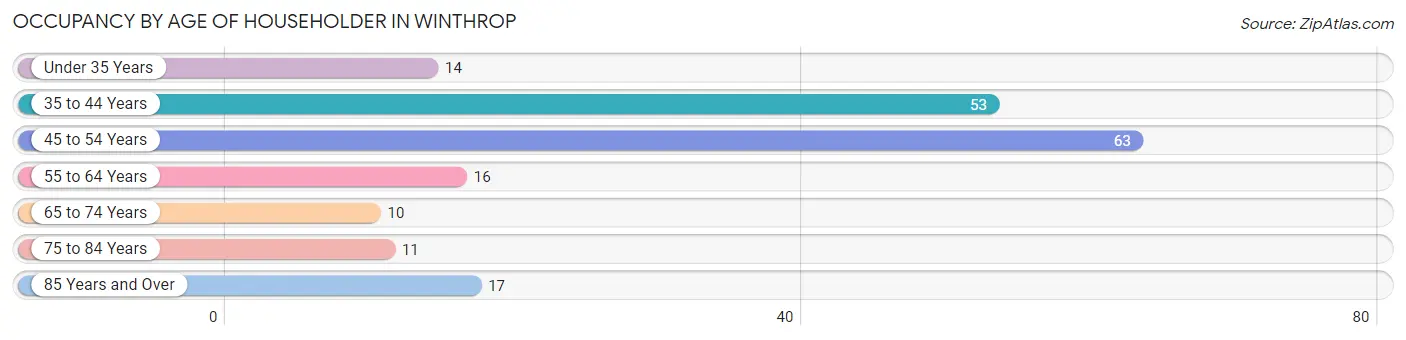
| Age Bracket | # Households | % Households |
| Under 35 Years | 14 | 7.6% |
| 35 to 44 Years | 53 | 28.8% |
| 45 to 54 Years | 63 | 34.2% |
| 55 to 64 Years | 16 | 8.7% |
| 65 to 74 Years | 10 | 5.4% |
| 75 to 84 Years | 11 | 6.0% |
| 85 Years and Over | 17 | 9.2% |
| Total | 184 | 100.0% |
Housing Finances in Winthrop
Median Income by Occupancy in Winthrop
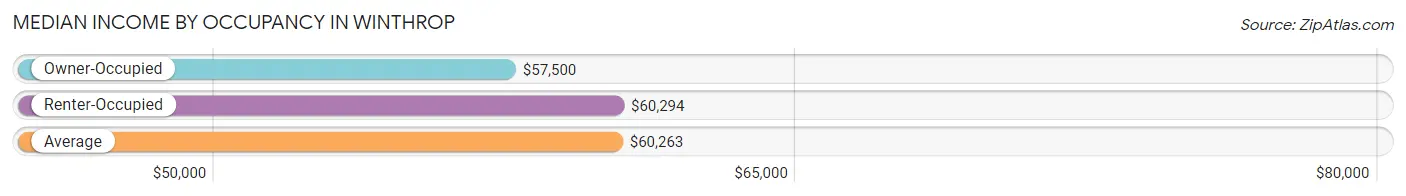
| Occupancy Type | # Households | Median Income |
| Owner-Occupied | 116 (63.0%) | $57,500 |
| Renter-Occupied | 68 (37.0%) | $60,294 |
| Average | 184 (100.0%) | $60,263 |
Occupancy by Householder Income Bracket in Winthrop
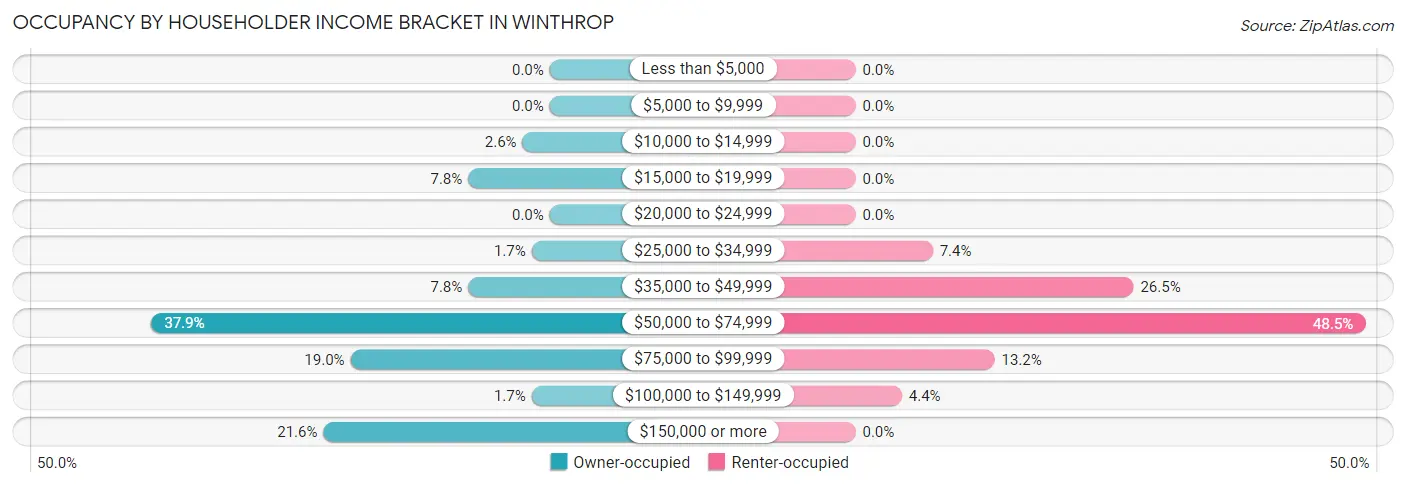
| Income Bracket | Owner-occupied | Renter-occupied |
| Less than $5,000 | 0 (0.0%) | 0 (0.0%) |
| $5,000 to $9,999 | 0 (0.0%) | 0 (0.0%) |
| $10,000 to $14,999 | 3 (2.6%) | 0 (0.0%) |
| $15,000 to $19,999 | 9 (7.8%) | 0 (0.0%) |
| $20,000 to $24,999 | 0 (0.0%) | 0 (0.0%) |
| $25,000 to $34,999 | 2 (1.7%) | 5 (7.3%) |
| $35,000 to $49,999 | 9 (7.8%) | 18 (26.5%) |
| $50,000 to $74,999 | 44 (37.9%) | 33 (48.5%) |
| $75,000 to $99,999 | 22 (19.0%) | 9 (13.2%) |
| $100,000 to $149,999 | 2 (1.7%) | 3 (4.4%) |
| $150,000 or more | 25 (21.5%) | 0 (0.0%) |
| Total | 116 (100.0%) | 68 (100.0%) |
Monthly Housing Cost Tiers in Winthrop
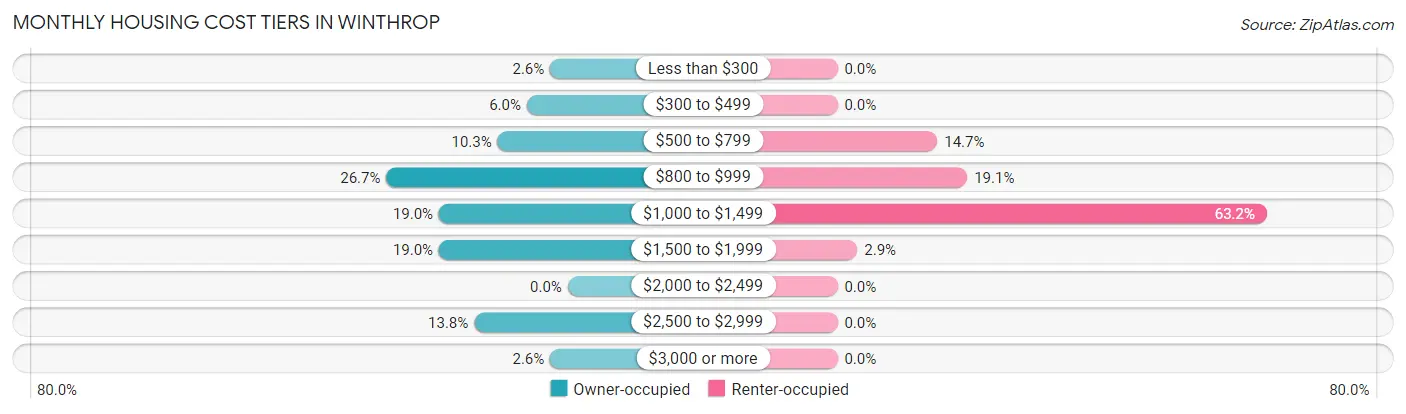
| Monthly Cost | Owner-occupied | Renter-occupied |
| Less than $300 | 3 (2.6%) | 0 (0.0%) |
| $300 to $499 | 7 (6.0%) | 0 (0.0%) |
| $500 to $799 | 12 (10.3%) | 10 (14.7%) |
| $800 to $999 | 31 (26.7%) | 13 (19.1%) |
| $1,000 to $1,499 | 22 (19.0%) | 43 (63.2%) |
| $1,500 to $1,999 | 22 (19.0%) | 2 (2.9%) |
| $2,000 to $2,499 | 0 (0.0%) | 0 (0.0%) |
| $2,500 to $2,999 | 16 (13.8%) | 0 (0.0%) |
| $3,000 or more | 3 (2.6%) | 0 (0.0%) |
| Total | 116 (100.0%) | 68 (100.0%) |
Physical Housing Characteristics in Winthrop
Housing Structures in Winthrop
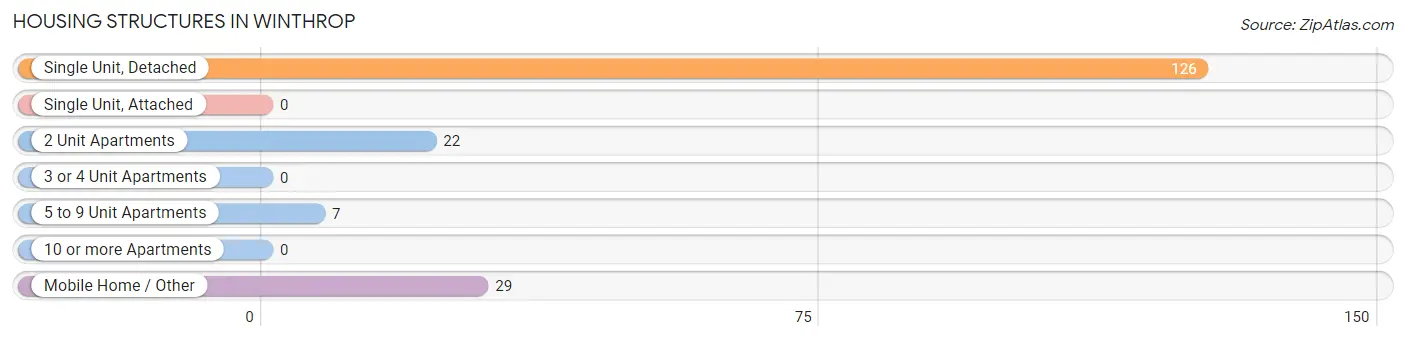
| Structure Type | # Housing Units | % Housing Units |
| Single Unit, Detached | 126 | 68.5% |
| Single Unit, Attached | 0 | 0.0% |
| 2 Unit Apartments | 22 | 12.0% |
| 3 or 4 Unit Apartments | 0 | 0.0% |
| 5 to 9 Unit Apartments | 7 | 3.8% |
| 10 or more Apartments | 0 | 0.0% |
| Mobile Home / Other | 29 | 15.8% |
| Total | 184 | 100.0% |
Housing Structures by Occupancy in Winthrop
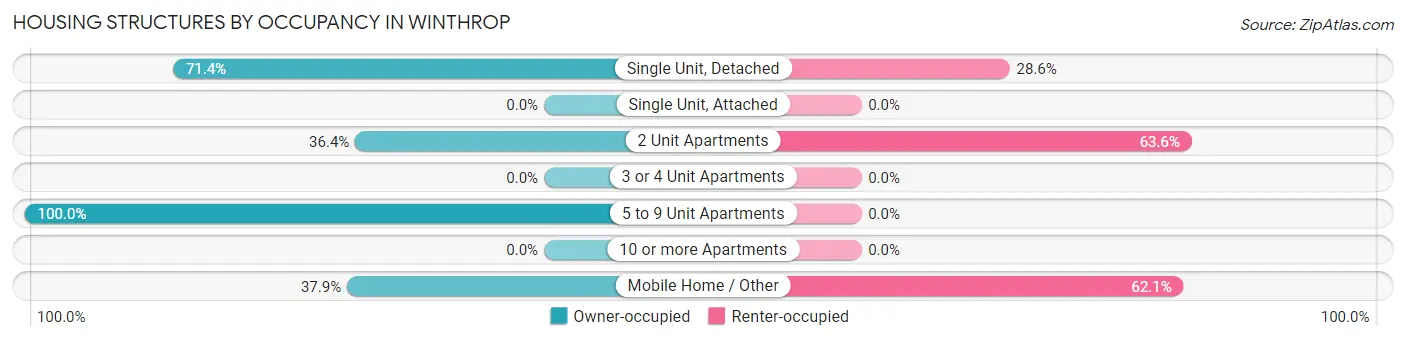
| Structure Type | Owner-occupied | Renter-occupied |
| Single Unit, Detached | 90 (71.4%) | 36 (28.6%) |
| Single Unit, Attached | 0 (0.0%) | 0 (0.0%) |
| 2 Unit Apartments | 8 (36.4%) | 14 (63.6%) |
| 3 or 4 Unit Apartments | 0 (0.0%) | 0 (0.0%) |
| 5 to 9 Unit Apartments | 7 (100.0%) | 0 (0.0%) |
| 10 or more Apartments | 0 (0.0%) | 0 (0.0%) |
| Mobile Home / Other | 11 (37.9%) | 18 (62.1%) |
| Total | 116 (63.0%) | 68 (37.0%) |
Housing Structures by Number of Rooms in Winthrop
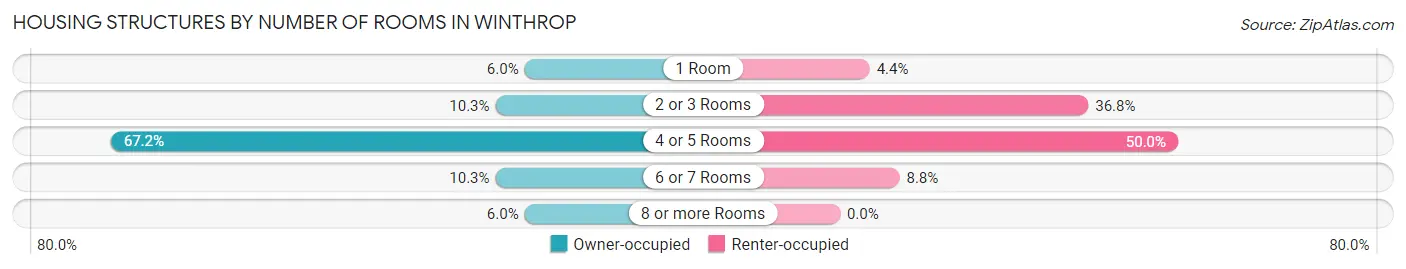
| Number of Rooms | Owner-occupied | Renter-occupied |
| 1 Room | 7 (6.0%) | 3 (4.4%) |
| 2 or 3 Rooms | 12 (10.3%) | 25 (36.8%) |
| 4 or 5 Rooms | 78 (67.2%) | 34 (50.0%) |
| 6 or 7 Rooms | 12 (10.3%) | 6 (8.8%) |
| 8 or more Rooms | 7 (6.0%) | 0 (0.0%) |
| Total | 116 (100.0%) | 68 (100.0%) |
Housing Structure by Heating Type in Winthrop
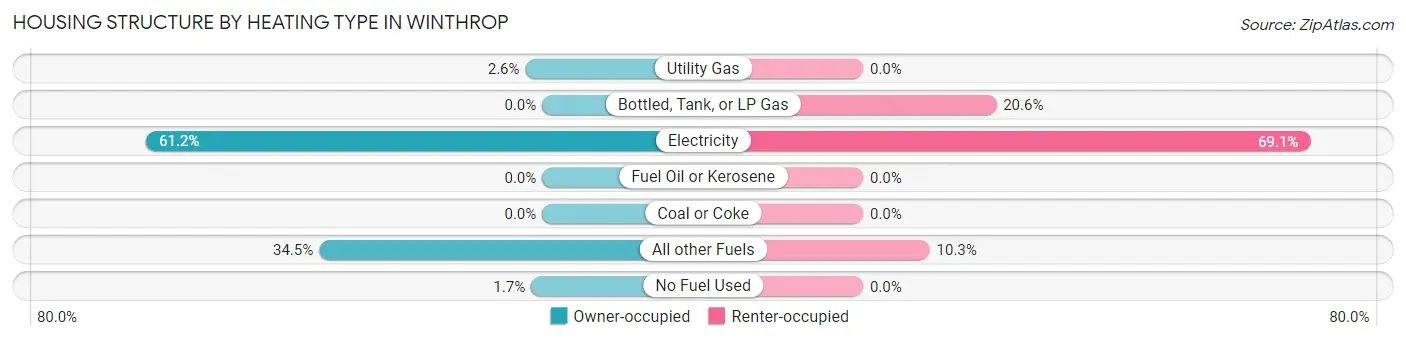
| Heating Type | Owner-occupied | Renter-occupied |
| Utility Gas | 3 (2.6%) | 0 (0.0%) |
| Bottled, Tank, or LP Gas | 0 (0.0%) | 14 (20.6%) |
| Electricity | 71 (61.2%) | 47 (69.1%) |
| Fuel Oil or Kerosene | 0 (0.0%) | 0 (0.0%) |
| Coal or Coke | 0 (0.0%) | 0 (0.0%) |
| All other Fuels | 40 (34.5%) | 7 (10.3%) |
| No Fuel Used | 2 (1.7%) | 0 (0.0%) |
| Total | 116 (100.0%) | 68 (100.0%) |
Household Vehicle Usage in Winthrop
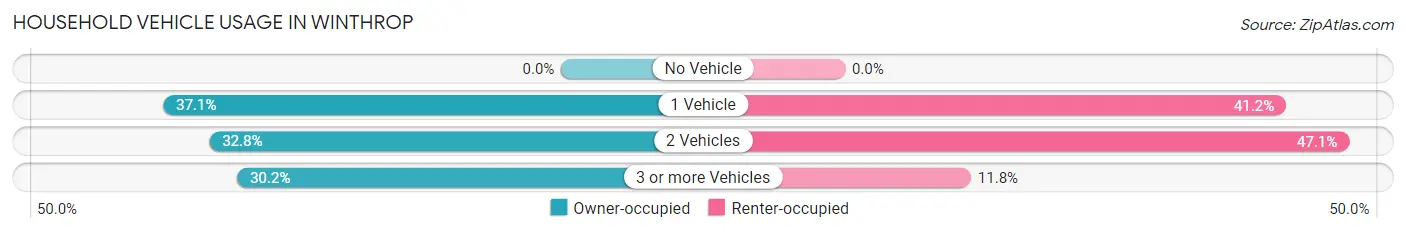
| Vehicles per Household | Owner-occupied | Renter-occupied |
| No Vehicle | 0 (0.0%) | 0 (0.0%) |
| 1 Vehicle | 43 (37.1%) | 28 (41.2%) |
| 2 Vehicles | 38 (32.8%) | 32 (47.1%) |
| 3 or more Vehicles | 35 (30.2%) | 8 (11.8%) |
| Total | 116 (100.0%) | 68 (100.0%) |
Real Estate & Mortgages in Winthrop
Real Estate and Mortgage Overview in Winthrop
| Characteristic | Without Mortgage | With Mortgage |
| Housing Units | 34 | 82 |
| Median Property Value | $281,600 | $400,000 |
| Median Household Income | $70,000 | $20 |
| Monthly Housing Costs | $700 | $3 |
| Real Estate Taxes | $2,667 | $0 |
Property Value by Mortgage Status in Winthrop
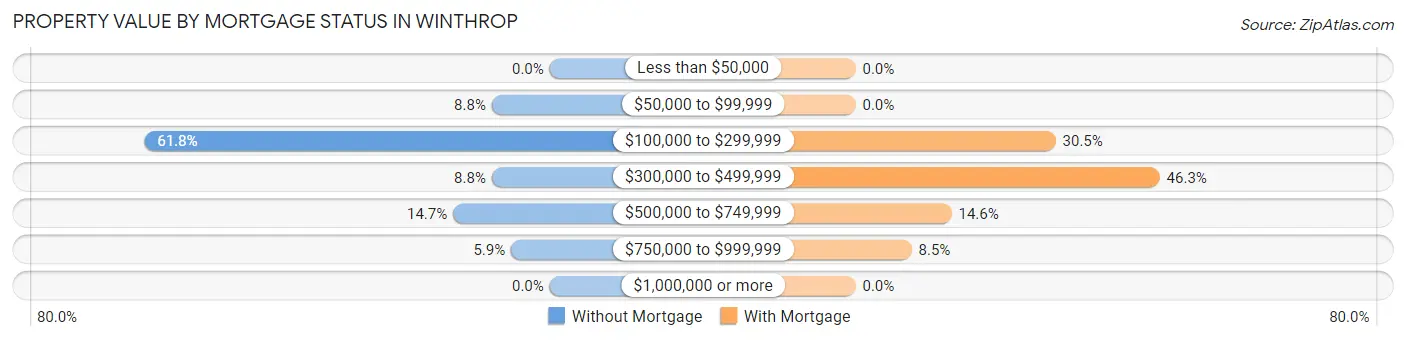
| Property Value | Without Mortgage | With Mortgage |
| Less than $50,000 | 0 (0.0%) | 0 (0.0%) |
| $50,000 to $99,999 | 3 (8.8%) | 0 (0.0%) |
| $100,000 to $299,999 | 21 (61.8%) | 25 (30.5%) |
| $300,000 to $499,999 | 3 (8.8%) | 38 (46.3%) |
| $500,000 to $749,999 | 5 (14.7%) | 12 (14.6%) |
| $750,000 to $999,999 | 2 (5.9%) | 7 (8.5%) |
| $1,000,000 or more | 0 (0.0%) | 0 (0.0%) |
| Total | 34 (100.0%) | 82 (100.0%) |
Household Income by Mortgage Status in Winthrop
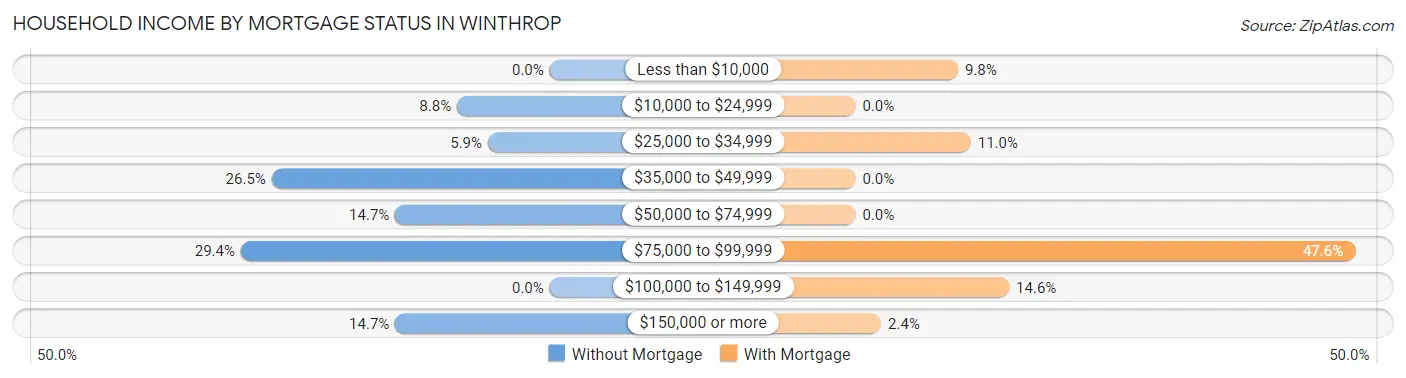
| Household Income | Without Mortgage | With Mortgage |
| Less than $10,000 | 0 (0.0%) | 8 (9.8%) |
| $10,000 to $24,999 | 3 (8.8%) | 0 (0.0%) |
| $25,000 to $34,999 | 2 (5.9%) | 9 (11.0%) |
| $35,000 to $49,999 | 9 (26.5%) | 0 (0.0%) |
| $50,000 to $74,999 | 5 (14.7%) | 0 (0.0%) |
| $75,000 to $99,999 | 10 (29.4%) | 39 (47.6%) |
| $100,000 to $149,999 | 0 (0.0%) | 12 (14.6%) |
| $150,000 or more | 5 (14.7%) | 2 (2.4%) |
| Total | 34 (100.0%) | 82 (100.0%) |
Property Value to Household Income Ratio in Winthrop
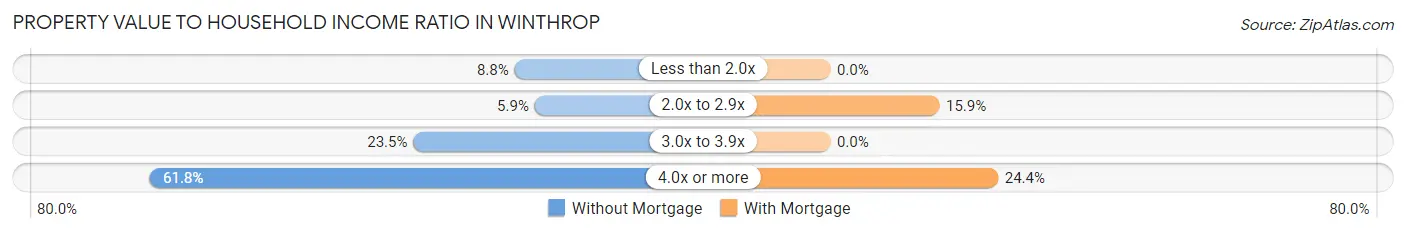
| Value-to-Income Ratio | Without Mortgage | With Mortgage |
| Less than 2.0x | 3 (8.8%) | 0 (0.0%) |
| 2.0x to 2.9x | 2 (5.9%) | 13 (15.9%) |
| 3.0x to 3.9x | 8 (23.5%) | 0 (0.0%) |
| 4.0x or more | 21 (61.8%) | 20 (24.4%) |
| Total | 34 (100.0%) | 82 (100.0%) |
Real Estate Taxes by Mortgage Status in Winthrop
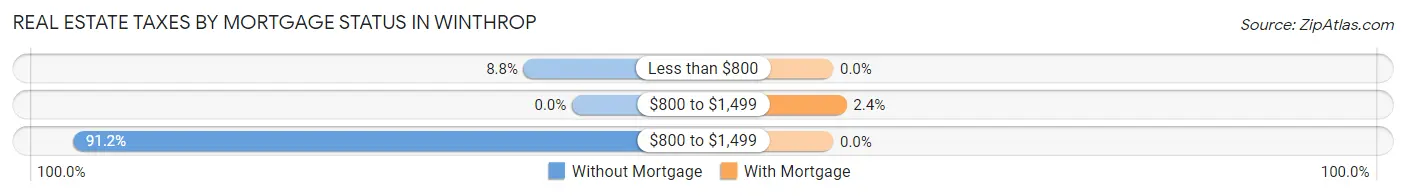
| Property Taxes | Without Mortgage | With Mortgage |
| Less than $800 | 3 (8.8%) | 0 (0.0%) |
| $800 to $1,499 | 0 (0.0%) | 2 (2.4%) |
| $800 to $1,499 | 31 (91.2%) | 0 (0.0%) |
| Total | 34 (100.0%) | 82 (100.0%) |
Health & Disability in Winthrop
Health Insurance Coverage by Age in Winthrop
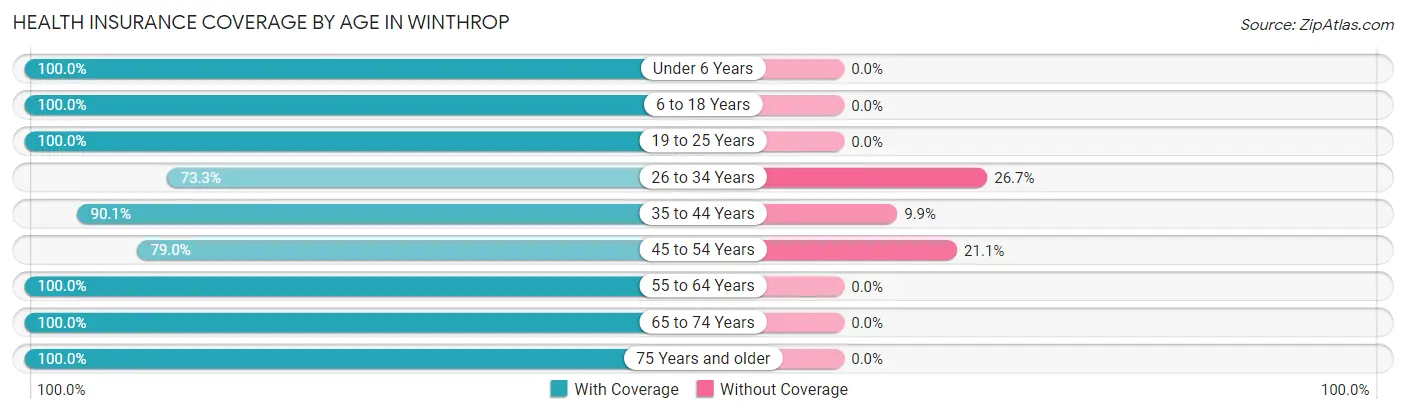
| Age Bracket | With Coverage | Without Coverage |
| Under 6 Years | 44 (100.0%) | 0 (0.0%) |
| 6 to 18 Years | 69 (100.0%) | 0 (0.0%) |
| 19 to 25 Years | 12 (100.0%) | 0 (0.0%) |
| 26 to 34 Years | 22 (73.3%) | 8 (26.7%) |
| 35 to 44 Years | 73 (90.1%) | 8 (9.9%) |
| 45 to 54 Years | 60 (78.9%) | 16 (21.0%) |
| 55 to 64 Years | 45 (100.0%) | 0 (0.0%) |
| 65 to 74 Years | 18 (100.0%) | 0 (0.0%) |
| 75 Years and older | 28 (100.0%) | 0 (0.0%) |
| Total | 371 (92.1%) | 32 (7.9%) |
Health Insurance Coverage by Citizenship Status in Winthrop
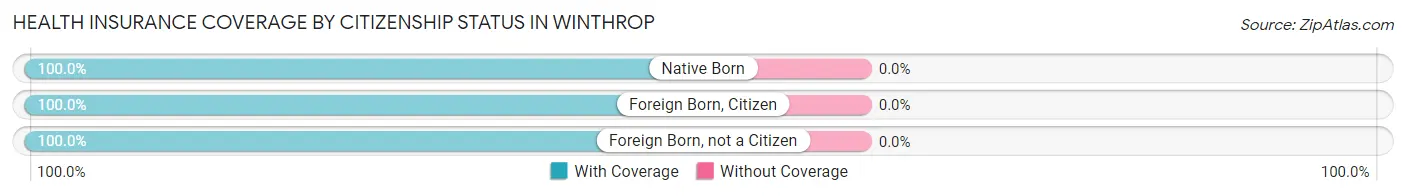
| Citizenship Status | With Coverage | Without Coverage |
| Native Born | 44 (100.0%) | 0 (0.0%) |
| Foreign Born, Citizen | 69 (100.0%) | 0 (0.0%) |
| Foreign Born, not a Citizen | 12 (100.0%) | 0 (0.0%) |
Health Insurance Coverage by Household Income in Winthrop
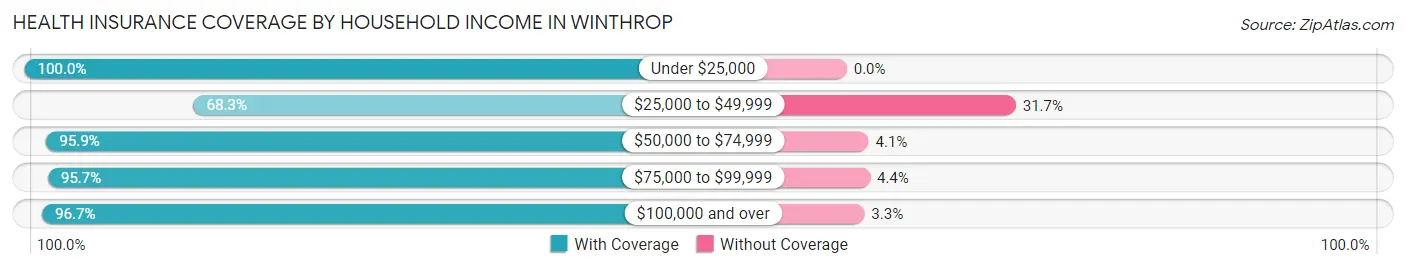
| Household Income | With Coverage | Without Coverage |
| Under $25,000 | 12 (100.0%) | 0 (0.0%) |
| $25,000 to $49,999 | 41 (68.3%) | 19 (31.7%) |
| $50,000 to $74,999 | 164 (95.9%) | 7 (4.1%) |
| $75,000 to $99,999 | 66 (95.7%) | 3 (4.3%) |
| $100,000 and over | 88 (96.7%) | 3 (3.3%) |
Public vs Private Health Insurance Coverage by Age in Winthrop
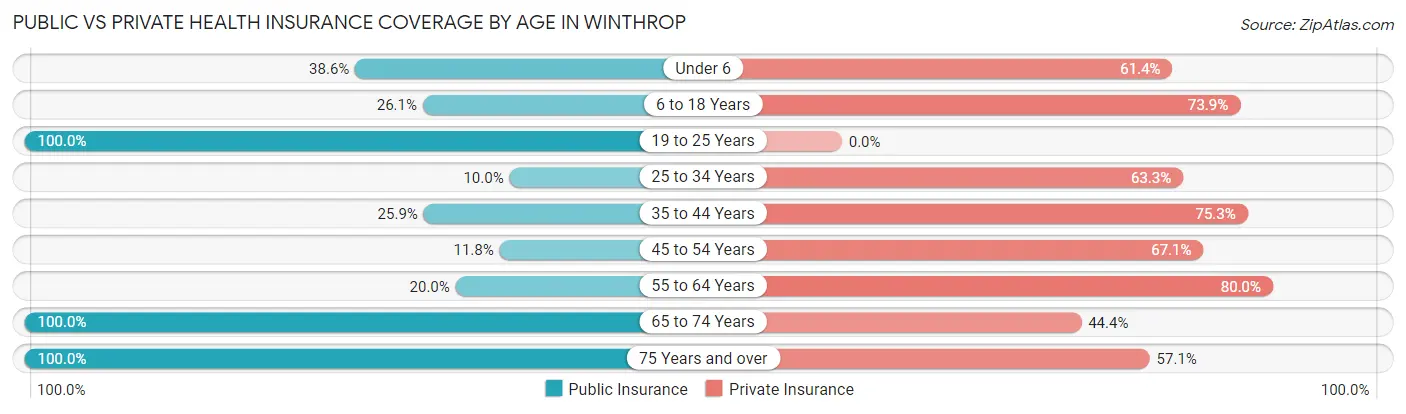
| Age Bracket | Public Insurance | Private Insurance |
| Under 6 | 17 (38.6%) | 27 (61.4%) |
| 6 to 18 Years | 18 (26.1%) | 51 (73.9%) |
| 19 to 25 Years | 12 (100.0%) | 0 (0.0%) |
| 25 to 34 Years | 3 (10.0%) | 19 (63.3%) |
| 35 to 44 Years | 21 (25.9%) | 61 (75.3%) |
| 45 to 54 Years | 9 (11.8%) | 51 (67.1%) |
| 55 to 64 Years | 9 (20.0%) | 36 (80.0%) |
| 65 to 74 Years | 18 (100.0%) | 8 (44.4%) |
| 75 Years and over | 28 (100.0%) | 16 (57.1%) |
| Total | 135 (33.5%) | 269 (66.7%) |
Disability Status by Sex by Age in Winthrop
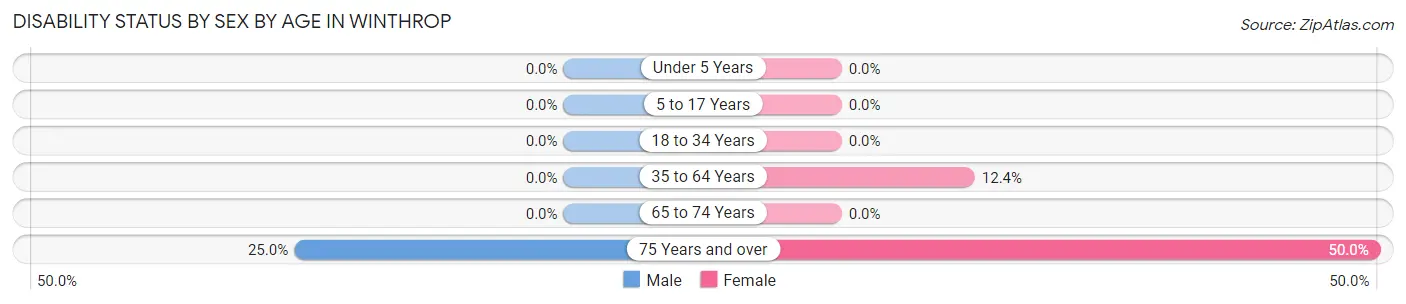
| Age Bracket | Male | Female |
| Under 5 Years | 0 (0.0%) | 0 (0.0%) |
| 5 to 17 Years | 0 (0.0%) | 0 (0.0%) |
| 18 to 34 Years | 0 (0.0%) | 0 (0.0%) |
| 35 to 64 Years | 0 (0.0%) | 10 (12.3%) |
| 65 to 74 Years | 0 (0.0%) | 0 (0.0%) |
| 75 Years and over | 3 (25.0%) | 8 (50.0%) |
Disability Class by Sex by Age in Winthrop
Disability Class: Hearing Difficulty
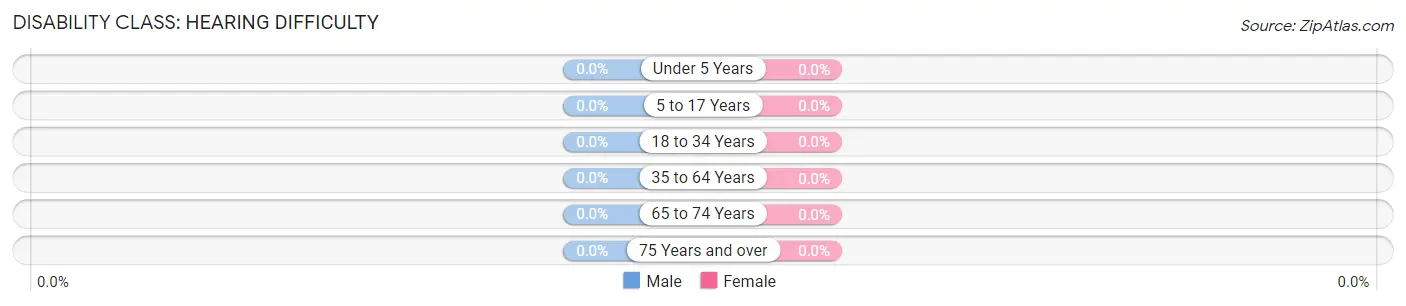
| Age Bracket | Male | Female |
| Under 5 Years | 0 (0.0%) | 0 (0.0%) |
| 5 to 17 Years | 0 (0.0%) | 0 (0.0%) |
| 18 to 34 Years | 0 (0.0%) | 0 (0.0%) |
| 35 to 64 Years | 0 (0.0%) | 0 (0.0%) |
| 65 to 74 Years | 0 (0.0%) | 0 (0.0%) |
| 75 Years and over | 0 (0.0%) | 0 (0.0%) |
Disability Class: Vision Difficulty
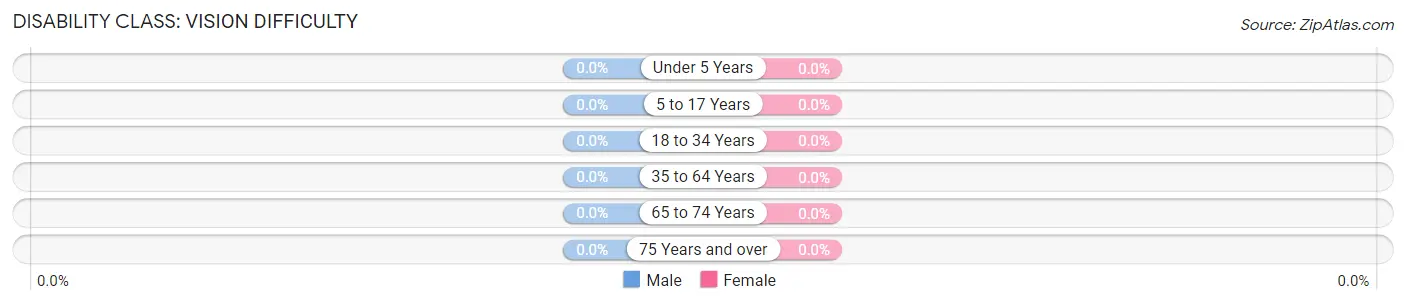
| Age Bracket | Male | Female |
| Under 5 Years | 0 (0.0%) | 0 (0.0%) |
| 5 to 17 Years | 0 (0.0%) | 0 (0.0%) |
| 18 to 34 Years | 0 (0.0%) | 0 (0.0%) |
| 35 to 64 Years | 0 (0.0%) | 0 (0.0%) |
| 65 to 74 Years | 0 (0.0%) | 0 (0.0%) |
| 75 Years and over | 0 (0.0%) | 0 (0.0%) |
Disability Class: Cognitive Difficulty
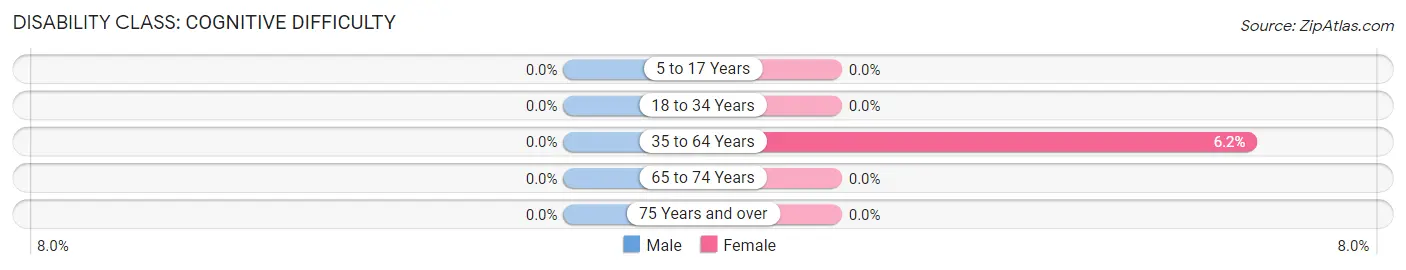
| Age Bracket | Male | Female |
| 5 to 17 Years | 0 (0.0%) | 0 (0.0%) |
| 18 to 34 Years | 0 (0.0%) | 0 (0.0%) |
| 35 to 64 Years | 0 (0.0%) | 5 (6.2%) |
| 65 to 74 Years | 0 (0.0%) | 0 (0.0%) |
| 75 Years and over | 0 (0.0%) | 0 (0.0%) |
Disability Class: Ambulatory Difficulty
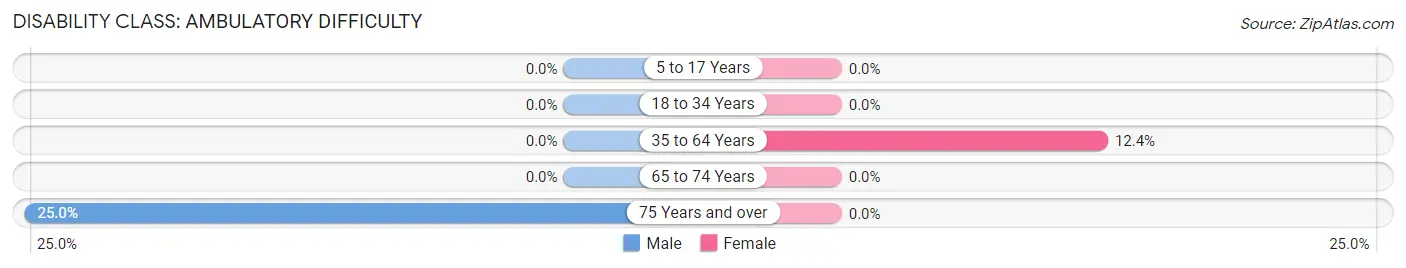
| Age Bracket | Male | Female |
| 5 to 17 Years | 0 (0.0%) | 0 (0.0%) |
| 18 to 34 Years | 0 (0.0%) | 0 (0.0%) |
| 35 to 64 Years | 0 (0.0%) | 10 (12.3%) |
| 65 to 74 Years | 0 (0.0%) | 0 (0.0%) |
| 75 Years and over | 3 (25.0%) | 0 (0.0%) |
Disability Class: Self-Care Difficulty
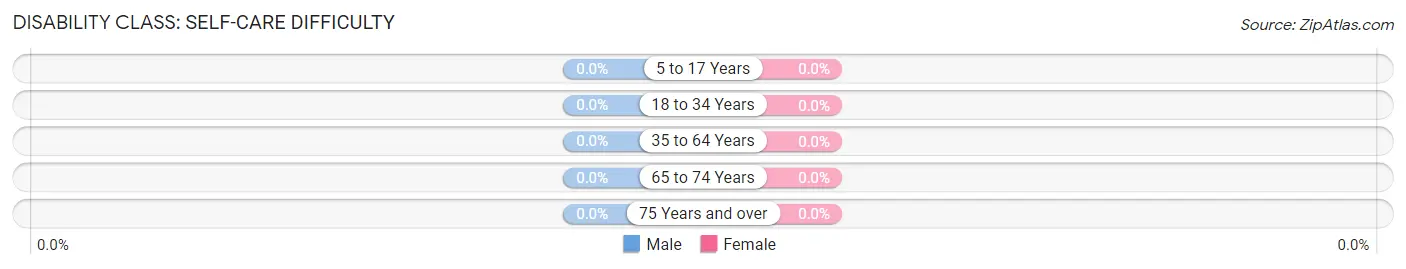
| Age Bracket | Male | Female |
| 5 to 17 Years | 0 (0.0%) | 0 (0.0%) |
| 18 to 34 Years | 0 (0.0%) | 0 (0.0%) |
| 35 to 64 Years | 0 (0.0%) | 0 (0.0%) |
| 65 to 74 Years | 0 (0.0%) | 0 (0.0%) |
| 75 Years and over | 0 (0.0%) | 0 (0.0%) |
Technology Access in Winthrop
Computing Device Access in Winthrop
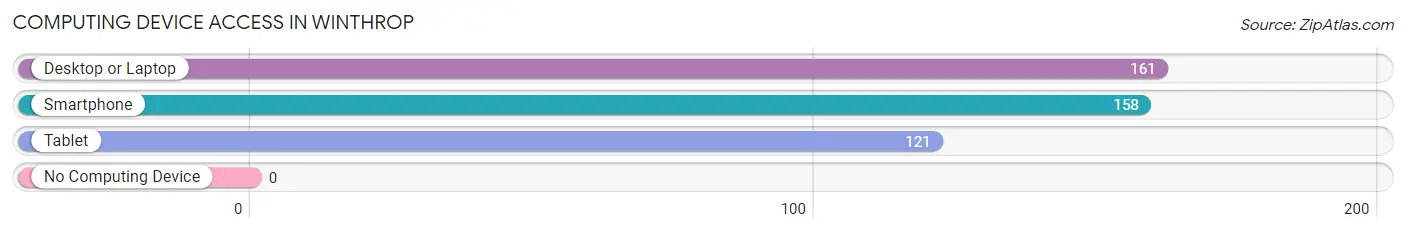
| Device Type | # Households | % Households |
| Desktop or Laptop | 161 | 87.5% |
| Smartphone | 158 | 85.9% |
| Tablet | 121 | 65.8% |
| No Computing Device | 0 | 0.0% |
| Total | 184 | 100.0% |
Internet Access in Winthrop
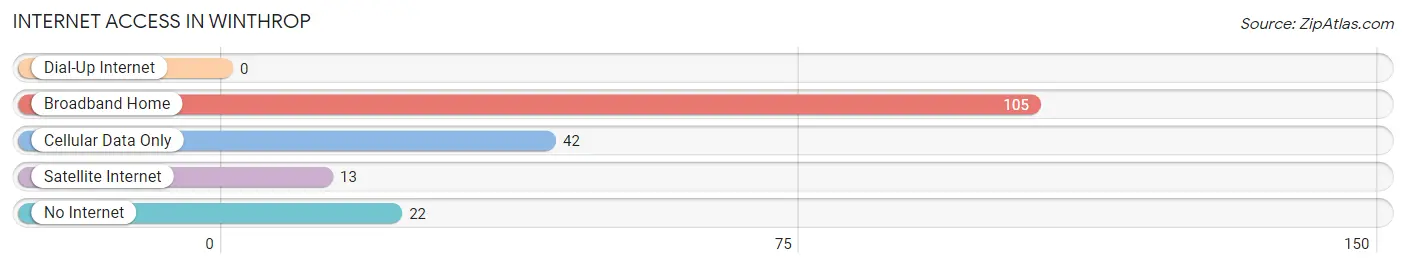
| Internet Type | # Households | % Households |
| Dial-Up Internet | 0 | 0.0% |
| Broadband Home | 105 | 57.1% |
| Cellular Data Only | 42 | 22.8% |
| Satellite Internet | 13 | 7.1% |
| No Internet | 22 | 12.0% |
| Total | 184 | 100.0% |
Winthrop Summary
Winthrop is a small town located in the Methow Valley of Washington State, in the United States. It is situated in the North Cascades mountain range, and is surrounded by the Okanogan National Forest. The town was founded in the late 19th century, and has a population of around 400 people.
Geography
Winthrop is located in the Methow Valley, in the North Cascades mountain range. The town is situated at an elevation of 1,845 feet (562 meters) above sea level. The town is surrounded by the Okanogan National Forest, and is located near the confluence of the Methow and Chewuch Rivers. The town is located approximately 100 miles (160 kilometers) east of Seattle, and is accessible by car via State Route 20.
Climate
Winthrop has a semi-arid climate, with hot summers and cold winters. The average high temperature in the summer is around 85°F (29°C), and the average low temperature in the winter is around 20°F (-7°C). The town receives an average of 16 inches (41 centimeters) of precipitation per year, with most of it falling in the winter months.
History
Winthrop was founded in the late 19th century by settlers from the East Coast of the United States. The town was named after John Winthrop, the first governor of the Massachusetts Bay Colony. The town was originally a trading post for miners and settlers in the area, and was later incorporated in 1889.
In the early 20th century, the town became a popular tourist destination, due to its proximity to the North Cascades mountain range. The town was also home to a number of dude ranches, which attracted visitors from all over the United States.
Economy
The economy of Winthrop is largely based on tourism. The town is home to a number of hotels, restaurants, and other tourist attractions. The town is also home to a number of outdoor recreation businesses, such as rafting, fishing, and horseback riding.
The town is also home to a number of small businesses, such as art galleries, antique stores, and gift shops. The town is also home to a number of wineries, which produce a variety of wines.
Demographics
As of the 2010 census, the population of Winthrop was 400 people. The town is predominantly white, with a small Hispanic population. The median household income in the town is $41,250, and the median age is 44.
Conclusion
Winthrop is a small town located in the Methow Valley of Washington State, in the United States. It is situated in the North Cascades mountain range, and is surrounded by the Okanogan National Forest. The town was founded in the late 19th century, and has a population of around 400 people. The economy of Winthrop is largely based on tourism, and the town is home to a number of small businesses. The town is predominantly white, with a small Hispanic population. Winthrop is a popular tourist destination, due to its proximity to the North Cascades mountain range, and its variety of outdoor recreation activities.
Common Questions
What is Per Capita Income in Winthrop?
Per Capita income in Winthrop is $43,202.
What is the Median Family Income in Winthrop?
Median Family Income in Winthrop is $80,417.
What is the Median Household income in Winthrop?
Median Household Income in Winthrop is $60,263.
What is Inequality or Gini Index in Winthrop?
Inequality or Gini Index in Winthrop is 0.47.
What is the Total Population of Winthrop?
Total Population of Winthrop is 408.
What is the Total Male Population of Winthrop?
Total Male Population of Winthrop is 222.
What is the Total Female Population of Winthrop?
Total Female Population of Winthrop is 186.
What is the Ratio of Males per 100 Females in Winthrop?
There are 119.35 Males per 100 Females in Winthrop.
What is the Ratio of Females per 100 Males in Winthrop?
There are 83.78 Females per 100 Males in Winthrop.
What is the Median Population Age in Winthrop?
Median Population Age in Winthrop is 38.5 Years.
What is the Average Family Size in Winthrop
Average Family Size in Winthrop is 3.2 People.
What is the Average Household Size in Winthrop
Average Household Size in Winthrop is 2.2 People.
How Large is the Labor Force in Winthrop?
There are 199 People in the Labor Forcein in Winthrop.
What is the Percentage of People in the Labor Force in Winthrop?
64.6% of People are in the Labor Force in Winthrop.
What is the Unemployment Rate in Winthrop?
Unemployment Rate in Winthrop is 1.5%.