Zip Codes with the Highest Percentage of Population Employed in Legal Services & Support in Puyallup, WA
RELATED REPORTS & OPTIONS
Legal Services & Support
Puyallup
Compare Zip Codes
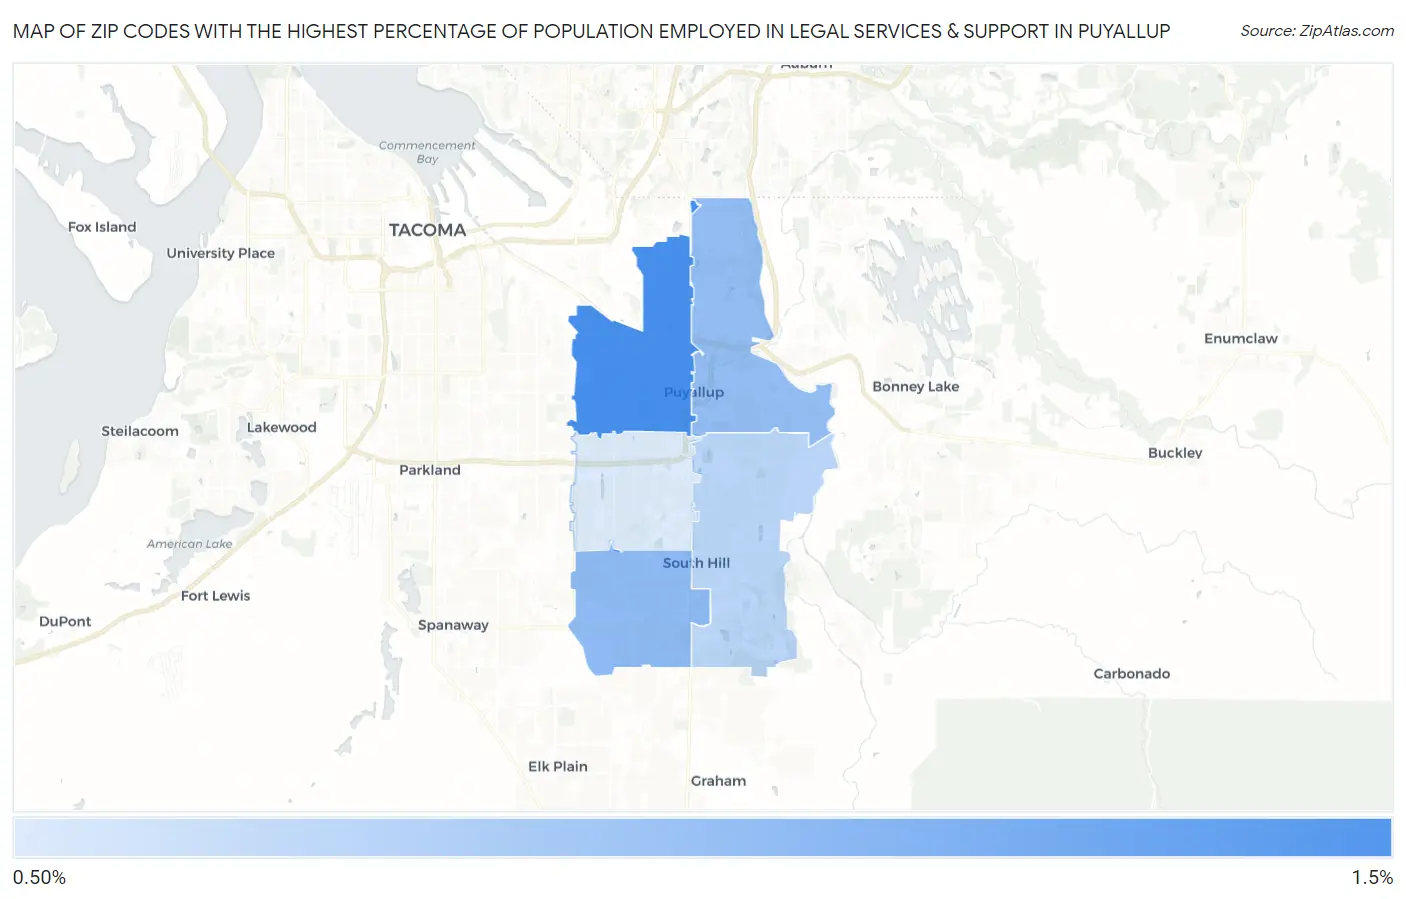
Map of Zip Codes with the Highest Percentage of Population Employed in Legal Services & Support in Puyallup
0.52%
1.1%
Zip Codes with the Highest Percentage of Population Employed in Legal Services & Support in Puyallup, WA
| Zip Code | % Employed | vs State | vs National | |
| 1. | 98371 | 1.1% | 1.1%(-0.002)#149 | 1.2%(-0.111)#7,349 |
| 2. | 98375 | 0.81% | 1.1%(-0.269)#214 | 1.2%(-0.379)#9,393 |
| 3. | 98372 | 0.79% | 1.1%(-0.283)#218 | 1.2%(-0.392)#9,531 |
| 4. | 98374 | 0.64% | 1.1%(-0.430)#260 | 1.2%(-0.539)#10,988 |
| 5. | 98373 | 0.52% | 1.1%(-0.558)#286 | 1.2%(-0.668)#12,422 |
1
Common Questions
What are the Top 3 Zip Codes with the Highest Percentage of Population Employed in Legal Services & Support in Puyallup, WA?
Top 3 Zip Codes with the Highest Percentage of Population Employed in Legal Services & Support in Puyallup, WA are:
What zip code has the Highest Percentage of Population Employed in Legal Services & Support in Puyallup, WA?
98371 has the Highest Percentage of Population Employed in Legal Services & Support in Puyallup, WA with 1.1%.
What is the Percentage of Population Employed in Legal Services & Support in Puyallup, WA?
Percentage of Population Employed in Legal Services & Support in Puyallup is 0.99%.
What is the Percentage of Population Employed in Legal Services & Support in Washington?
Percentage of Population Employed in Legal Services & Support in Washington is 1.1%.
What is the Percentage of Population Employed in Legal Services & Support in the United States?
Percentage of Population Employed in Legal Services & Support in the United States is 1.2%.