Port Townsend, WA Map & Demographics
Port Townsend Map
Port Townsend Overview
$43,155
PER CAPITA INCOME
$83,656
AVG FAMILY INCOME
$59,193
AVG HOUSEHOLD INCOME
15.6%
WAGE / INCOME GAP [ % ]
84.4¢/ $1
WAGE / INCOME GAP [ $ ]
0.46
INEQUALITY / GINI INDEX
10,161
TOTAL POPULATION
4,611
MALE POPULATION
5,550
FEMALE POPULATION
83.08
MALES / 100 FEMALES
120.36
FEMALES / 100 MALES
59.5
MEDIAN AGE
2.5
AVG FAMILY SIZE
1.9
AVG HOUSEHOLD SIZE
4,122
LABOR FORCE [ PEOPLE ]
44.5%
PERCENT IN LABOR FORCE
13.7%
UNEMPLOYMENT RATE
Port Townsend Zip Codes
Port Townsend Area Codes
Income in Port Townsend
Income Overview in Port Townsend
Per Capita Income in Port Townsend is $43,155, while median incomes of families and households are $83,656 and $59,193 respectively.
| Characteristic | Number | Measure |
| Per Capita Income | 10,161 | $43,155 |
| Median Family Income | 2,509 | $83,656 |
| Mean Family Income | 2,509 | $105,663 |
| Median Household Income | 5,371 | $59,193 |
| Mean Household Income | 5,371 | $80,981 |
| Income Deficit | 2,509 | $0 |
| Wage / Income Gap (%) | 10,161 | 15.64% |
| Wage / Income Gap ($) | 10,161 | 84.36¢ per $1 |
| Gini / Inequality Index | 10,161 | 0.46 |
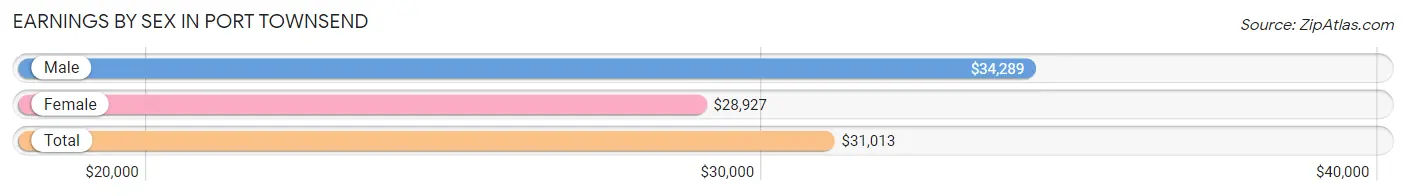
Earnings by Sex in Port Townsend
Average Earnings in Port Townsend are $31,013, $34,289 for men and $28,927 for women, a difference of 15.6%.
| Sex | Number | Average Earnings |
| Male | 2,048 (46.2%) | $34,289 |
| Female | 2,389 (53.8%) | $28,927 |
| Total | 4,437 (100.0%) | $31,013 |
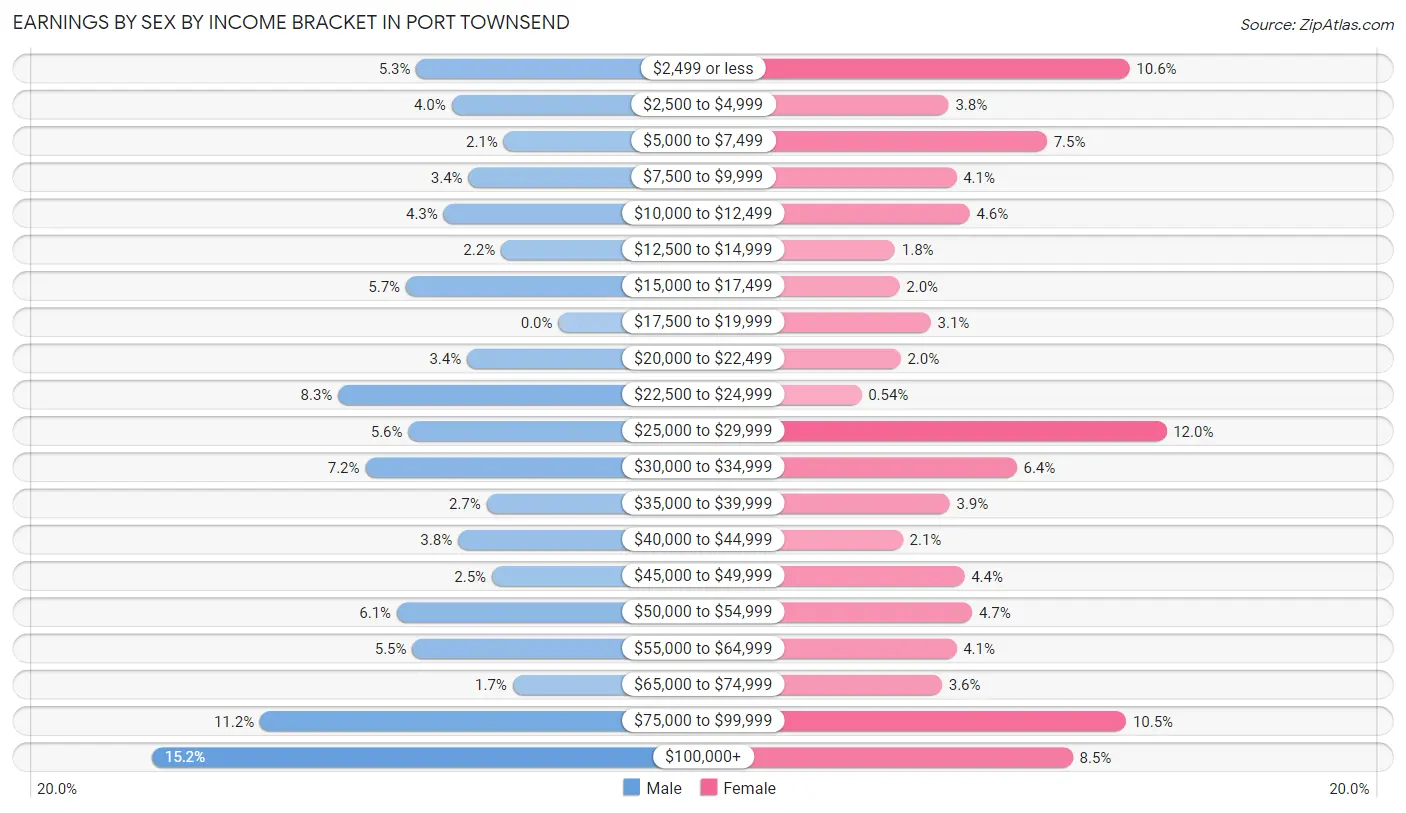
Earnings by Sex by Income Bracket in Port Townsend
The most common earnings brackets in Port Townsend are $100,000+ for men (312 | 15.2%) and $25,000 to $29,999 for women (286 | 12.0%).
| Income | Male | Female |
| $2,499 or less | 109 (5.3%) | 253 (10.6%) |
| $2,500 to $4,999 | 82 (4.0%) | 91 (3.8%) |
| $5,000 to $7,499 | 42 (2.1%) | 179 (7.5%) |
| $7,500 to $9,999 | 69 (3.4%) | 98 (4.1%) |
| $10,000 to $12,499 | 88 (4.3%) | 110 (4.6%) |
| $12,500 to $14,999 | 44 (2.1%) | 43 (1.8%) |
| $15,000 to $17,499 | 117 (5.7%) | 47 (2.0%) |
| $17,500 to $19,999 | 0 (0.0%) | 75 (3.1%) |
| $20,000 to $22,499 | 70 (3.4%) | 48 (2.0%) |
| $22,500 to $24,999 | 169 (8.3%) | 13 (0.5%) |
| $25,000 to $29,999 | 115 (5.6%) | 286 (12.0%) |
| $30,000 to $34,999 | 148 (7.2%) | 152 (6.4%) |
| $35,000 to $39,999 | 55 (2.7%) | 92 (3.8%) |
| $40,000 to $44,999 | 77 (3.8%) | 50 (2.1%) |
| $45,000 to $49,999 | 51 (2.5%) | 105 (4.4%) |
| $50,000 to $54,999 | 124 (6.0%) | 112 (4.7%) |
| $55,000 to $64,999 | 112 (5.5%) | 98 (4.1%) |
| $65,000 to $74,999 | 35 (1.7%) | 85 (3.6%) |
| $75,000 to $99,999 | 229 (11.2%) | 250 (10.5%) |
| $100,000+ | 312 (15.2%) | 202 (8.5%) |
| Total | 2,048 (100.0%) | 2,389 (100.0%) |
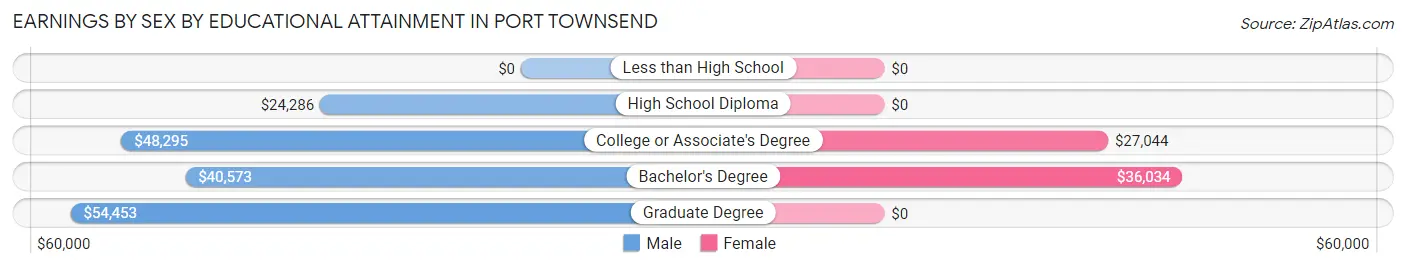
Earnings by Sex by Educational Attainment in Port Townsend
Average earnings in Port Townsend are $41,406 for men and $31,650 for women, a difference of 23.6%. Men with an educational attainment of graduate degree enjoy the highest average annual earnings of $54,453, while those with high school diploma education earn the least with $24,286. Women with an educational attainment of bachelor's degree earn the most with the average annual earnings of $36,034, while those with college or associate's degree education have the smallest earnings of $27,044.
| Educational Attainment | Male Income | Female Income |
| Less than High School | - | - |
| High School Diploma | $24,286 | $0 |
| College or Associate's Degree | $48,295 | $27,044 |
| Bachelor's Degree | $40,573 | $36,034 |
| Graduate Degree | $54,453 | $0 |
| Total | $41,406 | $31,650 |
Family Income in Port Townsend
Family Income Brackets in Port Townsend
According to the Port Townsend family income data, there are 462 families falling into the $100,000 to $149,999 income range, which is the most common income bracket and makes up 18.4% of all families. Conversely, the $10,000 to $14,999 income bracket is the least frequent group with only 38 families (1.5%) belonging to this category.
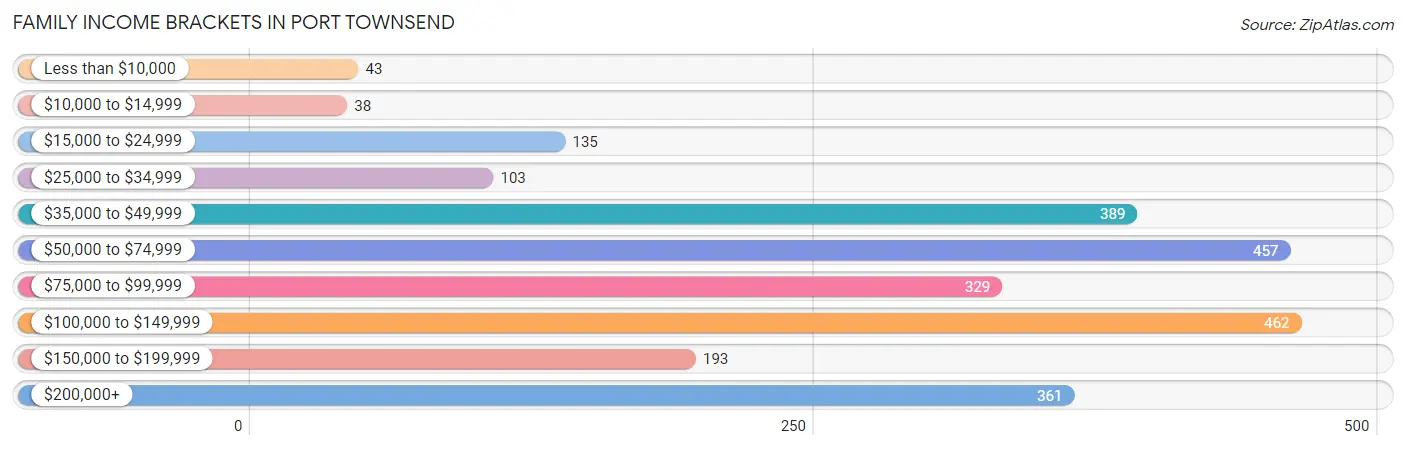
| Income Bracket | # Families | % Families |
| Less than $10,000 | 43 | 1.7% |
| $10,000 to $14,999 | 38 | 1.5% |
| $15,000 to $24,999 | 135 | 5.4% |
| $25,000 to $34,999 | 103 | 4.1% |
| $35,000 to $49,999 | 389 | 15.5% |
| $50,000 to $74,999 | 457 | 18.2% |
| $75,000 to $99,999 | 329 | 13.1% |
| $100,000 to $149,999 | 462 | 18.4% |
| $150,000 to $199,999 | 193 | 7.7% |
| $200,000+ | 361 | 14.4% |
Family Income by Famaliy Size in Port Townsend
3-person families (351 | 14.0%) account for the highest median family income in Port Townsend with $97,750 per family, while 2-person families (1,671 | 66.6%) have the highest median income of $41,375 per family member.
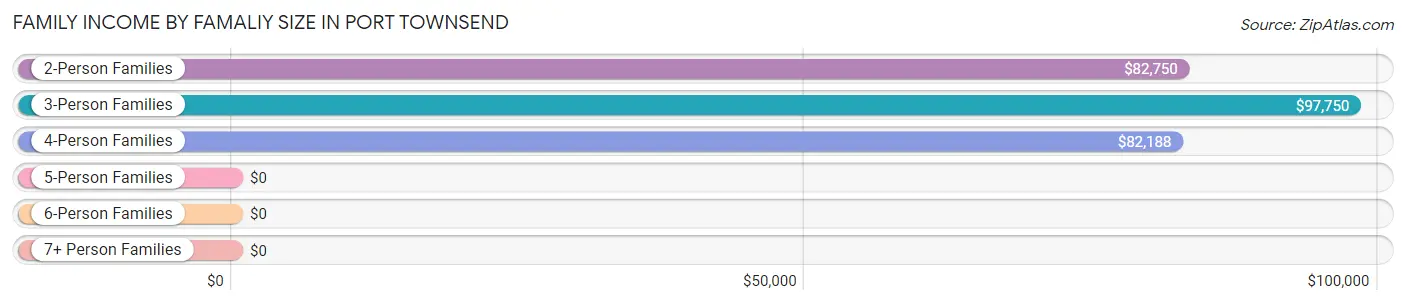
| Income Bracket | # Families | Median Income |
| 2-Person Families | 1,671 (66.6%) | $82,750 |
| 3-Person Families | 351 (14.0%) | $97,750 |
| 4-Person Families | 402 (16.0%) | $82,188 |
| 5-Person Families | 75 (3.0%) | $0 |
| 6-Person Families | 0 (0.0%) | $0 |
| 7+ Person Families | 10 (0.4%) | $0 |
| Total | 2,509 (100.0%) | $83,656 |
Family Income by Number of Earners in Port Townsend
The median family income in Port Townsend is $83,656, with families comprising 3+ earners (331) having the highest median family income of $99,917, while families with 1 earner (697) have the lowest median family income of $75,446, accounting for 13.2% and 27.8% of families, respectively.
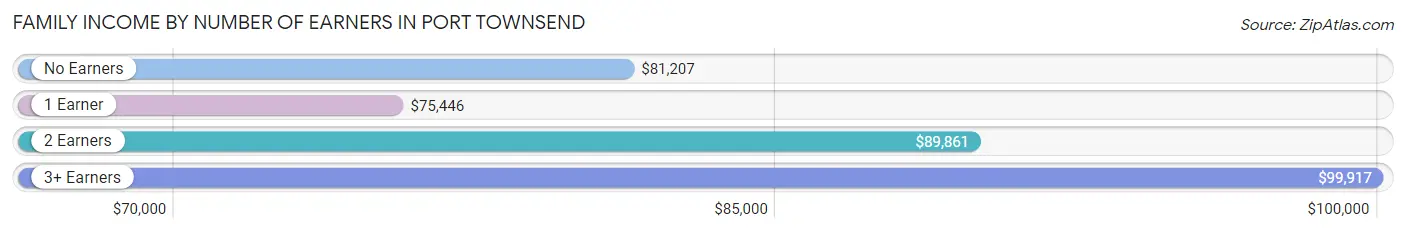
| Number of Earners | # Families | Median Income |
| No Earners | 746 (29.7%) | $81,207 |
| 1 Earner | 697 (27.8%) | $75,446 |
| 2 Earners | 735 (29.3%) | $89,861 |
| 3+ Earners | 331 (13.2%) | $99,917 |
| Total | 2,509 (100.0%) | $83,656 |
Household Income in Port Townsend
Household Income Brackets in Port Townsend
With 972 households falling in the category, the $50,000 to $74,999 income range is the most frequent in Port Townsend, accounting for 18.1% of all households. In contrast, only 312 households (5.8%) fall into the less than $10,000 income bracket, making it the least populous group.
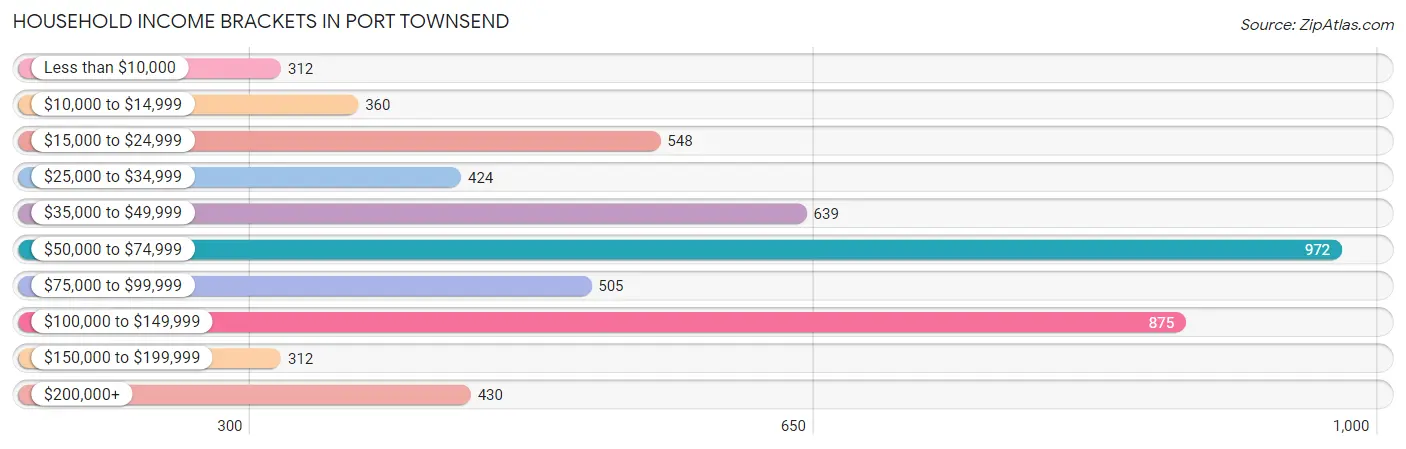
| Income Bracket | # Households | % Households |
| Less than $10,000 | 312 | 5.8% |
| $10,000 to $14,999 | 360 | 6.7% |
| $15,000 to $24,999 | 548 | 10.2% |
| $25,000 to $34,999 | 424 | 7.9% |
| $35,000 to $49,999 | 639 | 11.9% |
| $50,000 to $74,999 | 972 | 18.1% |
| $75,000 to $99,999 | 505 | 9.4% |
| $100,000 to $149,999 | 875 | 16.3% |
| $150,000 to $199,999 | 312 | 5.8% |
| $200,000+ | 430 | 8.0% |
Household Income by Householder Age in Port Townsend
The median household income in Port Townsend is $59,193, with the highest median household income of $61,406 found in the 45 to 64 years age bracket for the primary householder. A total of 1,596 households (29.7%) fall into this category. Meanwhile, the 15 to 24 years age bracket for the primary householder has the lowest median household income of $0, with 48 households (0.9%) in this group.
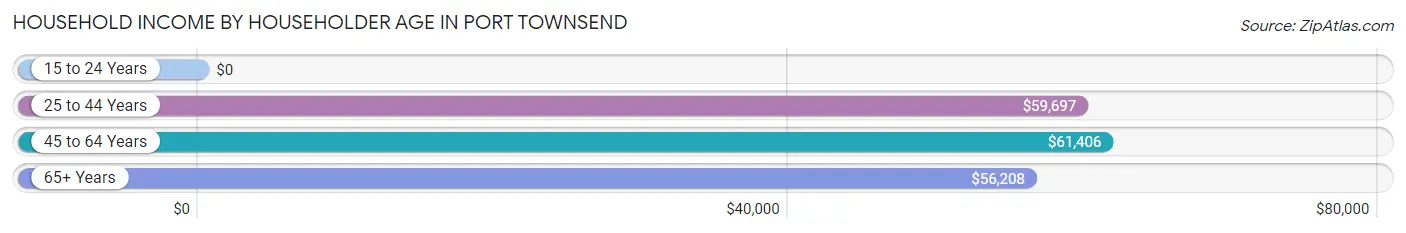
| Income Bracket | # Households | Median Income |
| 15 to 24 Years | 48 (0.9%) | $0 |
| 25 to 44 Years | 901 (16.8%) | $59,697 |
| 45 to 64 Years | 1,596 (29.7%) | $61,406 |
| 65+ Years | 2,826 (52.6%) | $56,208 |
| Total | 5,371 (100.0%) | $59,193 |
Poverty in Port Townsend
Income Below Poverty by Sex and Age in Port Townsend
With 9.5% poverty level for males and 17.7% for females among the residents of Port Townsend, 6 to 11 year old males and 15 year old females are the most vulnerable to poverty, with 37 males (25.9%) and 14 females (36.8%) in their respective age groups living below the poverty level.
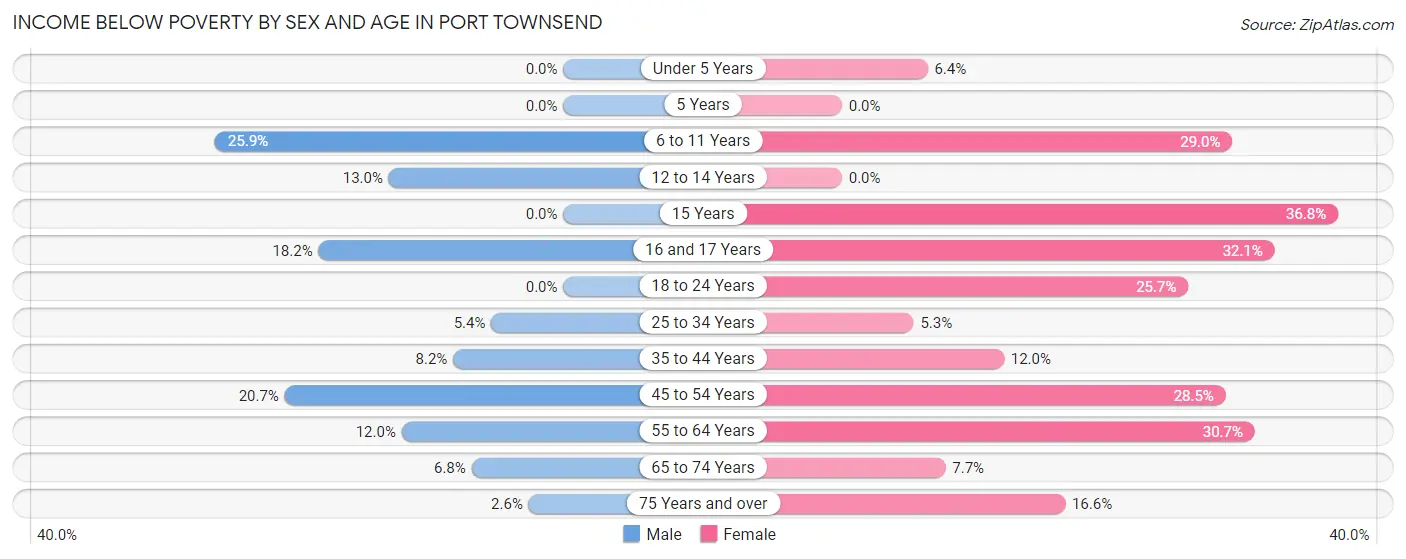
| Age Bracket | Male | Female |
| Under 5 Years | 0 (0.0%) | 7 (6.4%) |
| 5 Years | 0 (0.0%) | 0 (0.0%) |
| 6 to 11 Years | 37 (25.9%) | 80 (29.0%) |
| 12 to 14 Years | 14 (13.0%) | 0 (0.0%) |
| 15 Years | 0 (0.0%) | 14 (36.8%) |
| 16 and 17 Years | 36 (18.2%) | 9 (32.1%) |
| 18 to 24 Years | 0 (0.0%) | 80 (25.7%) |
| 25 to 34 Years | 13 (5.3%) | 20 (5.3%) |
| 35 to 44 Years | 44 (8.2%) | 54 (12.0%) |
| 45 to 54 Years | 120 (20.7%) | 161 (28.5%) |
| 55 to 64 Years | 78 (12.0%) | 298 (30.7%) |
| 65 to 74 Years | 71 (6.8%) | 109 (7.7%) |
| 75 Years and over | 19 (2.6%) | 139 (16.6%) |
| Total | 432 (9.5%) | 971 (17.7%) |
Income Above Poverty by Sex and Age in Port Townsend
According to the poverty statistics in Port Townsend, males aged under 5 years and females aged 5 years are the age groups that are most secure financially, with 100.0% of males and 100.0% of females in these age groups living above the poverty line.
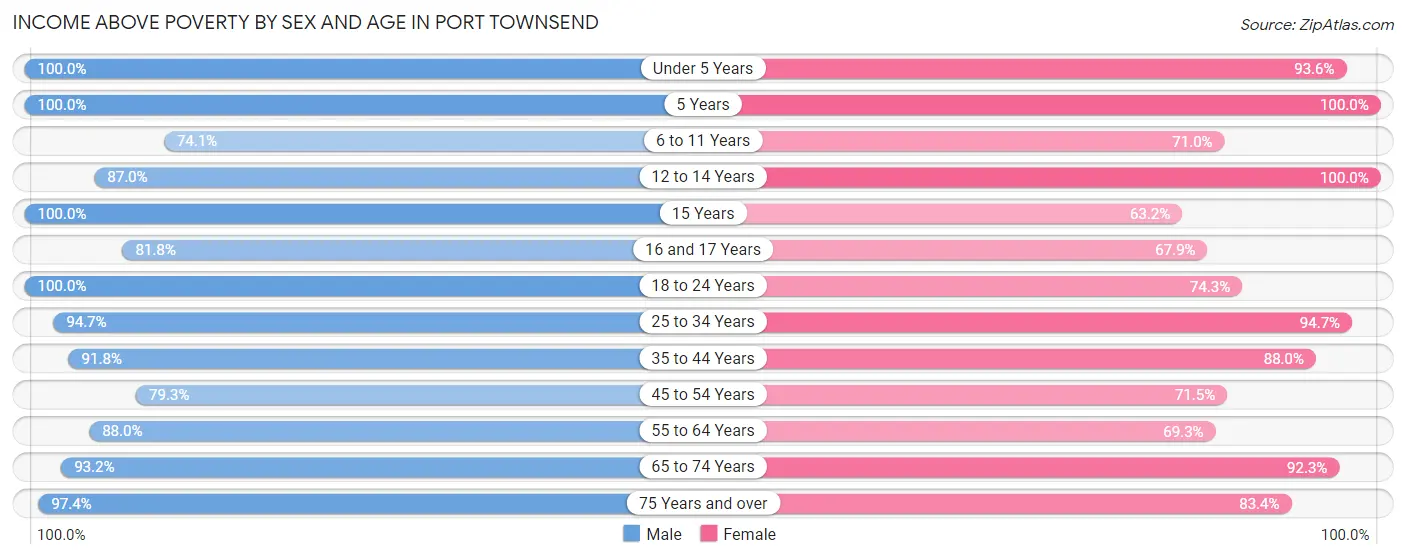
| Age Bracket | Male | Female |
| Under 5 Years | 47 (100.0%) | 103 (93.6%) |
| 5 Years | 13 (100.0%) | 32 (100.0%) |
| 6 to 11 Years | 106 (74.1%) | 196 (71.0%) |
| 12 to 14 Years | 94 (87.0%) | 75 (100.0%) |
| 15 Years | 28 (100.0%) | 24 (63.2%) |
| 16 and 17 Years | 162 (81.8%) | 19 (67.9%) |
| 18 to 24 Years | 216 (100.0%) | 231 (74.3%) |
| 25 to 34 Years | 230 (94.7%) | 356 (94.7%) |
| 35 to 44 Years | 494 (91.8%) | 395 (88.0%) |
| 45 to 54 Years | 460 (79.3%) | 404 (71.5%) |
| 55 to 64 Years | 572 (88.0%) | 674 (69.3%) |
| 65 to 74 Years | 972 (93.2%) | 1,308 (92.3%) |
| 75 Years and over | 721 (97.4%) | 700 (83.4%) |
| Total | 4,115 (90.5%) | 4,517 (82.3%) |
Income Below Poverty Among Married-Couple Families in Port Townsend
The poverty statistics for married-couple families in Port Townsend show that 2.2% or 46 of the total 2,089 families live below the poverty line. Families with 1 or 2 children have the highest poverty rate of 4.6%, comprising of 24 families. On the other hand, families with 5 or more children have the lowest poverty rate of 0.0%, which includes 0 families.
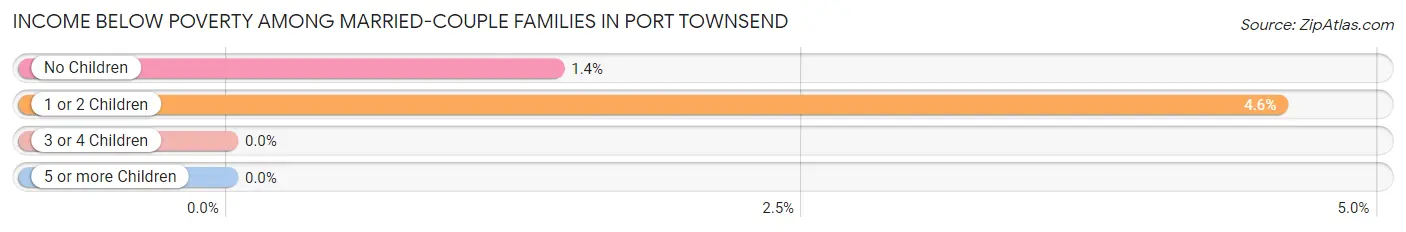
| Children | Above Poverty | Below Poverty |
| No Children | 1,532 (98.6%) | 22 (1.4%) |
| 1 or 2 Children | 501 (95.4%) | 24 (4.6%) |
| 3 or 4 Children | 0 (0.0%) | 0 (0.0%) |
| 5 or more Children | 10 (100.0%) | 0 (0.0%) |
| Total | 2,043 (97.8%) | 46 (2.2%) |
Income Below Poverty Among Single-Parent Households in Port Townsend
According to the poverty data in Port Townsend, 4.5% or 7 single-father households and 55.1% or 145 single-mother households are living below the poverty line. Among single-father households, those with 1 or 2 children have the highest poverty rate, with 7 households (13.7%) experiencing poverty. Likewise, among single-mother households, those with 1 or 2 children have the highest poverty rate, with 112 households (68.3%) falling below the poverty line.
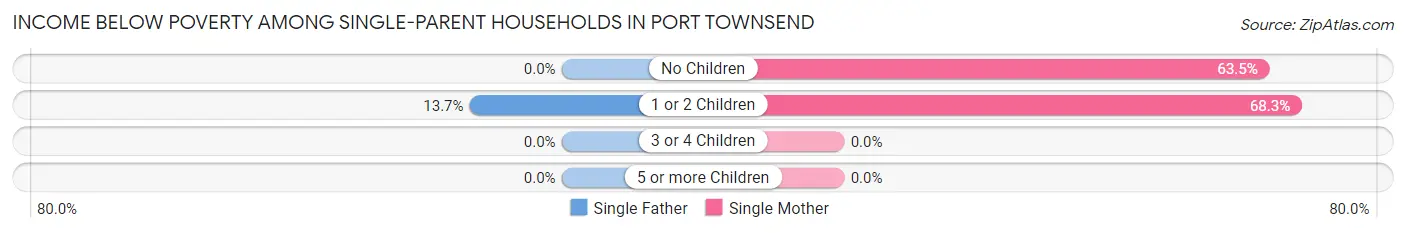
| Children | Single Father | Single Mother |
| No Children | 0 (0.0%) | 33 (63.5%) |
| 1 or 2 Children | 7 (13.7%) | 112 (68.3%) |
| 3 or 4 Children | 0 (0.0%) | 0 (0.0%) |
| 5 or more Children | 0 (0.0%) | 0 (0.0%) |
| Total | 7 (4.5%) | 145 (55.1%) |
Income Below Poverty Among Married-Couple vs Single-Parent Households in Port Townsend
The poverty data for Port Townsend shows that 46 of the married-couple family households (2.2%) and 152 of the single-parent households (36.2%) are living below the poverty level. Within the married-couple family households, those with 1 or 2 children have the highest poverty rate, with 24 households (4.6%) falling below the poverty line. Among the single-parent households, those with 1 or 2 children have the highest poverty rate, with 119 household (55.3%) living below poverty.
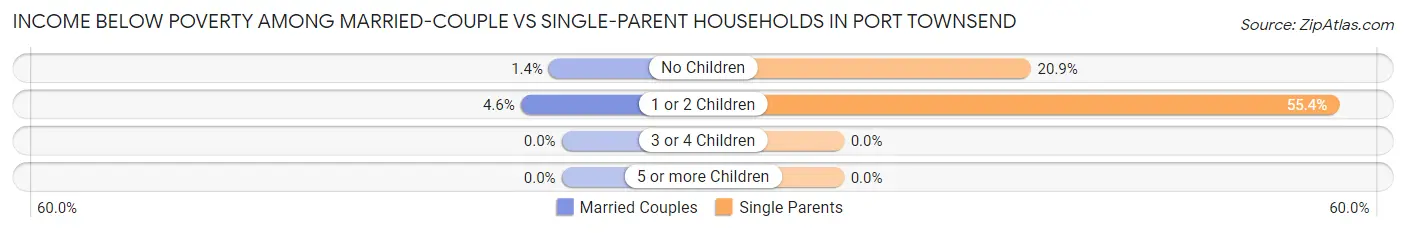
| Children | Married-Couple Families | Single-Parent Households |
| No Children | 22 (1.4%) | 33 (20.9%) |
| 1 or 2 Children | 24 (4.6%) | 119 (55.3%) |
| 3 or 4 Children | 0 (0.0%) | 0 (0.0%) |
| 5 or more Children | 0 (0.0%) | 0 (0.0%) |
| Total | 46 (2.2%) | 152 (36.2%) |
Race in Port Townsend
The most populous races in Port Townsend are White / Caucasian (9,172 | 90.3%), Two or more Races (430 | 4.2%), and Hispanic or Latino (360 | 3.5%).
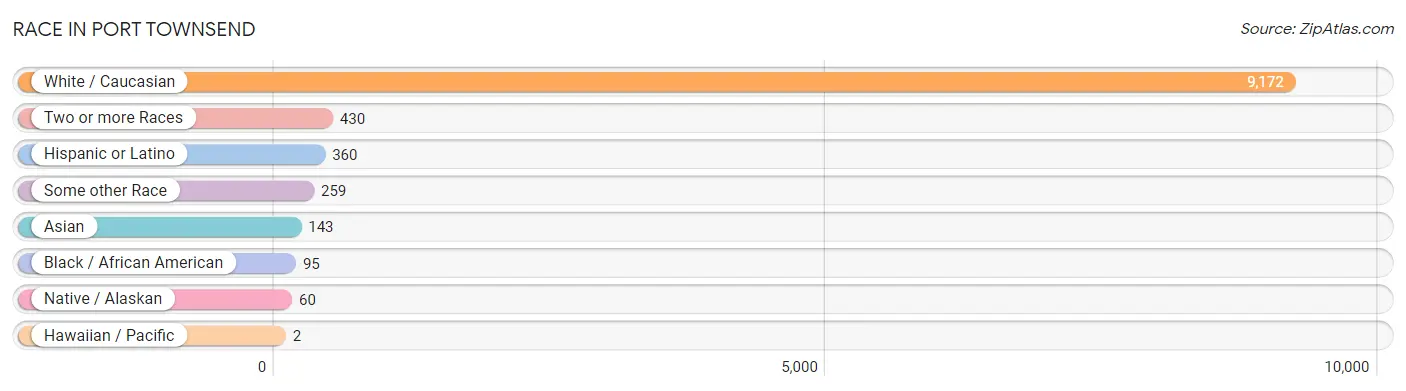
| Race | # Population | % Population |
| Asian | 143 | 1.4% |
| Black / African American | 95 | 0.9% |
| Hawaiian / Pacific | 2 | 0.0% |
| Hispanic or Latino | 360 | 3.5% |
| Native / Alaskan | 60 | 0.6% |
| White / Caucasian | 9,172 | 90.3% |
| Two or more Races | 430 | 4.2% |
| Some other Race | 259 | 2.5% |
| Total | 10,161 | 100.0% |
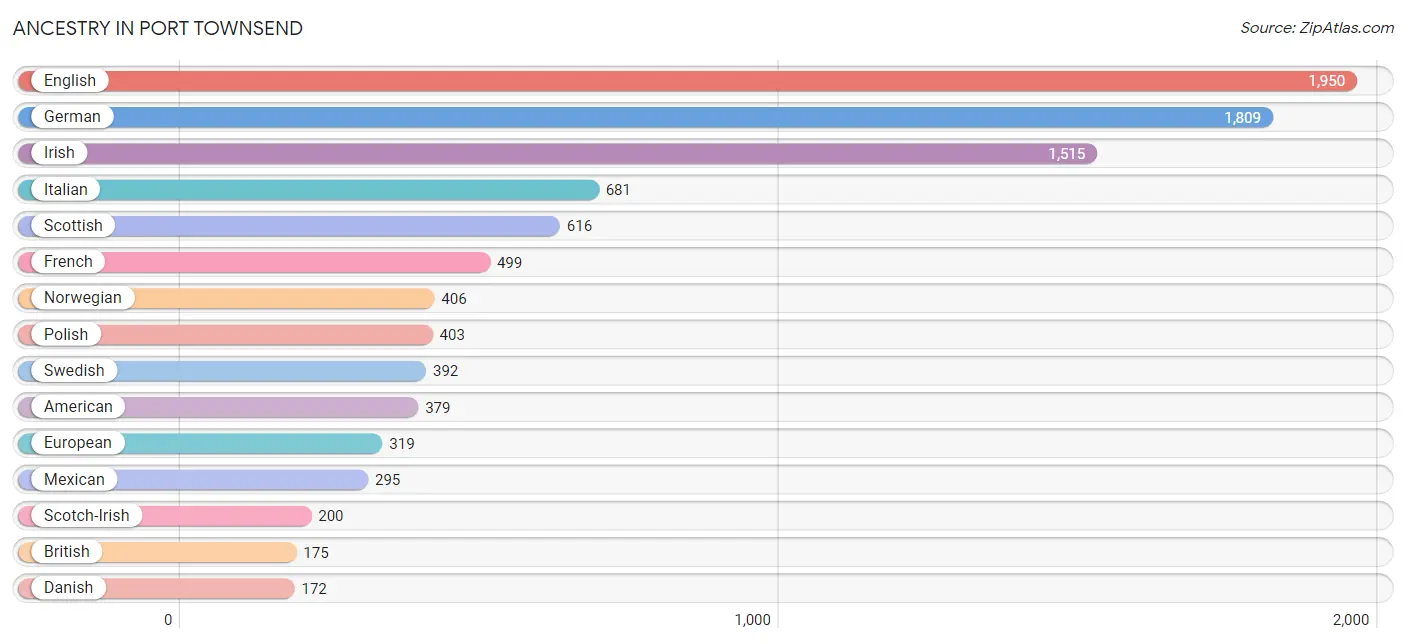
Ancestry in Port Townsend
The most populous ancestries reported in Port Townsend are English (1,950 | 19.2%), German (1,809 | 17.8%), Irish (1,515 | 14.9%), Italian (681 | 6.7%), and Scottish (616 | 6.1%), together accounting for 64.7% of all Port Townsend residents.
| Ancestry | # Population | % Population |
| African | 5 | 0.1% |
| American | 379 | 3.7% |
| Arab | 14 | 0.1% |
| Austrian | 36 | 0.4% |
| Bhutanese | 46 | 0.4% |
| Blackfeet | 19 | 0.2% |
| British | 175 | 1.7% |
| Canadian | 82 | 0.8% |
| Cherokee | 10 | 0.1% |
| Chickasaw | 3 | 0.0% |
| Choctaw | 30 | 0.3% |
| Czech | 109 | 1.1% |
| Danish | 172 | 1.7% |
| Dutch | 121 | 1.2% |
| Eastern European | 87 | 0.9% |
| English | 1,950 | 19.2% |
| European | 319 | 3.1% |
| Finnish | 123 | 1.2% |
| French | 499 | 4.9% |
| French Canadian | 48 | 0.5% |
| German | 1,809 | 17.8% |
| Greek | 21 | 0.2% |
| Hungarian | 45 | 0.4% |
| Indian (Asian) | 29 | 0.3% |
| Irish | 1,515 | 14.9% |
| Italian | 681 | 6.7% |
| Korean | 99 | 1.0% |
| Laotian | 11 | 0.1% |
| Lebanese | 14 | 0.1% |
| Lithuanian | 84 | 0.8% |
| Macedonian | 7 | 0.1% |
| Mexican | 295 | 2.9% |
| Native Hawaiian | 2 | 0.0% |
| Navajo | 42 | 0.4% |
| Nigerian | 33 | 0.3% |
| Northern European | 73 | 0.7% |
| Norwegian | 406 | 4.0% |
| Polish | 403 | 4.0% |
| Portuguese | 27 | 0.3% |
| Puerto Rican | 34 | 0.3% |
| Puget Sound Salish | 18 | 0.2% |
| Romanian | 12 | 0.1% |
| Russian | 139 | 1.4% |
| Scandinavian | 62 | 0.6% |
| Scotch-Irish | 200 | 2.0% |
| Scottish | 616 | 6.1% |
| Slovak | 52 | 0.5% |
| Spaniard | 23 | 0.2% |
| Subsaharan African | 38 | 0.4% |
| Sudanese | 33 | 0.3% |
| Swedish | 392 | 3.9% |
| Swiss | 21 | 0.2% |
| Thai | 62 | 0.6% |
| Ukrainian | 5 | 0.1% |
| Welsh | 138 | 1.4% |
| Yugoslavian | 11 | 0.1% | View All 56 Rows |
Immigrants in Port Townsend
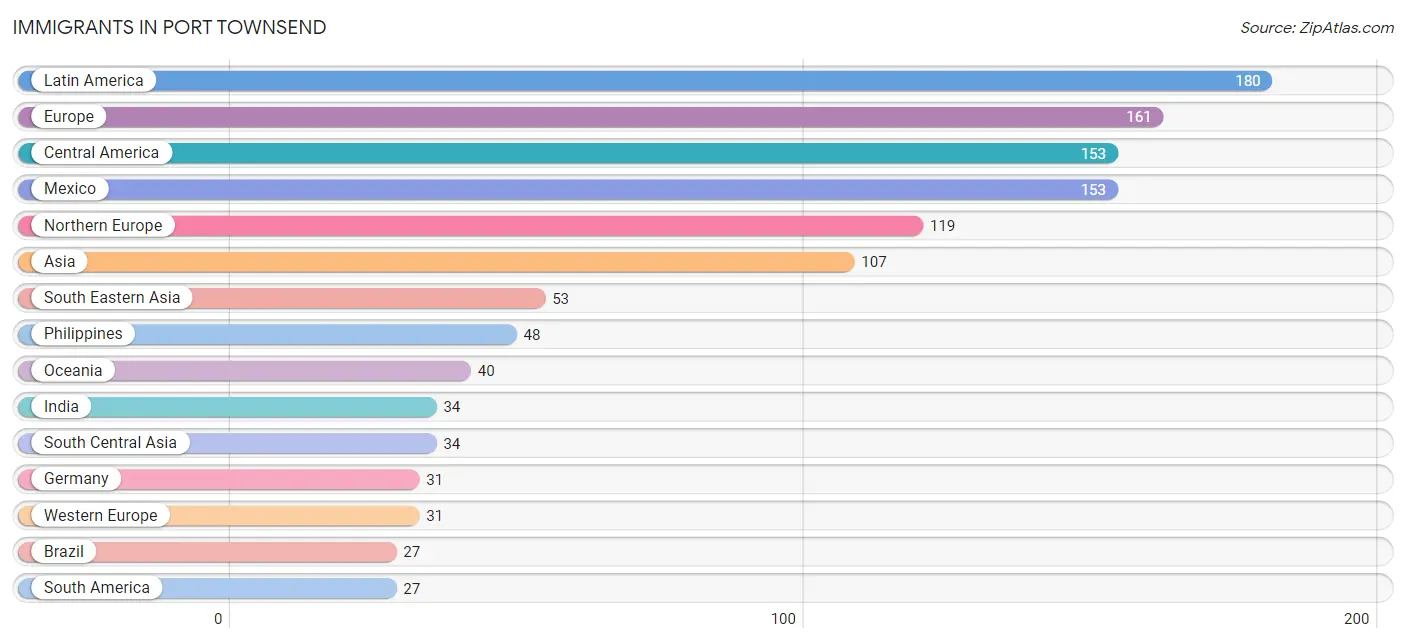
The most numerous immigrant groups reported in Port Townsend came from Latin America (180 | 1.8%), Europe (161 | 1.6%), Central America (153 | 1.5%), Mexico (153 | 1.5%), and Northern Europe (119 | 1.2%), together accounting for 7.5% of all Port Townsend residents.
| Immigration Origin | # Population | % Population |
| Asia | 107 | 1.1% |
| Brazil | 27 | 0.3% |
| Central America | 153 | 1.5% |
| China | 14 | 0.1% |
| Eastern Asia | 20 | 0.2% |
| Eastern Europe | 11 | 0.1% |
| England | 3 | 0.0% |
| Europe | 161 | 1.6% |
| Germany | 31 | 0.3% |
| India | 34 | 0.3% |
| Indonesia | 5 | 0.1% |
| Japan | 6 | 0.1% |
| Latin America | 180 | 1.8% |
| Mexico | 153 | 1.5% |
| Micronesia | 2 | 0.0% |
| Northern Europe | 119 | 1.2% |
| Norway | 9 | 0.1% |
| Oceania | 40 | 0.4% |
| Philippines | 48 | 0.5% |
| Poland | 3 | 0.0% |
| Russia | 8 | 0.1% |
| South America | 27 | 0.3% |
| South Central Asia | 34 | 0.3% |
| South Eastern Asia | 53 | 0.5% |
| Sweden | 18 | 0.2% |
| Western Europe | 31 | 0.3% | View All 26 Rows |
Sex and Age in Port Townsend
Sex and Age in Port Townsend
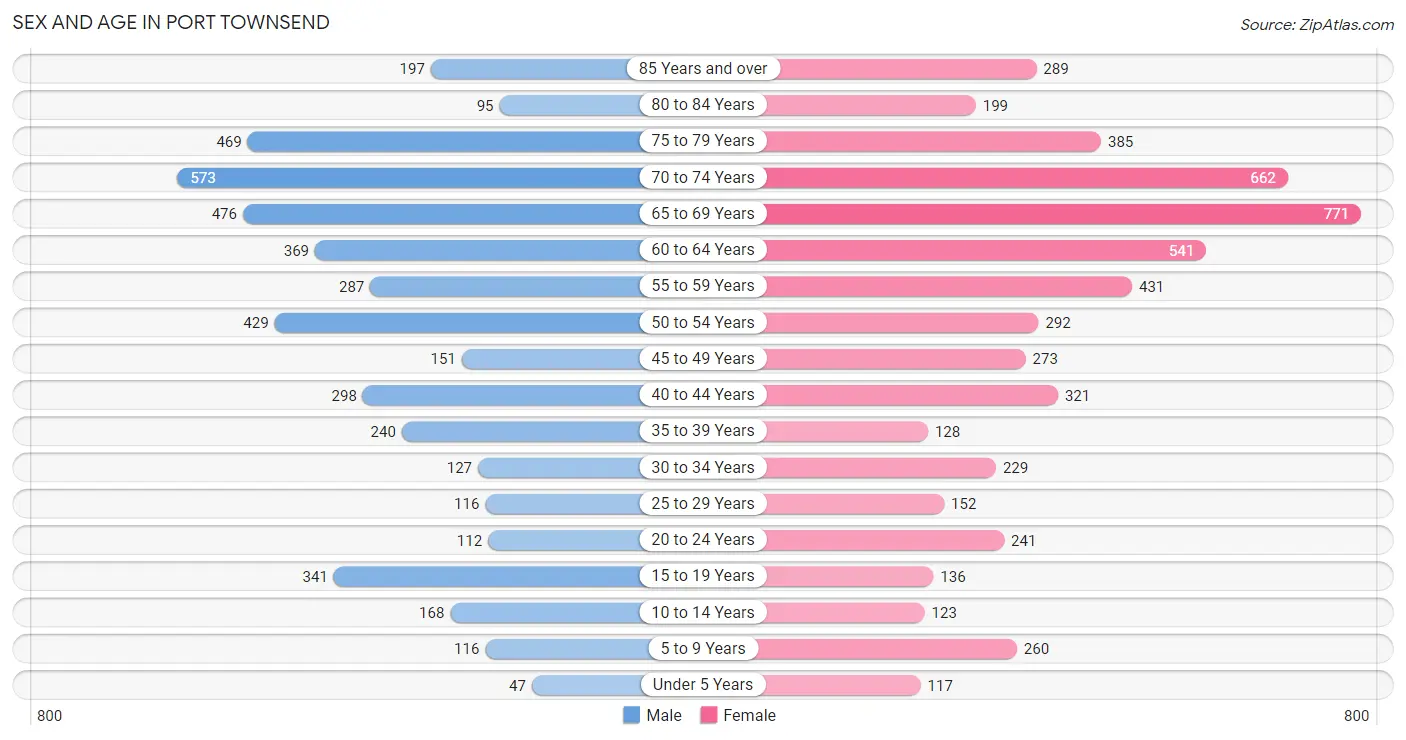
The most populous age groups in Port Townsend are 70 to 74 Years (573 | 12.4%) for men and 65 to 69 Years (771 | 13.9%) for women.
| Age Bracket | Male | Female |
| Under 5 Years | 47 (1.0%) | 117 (2.1%) |
| 5 to 9 Years | 116 (2.5%) | 260 (4.7%) |
| 10 to 14 Years | 168 (3.6%) | 123 (2.2%) |
| 15 to 19 Years | 341 (7.4%) | 136 (2.5%) |
| 20 to 24 Years | 112 (2.4%) | 241 (4.3%) |
| 25 to 29 Years | 116 (2.5%) | 152 (2.7%) |
| 30 to 34 Years | 127 (2.8%) | 229 (4.1%) |
| 35 to 39 Years | 240 (5.2%) | 128 (2.3%) |
| 40 to 44 Years | 298 (6.5%) | 321 (5.8%) |
| 45 to 49 Years | 151 (3.3%) | 273 (4.9%) |
| 50 to 54 Years | 429 (9.3%) | 292 (5.3%) |
| 55 to 59 Years | 287 (6.2%) | 431 (7.8%) |
| 60 to 64 Years | 369 (8.0%) | 541 (9.8%) |
| 65 to 69 Years | 476 (10.3%) | 771 (13.9%) |
| 70 to 74 Years | 573 (12.4%) | 662 (11.9%) |
| 75 to 79 Years | 469 (10.2%) | 385 (6.9%) |
| 80 to 84 Years | 95 (2.1%) | 199 (3.6%) |
| 85 Years and over | 197 (4.3%) | 289 (5.2%) |
| Total | 4,611 (100.0%) | 5,550 (100.0%) |
Families and Households in Port Townsend
Median Family Size in Port Townsend
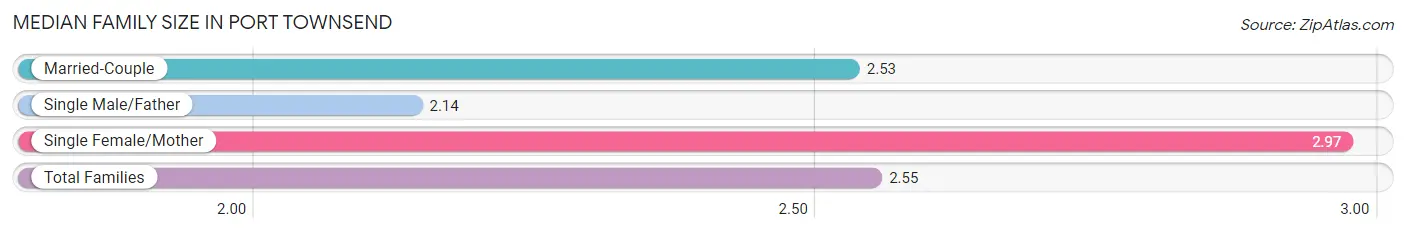
The median family size in Port Townsend is 2.55 persons per family, with single female/mother families (263 | 10.5%) accounting for the largest median family size of 2.97 persons per family. On the other hand, single male/father families (157 | 6.3%) represent the smallest median family size with 2.14 persons per family.
| Family Type | # Families | Family Size |
| Married-Couple | 2,089 (83.3%) | 2.53 |
| Single Male/Father | 157 (6.3%) | 2.14 |
| Single Female/Mother | 263 (10.5%) | 2.97 |
| Total Families | 2,509 (100.0%) | 2.55 |
Median Household Size in Port Townsend
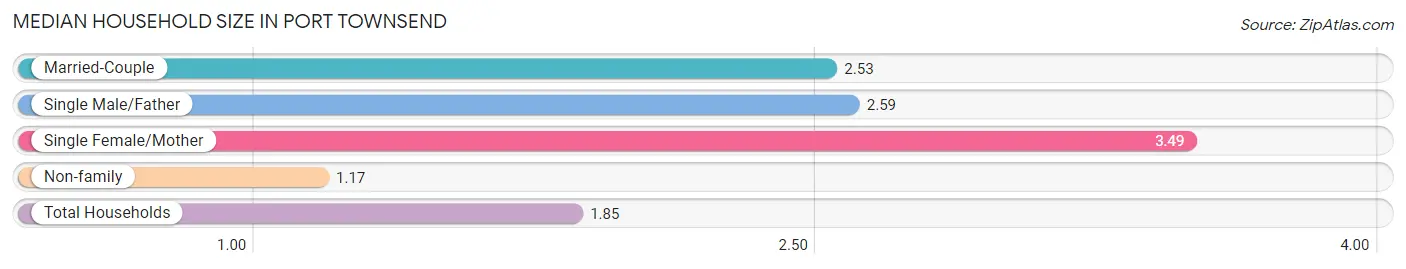
The median household size in Port Townsend is 1.85 persons per household, with single female/mother households (263 | 4.9%) accounting for the largest median household size of 3.49 persons per household. non-family households (2,862 | 53.3%) represent the smallest median household size with 1.17 persons per household.
| Household Type | # Households | Household Size |
| Married-Couple | 2,089 (38.9%) | 2.53 |
| Single Male/Father | 157 (2.9%) | 2.59 |
| Single Female/Mother | 263 (4.9%) | 3.49 |
| Non-family | 2,862 (53.3%) | 1.17 |
| Total Households | 5,371 (100.0%) | 1.85 |
Household Size by Marriage Status in Port Townsend
Out of a total of 5,371 households in Port Townsend, 2,509 (46.7%) are family households, while 2,862 (53.3%) are nonfamily households. The most numerous type of family households are 2-person households, comprising 1,498, and the most common type of nonfamily households are 1-person households, comprising 2,400.
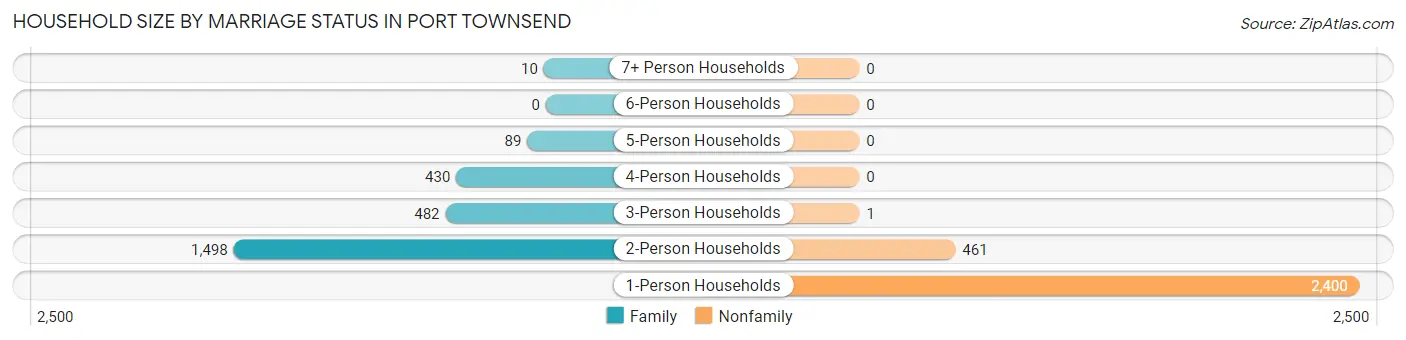
| Household Size | Family Households | Nonfamily Households |
| 1-Person Households | - | 2,400 (44.7%) |
| 2-Person Households | 1,498 (27.9%) | 461 (8.6%) |
| 3-Person Households | 482 (9.0%) | 1 (0.0%) |
| 4-Person Households | 430 (8.0%) | 0 (0.0%) |
| 5-Person Households | 89 (1.7%) | 0 (0.0%) |
| 6-Person Households | 0 (0.0%) | 0 (0.0%) |
| 7+ Person Households | 10 (0.2%) | 0 (0.0%) |
| Total | 2,509 (46.7%) | 2,862 (53.3%) |
Female Fertility in Port Townsend
Fertility by Age in Port Townsend
Average fertility rate in Port Townsend is 20.0 births per 1,000 women. Women in the age bracket of 20 to 34 years have the highest fertility rate with 34.0 births per 1,000 women. Women in the age bracket of 20 to 34 years acount for 67.7% of all women with births.
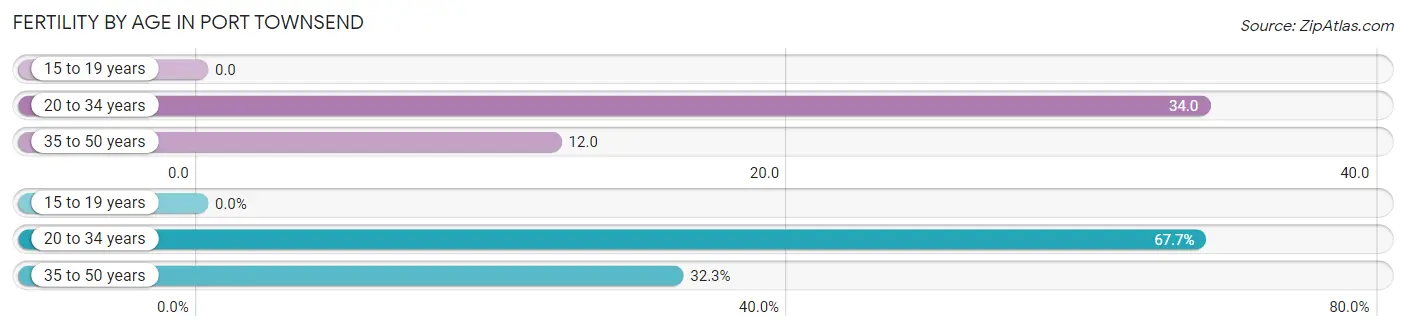
| Age Bracket | Women with Births | Births / 1,000 Women |
| 15 to 19 years | 0 (0.0%) | 0.0 |
| 20 to 34 years | 21 (67.7%) | 34.0 |
| 35 to 50 years | 10 (32.3%) | 12.0 |
| Total | 31 (100.0%) | 20.0 |
Fertility by Age by Marriage Status in Port Townsend
54.8% of women with births (31) in Port Townsend are married. The highest percentage of unmarried women with births falls into 20 to 34 years age bracket with 66.7% of them unmarried at the time of birth, while the lowest percentage of unmarried women with births belong to 35 to 50 years age bracket with 0.0% of them unmarried.
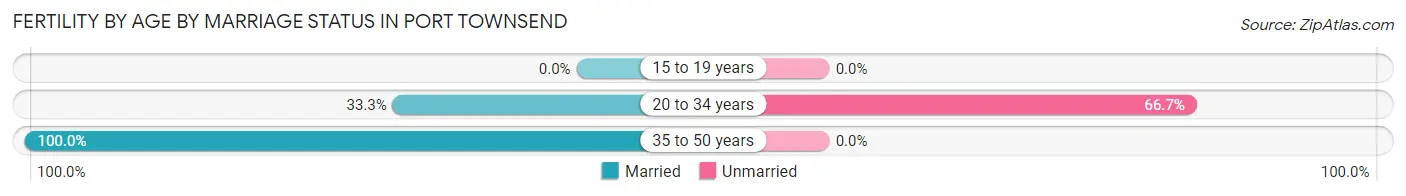
| Age Bracket | Married | Unmarried |
| 15 to 19 years | 0 (0.0%) | 0 (0.0%) |
| 20 to 34 years | 7 (33.3%) | 14 (66.7%) |
| 35 to 50 years | 10 (100.0%) | 0 (0.0%) |
| Total | 17 (54.8%) | 14 (45.2%) |
Fertility by Education in Port Townsend
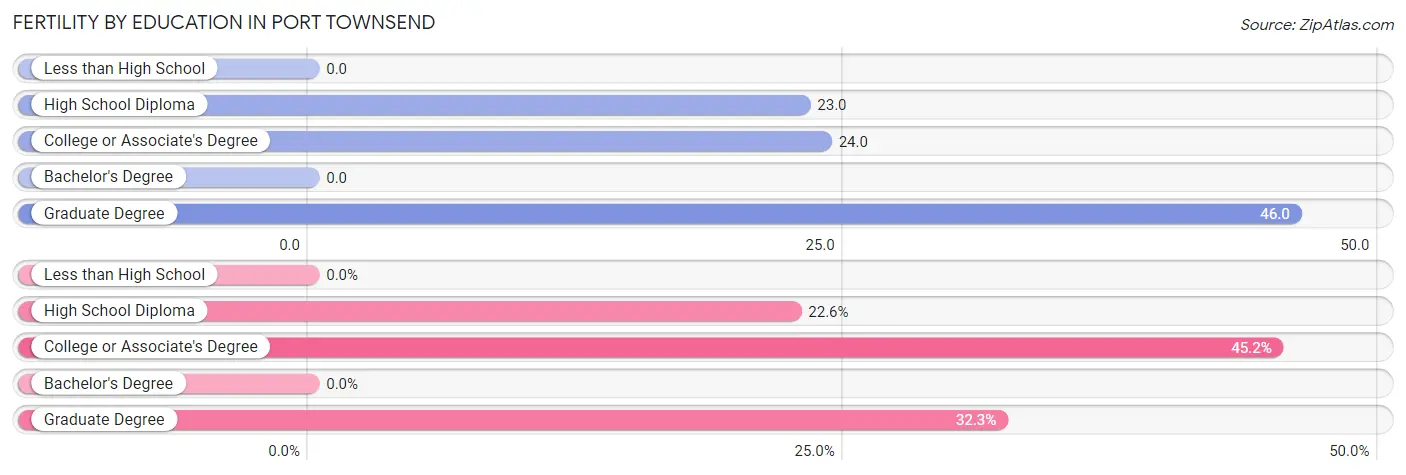
| Educational Attainment | Women with Births | Births / 1,000 Women |
| Less than High School | 0 (0.0%) | 0.0 |
| High School Diploma | 7 (22.6%) | 23.0 |
| College or Associate's Degree | 14 (45.2%) | 24.0 |
| Bachelor's Degree | 0 (0.0%) | 0.0 |
| Graduate Degree | 10 (32.3%) | 46.0 |
| Total | 31 (100.0%) | 20.0 |
Fertility by Education by Marriage Status in Port Townsend
45.2% of women with births in Port Townsend are unmarried. Women with the educational attainment of high school diploma are most likely to be married with 100.0% of them married at childbirth, while women with the educational attainment of college or associate's degree are least likely to be married with 100.0% of them unmarried at childbirth.
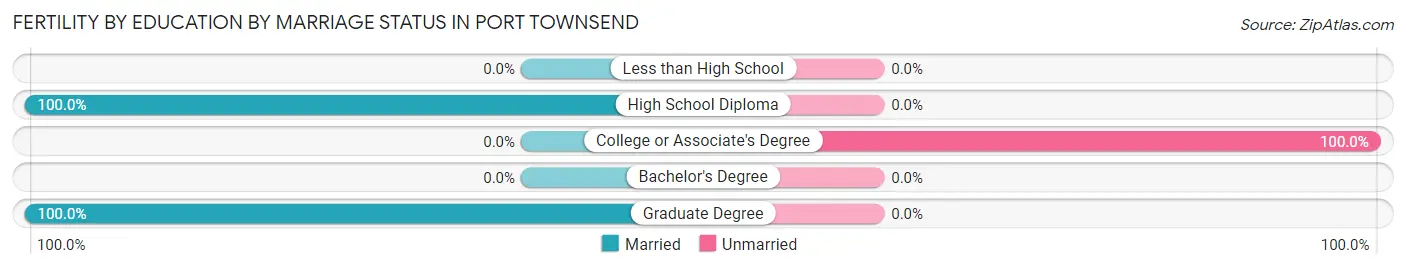
| Educational Attainment | Married | Unmarried |
| Less than High School | 0 (0.0%) | 0 (0.0%) |
| High School Diploma | 7 (100.0%) | 0 (0.0%) |
| College or Associate's Degree | 0 (0.0%) | 14 (100.0%) |
| Bachelor's Degree | 0 (0.0%) | 0 (0.0%) |
| Graduate Degree | 10 (100.0%) | 0 (0.0%) |
| Total | 17 (54.8%) | 14 (45.2%) |
Employment Characteristics in Port Townsend
Employment by Class of Employer in Port Townsend
Among the 3,478 employed individuals in Port Townsend, private company employees (1,471 | 42.3%), not-for-profit organizations (516 | 14.8%), and self-employed (not incorporated) (494 | 14.2%) make up the most common classes of employment.
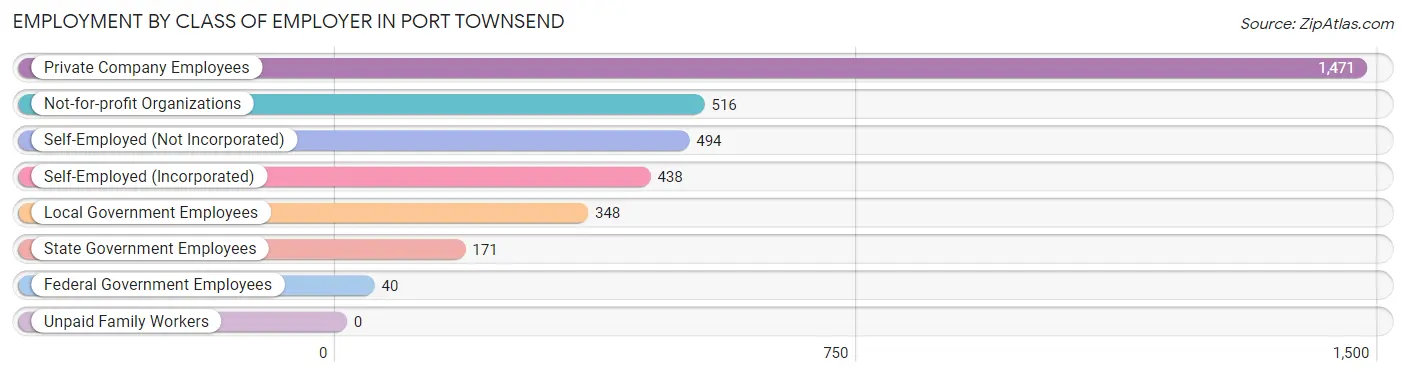
| Employer Class | # Employees | % Employees |
| Private Company Employees | 1,471 | 42.3% |
| Self-Employed (Incorporated) | 438 | 12.6% |
| Self-Employed (Not Incorporated) | 494 | 14.2% |
| Not-for-profit Organizations | 516 | 14.8% |
| Local Government Employees | 348 | 10.0% |
| State Government Employees | 171 | 4.9% |
| Federal Government Employees | 40 | 1.1% |
| Unpaid Family Workers | 0 | 0.0% |
| Total | 3,478 | 100.0% |
Employment Status by Age in Port Townsend
According to the labor force statistics for Port Townsend, out of the total population over 16 years of age (9,264), 44.5% or 4,122 individuals are in the labor force, with 13.7% or 565 of them unemployed. The age group with the highest labor force participation rate is 30 to 34 years, with 89.6% or 319 individuals in the labor force. Within the labor force, the 20 to 24 years age range has the highest percentage of unemployed individuals, with 52.9% or 141 of them being unemployed.
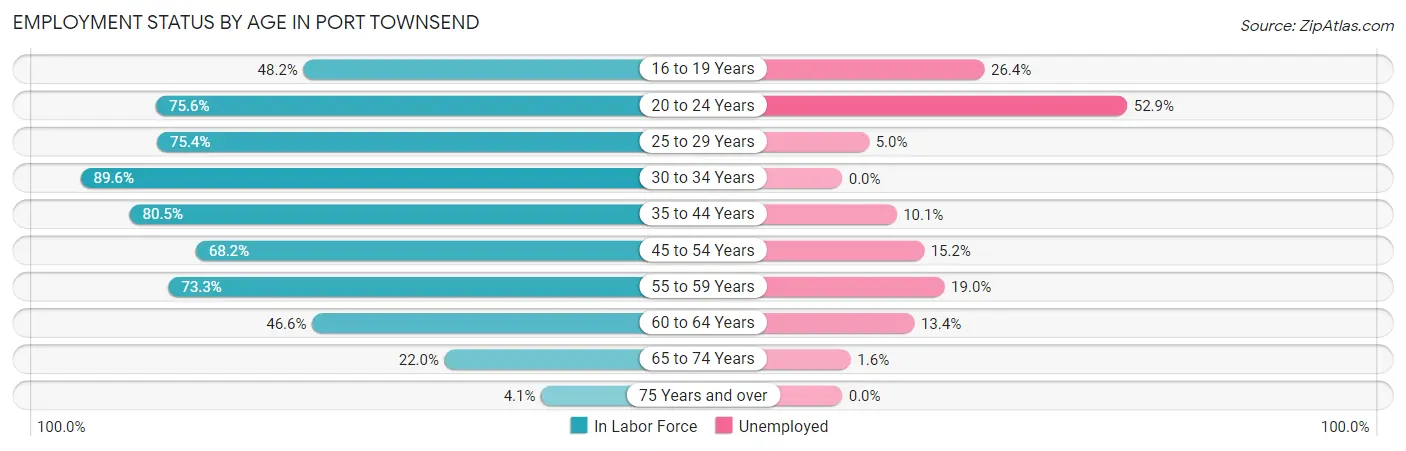
| Age Bracket | In Labor Force | Unemployed |
| 16 to 19 Years | 198 (48.2%) | 52 (26.4%) |
| 20 to 24 Years | 267 (75.6%) | 141 (52.9%) |
| 25 to 29 Years | 202 (75.4%) | 10 (5.0%) |
| 30 to 34 Years | 319 (89.6%) | 0 (0.0%) |
| 35 to 44 Years | 795 (80.5%) | 80 (10.1%) |
| 45 to 54 Years | 781 (68.2%) | 119 (15.2%) |
| 55 to 59 Years | 526 (73.3%) | 100 (19.0%) |
| 60 to 64 Years | 424 (46.6%) | 57 (13.4%) |
| 65 to 74 Years | 546 (22.0%) | 9 (1.6%) |
| 75 Years and over | 67 (4.1%) | 0 (0.0%) |
| Total | 4,122 (44.5%) | 565 (13.7%) |
Employment Status by Educational Attainment in Port Townsend
According to labor force statistics for Port Townsend, 69.5% of individuals (3,047) out of the total population between 25 and 64 years of age (4,384) are in the labor force, with 12.0% or 366 of them being unemployed. The group with the highest labor force participation rate are those with the educational attainment of college / associate degree, with 73.8% or 953 individuals in the labor force. Within the labor force, individuals with high school diploma education have the highest percentage of unemployment, with 20.6% or 90 of them being unemployed.
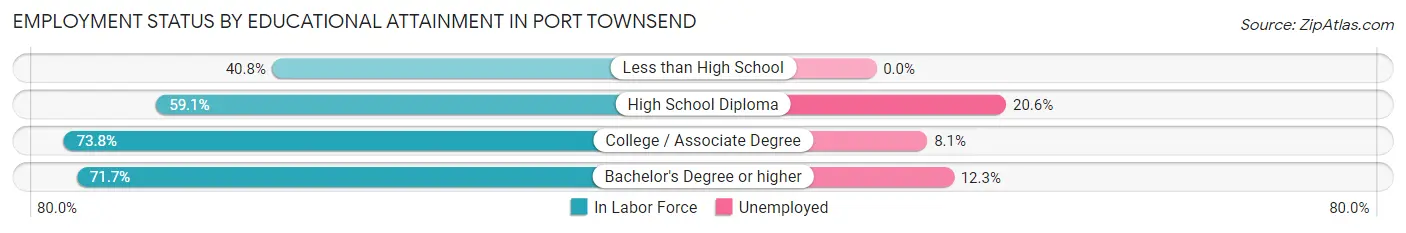
| Educational Attainment | In Labor Force | Unemployed |
| Less than High School | 40 (40.8%) | 0 (0.0%) |
| High School Diploma | 437 (59.1%) | 152 (20.6%) |
| College / Associate Degree | 953 (73.8%) | 105 (8.1%) |
| Bachelor's Degree or higher | 1,617 (71.7%) | 277 (12.3%) |
| Total | 3,047 (69.5%) | 526 (12.0%) |
Employment Occupations by Sex in Port Townsend
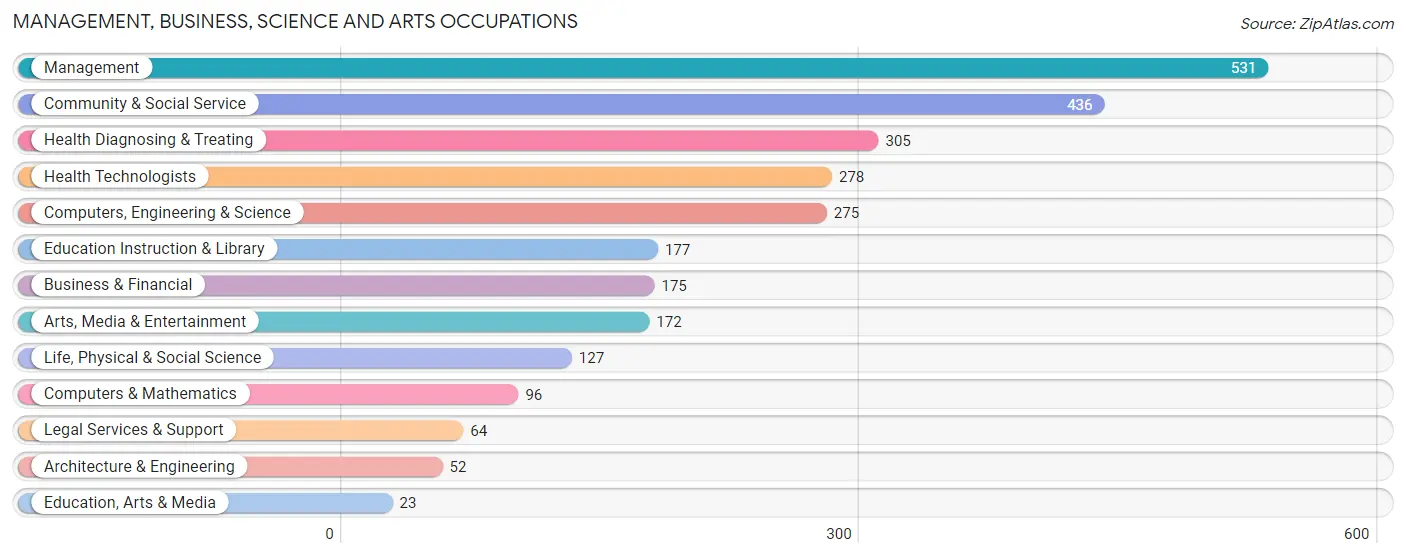
Management, Business, Science and Arts Occupations
The most common Management, Business, Science and Arts occupations in Port Townsend are Management (531 | 14.9%), Community & Social Service (436 | 12.3%), Health Diagnosing & Treating (305 | 8.6%), Health Technologists (278 | 7.8%), and Computers, Engineering & Science (275 | 7.7%).
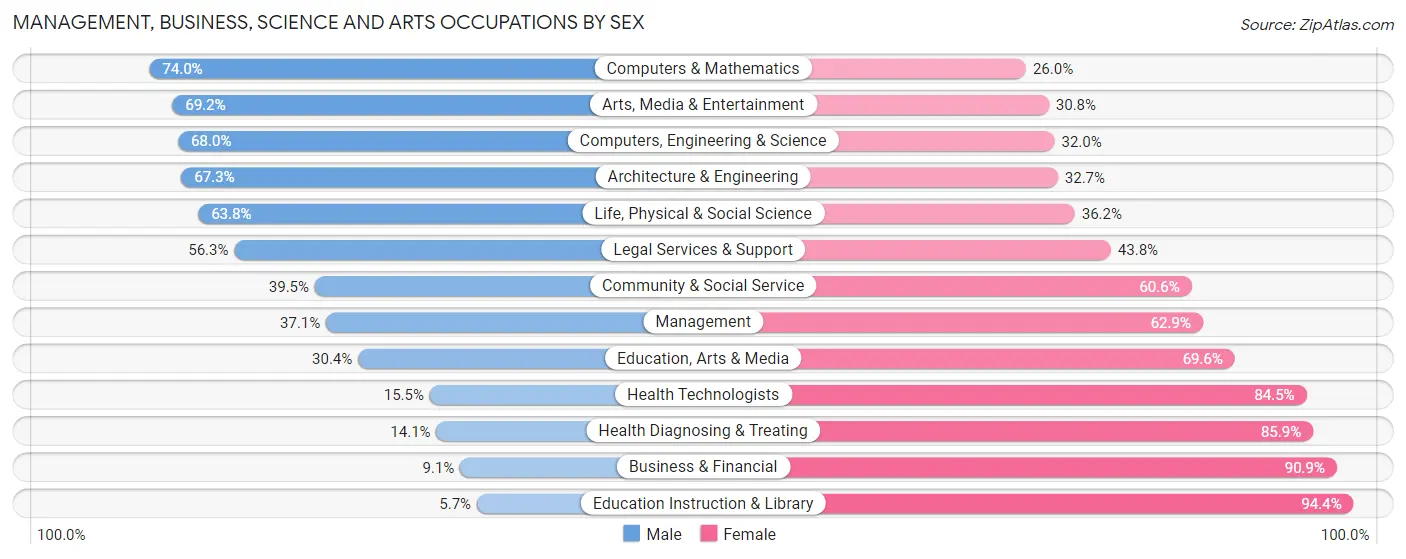
Management, Business, Science and Arts Occupations by Sex
Within the Management, Business, Science and Arts occupations in Port Townsend, the most male-oriented occupations are Computers & Mathematics (74.0%), Arts, Media & Entertainment (69.2%), and Computers, Engineering & Science (68.0%), while the most female-oriented occupations are Education Instruction & Library (94.4%), Business & Financial (90.9%), and Health Diagnosing & Treating (85.9%).
| Occupation | Male | Female |
| Management | 197 (37.1%) | 334 (62.9%) |
| Business & Financial | 16 (9.1%) | 159 (90.9%) |
| Computers, Engineering & Science | 187 (68.0%) | 88 (32.0%) |
| Computers & Mathematics | 71 (74.0%) | 25 (26.0%) |
| Architecture & Engineering | 35 (67.3%) | 17 (32.7%) |
| Life, Physical & Social Science | 81 (63.8%) | 46 (36.2%) |
| Community & Social Service | 172 (39.5%) | 264 (60.6%) |
| Education, Arts & Media | 7 (30.4%) | 16 (69.6%) |
| Legal Services & Support | 36 (56.2%) | 28 (43.8%) |
| Education Instruction & Library | 10 (5.7%) | 167 (94.4%) |
| Arts, Media & Entertainment | 119 (69.2%) | 53 (30.8%) |
| Health Diagnosing & Treating | 43 (14.1%) | 262 (85.9%) |
| Health Technologists | 43 (15.5%) | 235 (84.5%) |
| Total (Category) | 615 (35.7%) | 1,107 (64.3%) |
| Total (Overall) | 1,515 (42.7%) | 2,036 (57.3%) |
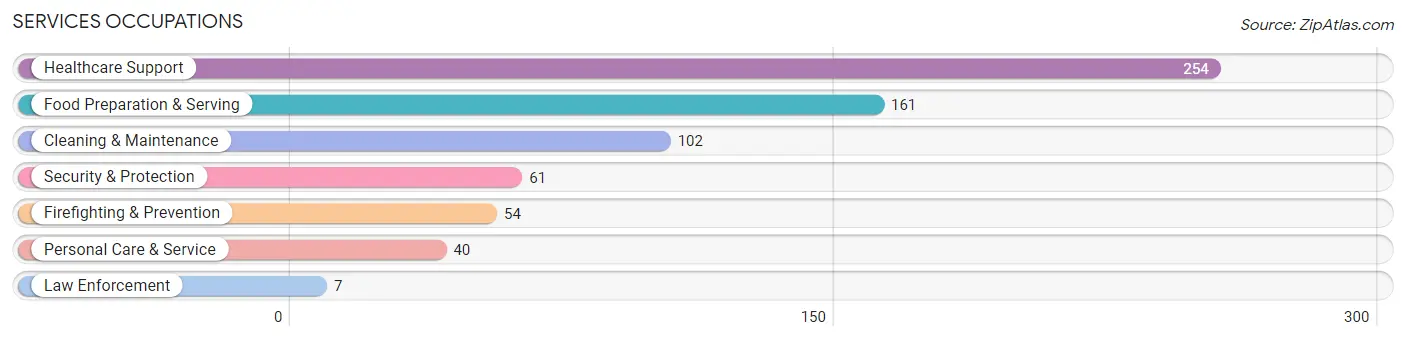
Services Occupations
The most common Services occupations in Port Townsend are Healthcare Support (254 | 7.1%), Food Preparation & Serving (161 | 4.5%), Cleaning & Maintenance (102 | 2.9%), Security & Protection (61 | 1.7%), and Firefighting & Prevention (54 | 1.5%).
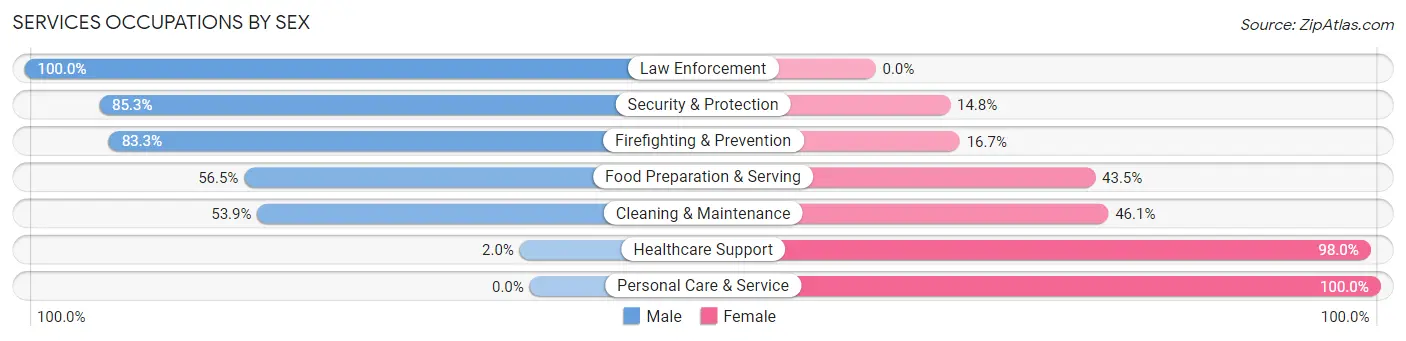
Services Occupations by Sex
Within the Services occupations in Port Townsend, the most male-oriented occupations are Law Enforcement (100.0%), Security & Protection (85.3%), and Firefighting & Prevention (83.3%), while the most female-oriented occupations are Personal Care & Service (100.0%), Healthcare Support (98.0%), and Cleaning & Maintenance (46.1%).
| Occupation | Male | Female |
| Healthcare Support | 5 (2.0%) | 249 (98.0%) |
| Security & Protection | 52 (85.3%) | 9 (14.7%) |
| Firefighting & Prevention | 45 (83.3%) | 9 (16.7%) |
| Law Enforcement | 7 (100.0%) | 0 (0.0%) |
| Food Preparation & Serving | 91 (56.5%) | 70 (43.5%) |
| Cleaning & Maintenance | 55 (53.9%) | 47 (46.1%) |
| Personal Care & Service | 0 (0.0%) | 40 (100.0%) |
| Total (Category) | 203 (32.9%) | 415 (67.1%) |
| Total (Overall) | 1,515 (42.7%) | 2,036 (57.3%) |
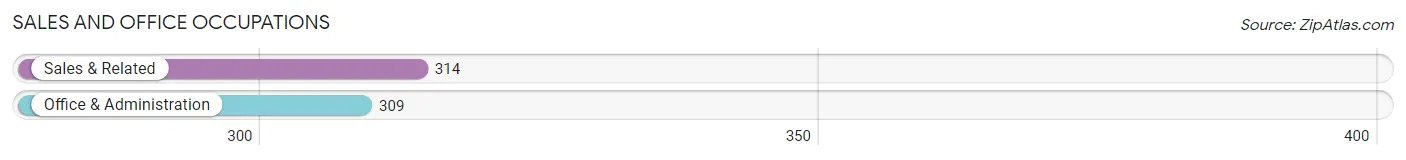
Sales and Office Occupations
The most common Sales and Office occupations in Port Townsend are Sales & Related (314 | 8.8%), and Office & Administration (309 | 8.7%).
Sales and Office Occupations by Sex
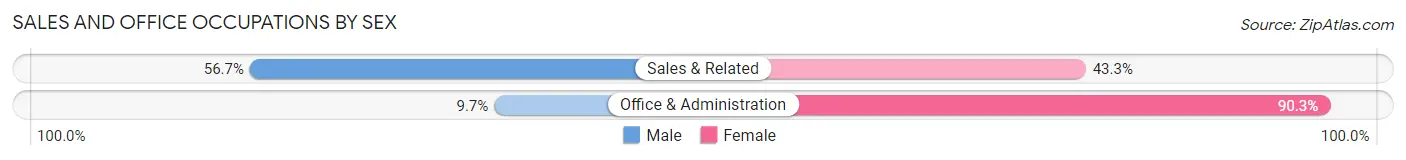
| Occupation | Male | Female |
| Sales & Related | 178 (56.7%) | 136 (43.3%) |
| Office & Administration | 30 (9.7%) | 279 (90.3%) |
| Total (Category) | 208 (33.4%) | 415 (66.6%) |
| Total (Overall) | 1,515 (42.7%) | 2,036 (57.3%) |
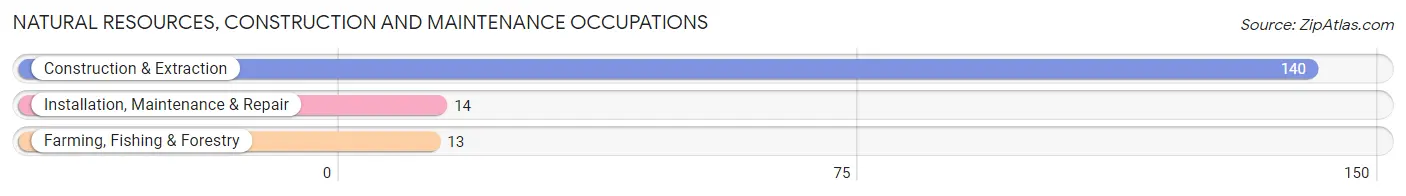
Natural Resources, Construction and Maintenance Occupations
The most common Natural Resources, Construction and Maintenance occupations in Port Townsend are Construction & Extraction (140 | 3.9%), Installation, Maintenance & Repair (14 | 0.4%), and Farming, Fishing & Forestry (13 | 0.4%).
Natural Resources, Construction and Maintenance Occupations by Sex
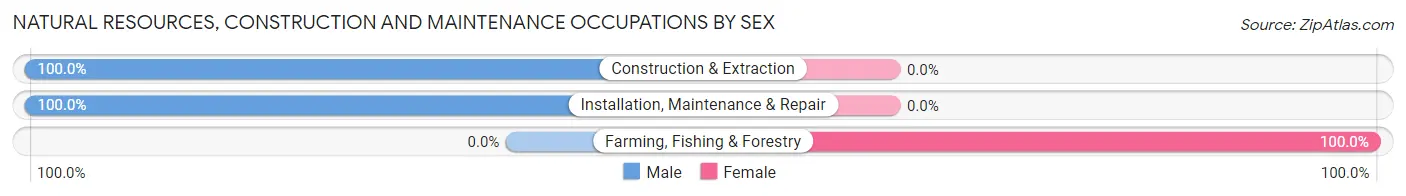
| Occupation | Male | Female |
| Farming, Fishing & Forestry | 0 (0.0%) | 13 (100.0%) |
| Construction & Extraction | 140 (100.0%) | 0 (0.0%) |
| Installation, Maintenance & Repair | 14 (100.0%) | 0 (0.0%) |
| Total (Category) | 154 (92.2%) | 13 (7.8%) |
| Total (Overall) | 1,515 (42.7%) | 2,036 (57.3%) |
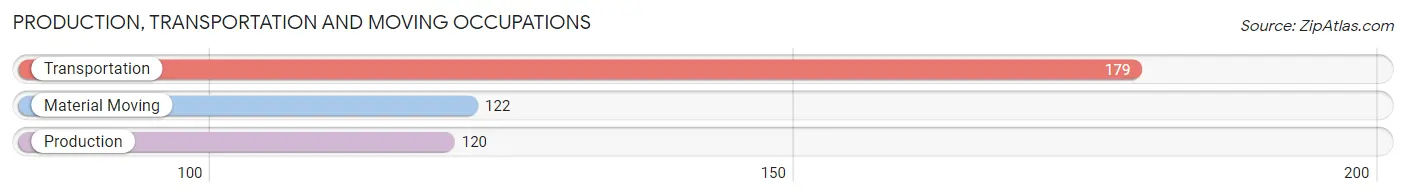
Production, Transportation and Moving Occupations
The most common Production, Transportation and Moving occupations in Port Townsend are Transportation (179 | 5.0%), Material Moving (122 | 3.4%), and Production (120 | 3.4%).
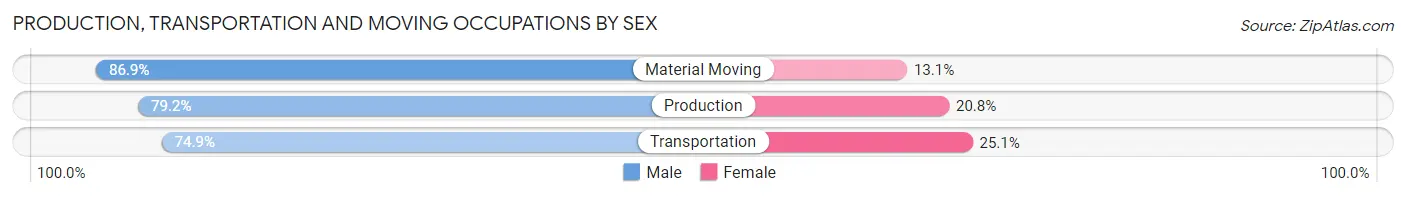
Production, Transportation and Moving Occupations by Sex
| Occupation | Male | Female |
| Production | 95 (79.2%) | 25 (20.8%) |
| Transportation | 134 (74.9%) | 45 (25.1%) |
| Material Moving | 106 (86.9%) | 16 (13.1%) |
| Total (Category) | 335 (79.6%) | 86 (20.4%) |
| Total (Overall) | 1,515 (42.7%) | 2,036 (57.3%) |
Employment Industries by Sex in Port Townsend
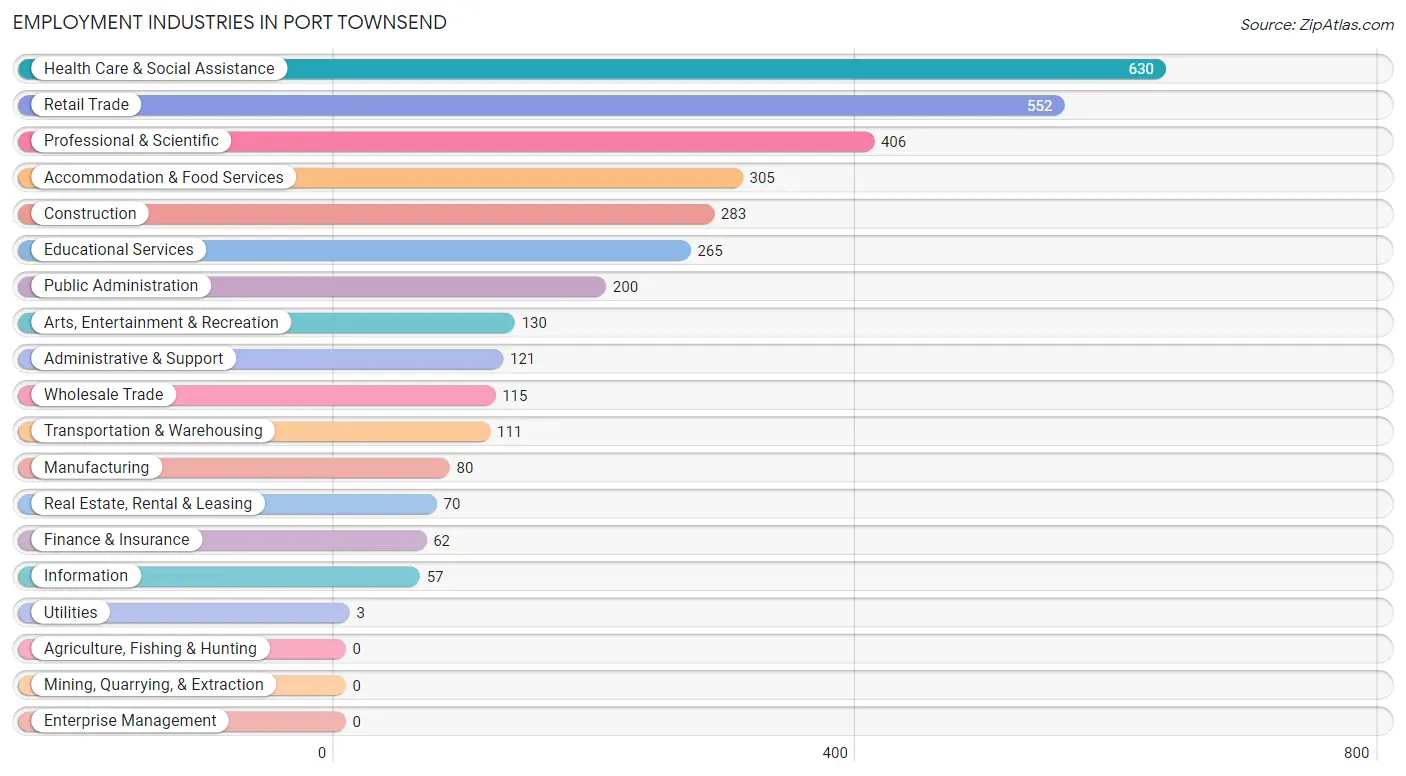
Employment Industries in Port Townsend
The major employment industries in Port Townsend include Health Care & Social Assistance (630 | 17.7%), Retail Trade (552 | 15.5%), Professional & Scientific (406 | 11.4%), Accommodation & Food Services (305 | 8.6%), and Construction (283 | 8.0%).
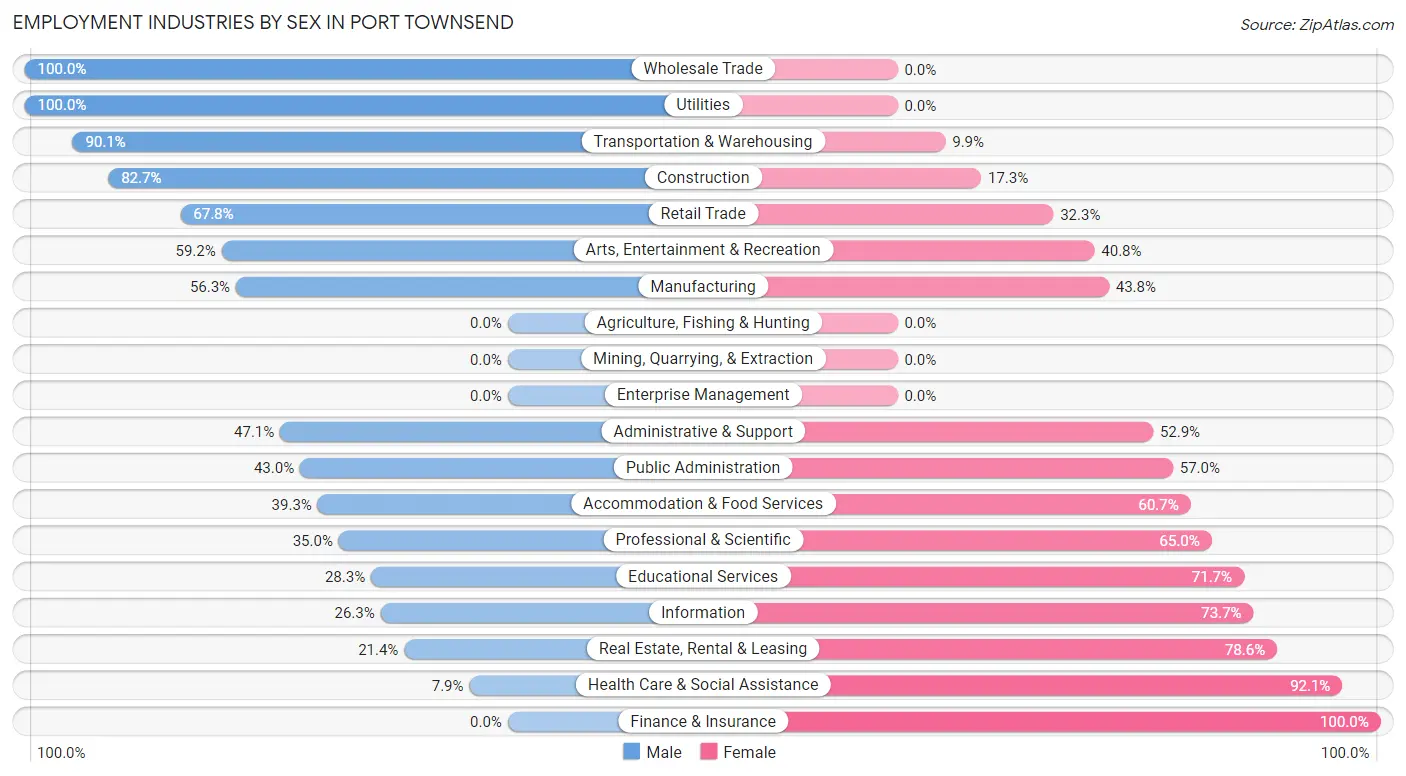
Employment Industries by Sex in Port Townsend
The Port Townsend industries that see more men than women are Wholesale Trade (100.0%), Utilities (100.0%), and Transportation & Warehousing (90.1%), whereas the industries that tend to have a higher number of women are Finance & Insurance (100.0%), Health Care & Social Assistance (92.1%), and Real Estate, Rental & Leasing (78.6%).
| Industry | Male | Female |
| Agriculture, Fishing & Hunting | 0 (0.0%) | 0 (0.0%) |
| Mining, Quarrying, & Extraction | 0 (0.0%) | 0 (0.0%) |
| Construction | 234 (82.7%) | 49 (17.3%) |
| Manufacturing | 45 (56.2%) | 35 (43.8%) |
| Wholesale Trade | 115 (100.0%) | 0 (0.0%) |
| Retail Trade | 374 (67.7%) | 178 (32.3%) |
| Transportation & Warehousing | 100 (90.1%) | 11 (9.9%) |
| Utilities | 3 (100.0%) | 0 (0.0%) |
| Information | 15 (26.3%) | 42 (73.7%) |
| Finance & Insurance | 0 (0.0%) | 62 (100.0%) |
| Real Estate, Rental & Leasing | 15 (21.4%) | 55 (78.6%) |
| Professional & Scientific | 142 (35.0%) | 264 (65.0%) |
| Enterprise Management | 0 (0.0%) | 0 (0.0%) |
| Administrative & Support | 57 (47.1%) | 64 (52.9%) |
| Educational Services | 75 (28.3%) | 190 (71.7%) |
| Health Care & Social Assistance | 50 (7.9%) | 580 (92.1%) |
| Arts, Entertainment & Recreation | 77 (59.2%) | 53 (40.8%) |
| Accommodation & Food Services | 120 (39.3%) | 185 (60.7%) |
| Public Administration | 86 (43.0%) | 114 (57.0%) |
| Total | 1,515 (42.7%) | 2,036 (57.3%) |
Education in Port Townsend
School Enrollment in Port Townsend
The most common levels of schooling among the 1,170 students in Port Townsend are elementary school (311 | 26.6%), high school (289 | 24.7%), and middle school (285 | 24.4%).
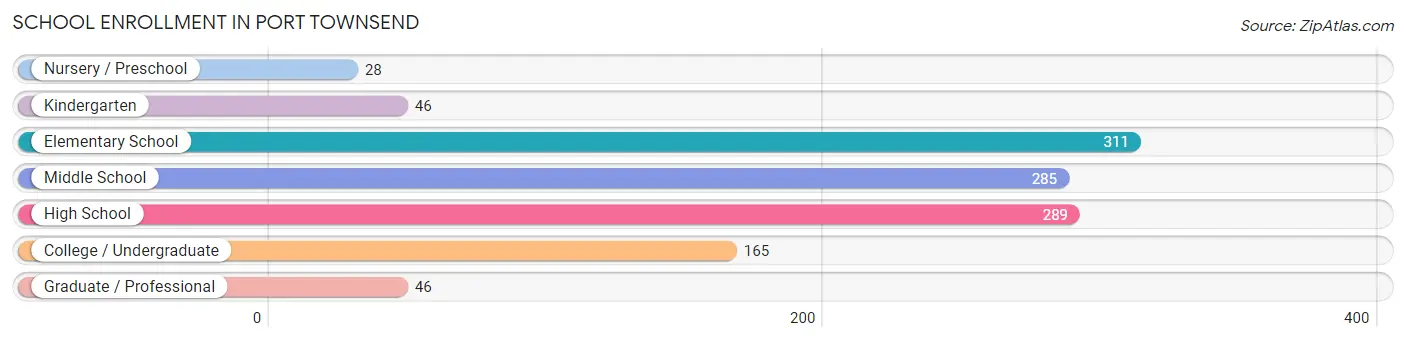
| School Level | # Students | % Students |
| Nursery / Preschool | 28 | 2.4% |
| Kindergarten | 46 | 3.9% |
| Elementary School | 311 | 26.6% |
| Middle School | 285 | 24.4% |
| High School | 289 | 24.7% |
| College / Undergraduate | 165 | 14.1% |
| Graduate / Professional | 46 | 3.9% |
| Total | 1,170 | 100.0% |
School Enrollment by Age by Funding Source in Port Townsend
Out of a total of 1,170 students who are enrolled in schools in Port Townsend, 310 (26.5%) attend a private institution, while the remaining 860 (73.5%) are enrolled in public schools. The age group of 3 to 4 year olds has the highest likelihood of being enrolled in private schools, with 4 (100.0% in the age bracket) enrolled. Conversely, the age group of 15 to 17 year olds has the lowest likelihood of being enrolled in a private school, with 248 (100.0% in the age bracket) attending a public institution.
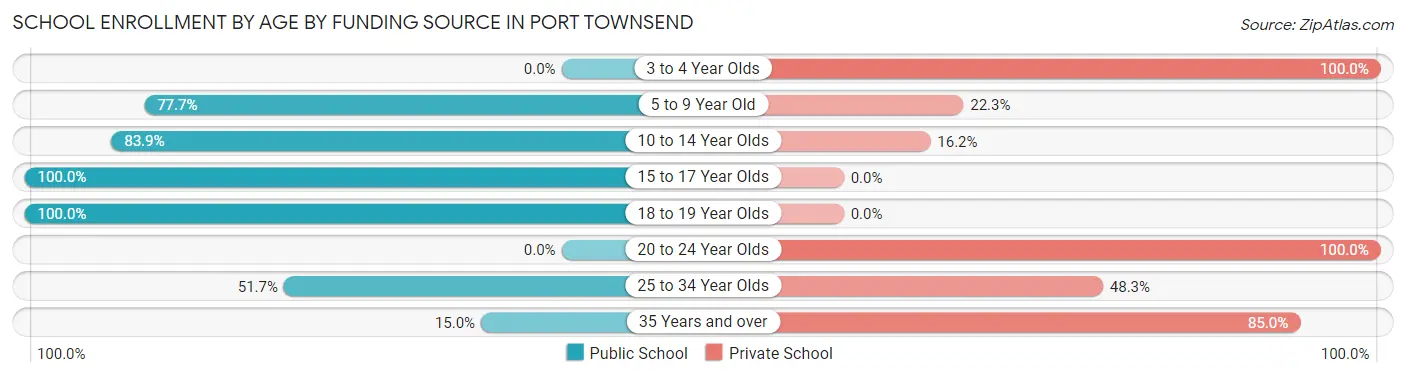
| Age Bracket | Public School | Private School |
| 3 to 4 Year Olds | 0 (0.0%) | 4 (100.0%) |
| 5 to 9 Year Old | 286 (77.7%) | 82 (22.3%) |
| 10 to 14 Year Olds | 244 (83.9%) | 47 (16.2%) |
| 15 to 17 Year Olds | 248 (100.0%) | 0 (0.0%) |
| 18 to 19 Year Olds | 55 (100.0%) | 0 (0.0%) |
| 20 to 24 Year Olds | 0 (0.0%) | 95 (100.0%) |
| 25 to 34 Year Olds | 15 (51.7%) | 14 (48.3%) |
| 35 Years and over | 12 (15.0%) | 68 (85.0%) |
| Total | 860 (73.5%) | 310 (26.5%) |
Educational Attainment by Field of Study in Port Townsend
Business (568 | 11.4%), education (566 | 11.3%), bio, nature & agricultural (563 | 11.3%), literature & languages (475 | 9.5%), and social sciences (438 | 8.8%) are the most common fields of study among 5,000 individuals in Port Townsend who have obtained a bachelor's degree or higher.
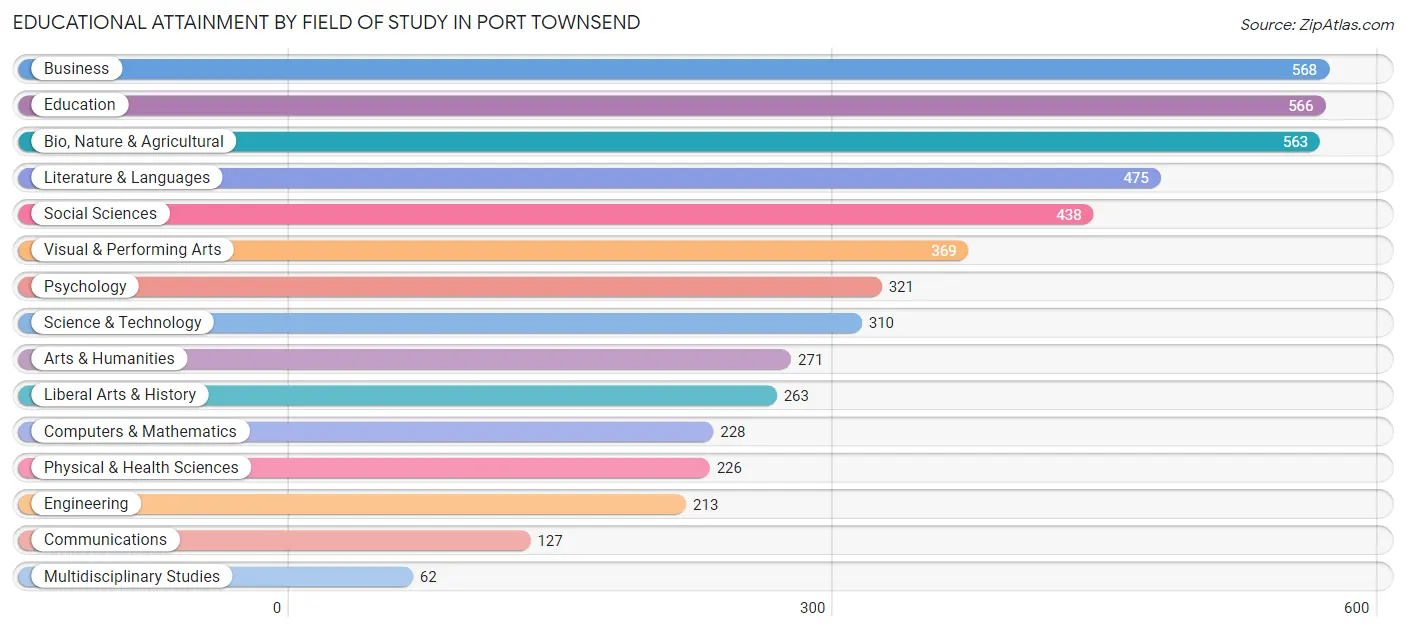
| Field of Study | # Graduates | % Graduates |
| Computers & Mathematics | 228 | 4.6% |
| Bio, Nature & Agricultural | 563 | 11.3% |
| Physical & Health Sciences | 226 | 4.5% |
| Psychology | 321 | 6.4% |
| Social Sciences | 438 | 8.8% |
| Engineering | 213 | 4.3% |
| Multidisciplinary Studies | 62 | 1.2% |
| Science & Technology | 310 | 6.2% |
| Business | 568 | 11.4% |
| Education | 566 | 11.3% |
| Literature & Languages | 475 | 9.5% |
| Liberal Arts & History | 263 | 5.3% |
| Visual & Performing Arts | 369 | 7.4% |
| Communications | 127 | 2.5% |
| Arts & Humanities | 271 | 5.4% |
| Total | 5,000 | 100.0% |
Transportation & Commute in Port Townsend
Vehicle Availability by Sex in Port Townsend
The most prevalent vehicle ownership categories in Port Townsend are males with 2 vehicles (718, accounting for 49.2%) and females with 2 vehicles (734, making up 35.8%).
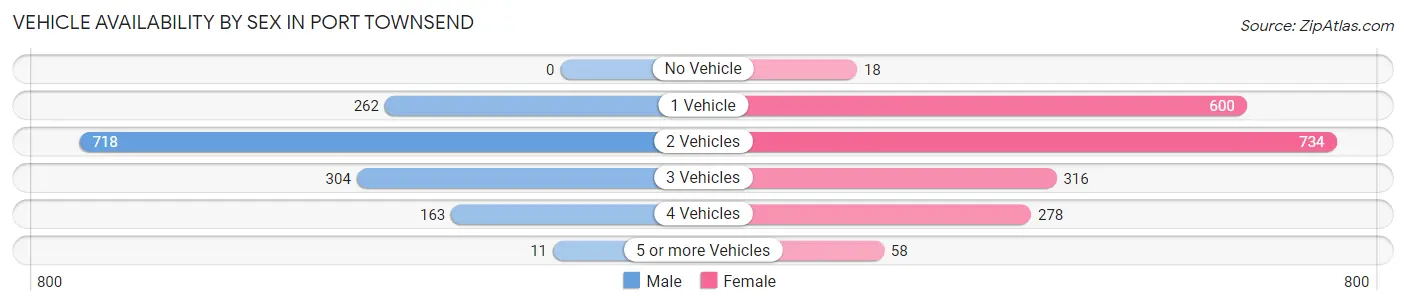
| Vehicles Available | Male | Female |
| No Vehicle | 0 (0.0%) | 18 (0.9%) |
| 1 Vehicle | 262 (18.0%) | 600 (29.9%) |
| 2 Vehicles | 718 (49.2%) | 734 (36.6%) |
| 3 Vehicles | 304 (20.8%) | 316 (15.8%) |
| 4 Vehicles | 163 (11.2%) | 278 (13.9%) |
| 5 or more Vehicles | 11 (0.7%) | 58 (2.9%) |
| Total | 1,458 (100.0%) | 2,004 (100.0%) |
Commute Time in Port Townsend
The most frequently occuring commute durations in Port Townsend are 10 to 14 minutes (805 commuters, 30.3%), 5 to 9 minutes (798 commuters, 30.1%), and 20 to 24 minutes (252 commuters, 9.5%).
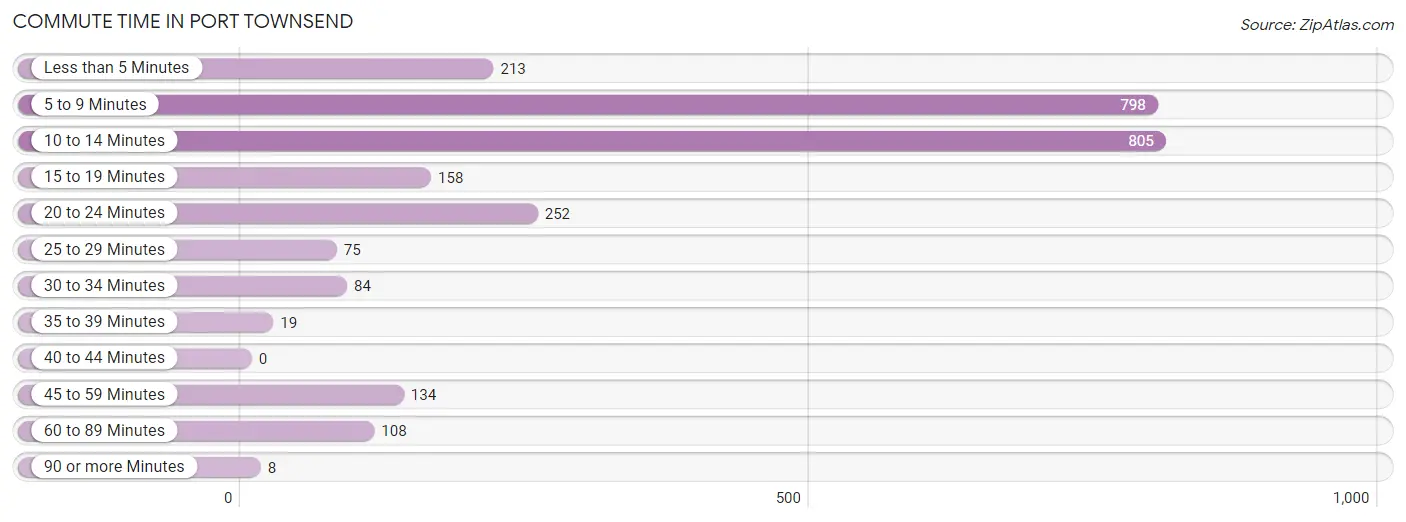
| Commute Time | # Commuters | % Commuters |
| Less than 5 Minutes | 213 | 8.0% |
| 5 to 9 Minutes | 798 | 30.1% |
| 10 to 14 Minutes | 805 | 30.3% |
| 15 to 19 Minutes | 158 | 5.9% |
| 20 to 24 Minutes | 252 | 9.5% |
| 25 to 29 Minutes | 75 | 2.8% |
| 30 to 34 Minutes | 84 | 3.2% |
| 35 to 39 Minutes | 19 | 0.7% |
| 40 to 44 Minutes | 0 | 0.0% |
| 45 to 59 Minutes | 134 | 5.1% |
| 60 to 89 Minutes | 108 | 4.1% |
| 90 or more Minutes | 8 | 0.3% |
Commute Time by Sex in Port Townsend
The most common commute times in Port Townsend are 5 to 9 minutes (312 commuters, 27.7%) for males and 10 to 14 minutes (560 commuters, 36.6%) for females.
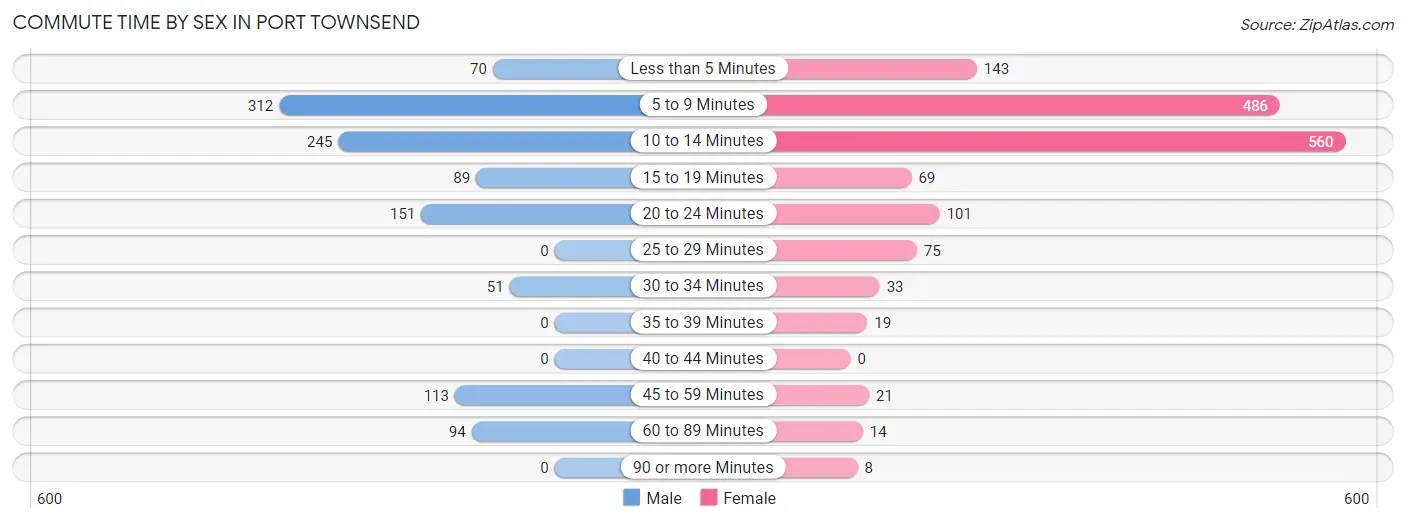
| Commute Time | Male | Female |
| Less than 5 Minutes | 70 (6.2%) | 143 (9.3%) |
| 5 to 9 Minutes | 312 (27.7%) | 486 (31.8%) |
| 10 to 14 Minutes | 245 (21.8%) | 560 (36.6%) |
| 15 to 19 Minutes | 89 (7.9%) | 69 (4.5%) |
| 20 to 24 Minutes | 151 (13.4%) | 101 (6.6%) |
| 25 to 29 Minutes | 0 (0.0%) | 75 (4.9%) |
| 30 to 34 Minutes | 51 (4.5%) | 33 (2.2%) |
| 35 to 39 Minutes | 0 (0.0%) | 19 (1.2%) |
| 40 to 44 Minutes | 0 (0.0%) | 0 (0.0%) |
| 45 to 59 Minutes | 113 (10.0%) | 21 (1.4%) |
| 60 to 89 Minutes | 94 (8.4%) | 14 (0.9%) |
| 90 or more Minutes | 0 (0.0%) | 8 (0.5%) |
Time of Departure to Work by Sex in Port Townsend
The most frequent times of departure to work in Port Townsend are 7:30 AM to 7:59 AM (254, 22.6%) for males and 7:30 AM to 7:59 AM (291, 19.0%) for females.
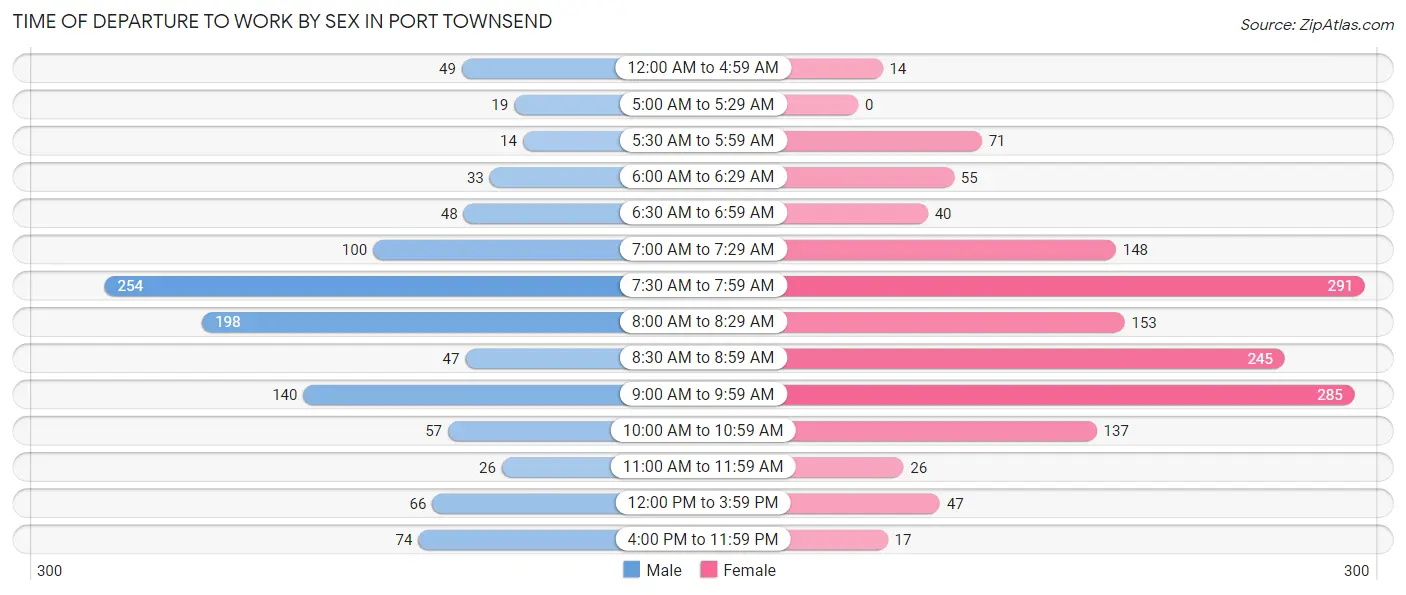
| Time of Departure | Male | Female |
| 12:00 AM to 4:59 AM | 49 (4.4%) | 14 (0.9%) |
| 5:00 AM to 5:29 AM | 19 (1.7%) | 0 (0.0%) |
| 5:30 AM to 5:59 AM | 14 (1.2%) | 71 (4.6%) |
| 6:00 AM to 6:29 AM | 33 (2.9%) | 55 (3.6%) |
| 6:30 AM to 6:59 AM | 48 (4.3%) | 40 (2.6%) |
| 7:00 AM to 7:29 AM | 100 (8.9%) | 148 (9.7%) |
| 7:30 AM to 7:59 AM | 254 (22.6%) | 291 (19.0%) |
| 8:00 AM to 8:29 AM | 198 (17.6%) | 153 (10.0%) |
| 8:30 AM to 8:59 AM | 47 (4.2%) | 245 (16.0%) |
| 9:00 AM to 9:59 AM | 140 (12.4%) | 285 (18.6%) |
| 10:00 AM to 10:59 AM | 57 (5.1%) | 137 (9.0%) |
| 11:00 AM to 11:59 AM | 26 (2.3%) | 26 (1.7%) |
| 12:00 PM to 3:59 PM | 66 (5.9%) | 47 (3.1%) |
| 4:00 PM to 11:59 PM | 74 (6.6%) | 17 (1.1%) |
| Total | 1,125 (100.0%) | 1,529 (100.0%) |
Housing Occupancy in Port Townsend
Occupancy by Ownership in Port Townsend
Of the total 5,371 dwellings in Port Townsend, owner-occupied units account for 3,809 (70.9%), while renter-occupied units make up 1,562 (29.1%).
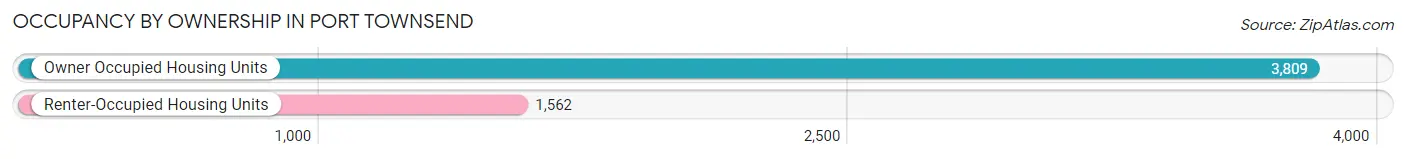
| Occupancy | # Housing Units | % Housing Units |
| Owner Occupied Housing Units | 3,809 | 70.9% |
| Renter-Occupied Housing Units | 1,562 | 29.1% |
| Total Occupied Housing Units | 5,371 | 100.0% |
Occupancy by Household Size in Port Townsend
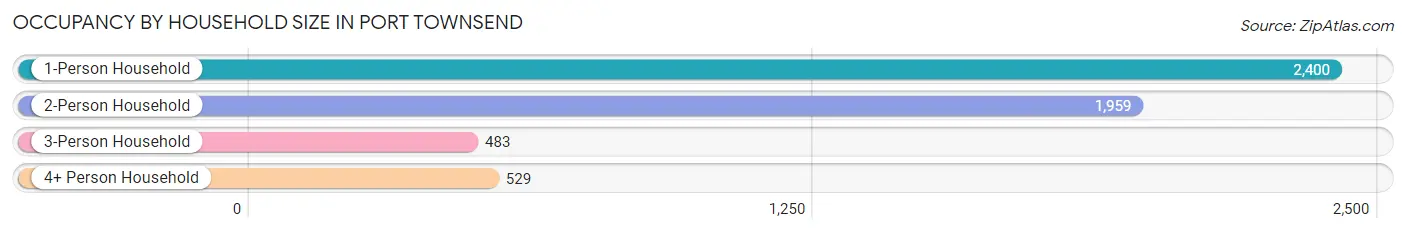
| Household Size | # Housing Units | % Housing Units |
| 1-Person Household | 2,400 | 44.7% |
| 2-Person Household | 1,959 | 36.5% |
| 3-Person Household | 483 | 9.0% |
| 4+ Person Household | 529 | 9.9% |
| Total Housing Units | 5,371 | 100.0% |
Occupancy by Ownership by Household Size in Port Townsend
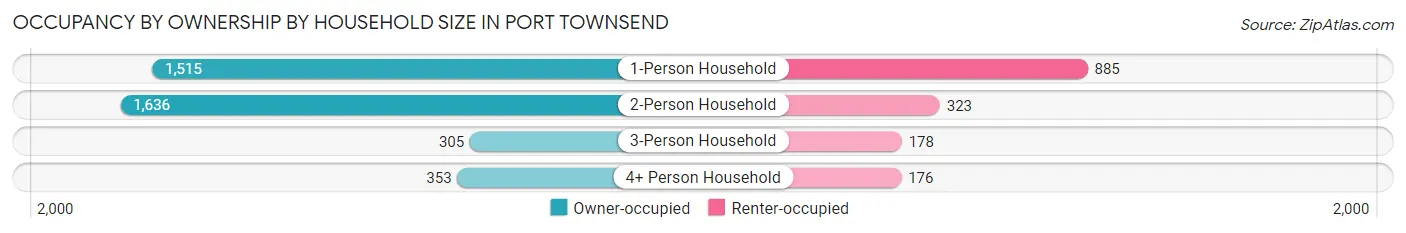
| Household Size | Owner-occupied | Renter-occupied |
| 1-Person Household | 1,515 (63.1%) | 885 (36.9%) |
| 2-Person Household | 1,636 (83.5%) | 323 (16.5%) |
| 3-Person Household | 305 (63.1%) | 178 (36.8%) |
| 4+ Person Household | 353 (66.7%) | 176 (33.3%) |
| Total Housing Units | 3,809 (70.9%) | 1,562 (29.1%) |
Occupancy by Educational Attainment in Port Townsend
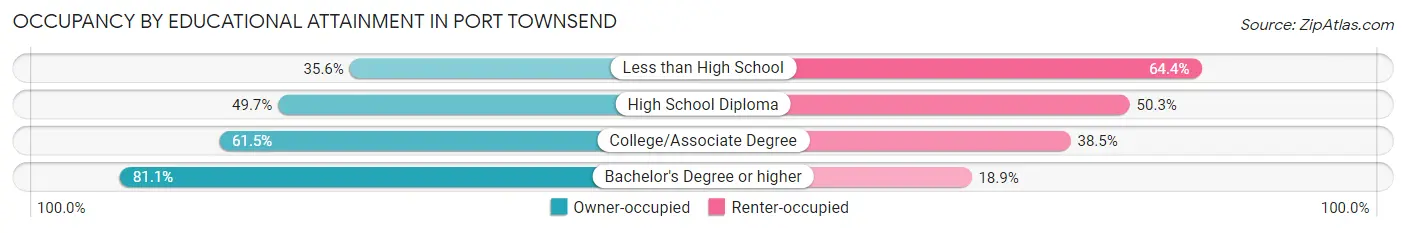
| Household Size | Owner-occupied | Renter-occupied |
| Less than High School | 16 (35.6%) | 29 (64.4%) |
| High School Diploma | 286 (49.7%) | 289 (50.3%) |
| College/Associate Degree | 1,083 (61.5%) | 679 (38.5%) |
| Bachelor's Degree or higher | 2,424 (81.1%) | 565 (18.9%) |
Occupancy by Age of Householder in Port Townsend
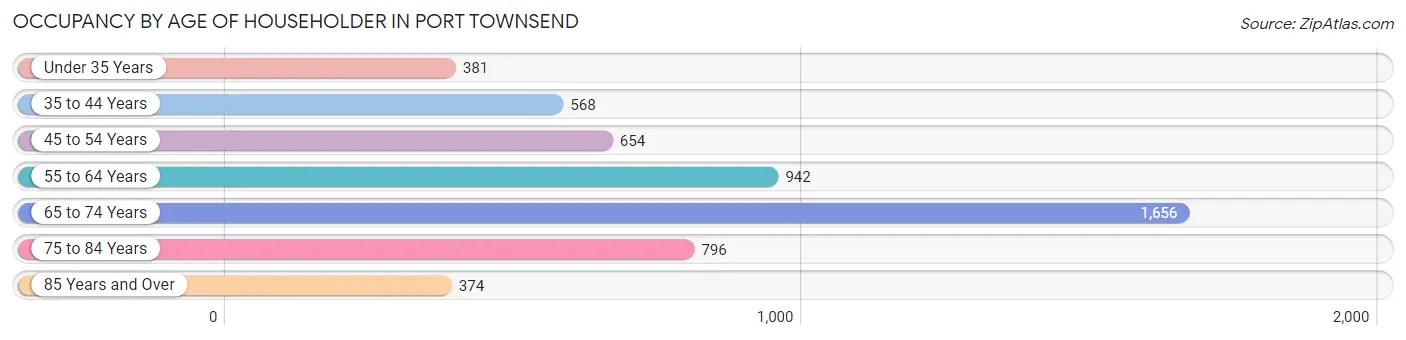
| Age Bracket | # Households | % Households |
| Under 35 Years | 381 | 7.1% |
| 35 to 44 Years | 568 | 10.6% |
| 45 to 54 Years | 654 | 12.2% |
| 55 to 64 Years | 942 | 17.5% |
| 65 to 74 Years | 1,656 | 30.8% |
| 75 to 84 Years | 796 | 14.8% |
| 85 Years and Over | 374 | 7.0% |
| Total | 5,371 | 100.0% |
Housing Finances in Port Townsend
Median Income by Occupancy in Port Townsend
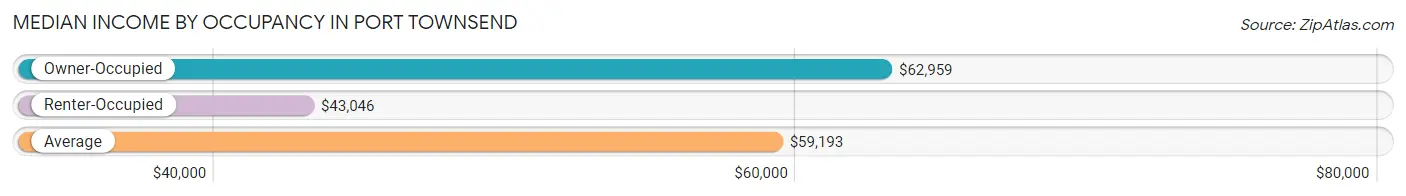
| Occupancy Type | # Households | Median Income |
| Owner-Occupied | 3,809 (70.9%) | $62,959 |
| Renter-Occupied | 1,562 (29.1%) | $43,046 |
| Average | 5,371 (100.0%) | $59,193 |
Occupancy by Householder Income Bracket in Port Townsend
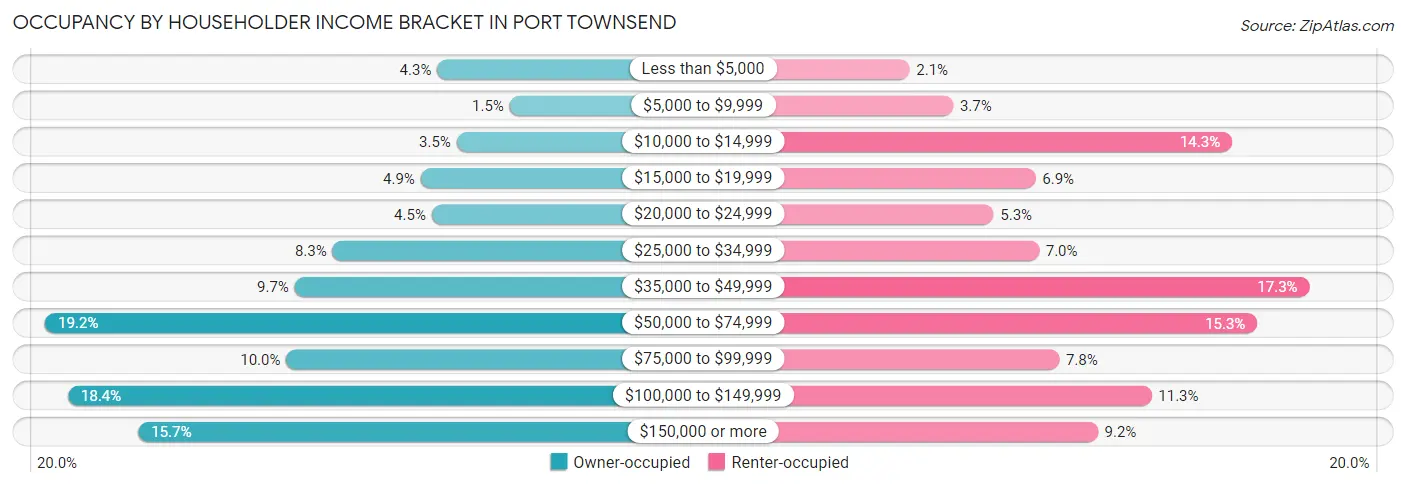
| Income Bracket | Owner-occupied | Renter-occupied |
| Less than $5,000 | 163 (4.3%) | 32 (2.1%) |
| $5,000 to $9,999 | 58 (1.5%) | 58 (3.7%) |
| $10,000 to $14,999 | 135 (3.5%) | 224 (14.3%) |
| $15,000 to $19,999 | 187 (4.9%) | 107 (6.9%) |
| $20,000 to $24,999 | 171 (4.5%) | 82 (5.2%) |
| $25,000 to $34,999 | 315 (8.3%) | 109 (7.0%) |
| $35,000 to $49,999 | 370 (9.7%) | 270 (17.3%) |
| $50,000 to $74,999 | 732 (19.2%) | 239 (15.3%) |
| $75,000 to $99,999 | 382 (10.0%) | 121 (7.7%) |
| $100,000 to $149,999 | 699 (18.3%) | 176 (11.3%) |
| $150,000 or more | 597 (15.7%) | 144 (9.2%) |
| Total | 3,809 (100.0%) | 1,562 (100.0%) |
Monthly Housing Cost Tiers in Port Townsend
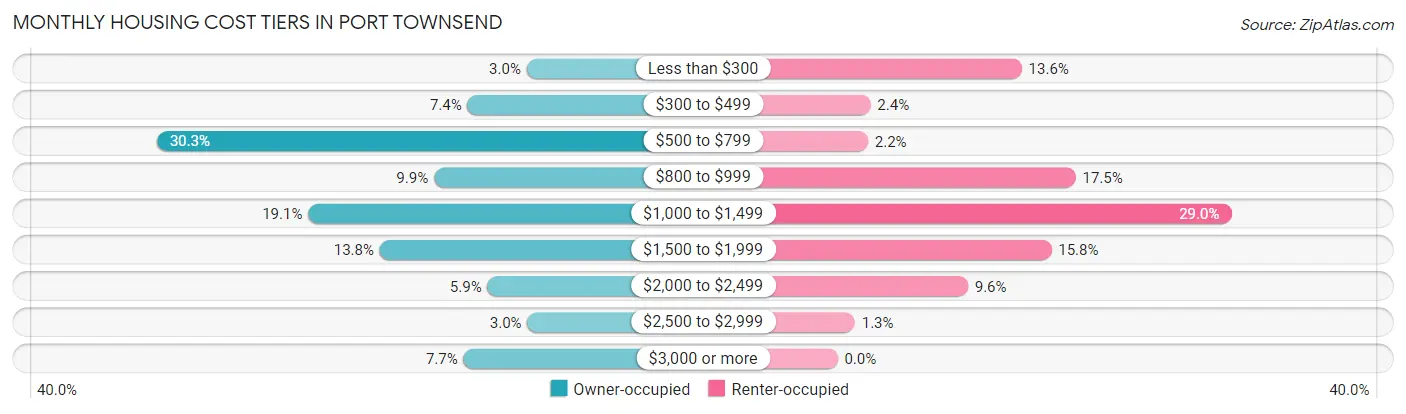
| Monthly Cost | Owner-occupied | Renter-occupied |
| Less than $300 | 115 (3.0%) | 212 (13.6%) |
| $300 to $499 | 281 (7.4%) | 38 (2.4%) |
| $500 to $799 | 1,153 (30.3%) | 35 (2.2%) |
| $800 to $999 | 375 (9.9%) | 274 (17.5%) |
| $1,000 to $1,499 | 728 (19.1%) | 453 (29.0%) |
| $1,500 to $1,999 | 527 (13.8%) | 246 (15.8%) |
| $2,000 to $2,499 | 225 (5.9%) | 150 (9.6%) |
| $2,500 to $2,999 | 113 (3.0%) | 20 (1.3%) |
| $3,000 or more | 292 (7.7%) | 0 (0.0%) |
| Total | 3,809 (100.0%) | 1,562 (100.0%) |
Physical Housing Characteristics in Port Townsend
Housing Structures in Port Townsend
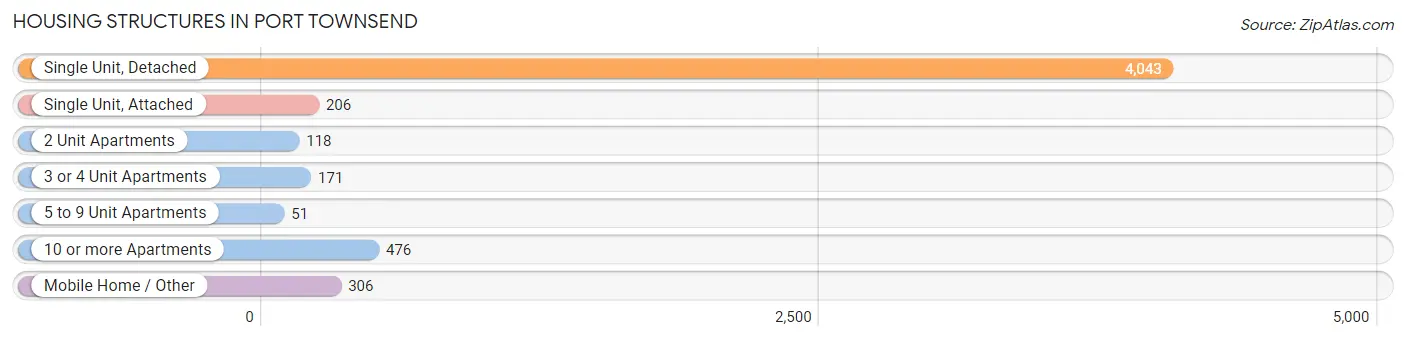
| Structure Type | # Housing Units | % Housing Units |
| Single Unit, Detached | 4,043 | 75.3% |
| Single Unit, Attached | 206 | 3.8% |
| 2 Unit Apartments | 118 | 2.2% |
| 3 or 4 Unit Apartments | 171 | 3.2% |
| 5 to 9 Unit Apartments | 51 | 0.9% |
| 10 or more Apartments | 476 | 8.9% |
| Mobile Home / Other | 306 | 5.7% |
| Total | 5,371 | 100.0% |
Housing Structures by Occupancy in Port Townsend
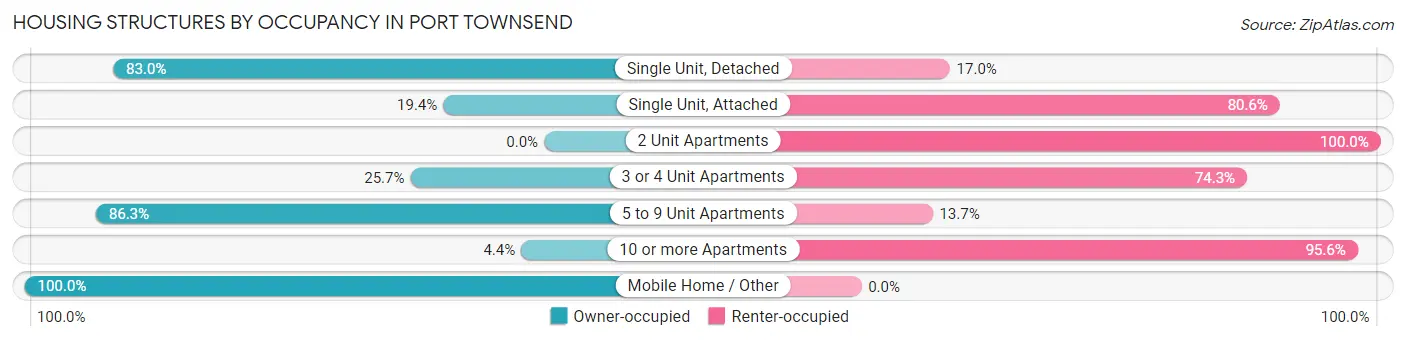
| Structure Type | Owner-occupied | Renter-occupied |
| Single Unit, Detached | 3,354 (83.0%) | 689 (17.0%) |
| Single Unit, Attached | 40 (19.4%) | 166 (80.6%) |
| 2 Unit Apartments | 0 (0.0%) | 118 (100.0%) |
| 3 or 4 Unit Apartments | 44 (25.7%) | 127 (74.3%) |
| 5 to 9 Unit Apartments | 44 (86.3%) | 7 (13.7%) |
| 10 or more Apartments | 21 (4.4%) | 455 (95.6%) |
| Mobile Home / Other | 306 (100.0%) | 0 (0.0%) |
| Total | 3,809 (70.9%) | 1,562 (29.1%) |
Housing Structures by Number of Rooms in Port Townsend
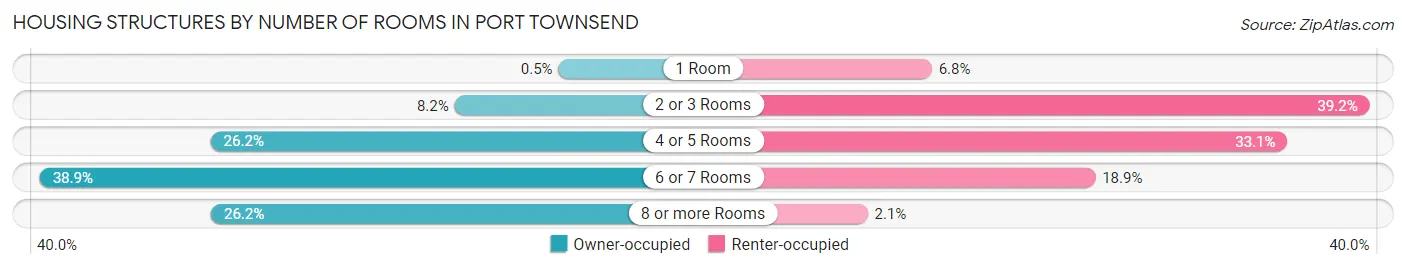
| Number of Rooms | Owner-occupied | Renter-occupied |
| 1 Room | 19 (0.5%) | 106 (6.8%) |
| 2 or 3 Rooms | 312 (8.2%) | 612 (39.2%) |
| 4 or 5 Rooms | 999 (26.2%) | 517 (33.1%) |
| 6 or 7 Rooms | 1,481 (38.9%) | 295 (18.9%) |
| 8 or more Rooms | 998 (26.2%) | 32 (2.1%) |
| Total | 3,809 (100.0%) | 1,562 (100.0%) |
Housing Structure by Heating Type in Port Townsend
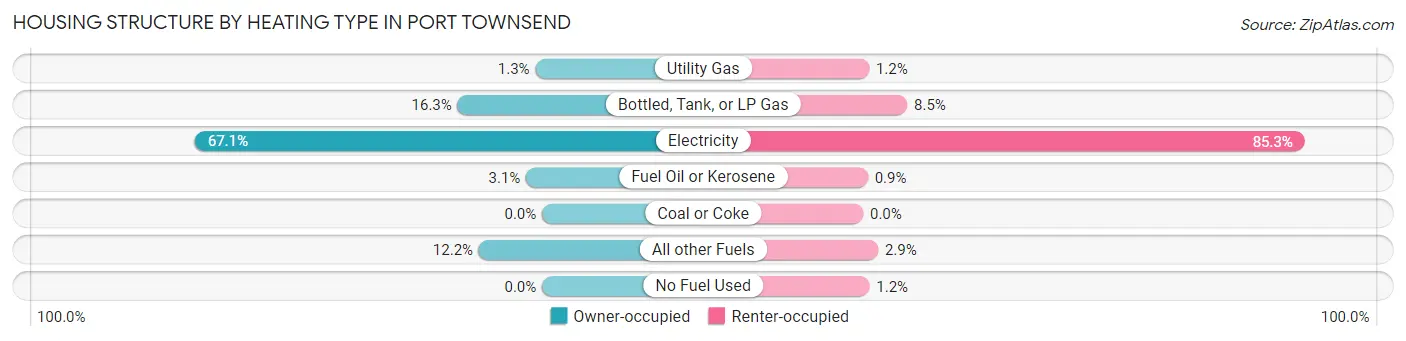
| Heating Type | Owner-occupied | Renter-occupied |
| Utility Gas | 49 (1.3%) | 18 (1.1%) |
| Bottled, Tank, or LP Gas | 622 (16.3%) | 133 (8.5%) |
| Electricity | 2,556 (67.1%) | 1,333 (85.3%) |
| Fuel Oil or Kerosene | 117 (3.1%) | 14 (0.9%) |
| Coal or Coke | 0 (0.0%) | 0 (0.0%) |
| All other Fuels | 465 (12.2%) | 45 (2.9%) |
| No Fuel Used | 0 (0.0%) | 19 (1.2%) |
| Total | 3,809 (100.0%) | 1,562 (100.0%) |
Household Vehicle Usage in Port Townsend
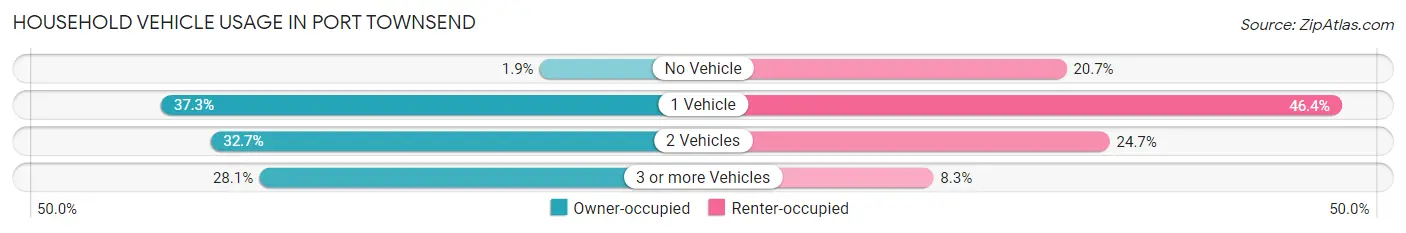
| Vehicles per Household | Owner-occupied | Renter-occupied |
| No Vehicle | 74 (1.9%) | 323 (20.7%) |
| 1 Vehicle | 1,420 (37.3%) | 724 (46.4%) |
| 2 Vehicles | 1,244 (32.7%) | 386 (24.7%) |
| 3 or more Vehicles | 1,071 (28.1%) | 129 (8.3%) |
| Total | 3,809 (100.0%) | 1,562 (100.0%) |
Real Estate & Mortgages in Port Townsend
Real Estate and Mortgage Overview in Port Townsend
| Characteristic | Without Mortgage | With Mortgage |
| Housing Units | 2,049 | 1,760 |
| Median Property Value | $430,500 | $472,900 |
| Median Household Income | $57,796 | $357 |
| Monthly Housing Costs | $693 | $283 |
| Real Estate Taxes | $3,649 | $10 |
Property Value by Mortgage Status in Port Townsend
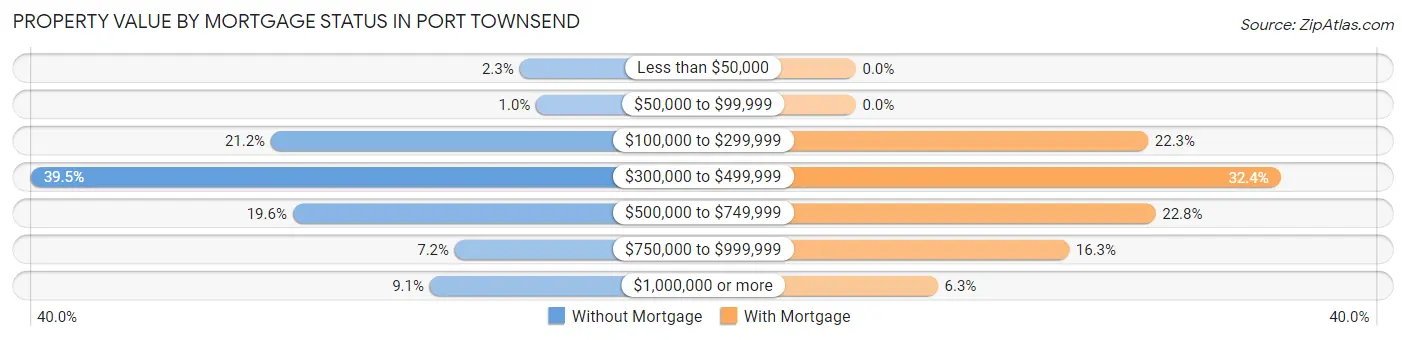
| Property Value | Without Mortgage | With Mortgage |
| Less than $50,000 | 47 (2.3%) | 0 (0.0%) |
| $50,000 to $99,999 | 21 (1.0%) | 0 (0.0%) |
| $100,000 to $299,999 | 435 (21.2%) | 392 (22.3%) |
| $300,000 to $499,999 | 810 (39.5%) | 570 (32.4%) |
| $500,000 to $749,999 | 401 (19.6%) | 402 (22.8%) |
| $750,000 to $999,999 | 148 (7.2%) | 286 (16.3%) |
| $1,000,000 or more | 187 (9.1%) | 110 (6.2%) |
| Total | 2,049 (100.0%) | 1,760 (100.0%) |
Household Income by Mortgage Status in Port Townsend
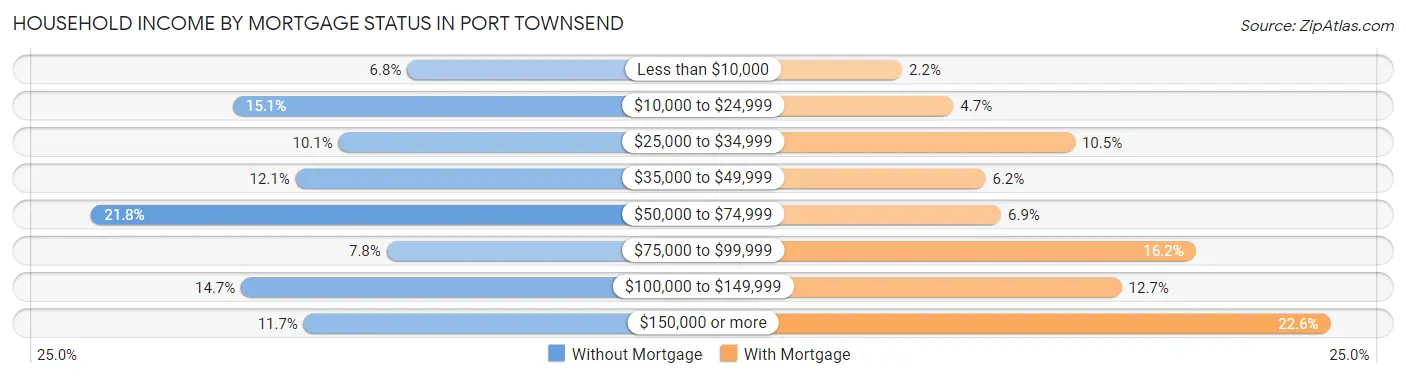
| Household Income | Without Mortgage | With Mortgage |
| Less than $10,000 | 139 (6.8%) | 39 (2.2%) |
| $10,000 to $24,999 | 309 (15.1%) | 82 (4.7%) |
| $25,000 to $34,999 | 206 (10.1%) | 184 (10.4%) |
| $35,000 to $49,999 | 248 (12.1%) | 109 (6.2%) |
| $50,000 to $74,999 | 447 (21.8%) | 122 (6.9%) |
| $75,000 to $99,999 | 159 (7.8%) | 285 (16.2%) |
| $100,000 to $149,999 | 301 (14.7%) | 223 (12.7%) |
| $150,000 or more | 240 (11.7%) | 398 (22.6%) |
| Total | 2,049 (100.0%) | 1,760 (100.0%) |
Property Value to Household Income Ratio in Port Townsend
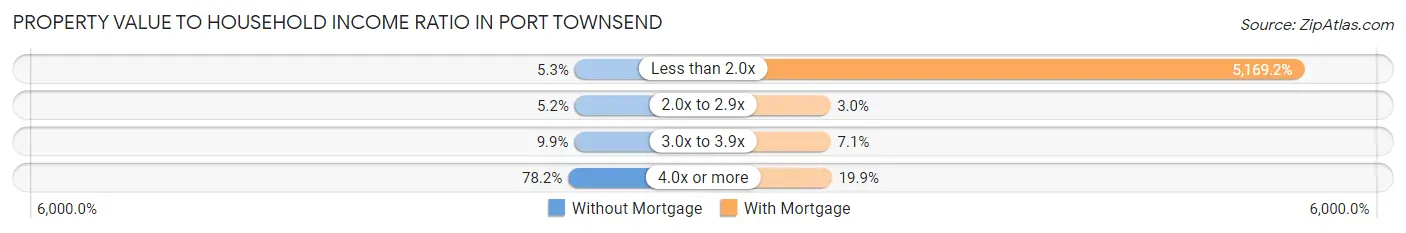
| Value-to-Income Ratio | Without Mortgage | With Mortgage |
| Less than 2.0x | 109 (5.3%) | 90,978 (5,169.2%) |
| 2.0x to 2.9x | 107 (5.2%) | 52 (2.9%) |
| 3.0x to 3.9x | 203 (9.9%) | 124 (7.0%) |
| 4.0x or more | 1,602 (78.2%) | 351 (19.9%) |
| Total | 2,049 (100.0%) | 1,760 (100.0%) |
Real Estate Taxes by Mortgage Status in Port Townsend
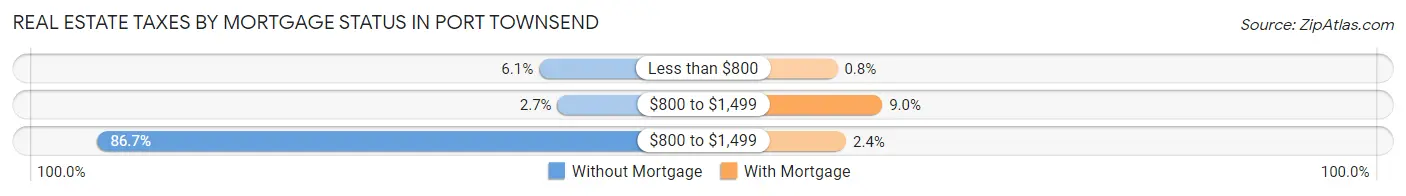
| Property Taxes | Without Mortgage | With Mortgage |
| Less than $800 | 124 (6.0%) | 14 (0.8%) |
| $800 to $1,499 | 55 (2.7%) | 158 (9.0%) |
| $800 to $1,499 | 1,776 (86.7%) | 42 (2.4%) |
| Total | 2,049 (100.0%) | 1,760 (100.0%) |
Health & Disability in Port Townsend
Health Insurance Coverage by Age in Port Townsend
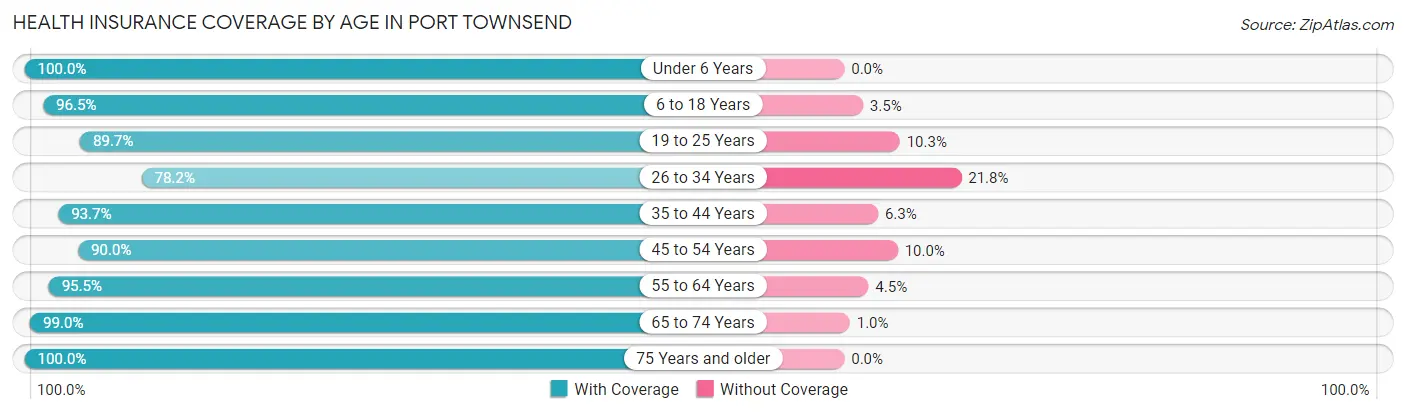
| Age Bracket | With Coverage | Without Coverage |
| Under 6 Years | 209 (100.0%) | 0 (0.0%) |
| 6 to 18 Years | 946 (96.5%) | 34 (3.5%) |
| 19 to 25 Years | 442 (89.7%) | 51 (10.3%) |
| 26 to 34 Years | 459 (78.2%) | 128 (21.8%) |
| 35 to 44 Years | 925 (93.7%) | 62 (6.3%) |
| 45 to 54 Years | 1,031 (90.0%) | 114 (10.0%) |
| 55 to 64 Years | 1,549 (95.5%) | 73 (4.5%) |
| 65 to 74 Years | 2,435 (99.0%) | 25 (1.0%) |
| 75 Years and older | 1,579 (100.0%) | 0 (0.0%) |
| Total | 9,575 (95.2%) | 487 (4.8%) |
Health Insurance Coverage by Citizenship Status in Port Townsend
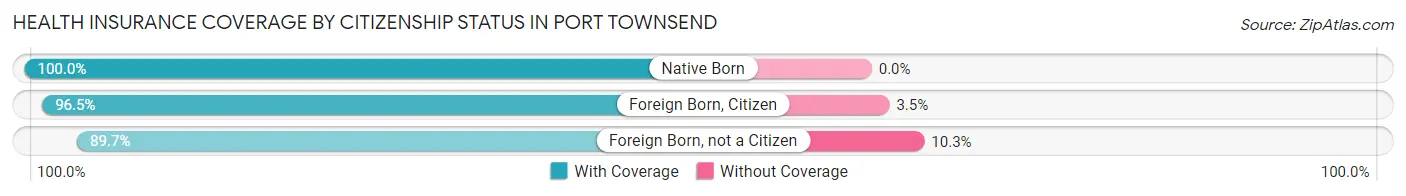
| Citizenship Status | With Coverage | Without Coverage |
| Native Born | 209 (100.0%) | 0 (0.0%) |
| Foreign Born, Citizen | 946 (96.5%) | 34 (3.5%) |
| Foreign Born, not a Citizen | 442 (89.7%) | 51 (10.3%) |
Health Insurance Coverage by Household Income in Port Townsend
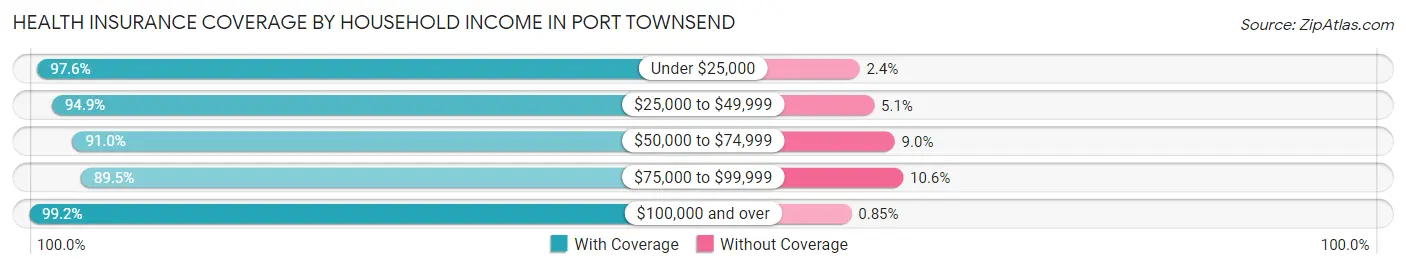
| Household Income | With Coverage | Without Coverage |
| Under $25,000 | 1,435 (97.6%) | 35 (2.4%) |
| $25,000 to $49,999 | 1,539 (94.9%) | 83 (5.1%) |
| $50,000 to $74,999 | 1,968 (91.0%) | 194 (9.0%) |
| $75,000 to $99,999 | 924 (89.4%) | 109 (10.5%) |
| $100,000 and over | 3,632 (99.2%) | 31 (0.9%) |
Public vs Private Health Insurance Coverage by Age in Port Townsend
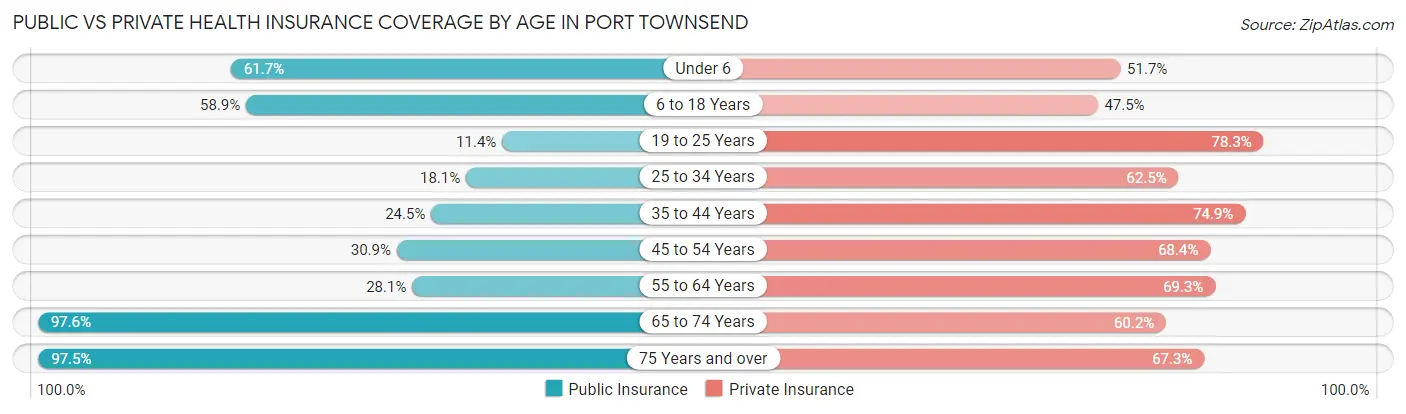
| Age Bracket | Public Insurance | Private Insurance |
| Under 6 | 129 (61.7%) | 108 (51.7%) |
| 6 to 18 Years | 577 (58.9%) | 465 (47.4%) |
| 19 to 25 Years | 56 (11.4%) | 386 (78.3%) |
| 25 to 34 Years | 106 (18.1%) | 367 (62.5%) |
| 35 to 44 Years | 242 (24.5%) | 739 (74.9%) |
| 45 to 54 Years | 354 (30.9%) | 783 (68.4%) |
| 55 to 64 Years | 455 (28.1%) | 1,124 (69.3%) |
| 65 to 74 Years | 2,400 (97.6%) | 1,481 (60.2%) |
| 75 Years and over | 1,539 (97.5%) | 1,062 (67.3%) |
| Total | 5,858 (58.2%) | 6,515 (64.7%) |
Disability Status by Sex by Age in Port Townsend
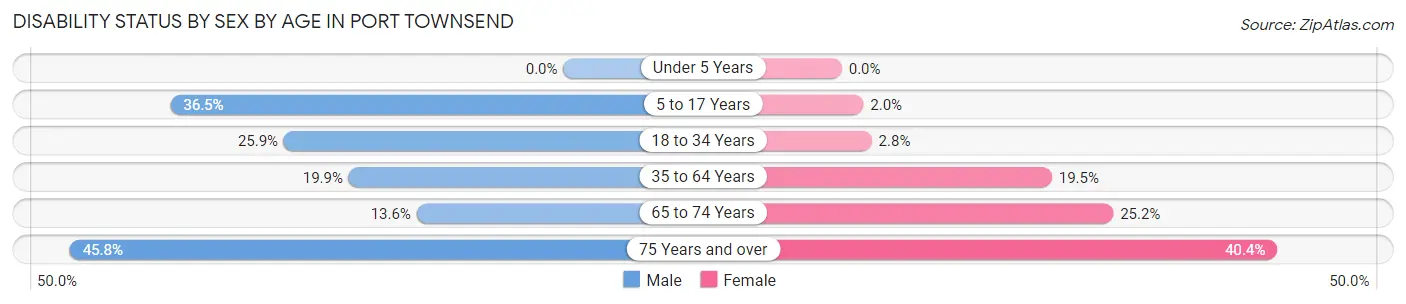
| Age Bracket | Male | Female |
| Under 5 Years | 0 (0.0%) | 0 (0.0%) |
| 5 to 17 Years | 186 (36.5%) | 9 (2.0%) |
| 18 to 34 Years | 119 (25.9%) | 19 (2.8%) |
| 35 to 64 Years | 352 (19.9%) | 387 (19.5%) |
| 65 to 74 Years | 142 (13.6%) | 357 (25.2%) |
| 75 Years and over | 339 (45.8%) | 339 (40.4%) |
Disability Class by Sex by Age in Port Townsend
Disability Class: Hearing Difficulty
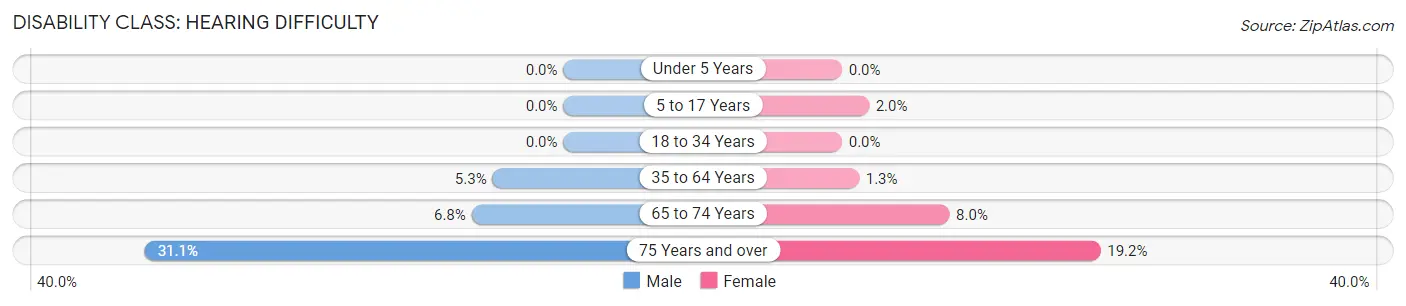
| Age Bracket | Male | Female |
| Under 5 Years | 0 (0.0%) | 0 (0.0%) |
| 5 to 17 Years | 0 (0.0%) | 9 (2.0%) |
| 18 to 34 Years | 0 (0.0%) | 0 (0.0%) |
| 35 to 64 Years | 93 (5.3%) | 25 (1.3%) |
| 65 to 74 Years | 71 (6.8%) | 113 (8.0%) |
| 75 Years and over | 230 (31.1%) | 161 (19.2%) |
Disability Class: Vision Difficulty
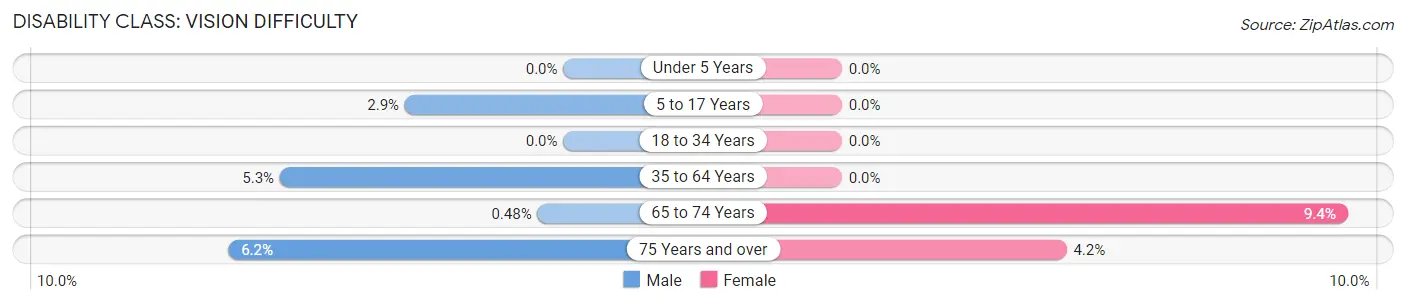
| Age Bracket | Male | Female |
| Under 5 Years | 0 (0.0%) | 0 (0.0%) |
| 5 to 17 Years | 15 (2.9%) | 0 (0.0%) |
| 18 to 34 Years | 0 (0.0%) | 0 (0.0%) |
| 35 to 64 Years | 93 (5.3%) | 0 (0.0%) |
| 65 to 74 Years | 5 (0.5%) | 133 (9.4%) |
| 75 Years and over | 46 (6.2%) | 35 (4.2%) |
Disability Class: Cognitive Difficulty
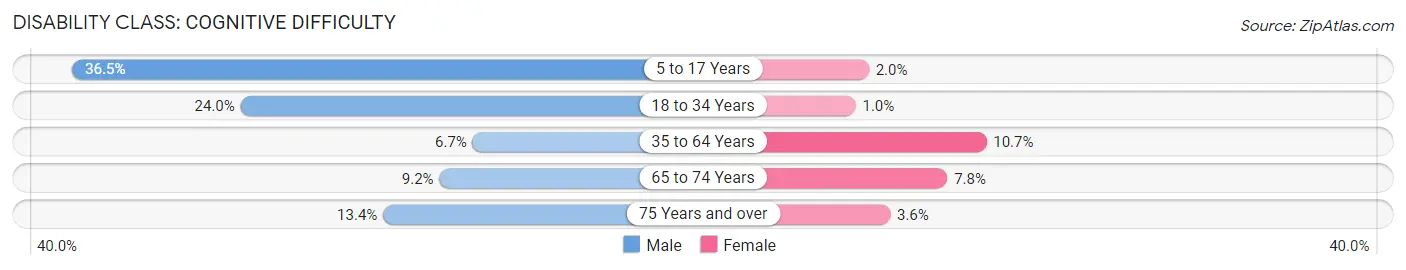
| Age Bracket | Male | Female |
| 5 to 17 Years | 186 (36.5%) | 9 (2.0%) |
| 18 to 34 Years | 110 (24.0%) | 7 (1.0%) |
| 35 to 64 Years | 119 (6.7%) | 213 (10.7%) |
| 65 to 74 Years | 96 (9.2%) | 111 (7.8%) |
| 75 Years and over | 99 (13.4%) | 30 (3.6%) |
Disability Class: Ambulatory Difficulty
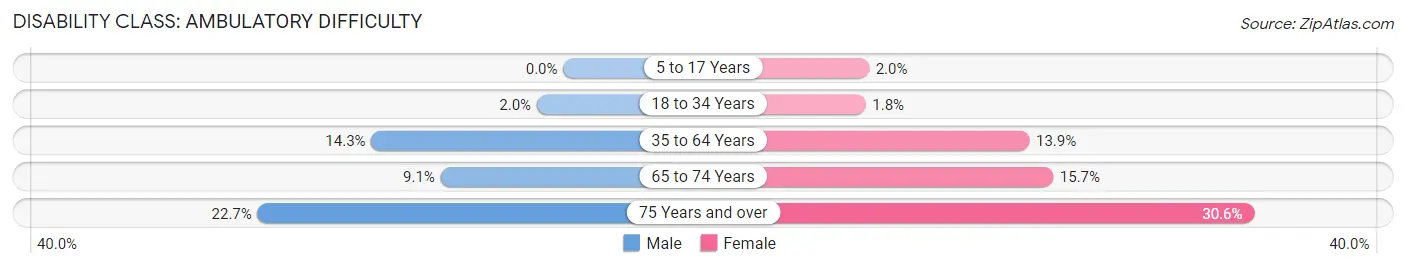
| Age Bracket | Male | Female |
| 5 to 17 Years | 0 (0.0%) | 9 (2.0%) |
| 18 to 34 Years | 9 (2.0%) | 12 (1.8%) |
| 35 to 64 Years | 252 (14.2%) | 276 (13.9%) |
| 65 to 74 Years | 95 (9.1%) | 222 (15.7%) |
| 75 Years and over | 168 (22.7%) | 257 (30.6%) |
Disability Class: Self-Care Difficulty
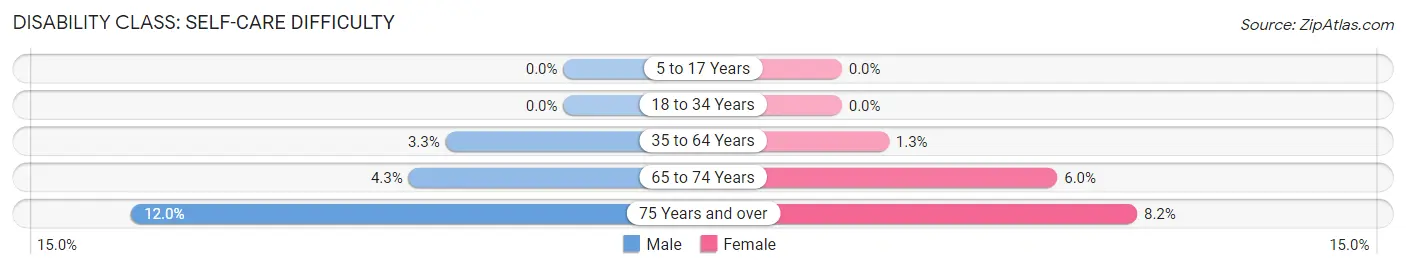
| Age Bracket | Male | Female |
| 5 to 17 Years | 0 (0.0%) | 0 (0.0%) |
| 18 to 34 Years | 0 (0.0%) | 0 (0.0%) |
| 35 to 64 Years | 58 (3.3%) | 26 (1.3%) |
| 65 to 74 Years | 45 (4.3%) | 85 (6.0%) |
| 75 Years and over | 89 (12.0%) | 69 (8.2%) |
Technology Access in Port Townsend
Computing Device Access in Port Townsend
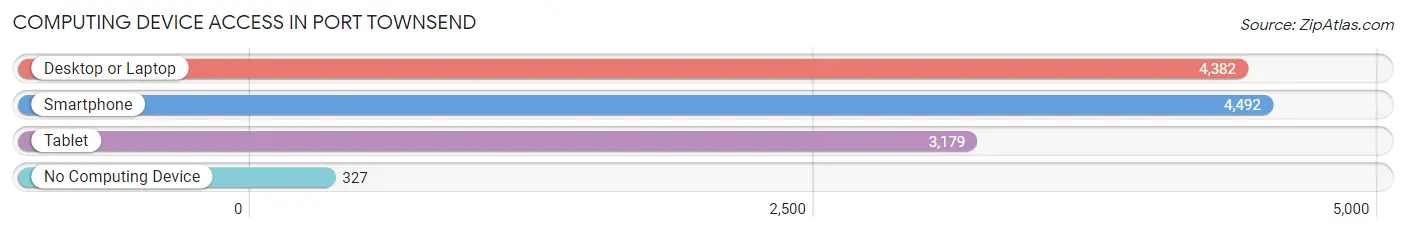
| Device Type | # Households | % Households |
| Desktop or Laptop | 4,382 | 81.6% |
| Smartphone | 4,492 | 83.6% |
| Tablet | 3,179 | 59.2% |
| No Computing Device | 327 | 6.1% |
| Total | 5,371 | 100.0% |
Internet Access in Port Townsend
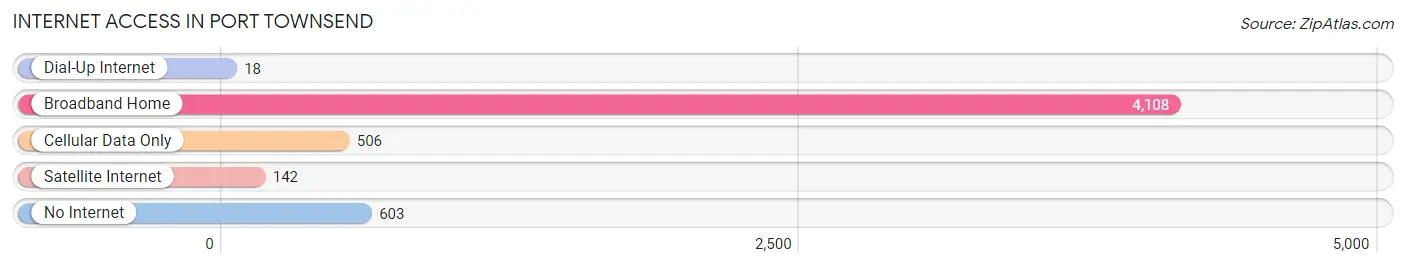
| Internet Type | # Households | % Households |
| Dial-Up Internet | 18 | 0.3% |
| Broadband Home | 4,108 | 76.5% |
| Cellular Data Only | 506 | 9.4% |
| Satellite Internet | 142 | 2.6% |
| No Internet | 603 | 11.2% |
| Total | 5,371 | 100.0% |
Port Townsend Summary
Townsend, Washington is a small city located on the Olympic Peninsula in the northwest corner of the state. It is the county seat of Jefferson County and is situated on the northern end of the Quimper Peninsula, which is bordered by the Strait of Juan de Fuca to the west and Port Townsend Bay to the east. The city is known for its Victorian-era architecture, its maritime heritage, and its natural beauty.
History
The area that is now Port Townsend was first inhabited by the Klallam people, who lived in the area for thousands of years before the arrival of Europeans. The first Europeans to explore the area were Spanish explorers in the late 1700s. In 1851, the area was claimed by the United States and was named Port Townsend after the British explorer George Vancouver.
In the late 1800s, Port Townsend became a major port of entry for immigrants and goods coming to the United States from Asia. The city was also a major center for shipbuilding and fishing. In the early 1900s, the city experienced a period of economic growth and prosperity, and many of the city’s Victorian-era buildings were constructed during this time.
In the mid-1900s, the city’s economy began to decline as the shipping industry moved away from the area. In the late 1900s, the city began to experience a resurgence in popularity as a tourist destination. Today, Port Townsend is a popular destination for visitors who come to enjoy its historic architecture, its maritime heritage, and its natural beauty.
Geography
Port Townsend is located on the northern end of the Quimper Peninsula, which is bordered by the Strait of Juan de Fuca to the west and Port Townsend Bay to the east. The city is situated on a hillside overlooking the bay, and is surrounded by the Olympic Mountains to the east and the Cascade Mountains to the west. The city has a total area of 8.3 square miles, and has a mild, temperate climate with warm summers and mild winters.
Economy
The economy of Port Townsend is largely based on tourism, with many visitors coming to the city to enjoy its historic architecture, its maritime heritage, and its natural beauty. The city is also home to a number of small businesses, including restaurants, shops, galleries, and other services. The city is also home to a number of boatbuilding and fishing businesses, as well as a number of government and military installations.
Demographics
As of the 2010 census, the population of Port Townsend was 9,113. The racial makeup of the city was 87.3% White, 1.2% African American, 1.2% Native American, 4.2% Asian, 0.3% Pacific Islander, 2.2% from other races, and 3.7% from two or more races. The median household income in the city was $45,837, and the median family income was $54,837. The per capita income in the city was $25,945.
Conclusion
Port Townsend, Washington is a small city located on the Olympic Peninsula in the northwest corner of the state. It is known for its Victorian-era architecture, its maritime heritage, and its natural beauty. The city’s economy is largely based on tourism, with many visitors coming to the city to enjoy its historic architecture, its maritime heritage, and its natural beauty. The city has a population of 9,113, and the median household income is $45,837.
Common Questions
What is Per Capita Income in Port Townsend?
Per Capita income in Port Townsend is $43,155.
What is the Median Family Income in Port Townsend?
Median Family Income in Port Townsend is $83,656.
What is the Median Household income in Port Townsend?
Median Household Income in Port Townsend is $59,193.
What is Income or Wage Gap in Port Townsend?
Income or Wage Gap in Port Townsend is 15.6%.
Women in Port Townsend earn 84.4 cents for every dollar earned by a man.
What is Inequality or Gini Index in Port Townsend?
Inequality or Gini Index in Port Townsend is 0.46.
What is the Total Population of Port Townsend?
Total Population of Port Townsend is 10,161.
What is the Total Male Population of Port Townsend?
Total Male Population of Port Townsend is 4,611.
What is the Total Female Population of Port Townsend?
Total Female Population of Port Townsend is 5,550.
What is the Ratio of Males per 100 Females in Port Townsend?
There are 83.08 Males per 100 Females in Port Townsend.
What is the Ratio of Females per 100 Males in Port Townsend?
There are 120.36 Females per 100 Males in Port Townsend.
What is the Median Population Age in Port Townsend?
Median Population Age in Port Townsend is 59.5 Years.
What is the Average Family Size in Port Townsend
Average Family Size in Port Townsend is 2.5 People.
What is the Average Household Size in Port Townsend
Average Household Size in Port Townsend is 1.9 People.
How Large is the Labor Force in Port Townsend?
There are 4,122 People in the Labor Forcein in Port Townsend.
What is the Percentage of People in the Labor Force in Port Townsend?
44.5% of People are in the Labor Force in Port Townsend.
What is the Unemployment Rate in Port Townsend?
Unemployment Rate in Port Townsend is 13.7%.