Zip Codes with the Highest Percentage of Population Employed in Legal Services & Support in Washington
RELATED REPORTS & OPTIONS
Legal Services & Support
Washington
Compare Zip Codes
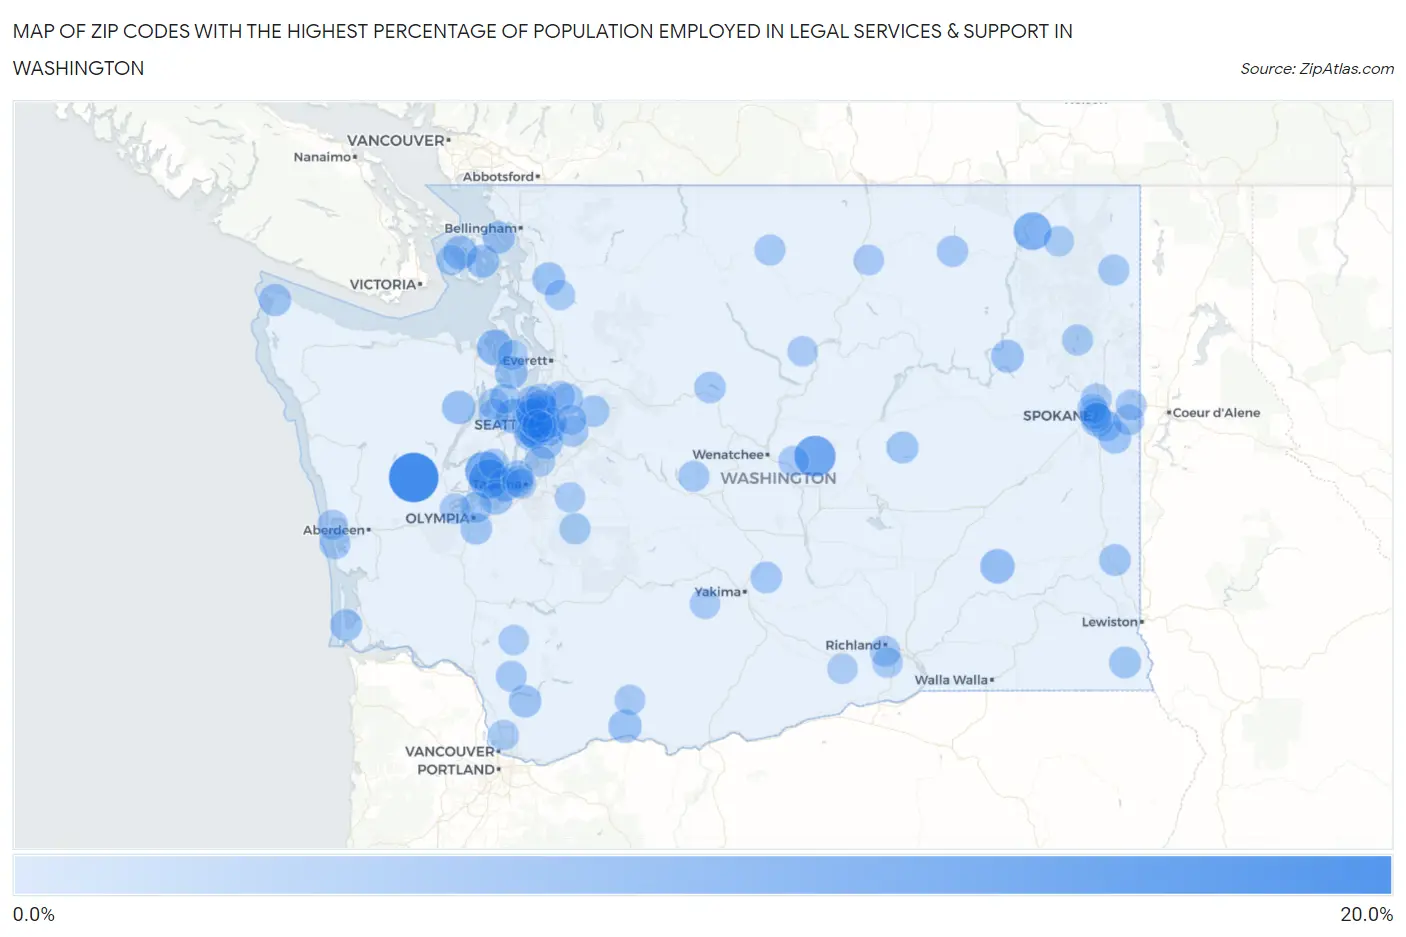
Map of Zip Codes with the Highest Percentage of Population Employed in Legal Services & Support in Washington
0.0%
20.0%
Zip Codes with the Highest Percentage of Population Employed in Legal Services & Support in Washington
| Zip Code | % Employed | vs State | vs National | |
| 1. | 98560 | 18.9% | 1.1%(+17.8)#1 | 1.2%(+17.7)#55 |
| 2. | 98845 | 11.2% | 1.1%(+10.2)#2 | 1.2%(+10.1)#127 |
| 3. | 98394 | 9.8% | 1.1%(+8.72)#3 | 1.2%(+8.61)#165 |
| 4. | 98349 | 9.7% | 1.1%(+8.61)#4 | 1.2%(+8.50)#166 |
| 5. | 98164 | 8.6% | 1.1%(+7.55)#5 | 1.2%(+7.45)#220 |
| 6. | 99126 | 8.2% | 1.1%(+7.15)#6 | 1.2%(+7.04)#245 |
| 7. | 98358 | 6.4% | 1.1%(+5.36)#7 | 1.2%(+5.25)#403 |
| 8. | 98110 | 5.2% | 1.1%(+4.17)#8 | 1.2%(+4.06)#651 |
| 9. | 99371 | 5.2% | 1.1%(+4.13)#9 | 1.2%(+4.02)#662 |
| 10. | 98243 | 4.5% | 1.1%(+3.47)#10 | 1.2%(+3.36)#881 |
| 11. | 98112 | 4.5% | 1.1%(+3.43)#11 | 1.2%(+3.32)#895 |
| 12. | 98333 | 4.4% | 1.1%(+3.31)#12 | 1.2%(+3.20)#946 |
| 13. | 98320 | 4.4% | 1.1%(+3.31)#13 | 1.2%(+3.20)#948 |
| 14. | 99203 | 4.3% | 1.1%(+3.24)#14 | 1.2%(+3.13)#970 |
| 15. | 98605 | 4.2% | 1.1%(+3.11)#15 | 1.2%(+3.00)#1,032 |
| 16. | 98178 | 4.1% | 1.1%(+3.05)#16 | 1.2%(+2.94)#1,063 |
| 17. | 98222 | 4.1% | 1.1%(+3.01)#17 | 1.2%(+2.90)#1,093 |
| 18. | 98235 | 3.9% | 1.1%(+2.86)#18 | 1.2%(+2.75)#1,158 |
| 19. | 98340 | 3.9% | 1.1%(+2.81)#19 | 1.2%(+2.70)#1,187 |
| 20. | 99129 | 3.8% | 1.1%(+2.74)#20 | 1.2%(+2.63)#1,225 |
| 21. | 98601 | 3.6% | 1.1%(+2.49)#21 | 1.2%(+2.38)#1,376 |
| 22. | 98102 | 3.5% | 1.1%(+2.43)#22 | 1.2%(+2.32)#1,430 |
| 23. | 98199 | 3.5% | 1.1%(+2.39)#23 | 1.2%(+2.28)#1,464 |
| 24. | 99036 | 3.4% | 1.1%(+2.33)#24 | 1.2%(+2.22)#1,500 |
| 25. | 98117 | 3.4% | 1.1%(+2.29)#25 | 1.2%(+2.18)#1,522 |
| 26. | 98357 | 3.3% | 1.1%(+2.23)#26 | 1.2%(+2.12)#1,577 |
| 27. | 98262 | 3.3% | 1.1%(+2.20)#27 | 1.2%(+2.09)#1,595 |
| 28. | 98860 | 3.1% | 1.1%(+2.05)#28 | 1.2%(+1.94)#1,729 |
| 29. | 98040 | 3.1% | 1.1%(+1.99)#29 | 1.2%(+1.88)#1,792 |
| 30. | 98631 | 3.0% | 1.1%(+1.93)#30 | 1.2%(+1.82)#1,842 |
| 31. | 98303 | 3.0% | 1.1%(+1.88)#31 | 1.2%(+1.77)#1,894 |
| 32. | 99402 | 2.9% | 1.1%(+1.87)#32 | 1.2%(+1.76)#1,908 |
| 33. | 99102 | 2.9% | 1.1%(+1.85)#33 | 1.2%(+1.74)#1,946 |
| 34. | 98407 | 2.9% | 1.1%(+1.83)#34 | 1.2%(+1.72)#1,966 |
| 35. | 98501 | 2.8% | 1.1%(+1.73)#35 | 1.2%(+1.62)#2,082 |
| 36. | 98901 | 2.7% | 1.1%(+1.65)#36 | 1.2%(+1.54)#2,173 |
| 37. | 98116 | 2.7% | 1.1%(+1.62)#37 | 1.2%(+1.51)#2,210 |
| 38. | 98826 | 2.6% | 1.1%(+1.56)#38 | 1.2%(+1.45)#2,290 |
| 39. | 99166 | 2.6% | 1.1%(+1.53)#39 | 1.2%(+1.42)#2,354 |
| 40. | 98029 | 2.6% | 1.1%(+1.52)#40 | 1.2%(+1.42)#2,356 |
| 41. | 98406 | 2.6% | 1.1%(+1.48)#41 | 1.2%(+1.37)#2,432 |
| 42. | 98136 | 2.5% | 1.1%(+1.47)#42 | 1.2%(+1.36)#2,442 |
| 43. | 98506 | 2.5% | 1.1%(+1.42)#43 | 1.2%(+1.31)#2,530 |
| 44. | 98014 | 2.5% | 1.1%(+1.40)#44 | 1.2%(+1.29)#2,540 |
| 45. | 98077 | 2.5% | 1.1%(+1.40)#45 | 1.2%(+1.29)#2,558 |
| 46. | 98323 | 2.4% | 1.1%(+1.33)#46 | 1.2%(+1.22)#2,681 |
| 47. | 98105 | 2.3% | 1.1%(+1.27)#47 | 1.2%(+1.16)#2,776 |
| 48. | 99119 | 2.3% | 1.1%(+1.19)#48 | 1.2%(+1.08)#2,903 |
| 49. | 98922 | 2.2% | 1.1%(+1.15)#49 | 1.2%(+1.04)#2,979 |
| 50. | 98595 | 2.2% | 1.1%(+1.15)#50 | 1.2%(+1.04)#2,994 |
| 51. | 98862 | 2.2% | 1.1%(+1.11)#51 | 1.2%(+1.00)#3,064 |
| 52. | 99223 | 2.2% | 1.1%(+1.08)#52 | 1.2%(+0.975)#3,120 |
| 53. | 99148 | 2.1% | 1.1%(+1.08)#53 | 1.2%(+0.966)#3,140 |
| 54. | 98115 | 2.1% | 1.1%(+1.06)#54 | 1.2%(+0.951)#3,168 |
| 55. | 98625 | 2.1% | 1.1%(+1.06)#55 | 1.2%(+0.946)#3,183 |
| 56. | 99201 | 2.1% | 1.1%(+1.04)#56 | 1.2%(+0.933)#3,201 |
| 57. | 98502 | 2.1% | 1.1%(+1.02)#57 | 1.2%(+0.908)#3,240 |
| 58. | 99016 | 2.1% | 1.1%(+1.01)#58 | 1.2%(+0.899)#3,262 |
| 59. | 98122 | 2.1% | 1.1%(+0.986)#59 | 1.2%(+0.877)#3,308 |
| 60. | 98101 | 2.1% | 1.1%(+0.986)#60 | 1.2%(+0.877)#3,312 |
| 61. | 98850 | 2.1% | 1.1%(+0.986)#61 | 1.2%(+0.876)#3,314 |
| 62. | 99352 | 2.0% | 1.1%(+0.970)#62 | 1.2%(+0.861)#3,349 |
| 63. | 98155 | 2.0% | 1.1%(+0.968)#63 | 1.2%(+0.859)#3,355 |
| 64. | 99027 | 2.0% | 1.1%(+0.962)#64 | 1.2%(+0.853)#3,371 |
| 65. | 98126 | 2.0% | 1.1%(+0.946)#65 | 1.2%(+0.836)#3,422 |
| 66. | 98072 | 2.0% | 1.1%(+0.939)#66 | 1.2%(+0.830)#3,439 |
| 67. | 98106 | 2.0% | 1.1%(+0.937)#67 | 1.2%(+0.828)#3,449 |
| 68. | 98103 | 2.0% | 1.1%(+0.935)#68 | 1.2%(+0.826)#3,456 |
| 69. | 98119 | 2.0% | 1.1%(+0.910)#69 | 1.2%(+0.801)#3,526 |
| 70. | 98121 | 2.0% | 1.1%(+0.896)#70 | 1.2%(+0.787)#3,554 |
| 71. | 99338 | 1.9% | 1.1%(+0.873)#71 | 1.2%(+0.764)#3,605 |
| 72. | 98004 | 1.9% | 1.1%(+0.860)#72 | 1.2%(+0.751)#3,642 |
| 73. | 98107 | 1.9% | 1.1%(+0.845)#73 | 1.2%(+0.736)#3,674 |
| 74. | 98177 | 1.9% | 1.1%(+0.821)#74 | 1.2%(+0.712)#3,742 |
| 75. | 98125 | 1.9% | 1.1%(+0.812)#75 | 1.2%(+0.703)#3,760 |
| 76. | 98849 | 1.9% | 1.1%(+0.790)#76 | 1.2%(+0.681)#3,823 |
| 77. | 98144 | 1.9% | 1.1%(+0.790)#77 | 1.2%(+0.680)#3,826 |
| 78. | 99251 | 1.9% | 1.1%(+0.783)#78 | 1.2%(+0.674)#3,849 |
| 79. | 98569 | 1.8% | 1.1%(+0.768)#79 | 1.2%(+0.659)#3,880 |
| 80. | 98650 | 1.8% | 1.1%(+0.760)#80 | 1.2%(+0.651)#3,906 |
| 81. | 98074 | 1.8% | 1.1%(+0.749)#81 | 1.2%(+0.640)#3,930 |
| 82. | 98198 | 1.8% | 1.1%(+0.726)#82 | 1.2%(+0.616)#4,005 |
| 83. | 98903 | 1.8% | 1.1%(+0.700)#83 | 1.2%(+0.590)#4,068 |
| 84. | 99114 | 1.8% | 1.1%(+0.698)#84 | 1.2%(+0.589)#4,071 |
| 85. | 98315 | 1.7% | 1.1%(+0.666)#85 | 1.2%(+0.557)#4,173 |
| 86. | 98250 | 1.7% | 1.1%(+0.660)#86 | 1.2%(+0.551)#4,191 |
| 87. | 98405 | 1.7% | 1.1%(+0.645)#87 | 1.2%(+0.536)#4,254 |
| 88. | 99205 | 1.7% | 1.1%(+0.644)#88 | 1.2%(+0.534)#4,258 |
| 89. | 99350 | 1.7% | 1.1%(+0.630)#89 | 1.2%(+0.521)#4,301 |
| 90. | 98383 | 1.7% | 1.1%(+0.608)#90 | 1.2%(+0.499)#4,367 |
| 91. | 98846 | 1.7% | 1.1%(+0.608)#91 | 1.2%(+0.498)#4,368 |
| 92. | 98104 | 1.7% | 1.1%(+0.605)#92 | 1.2%(+0.496)#4,382 |
| 93. | 98321 | 1.7% | 1.1%(+0.603)#93 | 1.2%(+0.493)#4,386 |
| 94. | 98329 | 1.7% | 1.1%(+0.602)#94 | 1.2%(+0.493)#4,391 |
| 95. | 98686 | 1.7% | 1.1%(+0.601)#95 | 1.2%(+0.492)#4,397 |
| 96. | 98249 | 1.7% | 1.1%(+0.582)#96 | 1.2%(+0.473)#4,472 |
| 97. | 98274 | 1.6% | 1.1%(+0.574)#97 | 1.2%(+0.464)#4,495 |
| 98. | 99204 | 1.6% | 1.1%(+0.563)#98 | 1.2%(+0.453)#4,538 |
| 99. | 98649 | 1.6% | 1.1%(+0.530)#99 | 1.2%(+0.420)#4,658 |
| 100. | 98370 | 1.6% | 1.1%(+0.515)#100 | 1.2%(+0.405)#4,708 |
Common Questions
What are the Top 10 Zip Codes with the Highest Percentage of Population Employed in Legal Services & Support in Washington?
Top 10 Zip Codes with the Highest Percentage of Population Employed in Legal Services & Support in Washington are:
What zip code has the Highest Percentage of Population Employed in Legal Services & Support in Washington?
98560 has the Highest Percentage of Population Employed in Legal Services & Support in Washington with 18.9%.
What is the Percentage of Population Employed in Legal Services & Support in the State of Washington?
Percentage of Population Employed in Legal Services & Support in Washington is 1.1%.
What is the Percentage of Population Employed in Legal Services & Support in the United States?
Percentage of Population Employed in Legal Services & Support in the United States is 1.2%.