Ruston, WA Map & Demographics
Ruston Map
Ruston Overview
$74,887
PER CAPITA INCOME
$110,000
AVG FAMILY INCOME
$116,625
AVG HOUSEHOLD INCOME
37.4%
WAGE / INCOME GAP [ % ]
62.6¢/ $1
WAGE / INCOME GAP [ $ ]
0.40
INEQUALITY / GINI INDEX
1,270
TOTAL POPULATION
645
MALE POPULATION
625
FEMALE POPULATION
103.20
MALES / 100 FEMALES
96.90
FEMALES / 100 MALES
46.1
MEDIAN AGE
2.5
AVG FAMILY SIZE
2.0
AVG HOUSEHOLD SIZE
695
LABOR FORCE [ PEOPLE ]
63.8%
PERCENT IN LABOR FORCE
1.5%
UNEMPLOYMENT RATE
Ruston Area Codes
Income in Ruston
Income Overview in Ruston
Per Capita Income in Ruston is $74,887, while median incomes of families and households are $110,000 and $116,625 respectively.
| Characteristic | Number | Measure |
| Per Capita Income | 1,270 | $74,887 |
| Median Family Income | 380 | $110,000 |
| Mean Family Income | 380 | $156,802 |
| Median Household Income | 641 | $116,625 |
| Mean Household Income | 641 | $149,074 |
| Income Deficit | 380 | $0 |
| Wage / Income Gap (%) | 1,270 | 37.38% |
| Wage / Income Gap ($) | 1,270 | 62.62¢ per $1 |
| Gini / Inequality Index | 1,270 | 0.40 |
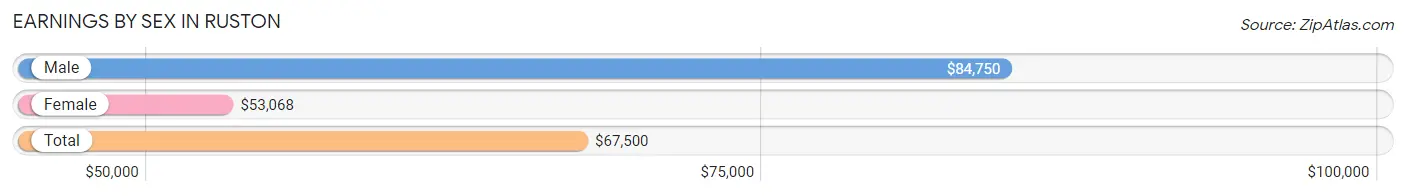
Earnings by Sex in Ruston
Average Earnings in Ruston are $67,500, $84,750 for men and $53,068 for women, a difference of 37.4%.
| Sex | Number | Average Earnings |
| Male | 387 (53.3%) | $84,750 |
| Female | 339 (46.7%) | $53,068 |
| Total | 726 (100.0%) | $67,500 |
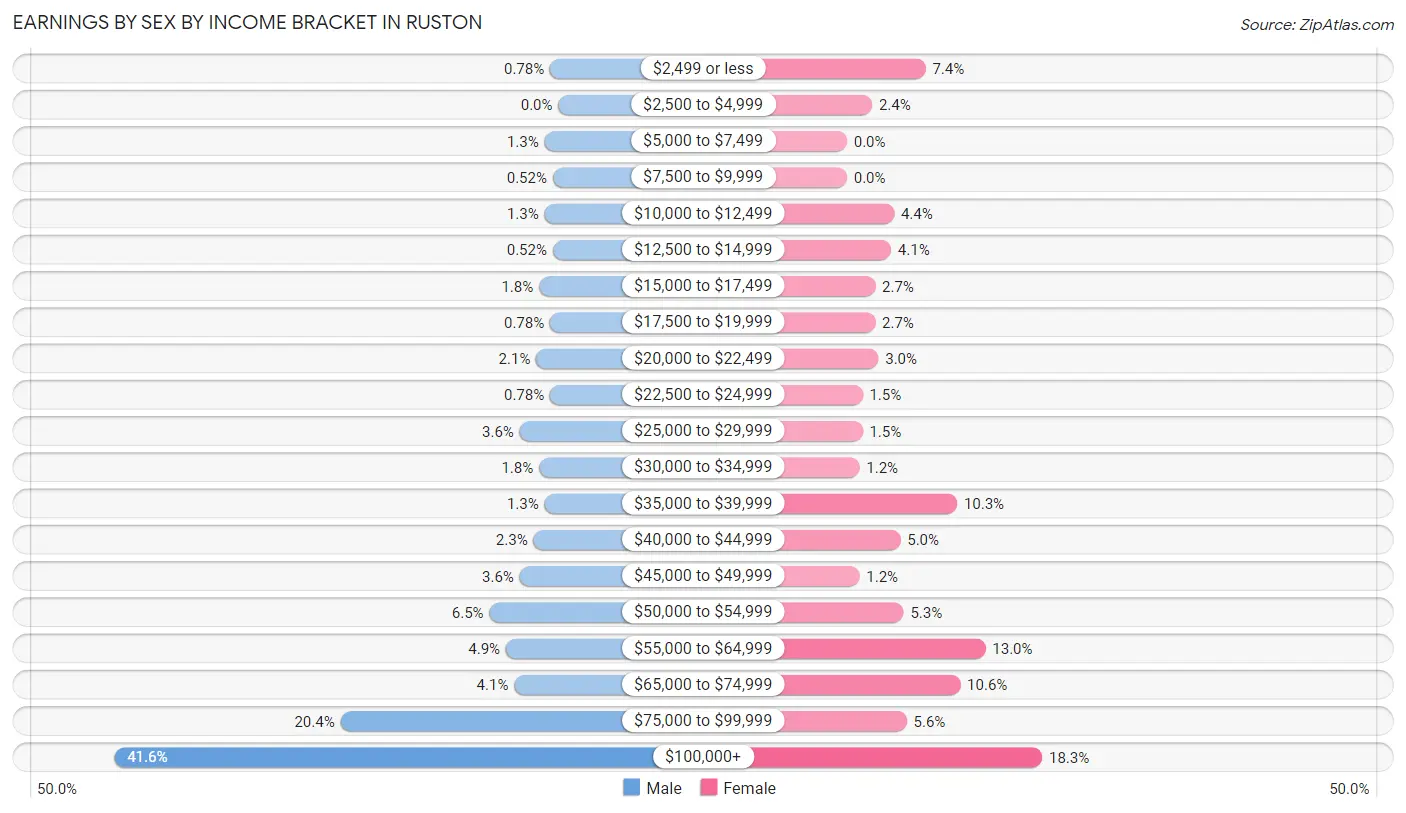
Earnings by Sex by Income Bracket in Ruston
The most common earnings brackets in Ruston are $100,000+ for men (161 | 41.6%) and $100,000+ for women (62 | 18.3%).
| Income | Male | Female |
| $2,499 or less | 3 (0.8%) | 25 (7.4%) |
| $2,500 to $4,999 | 0 (0.0%) | 8 (2.4%) |
| $5,000 to $7,499 | 5 (1.3%) | 0 (0.0%) |
| $7,500 to $9,999 | 2 (0.5%) | 0 (0.0%) |
| $10,000 to $12,499 | 5 (1.3%) | 15 (4.4%) |
| $12,500 to $14,999 | 2 (0.5%) | 14 (4.1%) |
| $15,000 to $17,499 | 7 (1.8%) | 9 (2.6%) |
| $17,500 to $19,999 | 3 (0.8%) | 9 (2.6%) |
| $20,000 to $22,499 | 8 (2.1%) | 10 (2.9%) |
| $22,500 to $24,999 | 3 (0.8%) | 5 (1.5%) |
| $25,000 to $29,999 | 14 (3.6%) | 5 (1.5%) |
| $30,000 to $34,999 | 7 (1.8%) | 4 (1.2%) |
| $35,000 to $39,999 | 5 (1.3%) | 35 (10.3%) |
| $40,000 to $44,999 | 9 (2.3%) | 17 (5.0%) |
| $45,000 to $49,999 | 14 (3.6%) | 4 (1.2%) |
| $50,000 to $54,999 | 25 (6.5%) | 18 (5.3%) |
| $55,000 to $64,999 | 19 (4.9%) | 44 (13.0%) |
| $65,000 to $74,999 | 16 (4.1%) | 36 (10.6%) |
| $75,000 to $99,999 | 79 (20.4%) | 19 (5.6%) |
| $100,000+ | 161 (41.6%) | 62 (18.3%) |
| Total | 387 (100.0%) | 339 (100.0%) |
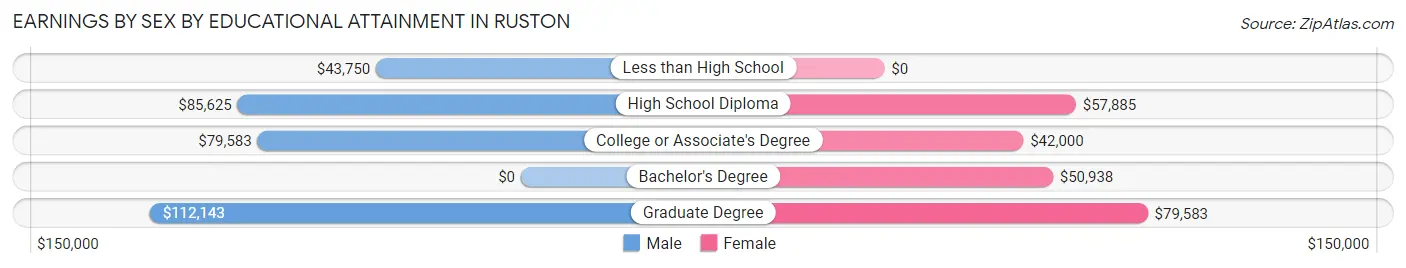
Earnings by Sex by Educational Attainment in Ruston
Average earnings in Ruston are $86,000 for men and $55,417 for women, a difference of 35.6%. Men with an educational attainment of graduate degree enjoy the highest average annual earnings of $112,143, while those with less than high school education earn the least with $43,750. Women with an educational attainment of graduate degree earn the most with the average annual earnings of $79,583, while those with college or associate's degree education have the smallest earnings of $42,000.
| Educational Attainment | Male Income | Female Income |
| Less than High School | $43,750 | $0 |
| High School Diploma | $85,625 | $57,885 |
| College or Associate's Degree | $79,583 | $42,000 |
| Bachelor's Degree | - | - |
| Graduate Degree | $112,143 | $79,583 |
| Total | $86,000 | $55,417 |
Family Income in Ruston
Family Income Brackets in Ruston
According to the Ruston family income data, there are 90 families falling into the $100,000 to $149,999 income range, which is the most common income bracket and makes up 23.7% of all families. Conversely, the $10,000 to $14,999 income bracket is the least frequent group with only 2 families (0.5%) belonging to this category.
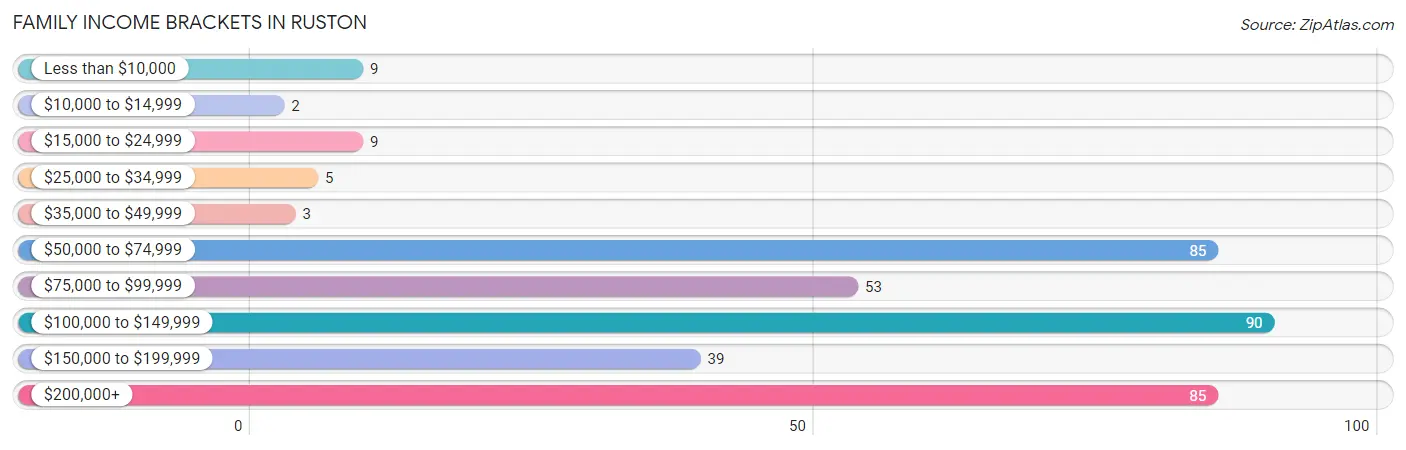
| Income Bracket | # Families | % Families |
| Less than $10,000 | 9 | 2.4% |
| $10,000 to $14,999 | 2 | 0.5% |
| $15,000 to $24,999 | 9 | 2.4% |
| $25,000 to $34,999 | 5 | 1.3% |
| $35,000 to $49,999 | 3 | 0.8% |
| $50,000 to $74,999 | 85 | 22.4% |
| $75,000 to $99,999 | 53 | 13.9% |
| $100,000 to $149,999 | 90 | 23.7% |
| $150,000 to $199,999 | 39 | 10.3% |
| $200,000+ | 85 | 22.4% |
Family Income by Famaliy Size in Ruston
3-person families (35 | 9.2%) account for the highest median family income in Ruston with $159,583 per family, while 3-person families (35 | 9.2%) have the highest median income of $53,194 per family member.
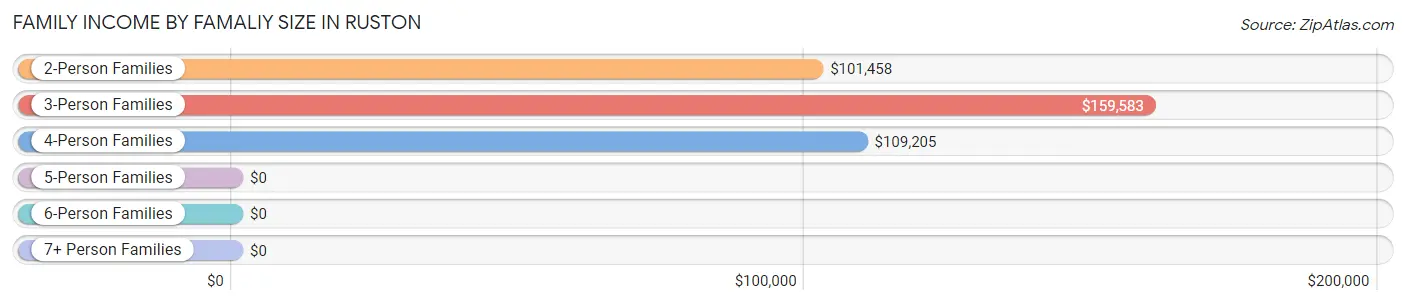
| Income Bracket | # Families | Median Income |
| 2-Person Families | 285 (75.0%) | $101,458 |
| 3-Person Families | 35 (9.2%) | $159,583 |
| 4-Person Families | 39 (10.3%) | $109,205 |
| 5-Person Families | 14 (3.7%) | $0 |
| 6-Person Families | 7 (1.8%) | $0 |
| 7+ Person Families | 0 (0.0%) | $0 |
| Total | 380 (100.0%) | $110,000 |
Family Income by Number of Earners in Ruston
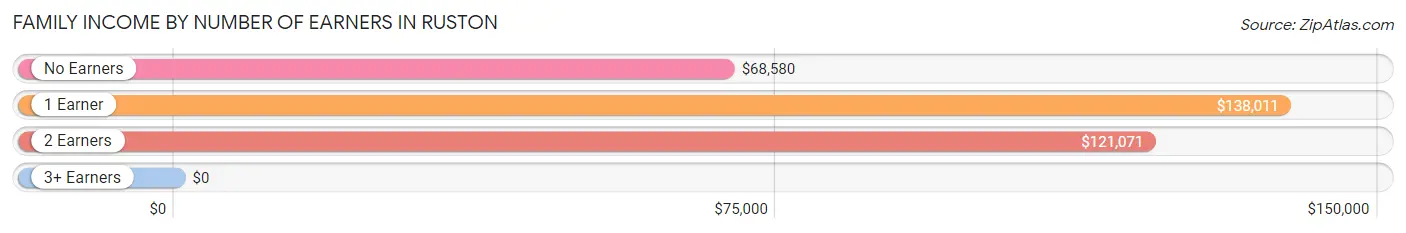
| Number of Earners | # Families | Median Income |
| No Earners | 85 (22.4%) | $68,580 |
| 1 Earner | 145 (38.2%) | $138,011 |
| 2 Earners | 146 (38.4%) | $121,071 |
| 3+ Earners | 4 (1.1%) | $0 |
| Total | 380 (100.0%) | $110,000 |
Household Income in Ruston
Household Income Brackets in Ruston
With 178 households falling in the category, the $200,000+ income range is the most frequent in Ruston, accounting for 27.8% of all households. In contrast, only 8 households (1.3%) fall into the $10,000 to $14,999 income bracket, making it the least populous group.
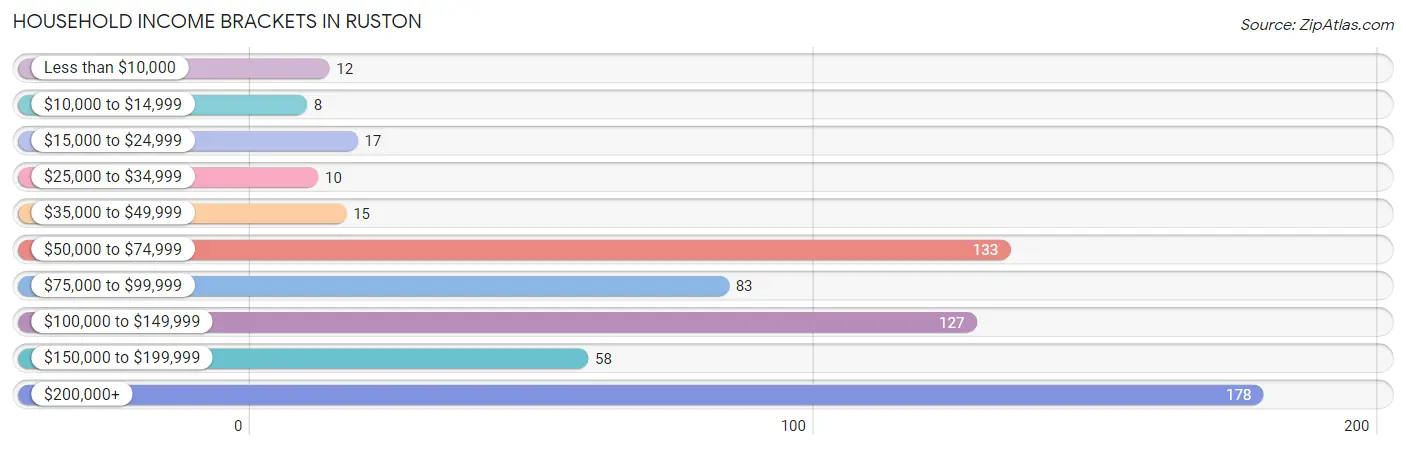
| Income Bracket | # Households | % Households |
| Less than $10,000 | 12 | 1.9% |
| $10,000 to $14,999 | 8 | 1.2% |
| $15,000 to $24,999 | 17 | 2.7% |
| $25,000 to $34,999 | 10 | 1.6% |
| $35,000 to $49,999 | 15 | 2.3% |
| $50,000 to $74,999 | 133 | 20.7% |
| $75,000 to $99,999 | 83 | 12.9% |
| $100,000 to $149,999 | 127 | 19.8% |
| $150,000 to $199,999 | 58 | 9.0% |
| $200,000+ | 178 | 27.8% |
Household Income by Householder Age in Ruston
The median household income in Ruston is $116,625, with the highest median household income of $120,893 found in the 25 to 44 years age bracket for the primary householder. A total of 231 households (36.0%) fall into this category. Meanwhile, the 15 to 24 years age bracket for the primary householder has the lowest median household income of $0, with 1 households (0.2%) in this group.
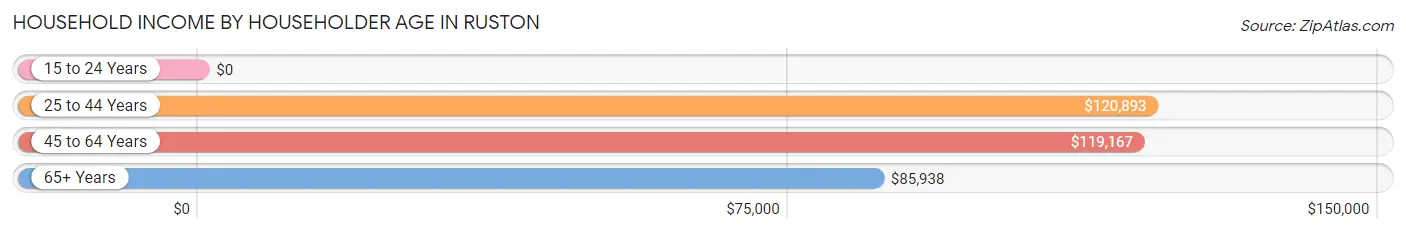
| Income Bracket | # Households | Median Income |
| 15 to 24 Years | 1 (0.2%) | $0 |
| 25 to 44 Years | 231 (36.0%) | $120,893 |
| 45 to 64 Years | 222 (34.6%) | $119,167 |
| 65+ Years | 187 (29.2%) | $85,938 |
| Total | 641 (100.0%) | $116,625 |
Poverty in Ruston
Income Below Poverty by Sex and Age in Ruston
With 4.2% poverty level for males and 8.2% for females among the residents of Ruston, 18 to 24 year old males and 6 to 11 year old females are the most vulnerable to poverty, with 2 males (20.0%) and 15 females (28.8%) in their respective age groups living below the poverty level.
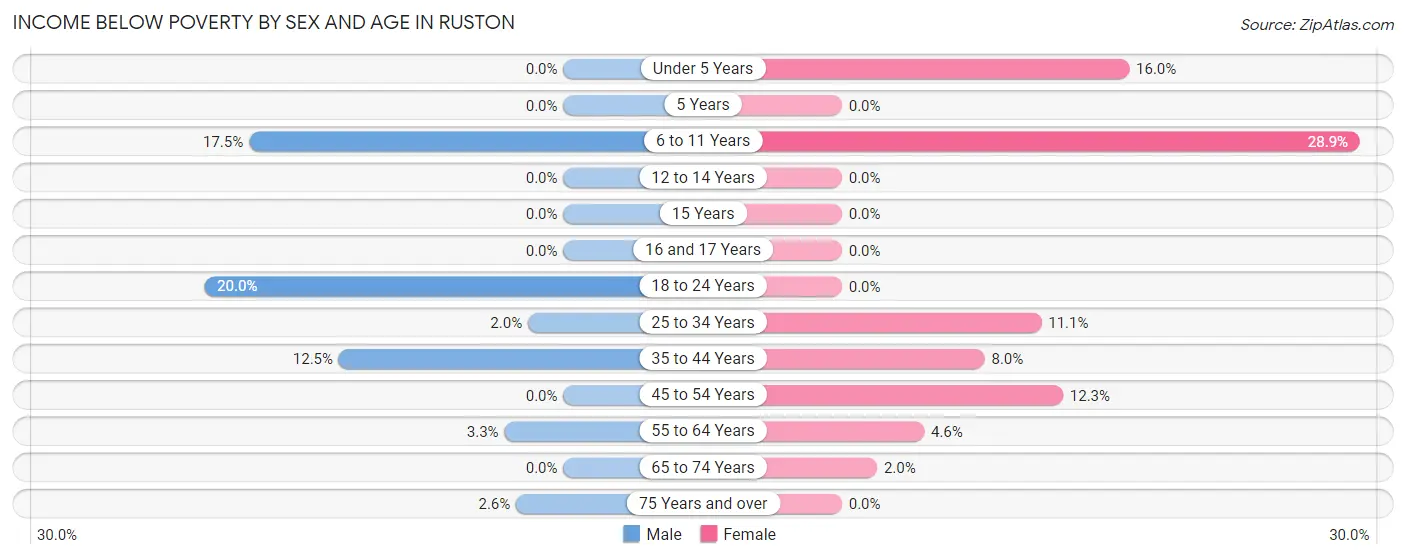
| Age Bracket | Male | Female |
| Under 5 Years | 0 (0.0%) | 4 (16.0%) |
| 5 Years | 0 (0.0%) | 0 (0.0%) |
| 6 to 11 Years | 7 (17.5%) | 15 (28.8%) |
| 12 to 14 Years | 0 (0.0%) | 0 (0.0%) |
| 15 Years | 0 (0.0%) | 0 (0.0%) |
| 16 and 17 Years | 0 (0.0%) | 0 (0.0%) |
| 18 to 24 Years | 2 (20.0%) | 0 (0.0%) |
| 25 to 34 Years | 3 (2.0%) | 9 (11.1%) |
| 35 to 44 Years | 10 (12.5%) | 7 (8.0%) |
| 45 to 54 Years | 0 (0.0%) | 8 (12.3%) |
| 55 to 64 Years | 4 (3.3%) | 6 (4.6%) |
| 65 to 74 Years | 0 (0.0%) | 2 (2.0%) |
| 75 Years and over | 1 (2.6%) | 0 (0.0%) |
| Total | 27 (4.2%) | 51 (8.2%) |
Income Above Poverty by Sex and Age in Ruston
According to the poverty statistics in Ruston, males aged under 5 years and females aged 12 to 14 years are the age groups that are most secure financially, with 100.0% of males and 100.0% of females in these age groups living above the poverty line.
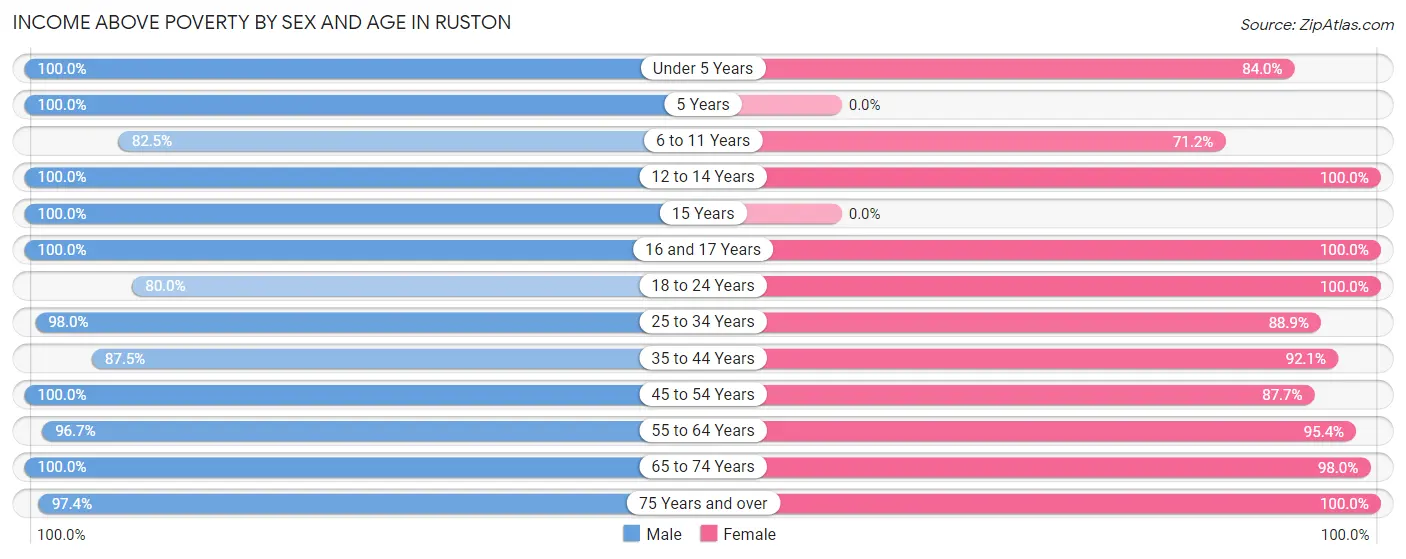
| Age Bracket | Male | Female |
| Under 5 Years | 22 (100.0%) | 21 (84.0%) |
| 5 Years | 9 (100.0%) | 0 (0.0%) |
| 6 to 11 Years | 33 (82.5%) | 37 (71.2%) |
| 12 to 14 Years | 13 (100.0%) | 14 (100.0%) |
| 15 Years | 2 (100.0%) | 0 (0.0%) |
| 16 and 17 Years | 4 (100.0%) | 3 (100.0%) |
| 18 to 24 Years | 8 (80.0%) | 23 (100.0%) |
| 25 to 34 Years | 149 (98.0%) | 72 (88.9%) |
| 35 to 44 Years | 70 (87.5%) | 81 (92.0%) |
| 45 to 54 Years | 58 (100.0%) | 57 (87.7%) |
| 55 to 64 Years | 118 (96.7%) | 125 (95.4%) |
| 65 to 74 Years | 93 (100.0%) | 100 (98.0%) |
| 75 Years and over | 37 (97.4%) | 40 (100.0%) |
| Total | 616 (95.8%) | 573 (91.8%) |
Income Below Poverty Among Married-Couple Families in Ruston
The poverty statistics for married-couple families in Ruston show that 2.1% or 6 of the total 288 families live below the poverty line. Families with 3 or 4 children have the highest poverty rate of 31.6%, comprising of 6 families. On the other hand, families with no children have the lowest poverty rate of 0.0%, which includes 0 families.
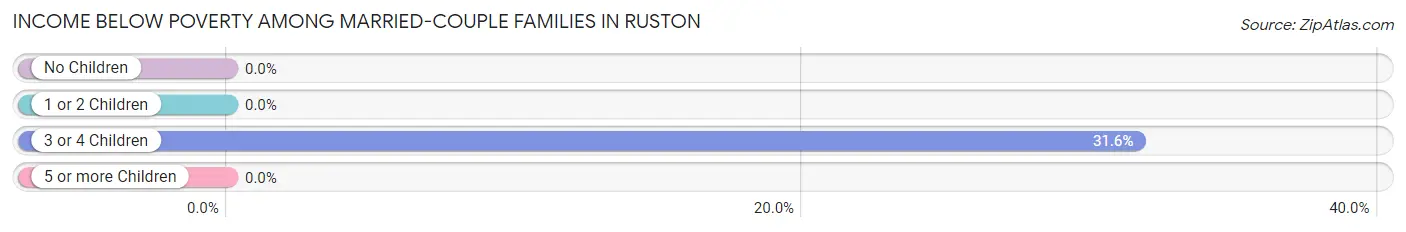
| Children | Above Poverty | Below Poverty |
| No Children | 234 (100.0%) | 0 (0.0%) |
| 1 or 2 Children | 35 (100.0%) | 0 (0.0%) |
| 3 or 4 Children | 13 (68.4%) | 6 (31.6%) |
| 5 or more Children | 0 (0.0%) | 0 (0.0%) |
| Total | 282 (97.9%) | 6 (2.1%) |
Income Below Poverty Among Single-Parent Households in Ruston
According to the poverty data in Ruston, 5.0% or 2 single-father households and 15.4% or 8 single-mother households are living below the poverty line. Among single-father households, those with no children have the highest poverty rate, with 2 households (8.0%) experiencing poverty. Likewise, among single-mother households, those with 1 or 2 children have the highest poverty rate, with 5 households (22.7%) falling below the poverty line.
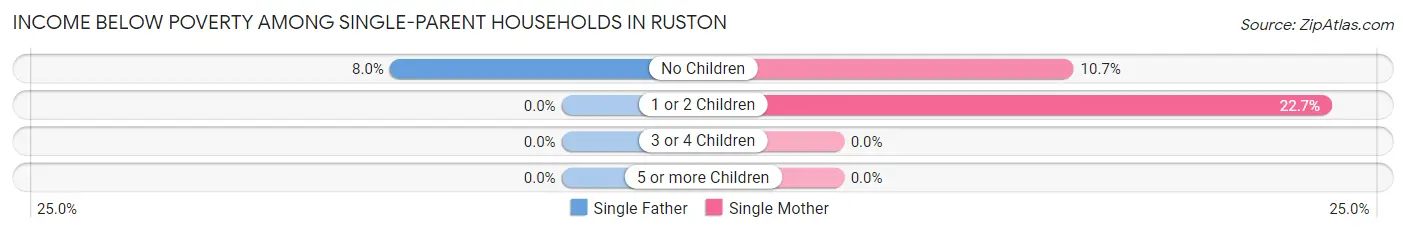
| Children | Single Father | Single Mother |
| No Children | 2 (8.0%) | 3 (10.7%) |
| 1 or 2 Children | 0 (0.0%) | 5 (22.7%) |
| 3 or 4 Children | 0 (0.0%) | 0 (0.0%) |
| 5 or more Children | 0 (0.0%) | 0 (0.0%) |
| Total | 2 (5.0%) | 8 (15.4%) |
Income Below Poverty Among Married-Couple vs Single-Parent Households in Ruston
The poverty data for Ruston shows that 6 of the married-couple family households (2.1%) and 10 of the single-parent households (10.9%) are living below the poverty level. Within the married-couple family households, those with 3 or 4 children have the highest poverty rate, with 6 households (31.6%) falling below the poverty line. Among the single-parent households, those with 1 or 2 children have the highest poverty rate, with 5 household (13.5%) living below poverty.
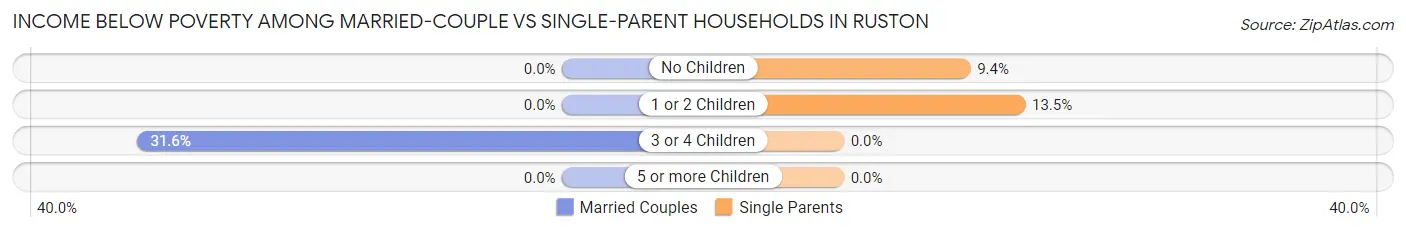
| Children | Married-Couple Families | Single-Parent Households |
| No Children | 0 (0.0%) | 5 (9.4%) |
| 1 or 2 Children | 0 (0.0%) | 5 (13.5%) |
| 3 or 4 Children | 6 (31.6%) | 0 (0.0%) |
| 5 or more Children | 0 (0.0%) | 0 (0.0%) |
| Total | 6 (2.1%) | 10 (10.9%) |
Race in Ruston
The most populous races in Ruston are White / Caucasian (1,004 | 79.1%), Two or more Races (125 | 9.8%), and Asian (84 | 6.6%).
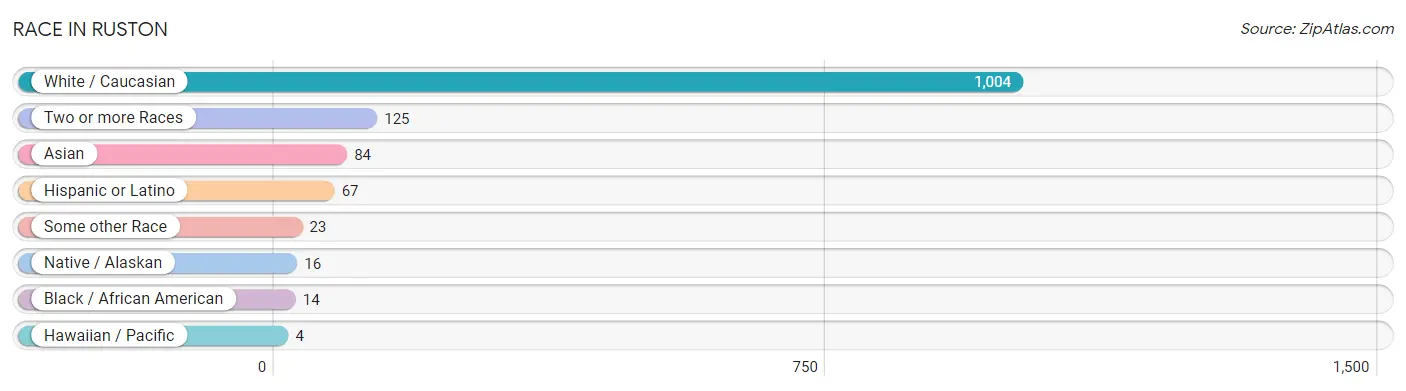
| Race | # Population | % Population |
| Asian | 84 | 6.6% |
| Black / African American | 14 | 1.1% |
| Hawaiian / Pacific | 4 | 0.3% |
| Hispanic or Latino | 67 | 5.3% |
| Native / Alaskan | 16 | 1.3% |
| White / Caucasian | 1,004 | 79.1% |
| Two or more Races | 125 | 9.8% |
| Some other Race | 23 | 1.8% |
| Total | 1,270 | 100.0% |
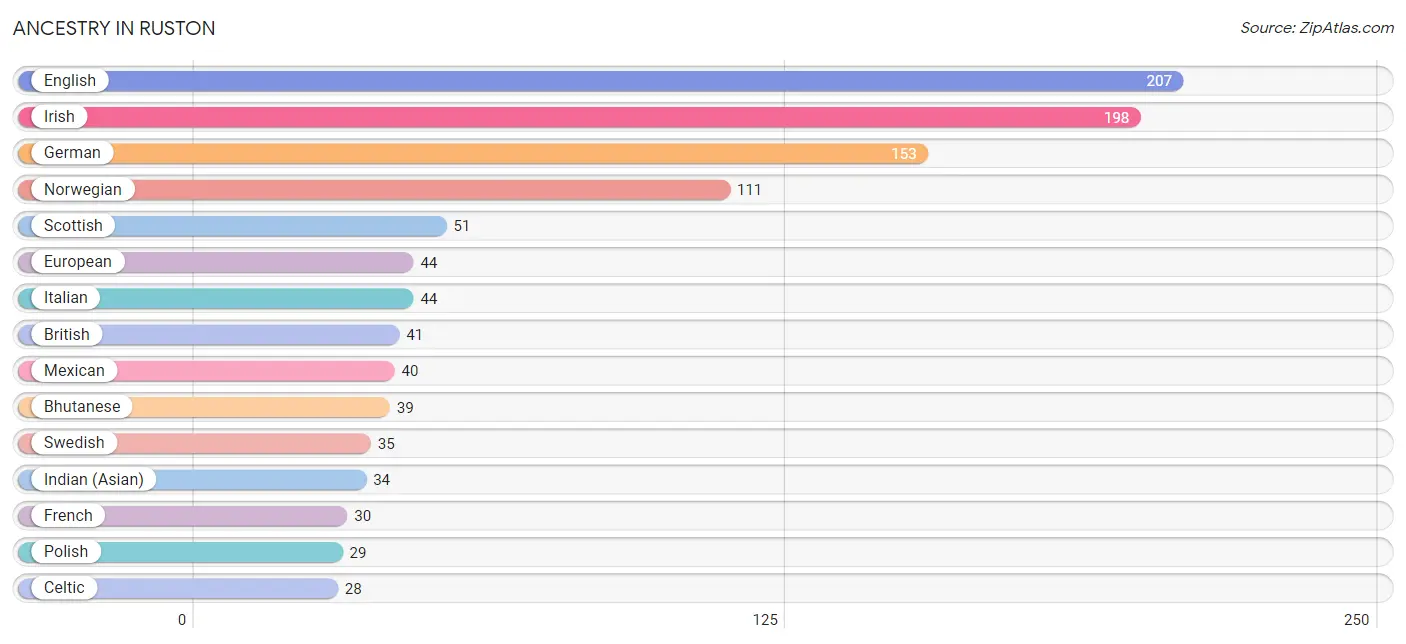
Ancestry in Ruston
The most populous ancestries reported in Ruston are English (207 | 16.3%), Irish (198 | 15.6%), German (153 | 12.0%), Norwegian (111 | 8.7%), and Scottish (51 | 4.0%), together accounting for 56.7% of all Ruston residents.
| Ancestry | # Population | % Population |
| African | 2 | 0.2% |
| American | 16 | 1.3% |
| Arab | 2 | 0.2% |
| Argentinean | 6 | 0.5% |
| Austrian | 15 | 1.2% |
| Bhutanese | 39 | 3.1% |
| Blackfeet | 6 | 0.5% |
| British | 41 | 3.2% |
| Burmese | 11 | 0.9% |
| Canadian | 7 | 0.5% |
| Celtic | 28 | 2.2% |
| Cherokee | 5 | 0.4% |
| Chippewa | 1 | 0.1% |
| Choctaw | 2 | 0.2% |
| Cree | 3 | 0.2% |
| Creek | 2 | 0.2% |
| Czech | 2 | 0.2% |
| Czechoslovakian | 4 | 0.3% |
| Danish | 21 | 1.7% |
| Dominican | 4 | 0.3% |
| Dutch | 18 | 1.4% |
| Eastern European | 8 | 0.6% |
| English | 207 | 16.3% |
| European | 44 | 3.5% |
| Finnish | 5 | 0.4% |
| French | 30 | 2.4% |
| French Canadian | 5 | 0.4% |
| German | 153 | 12.0% |
| Greek | 2 | 0.2% |
| Hungarian | 7 | 0.5% |
| Indian (Asian) | 34 | 2.7% |
| Iranian | 5 | 0.4% |
| Irish | 198 | 15.6% |
| Italian | 44 | 3.5% |
| Korean | 28 | 2.2% |
| Lebanese | 2 | 0.2% |
| Mexican | 40 | 3.2% |
| Native Hawaiian | 10 | 0.8% |
| Northern European | 6 | 0.5% |
| Norwegian | 111 | 8.7% |
| Pennsylvania German | 1 | 0.1% |
| Polish | 29 | 2.3% |
| Portuguese | 3 | 0.2% |
| Puerto Rican | 9 | 0.7% |
| Puget Sound Salish | 10 | 0.8% |
| Russian | 16 | 1.3% |
| Scandinavian | 13 | 1.0% |
| Scotch-Irish | 13 | 1.0% |
| Scottish | 51 | 4.0% |
| Serbian | 3 | 0.2% |
| Sioux | 2 | 0.2% |
| Slavic | 3 | 0.2% |
| Slovak | 4 | 0.3% |
| Slovene | 6 | 0.5% |
| South American | 6 | 0.5% |
| Spaniard | 8 | 0.6% |
| Sri Lankan | 27 | 2.1% |
| Subsaharan African | 2 | 0.2% |
| Swedish | 35 | 2.8% |
| Swiss | 5 | 0.4% |
| Thai | 9 | 0.7% |
| Ukrainian | 18 | 1.4% |
| Welsh | 22 | 1.7% | View All 63 Rows |
Immigrants in Ruston
The most numerous immigrant groups reported in Ruston came from Asia (44 | 3.5%), Europe (39 | 3.1%), South Eastern Asia (32 | 2.5%), Northern Europe (27 | 2.1%), and England (22 | 1.7%), together accounting for 12.9% of all Ruston residents.
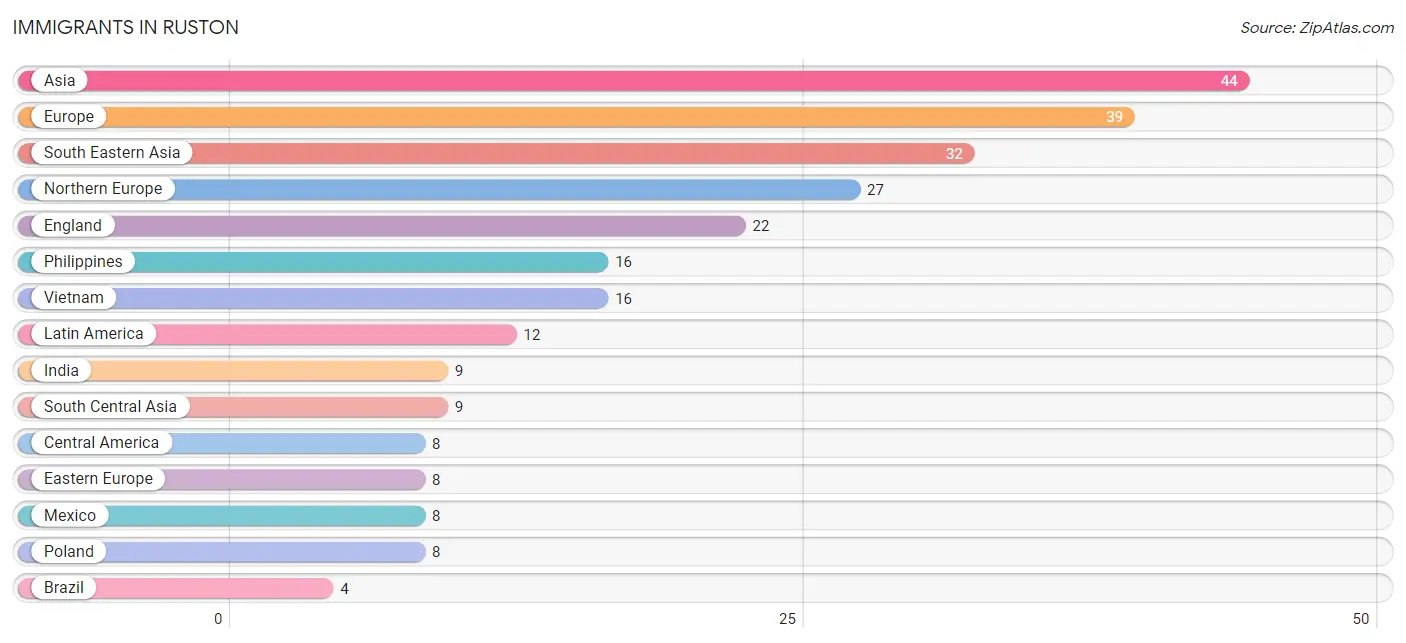
| Immigration Origin | # Population | % Population |
| Asia | 44 | 3.5% |
| Brazil | 4 | 0.3% |
| Canada | 2 | 0.2% |
| Central America | 8 | 0.6% |
| Eastern Asia | 3 | 0.2% |
| Eastern Europe | 8 | 0.6% |
| England | 22 | 1.7% |
| Europe | 39 | 3.1% |
| France | 4 | 0.3% |
| India | 9 | 0.7% |
| Ireland | 3 | 0.2% |
| Korea | 3 | 0.2% |
| Latin America | 12 | 0.9% |
| Mexico | 8 | 0.6% |
| Northern Europe | 27 | 2.1% |
| Philippines | 16 | 1.3% |
| Poland | 8 | 0.6% |
| South America | 4 | 0.3% |
| South Central Asia | 9 | 0.7% |
| South Eastern Asia | 32 | 2.5% |
| Vietnam | 16 | 1.3% |
| Western Europe | 4 | 0.3% | View All 22 Rows |
Sex and Age in Ruston
Sex and Age in Ruston
The most populous age groups in Ruston are 30 to 34 Years (106 | 16.4%) for men and 60 to 64 Years (91 | 14.6%) for women.
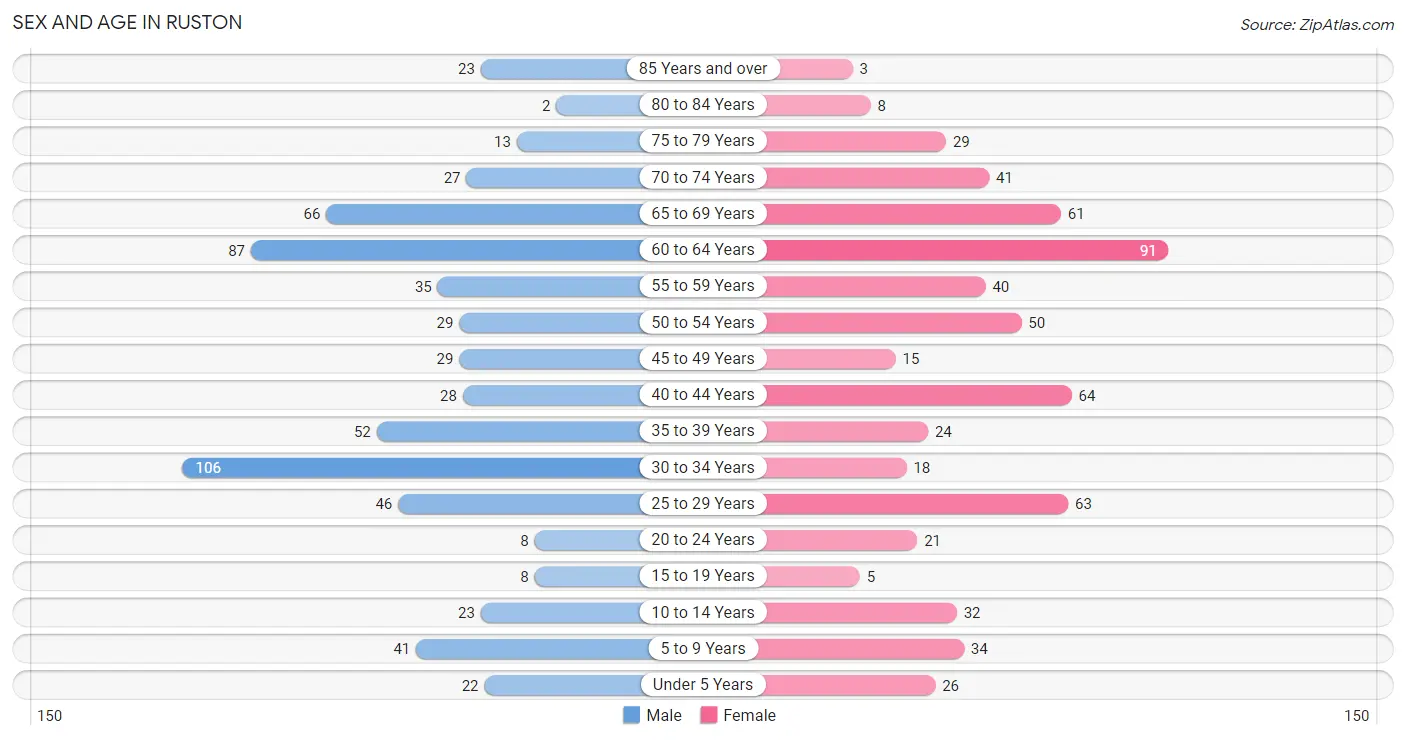
| Age Bracket | Male | Female |
| Under 5 Years | 22 (3.4%) | 26 (4.2%) |
| 5 to 9 Years | 41 (6.4%) | 34 (5.4%) |
| 10 to 14 Years | 23 (3.6%) | 32 (5.1%) |
| 15 to 19 Years | 8 (1.2%) | 5 (0.8%) |
| 20 to 24 Years | 8 (1.2%) | 21 (3.4%) |
| 25 to 29 Years | 46 (7.1%) | 63 (10.1%) |
| 30 to 34 Years | 106 (16.4%) | 18 (2.9%) |
| 35 to 39 Years | 52 (8.1%) | 24 (3.8%) |
| 40 to 44 Years | 28 (4.3%) | 64 (10.2%) |
| 45 to 49 Years | 29 (4.5%) | 15 (2.4%) |
| 50 to 54 Years | 29 (4.5%) | 50 (8.0%) |
| 55 to 59 Years | 35 (5.4%) | 40 (6.4%) |
| 60 to 64 Years | 87 (13.5%) | 91 (14.6%) |
| 65 to 69 Years | 66 (10.2%) | 61 (9.8%) |
| 70 to 74 Years | 27 (4.2%) | 41 (6.6%) |
| 75 to 79 Years | 13 (2.0%) | 29 (4.6%) |
| 80 to 84 Years | 2 (0.3%) | 8 (1.3%) |
| 85 Years and over | 23 (3.6%) | 3 (0.5%) |
| Total | 645 (100.0%) | 625 (100.0%) |
Families and Households in Ruston
Median Family Size in Ruston
The median family size in Ruston is 2.46 persons per family, with single female/mother families (52 | 13.7%) accounting for the largest median family size of 2.5 persons per family. On the other hand, single male/father families (40 | 10.5%) represent the smallest median family size with 2.20 persons per family.
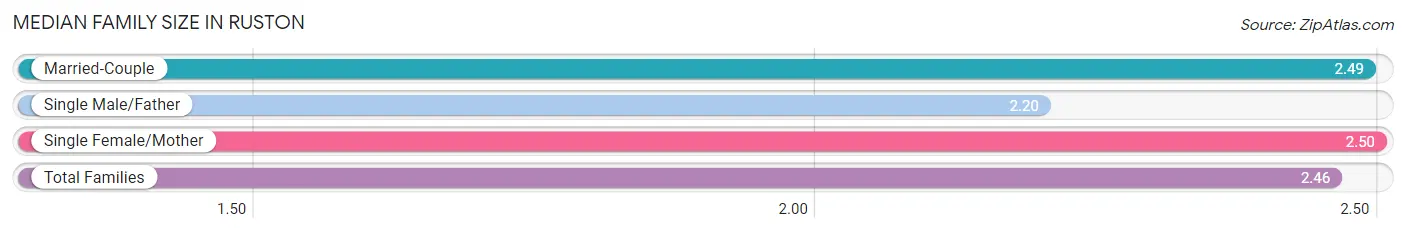
| Family Type | # Families | Family Size |
| Married-Couple | 288 (75.8%) | 2.49 |
| Single Male/Father | 40 (10.5%) | 2.20 |
| Single Female/Mother | 52 (13.7%) | 2.50 |
| Total Families | 380 (100.0%) | 2.46 |
Median Household Size in Ruston
The median household size in Ruston is 1.98 persons per household, with single female/mother households (52 | 8.1%) accounting for the largest median household size of 2.79 persons per household. non-family households (261 | 40.7%) represent the smallest median household size with 1.16 persons per household.
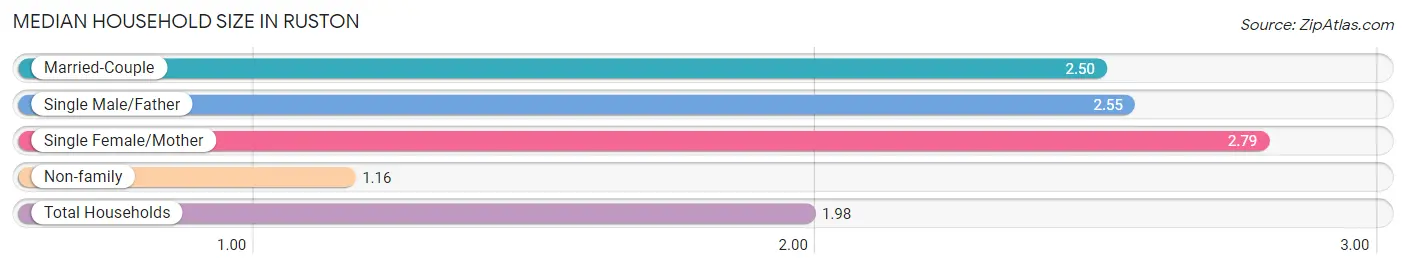
| Household Type | # Households | Household Size |
| Married-Couple | 288 (44.9%) | 2.50 |
| Single Male/Father | 40 (6.2%) | 2.55 |
| Single Female/Mother | 52 (8.1%) | 2.79 |
| Non-family | 261 (40.7%) | 1.16 |
| Total Households | 641 (100.0%) | 1.98 |
Household Size by Marriage Status in Ruston
Out of a total of 641 households in Ruston, 380 (59.3%) are family households, while 261 (40.7%) are nonfamily households. The most numerous type of family households are 2-person households, comprising 263, and the most common type of nonfamily households are 1-person households, comprising 217.
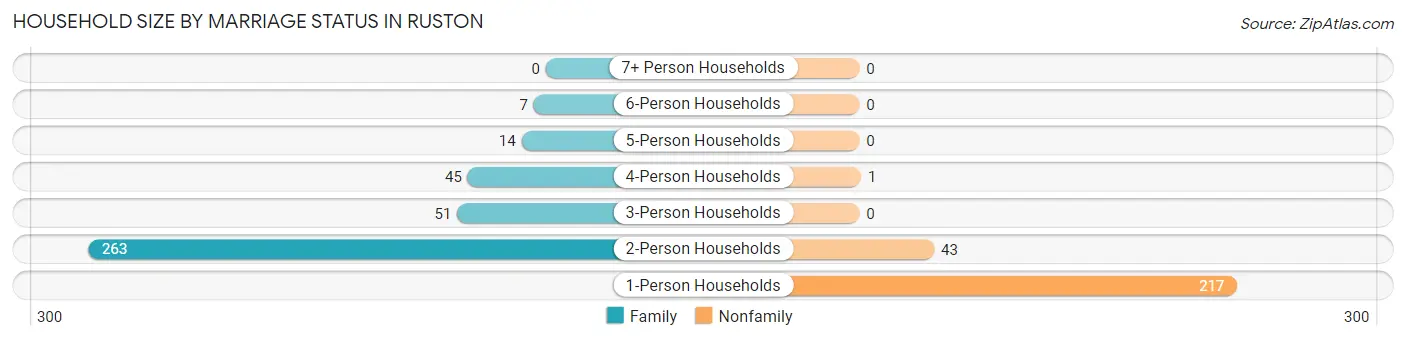
| Household Size | Family Households | Nonfamily Households |
| 1-Person Households | - | 217 (33.9%) |
| 2-Person Households | 263 (41.0%) | 43 (6.7%) |
| 3-Person Households | 51 (8.0%) | 0 (0.0%) |
| 4-Person Households | 45 (7.0%) | 1 (0.2%) |
| 5-Person Households | 14 (2.2%) | 0 (0.0%) |
| 6-Person Households | 7 (1.1%) | 0 (0.0%) |
| 7+ Person Households | 0 (0.0%) | 0 (0.0%) |
| Total | 380 (59.3%) | 261 (40.7%) |
Female Fertility in Ruston
Fertility by Age in Ruston
Average fertility rate in Ruston is 14.0 births per 1,000 women. Women in the age bracket of 20 to 34 years have the highest fertility rate with 29.0 births per 1,000 women. Women in the age bracket of 20 to 34 years acount for 100.0% of all women with births.
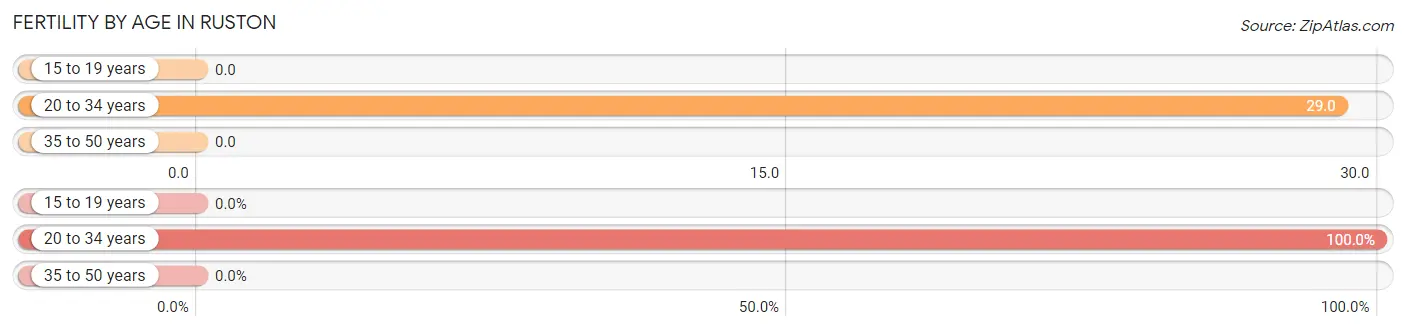
| Age Bracket | Women with Births | Births / 1,000 Women |
| 15 to 19 years | 0 (0.0%) | 0.0 |
| 20 to 34 years | 3 (100.0%) | 29.0 |
| 35 to 50 years | 0 (0.0%) | 0.0 |
| Total | 3 (100.0%) | 14.0 |
Fertility by Age by Marriage Status in Ruston
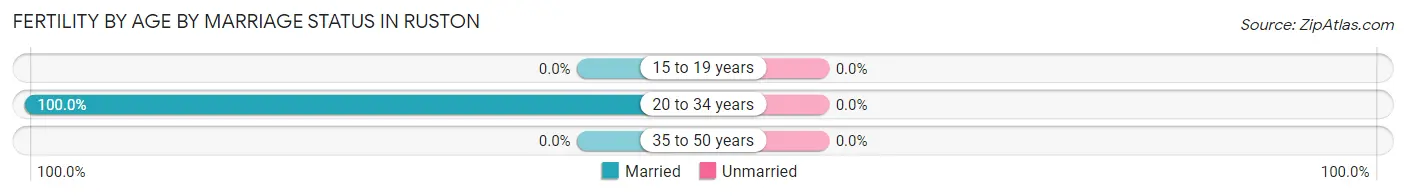
| Age Bracket | Married | Unmarried |
| 15 to 19 years | 0 (0.0%) | 0 (0.0%) |
| 20 to 34 years | 3 (100.0%) | 0 (0.0%) |
| 35 to 50 years | 0 (0.0%) | 0 (0.0%) |
| Total | 3 (100.0%) | 0 (0.0%) |
Fertility by Education in Ruston
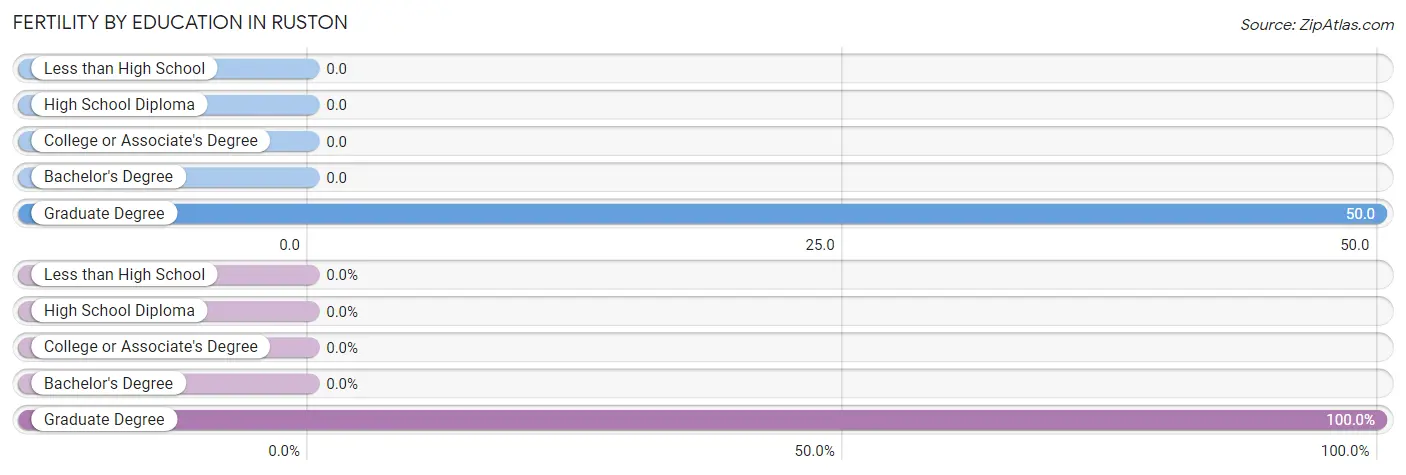
| Educational Attainment | Women with Births | Births / 1,000 Women |
| Less than High School | 0 (0.0%) | 0.0 |
| High School Diploma | 0 (0.0%) | 0.0 |
| College or Associate's Degree | 0 (0.0%) | 0.0 |
| Bachelor's Degree | 0 (0.0%) | 0.0 |
| Graduate Degree | 3 (100.0%) | 50.0 |
| Total | 3 (100.0%) | 14.0 |
Fertility by Education by Marriage Status in Ruston
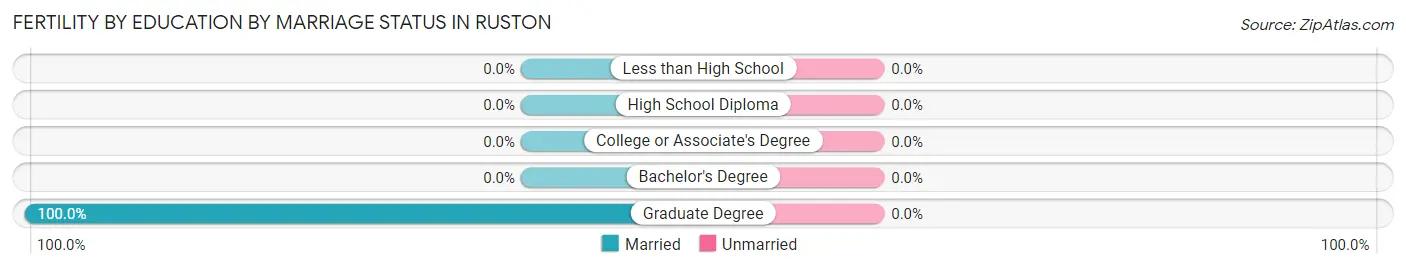
| Educational Attainment | Married | Unmarried |
| Less than High School | 0 (0.0%) | 0 (0.0%) |
| High School Diploma | 0 (0.0%) | 0 (0.0%) |
| College or Associate's Degree | 0 (0.0%) | 0 (0.0%) |
| Bachelor's Degree | 0 (0.0%) | 0 (0.0%) |
| Graduate Degree | 3 (100.0%) | 0 (0.0%) |
| Total | 3 (100.0%) | 0 (0.0%) |
Employment Characteristics in Ruston
Employment by Class of Employer in Ruston
Among the 676 employed individuals in Ruston, private company employees (339 | 50.1%), not-for-profit organizations (113 | 16.7%), and self-employed (not incorporated) (77 | 11.4%) make up the most common classes of employment.
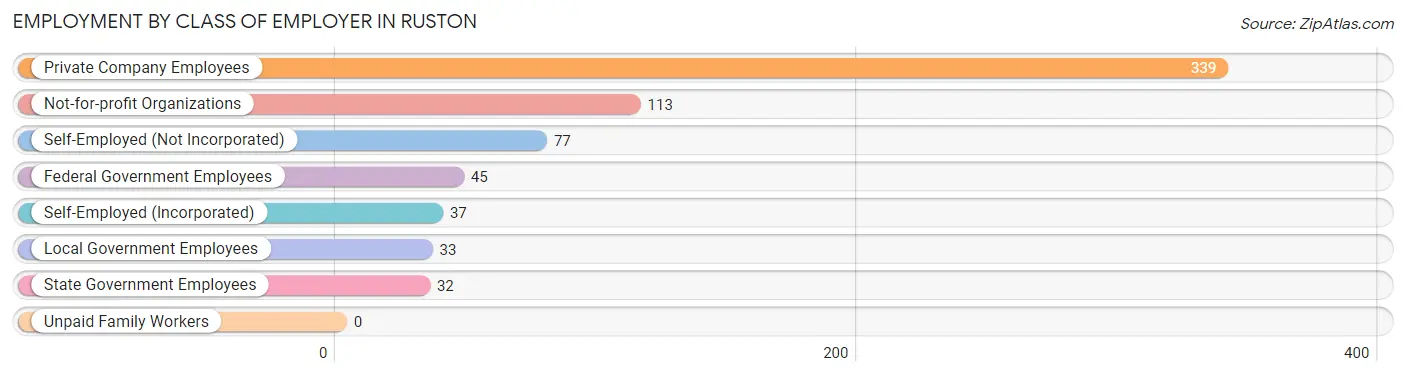
| Employer Class | # Employees | % Employees |
| Private Company Employees | 339 | 50.1% |
| Self-Employed (Incorporated) | 37 | 5.5% |
| Self-Employed (Not Incorporated) | 77 | 11.4% |
| Not-for-profit Organizations | 113 | 16.7% |
| Local Government Employees | 33 | 4.9% |
| State Government Employees | 32 | 4.7% |
| Federal Government Employees | 45 | 6.7% |
| Unpaid Family Workers | 0 | 0.0% |
| Total | 676 | 100.0% |
Employment Status by Age in Ruston
According to the labor force statistics for Ruston, out of the total population over 16 years of age (1,090), 63.8% or 695 individuals are in the labor force, with 1.5% or 10 of them unemployed. The age group with the highest labor force participation rate is 25 to 29 years, with 97.2% or 106 individuals in the labor force. Within the labor force, the 45 to 54 years age range has the highest percentage of unemployed individuals, with 9.9% or 10 of them being unemployed.
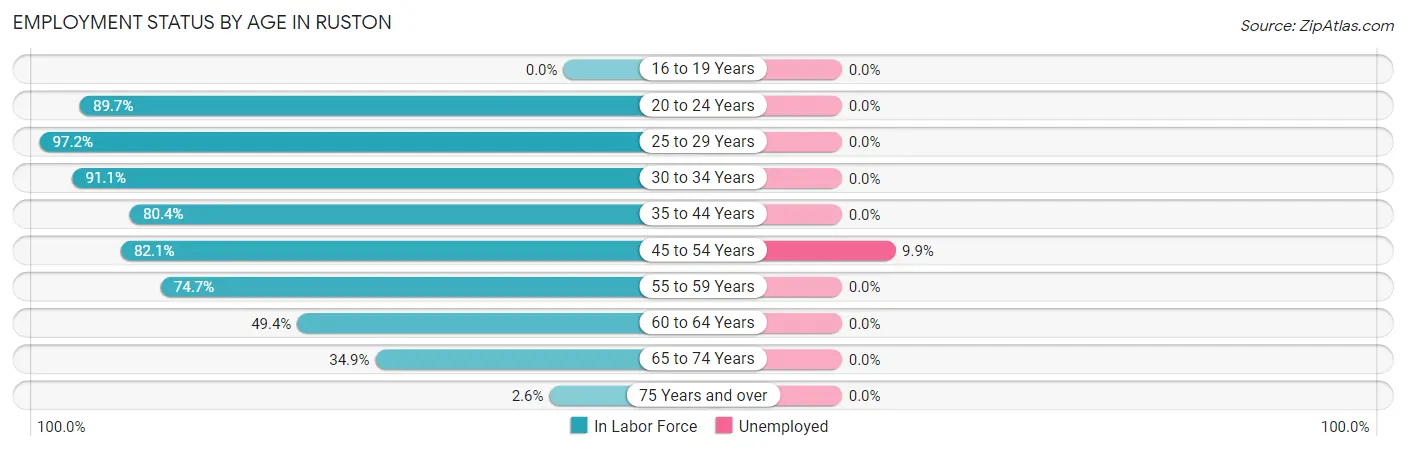
| Age Bracket | In Labor Force | Unemployed |
| 16 to 19 Years | 0 (0.0%) | 0 (0.0%) |
| 20 to 24 Years | 26 (89.7%) | 0 (0.0%) |
| 25 to 29 Years | 106 (97.2%) | 0 (0.0%) |
| 30 to 34 Years | 113 (91.1%) | 0 (0.0%) |
| 35 to 44 Years | 135 (80.4%) | 0 (0.0%) |
| 45 to 54 Years | 101 (82.1%) | 10 (9.9%) |
| 55 to 59 Years | 56 (74.7%) | 0 (0.0%) |
| 60 to 64 Years | 88 (49.4%) | 0 (0.0%) |
| 65 to 74 Years | 68 (34.9%) | 0 (0.0%) |
| 75 Years and over | 2 (2.6%) | 0 (0.0%) |
| Total | 695 (63.8%) | 10 (1.5%) |
Employment Status by Educational Attainment in Ruston
According to labor force statistics for Ruston, 77.1% of individuals (599) out of the total population between 25 and 64 years of age (777) are in the labor force, with 1.7% or 10 of them being unemployed. The group with the highest labor force participation rate are those with the educational attainment of bachelor's degree or higher, with 80.6% or 373 individuals in the labor force. Within the labor force, individuals with bachelor's degree or higher education have the highest percentage of unemployment, with 2.1% or 8 of them being unemployed.
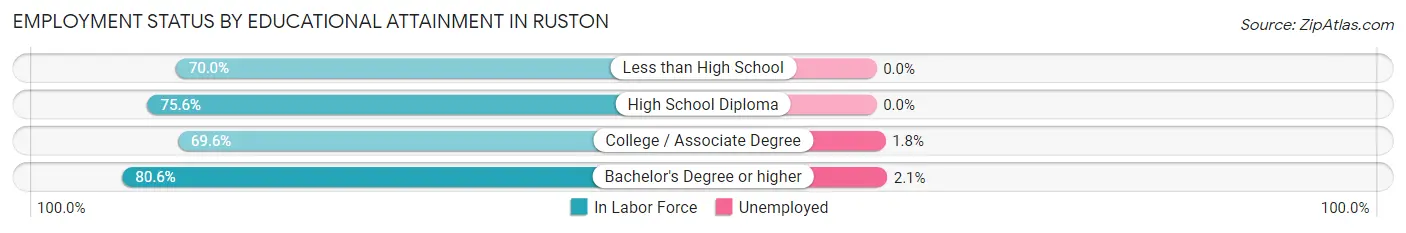
| Educational Attainment | In Labor Force | Unemployed |
| Less than High School | 14 (70.0%) | 0 (0.0%) |
| High School Diploma | 93 (75.6%) | 0 (0.0%) |
| College / Associate Degree | 119 (69.6%) | 3 (1.8%) |
| Bachelor's Degree or higher | 373 (80.6%) | 10 (2.1%) |
| Total | 599 (77.1%) | 13 (1.7%) |
Employment Occupations by Sex in Ruston
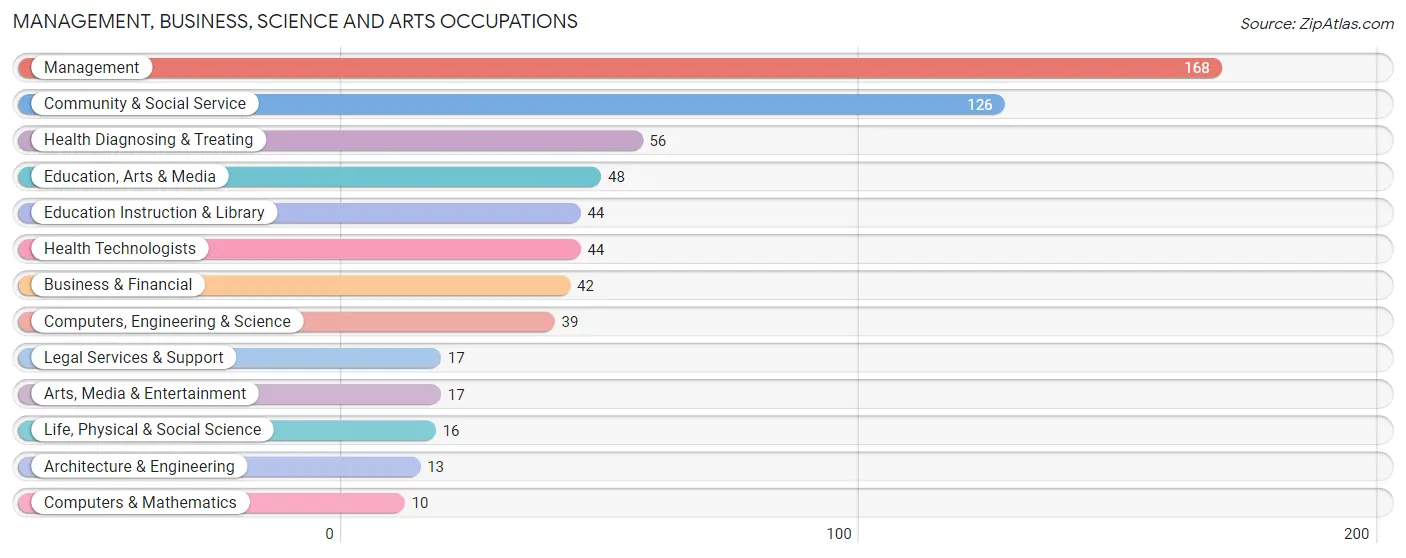
Management, Business, Science and Arts Occupations
The most common Management, Business, Science and Arts occupations in Ruston are Management (168 | 24.8%), Community & Social Service (126 | 18.6%), Health Diagnosing & Treating (56 | 8.3%), Education, Arts & Media (48 | 7.1%), and Education Instruction & Library (44 | 6.5%).
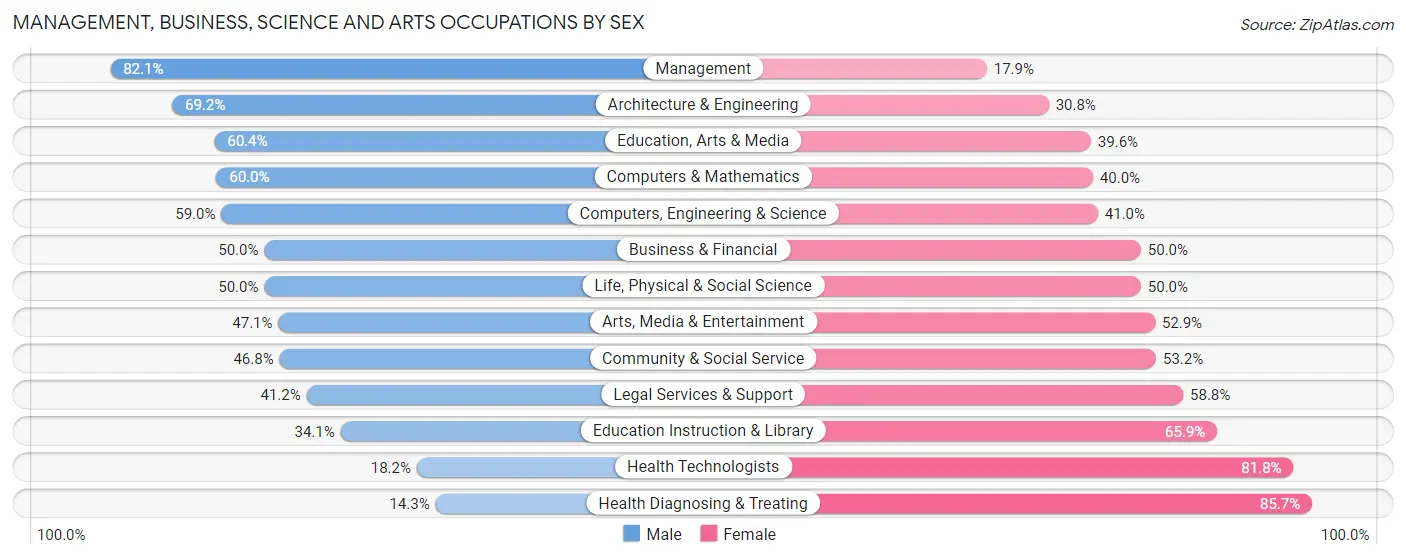
Management, Business, Science and Arts Occupations by Sex
Within the Management, Business, Science and Arts occupations in Ruston, the most male-oriented occupations are Management (82.1%), Architecture & Engineering (69.2%), and Education, Arts & Media (60.4%), while the most female-oriented occupations are Health Diagnosing & Treating (85.7%), Health Technologists (81.8%), and Education Instruction & Library (65.9%).
| Occupation | Male | Female |
| Management | 138 (82.1%) | 30 (17.9%) |
| Business & Financial | 21 (50.0%) | 21 (50.0%) |
| Computers, Engineering & Science | 23 (59.0%) | 16 (41.0%) |
| Computers & Mathematics | 6 (60.0%) | 4 (40.0%) |
| Architecture & Engineering | 9 (69.2%) | 4 (30.8%) |
| Life, Physical & Social Science | 8 (50.0%) | 8 (50.0%) |
| Community & Social Service | 59 (46.8%) | 67 (53.2%) |
| Education, Arts & Media | 29 (60.4%) | 19 (39.6%) |
| Legal Services & Support | 7 (41.2%) | 10 (58.8%) |
| Education Instruction & Library | 15 (34.1%) | 29 (65.9%) |
| Arts, Media & Entertainment | 8 (47.1%) | 9 (52.9%) |
| Health Diagnosing & Treating | 8 (14.3%) | 48 (85.7%) |
| Health Technologists | 8 (18.2%) | 36 (81.8%) |
| Total (Category) | 249 (57.8%) | 182 (42.2%) |
| Total (Overall) | 369 (54.5%) | 308 (45.5%) |
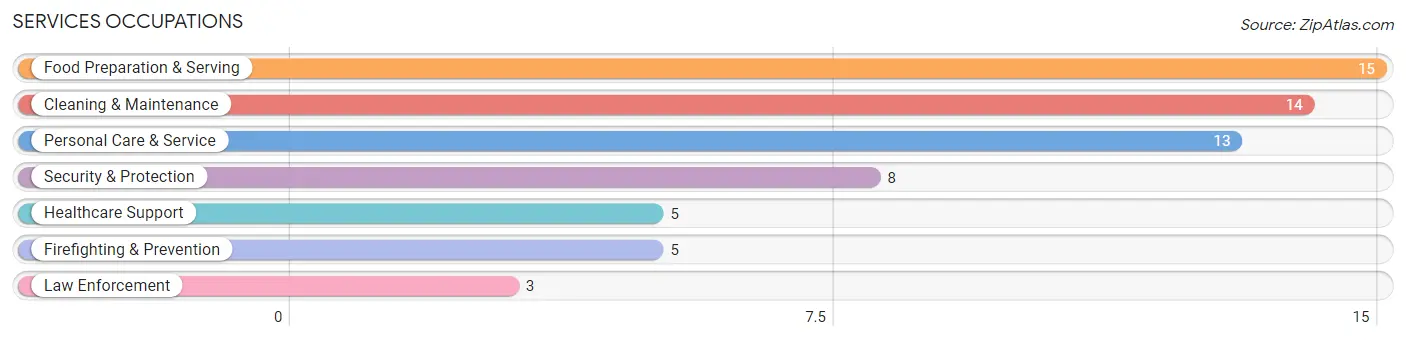
Services Occupations
The most common Services occupations in Ruston are Food Preparation & Serving (15 | 2.2%), Cleaning & Maintenance (14 | 2.1%), Personal Care & Service (13 | 1.9%), Security & Protection (8 | 1.2%), and Healthcare Support (5 | 0.7%).
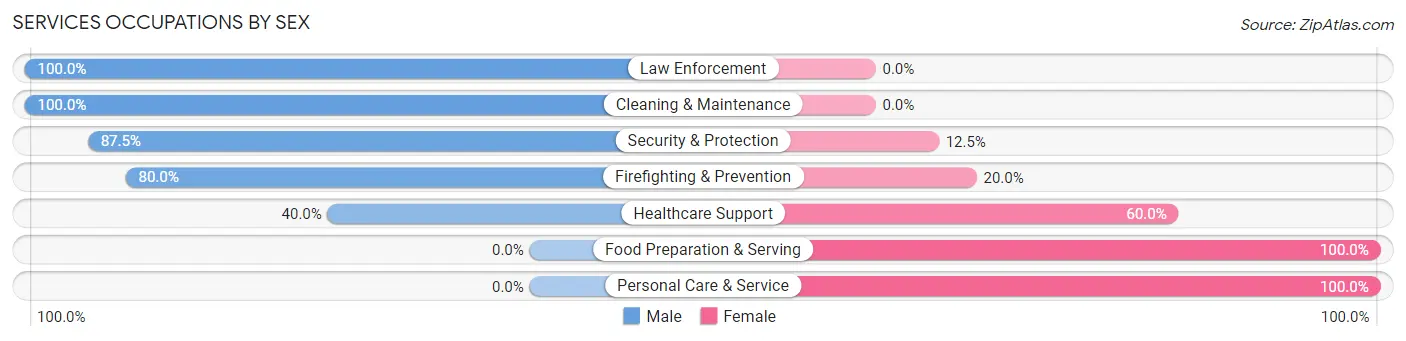
Services Occupations by Sex
Within the Services occupations in Ruston, the most male-oriented occupations are Law Enforcement (100.0%), Cleaning & Maintenance (100.0%), and Security & Protection (87.5%), while the most female-oriented occupations are Food Preparation & Serving (100.0%), Personal Care & Service (100.0%), and Healthcare Support (60.0%).
| Occupation | Male | Female |
| Healthcare Support | 2 (40.0%) | 3 (60.0%) |
| Security & Protection | 7 (87.5%) | 1 (12.5%) |
| Firefighting & Prevention | 4 (80.0%) | 1 (20.0%) |
| Law Enforcement | 3 (100.0%) | 0 (0.0%) |
| Food Preparation & Serving | 0 (0.0%) | 15 (100.0%) |
| Cleaning & Maintenance | 14 (100.0%) | 0 (0.0%) |
| Personal Care & Service | 0 (0.0%) | 13 (100.0%) |
| Total (Category) | 23 (41.8%) | 32 (58.2%) |
| Total (Overall) | 369 (54.5%) | 308 (45.5%) |
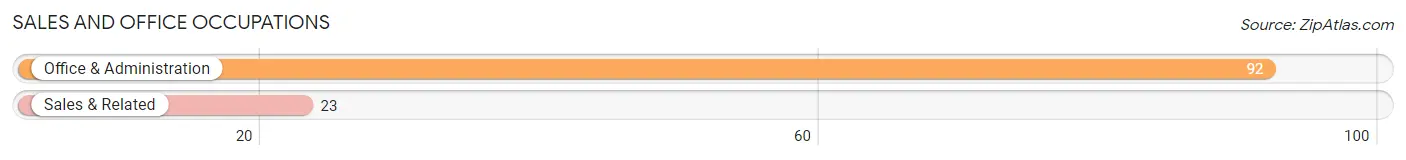
Sales and Office Occupations
The most common Sales and Office occupations in Ruston are Office & Administration (92 | 13.6%), and Sales & Related (23 | 3.4%).
Sales and Office Occupations by Sex
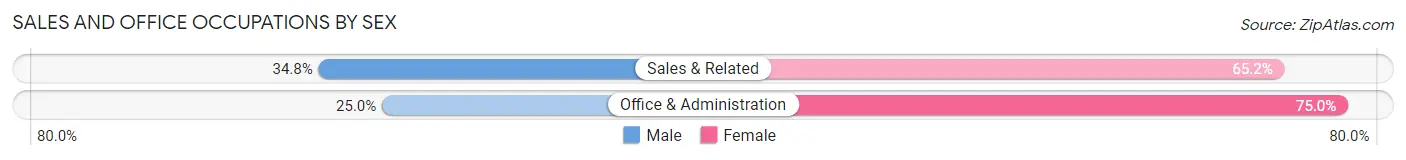
| Occupation | Male | Female |
| Sales & Related | 8 (34.8%) | 15 (65.2%) |
| Office & Administration | 23 (25.0%) | 69 (75.0%) |
| Total (Category) | 31 (27.0%) | 84 (73.0%) |
| Total (Overall) | 369 (54.5%) | 308 (45.5%) |
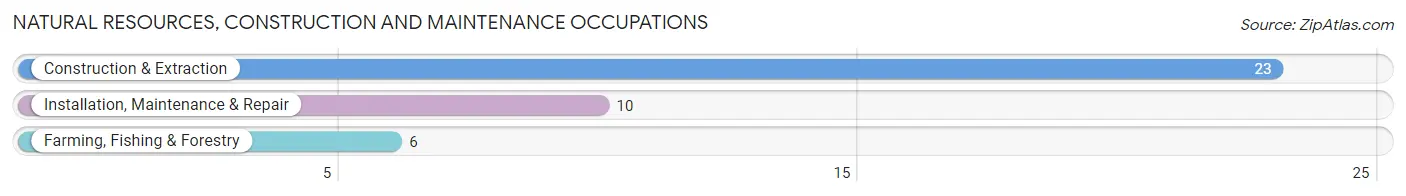
Natural Resources, Construction and Maintenance Occupations
The most common Natural Resources, Construction and Maintenance occupations in Ruston are Construction & Extraction (23 | 3.4%), Installation, Maintenance & Repair (10 | 1.5%), and Farming, Fishing & Forestry (6 | 0.9%).
Natural Resources, Construction and Maintenance Occupations by Sex
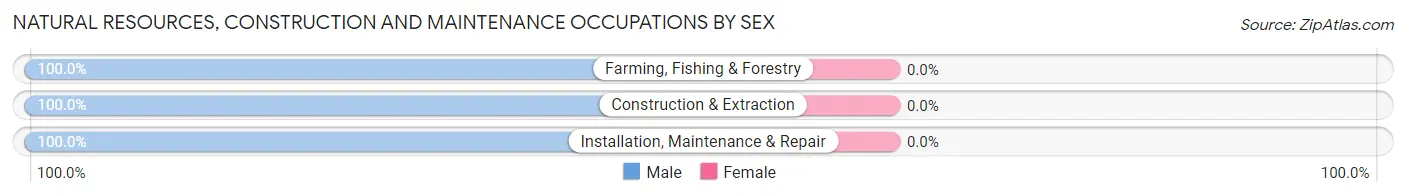
| Occupation | Male | Female |
| Farming, Fishing & Forestry | 6 (100.0%) | 0 (0.0%) |
| Construction & Extraction | 23 (100.0%) | 0 (0.0%) |
| Installation, Maintenance & Repair | 10 (100.0%) | 0 (0.0%) |
| Total (Category) | 39 (100.0%) | 0 (0.0%) |
| Total (Overall) | 369 (54.5%) | 308 (45.5%) |
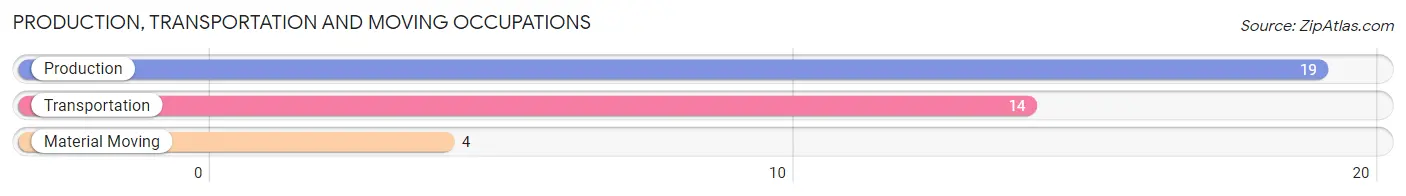
Production, Transportation and Moving Occupations
The most common Production, Transportation and Moving occupations in Ruston are Production (19 | 2.8%), Transportation (14 | 2.1%), and Material Moving (4 | 0.6%).
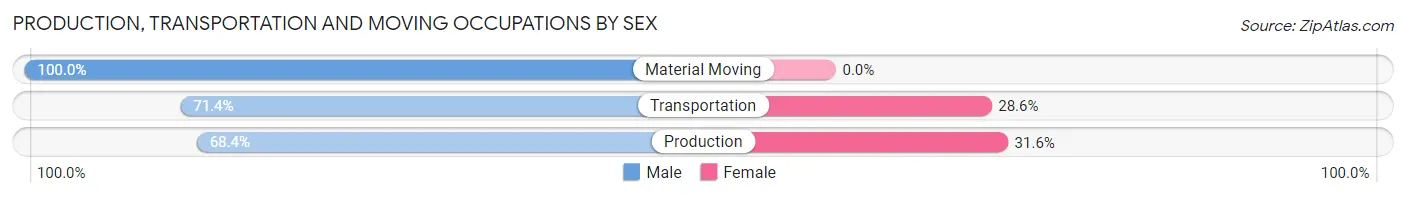
Production, Transportation and Moving Occupations by Sex
| Occupation | Male | Female |
| Production | 13 (68.4%) | 6 (31.6%) |
| Transportation | 10 (71.4%) | 4 (28.6%) |
| Material Moving | 4 (100.0%) | 0 (0.0%) |
| Total (Category) | 27 (73.0%) | 10 (27.0%) |
| Total (Overall) | 369 (54.5%) | 308 (45.5%) |
Employment Industries by Sex in Ruston
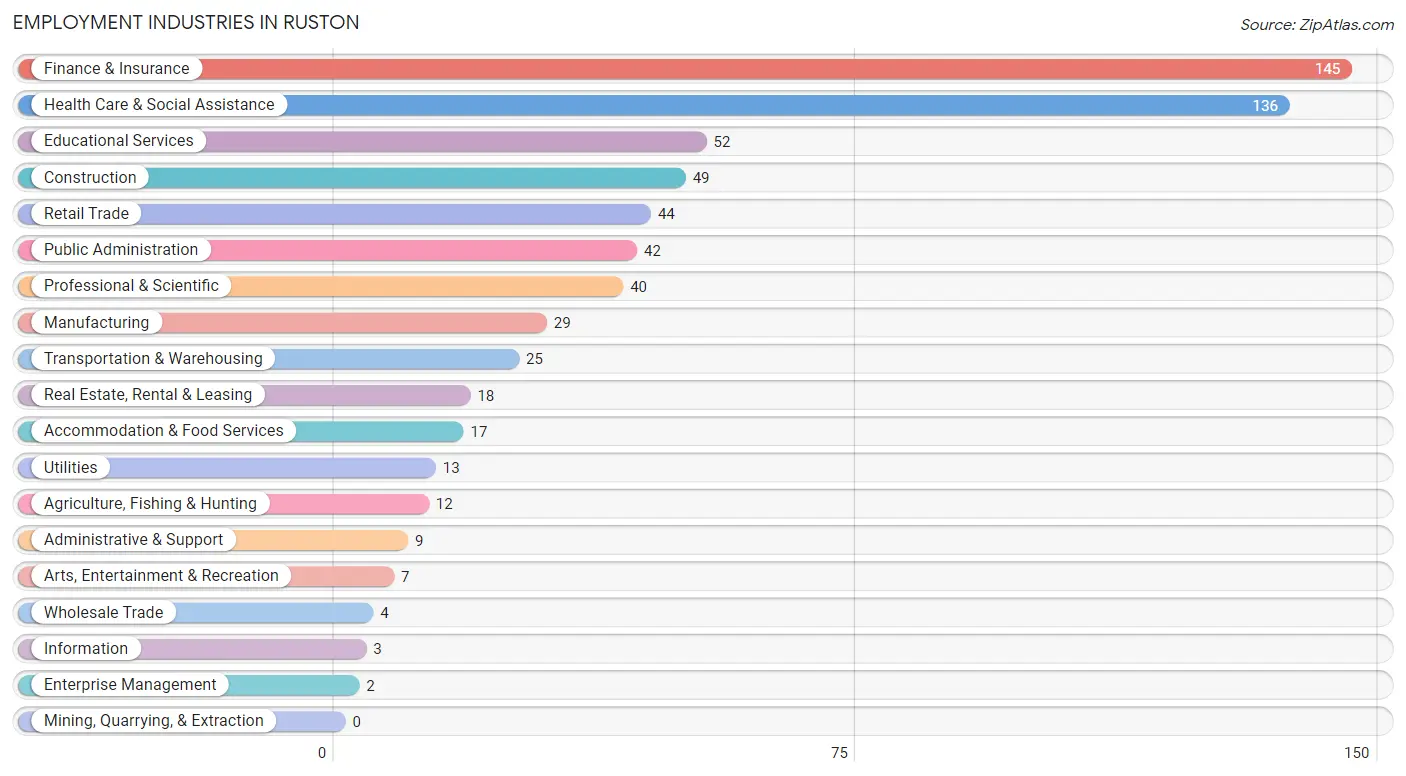
Employment Industries in Ruston
The major employment industries in Ruston include Finance & Insurance (145 | 21.4%), Health Care & Social Assistance (136 | 20.1%), Educational Services (52 | 7.7%), Construction (49 | 7.2%), and Retail Trade (44 | 6.5%).
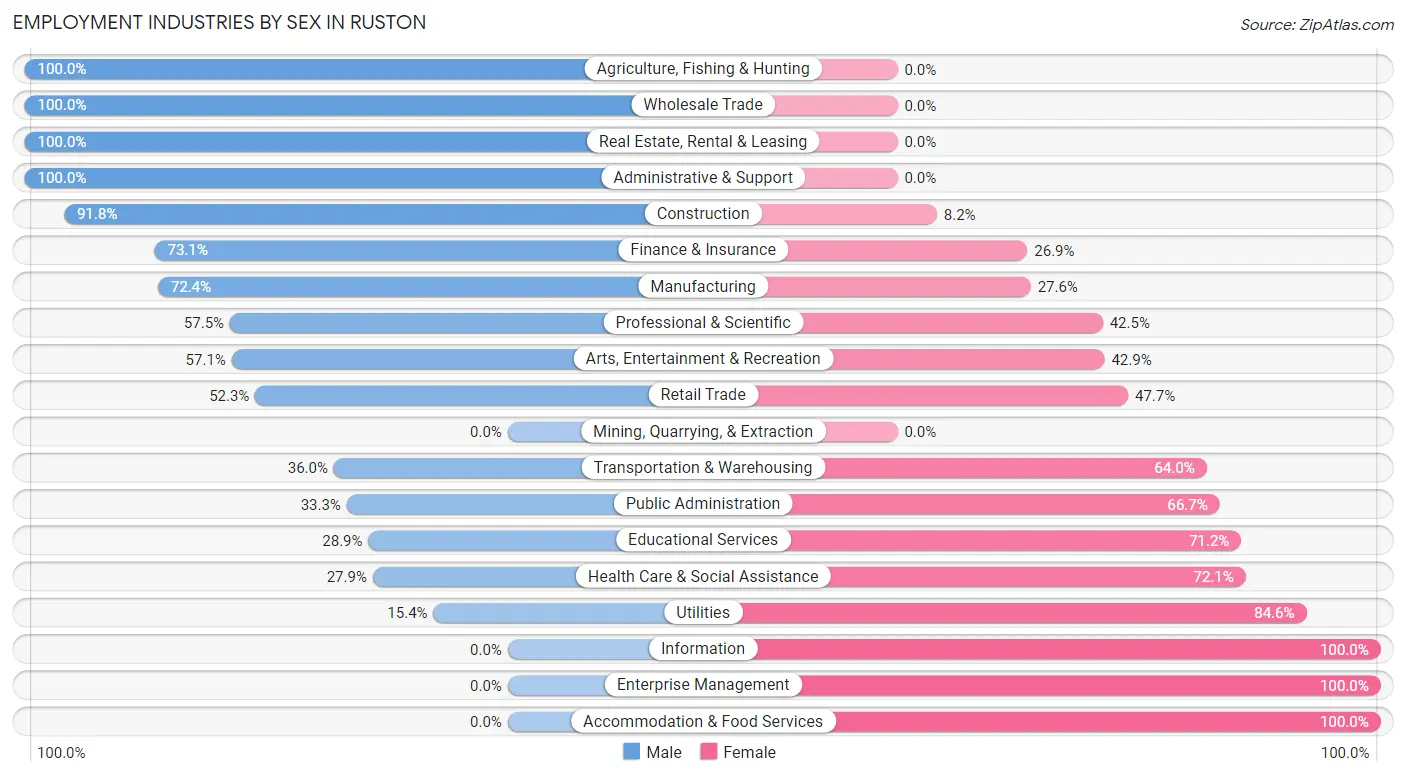
Employment Industries by Sex in Ruston
The Ruston industries that see more men than women are Agriculture, Fishing & Hunting (100.0%), Wholesale Trade (100.0%), and Real Estate, Rental & Leasing (100.0%), whereas the industries that tend to have a higher number of women are Information (100.0%), Enterprise Management (100.0%), and Accommodation & Food Services (100.0%).
| Industry | Male | Female |
| Agriculture, Fishing & Hunting | 12 (100.0%) | 0 (0.0%) |
| Mining, Quarrying, & Extraction | 0 (0.0%) | 0 (0.0%) |
| Construction | 45 (91.8%) | 4 (8.2%) |
| Manufacturing | 21 (72.4%) | 8 (27.6%) |
| Wholesale Trade | 4 (100.0%) | 0 (0.0%) |
| Retail Trade | 23 (52.3%) | 21 (47.7%) |
| Transportation & Warehousing | 9 (36.0%) | 16 (64.0%) |
| Utilities | 2 (15.4%) | 11 (84.6%) |
| Information | 0 (0.0%) | 3 (100.0%) |
| Finance & Insurance | 106 (73.1%) | 39 (26.9%) |
| Real Estate, Rental & Leasing | 18 (100.0%) | 0 (0.0%) |
| Professional & Scientific | 23 (57.5%) | 17 (42.5%) |
| Enterprise Management | 0 (0.0%) | 2 (100.0%) |
| Administrative & Support | 9 (100.0%) | 0 (0.0%) |
| Educational Services | 15 (28.8%) | 37 (71.2%) |
| Health Care & Social Assistance | 38 (27.9%) | 98 (72.1%) |
| Arts, Entertainment & Recreation | 4 (57.1%) | 3 (42.9%) |
| Accommodation & Food Services | 0 (0.0%) | 17 (100.0%) |
| Public Administration | 14 (33.3%) | 28 (66.7%) |
| Total | 369 (54.5%) | 308 (45.5%) |
Education in Ruston
School Enrollment in Ruston
The most common levels of schooling among the 189 students in Ruston are elementary school (56 | 29.6%), middle school (54 | 28.6%), and nursery / preschool (26 | 13.8%).
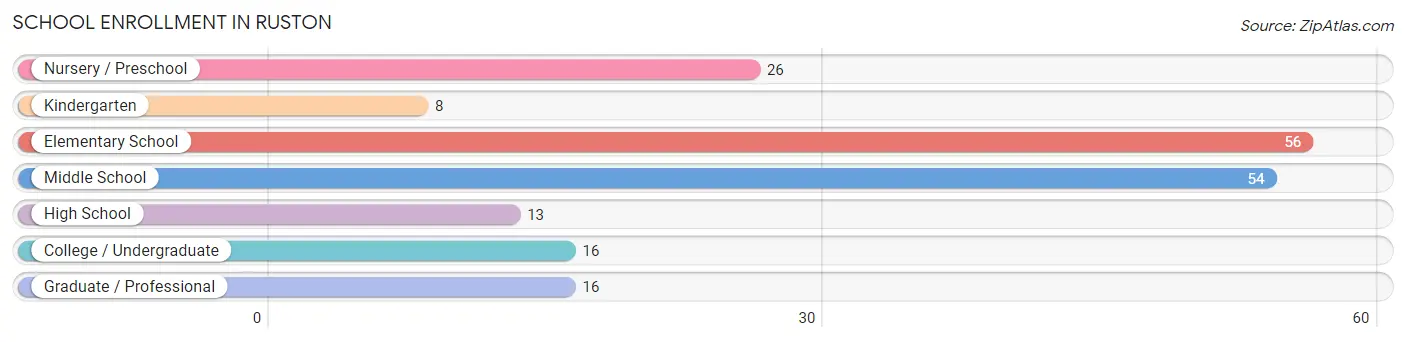
| School Level | # Students | % Students |
| Nursery / Preschool | 26 | 13.8% |
| Kindergarten | 8 | 4.2% |
| Elementary School | 56 | 29.6% |
| Middle School | 54 | 28.6% |
| High School | 13 | 6.9% |
| College / Undergraduate | 16 | 8.5% |
| Graduate / Professional | 16 | 8.5% |
| Total | 189 | 100.0% |
School Enrollment by Age by Funding Source in Ruston
Out of a total of 189 students who are enrolled in schools in Ruston, 74 (39.2%) attend a private institution, while the remaining 115 (60.8%) are enrolled in public schools. The age group of 3 to 4 year olds has the highest likelihood of being enrolled in private schools, with 14 (82.4% in the age bracket) enrolled. Conversely, the age group of 20 to 24 year olds has the lowest likelihood of being enrolled in a private school, with 6 (100.0% in the age bracket) attending a public institution.
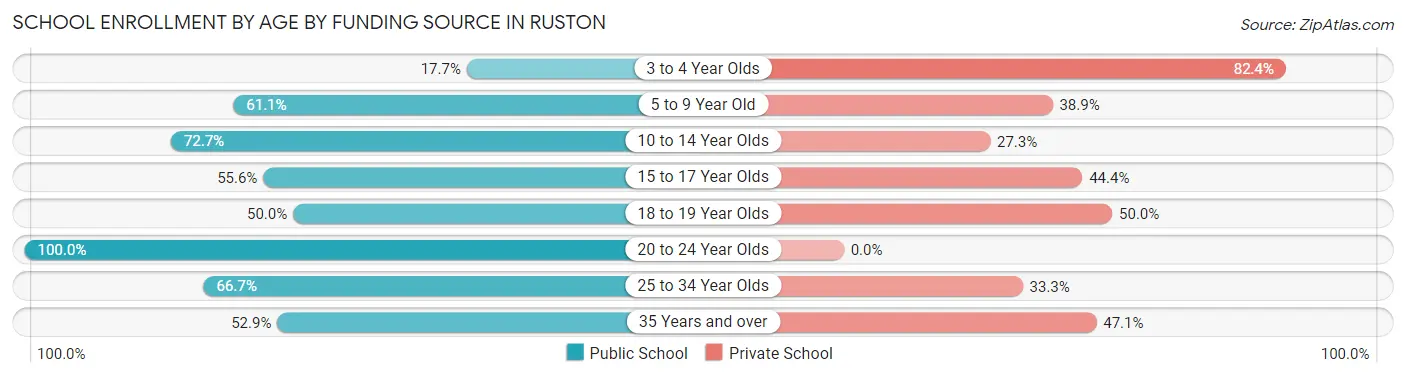
| Age Bracket | Public School | Private School |
| 3 to 4 Year Olds | 3 (17.6%) | 14 (82.4%) |
| 5 to 9 Year Old | 44 (61.1%) | 28 (38.9%) |
| 10 to 14 Year Olds | 40 (72.7%) | 15 (27.3%) |
| 15 to 17 Year Olds | 5 (55.6%) | 4 (44.4%) |
| 18 to 19 Year Olds | 2 (50.0%) | 2 (50.0%) |
| 20 to 24 Year Olds | 6 (100.0%) | 0 (0.0%) |
| 25 to 34 Year Olds | 6 (66.7%) | 3 (33.3%) |
| 35 Years and over | 9 (52.9%) | 8 (47.1%) |
| Total | 115 (60.8%) | 74 (39.2%) |
Educational Attainment by Field of Study in Ruston
Business (170 | 23.7%), social sciences (87 | 12.1%), science & technology (74 | 10.3%), liberal arts & history (56 | 7.8%), and bio, nature & agricultural (54 | 7.5%) are the most common fields of study among 717 individuals in Ruston who have obtained a bachelor's degree or higher.
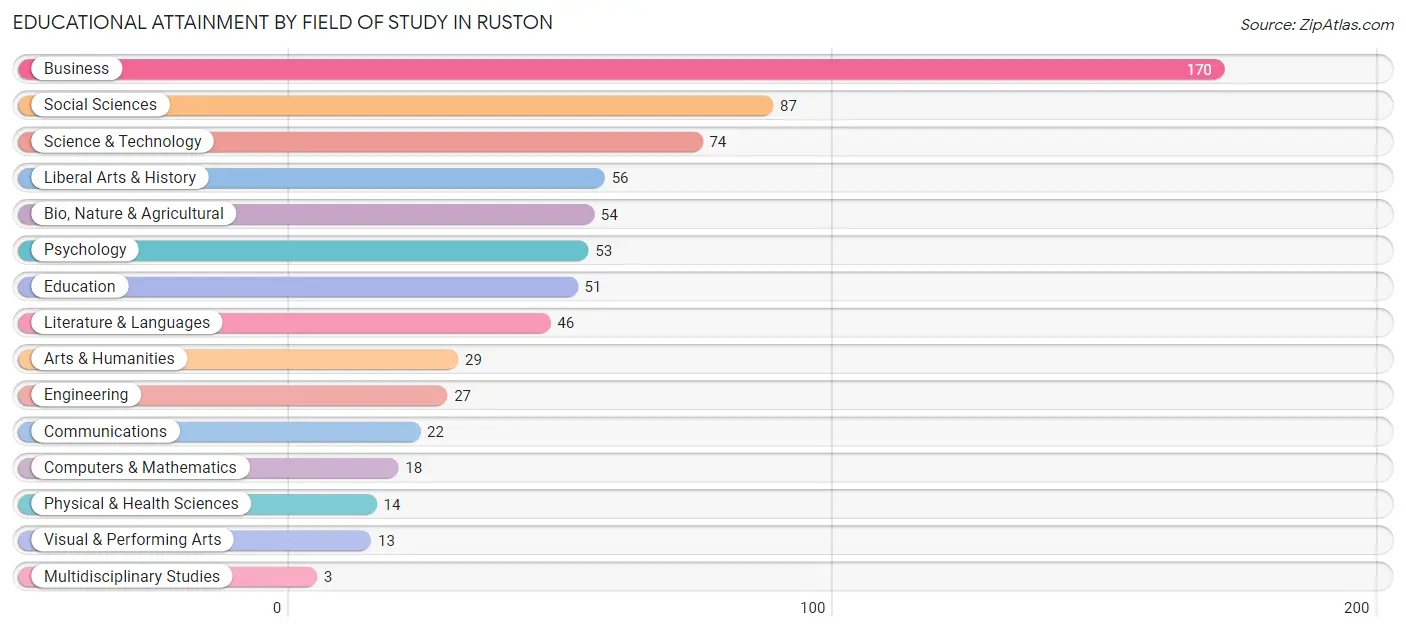
| Field of Study | # Graduates | % Graduates |
| Computers & Mathematics | 18 | 2.5% |
| Bio, Nature & Agricultural | 54 | 7.5% |
| Physical & Health Sciences | 14 | 1.9% |
| Psychology | 53 | 7.4% |
| Social Sciences | 87 | 12.1% |
| Engineering | 27 | 3.8% |
| Multidisciplinary Studies | 3 | 0.4% |
| Science & Technology | 74 | 10.3% |
| Business | 170 | 23.7% |
| Education | 51 | 7.1% |
| Literature & Languages | 46 | 6.4% |
| Liberal Arts & History | 56 | 7.8% |
| Visual & Performing Arts | 13 | 1.8% |
| Communications | 22 | 3.1% |
| Arts & Humanities | 29 | 4.0% |
| Total | 717 | 100.0% |
Transportation & Commute in Ruston
Vehicle Availability by Sex in Ruston
The most prevalent vehicle ownership categories in Ruston are males with 2 vehicles (171, accounting for 45.5%) and females with 2 vehicles (153, making up 57.0%).
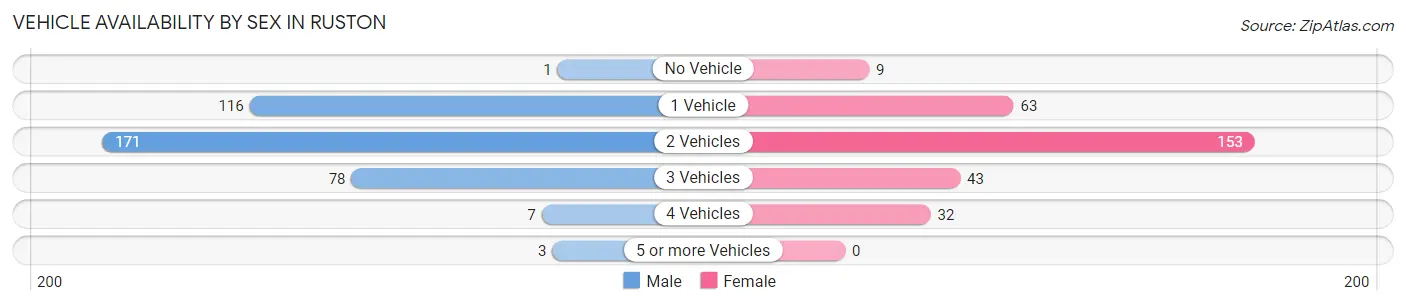
| Vehicles Available | Male | Female |
| No Vehicle | 1 (0.3%) | 9 (3.0%) |
| 1 Vehicle | 116 (30.8%) | 63 (21.0%) |
| 2 Vehicles | 171 (45.5%) | 153 (51.0%) |
| 3 Vehicles | 78 (20.7%) | 43 (14.3%) |
| 4 Vehicles | 7 (1.9%) | 32 (10.7%) |
| 5 or more Vehicles | 3 (0.8%) | 0 (0.0%) |
| Total | 376 (100.0%) | 300 (100.0%) |
Commute Time in Ruston
The most frequently occuring commute durations in Ruston are 60 to 89 minutes (104 commuters, 18.2%), 15 to 19 minutes (100 commuters, 17.5%), and 20 to 24 minutes (81 commuters, 14.2%).
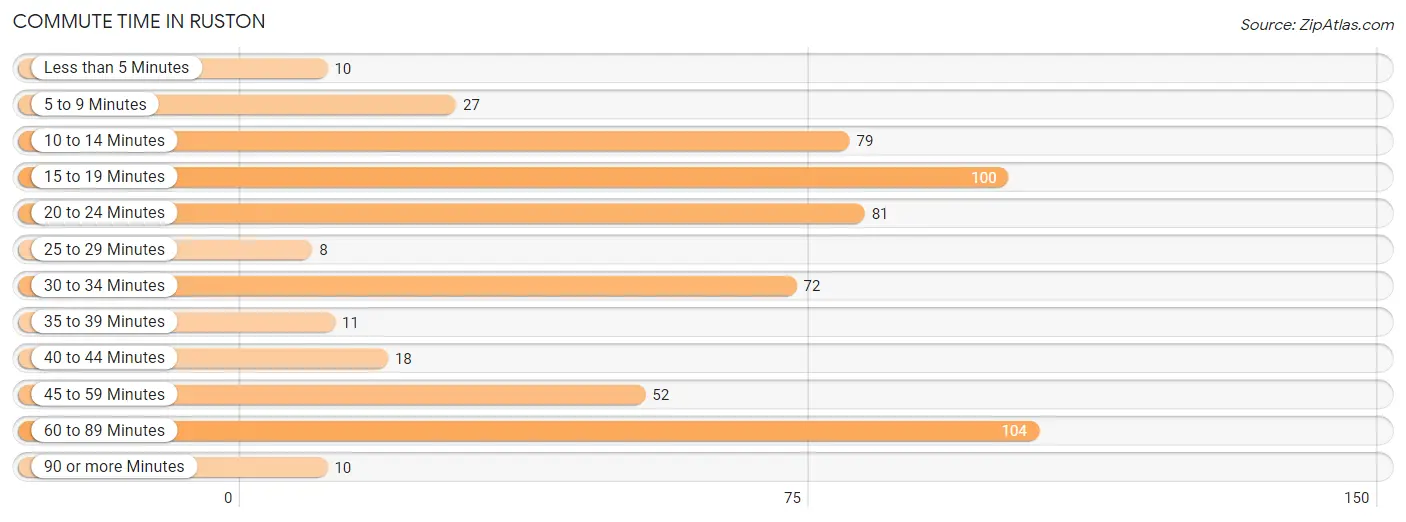
| Commute Time | # Commuters | % Commuters |
| Less than 5 Minutes | 10 | 1.8% |
| 5 to 9 Minutes | 27 | 4.7% |
| 10 to 14 Minutes | 79 | 13.8% |
| 15 to 19 Minutes | 100 | 17.5% |
| 20 to 24 Minutes | 81 | 14.2% |
| 25 to 29 Minutes | 8 | 1.4% |
| 30 to 34 Minutes | 72 | 12.6% |
| 35 to 39 Minutes | 11 | 1.9% |
| 40 to 44 Minutes | 18 | 3.2% |
| 45 to 59 Minutes | 52 | 9.1% |
| 60 to 89 Minutes | 104 | 18.2% |
| 90 or more Minutes | 10 | 1.8% |
Commute Time by Sex in Ruston
The most common commute times in Ruston are 60 to 89 minutes (87 commuters, 27.7%) for males and 15 to 19 minutes (56 commuters, 21.7%) for females.
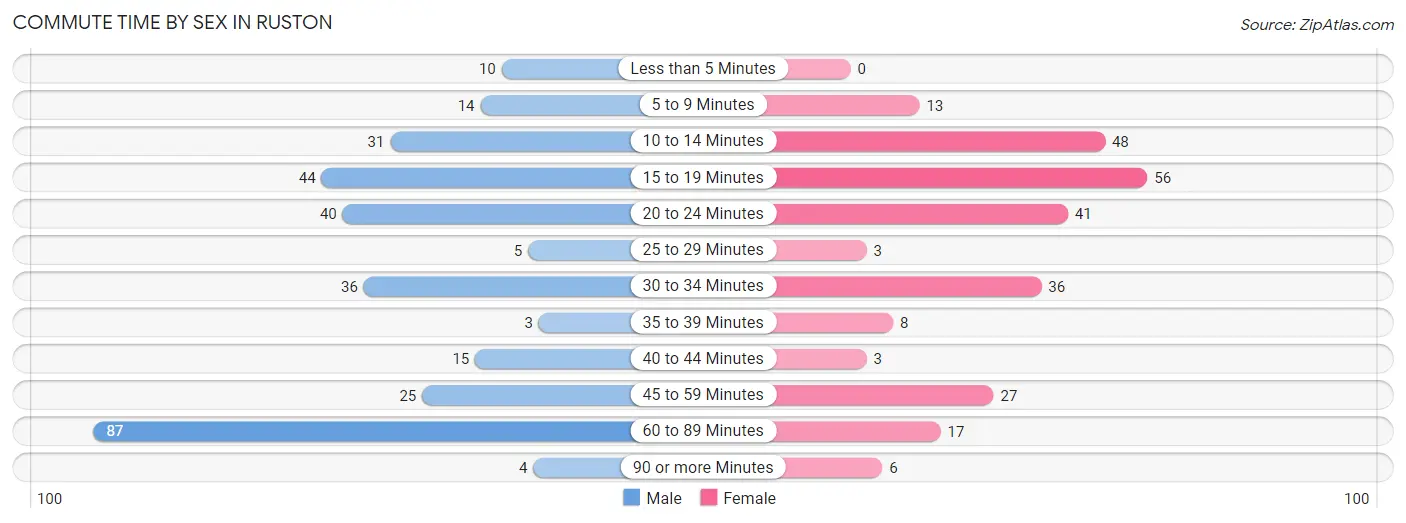
| Commute Time | Male | Female |
| Less than 5 Minutes | 10 (3.2%) | 0 (0.0%) |
| 5 to 9 Minutes | 14 (4.5%) | 13 (5.0%) |
| 10 to 14 Minutes | 31 (9.9%) | 48 (18.6%) |
| 15 to 19 Minutes | 44 (14.0%) | 56 (21.7%) |
| 20 to 24 Minutes | 40 (12.7%) | 41 (15.9%) |
| 25 to 29 Minutes | 5 (1.6%) | 3 (1.2%) |
| 30 to 34 Minutes | 36 (11.5%) | 36 (14.0%) |
| 35 to 39 Minutes | 3 (1.0%) | 8 (3.1%) |
| 40 to 44 Minutes | 15 (4.8%) | 3 (1.2%) |
| 45 to 59 Minutes | 25 (8.0%) | 27 (10.5%) |
| 60 to 89 Minutes | 87 (27.7%) | 17 (6.6%) |
| 90 or more Minutes | 4 (1.3%) | 6 (2.3%) |
Time of Departure to Work by Sex in Ruston
The most frequent times of departure to work in Ruston are 7:00 AM to 7:29 AM (104, 33.1%) for males and 7:00 AM to 7:29 AM (53, 20.5%) for females.
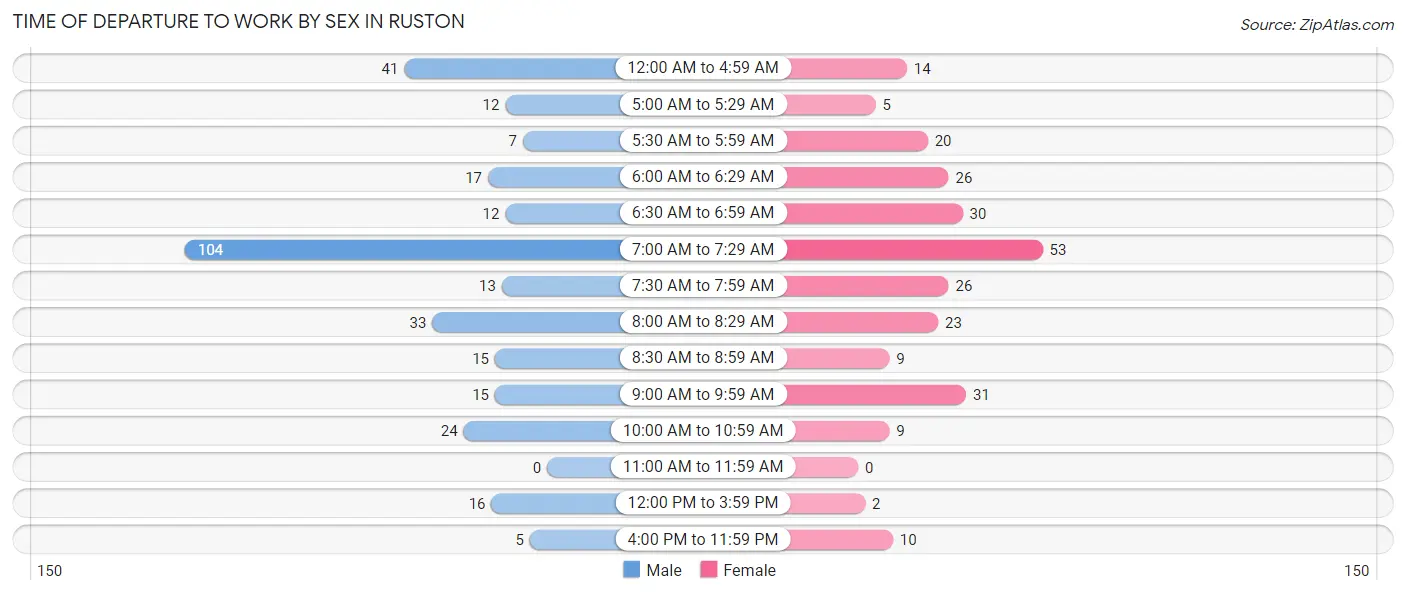
| Time of Departure | Male | Female |
| 12:00 AM to 4:59 AM | 41 (13.1%) | 14 (5.4%) |
| 5:00 AM to 5:29 AM | 12 (3.8%) | 5 (1.9%) |
| 5:30 AM to 5:59 AM | 7 (2.2%) | 20 (7.7%) |
| 6:00 AM to 6:29 AM | 17 (5.4%) | 26 (10.1%) |
| 6:30 AM to 6:59 AM | 12 (3.8%) | 30 (11.6%) |
| 7:00 AM to 7:29 AM | 104 (33.1%) | 53 (20.5%) |
| 7:30 AM to 7:59 AM | 13 (4.1%) | 26 (10.1%) |
| 8:00 AM to 8:29 AM | 33 (10.5%) | 23 (8.9%) |
| 8:30 AM to 8:59 AM | 15 (4.8%) | 9 (3.5%) |
| 9:00 AM to 9:59 AM | 15 (4.8%) | 31 (12.0%) |
| 10:00 AM to 10:59 AM | 24 (7.6%) | 9 (3.5%) |
| 11:00 AM to 11:59 AM | 0 (0.0%) | 0 (0.0%) |
| 12:00 PM to 3:59 PM | 16 (5.1%) | 2 (0.8%) |
| 4:00 PM to 11:59 PM | 5 (1.6%) | 10 (3.9%) |
| Total | 314 (100.0%) | 258 (100.0%) |
Housing Occupancy in Ruston
Occupancy by Ownership in Ruston
Of the total 641 dwellings in Ruston, owner-occupied units account for 437 (68.2%), while renter-occupied units make up 204 (31.8%).
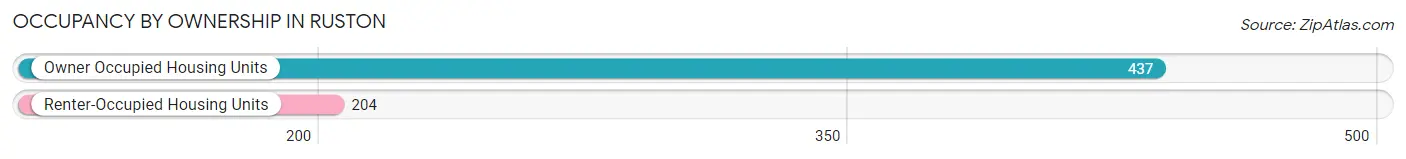
| Occupancy | # Housing Units | % Housing Units |
| Owner Occupied Housing Units | 437 | 68.2% |
| Renter-Occupied Housing Units | 204 | 31.8% |
| Total Occupied Housing Units | 641 | 100.0% |
Occupancy by Household Size in Ruston
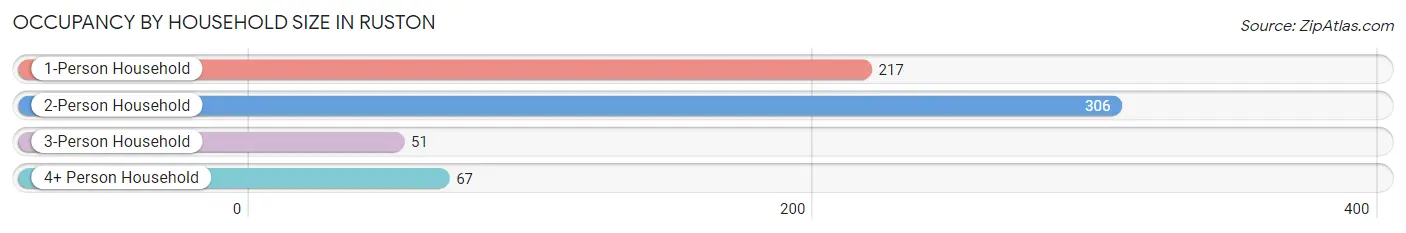
| Household Size | # Housing Units | % Housing Units |
| 1-Person Household | 217 | 33.9% |
| 2-Person Household | 306 | 47.7% |
| 3-Person Household | 51 | 8.0% |
| 4+ Person Household | 67 | 10.4% |
| Total Housing Units | 641 | 100.0% |
Occupancy by Ownership by Household Size in Ruston
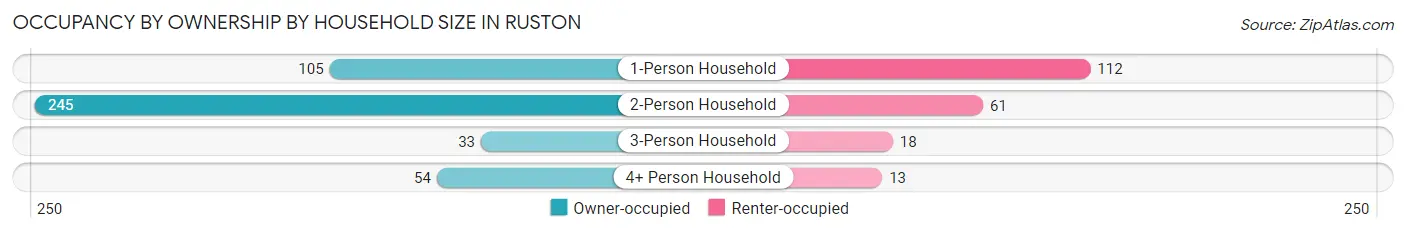
| Household Size | Owner-occupied | Renter-occupied |
| 1-Person Household | 105 (48.4%) | 112 (51.6%) |
| 2-Person Household | 245 (80.1%) | 61 (19.9%) |
| 3-Person Household | 33 (64.7%) | 18 (35.3%) |
| 4+ Person Household | 54 (80.6%) | 13 (19.4%) |
| Total Housing Units | 437 (68.2%) | 204 (31.8%) |
Occupancy by Educational Attainment in Ruston
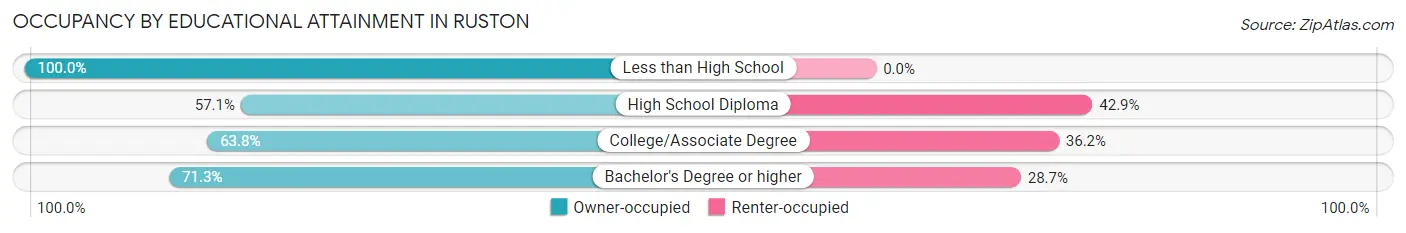
| Household Size | Owner-occupied | Renter-occupied |
| Less than High School | 1 (100.0%) | 0 (0.0%) |
| High School Diploma | 44 (57.1%) | 33 (42.9%) |
| College/Associate Degree | 81 (63.8%) | 46 (36.2%) |
| Bachelor's Degree or higher | 311 (71.3%) | 125 (28.7%) |
Occupancy by Age of Householder in Ruston
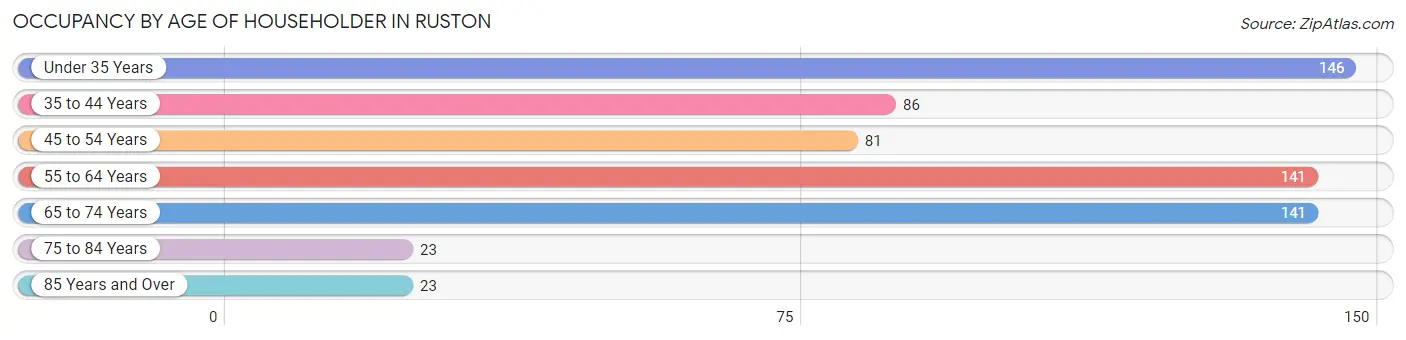
| Age Bracket | # Households | % Households |
| Under 35 Years | 146 | 22.8% |
| 35 to 44 Years | 86 | 13.4% |
| 45 to 54 Years | 81 | 12.6% |
| 55 to 64 Years | 141 | 22.0% |
| 65 to 74 Years | 141 | 22.0% |
| 75 to 84 Years | 23 | 3.6% |
| 85 Years and Over | 23 | 3.6% |
| Total | 641 | 100.0% |
Housing Finances in Ruston
Median Income by Occupancy in Ruston
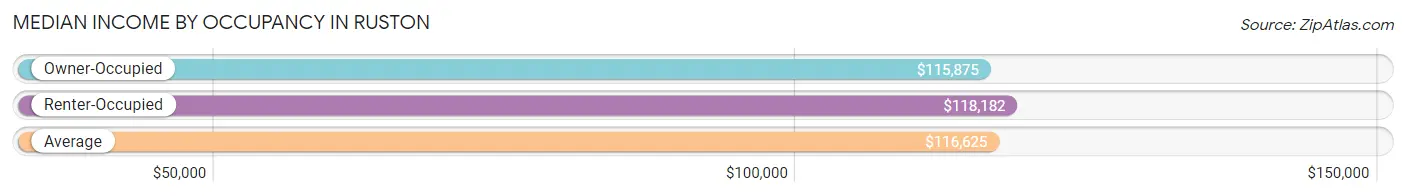
| Occupancy Type | # Households | Median Income |
| Owner-Occupied | 437 (68.2%) | $115,875 |
| Renter-Occupied | 204 (31.8%) | $118,182 |
| Average | 641 (100.0%) | $116,625 |
Occupancy by Householder Income Bracket in Ruston
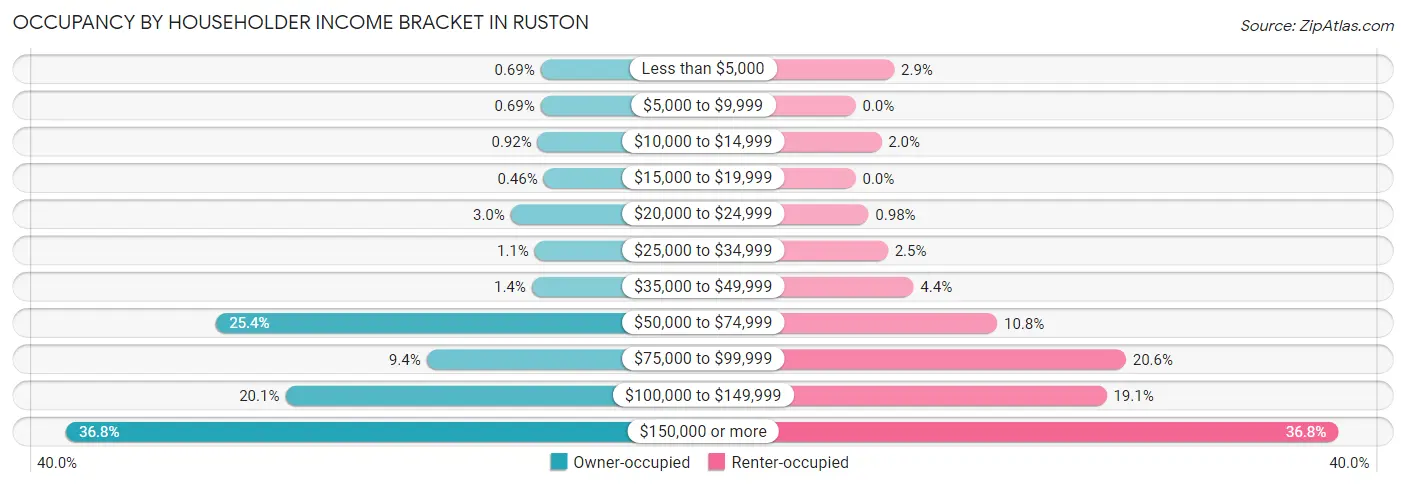
| Income Bracket | Owner-occupied | Renter-occupied |
| Less than $5,000 | 3 (0.7%) | 6 (2.9%) |
| $5,000 to $9,999 | 3 (0.7%) | 0 (0.0%) |
| $10,000 to $14,999 | 4 (0.9%) | 4 (2.0%) |
| $15,000 to $19,999 | 2 (0.5%) | 0 (0.0%) |
| $20,000 to $24,999 | 13 (3.0%) | 2 (1.0%) |
| $25,000 to $34,999 | 5 (1.1%) | 5 (2.5%) |
| $35,000 to $49,999 | 6 (1.4%) | 9 (4.4%) |
| $50,000 to $74,999 | 111 (25.4%) | 22 (10.8%) |
| $75,000 to $99,999 | 41 (9.4%) | 42 (20.6%) |
| $100,000 to $149,999 | 88 (20.1%) | 39 (19.1%) |
| $150,000 or more | 161 (36.8%) | 75 (36.8%) |
| Total | 437 (100.0%) | 204 (100.0%) |
Monthly Housing Cost Tiers in Ruston
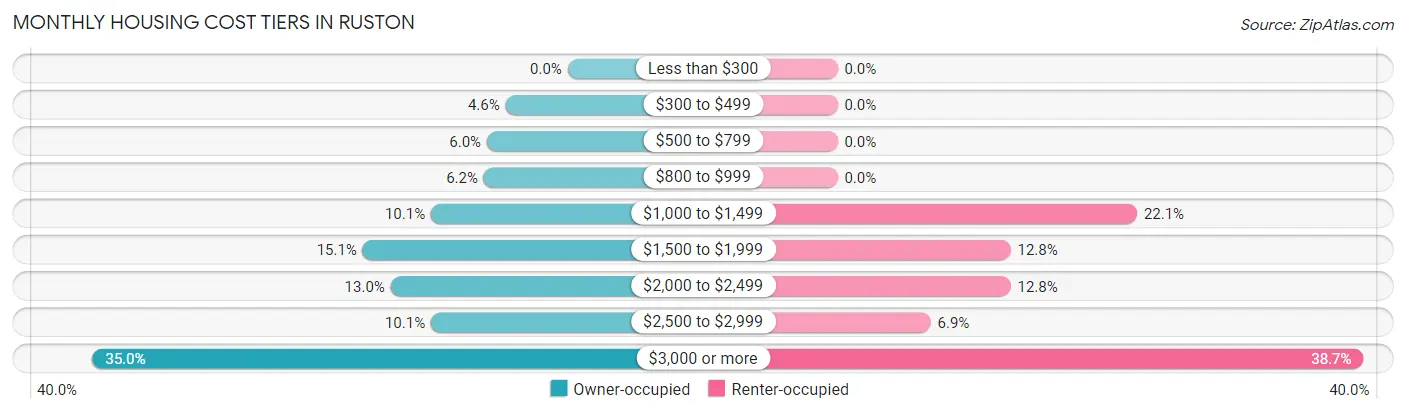
| Monthly Cost | Owner-occupied | Renter-occupied |
| Less than $300 | 0 (0.0%) | 0 (0.0%) |
| $300 to $499 | 20 (4.6%) | 0 (0.0%) |
| $500 to $799 | 26 (5.9%) | 0 (0.0%) |
| $800 to $999 | 27 (6.2%) | 0 (0.0%) |
| $1,000 to $1,499 | 44 (10.1%) | 45 (22.1%) |
| $1,500 to $1,999 | 66 (15.1%) | 26 (12.8%) |
| $2,000 to $2,499 | 57 (13.0%) | 26 (12.8%) |
| $2,500 to $2,999 | 44 (10.1%) | 14 (6.9%) |
| $3,000 or more | 153 (35.0%) | 79 (38.7%) |
| Total | 437 (100.0%) | 204 (100.0%) |
Physical Housing Characteristics in Ruston
Housing Structures in Ruston
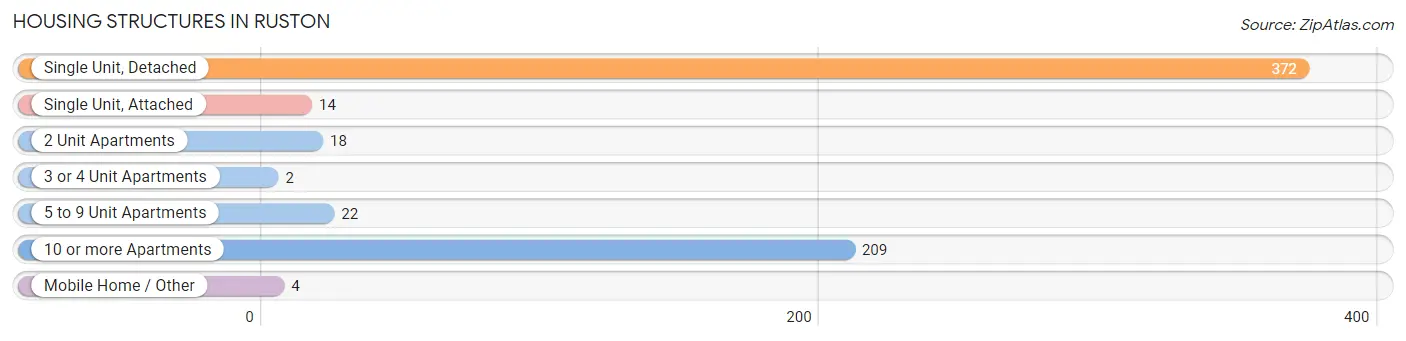
| Structure Type | # Housing Units | % Housing Units |
| Single Unit, Detached | 372 | 58.0% |
| Single Unit, Attached | 14 | 2.2% |
| 2 Unit Apartments | 18 | 2.8% |
| 3 or 4 Unit Apartments | 2 | 0.3% |
| 5 to 9 Unit Apartments | 22 | 3.4% |
| 10 or more Apartments | 209 | 32.6% |
| Mobile Home / Other | 4 | 0.6% |
| Total | 641 | 100.0% |
Housing Structures by Occupancy in Ruston
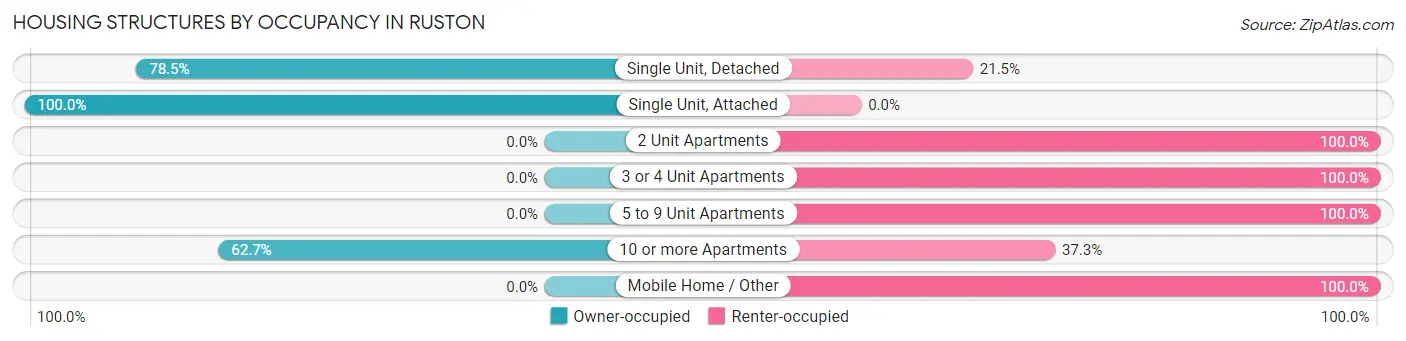
| Structure Type | Owner-occupied | Renter-occupied |
| Single Unit, Detached | 292 (78.5%) | 80 (21.5%) |
| Single Unit, Attached | 14 (100.0%) | 0 (0.0%) |
| 2 Unit Apartments | 0 (0.0%) | 18 (100.0%) |
| 3 or 4 Unit Apartments | 0 (0.0%) | 2 (100.0%) |
| 5 to 9 Unit Apartments | 0 (0.0%) | 22 (100.0%) |
| 10 or more Apartments | 131 (62.7%) | 78 (37.3%) |
| Mobile Home / Other | 0 (0.0%) | 4 (100.0%) |
| Total | 437 (68.2%) | 204 (31.8%) |
Housing Structures by Number of Rooms in Ruston
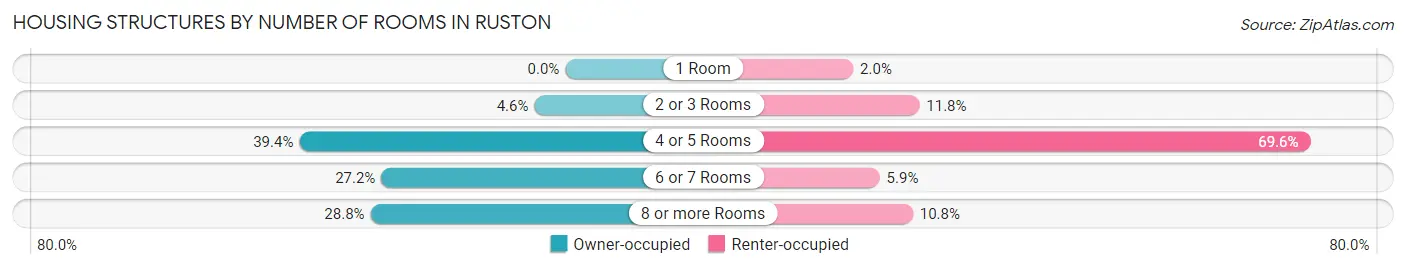
| Number of Rooms | Owner-occupied | Renter-occupied |
| 1 Room | 0 (0.0%) | 4 (2.0%) |
| 2 or 3 Rooms | 20 (4.6%) | 24 (11.8%) |
| 4 or 5 Rooms | 172 (39.4%) | 142 (69.6%) |
| 6 or 7 Rooms | 119 (27.2%) | 12 (5.9%) |
| 8 or more Rooms | 126 (28.8%) | 22 (10.8%) |
| Total | 437 (100.0%) | 204 (100.0%) |
Housing Structure by Heating Type in Ruston
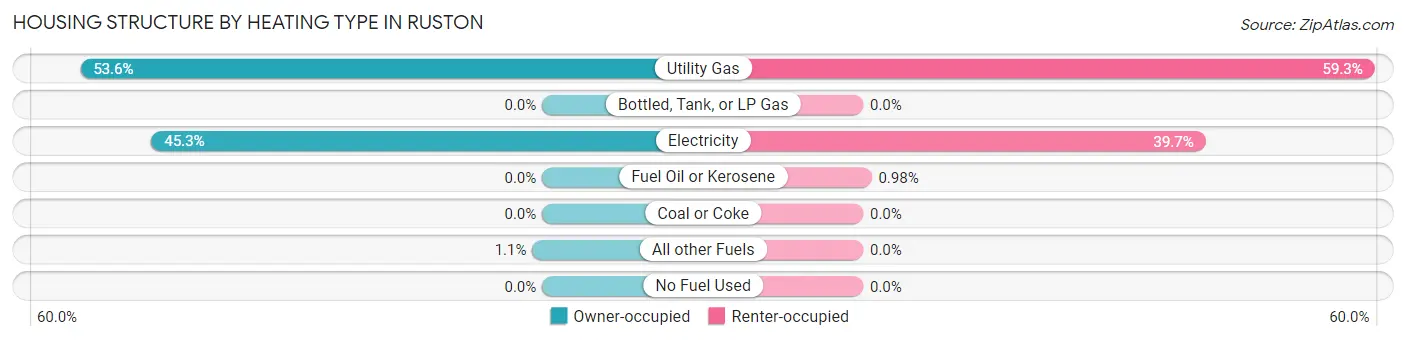
| Heating Type | Owner-occupied | Renter-occupied |
| Utility Gas | 234 (53.5%) | 121 (59.3%) |
| Bottled, Tank, or LP Gas | 0 (0.0%) | 0 (0.0%) |
| Electricity | 198 (45.3%) | 81 (39.7%) |
| Fuel Oil or Kerosene | 0 (0.0%) | 2 (1.0%) |
| Coal or Coke | 0 (0.0%) | 0 (0.0%) |
| All other Fuels | 5 (1.1%) | 0 (0.0%) |
| No Fuel Used | 0 (0.0%) | 0 (0.0%) |
| Total | 437 (100.0%) | 204 (100.0%) |
Household Vehicle Usage in Ruston
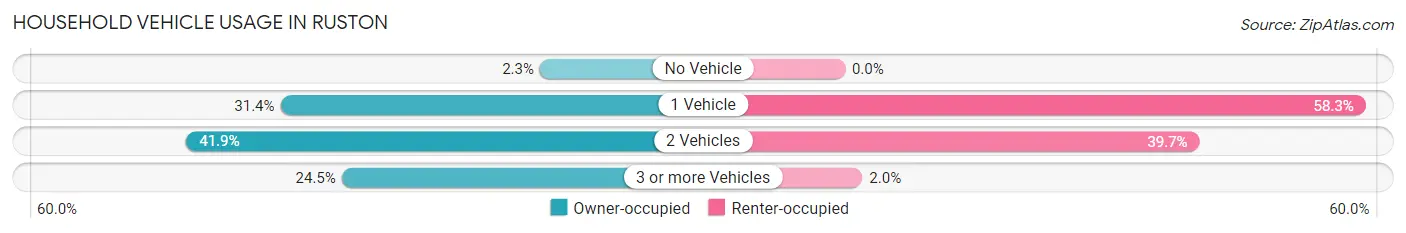
| Vehicles per Household | Owner-occupied | Renter-occupied |
| No Vehicle | 10 (2.3%) | 0 (0.0%) |
| 1 Vehicle | 137 (31.4%) | 119 (58.3%) |
| 2 Vehicles | 183 (41.9%) | 81 (39.7%) |
| 3 or more Vehicles | 107 (24.5%) | 4 (2.0%) |
| Total | 437 (100.0%) | 204 (100.0%) |
Real Estate & Mortgages in Ruston
Real Estate and Mortgage Overview in Ruston
| Characteristic | Without Mortgage | With Mortgage |
| Housing Units | 153 | 284 |
| Median Property Value | $823,400 | $762,500 |
| Median Household Income | $117,083 | $111 |
| Monthly Housing Costs | $1,188 | $147 |
| Real Estate Taxes | $7,540 | $0 |
Property Value by Mortgage Status in Ruston
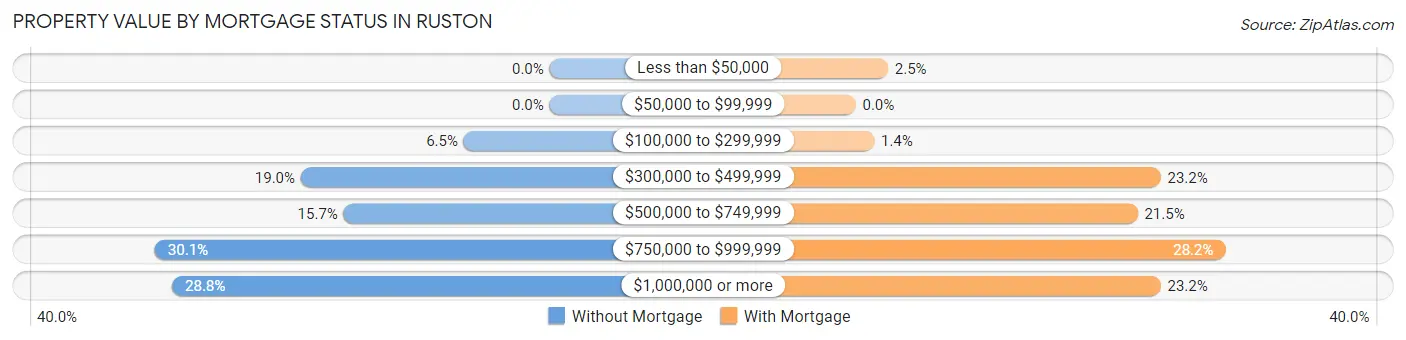
| Property Value | Without Mortgage | With Mortgage |
| Less than $50,000 | 0 (0.0%) | 7 (2.5%) |
| $50,000 to $99,999 | 0 (0.0%) | 0 (0.0%) |
| $100,000 to $299,999 | 10 (6.5%) | 4 (1.4%) |
| $300,000 to $499,999 | 29 (19.0%) | 66 (23.2%) |
| $500,000 to $749,999 | 24 (15.7%) | 61 (21.5%) |
| $750,000 to $999,999 | 46 (30.1%) | 80 (28.2%) |
| $1,000,000 or more | 44 (28.8%) | 66 (23.2%) |
| Total | 153 (100.0%) | 284 (100.0%) |
Household Income by Mortgage Status in Ruston
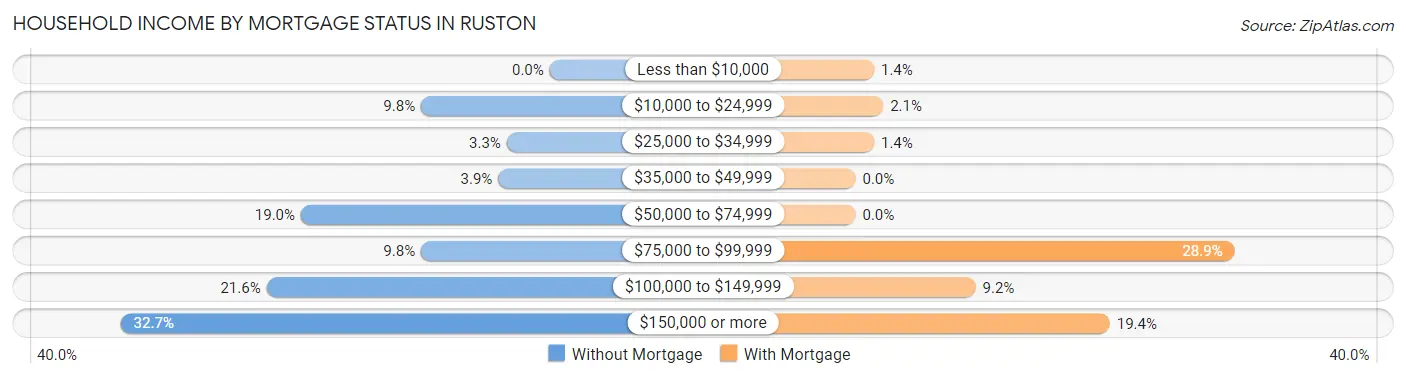
| Household Income | Without Mortgage | With Mortgage |
| Less than $10,000 | 0 (0.0%) | 4 (1.4%) |
| $10,000 to $24,999 | 15 (9.8%) | 6 (2.1%) |
| $25,000 to $34,999 | 5 (3.3%) | 4 (1.4%) |
| $35,000 to $49,999 | 6 (3.9%) | 0 (0.0%) |
| $50,000 to $74,999 | 29 (19.0%) | 0 (0.0%) |
| $75,000 to $99,999 | 15 (9.8%) | 82 (28.9%) |
| $100,000 to $149,999 | 33 (21.6%) | 26 (9.1%) |
| $150,000 or more | 50 (32.7%) | 55 (19.4%) |
| Total | 153 (100.0%) | 284 (100.0%) |
Property Value to Household Income Ratio in Ruston
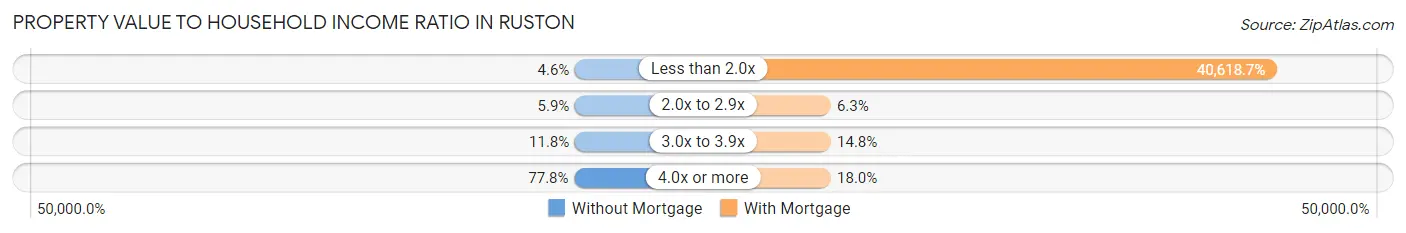
| Value-to-Income Ratio | Without Mortgage | With Mortgage |
| Less than 2.0x | 7 (4.6%) | 115,357 (40,618.7%) |
| 2.0x to 2.9x | 9 (5.9%) | 18 (6.3%) |
| 3.0x to 3.9x | 18 (11.8%) | 42 (14.8%) |
| 4.0x or more | 119 (77.8%) | 51 (18.0%) |
| Total | 153 (100.0%) | 284 (100.0%) |
Real Estate Taxes by Mortgage Status in Ruston
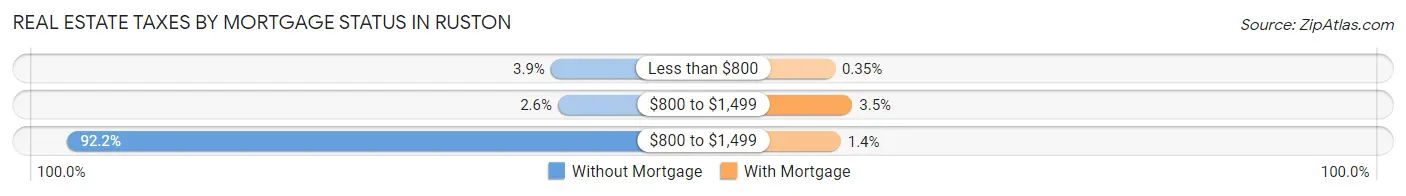
| Property Taxes | Without Mortgage | With Mortgage |
| Less than $800 | 6 (3.9%) | 1 (0.4%) |
| $800 to $1,499 | 4 (2.6%) | 10 (3.5%) |
| $800 to $1,499 | 141 (92.2%) | 4 (1.4%) |
| Total | 153 (100.0%) | 284 (100.0%) |
Health & Disability in Ruston
Health Insurance Coverage by Age in Ruston
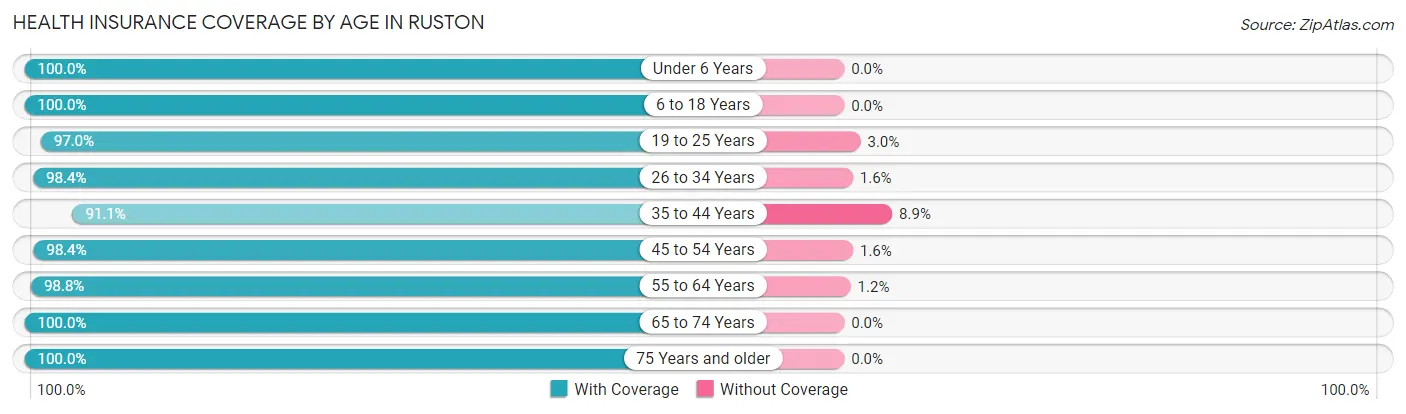
| Age Bracket | With Coverage | Without Coverage |
| Under 6 Years | 58 (100.0%) | 0 (0.0%) |
| 6 to 18 Years | 133 (100.0%) | 0 (0.0%) |
| 19 to 25 Years | 64 (97.0%) | 2 (3.0%) |
| 26 to 34 Years | 185 (98.4%) | 3 (1.6%) |
| 35 to 44 Years | 153 (91.1%) | 15 (8.9%) |
| 45 to 54 Years | 121 (98.4%) | 2 (1.6%) |
| 55 to 64 Years | 250 (98.8%) | 3 (1.2%) |
| 65 to 74 Years | 195 (100.0%) | 0 (0.0%) |
| 75 Years and older | 78 (100.0%) | 0 (0.0%) |
| Total | 1,237 (98.0%) | 25 (2.0%) |
Health Insurance Coverage by Citizenship Status in Ruston
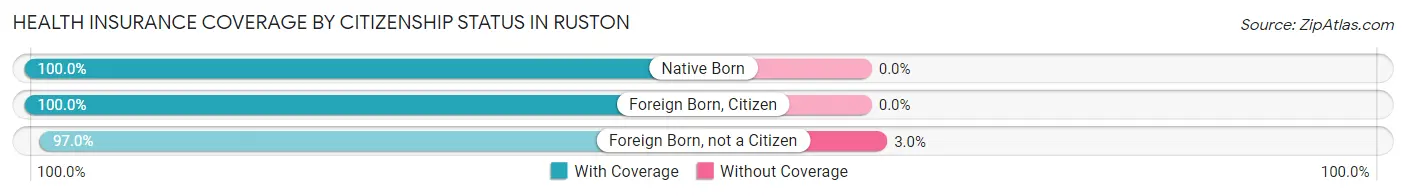
| Citizenship Status | With Coverage | Without Coverage |
| Native Born | 58 (100.0%) | 0 (0.0%) |
| Foreign Born, Citizen | 133 (100.0%) | 0 (0.0%) |
| Foreign Born, not a Citizen | 64 (97.0%) | 2 (3.0%) |
Health Insurance Coverage by Household Income in Ruston
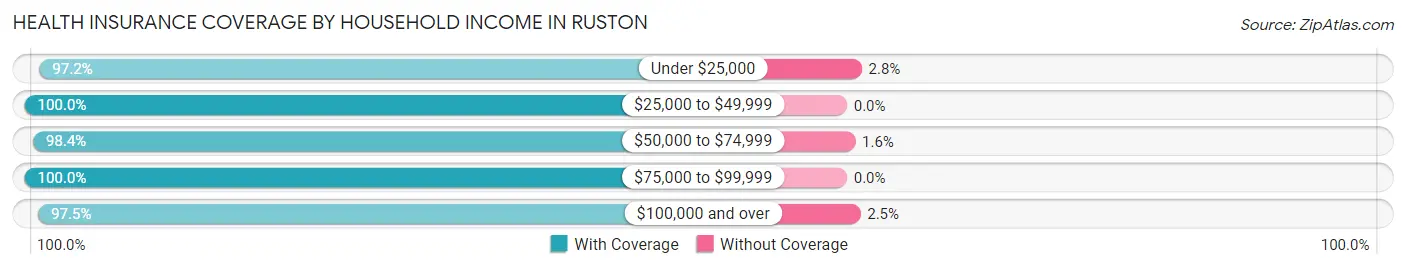
| Household Income | With Coverage | Without Coverage |
| Under $25,000 | 70 (97.2%) | 2 (2.8%) |
| $25,000 to $49,999 | 39 (100.0%) | 0 (0.0%) |
| $50,000 to $74,999 | 253 (98.4%) | 4 (1.6%) |
| $75,000 to $99,999 | 142 (100.0%) | 0 (0.0%) |
| $100,000 and over | 733 (97.5%) | 19 (2.5%) |
Public vs Private Health Insurance Coverage by Age in Ruston
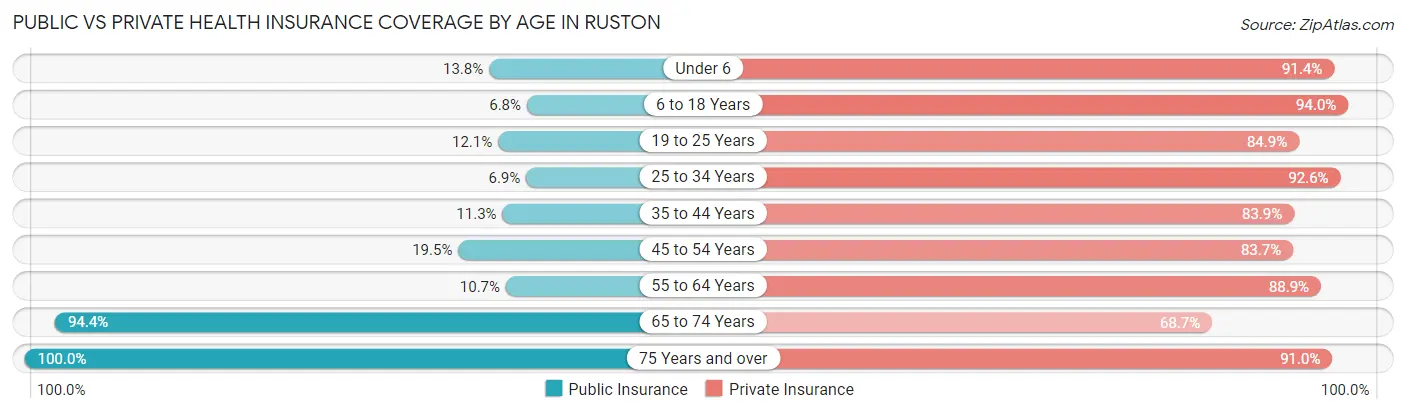
| Age Bracket | Public Insurance | Private Insurance |
| Under 6 | 8 (13.8%) | 53 (91.4%) |
| 6 to 18 Years | 9 (6.8%) | 125 (94.0%) |
| 19 to 25 Years | 8 (12.1%) | 56 (84.9%) |
| 25 to 34 Years | 13 (6.9%) | 174 (92.5%) |
| 35 to 44 Years | 19 (11.3%) | 141 (83.9%) |
| 45 to 54 Years | 24 (19.5%) | 103 (83.7%) |
| 55 to 64 Years | 27 (10.7%) | 225 (88.9%) |
| 65 to 74 Years | 184 (94.4%) | 134 (68.7%) |
| 75 Years and over | 78 (100.0%) | 71 (91.0%) |
| Total | 370 (29.3%) | 1,082 (85.7%) |
Disability Status by Sex by Age in Ruston
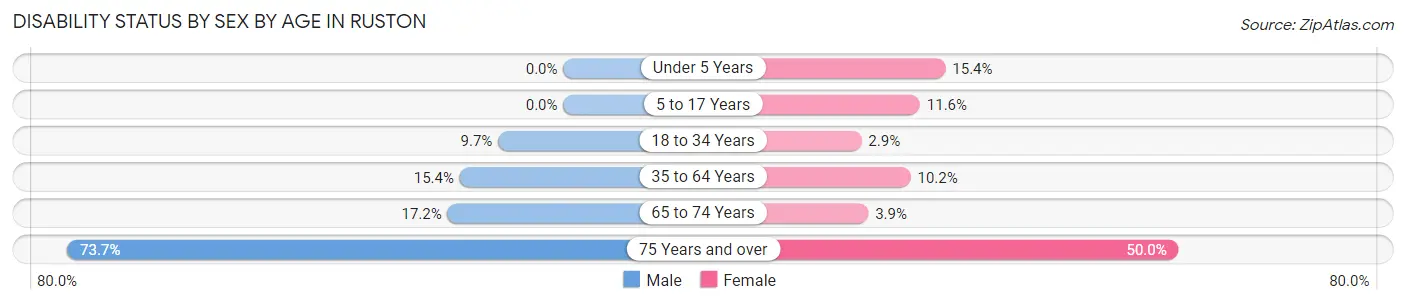
| Age Bracket | Male | Female |
| Under 5 Years | 0 (0.0%) | 4 (15.4%) |
| 5 to 17 Years | 0 (0.0%) | 8 (11.6%) |
| 18 to 34 Years | 15 (9.7%) | 3 (2.9%) |
| 35 to 64 Years | 40 (15.4%) | 29 (10.2%) |
| 65 to 74 Years | 16 (17.2%) | 4 (3.9%) |
| 75 Years and over | 28 (73.7%) | 20 (50.0%) |
Disability Class by Sex by Age in Ruston
Disability Class: Hearing Difficulty
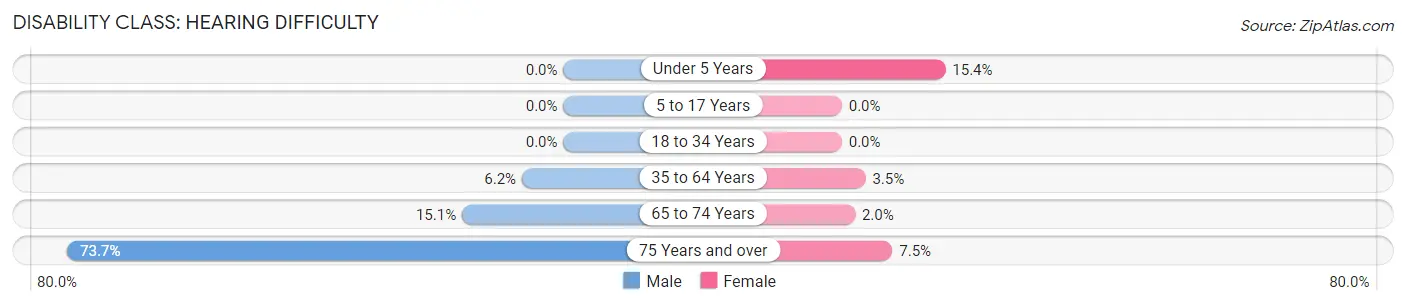
| Age Bracket | Male | Female |
| Under 5 Years | 0 (0.0%) | 4 (15.4%) |
| 5 to 17 Years | 0 (0.0%) | 0 (0.0%) |
| 18 to 34 Years | 0 (0.0%) | 0 (0.0%) |
| 35 to 64 Years | 16 (6.1%) | 10 (3.5%) |
| 65 to 74 Years | 14 (15.0%) | 2 (2.0%) |
| 75 Years and over | 28 (73.7%) | 3 (7.5%) |
Disability Class: Vision Difficulty
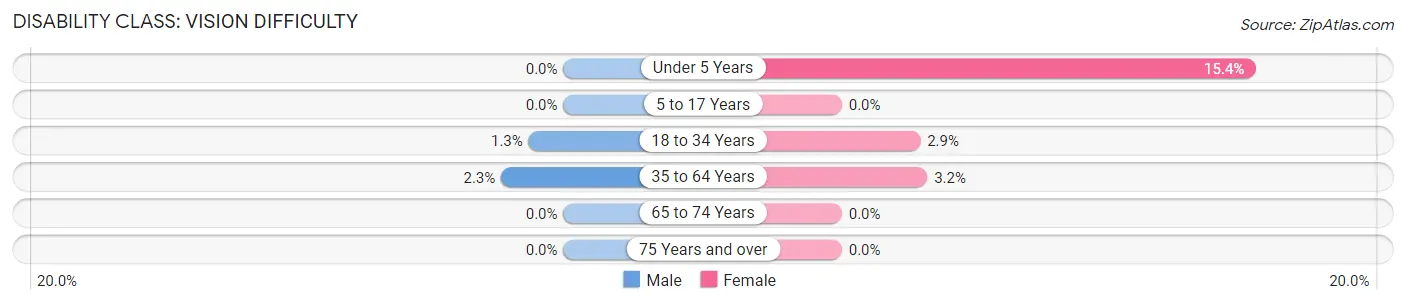
| Age Bracket | Male | Female |
| Under 5 Years | 0 (0.0%) | 4 (15.4%) |
| 5 to 17 Years | 0 (0.0%) | 0 (0.0%) |
| 18 to 34 Years | 2 (1.3%) | 3 (2.9%) |
| 35 to 64 Years | 6 (2.3%) | 9 (3.2%) |
| 65 to 74 Years | 0 (0.0%) | 0 (0.0%) |
| 75 Years and over | 0 (0.0%) | 0 (0.0%) |
Disability Class: Cognitive Difficulty
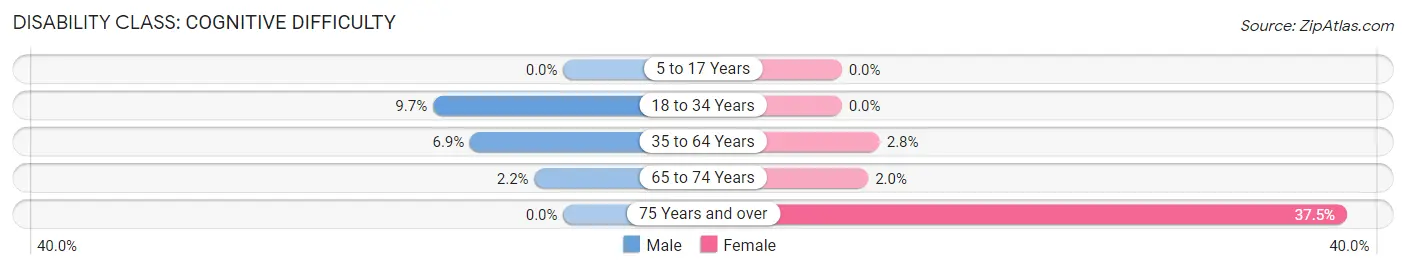
| Age Bracket | Male | Female |
| 5 to 17 Years | 0 (0.0%) | 0 (0.0%) |
| 18 to 34 Years | 15 (9.7%) | 0 (0.0%) |
| 35 to 64 Years | 18 (6.9%) | 8 (2.8%) |
| 65 to 74 Years | 2 (2.1%) | 2 (2.0%) |
| 75 Years and over | 0 (0.0%) | 15 (37.5%) |
Disability Class: Ambulatory Difficulty
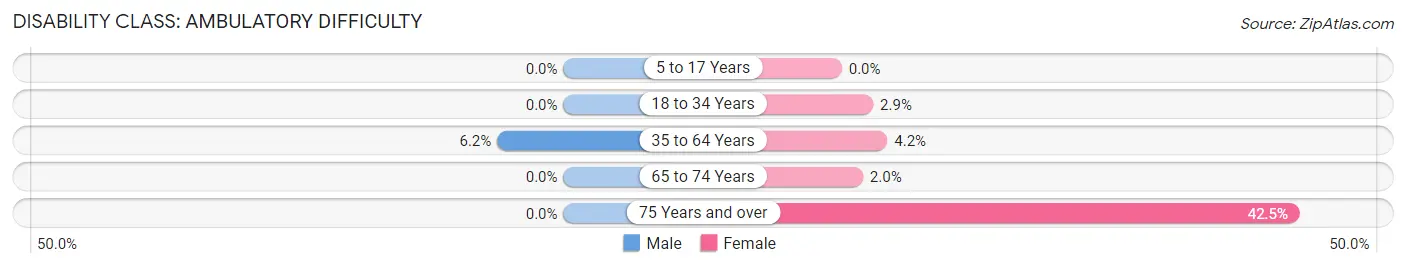
| Age Bracket | Male | Female |
| 5 to 17 Years | 0 (0.0%) | 0 (0.0%) |
| 18 to 34 Years | 0 (0.0%) | 3 (2.9%) |
| 35 to 64 Years | 16 (6.1%) | 12 (4.2%) |
| 65 to 74 Years | 0 (0.0%) | 2 (2.0%) |
| 75 Years and over | 0 (0.0%) | 17 (42.5%) |
Disability Class: Self-Care Difficulty
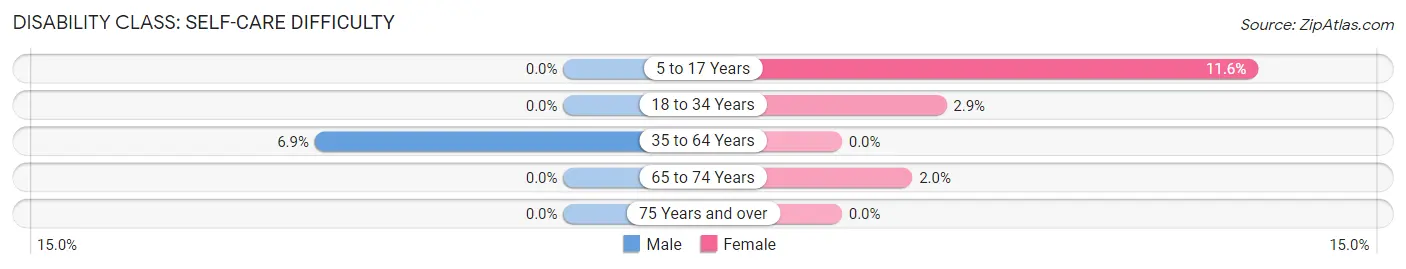
| Age Bracket | Male | Female |
| 5 to 17 Years | 0 (0.0%) | 8 (11.6%) |
| 18 to 34 Years | 0 (0.0%) | 3 (2.9%) |
| 35 to 64 Years | 18 (6.9%) | 0 (0.0%) |
| 65 to 74 Years | 0 (0.0%) | 2 (2.0%) |
| 75 Years and over | 0 (0.0%) | 0 (0.0%) |
Technology Access in Ruston
Computing Device Access in Ruston
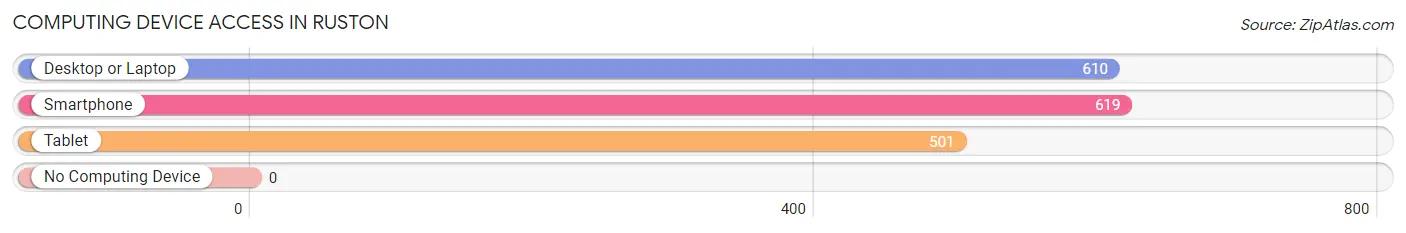
| Device Type | # Households | % Households |
| Desktop or Laptop | 610 | 95.2% |
| Smartphone | 619 | 96.6% |
| Tablet | 501 | 78.2% |
| No Computing Device | 0 | 0.0% |
| Total | 641 | 100.0% |
Internet Access in Ruston
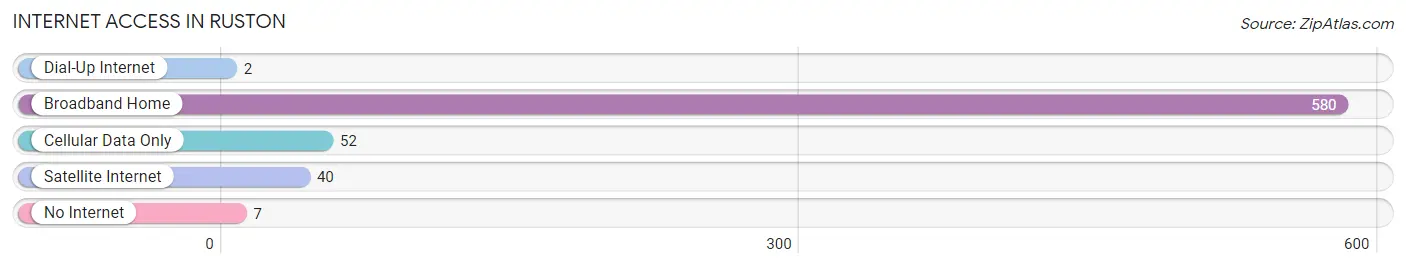
| Internet Type | # Households | % Households |
| Dial-Up Internet | 2 | 0.3% |
| Broadband Home | 580 | 90.5% |
| Cellular Data Only | 52 | 8.1% |
| Satellite Internet | 40 | 6.2% |
| No Internet | 7 | 1.1% |
| Total | 641 | 100.0% |
Ruston Summary
Introduction
The small town of Ruston, Washington is located in Pierce County, just north of Tacoma. It is a small, unincorporated community with a population of just over 1,000 people. Ruston is known for its beautiful views of the Puget Sound and its close proximity to the city of Tacoma. It is a quiet, peaceful community that is home to many families and retirees.
History
The area that is now Ruston was first settled in the late 1800s by a group of Scandinavian immigrants. The town was originally called “New Scandinavia” and was a small fishing village. In the early 1900s, the town was renamed Ruston after a local businessman, Charles Rust. The town grew slowly over the years, and by the 1950s, it had become a popular summer destination for tourists.
In the 1970s, Ruston began to experience a period of growth and development. The town was annexed by the city of Tacoma in 1975, and the population began to increase. In the 1980s, Ruston began to attract more businesses and residents, and the town began to develop into a more modern community.
Geography
Ruston is located in Pierce County, just north of Tacoma. It is situated on the Puget Sound, and is surrounded by the cities of Tacoma, University Place, and Fircrest. The town is located on a hillside, and is bordered by the Ruston Way waterfront. The town is home to several parks, including Point Defiance Park, which is a popular destination for visitors.
Economy
The economy of Ruston is largely based on tourism and retail. The town is home to several small businesses, including restaurants, shops, and galleries. The town also has a marina, which is a popular destination for boaters. The town is also home to several large employers, including the University of Washington Tacoma and the Tacoma-Pierce County Health Department.
Demographics
As of the 2010 census, the population of Ruston was 1,039. The population is largely white (90.2%), with a small percentage of African Americans (2.2%), Asians (2.1%), and Native Americans (1.2%). The median household income is $50,945, and the median age is 44.
Conclusion
Ruston, Washington is a small, unincorporated community located in Pierce County, just north of Tacoma. It is a quiet, peaceful town that is home to many families and retirees. The town is known for its beautiful views of the Puget Sound and its close proximity to the city of Tacoma. The economy of Ruston is largely based on tourism and retail, and the population is largely white. Ruston is a great place to live and visit, and is a great example of a small town in Washington.
Common Questions
What is Per Capita Income in Ruston?
Per Capita income in Ruston is $74,887.
What is the Median Family Income in Ruston?
Median Family Income in Ruston is $110,000.
What is the Median Household income in Ruston?
Median Household Income in Ruston is $116,625.
What is Income or Wage Gap in Ruston?
Income or Wage Gap in Ruston is 37.4%.
Women in Ruston earn 62.6 cents for every dollar earned by a man.
What is Inequality or Gini Index in Ruston?
Inequality or Gini Index in Ruston is 0.40.
What is the Total Population of Ruston?
Total Population of Ruston is 1,270.
What is the Total Male Population of Ruston?
Total Male Population of Ruston is 645.
What is the Total Female Population of Ruston?
Total Female Population of Ruston is 625.
What is the Ratio of Males per 100 Females in Ruston?
There are 103.20 Males per 100 Females in Ruston.
What is the Ratio of Females per 100 Males in Ruston?
There are 96.90 Females per 100 Males in Ruston.
What is the Median Population Age in Ruston?
Median Population Age in Ruston is 46.1 Years.
What is the Average Family Size in Ruston
Average Family Size in Ruston is 2.5 People.
What is the Average Household Size in Ruston
Average Household Size in Ruston is 2.0 People.
How Large is the Labor Force in Ruston?
There are 695 People in the Labor Forcein in Ruston.
What is the Percentage of People in the Labor Force in Ruston?
63.8% of People are in the Labor Force in Ruston.
What is the Unemployment Rate in Ruston?
Unemployment Rate in Ruston is 1.5%.