Zip Codes with the Highest Percentage of Population Employed in Legal Services & Support in Bellingham, WA
RELATED REPORTS & OPTIONS
Legal Services & Support
Bellingham
Compare Zip Codes
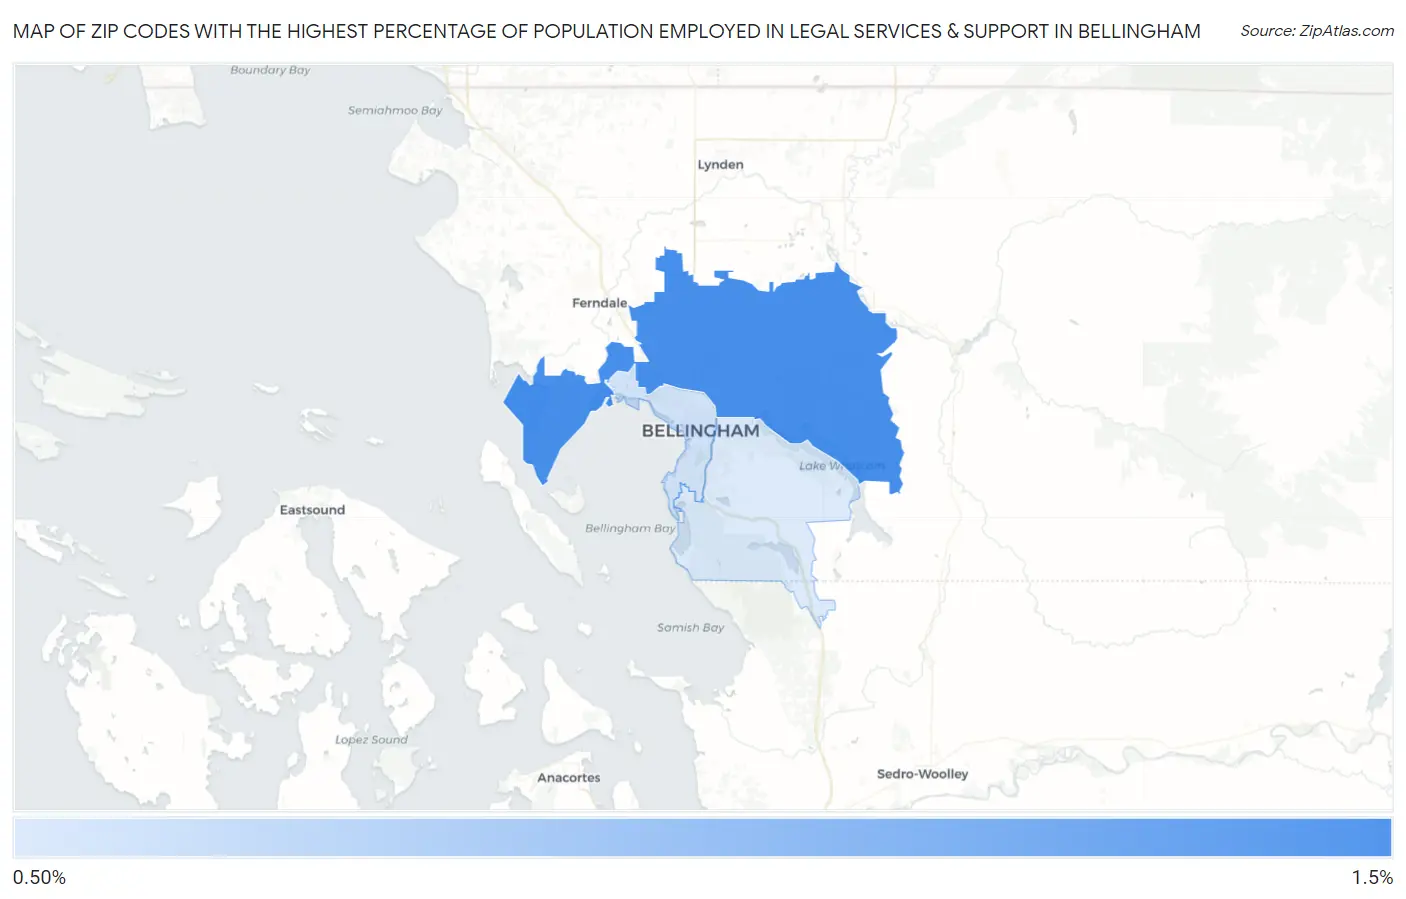
Map of Zip Codes with the Highest Percentage of Population Employed in Legal Services & Support in Bellingham
0.91%
1.3%
Zip Codes with the Highest Percentage of Population Employed in Legal Services & Support in Bellingham, WA
| Zip Code | % Employed | vs State | vs National | |
| 1. | 98226 | 1.3% | 1.1%(+0.247)#118 | 1.2%(+0.138)#5,825 |
| 2. | 98225 | 0.94% | 1.1%(-0.134)#176 | 1.2%(-0.244)#8,274 |
| 3. | 98229 | 0.91% | 1.1%(-0.166)#185 | 1.2%(-0.275)#8,522 |
1
Common Questions
What are the Top Zip Codes with the Highest Percentage of Population Employed in Legal Services & Support in Bellingham, WA?
Top Zip Codes with the Highest Percentage of Population Employed in Legal Services & Support in Bellingham, WA are:
What zip code has the Highest Percentage of Population Employed in Legal Services & Support in Bellingham, WA?
98226 has the Highest Percentage of Population Employed in Legal Services & Support in Bellingham, WA with 1.3%.
What is the Percentage of Population Employed in Legal Services & Support in Bellingham, WA?
Percentage of Population Employed in Legal Services & Support in Bellingham is 0.76%.
What is the Percentage of Population Employed in Legal Services & Support in Washington?
Percentage of Population Employed in Legal Services & Support in Washington is 1.1%.
What is the Percentage of Population Employed in Legal Services & Support in the United States?
Percentage of Population Employed in Legal Services & Support in the United States is 1.2%.