Pateros, WA Map & Demographics
Pateros Map
Pateros Overview
$23,354
PER CAPITA INCOME
$71,250
AVG FAMILY INCOME
$64,531
AVG HOUSEHOLD INCOME
2.7%
WAGE / INCOME GAP [ % ]
97.3¢/ $1
WAGE / INCOME GAP [ $ ]
0.41
INEQUALITY / GINI INDEX
668
TOTAL POPULATION
324
MALE POPULATION
344
FEMALE POPULATION
94.19
MALES / 100 FEMALES
106.17
FEMALES / 100 MALES
27.9
MEDIAN AGE
3.7
AVG FAMILY SIZE
3.4
AVG HOUSEHOLD SIZE
303
LABOR FORCE [ PEOPLE ]
67.2%
PERCENT IN LABOR FORCE
11.2%
UNEMPLOYMENT RATE
Pateros Zip Codes
Pateros Area Codes
Income in Pateros
Income Overview in Pateros
Per Capita Income in Pateros is $23,354, while median incomes of families and households are $71,250 and $64,531 respectively.
| Characteristic | Number | Measure |
| Per Capita Income | 668 | $23,354 |
| Median Family Income | 172 | $71,250 |
| Mean Family Income | 172 | $82,806 |
| Median Household Income | 195 | $64,531 |
| Mean Household Income | 195 | $77,347 |
| Income Deficit | 172 | $0 |
| Wage / Income Gap (%) | 668 | 2.65% |
| Wage / Income Gap ($) | 668 | 97.35¢ per $1 |
| Gini / Inequality Index | 668 | 0.41 |
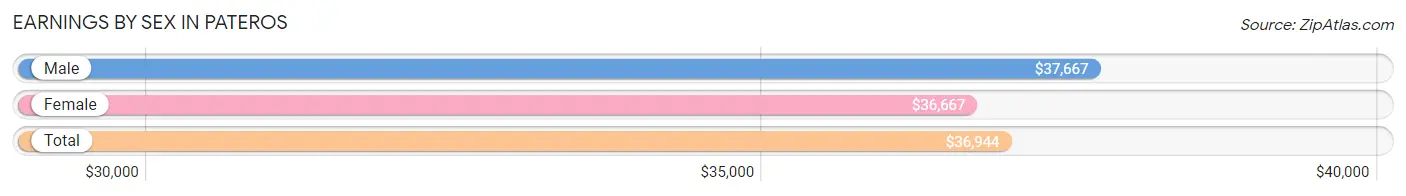
Earnings by Sex in Pateros
Average Earnings in Pateros are $36,944, $37,667 for men and $36,667 for women, a difference of 2.6%.
| Sex | Number | Average Earnings |
| Male | 150 (49.3%) | $37,667 |
| Female | 154 (50.7%) | $36,667 |
| Total | 304 (100.0%) | $36,944 |
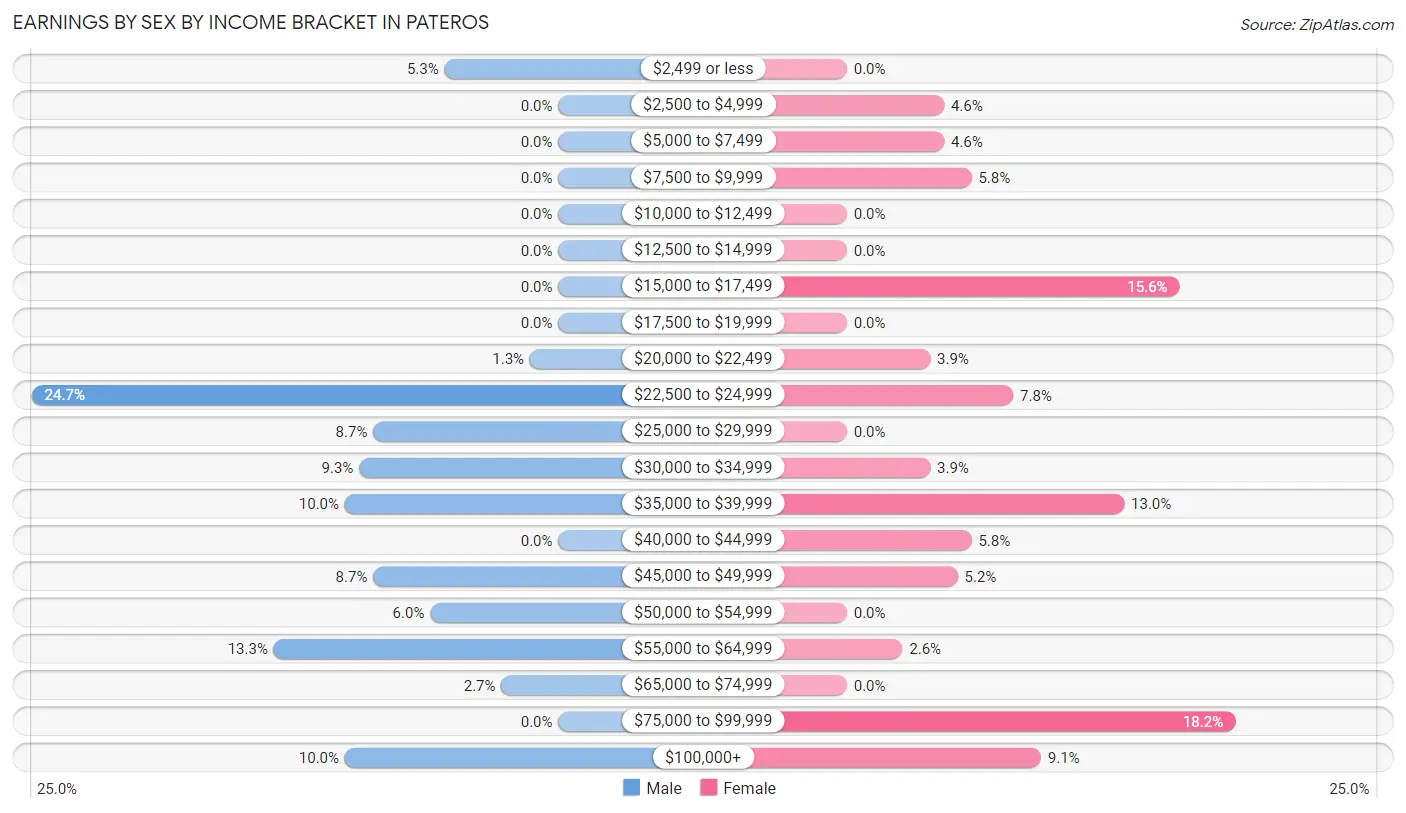
Earnings by Sex by Income Bracket in Pateros
The most common earnings brackets in Pateros are $22,500 to $24,999 for men (37 | 24.7%) and $75,000 to $99,999 for women (28 | 18.2%).
| Income | Male | Female |
| $2,499 or less | 8 (5.3%) | 0 (0.0%) |
| $2,500 to $4,999 | 0 (0.0%) | 7 (4.5%) |
| $5,000 to $7,499 | 0 (0.0%) | 7 (4.5%) |
| $7,500 to $9,999 | 0 (0.0%) | 9 (5.8%) |
| $10,000 to $12,499 | 0 (0.0%) | 0 (0.0%) |
| $12,500 to $14,999 | 0 (0.0%) | 0 (0.0%) |
| $15,000 to $17,499 | 0 (0.0%) | 24 (15.6%) |
| $17,500 to $19,999 | 0 (0.0%) | 0 (0.0%) |
| $20,000 to $22,499 | 2 (1.3%) | 6 (3.9%) |
| $22,500 to $24,999 | 37 (24.7%) | 12 (7.8%) |
| $25,000 to $29,999 | 13 (8.7%) | 0 (0.0%) |
| $30,000 to $34,999 | 14 (9.3%) | 6 (3.9%) |
| $35,000 to $39,999 | 15 (10.0%) | 20 (13.0%) |
| $40,000 to $44,999 | 0 (0.0%) | 9 (5.8%) |
| $45,000 to $49,999 | 13 (8.7%) | 8 (5.2%) |
| $50,000 to $54,999 | 9 (6.0%) | 0 (0.0%) |
| $55,000 to $64,999 | 20 (13.3%) | 4 (2.6%) |
| $65,000 to $74,999 | 4 (2.7%) | 0 (0.0%) |
| $75,000 to $99,999 | 0 (0.0%) | 28 (18.2%) |
| $100,000+ | 15 (10.0%) | 14 (9.1%) |
| Total | 150 (100.0%) | 154 (100.0%) |
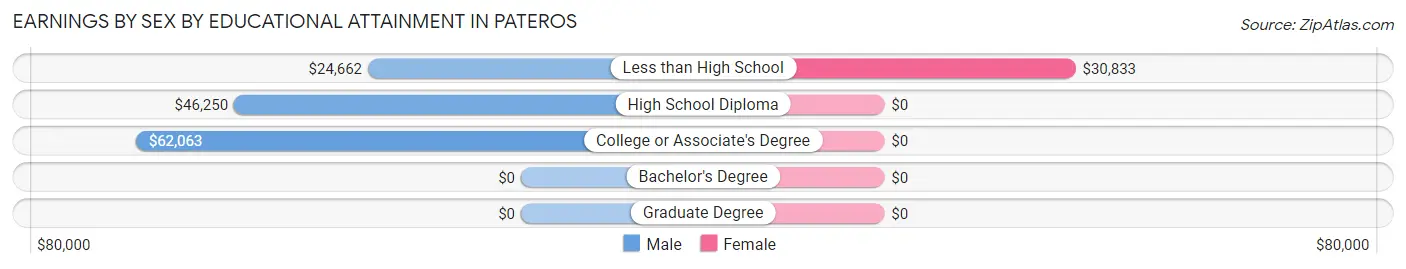
Earnings by Sex by Educational Attainment in Pateros
Average earnings in Pateros are $38,333 for men and $37,841 for women, a difference of 1.3%. Men with an educational attainment of college or associate's degree enjoy the highest average annual earnings of $62,063, while those with less than high school education earn the least with $24,662. Women with an educational attainment of less than high school earn the most with the average annual earnings of $30,833, while those with less than high school education have the smallest earnings of $30,833.
| Educational Attainment | Male Income | Female Income |
| Less than High School | $24,662 | $30,833 |
| High School Diploma | $46,250 | $0 |
| College or Associate's Degree | $62,063 | $0 |
| Bachelor's Degree | - | - |
| Graduate Degree | - | - |
| Total | $38,333 | $37,841 |
Family Income in Pateros
Family Income Brackets in Pateros
According to the Pateros family income data, there are 40 families falling into the $25,000 to $34,999 income range, which is the most common income bracket and makes up 23.3% of all families.
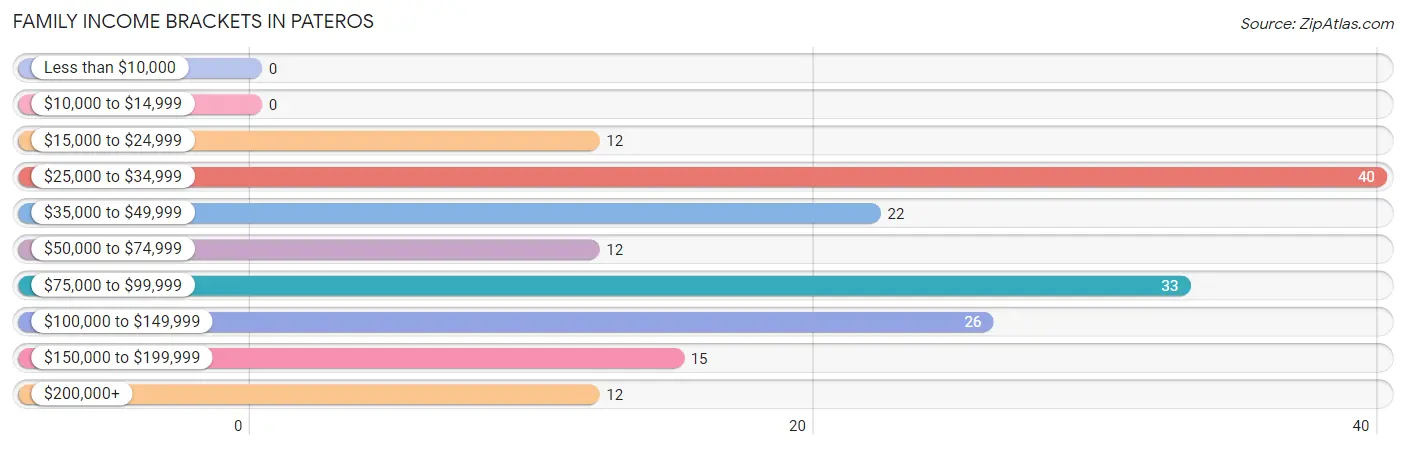
| Income Bracket | # Families | % Families |
| Less than $10,000 | 0 | 0.0% |
| $10,000 to $14,999 | 0 | 0.0% |
| $15,000 to $24,999 | 12 | 7.0% |
| $25,000 to $34,999 | 40 | 23.3% |
| $35,000 to $49,999 | 22 | 12.8% |
| $50,000 to $74,999 | 12 | 7.0% |
| $75,000 to $99,999 | 33 | 19.2% |
| $100,000 to $149,999 | 26 | 15.1% |
| $150,000 to $199,999 | 15 | 8.7% |
| $200,000+ | 12 | 7.0% |
Family Income by Famaliy Size in Pateros
3-person families (25 | 14.5%) account for the highest median family income in Pateros with $152,321 per family, while 3-person families (25 | 14.5%) have the highest median income of $50,774 per family member.
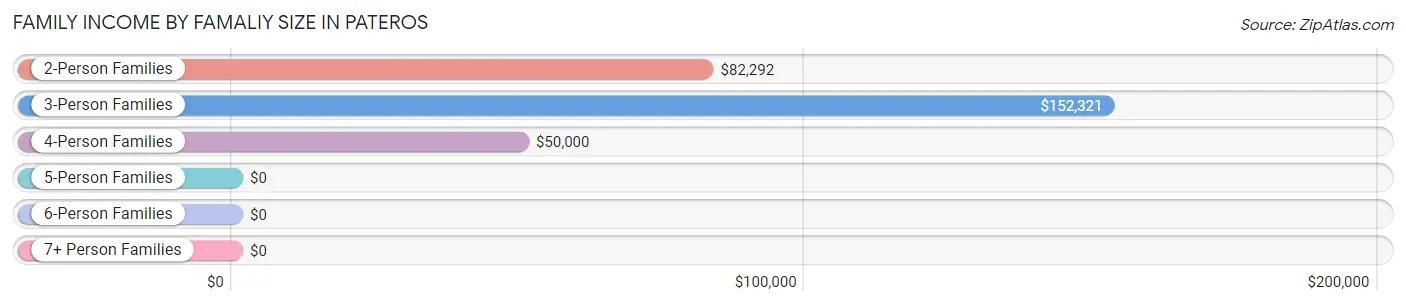
| Income Bracket | # Families | Median Income |
| 2-Person Families | 34 (19.8%) | $82,292 |
| 3-Person Families | 25 (14.5%) | $152,321 |
| 4-Person Families | 48 (27.9%) | $50,000 |
| 5-Person Families | 61 (35.5%) | $0 |
| 6-Person Families | 4 (2.3%) | $0 |
| 7+ Person Families | 0 (0.0%) | $0 |
| Total | 172 (100.0%) | $71,250 |
Family Income by Number of Earners in Pateros
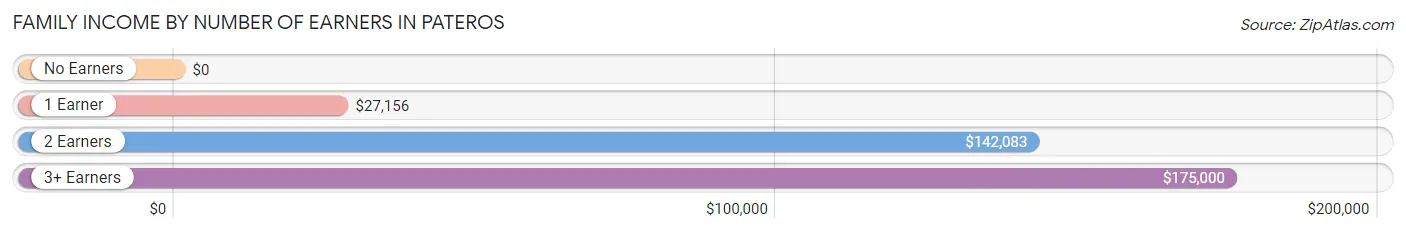
| Number of Earners | # Families | Median Income |
| No Earners | 4 (2.3%) | $0 |
| 1 Earner | 93 (54.1%) | $27,156 |
| 2 Earners | 59 (34.3%) | $142,083 |
| 3+ Earners | 16 (9.3%) | $175,000 |
| Total | 172 (100.0%) | $71,250 |
Household Income in Pateros
Household Income Brackets in Pateros
With 43 households falling in the category, the $75,000 to $99,999 income range is the most frequent in Pateros, accounting for 22.1% of all households.
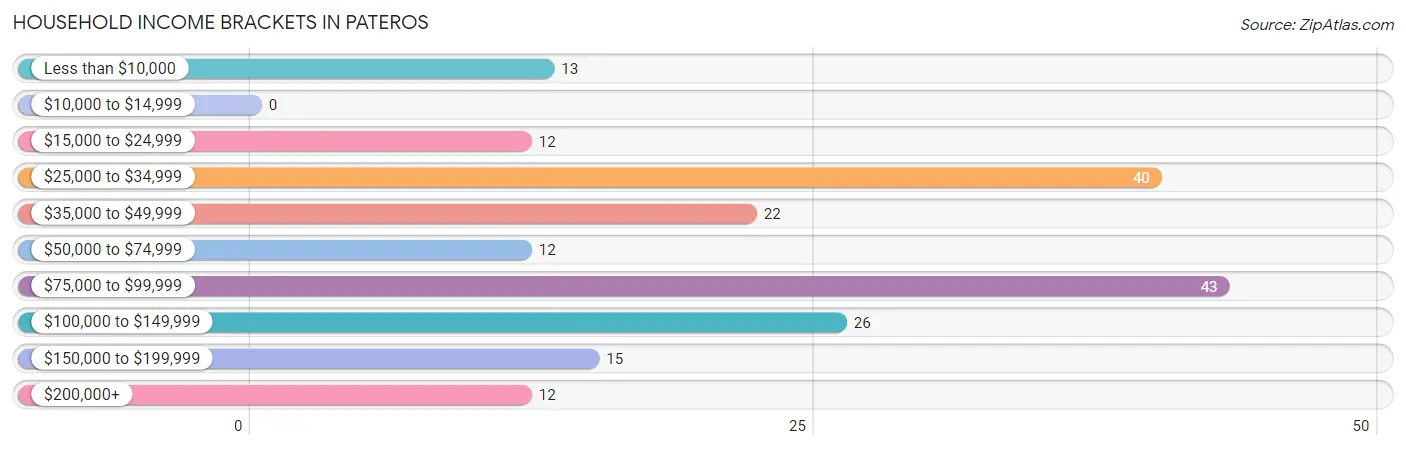
| Income Bracket | # Households | % Households |
| Less than $10,000 | 13 | 6.7% |
| $10,000 to $14,999 | 0 | 0.0% |
| $15,000 to $24,999 | 12 | 6.2% |
| $25,000 to $34,999 | 40 | 20.5% |
| $35,000 to $49,999 | 22 | 11.3% |
| $50,000 to $74,999 | 12 | 6.2% |
| $75,000 to $99,999 | 43 | 22.1% |
| $100,000 to $149,999 | 26 | 13.3% |
| $150,000 to $199,999 | 15 | 7.7% |
| $200,000+ | 12 | 6.2% |
Household Income by Householder Age in Pateros
The median household income in Pateros is $64,531, with the highest median household income of $87,045 found in the 45 to 64 years age bracket for the primary householder. A total of 52 households (26.7%) fall into this category. Meanwhile, the 15 to 24 years age bracket for the primary householder has the lowest median household income of $0, with 3 households (1.5%) in this group.
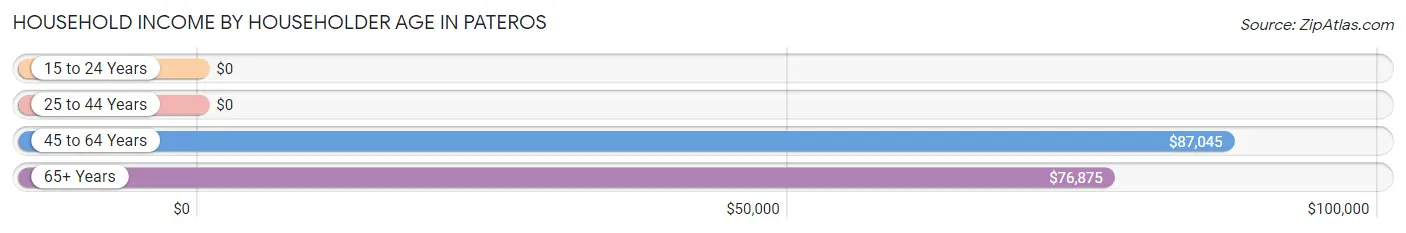
| Income Bracket | # Households | Median Income |
| 15 to 24 Years | 3 (1.5%) | $0 |
| 25 to 44 Years | 100 (51.3%) | $0 |
| 45 to 64 Years | 52 (26.7%) | $87,045 |
| 65+ Years | 40 (20.5%) | $76,875 |
| Total | 195 (100.0%) | $64,531 |
Poverty in Pateros
Income Below Poverty by Sex and Age in Pateros
With 20.4% poverty level for males and 33.4% for females among the residents of Pateros, 35 to 44 year old males and 12 to 14 year old females are the most vulnerable to poverty, with 37 males (57.8%) and 15 females (100.0%) in their respective age groups living below the poverty level.
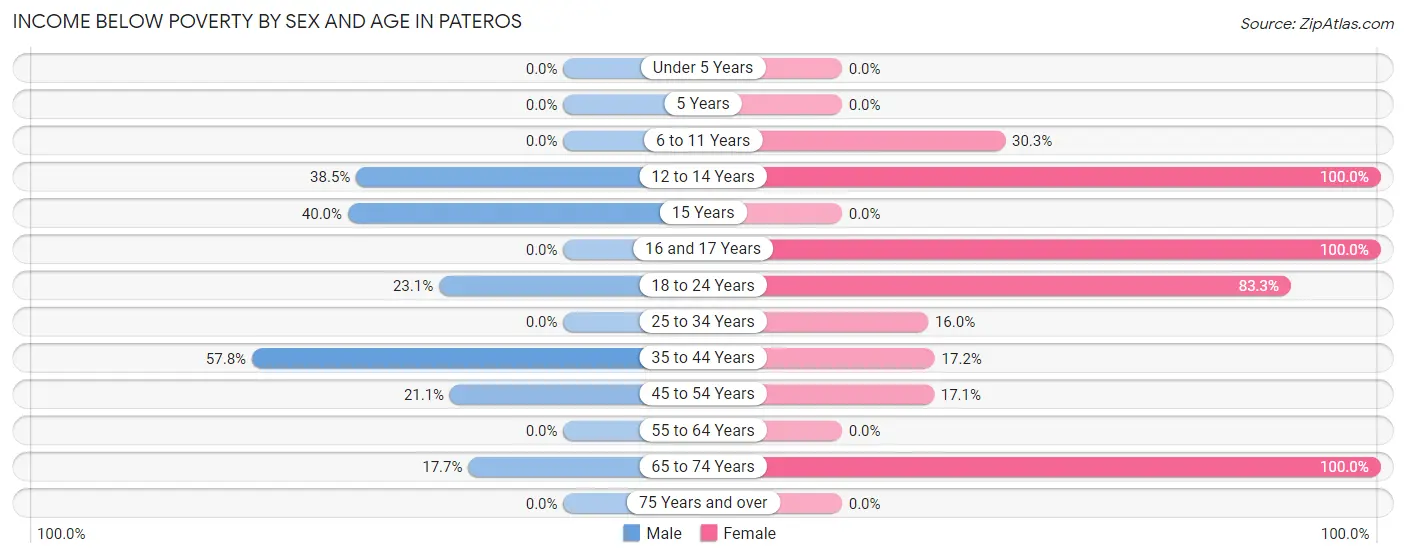
| Age Bracket | Male | Female |
| Under 5 Years | 0 (0.0%) | 0 (0.0%) |
| 5 Years | 0 (0.0%) | 0 (0.0%) |
| 6 to 11 Years | 0 (0.0%) | 10 (30.3%) |
| 12 to 14 Years | 10 (38.5%) | 15 (100.0%) |
| 15 Years | 6 (40.0%) | 0 (0.0%) |
| 16 and 17 Years | 0 (0.0%) | 5 (100.0%) |
| 18 to 24 Years | 3 (23.1%) | 45 (83.3%) |
| 25 to 34 Years | 0 (0.0%) | 12 (16.0%) |
| 35 to 44 Years | 37 (57.8%) | 10 (17.2%) |
| 45 to 54 Years | 4 (21.0%) | 7 (17.1%) |
| 55 to 64 Years | 0 (0.0%) | 0 (0.0%) |
| 65 to 74 Years | 6 (17.6%) | 11 (100.0%) |
| 75 Years and over | 0 (0.0%) | 0 (0.0%) |
| Total | 66 (20.4%) | 115 (33.4%) |
Income Above Poverty by Sex and Age in Pateros
According to the poverty statistics in Pateros, males aged under 5 years and females aged under 5 years are the age groups that are most secure financially, with 100.0% of males and 100.0% of females in these age groups living above the poverty line.
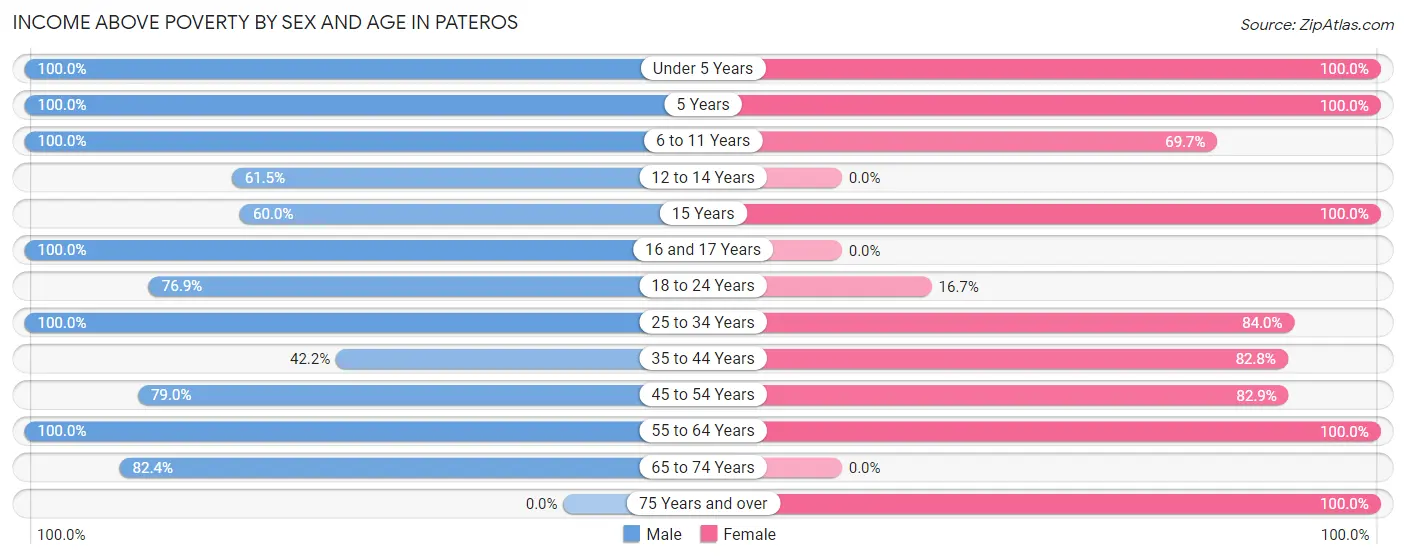
| Age Bracket | Male | Female |
| Under 5 Years | 48 (100.0%) | 14 (100.0%) |
| 5 Years | 10 (100.0%) | 6 (100.0%) |
| 6 to 11 Years | 39 (100.0%) | 23 (69.7%) |
| 12 to 14 Years | 16 (61.5%) | 0 (0.0%) |
| 15 Years | 9 (60.0%) | 11 (100.0%) |
| 16 and 17 Years | 5 (100.0%) | 0 (0.0%) |
| 18 to 24 Years | 10 (76.9%) | 9 (16.7%) |
| 25 to 34 Years | 22 (100.0%) | 63 (84.0%) |
| 35 to 44 Years | 27 (42.2%) | 48 (82.8%) |
| 45 to 54 Years | 15 (78.9%) | 34 (82.9%) |
| 55 to 64 Years | 29 (100.0%) | 18 (100.0%) |
| 65 to 74 Years | 28 (82.4%) | 0 (0.0%) |
| 75 Years and over | 0 (0.0%) | 3 (100.0%) |
| Total | 258 (79.6%) | 229 (66.6%) |
Income Below Poverty Among Married-Couple Families in Pateros
The poverty statistics for married-couple families in Pateros show that 28.2% or 37 of the total 131 families live below the poverty line. Families with 1 or 2 children have the highest poverty rate of 46.8%, comprising of 37 families. On the other hand, families with no children have the lowest poverty rate of 0.0%, which includes 0 families.
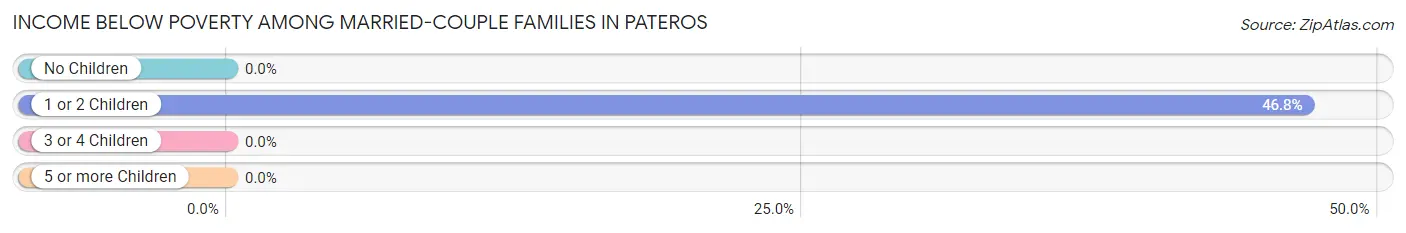
| Children | Above Poverty | Below Poverty |
| No Children | 30 (100.0%) | 0 (0.0%) |
| 1 or 2 Children | 42 (53.2%) | 37 (46.8%) |
| 3 or 4 Children | 22 (100.0%) | 0 (0.0%) |
| 5 or more Children | 0 (0.0%) | 0 (0.0%) |
| Total | 94 (71.8%) | 37 (28.2%) |
Income Below Poverty Among Single-Parent Households in Pateros
According to the poverty data in Pateros, 33.3% or 3 single-father households and 37.5% or 12 single-mother households are living below the poverty line. Among single-father households, those with 1 or 2 children have the highest poverty rate, with 3 households (100.0%) experiencing poverty. Likewise, among single-mother households, those with 3 or 4 children have the highest poverty rate, with 12 households (100.0%) falling below the poverty line.
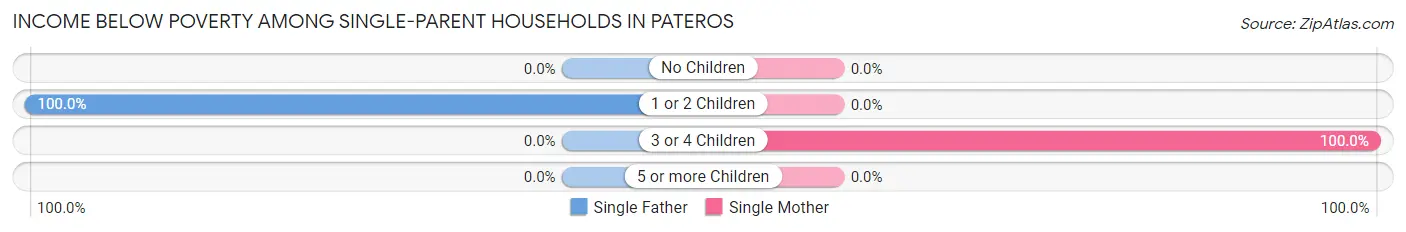
| Children | Single Father | Single Mother |
| No Children | 0 (0.0%) | 0 (0.0%) |
| 1 or 2 Children | 3 (100.0%) | 0 (0.0%) |
| 3 or 4 Children | 0 (0.0%) | 12 (100.0%) |
| 5 or more Children | 0 (0.0%) | 0 (0.0%) |
| Total | 3 (33.3%) | 12 (37.5%) |
Income Below Poverty Among Married-Couple vs Single-Parent Households in Pateros
The poverty data for Pateros shows that 37 of the married-couple family households (28.2%) and 15 of the single-parent households (36.6%) are living below the poverty level. Within the married-couple family households, those with 1 or 2 children have the highest poverty rate, with 37 households (46.8%) falling below the poverty line. Among the single-parent households, those with 3 or 4 children have the highest poverty rate, with 12 household (100.0%) living below poverty.
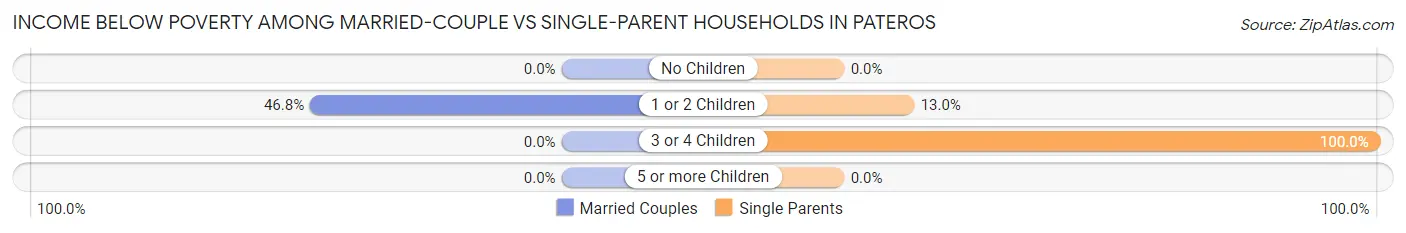
| Children | Married-Couple Families | Single-Parent Households |
| No Children | 0 (0.0%) | 0 (0.0%) |
| 1 or 2 Children | 37 (46.8%) | 3 (13.0%) |
| 3 or 4 Children | 0 (0.0%) | 12 (100.0%) |
| 5 or more Children | 0 (0.0%) | 0 (0.0%) |
| Total | 37 (28.2%) | 15 (36.6%) |
Race in Pateros
The most populous races in Pateros are Hispanic or Latino (328 | 49.1%), Some other Race (298 | 44.6%), and White / Caucasian (296 | 44.3%).
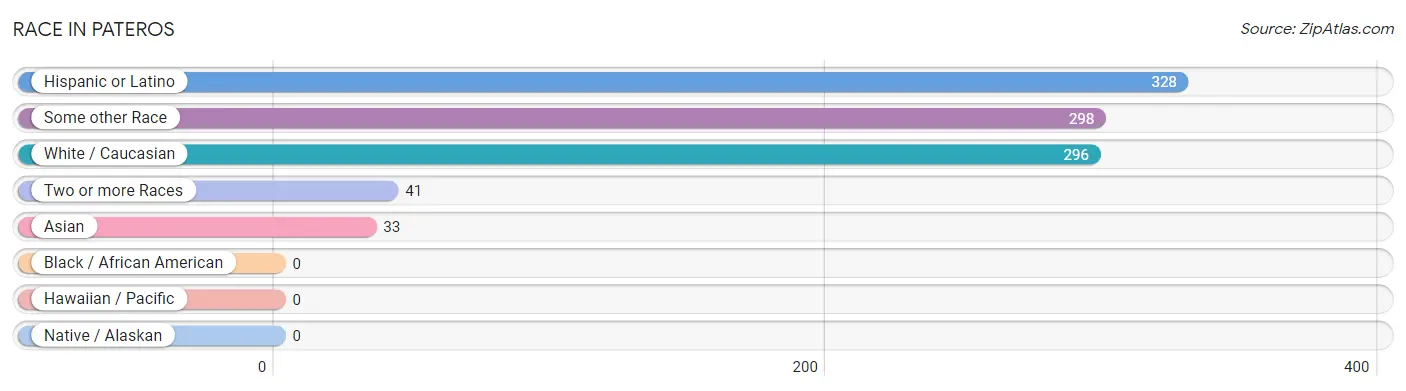
| Race | # Population | % Population |
| Asian | 33 | 4.9% |
| Black / African American | 0 | 0.0% |
| Hawaiian / Pacific | 0 | 0.0% |
| Hispanic or Latino | 328 | 49.1% |
| Native / Alaskan | 0 | 0.0% |
| White / Caucasian | 296 | 44.3% |
| Two or more Races | 41 | 6.1% |
| Some other Race | 298 | 44.6% |
| Total | 668 | 100.0% |
Ancestry in Pateros
The most populous ancestries reported in Pateros are Mexican (328 | 49.1%), German (92 | 13.8%), American (82 | 12.3%), Irish (75 | 11.2%), and Korean (54 | 8.1%), together accounting for 94.5% of all Pateros residents.
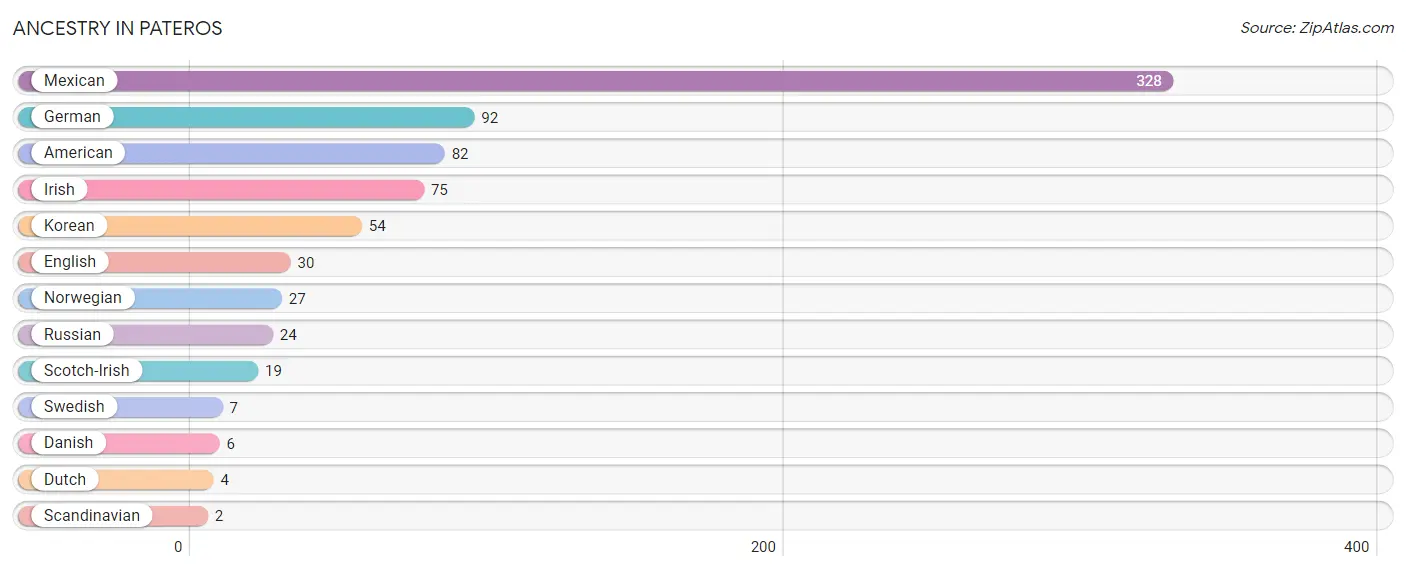
| Ancestry | # Population | % Population |
| American | 82 | 12.3% |
| Danish | 6 | 0.9% |
| Dutch | 4 | 0.6% |
| English | 30 | 4.5% |
| German | 92 | 13.8% |
| Irish | 75 | 11.2% |
| Korean | 54 | 8.1% |
| Mexican | 328 | 49.1% |
| Norwegian | 27 | 4.0% |
| Russian | 24 | 3.6% |
| Scandinavian | 2 | 0.3% |
| Scotch-Irish | 19 | 2.8% |
| Swedish | 7 | 1.1% | View All 13 Rows |
Immigrants in Pateros
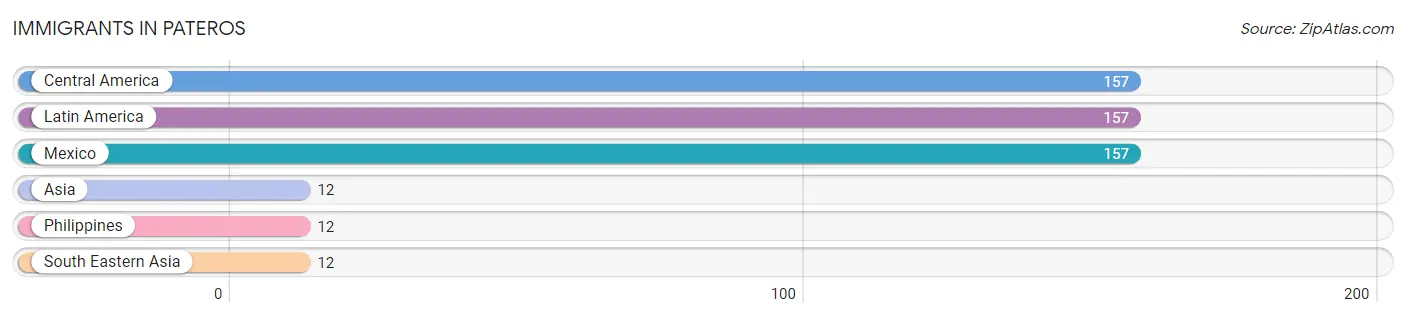
The most numerous immigrant groups reported in Pateros came from Central America (157 | 23.5%), Latin America (157 | 23.5%), Mexico (157 | 23.5%), Asia (12 | 1.8%), and Philippines (12 | 1.8%), together accounting for 74.1% of all Pateros residents.
| Immigration Origin | # Population | % Population |
| Asia | 12 | 1.8% |
| Central America | 157 | 23.5% |
| Latin America | 157 | 23.5% |
| Mexico | 157 | 23.5% |
| Philippines | 12 | 1.8% |
| South Eastern Asia | 12 | 1.8% | View All 6 Rows |
Sex and Age in Pateros
Sex and Age in Pateros
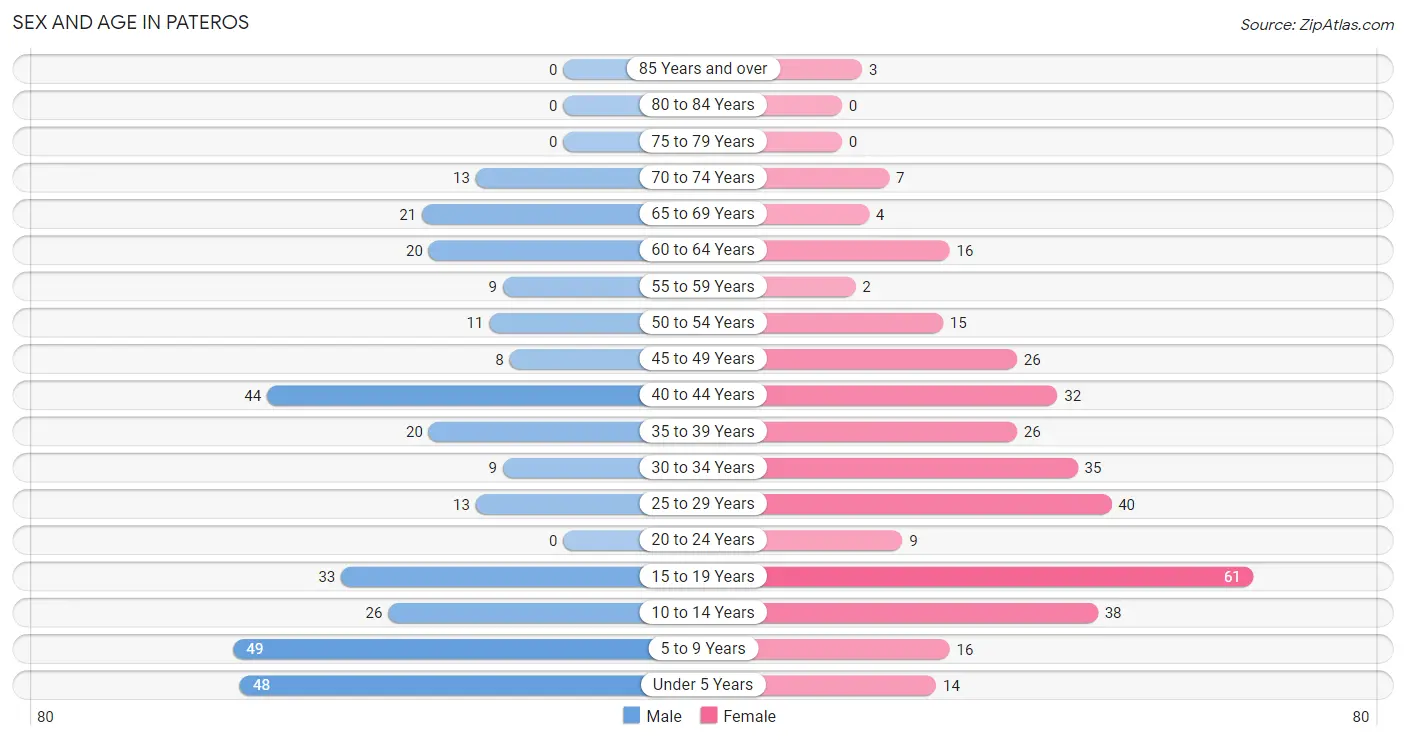
The most populous age groups in Pateros are 5 to 9 Years (49 | 15.1%) for men and 15 to 19 Years (61 | 17.7%) for women.
| Age Bracket | Male | Female |
| Under 5 Years | 48 (14.8%) | 14 (4.1%) |
| 5 to 9 Years | 49 (15.1%) | 16 (4.6%) |
| 10 to 14 Years | 26 (8.0%) | 38 (11.1%) |
| 15 to 19 Years | 33 (10.2%) | 61 (17.7%) |
| 20 to 24 Years | 0 (0.0%) | 9 (2.6%) |
| 25 to 29 Years | 13 (4.0%) | 40 (11.6%) |
| 30 to 34 Years | 9 (2.8%) | 35 (10.2%) |
| 35 to 39 Years | 20 (6.2%) | 26 (7.6%) |
| 40 to 44 Years | 44 (13.6%) | 32 (9.3%) |
| 45 to 49 Years | 8 (2.5%) | 26 (7.6%) |
| 50 to 54 Years | 11 (3.4%) | 15 (4.4%) |
| 55 to 59 Years | 9 (2.8%) | 2 (0.6%) |
| 60 to 64 Years | 20 (6.2%) | 16 (4.6%) |
| 65 to 69 Years | 21 (6.5%) | 4 (1.2%) |
| 70 to 74 Years | 13 (4.0%) | 7 (2.0%) |
| 75 to 79 Years | 0 (0.0%) | 0 (0.0%) |
| 80 to 84 Years | 0 (0.0%) | 0 (0.0%) |
| 85 Years and over | 0 (0.0%) | 3 (0.9%) |
| Total | 324 (100.0%) | 344 (100.0%) |
Families and Households in Pateros
Median Family Size in Pateros
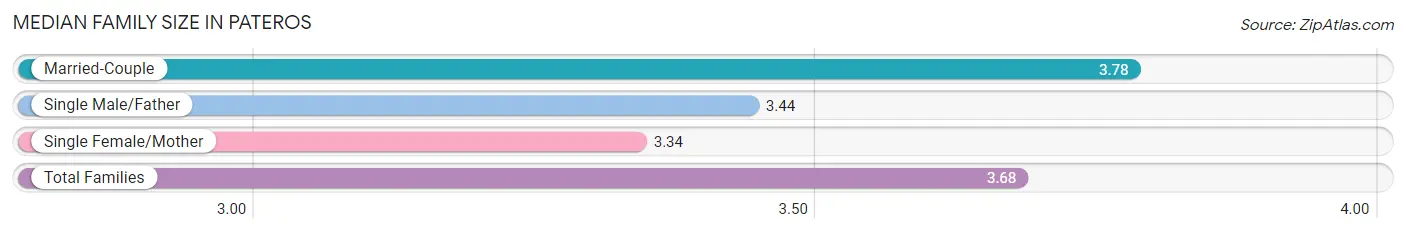
The median family size in Pateros is 3.68 persons per family, with married-couple families (131 | 76.2%) accounting for the largest median family size of 3.78 persons per family. On the other hand, single female/mother families (32 | 18.6%) represent the smallest median family size with 3.34 persons per family.
| Family Type | # Families | Family Size |
| Married-Couple | 131 (76.2%) | 3.78 |
| Single Male/Father | 9 (5.2%) | 3.44 |
| Single Female/Mother | 32 (18.6%) | 3.34 |
| Total Families | 172 (100.0%) | 3.68 |
Median Household Size in Pateros
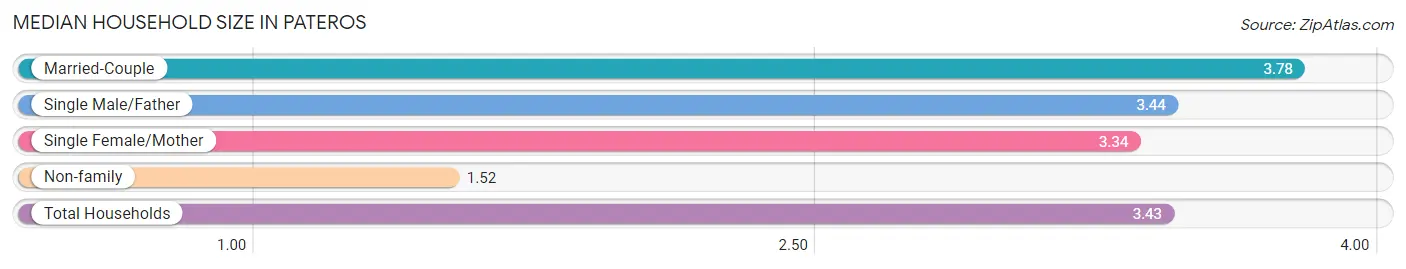
The median household size in Pateros is 3.43 persons per household, with married-couple households (131 | 67.2%) accounting for the largest median household size of 3.78 persons per household. non-family households (23 | 11.8%) represent the smallest median household size with 1.52 persons per household.
| Household Type | # Households | Household Size |
| Married-Couple | 131 (67.2%) | 3.78 |
| Single Male/Father | 9 (4.6%) | 3.44 |
| Single Female/Mother | 32 (16.4%) | 3.34 |
| Non-family | 23 (11.8%) | 1.52 |
| Total Households | 195 (100.0%) | 3.43 |
Household Size by Marriage Status in Pateros
Out of a total of 195 households in Pateros, 172 (88.2%) are family households, while 23 (11.8%) are nonfamily households. The most numerous type of family households are 5-person households, comprising 61, and the most common type of nonfamily households are 1-person households, comprising 13.
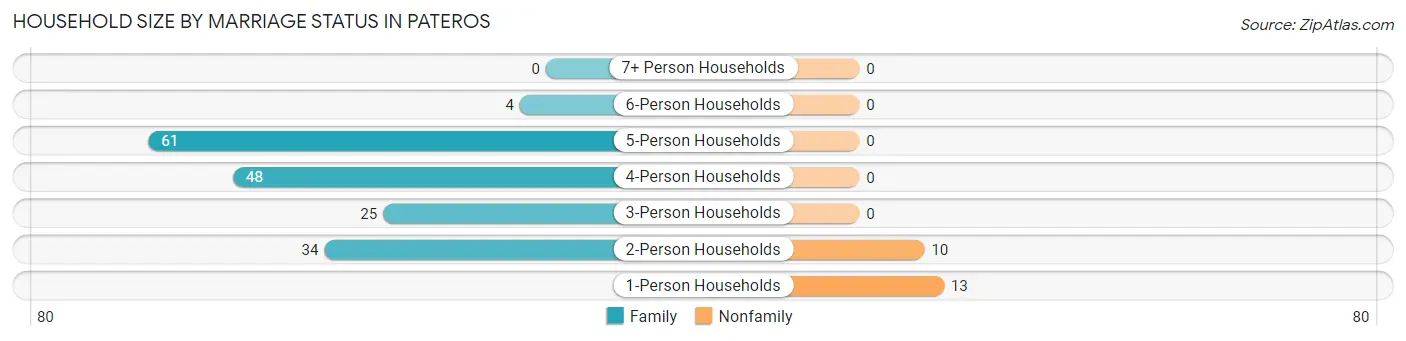
| Household Size | Family Households | Nonfamily Households |
| 1-Person Households | - | 13 (6.7%) |
| 2-Person Households | 34 (17.4%) | 10 (5.1%) |
| 3-Person Households | 25 (12.8%) | 0 (0.0%) |
| 4-Person Households | 48 (24.6%) | 0 (0.0%) |
| 5-Person Households | 61 (31.3%) | 0 (0.0%) |
| 6-Person Households | 4 (2.1%) | 0 (0.0%) |
| 7+ Person Households | 0 (0.0%) | 0 (0.0%) |
| Total | 172 (88.2%) | 23 (11.8%) |
Female Fertility in Pateros
Fertility by Age in Pateros
Average fertility rate in Pateros is 61.0 births per 1,000 women. Women in the age bracket of 35 to 50 years have the highest fertility rate with 107.0 births per 1,000 women. Women in the age bracket of 35 to 50 years acount for 64.3% of all women with births.
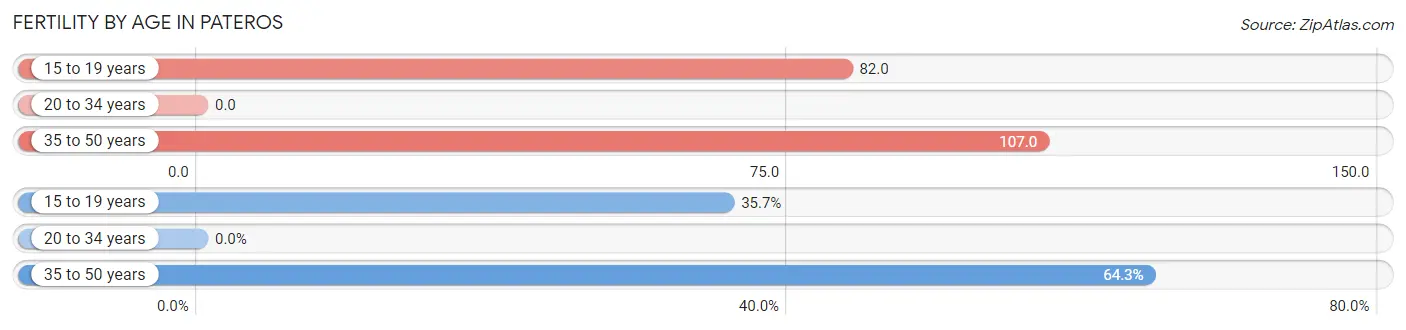
| Age Bracket | Women with Births | Births / 1,000 Women |
| 15 to 19 years | 5 (35.7%) | 82.0 |
| 20 to 34 years | 0 (0.0%) | 0.0 |
| 35 to 50 years | 9 (64.3%) | 107.0 |
| Total | 14 (100.0%) | 61.0 |
Fertility by Age by Marriage Status in Pateros
64.3% of women with births (14) in Pateros are married. The highest percentage of unmarried women with births falls into 15 to 19 years age bracket with 100.0% of them unmarried at the time of birth, while the lowest percentage of unmarried women with births belong to 35 to 50 years age bracket with 0.0% of them unmarried.
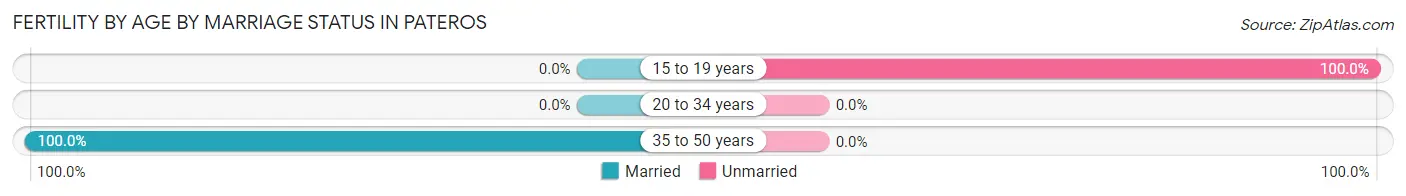
| Age Bracket | Married | Unmarried |
| 15 to 19 years | 0 (0.0%) | 5 (100.0%) |
| 20 to 34 years | 0 (0.0%) | 0 (0.0%) |
| 35 to 50 years | 9 (100.0%) | 0 (0.0%) |
| Total | 9 (64.3%) | 5 (35.7%) |
Fertility by Education in Pateros
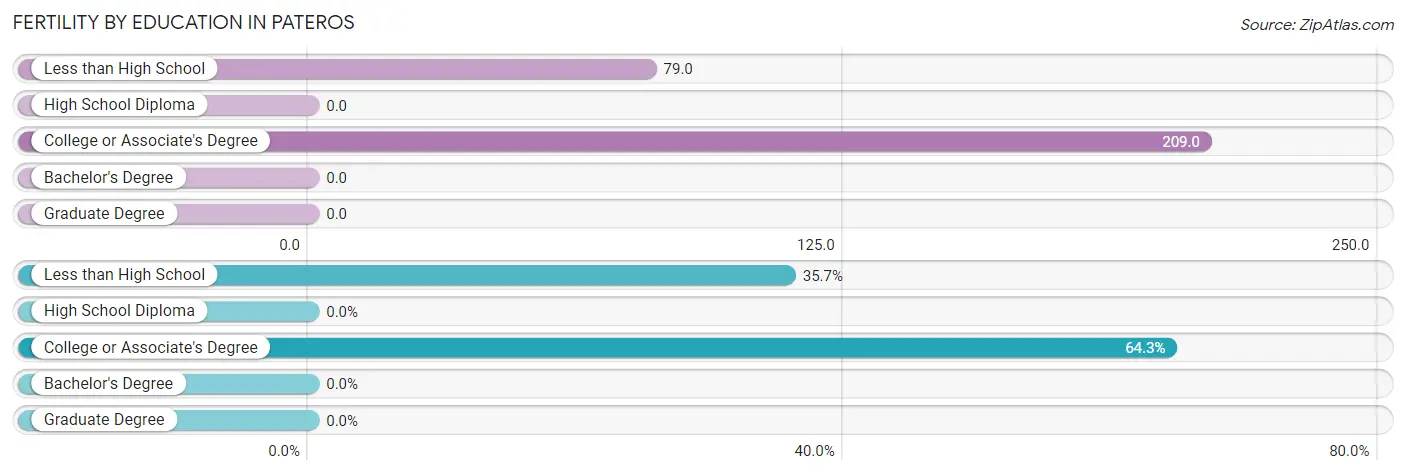
| Educational Attainment | Women with Births | Births / 1,000 Women |
| Less than High School | 5 (35.7%) | 79.0 |
| High School Diploma | 0 (0.0%) | 0.0 |
| College or Associate's Degree | 9 (64.3%) | 209.0 |
| Bachelor's Degree | 0 (0.0%) | 0.0 |
| Graduate Degree | 0 (0.0%) | 0.0 |
| Total | 14 (100.0%) | 61.0 |
Fertility by Education by Marriage Status in Pateros
35.7% of women with births in Pateros are unmarried. Women with the educational attainment of college or associate's degree are most likely to be married with 100.0% of them married at childbirth, while women with the educational attainment of less than high school are least likely to be married with 100.0% of them unmarried at childbirth.
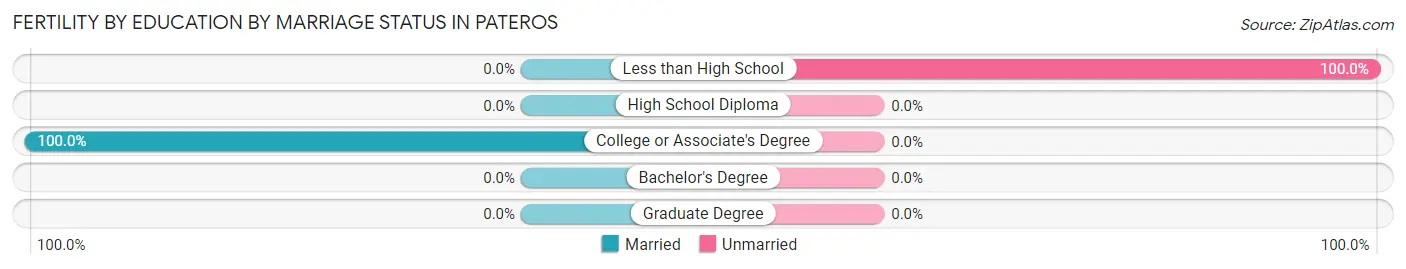
| Educational Attainment | Married | Unmarried |
| Less than High School | 0 (0.0%) | 5 (100.0%) |
| High School Diploma | 0 (0.0%) | 0 (0.0%) |
| College or Associate's Degree | 9 (100.0%) | 0 (0.0%) |
| Bachelor's Degree | 0 (0.0%) | 0 (0.0%) |
| Graduate Degree | 0 (0.0%) | 0 (0.0%) |
| Total | 9 (64.3%) | 5 (35.7%) |
Employment Characteristics in Pateros
Employment by Class of Employer in Pateros
Among the 255 employed individuals in Pateros, private company employees (176 | 69.0%), local government employees (28 | 11.0%), and not-for-profit organizations (23 | 9.0%) make up the most common classes of employment.
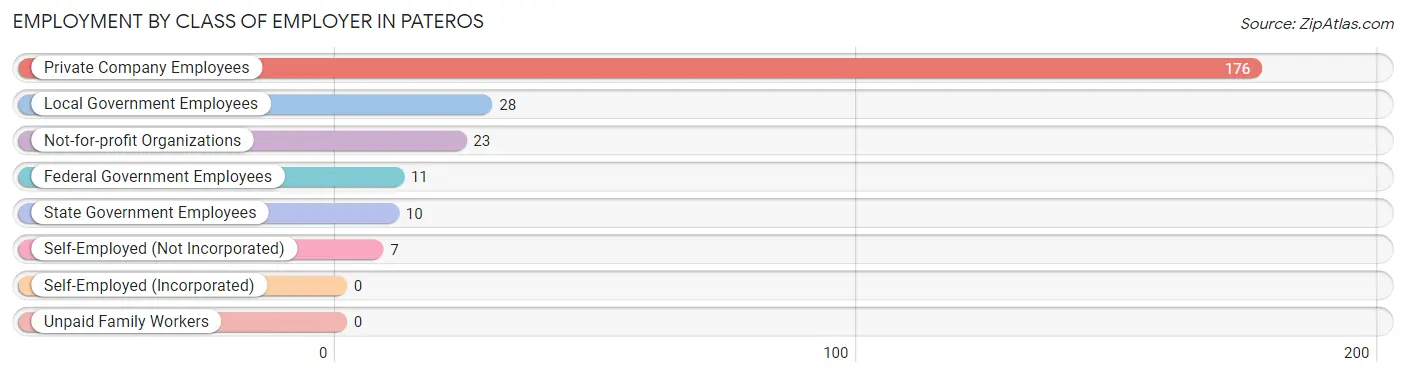
| Employer Class | # Employees | % Employees |
| Private Company Employees | 176 | 69.0% |
| Self-Employed (Incorporated) | 0 | 0.0% |
| Self-Employed (Not Incorporated) | 7 | 2.8% |
| Not-for-profit Organizations | 23 | 9.0% |
| Local Government Employees | 28 | 11.0% |
| State Government Employees | 10 | 3.9% |
| Federal Government Employees | 11 | 4.3% |
| Unpaid Family Workers | 0 | 0.0% |
| Total | 255 | 100.0% |
Employment Status by Age in Pateros
According to the labor force statistics for Pateros, out of the total population over 16 years of age (451), 67.2% or 303 individuals are in the labor force, with 11.2% or 34 of them unemployed. The age group with the highest labor force participation rate is 20 to 24 years, with 100.0% or 9 individuals in the labor force. Within the labor force, the 16 to 19 years age range has the highest percentage of unemployed individuals, with 100.0% or 25 of them being unemployed.
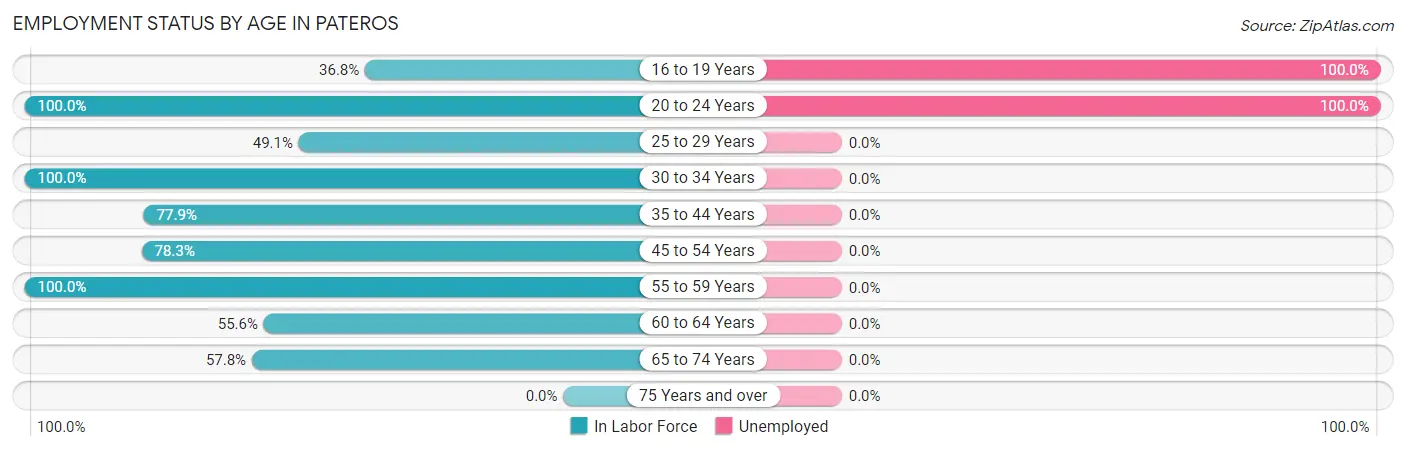
| Age Bracket | In Labor Force | Unemployed |
| 16 to 19 Years | 25 (36.8%) | 25 (100.0%) |
| 20 to 24 Years | 9 (100.0%) | 9 (100.0%) |
| 25 to 29 Years | 26 (49.1%) | 0 (0.0%) |
| 30 to 34 Years | 44 (100.0%) | 0 (0.0%) |
| 35 to 44 Years | 95 (77.9%) | 0 (0.0%) |
| 45 to 54 Years | 47 (78.3%) | 0 (0.0%) |
| 55 to 59 Years | 11 (100.0%) | 0 (0.0%) |
| 60 to 64 Years | 20 (55.6%) | 0 (0.0%) |
| 65 to 74 Years | 26 (57.8%) | 0 (0.0%) |
| 75 Years and over | 0 (0.0%) | 0 (0.0%) |
| Total | 303 (67.2%) | 34 (11.2%) |
Employment Status by Educational Attainment in Pateros
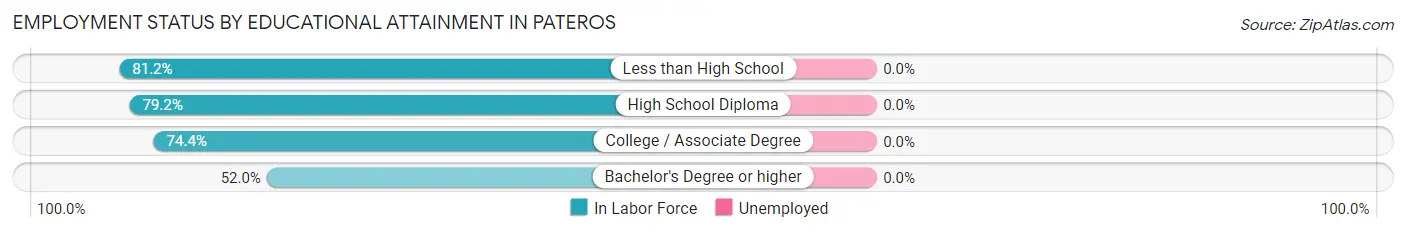
| Educational Attainment | In Labor Force | Unemployed |
| Less than High School | 95 (81.2%) | 0 (0.0%) |
| High School Diploma | 61 (79.2%) | 0 (0.0%) |
| College / Associate Degree | 61 (74.4%) | 0 (0.0%) |
| Bachelor's Degree or higher | 26 (52.0%) | 0 (0.0%) |
| Total | 243 (74.5%) | 0 (0.0%) |
Employment Occupations by Sex in Pateros
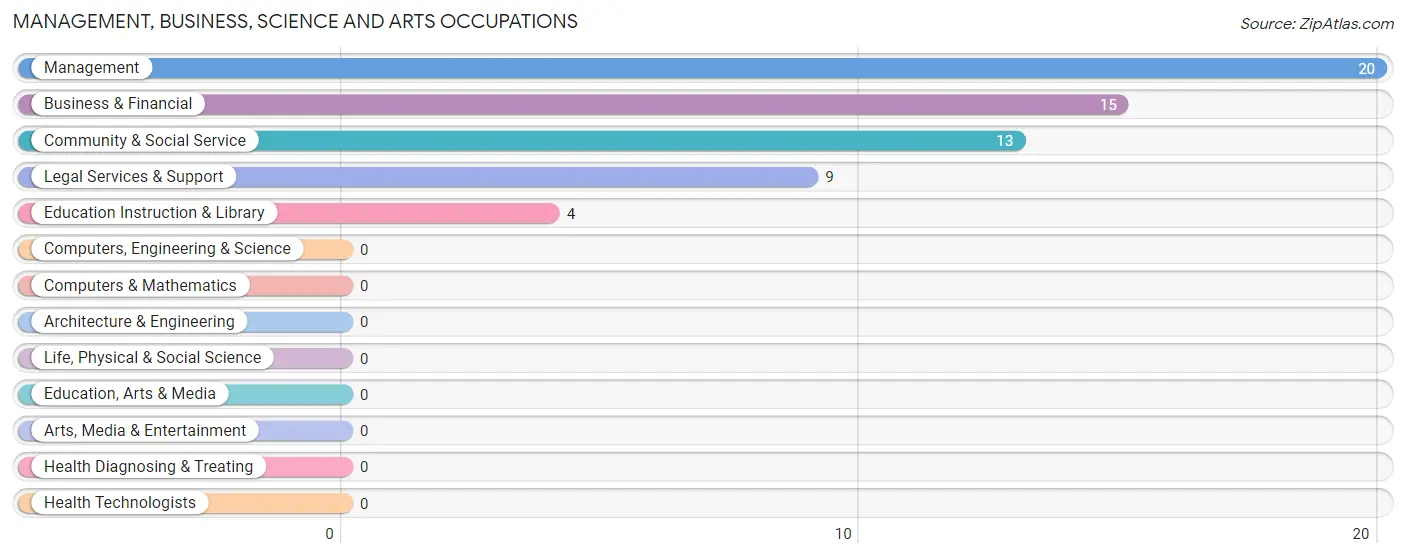
Management, Business, Science and Arts Occupations
The most common Management, Business, Science and Arts occupations in Pateros are Management (20 | 7.4%), Business & Financial (15 | 5.6%), Community & Social Service (13 | 4.8%), Legal Services & Support (9 | 3.4%), and Education Instruction & Library (4 | 1.5%).
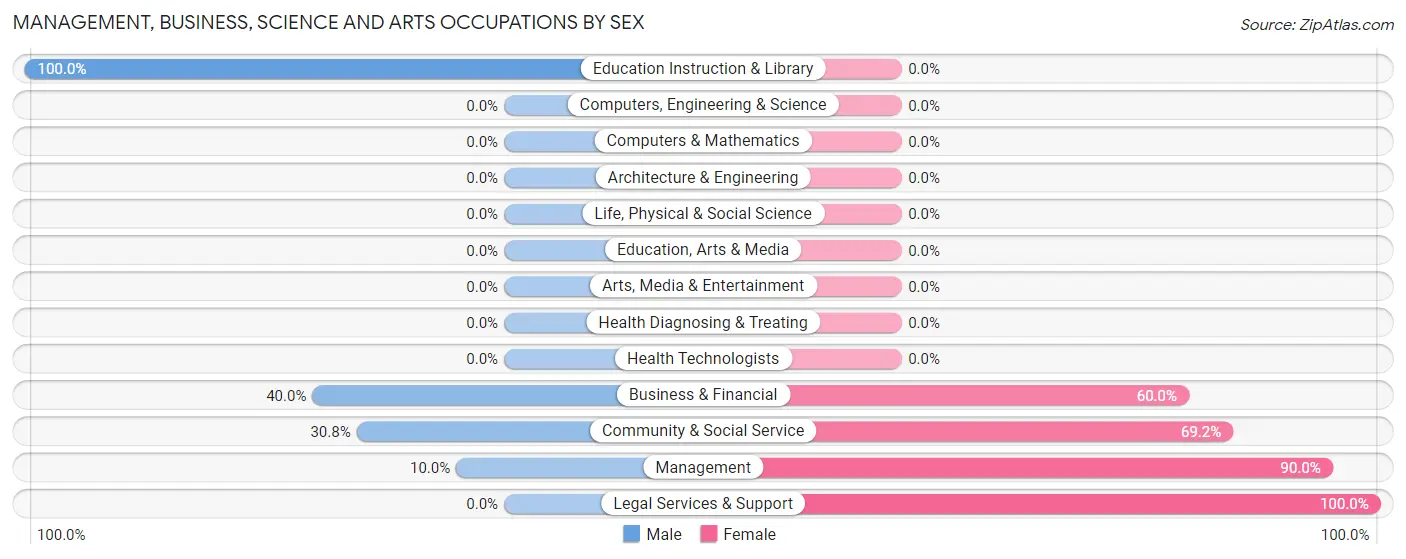
Management, Business, Science and Arts Occupations by Sex
Within the Management, Business, Science and Arts occupations in Pateros, the most male-oriented occupations are Education Instruction & Library (100.0%), Business & Financial (40.0%), and Community & Social Service (30.8%), while the most female-oriented occupations are Legal Services & Support (100.0%), Management (90.0%), and Community & Social Service (69.2%).
| Occupation | Male | Female |
| Management | 2 (10.0%) | 18 (90.0%) |
| Business & Financial | 6 (40.0%) | 9 (60.0%) |
| Computers, Engineering & Science | 0 (0.0%) | 0 (0.0%) |
| Computers & Mathematics | 0 (0.0%) | 0 (0.0%) |
| Architecture & Engineering | 0 (0.0%) | 0 (0.0%) |
| Life, Physical & Social Science | 0 (0.0%) | 0 (0.0%) |
| Community & Social Service | 4 (30.8%) | 9 (69.2%) |
| Education, Arts & Media | 0 (0.0%) | 0 (0.0%) |
| Legal Services & Support | 0 (0.0%) | 9 (100.0%) |
| Education Instruction & Library | 4 (100.0%) | 0 (0.0%) |
| Arts, Media & Entertainment | 0 (0.0%) | 0 (0.0%) |
| Health Diagnosing & Treating | 0 (0.0%) | 0 (0.0%) |
| Health Technologists | 0 (0.0%) | 0 (0.0%) |
| Total (Category) | 12 (25.0%) | 36 (75.0%) |
| Total (Overall) | 142 (52.8%) | 127 (47.2%) |
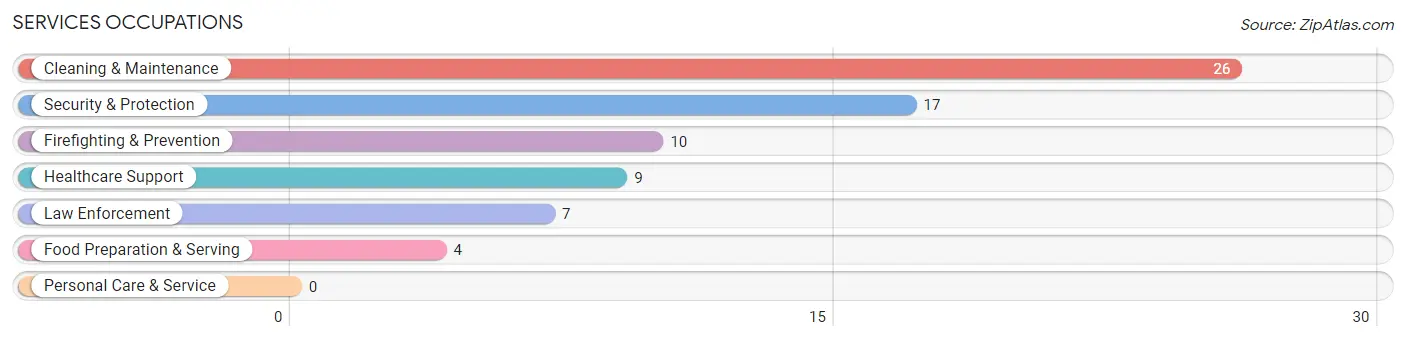
Services Occupations
The most common Services occupations in Pateros are Cleaning & Maintenance (26 | 9.7%), Security & Protection (17 | 6.3%), Firefighting & Prevention (10 | 3.7%), Healthcare Support (9 | 3.4%), and Law Enforcement (7 | 2.6%).
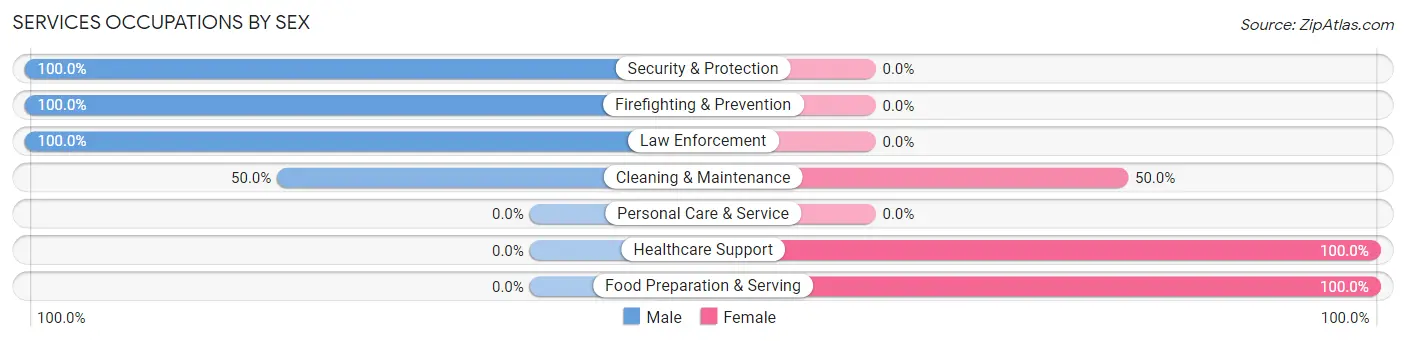
Services Occupations by Sex
Within the Services occupations in Pateros, the most male-oriented occupations are Security & Protection (100.0%), Firefighting & Prevention (100.0%), and Law Enforcement (100.0%), while the most female-oriented occupations are Healthcare Support (100.0%), Food Preparation & Serving (100.0%), and Cleaning & Maintenance (50.0%).
| Occupation | Male | Female |
| Healthcare Support | 0 (0.0%) | 9 (100.0%) |
| Security & Protection | 17 (100.0%) | 0 (0.0%) |
| Firefighting & Prevention | 10 (100.0%) | 0 (0.0%) |
| Law Enforcement | 7 (100.0%) | 0 (0.0%) |
| Food Preparation & Serving | 0 (0.0%) | 4 (100.0%) |
| Cleaning & Maintenance | 13 (50.0%) | 13 (50.0%) |
| Personal Care & Service | 0 (0.0%) | 0 (0.0%) |
| Total (Category) | 30 (53.6%) | 26 (46.4%) |
| Total (Overall) | 142 (52.8%) | 127 (47.2%) |
Sales and Office Occupations
The most common Sales and Office occupations in Pateros are Sales & Related (21 | 7.8%), and Office & Administration (18 | 6.7%).

Sales and Office Occupations by Sex

| Occupation | Male | Female |
| Sales & Related | 6 (28.6%) | 15 (71.4%) |
| Office & Administration | 0 (0.0%) | 18 (100.0%) |
| Total (Category) | 6 (15.4%) | 33 (84.6%) |
| Total (Overall) | 142 (52.8%) | 127 (47.2%) |
Natural Resources, Construction and Maintenance Occupations
The most common Natural Resources, Construction and Maintenance occupations in Pateros are Construction & Extraction (43 | 16.0%), Farming, Fishing & Forestry (35 | 13.0%), and Installation, Maintenance & Repair (8 | 3.0%).
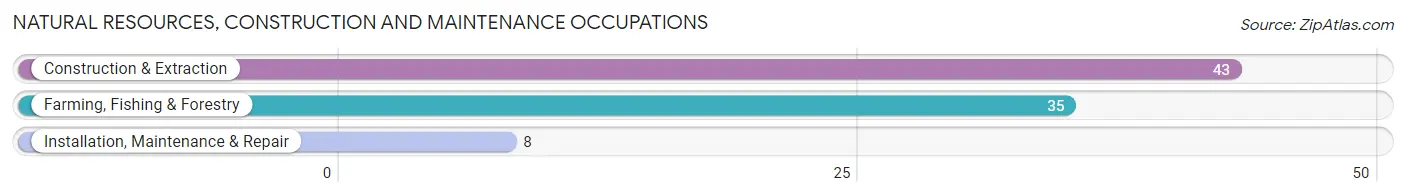
Natural Resources, Construction and Maintenance Occupations by Sex

| Occupation | Male | Female |
| Farming, Fishing & Forestry | 29 (82.9%) | 6 (17.1%) |
| Construction & Extraction | 43 (100.0%) | 0 (0.0%) |
| Installation, Maintenance & Repair | 8 (100.0%) | 0 (0.0%) |
| Total (Category) | 80 (93.0%) | 6 (7.0%) |
| Total (Overall) | 142 (52.8%) | 127 (47.2%) |
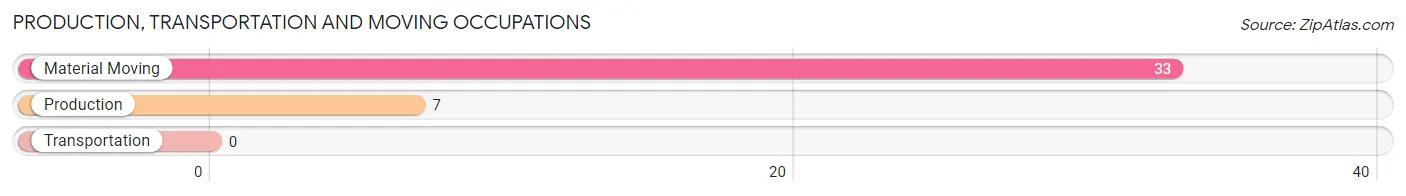
Production, Transportation and Moving Occupations
The most common Production, Transportation and Moving occupations in Pateros are Material Moving (33 | 12.3%), and Production (7 | 2.6%).
Production, Transportation and Moving Occupations by Sex
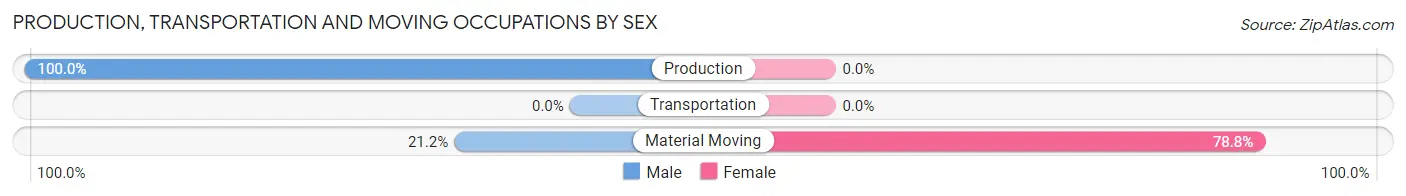
| Occupation | Male | Female |
| Production | 7 (100.0%) | 0 (0.0%) |
| Transportation | 0 (0.0%) | 0 (0.0%) |
| Material Moving | 7 (21.2%) | 26 (78.8%) |
| Total (Category) | 14 (35.0%) | 26 (65.0%) |
| Total (Overall) | 142 (52.8%) | 127 (47.2%) |
Employment Industries by Sex in Pateros
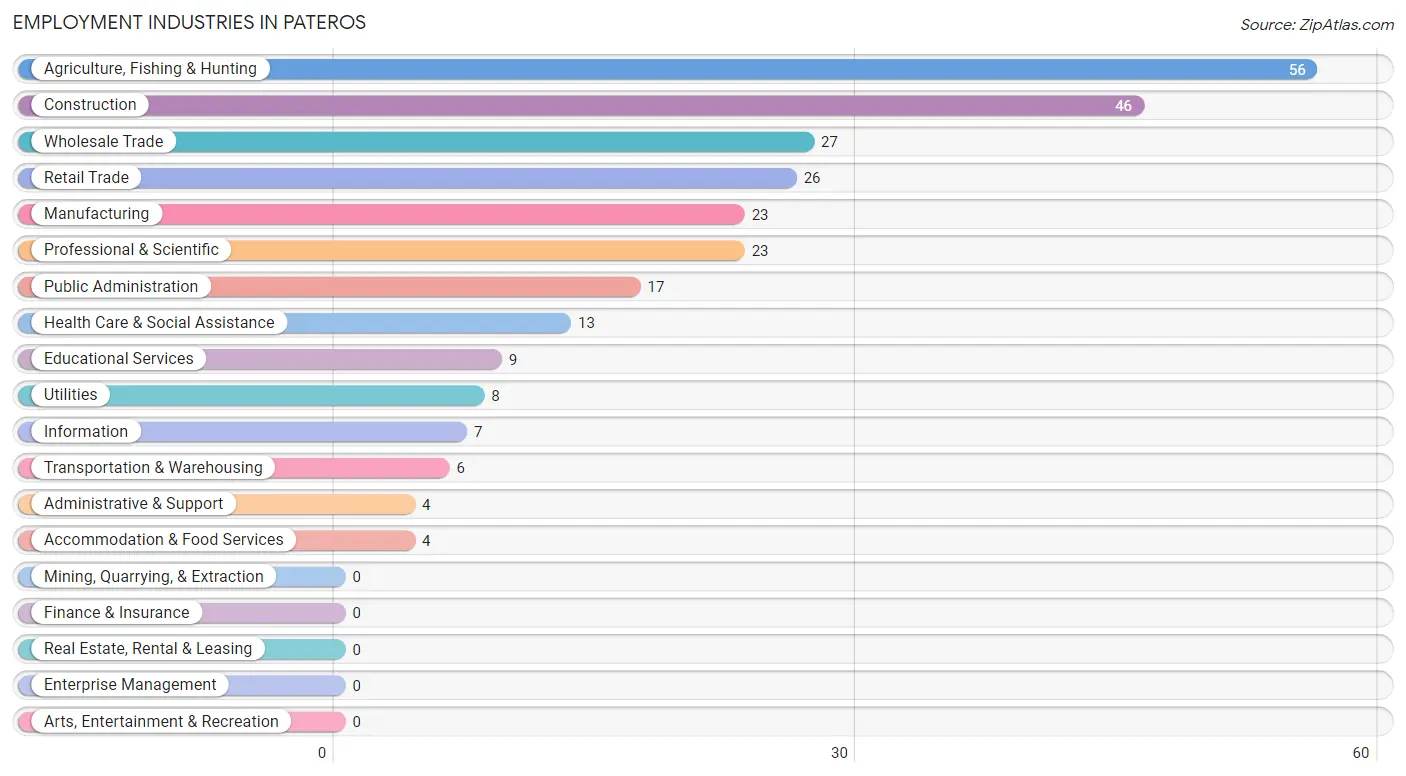
Employment Industries in Pateros
The major employment industries in Pateros include Agriculture, Fishing & Hunting (56 | 20.8%), Construction (46 | 17.1%), Wholesale Trade (27 | 10.0%), Retail Trade (26 | 9.7%), and Manufacturing (23 | 8.6%).
Employment Industries by Sex in Pateros
The Pateros industries that see more men than women are Utilities (100.0%), Administrative & Support (100.0%), and Educational Services (100.0%), whereas the industries that tend to have a higher number of women are Manufacturing (100.0%), Wholesale Trade (100.0%), and Transportation & Warehousing (100.0%).
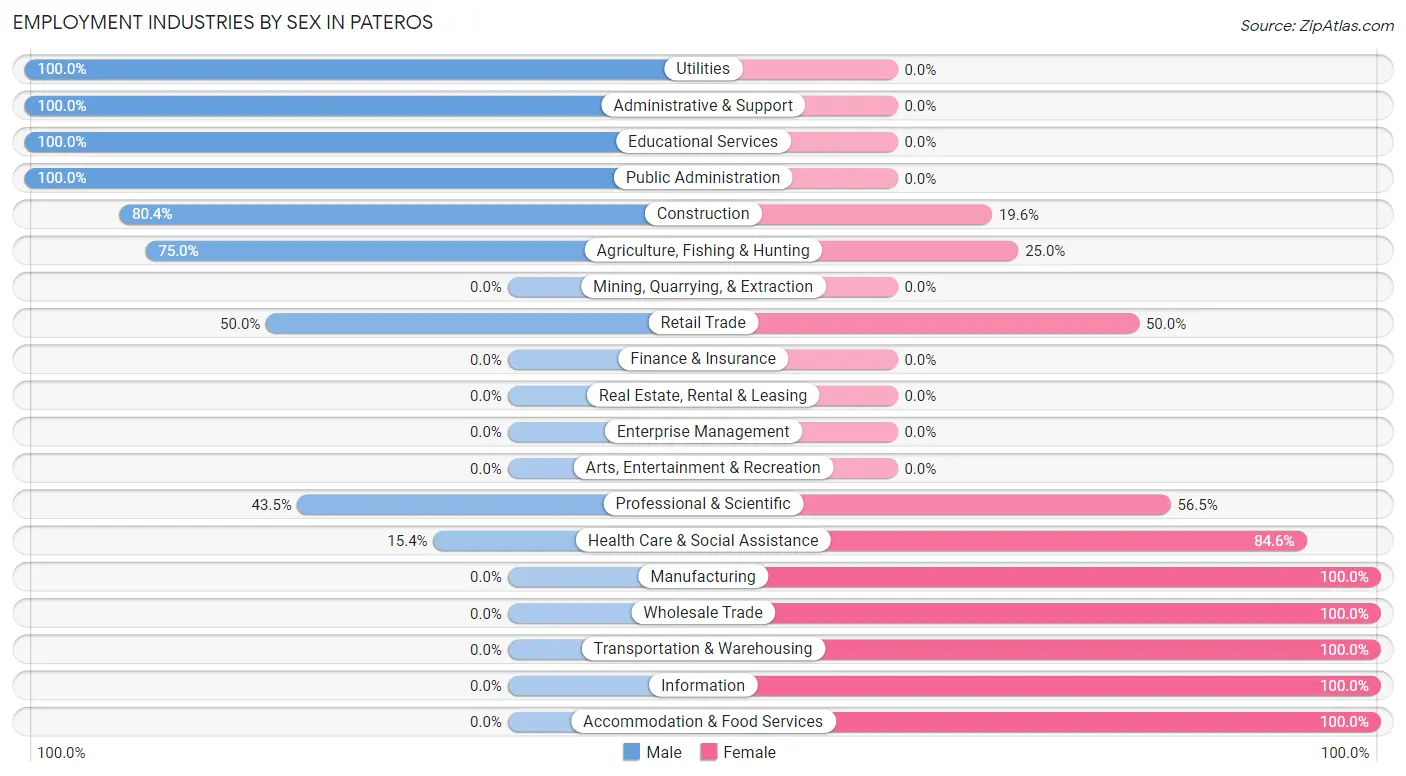
| Industry | Male | Female |
| Agriculture, Fishing & Hunting | 42 (75.0%) | 14 (25.0%) |
| Mining, Quarrying, & Extraction | 0 (0.0%) | 0 (0.0%) |
| Construction | 37 (80.4%) | 9 (19.6%) |
| Manufacturing | 0 (0.0%) | 23 (100.0%) |
| Wholesale Trade | 0 (0.0%) | 27 (100.0%) |
| Retail Trade | 13 (50.0%) | 13 (50.0%) |
| Transportation & Warehousing | 0 (0.0%) | 6 (100.0%) |
| Utilities | 8 (100.0%) | 0 (0.0%) |
| Information | 0 (0.0%) | 7 (100.0%) |
| Finance & Insurance | 0 (0.0%) | 0 (0.0%) |
| Real Estate, Rental & Leasing | 0 (0.0%) | 0 (0.0%) |
| Professional & Scientific | 10 (43.5%) | 13 (56.5%) |
| Enterprise Management | 0 (0.0%) | 0 (0.0%) |
| Administrative & Support | 4 (100.0%) | 0 (0.0%) |
| Educational Services | 9 (100.0%) | 0 (0.0%) |
| Health Care & Social Assistance | 2 (15.4%) | 11 (84.6%) |
| Arts, Entertainment & Recreation | 0 (0.0%) | 0 (0.0%) |
| Accommodation & Food Services | 0 (0.0%) | 4 (100.0%) |
| Public Administration | 17 (100.0%) | 0 (0.0%) |
| Total | 142 (52.8%) | 127 (47.2%) |
Education in Pateros
School Enrollment in Pateros
The most common levels of schooling among the 229 students in Pateros are high school (79 | 34.5%), middle school (51 | 22.3%), and elementary school (30 | 13.1%).
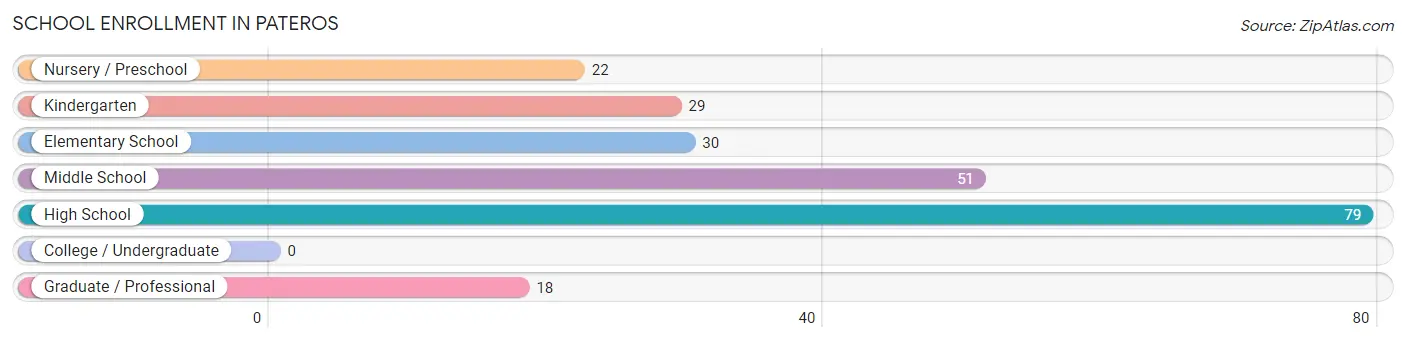
| School Level | # Students | % Students |
| Nursery / Preschool | 22 | 9.6% |
| Kindergarten | 29 | 12.7% |
| Elementary School | 30 | 13.1% |
| Middle School | 51 | 22.3% |
| High School | 79 | 34.5% |
| College / Undergraduate | 0 | 0.0% |
| Graduate / Professional | 18 | 7.9% |
| Total | 229 | 100.0% |
School Enrollment by Age by Funding Source in Pateros
Out of a total of 229 students who are enrolled in schools in Pateros, 16 (7.0%) attend a private institution, while the remaining 213 (93.0%) are enrolled in public schools. The age group of 3 to 4 year olds has the highest likelihood of being enrolled in private schools, with 16 (100.0% in the age bracket) enrolled. Conversely, the age group of 5 to 9 year old has the lowest likelihood of being enrolled in a private school, with 65 (100.0% in the age bracket) attending a public institution.
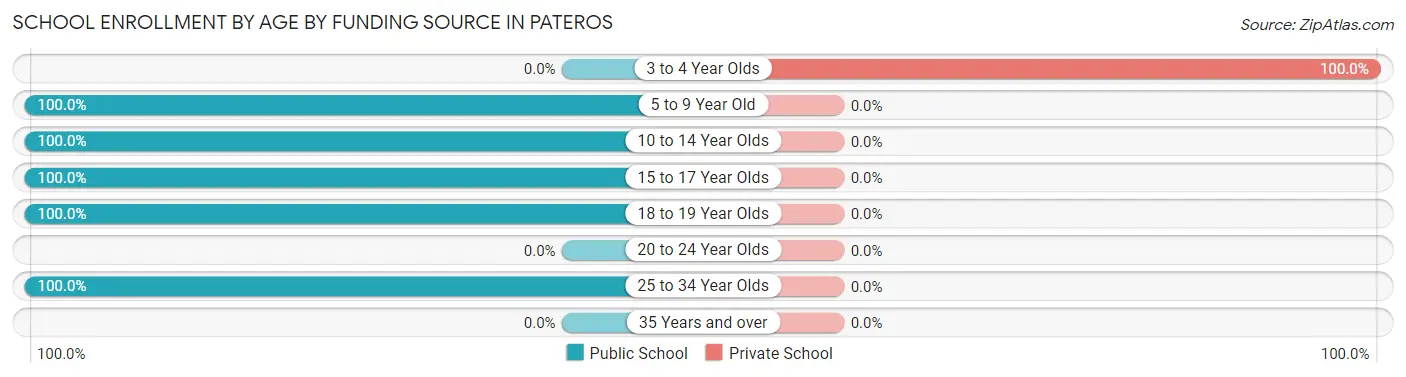
| Age Bracket | Public School | Private School |
| 3 to 4 Year Olds | 0 (0.0%) | 16 (100.0%) |
| 5 to 9 Year Old | 65 (100.0%) | 0 (0.0%) |
| 10 to 14 Year Olds | 64 (100.0%) | 0 (0.0%) |
| 15 to 17 Year Olds | 31 (100.0%) | 0 (0.0%) |
| 18 to 19 Year Olds | 35 (100.0%) | 0 (0.0%) |
| 20 to 24 Year Olds | 0 (0.0%) | 0 (0.0%) |
| 25 to 34 Year Olds | 18 (100.0%) | 0 (0.0%) |
| 35 Years and over | 0 (0.0%) | 0 (0.0%) |
| Total | 213 (93.0%) | 16 (7.0%) |
Educational Attainment by Field of Study in Pateros
Business (21 | 42.0%), education (20 | 40.0%), bio, nature & agricultural (7 | 14.0%), and arts & humanities (2 | 4.0%) are the most common fields of study among 50 individuals in Pateros who have obtained a bachelor's degree or higher.
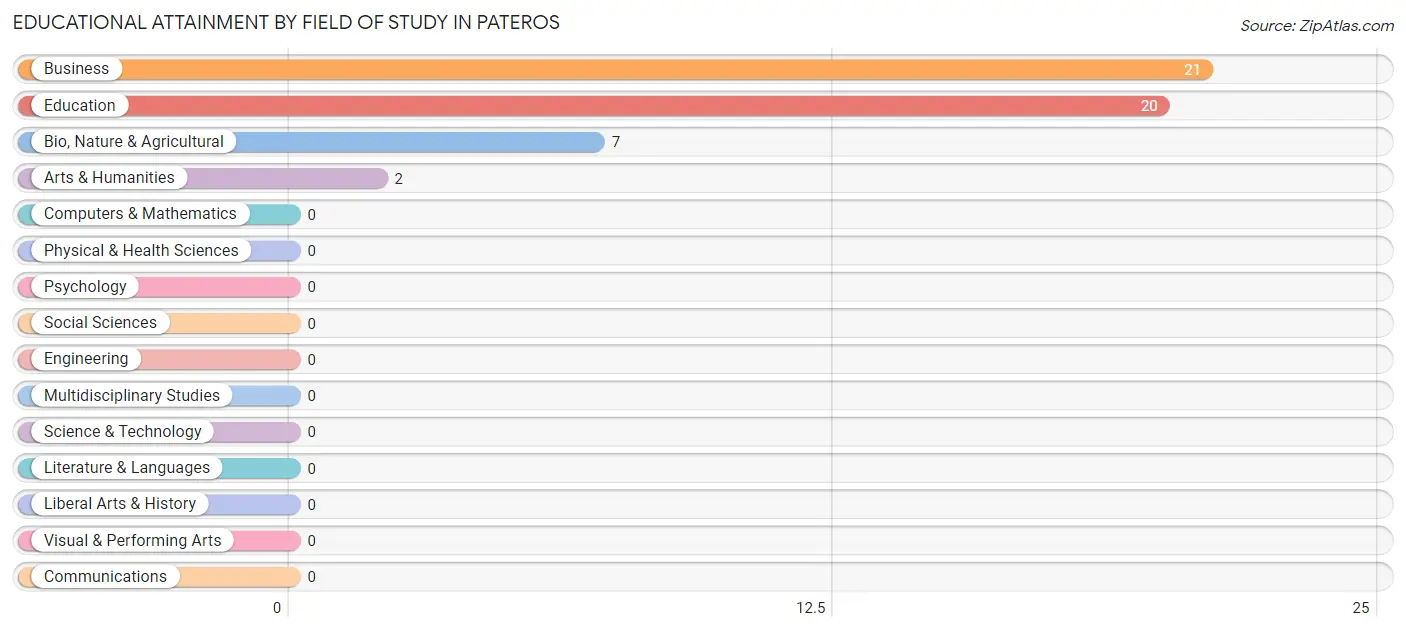
| Field of Study | # Graduates | % Graduates |
| Computers & Mathematics | 0 | 0.0% |
| Bio, Nature & Agricultural | 7 | 14.0% |
| Physical & Health Sciences | 0 | 0.0% |
| Psychology | 0 | 0.0% |
| Social Sciences | 0 | 0.0% |
| Engineering | 0 | 0.0% |
| Multidisciplinary Studies | 0 | 0.0% |
| Science & Technology | 0 | 0.0% |
| Business | 21 | 42.0% |
| Education | 20 | 40.0% |
| Literature & Languages | 0 | 0.0% |
| Liberal Arts & History | 0 | 0.0% |
| Visual & Performing Arts | 0 | 0.0% |
| Communications | 0 | 0.0% |
| Arts & Humanities | 2 | 4.0% |
| Total | 50 | 100.0% |
Transportation & Commute in Pateros
Vehicle Availability by Sex in Pateros
The most prevalent vehicle ownership categories in Pateros are males with 3 vehicles (88, accounting for 65.2%) and females with 3 vehicles (45, making up 73.3%).
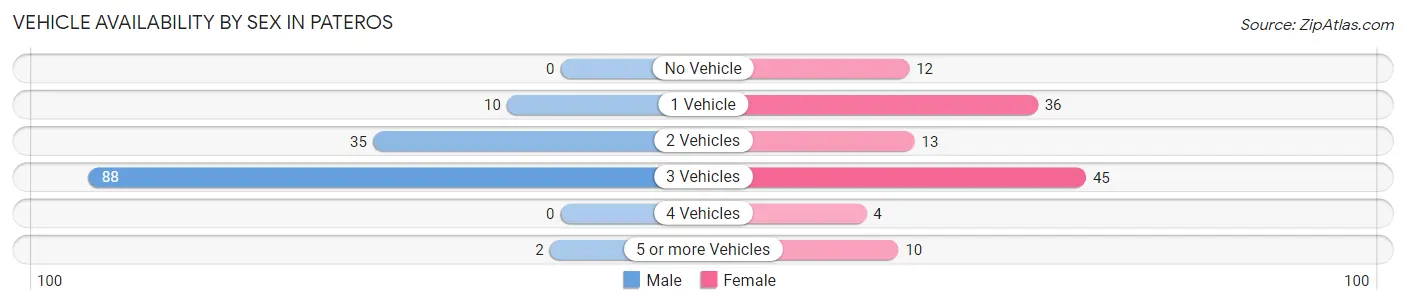
| Vehicles Available | Male | Female |
| No Vehicle | 0 (0.0%) | 12 (10.0%) |
| 1 Vehicle | 10 (7.4%) | 36 (30.0%) |
| 2 Vehicles | 35 (25.9%) | 13 (10.8%) |
| 3 Vehicles | 88 (65.2%) | 45 (37.5%) |
| 4 Vehicles | 0 (0.0%) | 4 (3.3%) |
| 5 or more Vehicles | 2 (1.5%) | 10 (8.3%) |
| Total | 135 (100.0%) | 120 (100.0%) |
Commute Time in Pateros
The most frequently occuring commute durations in Pateros are 25 to 29 minutes (53 commuters, 22.4%), 10 to 14 minutes (44 commuters, 18.6%), and less than 5 minutes (34 commuters, 14.3%).
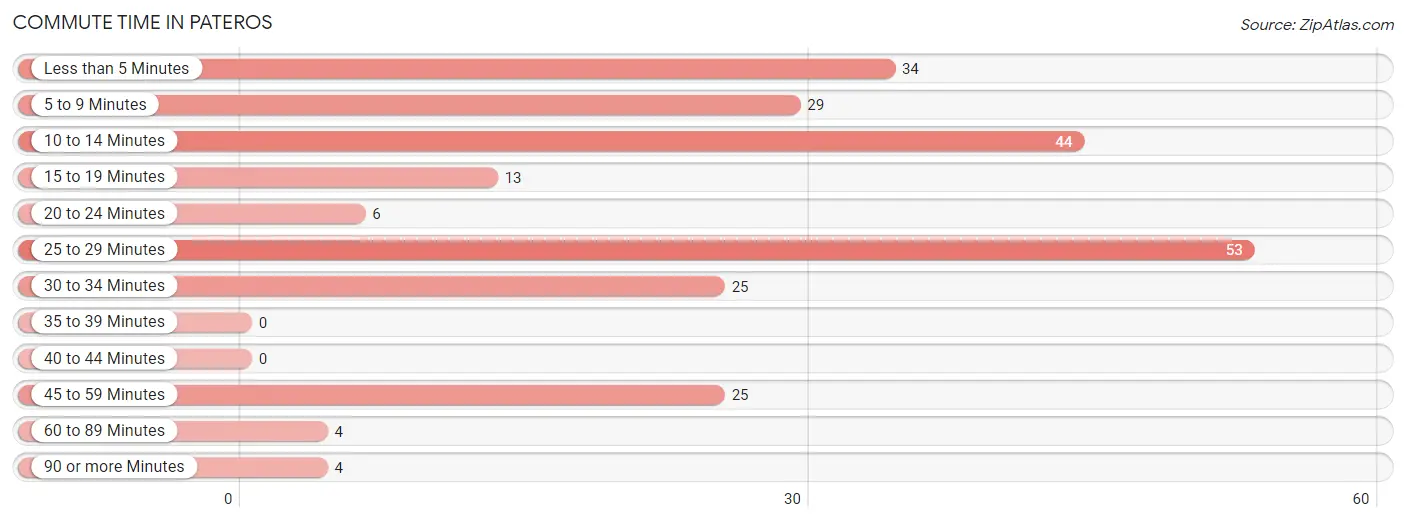
| Commute Time | # Commuters | % Commuters |
| Less than 5 Minutes | 34 | 14.3% |
| 5 to 9 Minutes | 29 | 12.2% |
| 10 to 14 Minutes | 44 | 18.6% |
| 15 to 19 Minutes | 13 | 5.5% |
| 20 to 24 Minutes | 6 | 2.5% |
| 25 to 29 Minutes | 53 | 22.4% |
| 30 to 34 Minutes | 25 | 10.5% |
| 35 to 39 Minutes | 0 | 0.0% |
| 40 to 44 Minutes | 0 | 0.0% |
| 45 to 59 Minutes | 25 | 10.5% |
| 60 to 89 Minutes | 4 | 1.7% |
| 90 or more Minutes | 4 | 1.7% |
Commute Time by Sex in Pateros
The most common commute times in Pateros are 25 to 29 minutes (37 commuters, 27.4%) for males and 30 to 34 minutes (25 commuters, 24.5%) for females.
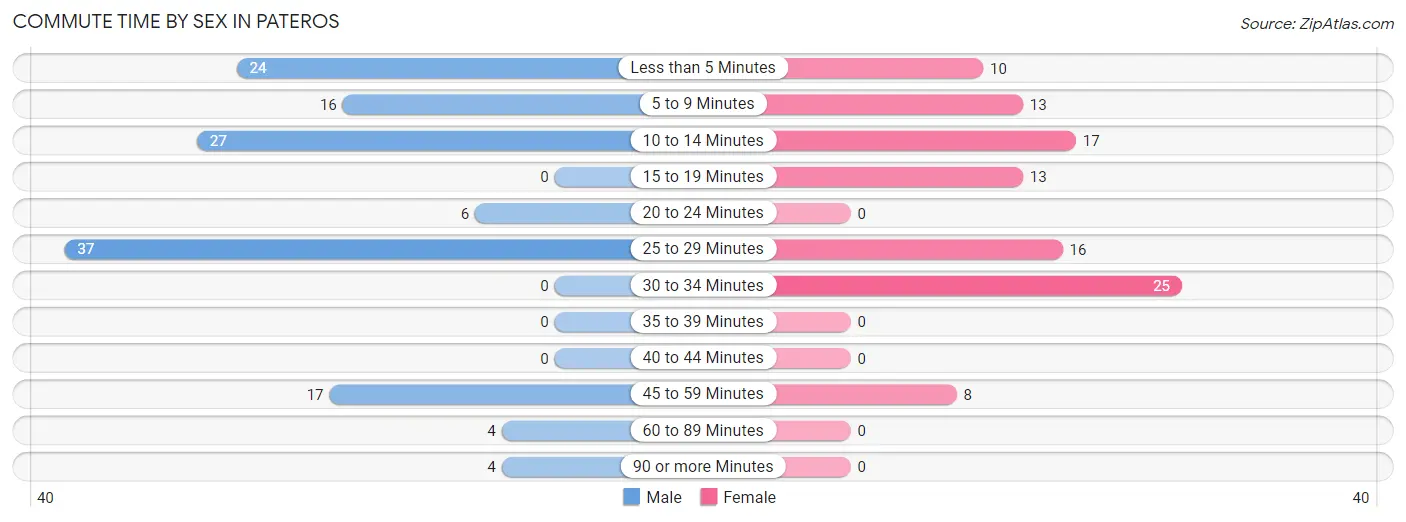
| Commute Time | Male | Female |
| Less than 5 Minutes | 24 (17.8%) | 10 (9.8%) |
| 5 to 9 Minutes | 16 (11.8%) | 13 (12.8%) |
| 10 to 14 Minutes | 27 (20.0%) | 17 (16.7%) |
| 15 to 19 Minutes | 0 (0.0%) | 13 (12.8%) |
| 20 to 24 Minutes | 6 (4.4%) | 0 (0.0%) |
| 25 to 29 Minutes | 37 (27.4%) | 16 (15.7%) |
| 30 to 34 Minutes | 0 (0.0%) | 25 (24.5%) |
| 35 to 39 Minutes | 0 (0.0%) | 0 (0.0%) |
| 40 to 44 Minutes | 0 (0.0%) | 0 (0.0%) |
| 45 to 59 Minutes | 17 (12.6%) | 8 (7.8%) |
| 60 to 89 Minutes | 4 (3.0%) | 0 (0.0%) |
| 90 or more Minutes | 4 (3.0%) | 0 (0.0%) |
Time of Departure to Work by Sex in Pateros
The most frequent times of departure to work in Pateros are 6:30 AM to 6:59 AM (46, 34.1%) for males and 7:30 AM to 7:59 AM (41, 40.2%) for females.
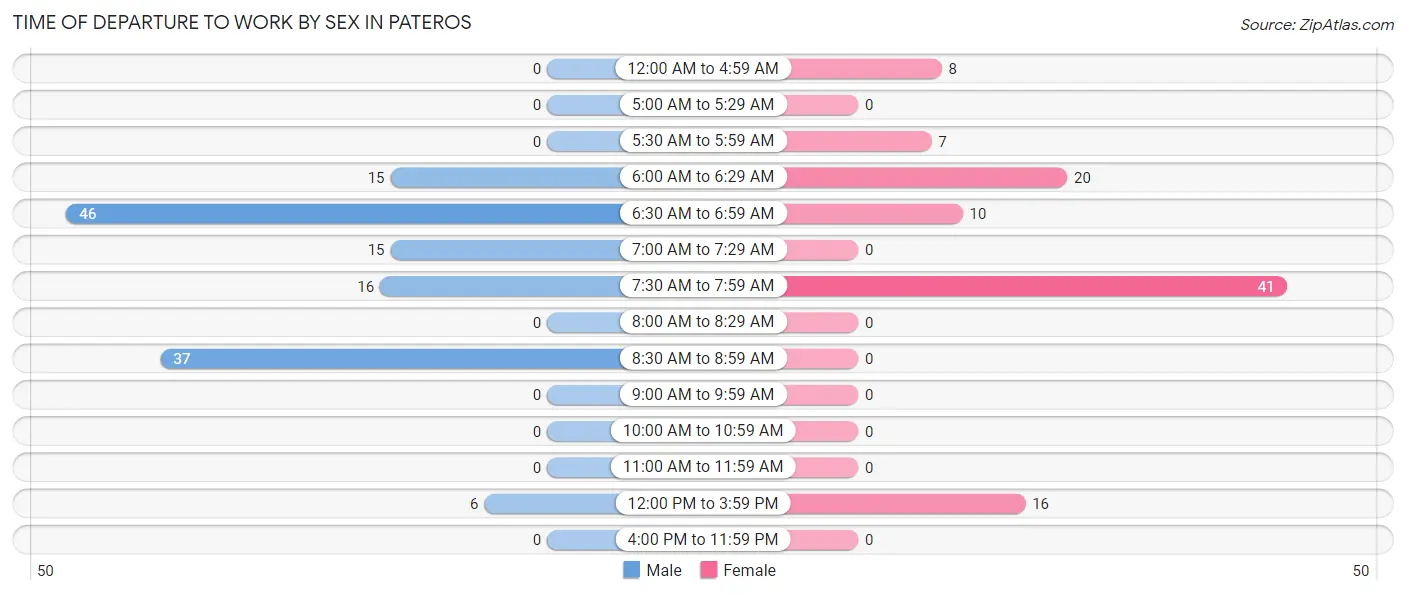
| Time of Departure | Male | Female |
| 12:00 AM to 4:59 AM | 0 (0.0%) | 8 (7.8%) |
| 5:00 AM to 5:29 AM | 0 (0.0%) | 0 (0.0%) |
| 5:30 AM to 5:59 AM | 0 (0.0%) | 7 (6.9%) |
| 6:00 AM to 6:29 AM | 15 (11.1%) | 20 (19.6%) |
| 6:30 AM to 6:59 AM | 46 (34.1%) | 10 (9.8%) |
| 7:00 AM to 7:29 AM | 15 (11.1%) | 0 (0.0%) |
| 7:30 AM to 7:59 AM | 16 (11.8%) | 41 (40.2%) |
| 8:00 AM to 8:29 AM | 0 (0.0%) | 0 (0.0%) |
| 8:30 AM to 8:59 AM | 37 (27.4%) | 0 (0.0%) |
| 9:00 AM to 9:59 AM | 0 (0.0%) | 0 (0.0%) |
| 10:00 AM to 10:59 AM | 0 (0.0%) | 0 (0.0%) |
| 11:00 AM to 11:59 AM | 0 (0.0%) | 0 (0.0%) |
| 12:00 PM to 3:59 PM | 6 (4.4%) | 16 (15.7%) |
| 4:00 PM to 11:59 PM | 0 (0.0%) | 0 (0.0%) |
| Total | 135 (100.0%) | 102 (100.0%) |
Housing Occupancy in Pateros
Occupancy by Ownership in Pateros
Of the total 195 dwellings in Pateros, owner-occupied units account for 156 (80.0%), while renter-occupied units make up 39 (20.0%).
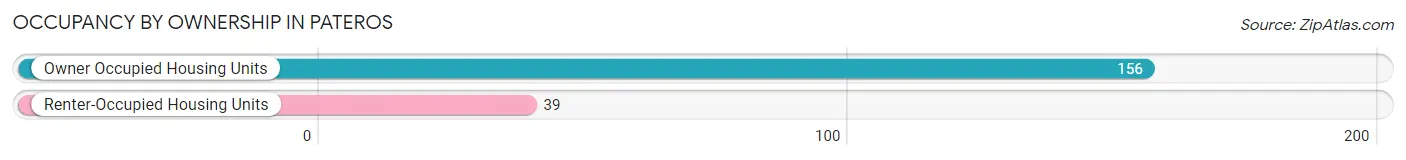
| Occupancy | # Housing Units | % Housing Units |
| Owner Occupied Housing Units | 156 | 80.0% |
| Renter-Occupied Housing Units | 39 | 20.0% |
| Total Occupied Housing Units | 195 | 100.0% |
Occupancy by Household Size in Pateros
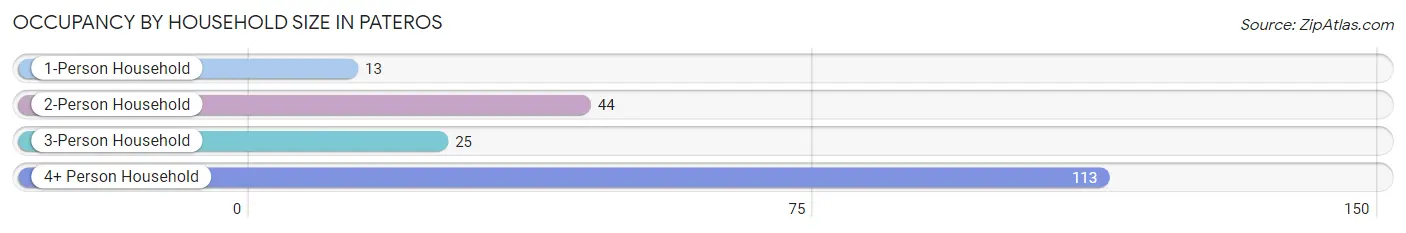
| Household Size | # Housing Units | % Housing Units |
| 1-Person Household | 13 | 6.7% |
| 2-Person Household | 44 | 22.6% |
| 3-Person Household | 25 | 12.8% |
| 4+ Person Household | 113 | 58.0% |
| Total Housing Units | 195 | 100.0% |
Occupancy by Ownership by Household Size in Pateros
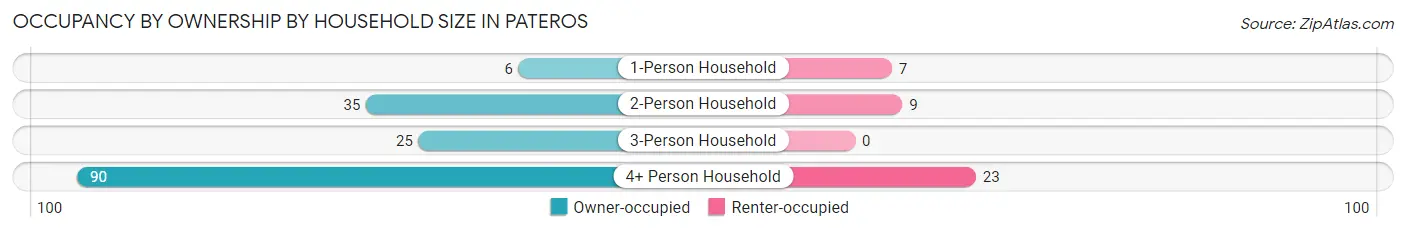
| Household Size | Owner-occupied | Renter-occupied |
| 1-Person Household | 6 (46.2%) | 7 (53.8%) |
| 2-Person Household | 35 (79.5%) | 9 (20.4%) |
| 3-Person Household | 25 (100.0%) | 0 (0.0%) |
| 4+ Person Household | 90 (79.6%) | 23 (20.3%) |
| Total Housing Units | 156 (80.0%) | 39 (20.0%) |
Occupancy by Educational Attainment in Pateros
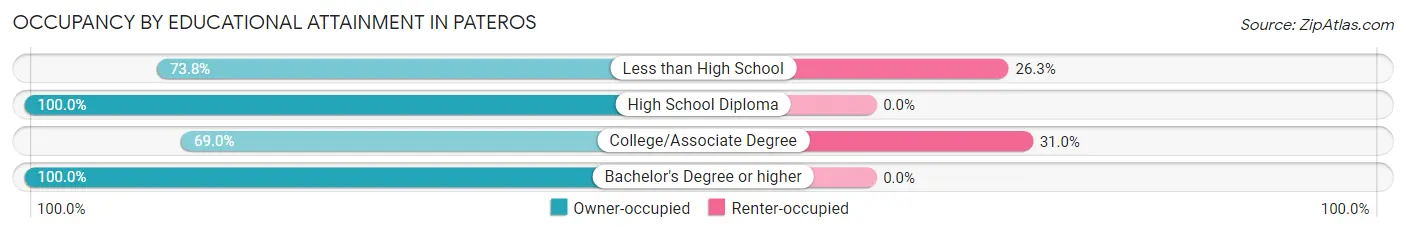
| Household Size | Owner-occupied | Renter-occupied |
| Less than High School | 59 (73.8%) | 21 (26.3%) |
| High School Diploma | 49 (100.0%) | 0 (0.0%) |
| College/Associate Degree | 40 (69.0%) | 18 (31.0%) |
| Bachelor's Degree or higher | 8 (100.0%) | 0 (0.0%) |
Occupancy by Age of Householder in Pateros
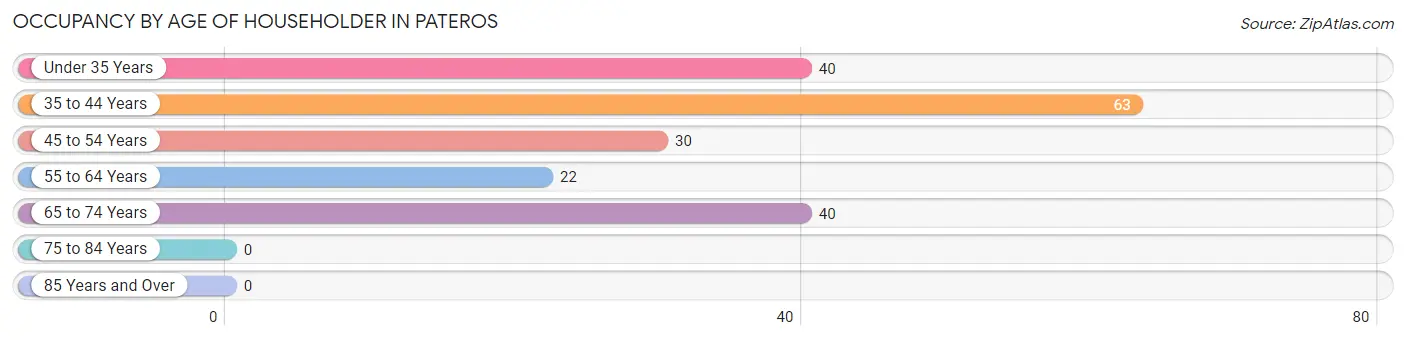
| Age Bracket | # Households | % Households |
| Under 35 Years | 40 | 20.5% |
| 35 to 44 Years | 63 | 32.3% |
| 45 to 54 Years | 30 | 15.4% |
| 55 to 64 Years | 22 | 11.3% |
| 65 to 74 Years | 40 | 20.5% |
| 75 to 84 Years | 0 | 0.0% |
| 85 Years and Over | 0 | 0.0% |
| Total | 195 | 100.0% |
Housing Finances in Pateros
Median Income by Occupancy in Pateros
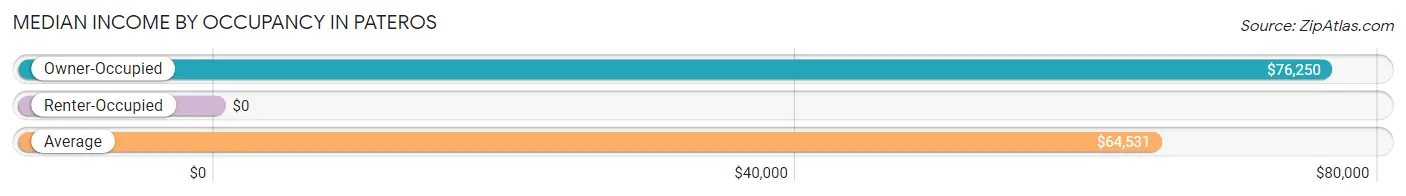
| Occupancy Type | # Households | Median Income |
| Owner-Occupied | 156 (80.0%) | $76,250 |
| Renter-Occupied | 39 (20.0%) | $0 |
| Average | 195 (100.0%) | $64,531 |
Occupancy by Householder Income Bracket in Pateros
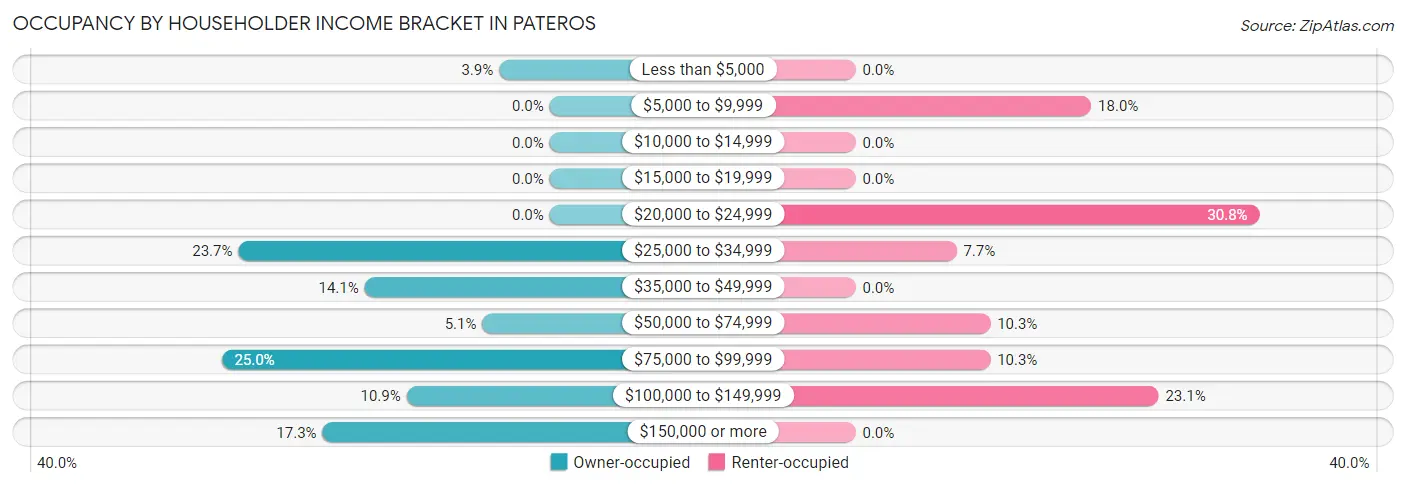
| Income Bracket | Owner-occupied | Renter-occupied |
| Less than $5,000 | 6 (3.8%) | 0 (0.0%) |
| $5,000 to $9,999 | 0 (0.0%) | 7 (17.9%) |
| $10,000 to $14,999 | 0 (0.0%) | 0 (0.0%) |
| $15,000 to $19,999 | 0 (0.0%) | 0 (0.0%) |
| $20,000 to $24,999 | 0 (0.0%) | 12 (30.8%) |
| $25,000 to $34,999 | 37 (23.7%) | 3 (7.7%) |
| $35,000 to $49,999 | 22 (14.1%) | 0 (0.0%) |
| $50,000 to $74,999 | 8 (5.1%) | 4 (10.3%) |
| $75,000 to $99,999 | 39 (25.0%) | 4 (10.3%) |
| $100,000 to $149,999 | 17 (10.9%) | 9 (23.1%) |
| $150,000 or more | 27 (17.3%) | 0 (0.0%) |
| Total | 156 (100.0%) | 39 (100.0%) |
Monthly Housing Cost Tiers in Pateros
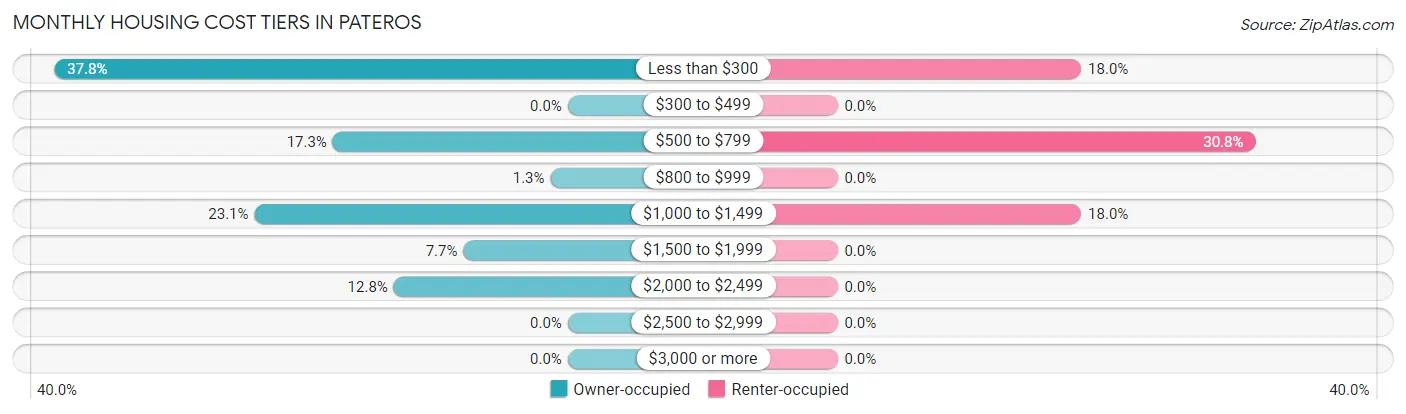
| Monthly Cost | Owner-occupied | Renter-occupied |
| Less than $300 | 59 (37.8%) | 7 (17.9%) |
| $300 to $499 | 0 (0.0%) | 0 (0.0%) |
| $500 to $799 | 27 (17.3%) | 12 (30.8%) |
| $800 to $999 | 2 (1.3%) | 0 (0.0%) |
| $1,000 to $1,499 | 36 (23.1%) | 7 (17.9%) |
| $1,500 to $1,999 | 12 (7.7%) | 0 (0.0%) |
| $2,000 to $2,499 | 20 (12.8%) | 0 (0.0%) |
| $2,500 to $2,999 | 0 (0.0%) | 0 (0.0%) |
| $3,000 or more | 0 (0.0%) | 0 (0.0%) |
| Total | 156 (100.0%) | 39 (100.0%) |
Physical Housing Characteristics in Pateros
Housing Structures in Pateros
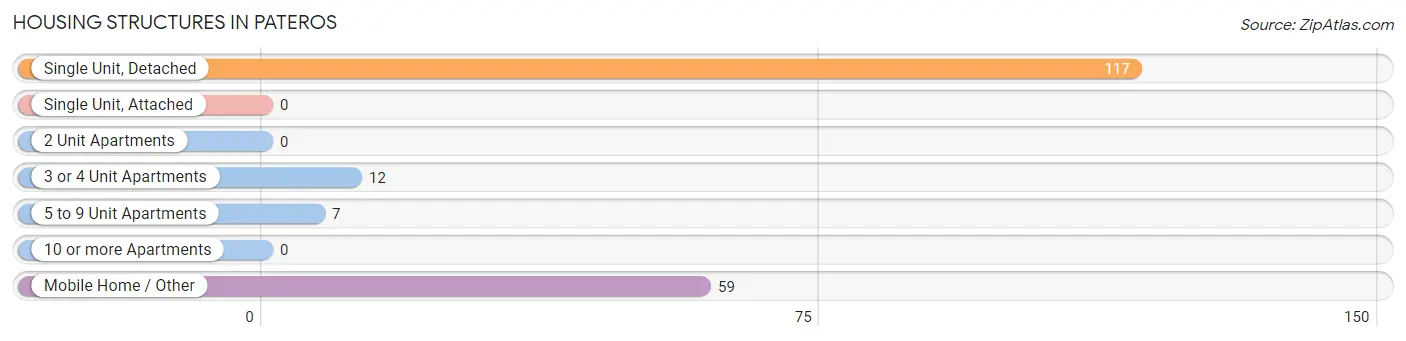
| Structure Type | # Housing Units | % Housing Units |
| Single Unit, Detached | 117 | 60.0% |
| Single Unit, Attached | 0 | 0.0% |
| 2 Unit Apartments | 0 | 0.0% |
| 3 or 4 Unit Apartments | 12 | 6.1% |
| 5 to 9 Unit Apartments | 7 | 3.6% |
| 10 or more Apartments | 0 | 0.0% |
| Mobile Home / Other | 59 | 30.3% |
| Total | 195 | 100.0% |
Housing Structures by Occupancy in Pateros
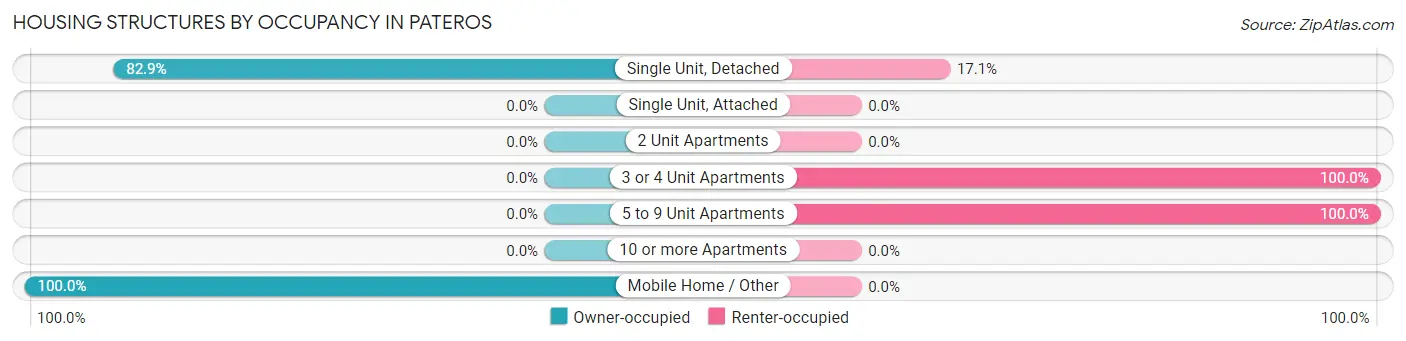
| Structure Type | Owner-occupied | Renter-occupied |
| Single Unit, Detached | 97 (82.9%) | 20 (17.1%) |
| Single Unit, Attached | 0 (0.0%) | 0 (0.0%) |
| 2 Unit Apartments | 0 (0.0%) | 0 (0.0%) |
| 3 or 4 Unit Apartments | 0 (0.0%) | 12 (100.0%) |
| 5 to 9 Unit Apartments | 0 (0.0%) | 7 (100.0%) |
| 10 or more Apartments | 0 (0.0%) | 0 (0.0%) |
| Mobile Home / Other | 59 (100.0%) | 0 (0.0%) |
| Total | 156 (80.0%) | 39 (20.0%) |
Housing Structures by Number of Rooms in Pateros
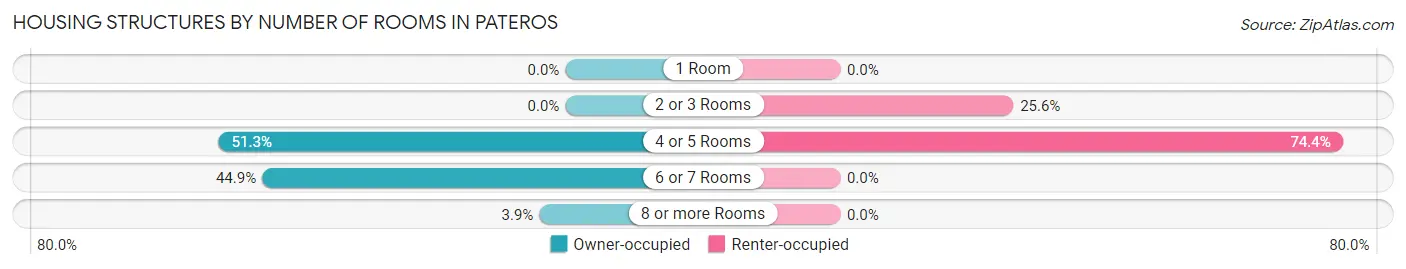
| Number of Rooms | Owner-occupied | Renter-occupied |
| 1 Room | 0 (0.0%) | 0 (0.0%) |
| 2 or 3 Rooms | 0 (0.0%) | 10 (25.6%) |
| 4 or 5 Rooms | 80 (51.3%) | 29 (74.4%) |
| 6 or 7 Rooms | 70 (44.9%) | 0 (0.0%) |
| 8 or more Rooms | 6 (3.8%) | 0 (0.0%) |
| Total | 156 (100.0%) | 39 (100.0%) |
Housing Structure by Heating Type in Pateros
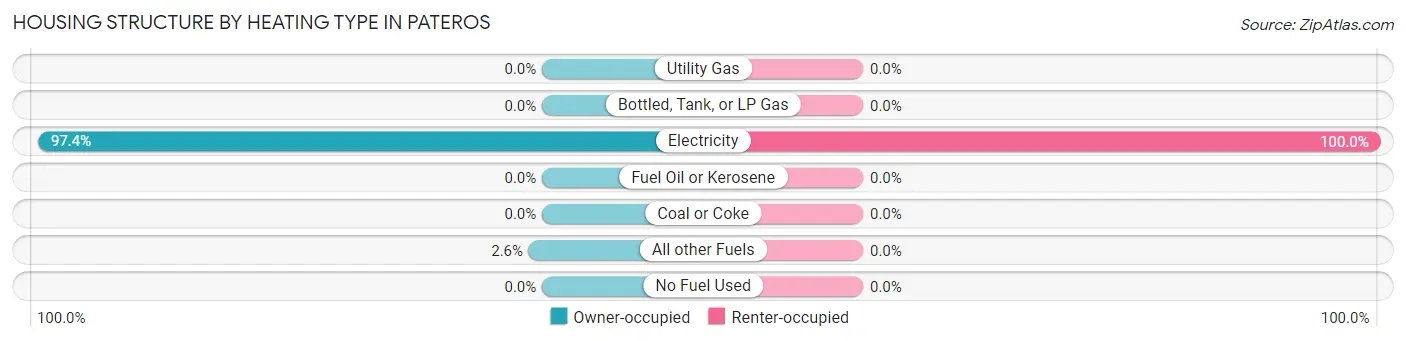
| Heating Type | Owner-occupied | Renter-occupied |
| Utility Gas | 0 (0.0%) | 0 (0.0%) |
| Bottled, Tank, or LP Gas | 0 (0.0%) | 0 (0.0%) |
| Electricity | 152 (97.4%) | 39 (100.0%) |
| Fuel Oil or Kerosene | 0 (0.0%) | 0 (0.0%) |
| Coal or Coke | 0 (0.0%) | 0 (0.0%) |
| All other Fuels | 4 (2.6%) | 0 (0.0%) |
| No Fuel Used | 0 (0.0%) | 0 (0.0%) |
| Total | 156 (100.0%) | 39 (100.0%) |
Household Vehicle Usage in Pateros
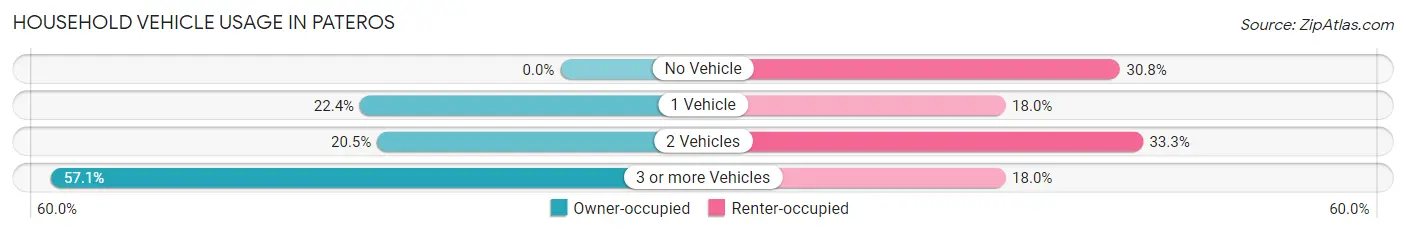
| Vehicles per Household | Owner-occupied | Renter-occupied |
| No Vehicle | 0 (0.0%) | 12 (30.8%) |
| 1 Vehicle | 35 (22.4%) | 7 (17.9%) |
| 2 Vehicles | 32 (20.5%) | 13 (33.3%) |
| 3 or more Vehicles | 89 (57.1%) | 7 (17.9%) |
| Total | 156 (100.0%) | 39 (100.0%) |
Real Estate & Mortgages in Pateros
Real Estate and Mortgage Overview in Pateros
| Characteristic | Without Mortgage | With Mortgage |
| Housing Units | 88 | 68 |
| Median Property Value | - | - |
| Median Household Income | - | - |
| Monthly Housing Costs | $249 | $0 |
| Real Estate Taxes | $1,703 | $0 |
Property Value by Mortgage Status in Pateros
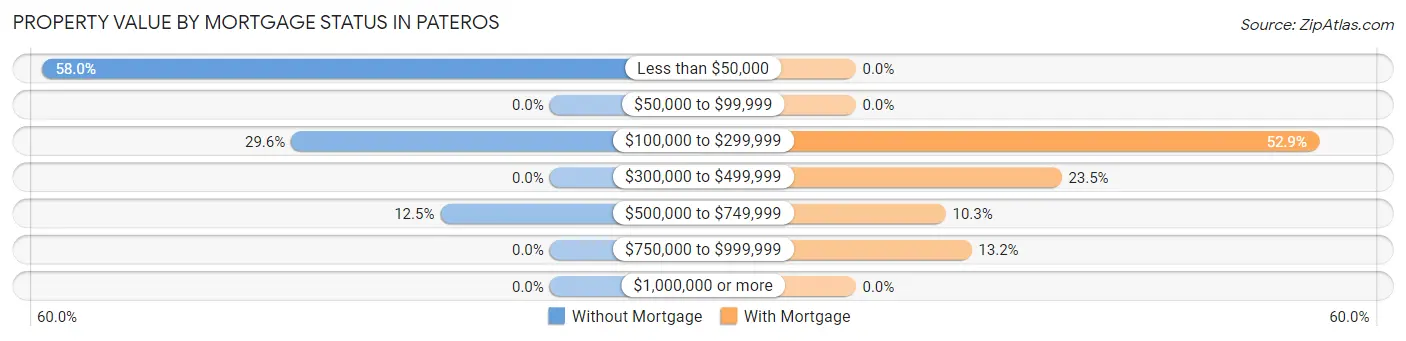
| Property Value | Without Mortgage | With Mortgage |
| Less than $50,000 | 51 (58.0%) | 0 (0.0%) |
| $50,000 to $99,999 | 0 (0.0%) | 0 (0.0%) |
| $100,000 to $299,999 | 26 (29.5%) | 36 (52.9%) |
| $300,000 to $499,999 | 0 (0.0%) | 16 (23.5%) |
| $500,000 to $749,999 | 11 (12.5%) | 7 (10.3%) |
| $750,000 to $999,999 | 0 (0.0%) | 9 (13.2%) |
| $1,000,000 or more | 0 (0.0%) | 0 (0.0%) |
| Total | 88 (100.0%) | 68 (100.0%) |
Household Income by Mortgage Status in Pateros
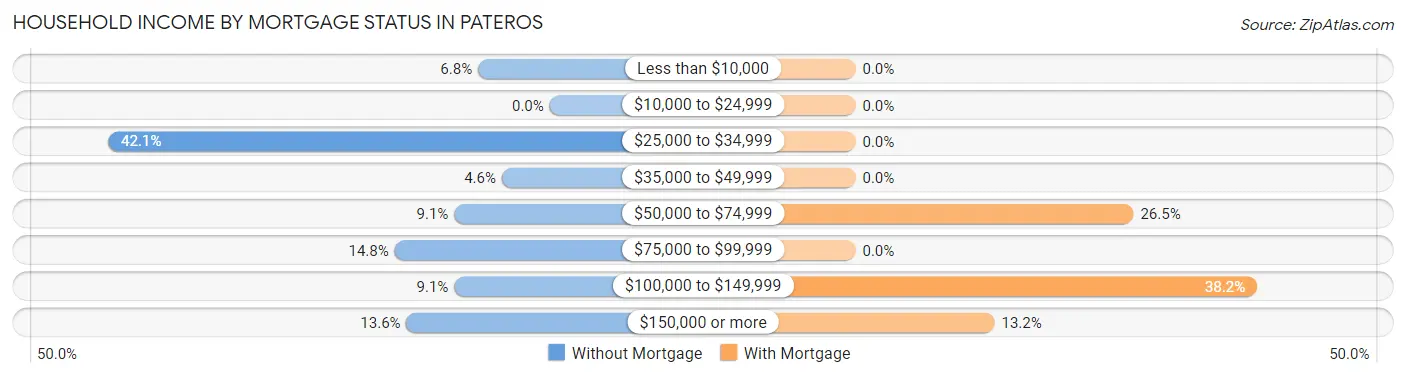
| Household Income | Without Mortgage | With Mortgage |
| Less than $10,000 | 6 (6.8%) | 0 (0.0%) |
| $10,000 to $24,999 | 0 (0.0%) | 0 (0.0%) |
| $25,000 to $34,999 | 37 (42.0%) | 0 (0.0%) |
| $35,000 to $49,999 | 4 (4.5%) | 0 (0.0%) |
| $50,000 to $74,999 | 8 (9.1%) | 18 (26.5%) |
| $75,000 to $99,999 | 13 (14.8%) | 0 (0.0%) |
| $100,000 to $149,999 | 8 (9.1%) | 26 (38.2%) |
| $150,000 or more | 12 (13.6%) | 9 (13.2%) |
| Total | 88 (100.0%) | 68 (100.0%) |
Property Value to Household Income Ratio in Pateros
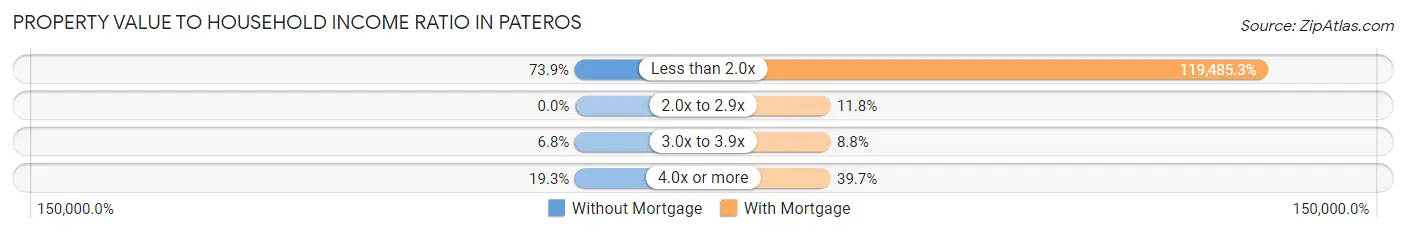
| Value-to-Income Ratio | Without Mortgage | With Mortgage |
| Less than 2.0x | 65 (73.9%) | 81,250 (119,485.3%) |
| 2.0x to 2.9x | 0 (0.0%) | 8 (11.8%) |
| 3.0x to 3.9x | 6 (6.8%) | 6 (8.8%) |
| 4.0x or more | 17 (19.3%) | 27 (39.7%) |
| Total | 88 (100.0%) | 68 (100.0%) |
Real Estate Taxes by Mortgage Status in Pateros
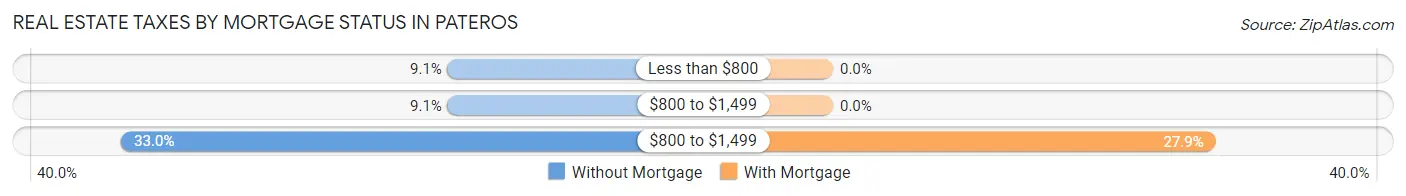
| Property Taxes | Without Mortgage | With Mortgage |
| Less than $800 | 8 (9.1%) | 0 (0.0%) |
| $800 to $1,499 | 8 (9.1%) | 0 (0.0%) |
| $800 to $1,499 | 29 (33.0%) | 19 (27.9%) |
| Total | 88 (100.0%) | 68 (100.0%) |
Health & Disability in Pateros
Health Insurance Coverage by Age in Pateros
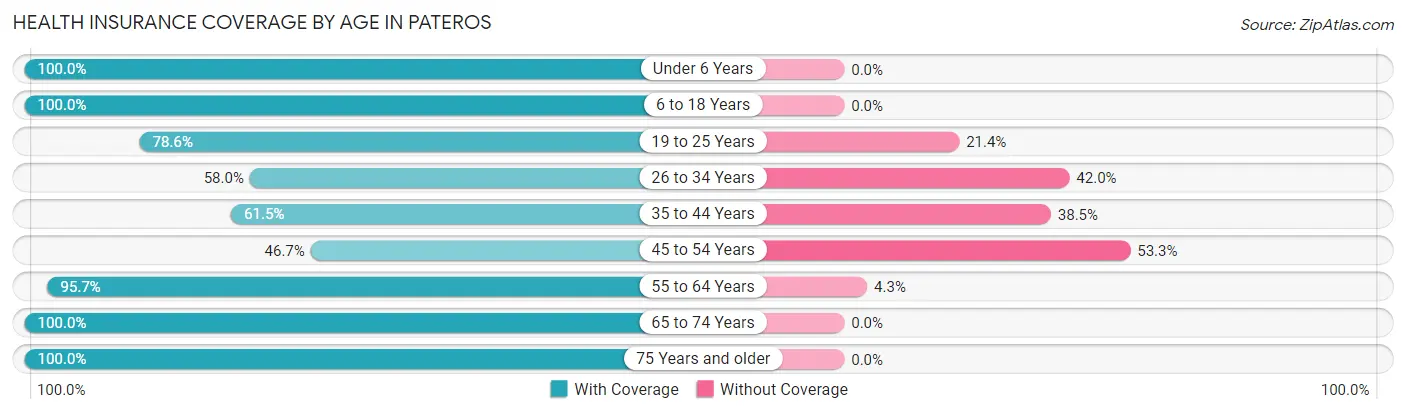
| Age Bracket | With Coverage | Without Coverage |
| Under 6 Years | 78 (100.0%) | 0 (0.0%) |
| 6 to 18 Years | 176 (100.0%) | 0 (0.0%) |
| 19 to 25 Years | 44 (78.6%) | 12 (21.4%) |
| 26 to 34 Years | 47 (58.0%) | 34 (42.0%) |
| 35 to 44 Years | 75 (61.5%) | 47 (38.5%) |
| 45 to 54 Years | 28 (46.7%) | 32 (53.3%) |
| 55 to 64 Years | 45 (95.7%) | 2 (4.3%) |
| 65 to 74 Years | 45 (100.0%) | 0 (0.0%) |
| 75 Years and older | 3 (100.0%) | 0 (0.0%) |
| Total | 541 (81.0%) | 127 (19.0%) |
Health Insurance Coverage by Citizenship Status in Pateros
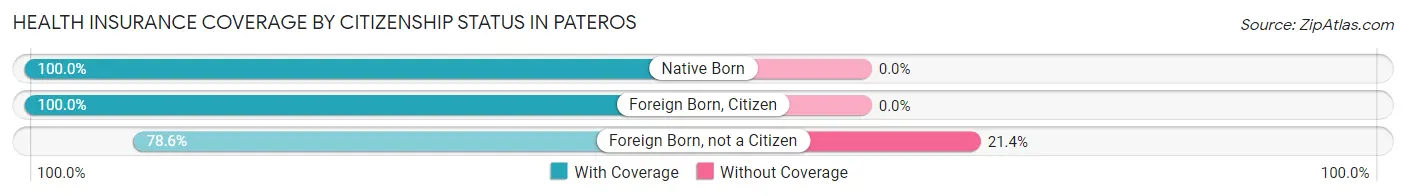
| Citizenship Status | With Coverage | Without Coverage |
| Native Born | 78 (100.0%) | 0 (0.0%) |
| Foreign Born, Citizen | 176 (100.0%) | 0 (0.0%) |
| Foreign Born, not a Citizen | 44 (78.6%) | 12 (21.4%) |
Health Insurance Coverage by Household Income in Pateros
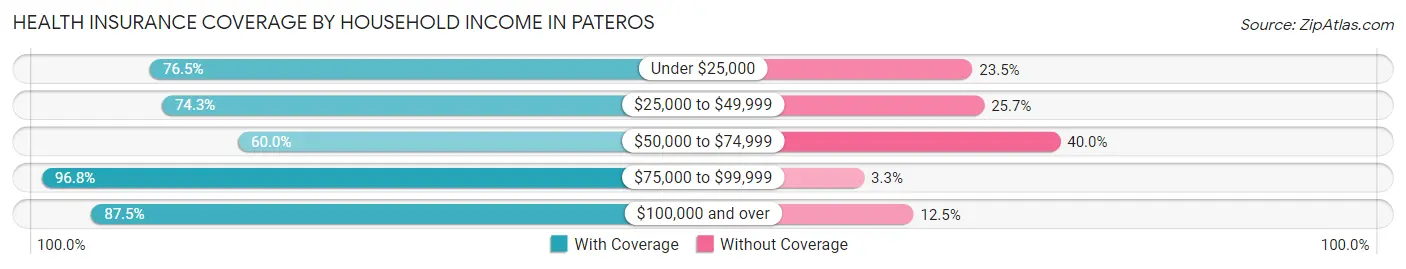
| Household Income | With Coverage | Without Coverage |
| Under $25,000 | 39 (76.5%) | 12 (23.5%) |
| $25,000 to $49,999 | 176 (74.3%) | 61 (25.7%) |
| $50,000 to $74,999 | 39 (60.0%) | 26 (40.0%) |
| $75,000 to $99,999 | 119 (96.8%) | 4 (3.3%) |
| $100,000 and over | 168 (87.5%) | 24 (12.5%) |
Public vs Private Health Insurance Coverage by Age in Pateros
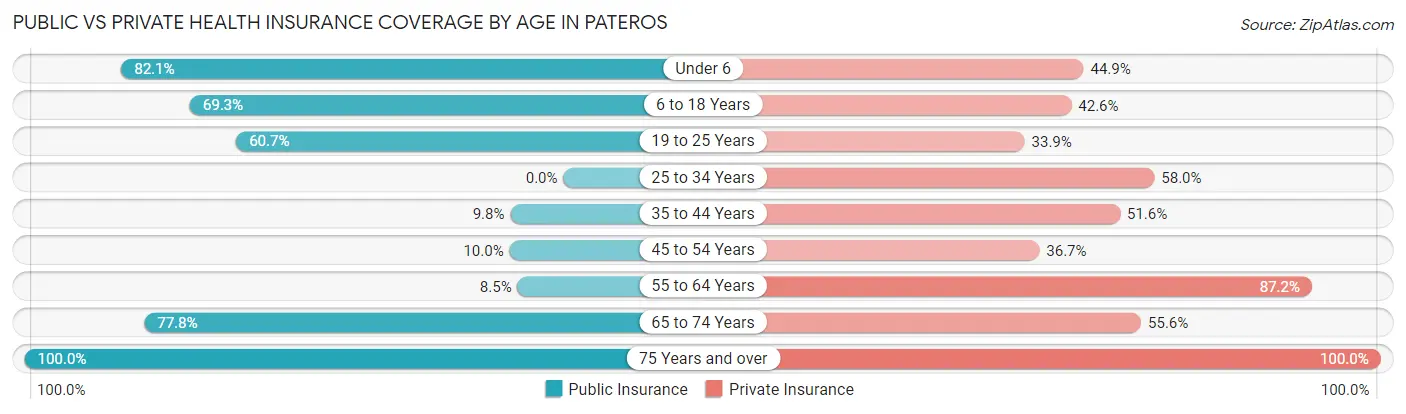
| Age Bracket | Public Insurance | Private Insurance |
| Under 6 | 64 (82.1%) | 35 (44.9%) |
| 6 to 18 Years | 122 (69.3%) | 75 (42.6%) |
| 19 to 25 Years | 34 (60.7%) | 19 (33.9%) |
| 25 to 34 Years | 0 (0.0%) | 47 (58.0%) |
| 35 to 44 Years | 12 (9.8%) | 63 (51.6%) |
| 45 to 54 Years | 6 (10.0%) | 22 (36.7%) |
| 55 to 64 Years | 4 (8.5%) | 41 (87.2%) |
| 65 to 74 Years | 35 (77.8%) | 25 (55.6%) |
| 75 Years and over | 3 (100.0%) | 3 (100.0%) |
| Total | 280 (41.9%) | 330 (49.4%) |
Disability Status by Sex by Age in Pateros
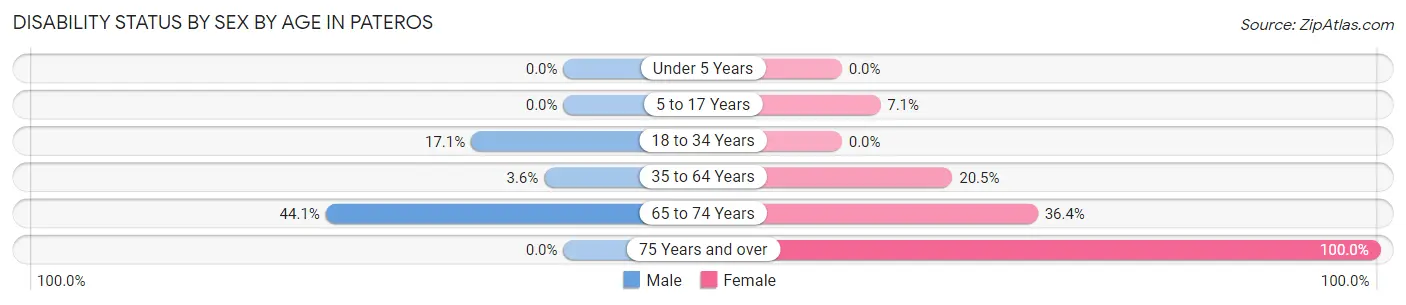
| Age Bracket | Male | Female |
| Under 5 Years | 0 (0.0%) | 0 (0.0%) |
| 5 to 17 Years | 0 (0.0%) | 5 (7.1%) |
| 18 to 34 Years | 6 (17.1%) | 0 (0.0%) |
| 35 to 64 Years | 4 (3.6%) | 24 (20.5%) |
| 65 to 74 Years | 15 (44.1%) | 4 (36.4%) |
| 75 Years and over | 0 (0.0%) | 3 (100.0%) |
Disability Class by Sex by Age in Pateros
Disability Class: Hearing Difficulty
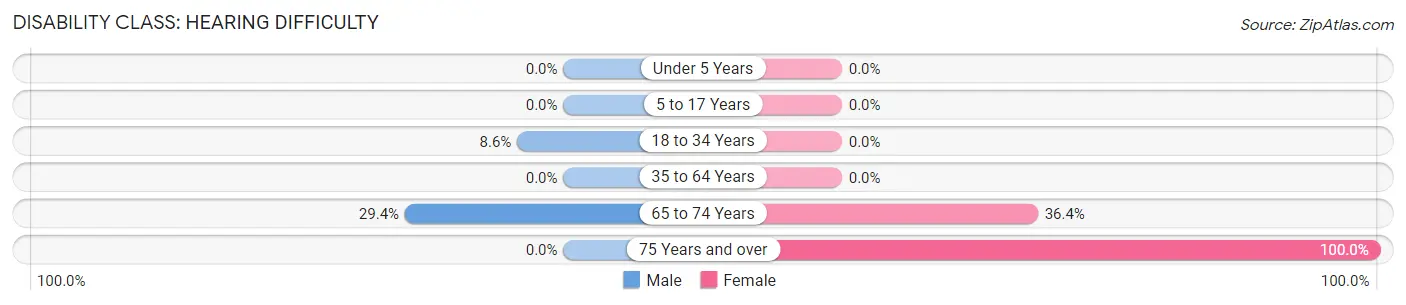
| Age Bracket | Male | Female |
| Under 5 Years | 0 (0.0%) | 0 (0.0%) |
| 5 to 17 Years | 0 (0.0%) | 0 (0.0%) |
| 18 to 34 Years | 3 (8.6%) | 0 (0.0%) |
| 35 to 64 Years | 0 (0.0%) | 0 (0.0%) |
| 65 to 74 Years | 10 (29.4%) | 4 (36.4%) |
| 75 Years and over | 0 (0.0%) | 3 (100.0%) |
Disability Class: Vision Difficulty
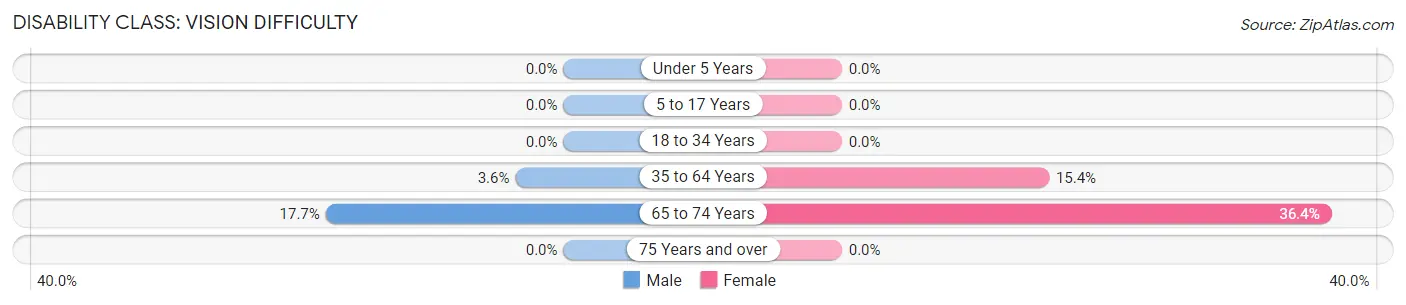
| Age Bracket | Male | Female |
| Under 5 Years | 0 (0.0%) | 0 (0.0%) |
| 5 to 17 Years | 0 (0.0%) | 0 (0.0%) |
| 18 to 34 Years | 0 (0.0%) | 0 (0.0%) |
| 35 to 64 Years | 4 (3.6%) | 18 (15.4%) |
| 65 to 74 Years | 6 (17.6%) | 4 (36.4%) |
| 75 Years and over | 0 (0.0%) | 0 (0.0%) |
Disability Class: Cognitive Difficulty
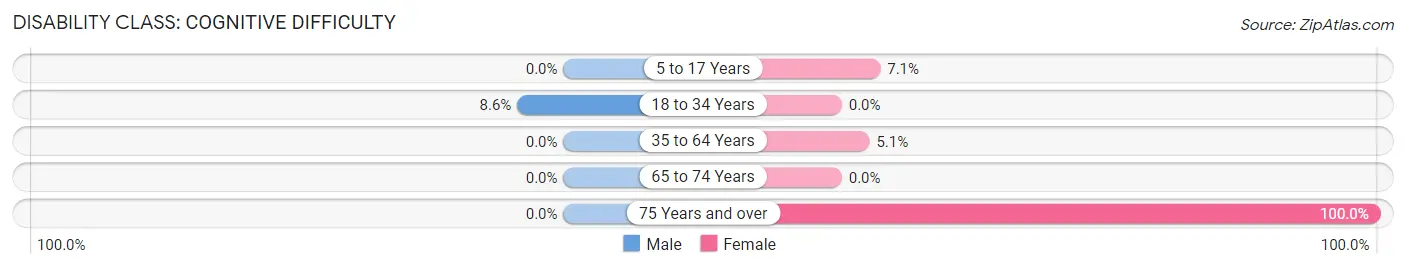
| Age Bracket | Male | Female |
| 5 to 17 Years | 0 (0.0%) | 5 (7.1%) |
| 18 to 34 Years | 3 (8.6%) | 0 (0.0%) |
| 35 to 64 Years | 0 (0.0%) | 6 (5.1%) |
| 65 to 74 Years | 0 (0.0%) | 0 (0.0%) |
| 75 Years and over | 0 (0.0%) | 3 (100.0%) |
Disability Class: Ambulatory Difficulty
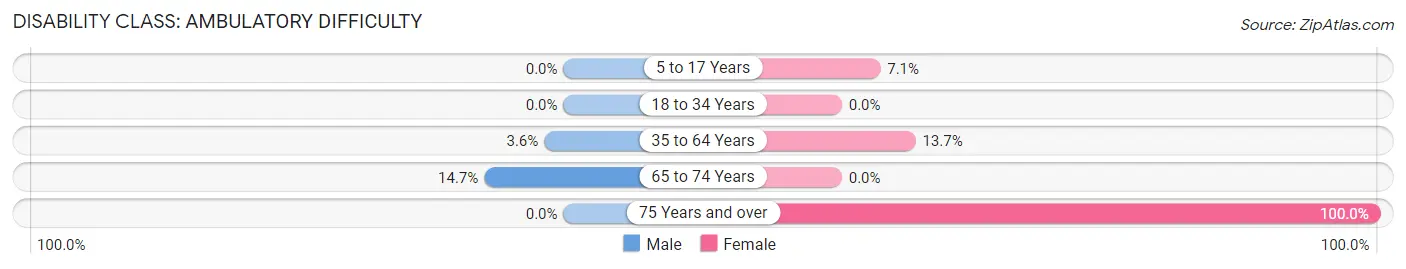
| Age Bracket | Male | Female |
| 5 to 17 Years | 0 (0.0%) | 5 (7.1%) |
| 18 to 34 Years | 0 (0.0%) | 0 (0.0%) |
| 35 to 64 Years | 4 (3.6%) | 16 (13.7%) |
| 65 to 74 Years | 5 (14.7%) | 0 (0.0%) |
| 75 Years and over | 0 (0.0%) | 3 (100.0%) |
Disability Class: Self-Care Difficulty
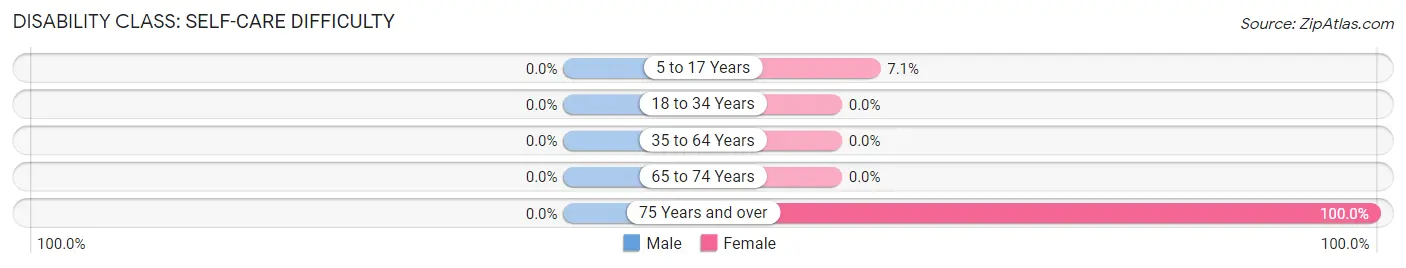
| Age Bracket | Male | Female |
| 5 to 17 Years | 0 (0.0%) | 5 (7.1%) |
| 18 to 34 Years | 0 (0.0%) | 0 (0.0%) |
| 35 to 64 Years | 0 (0.0%) | 0 (0.0%) |
| 65 to 74 Years | 0 (0.0%) | 0 (0.0%) |
| 75 Years and over | 0 (0.0%) | 3 (100.0%) |
Technology Access in Pateros
Computing Device Access in Pateros
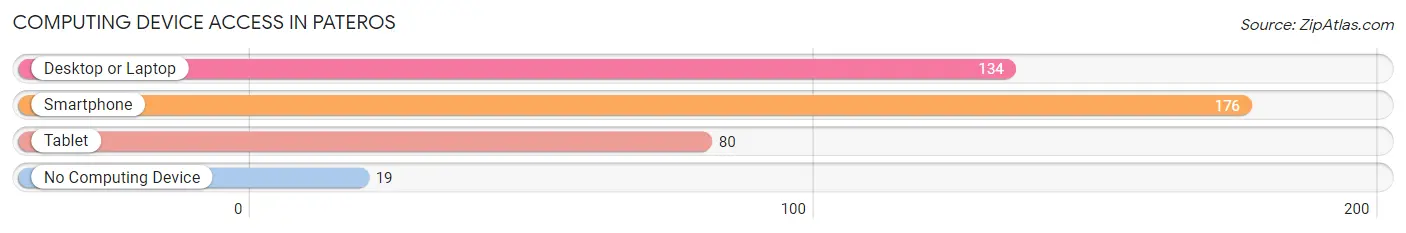
| Device Type | # Households | % Households |
| Desktop or Laptop | 134 | 68.7% |
| Smartphone | 176 | 90.3% |
| Tablet | 80 | 41.0% |
| No Computing Device | 19 | 9.7% |
| Total | 195 | 100.0% |
Internet Access in Pateros
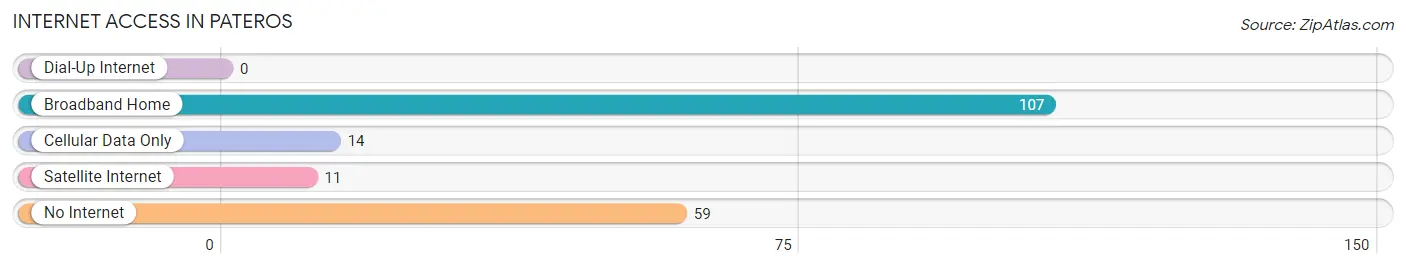
| Internet Type | # Households | % Households |
| Dial-Up Internet | 0 | 0.0% |
| Broadband Home | 107 | 54.9% |
| Cellular Data Only | 14 | 7.2% |
| Satellite Internet | 11 | 5.6% |
| No Internet | 59 | 30.3% |
| Total | 195 | 100.0% |
Pateros Summary
Pateros is a small town located in Okanogan County, Washington, United States. It is situated on the banks of the Columbia River, just south of the Canadian border. The town was founded in 1891 and was named after the Pateros Indians, who were the original inhabitants of the area. The population of Pateros was 1,072 at the 2010 census.
History
The area around Pateros was first inhabited by the Pateros Indians, who were a sub-tribe of the Okanagan people. The Pateros Indians were known for their fishing and hunting skills, and they lived in the area for centuries before the arrival of European settlers.
In 1891, the town of Pateros was founded by a group of settlers from the Midwest. The settlers were attracted to the area by the abundance of fish and game, as well as the fertile soil. The town was named after the Pateros Indians, and the settlers quickly established a thriving community.
In the early 1900s, Pateros became a popular destination for tourists, who were drawn to the area by its natural beauty and abundance of outdoor activities. The town was also known for its excellent fishing, and it became a popular spot for anglers from all over the country.
In the 1950s, Pateros began to experience a decline in population as many of the town’s residents moved away in search of better economic opportunities. However, the town has experienced a resurgence in recent years, and it is now home to a vibrant community of artists, entrepreneurs, and outdoor enthusiasts.
Geography
Pateros is located in Okanogan County, Washington, United States. It is situated on the banks of the Columbia River, just south of the Canadian border. The town is surrounded by rolling hills and lush forests, and it is located in the heart of the Okanogan Valley.
The climate in Pateros is generally mild, with warm summers and cold winters. The average temperature in the summer is around 75 degrees Fahrenheit, and the average temperature in the winter is around 30 degrees Fahrenheit.
Economy
The economy of Pateros is largely based on tourism and agriculture. The town is home to several wineries, and it is a popular destination for wine-tasting tours. The town is also home to several small businesses, including restaurants, shops, and galleries.
Agriculture is also an important part of the local economy. The area is known for its apple orchards, and it is also home to several dairy farms.
Demographics
As of the 2010 census, the population of Pateros was 1,072. The racial makeup of the town was 94.3% White, 0.7% African American, 0.7% Native American, 0.7% Asian, 0.3% Pacific Islander, and 2.7% from other races. The median household income was $37,500, and the median family income was $41,250.
Conclusion
Pateros is a small town located in Okanogan County, Washington, United States. It is situated on the banks of the Columbia River, just south of the Canadian border. The town was founded in 1891 and was named after the Pateros Indians, who were the original inhabitants of the area. The population of Pateros was 1,072 at the 2010 census. The economy of Pateros is largely based on tourism and agriculture, and the town is home to several wineries, restaurants, shops, and galleries. The racial makeup of the town was 94.3% White, 0.7% African American, 0.7% Native American, 0.7% Asian, 0.3% Pacific Islander, and 2.7% from other races. The median household income was $37,500, and the median family income was $41,250.
Common Questions
What is Per Capita Income in Pateros?
Per Capita income in Pateros is $23,354.
What is the Median Family Income in Pateros?
Median Family Income in Pateros is $71,250.
What is the Median Household income in Pateros?
Median Household Income in Pateros is $64,531.
What is Income or Wage Gap in Pateros?
Income or Wage Gap in Pateros is 2.7%.
Women in Pateros earn 97.3 cents for every dollar earned by a man.
What is Inequality or Gini Index in Pateros?
Inequality or Gini Index in Pateros is 0.41.
What is the Total Population of Pateros?
Total Population of Pateros is 668.
What is the Total Male Population of Pateros?
Total Male Population of Pateros is 324.
What is the Total Female Population of Pateros?
Total Female Population of Pateros is 344.
What is the Ratio of Males per 100 Females in Pateros?
There are 94.19 Males per 100 Females in Pateros.
What is the Ratio of Females per 100 Males in Pateros?
There are 106.17 Females per 100 Males in Pateros.
What is the Median Population Age in Pateros?
Median Population Age in Pateros is 27.9 Years.
What is the Average Family Size in Pateros
Average Family Size in Pateros is 3.7 People.
What is the Average Household Size in Pateros
Average Household Size in Pateros is 3.4 People.
How Large is the Labor Force in Pateros?
There are 303 People in the Labor Forcein in Pateros.
What is the Percentage of People in the Labor Force in Pateros?
67.2% of People are in the Labor Force in Pateros.
What is the Unemployment Rate in Pateros?
Unemployment Rate in Pateros is 11.2%.