Tenino, WA Map & Demographics
Tenino Map
Tenino Overview
$29,367
PER CAPITA INCOME
$87,656
AVG FAMILY INCOME
$63,654
AVG HOUSEHOLD INCOME
36.7%
WAGE / INCOME GAP [ % ]
63.3¢/ $1
WAGE / INCOME GAP [ $ ]
0.42
INEQUALITY / GINI INDEX
2,045
TOTAL POPULATION
805
MALE POPULATION
1,240
FEMALE POPULATION
64.92
MALES / 100 FEMALES
154.04
FEMALES / 100 MALES
33.3
MEDIAN AGE
3.2
AVG FAMILY SIZE
2.6
AVG HOUSEHOLD SIZE
1,045
LABOR FORCE [ PEOPLE ]
64.6%
PERCENT IN LABOR FORCE
4.6%
UNEMPLOYMENT RATE
Tenino Zip Codes
Tenino Area Codes
Income in Tenino
Income Overview in Tenino
Per Capita Income in Tenino is $29,367, while median incomes of families and households are $87,656 and $63,654 respectively.
| Characteristic | Number | Measure |
| Per Capita Income | 2,045 | $29,367 |
| Median Family Income | 459 | $87,656 |
| Mean Family Income | 459 | $91,288 |
| Median Household Income | 780 | $63,654 |
| Mean Household Income | 780 | $76,399 |
| Income Deficit | 459 | $0 |
| Wage / Income Gap (%) | 2,045 | 36.66% |
| Wage / Income Gap ($) | 2,045 | 63.34¢ per $1 |
| Gini / Inequality Index | 2,045 | 0.42 |
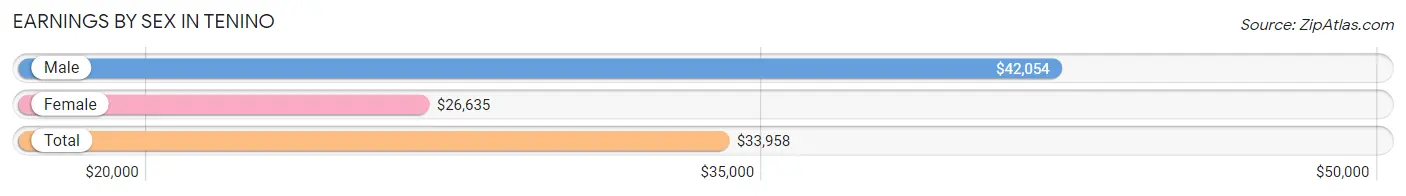
Earnings by Sex in Tenino
Average Earnings in Tenino are $33,958, $42,054 for men and $26,635 for women, a difference of 36.7%.
| Sex | Number | Average Earnings |
| Male | 527 (46.9%) | $42,054 |
| Female | 597 (53.1%) | $26,635 |
| Total | 1,124 (100.0%) | $33,958 |
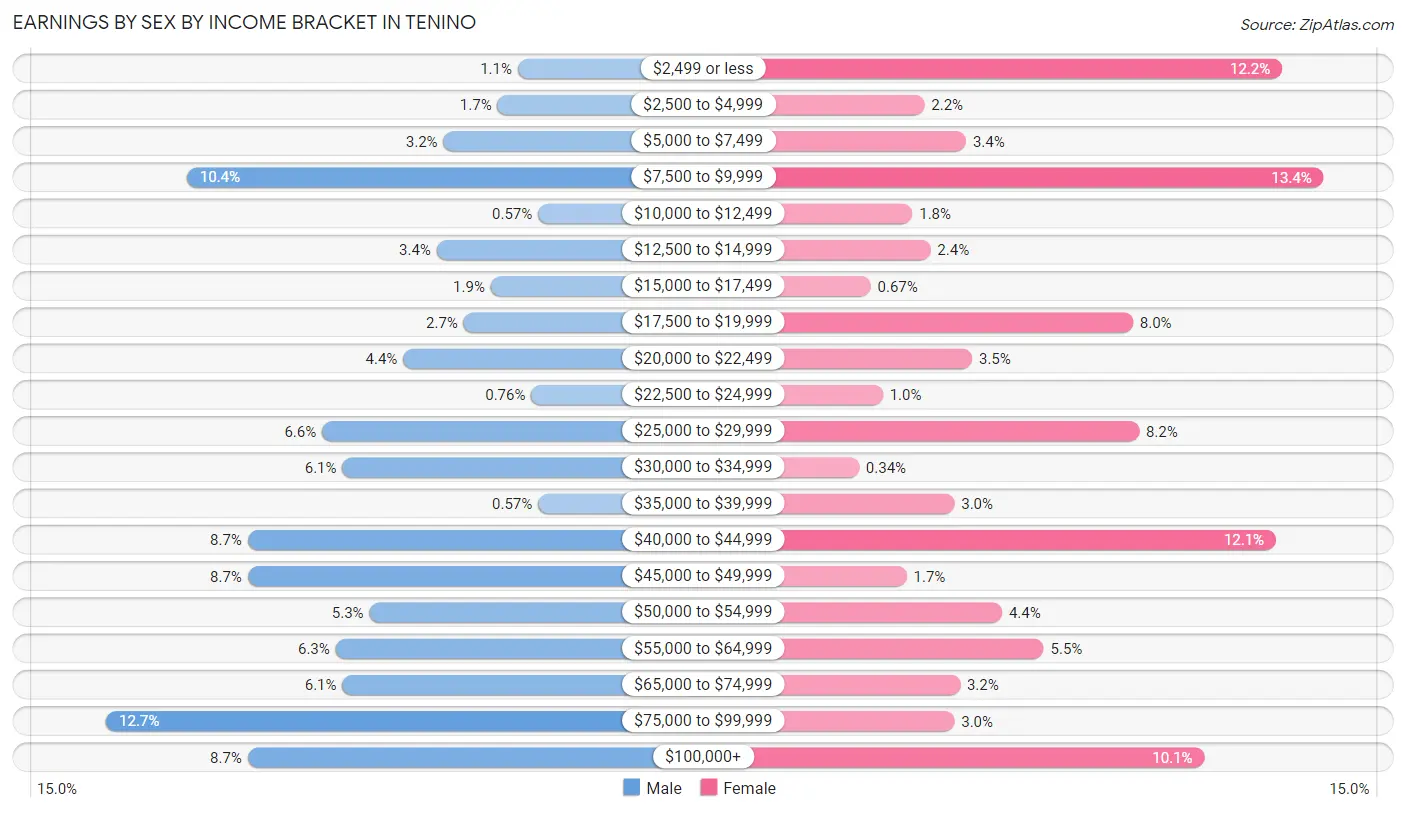
Earnings by Sex by Income Bracket in Tenino
The most common earnings brackets in Tenino are $75,000 to $99,999 for men (67 | 12.7%) and $7,500 to $9,999 for women (80 | 13.4%).
| Income | Male | Female |
| $2,499 or less | 6 (1.1%) | 73 (12.2%) |
| $2,500 to $4,999 | 9 (1.7%) | 13 (2.2%) |
| $5,000 to $7,499 | 17 (3.2%) | 20 (3.4%) |
| $7,500 to $9,999 | 55 (10.4%) | 80 (13.4%) |
| $10,000 to $12,499 | 3 (0.6%) | 11 (1.8%) |
| $12,500 to $14,999 | 18 (3.4%) | 14 (2.4%) |
| $15,000 to $17,499 | 10 (1.9%) | 4 (0.7%) |
| $17,500 to $19,999 | 14 (2.7%) | 48 (8.0%) |
| $20,000 to $22,499 | 23 (4.4%) | 21 (3.5%) |
| $22,500 to $24,999 | 4 (0.8%) | 6 (1.0%) |
| $25,000 to $29,999 | 35 (6.6%) | 49 (8.2%) |
| $30,000 to $34,999 | 32 (6.1%) | 2 (0.3%) |
| $35,000 to $39,999 | 3 (0.6%) | 18 (3.0%) |
| $40,000 to $44,999 | 46 (8.7%) | 72 (12.1%) |
| $45,000 to $49,999 | 46 (8.7%) | 10 (1.7%) |
| $50,000 to $54,999 | 28 (5.3%) | 26 (4.4%) |
| $55,000 to $64,999 | 33 (6.3%) | 33 (5.5%) |
| $65,000 to $74,999 | 32 (6.1%) | 19 (3.2%) |
| $75,000 to $99,999 | 67 (12.7%) | 18 (3.0%) |
| $100,000+ | 46 (8.7%) | 60 (10.1%) |
| Total | 527 (100.0%) | 597 (100.0%) |
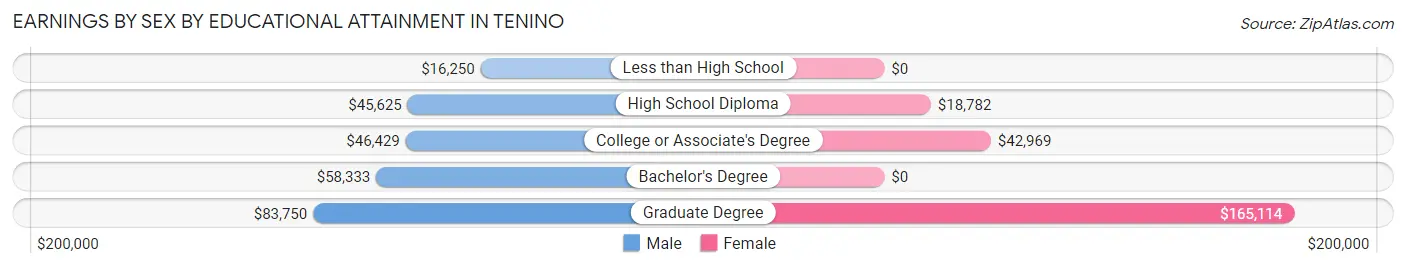
Earnings by Sex by Educational Attainment in Tenino
Average earnings in Tenino are $49,239 for men and $41,354 for women, a difference of 16.0%. Men with an educational attainment of graduate degree enjoy the highest average annual earnings of $83,750, while those with less than high school education earn the least with $16,250. Women with an educational attainment of graduate degree earn the most with the average annual earnings of $165,114, while those with high school diploma education have the smallest earnings of $18,782.
| Educational Attainment | Male Income | Female Income |
| Less than High School | $16,250 | $0 |
| High School Diploma | $45,625 | $18,782 |
| College or Associate's Degree | $46,429 | $42,969 |
| Bachelor's Degree | $58,333 | $0 |
| Graduate Degree | $83,750 | $165,114 |
| Total | $49,239 | $41,354 |
Family Income in Tenino
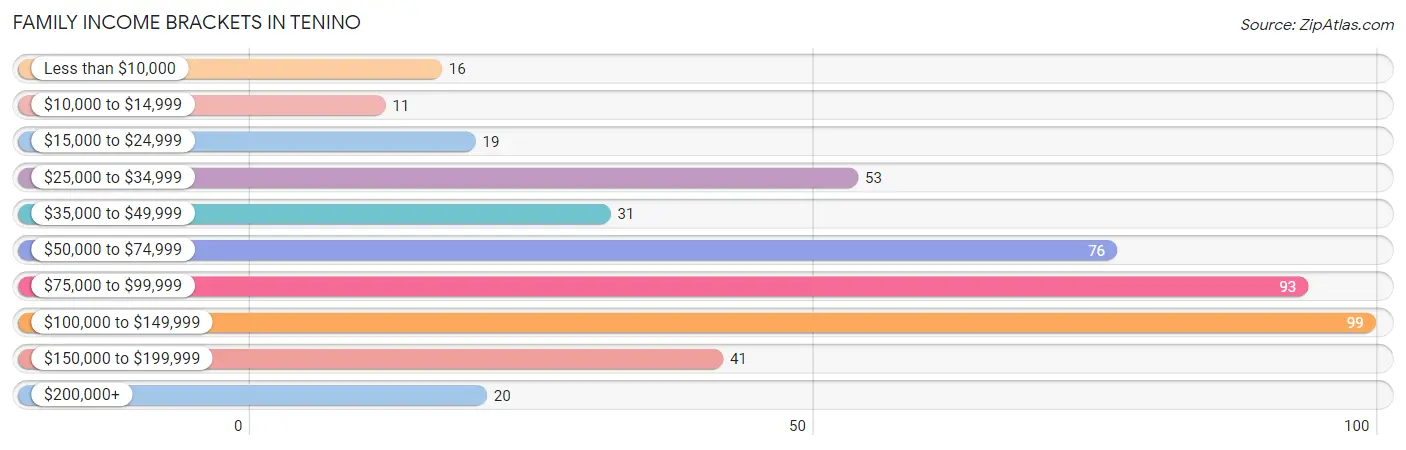
Family Income Brackets in Tenino
According to the Tenino family income data, there are 99 families falling into the $100,000 to $149,999 income range, which is the most common income bracket and makes up 21.6% of all families. Conversely, the $10,000 to $14,999 income bracket is the least frequent group with only 11 families (2.4%) belonging to this category.
| Income Bracket | # Families | % Families |
| Less than $10,000 | 16 | 3.5% |
| $10,000 to $14,999 | 11 | 2.4% |
| $15,000 to $24,999 | 19 | 4.1% |
| $25,000 to $34,999 | 53 | 11.5% |
| $35,000 to $49,999 | 31 | 6.8% |
| $50,000 to $74,999 | 76 | 16.6% |
| $75,000 to $99,999 | 93 | 20.3% |
| $100,000 to $149,999 | 99 | 21.6% |
| $150,000 to $199,999 | 41 | 8.9% |
| $200,000+ | 20 | 4.4% |
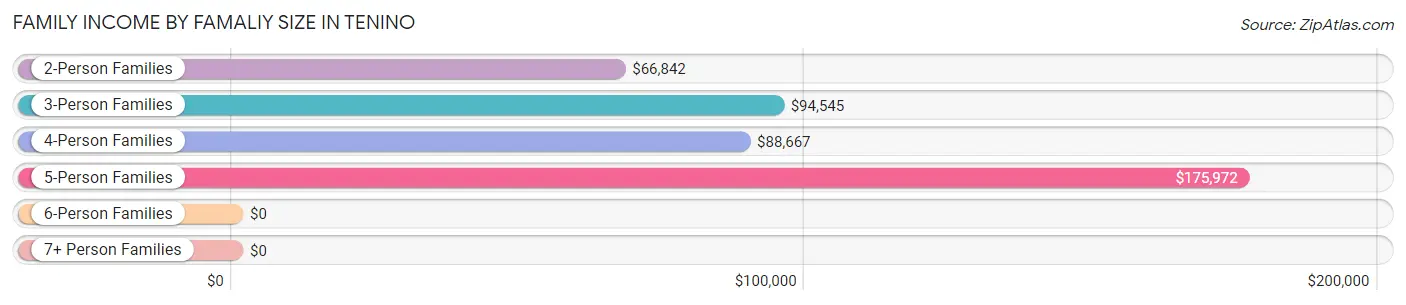
Family Income by Famaliy Size in Tenino
5-person families (22 | 4.8%) account for the highest median family income in Tenino with $175,972 per family, while 5-person families (22 | 4.8%) have the highest median income of $35,194 per family member.
| Income Bracket | # Families | Median Income |
| 2-Person Families | 176 (38.3%) | $66,842 |
| 3-Person Families | 136 (29.6%) | $94,545 |
| 4-Person Families | 104 (22.7%) | $88,667 |
| 5-Person Families | 22 (4.8%) | $175,972 |
| 6-Person Families | 15 (3.3%) | $0 |
| 7+ Person Families | 6 (1.3%) | $0 |
| Total | 459 (100.0%) | $87,656 |
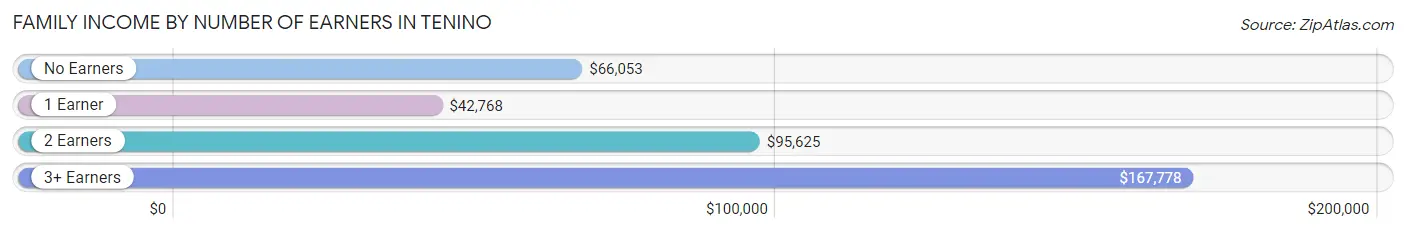
Family Income by Number of Earners in Tenino
The median family income in Tenino is $87,656, with families comprising 3+ earners (38) having the highest median family income of $167,778, while families with 1 earner (153) have the lowest median family income of $42,768, accounting for 8.3% and 33.3% of families, respectively.
| Number of Earners | # Families | Median Income |
| No Earners | 50 (10.9%) | $66,053 |
| 1 Earner | 153 (33.3%) | $42,768 |
| 2 Earners | 218 (47.5%) | $95,625 |
| 3+ Earners | 38 (8.3%) | $167,778 |
| Total | 459 (100.0%) | $87,656 |
Household Income in Tenino
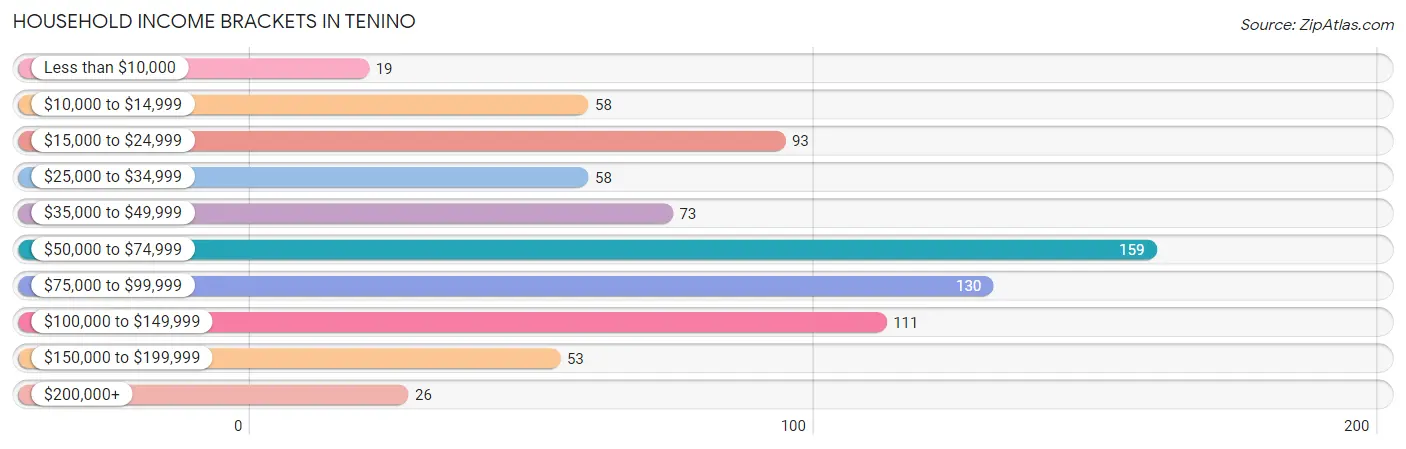
Household Income Brackets in Tenino
With 159 households falling in the category, the $50,000 to $74,999 income range is the most frequent in Tenino, accounting for 20.4% of all households. In contrast, only 19 households (2.4%) fall into the less than $10,000 income bracket, making it the least populous group.
| Income Bracket | # Households | % Households |
| Less than $10,000 | 19 | 2.4% |
| $10,000 to $14,999 | 58 | 7.4% |
| $15,000 to $24,999 | 93 | 11.9% |
| $25,000 to $34,999 | 58 | 7.4% |
| $35,000 to $49,999 | 73 | 9.4% |
| $50,000 to $74,999 | 159 | 20.4% |
| $75,000 to $99,999 | 130 | 16.7% |
| $100,000 to $149,999 | 111 | 14.2% |
| $150,000 to $199,999 | 53 | 6.8% |
| $200,000+ | 26 | 3.3% |
Household Income by Householder Age in Tenino
The median household income in Tenino is $63,654, with the highest median household income of $83,750 found in the 25 to 44 years age bracket for the primary householder. A total of 309 households (39.6%) fall into this category. Meanwhile, the 15 to 24 years age bracket for the primary householder has the lowest median household income of $0, with 89 households (11.4%) in this group.
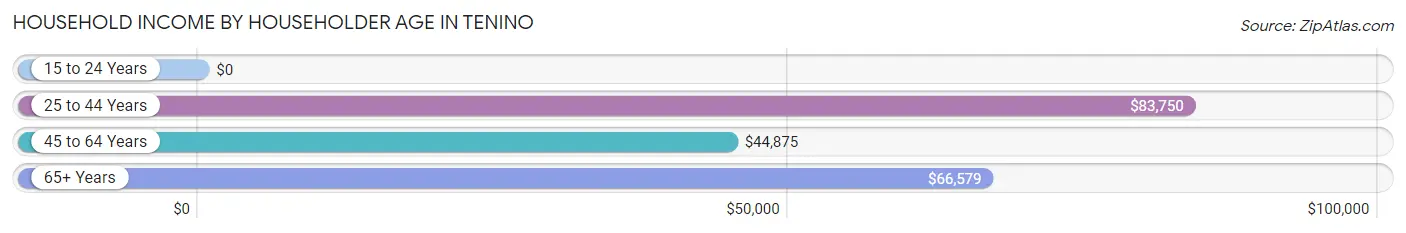
| Income Bracket | # Households | Median Income |
| 15 to 24 Years | 89 (11.4%) | $0 |
| 25 to 44 Years | 309 (39.6%) | $83,750 |
| 45 to 64 Years | 252 (32.3%) | $44,875 |
| 65+ Years | 130 (16.7%) | $66,579 |
| Total | 780 (100.0%) | $63,654 |
Poverty in Tenino
Income Below Poverty by Sex and Age in Tenino
With 16.3% poverty level for males and 19.7% for females among the residents of Tenino, 5 year old males and 16 and 17 year old females are the most vulnerable to poverty, with 5 males (100.0%) and 12 females (44.4%) in their respective age groups living below the poverty level.
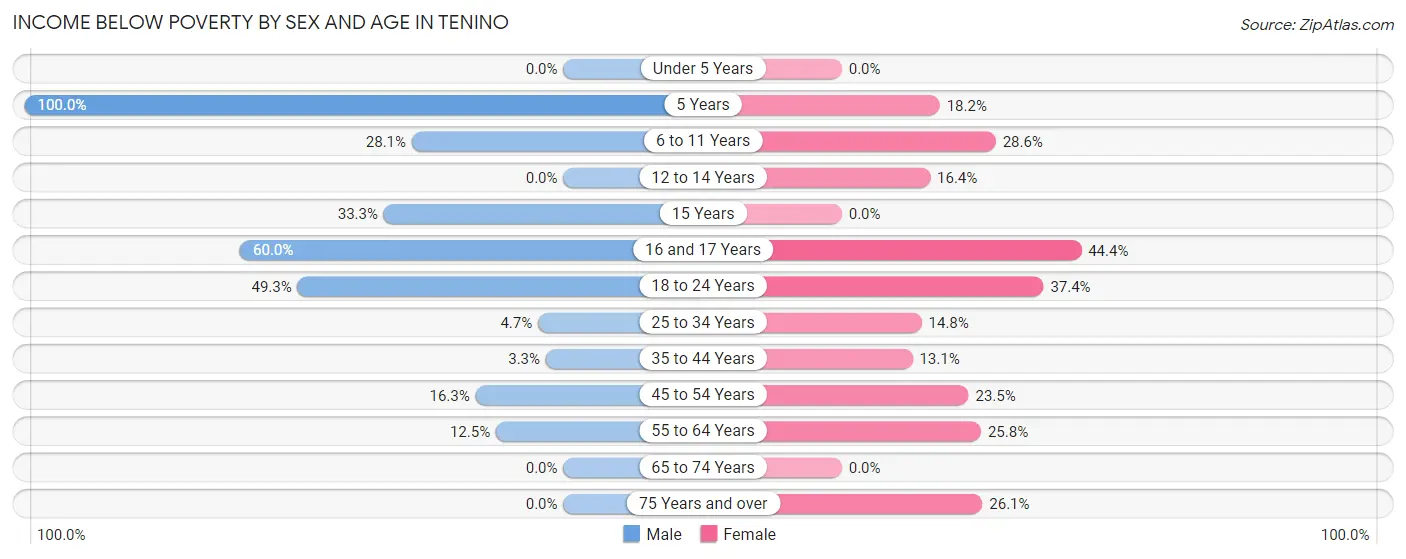
| Age Bracket | Male | Female |
| Under 5 Years | 0 (0.0%) | 0 (0.0%) |
| 5 Years | 5 (100.0%) | 4 (18.2%) |
| 6 to 11 Years | 9 (28.1%) | 24 (28.6%) |
| 12 to 14 Years | 0 (0.0%) | 10 (16.4%) |
| 15 Years | 2 (33.3%) | 0 (0.0%) |
| 16 and 17 Years | 6 (60.0%) | 12 (44.4%) |
| 18 to 24 Years | 75 (49.3%) | 67 (37.4%) |
| 25 to 34 Years | 7 (4.7%) | 24 (14.8%) |
| 35 to 44 Years | 4 (3.3%) | 21 (13.1%) |
| 45 to 54 Years | 15 (16.3%) | 24 (23.5%) |
| 55 to 64 Years | 8 (12.5%) | 46 (25.8%) |
| 65 to 74 Years | 0 (0.0%) | 0 (0.0%) |
| 75 Years and over | 0 (0.0%) | 12 (26.1%) |
| Total | 131 (16.3%) | 244 (19.7%) |
Income Above Poverty by Sex and Age in Tenino
According to the poverty statistics in Tenino, males aged under 5 years and females aged under 5 years are the age groups that are most secure financially, with 100.0% of males and 100.0% of females in these age groups living above the poverty line.
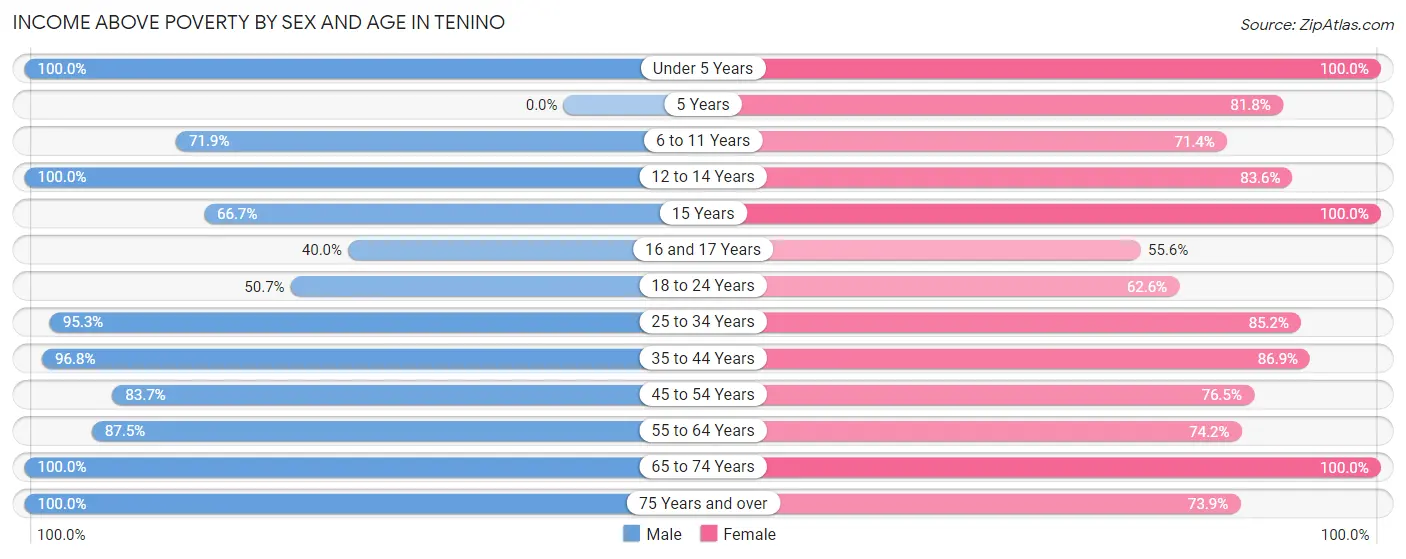
| Age Bracket | Male | Female |
| Under 5 Years | 35 (100.0%) | 154 (100.0%) |
| 5 Years | 0 (0.0%) | 18 (81.8%) |
| 6 to 11 Years | 23 (71.9%) | 60 (71.4%) |
| 12 to 14 Years | 14 (100.0%) | 51 (83.6%) |
| 15 Years | 4 (66.7%) | 15 (100.0%) |
| 16 and 17 Years | 4 (40.0%) | 15 (55.6%) |
| 18 to 24 Years | 77 (50.7%) | 112 (62.6%) |
| 25 to 34 Years | 142 (95.3%) | 138 (85.2%) |
| 35 to 44 Years | 119 (96.8%) | 139 (86.9%) |
| 45 to 54 Years | 77 (83.7%) | 78 (76.5%) |
| 55 to 64 Years | 56 (87.5%) | 132 (74.2%) |
| 65 to 74 Years | 88 (100.0%) | 50 (100.0%) |
| 75 Years and over | 35 (100.0%) | 34 (73.9%) |
| Total | 674 (83.7%) | 996 (80.3%) |
Income Below Poverty Among Married-Couple Families in Tenino
The poverty statistics for married-couple families in Tenino show that 0.9% or 3 of the total 344 families live below the poverty line. Families with no children have the highest poverty rate of 1.8%, comprising of 3 families. On the other hand, families with 1 or 2 children have the lowest poverty rate of 0.0%, which includes 0 families.
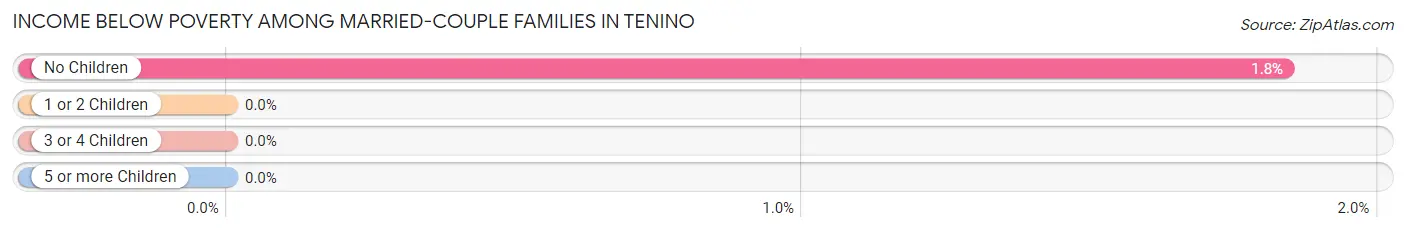
| Children | Above Poverty | Below Poverty |
| No Children | 160 (98.2%) | 3 (1.8%) |
| 1 or 2 Children | 167 (100.0%) | 0 (0.0%) |
| 3 or 4 Children | 14 (100.0%) | 0 (0.0%) |
| 5 or more Children | 0 (0.0%) | 0 (0.0%) |
| Total | 341 (99.1%) | 3 (0.9%) |
Income Below Poverty Among Single-Parent Households in Tenino
According to the poverty data in Tenino, 10.0% or 3 single-father households and 47.1% or 40 single-mother households are living below the poverty line. Among single-father households, those with no children have the highest poverty rate, with 3 households (17.6%) experiencing poverty. Likewise, among single-mother households, those with 5 or more children have the highest poverty rate, with 6 households (100.0%) falling below the poverty line.
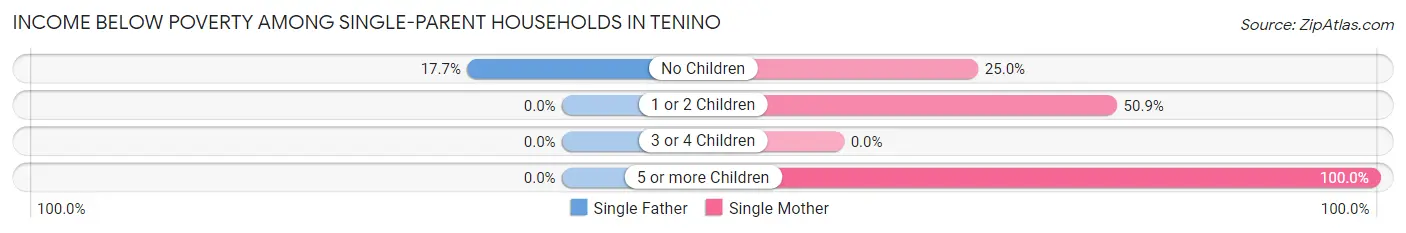
| Children | Single Father | Single Mother |
| No Children | 3 (17.6%) | 4 (25.0%) |
| 1 or 2 Children | 0 (0.0%) | 30 (50.8%) |
| 3 or 4 Children | 0 (0.0%) | 0 (0.0%) |
| 5 or more Children | 0 (0.0%) | 6 (100.0%) |
| Total | 3 (10.0%) | 40 (47.1%) |
Income Below Poverty Among Married-Couple vs Single-Parent Households in Tenino
The poverty data for Tenino shows that 3 of the married-couple family households (0.9%) and 43 of the single-parent households (37.4%) are living below the poverty level. Within the married-couple family households, those with no children have the highest poverty rate, with 3 households (1.8%) falling below the poverty line. Among the single-parent households, those with 5 or more children have the highest poverty rate, with 6 household (100.0%) living below poverty.
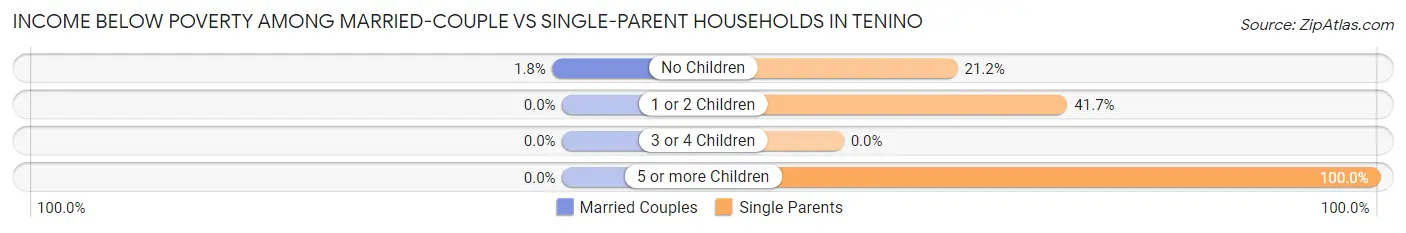
| Children | Married-Couple Families | Single-Parent Households |
| No Children | 3 (1.8%) | 7 (21.2%) |
| 1 or 2 Children | 0 (0.0%) | 30 (41.7%) |
| 3 or 4 Children | 0 (0.0%) | 0 (0.0%) |
| 5 or more Children | 0 (0.0%) | 6 (100.0%) |
| Total | 3 (0.9%) | 43 (37.4%) |
Race in Tenino
The most populous races in Tenino are White / Caucasian (1,697 | 83.0%), Two or more Races (251 | 12.3%), and Hispanic or Latino (140 | 6.9%).
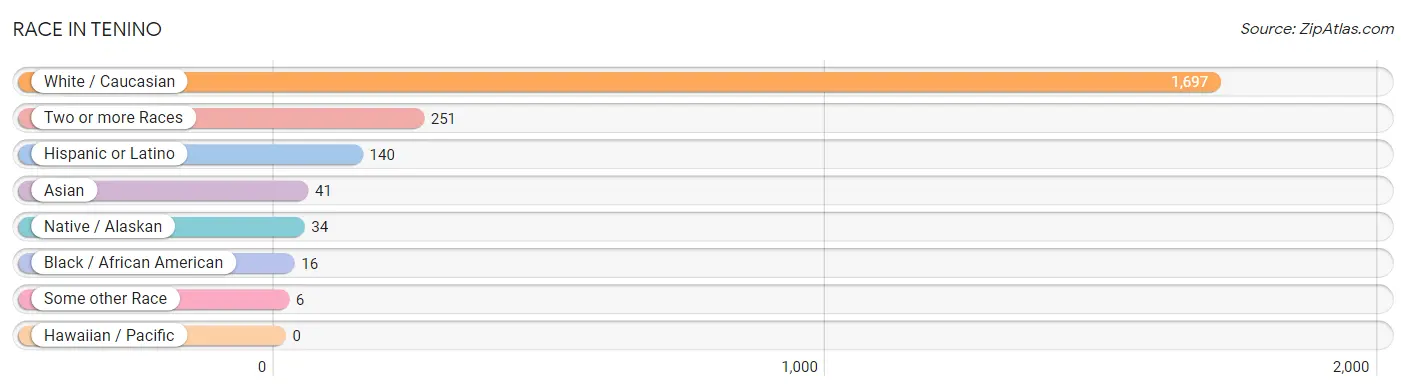
| Race | # Population | % Population |
| Asian | 41 | 2.0% |
| Black / African American | 16 | 0.8% |
| Hawaiian / Pacific | 0 | 0.0% |
| Hispanic or Latino | 140 | 6.9% |
| Native / Alaskan | 34 | 1.7% |
| White / Caucasian | 1,697 | 83.0% |
| Two or more Races | 251 | 12.3% |
| Some other Race | 6 | 0.3% |
| Total | 2,045 | 100.0% |
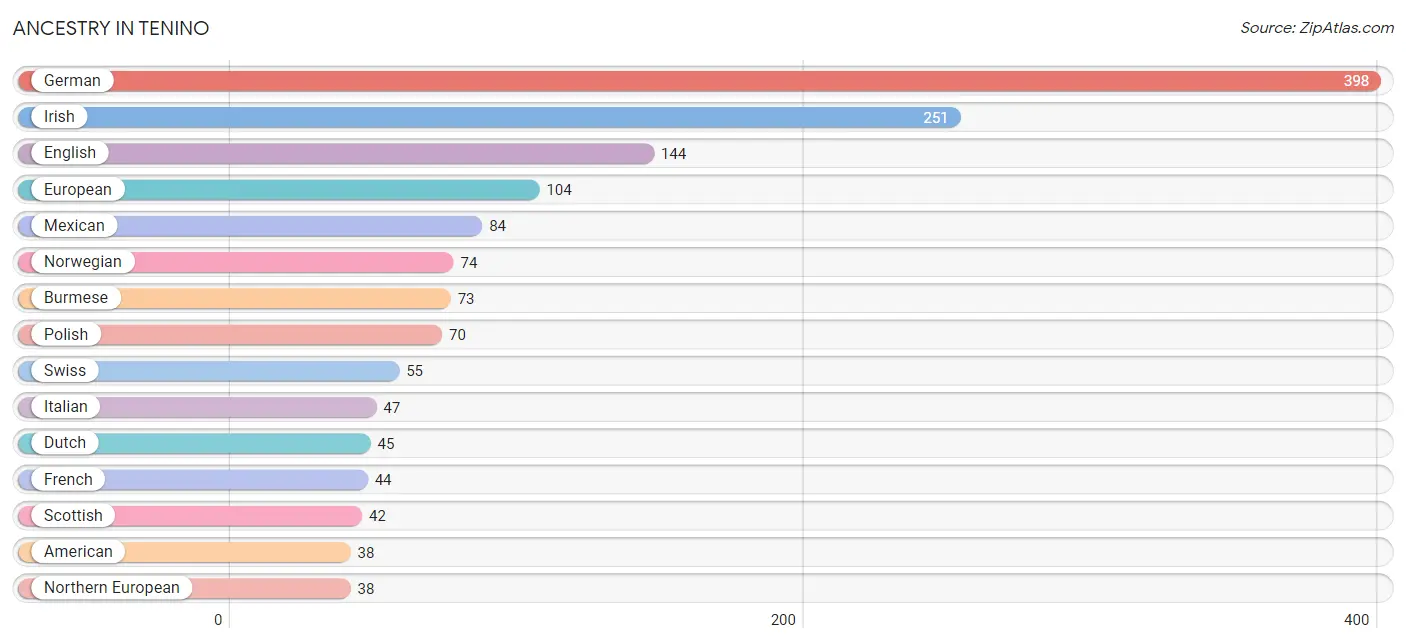
Ancestry in Tenino
The most populous ancestries reported in Tenino are German (398 | 19.5%), Irish (251 | 12.3%), English (144 | 7.0%), European (104 | 5.1%), and Mexican (84 | 4.1%), together accounting for 48.0% of all Tenino residents.
| Ancestry | # Population | % Population |
| American | 38 | 1.9% |
| Bhutanese | 3 | 0.2% |
| British | 35 | 1.7% |
| Burmese | 73 | 3.6% |
| Central American | 27 | 1.3% |
| Czech | 6 | 0.3% |
| Danish | 5 | 0.2% |
| Dutch | 45 | 2.2% |
| English | 144 | 7.0% |
| European | 104 | 5.1% |
| Finnish | 34 | 1.7% |
| French | 44 | 2.1% |
| French American Indian | 31 | 1.5% |
| German | 398 | 19.5% |
| Greek | 3 | 0.2% |
| Honduran | 27 | 1.3% |
| Icelander | 11 | 0.5% |
| Indian (Asian) | 12 | 0.6% |
| Irish | 251 | 12.3% |
| Italian | 47 | 2.3% |
| Jamaican | 15 | 0.7% |
| Japanese | 29 | 1.4% |
| Korean | 3 | 0.2% |
| Mexican | 84 | 4.1% |
| Native Hawaiian | 3 | 0.2% |
| Northern European | 38 | 1.9% |
| Norwegian | 74 | 3.6% |
| Polish | 70 | 3.4% |
| Portuguese | 2 | 0.1% |
| Russian | 9 | 0.4% |
| Scandinavian | 6 | 0.3% |
| Scotch-Irish | 31 | 1.5% |
| Scottish | 42 | 2.1% |
| Sioux | 35 | 1.7% |
| Spanish | 29 | 1.4% |
| Swedish | 32 | 1.6% |
| Swiss | 55 | 2.7% |
| Ukrainian | 4 | 0.2% |
| Welsh | 22 | 1.1% | View All 39 Rows |
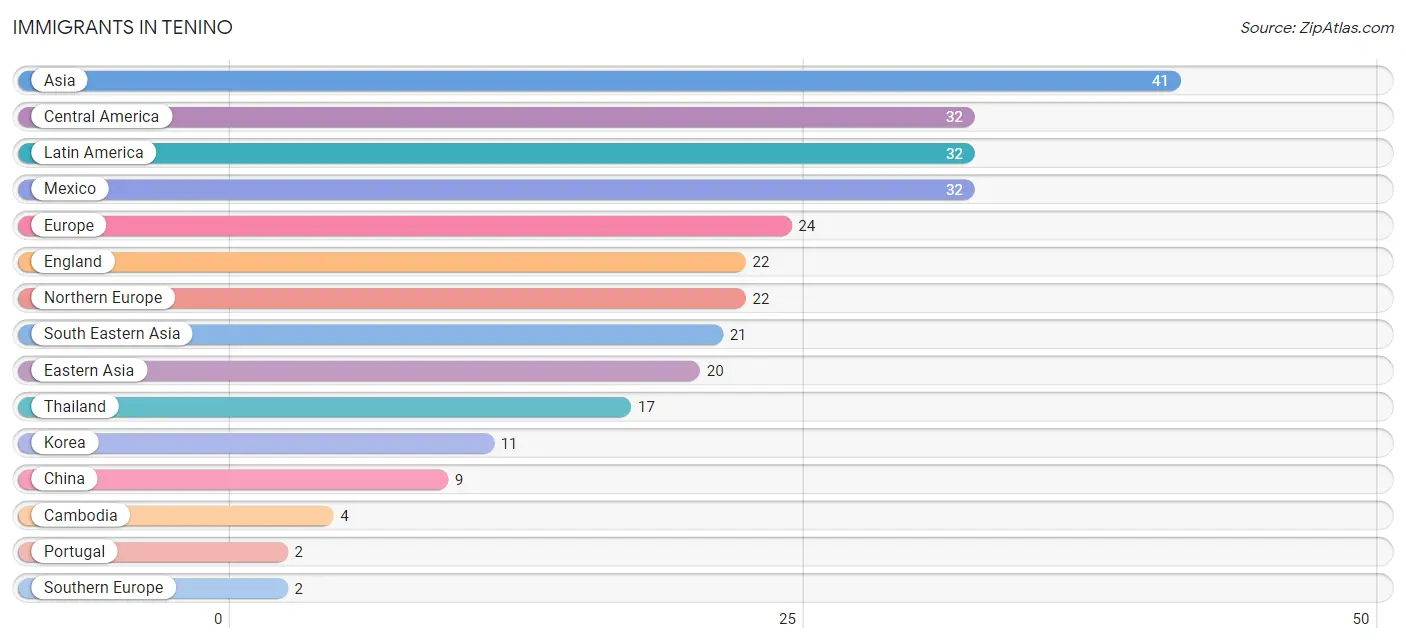
Immigrants in Tenino
The most numerous immigrant groups reported in Tenino came from Asia (41 | 2.0%), Central America (32 | 1.6%), Latin America (32 | 1.6%), Mexico (32 | 1.6%), and Europe (24 | 1.2%), together accounting for 7.9% of all Tenino residents.
| Immigration Origin | # Population | % Population |
| Asia | 41 | 2.0% |
| Cambodia | 4 | 0.2% |
| Central America | 32 | 1.6% |
| China | 9 | 0.4% |
| Eastern Asia | 20 | 1.0% |
| England | 22 | 1.1% |
| Europe | 24 | 1.2% |
| Korea | 11 | 0.5% |
| Latin America | 32 | 1.6% |
| Mexico | 32 | 1.6% |
| Northern Europe | 22 | 1.1% |
| Portugal | 2 | 0.1% |
| South Eastern Asia | 21 | 1.0% |
| Southern Europe | 2 | 0.1% |
| Thailand | 17 | 0.8% | View All 15 Rows |
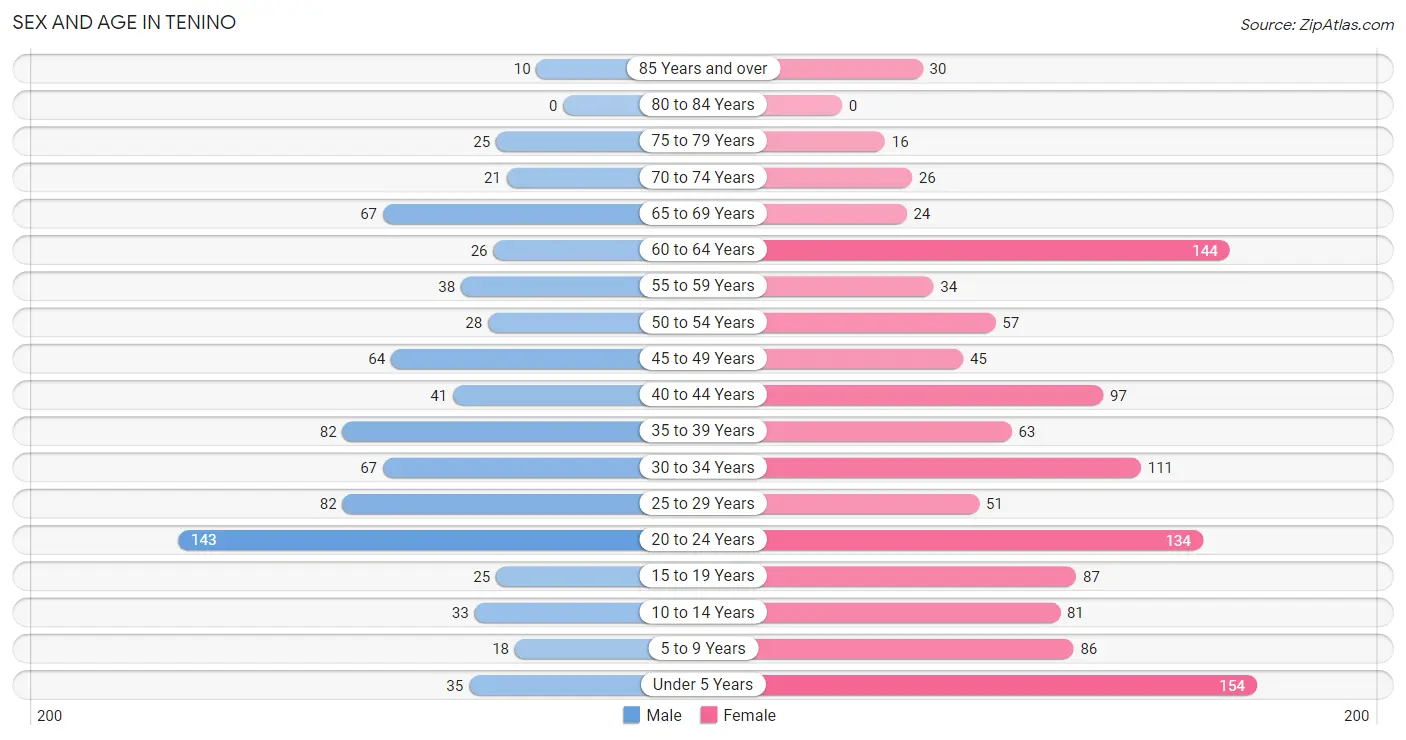
Sex and Age in Tenino
Sex and Age in Tenino
The most populous age groups in Tenino are 20 to 24 Years (143 | 17.8%) for men and Under 5 Years (154 | 12.4%) for women.
| Age Bracket | Male | Female |
| Under 5 Years | 35 (4.3%) | 154 (12.4%) |
| 5 to 9 Years | 18 (2.2%) | 86 (6.9%) |
| 10 to 14 Years | 33 (4.1%) | 81 (6.5%) |
| 15 to 19 Years | 25 (3.1%) | 87 (7.0%) |
| 20 to 24 Years | 143 (17.8%) | 134 (10.8%) |
| 25 to 29 Years | 82 (10.2%) | 51 (4.1%) |
| 30 to 34 Years | 67 (8.3%) | 111 (8.9%) |
| 35 to 39 Years | 82 (10.2%) | 63 (5.1%) |
| 40 to 44 Years | 41 (5.1%) | 97 (7.8%) |
| 45 to 49 Years | 64 (8.0%) | 45 (3.6%) |
| 50 to 54 Years | 28 (3.5%) | 57 (4.6%) |
| 55 to 59 Years | 38 (4.7%) | 34 (2.7%) |
| 60 to 64 Years | 26 (3.2%) | 144 (11.6%) |
| 65 to 69 Years | 67 (8.3%) | 24 (1.9%) |
| 70 to 74 Years | 21 (2.6%) | 26 (2.1%) |
| 75 to 79 Years | 25 (3.1%) | 16 (1.3%) |
| 80 to 84 Years | 0 (0.0%) | 0 (0.0%) |
| 85 Years and over | 10 (1.2%) | 30 (2.4%) |
| Total | 805 (100.0%) | 1,240 (100.0%) |
Families and Households in Tenino
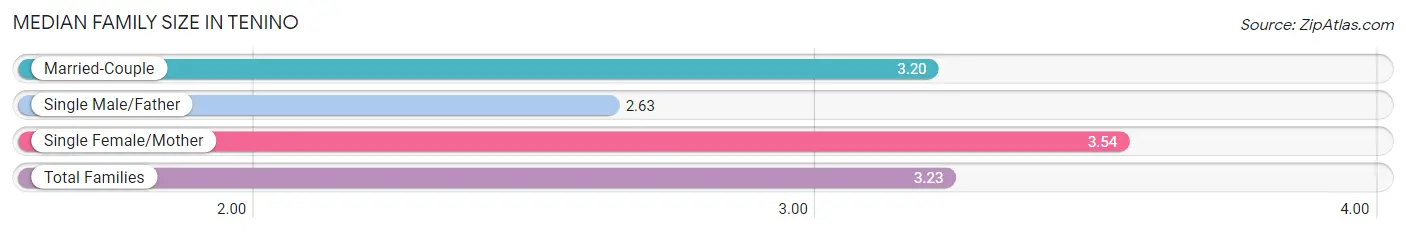
Median Family Size in Tenino
The median family size in Tenino is 3.23 persons per family, with single female/mother families (85 | 18.5%) accounting for the largest median family size of 3.54 persons per family. On the other hand, single male/father families (30 | 6.5%) represent the smallest median family size with 2.63 persons per family.
| Family Type | # Families | Family Size |
| Married-Couple | 344 (75.0%) | 3.20 |
| Single Male/Father | 30 (6.5%) | 2.63 |
| Single Female/Mother | 85 (18.5%) | 3.54 |
| Total Families | 459 (100.0%) | 3.23 |
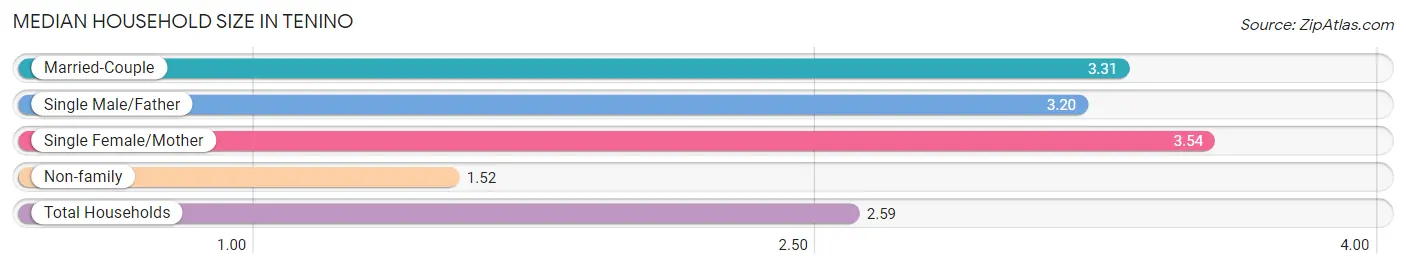
Median Household Size in Tenino
The median household size in Tenino is 2.59 persons per household, with single female/mother households (85 | 10.9%) accounting for the largest median household size of 3.54 persons per household. non-family households (321 | 41.1%) represent the smallest median household size with 1.52 persons per household.
| Household Type | # Households | Household Size |
| Married-Couple | 344 (44.1%) | 3.31 |
| Single Male/Father | 30 (3.8%) | 3.20 |
| Single Female/Mother | 85 (10.9%) | 3.54 |
| Non-family | 321 (41.1%) | 1.52 |
| Total Households | 780 (100.0%) | 2.59 |
Household Size by Marriage Status in Tenino
Out of a total of 780 households in Tenino, 459 (58.9%) are family households, while 321 (41.1%) are nonfamily households. The most numerous type of family households are 2-person households, comprising 152, and the most common type of nonfamily households are 1-person households, comprising 184.
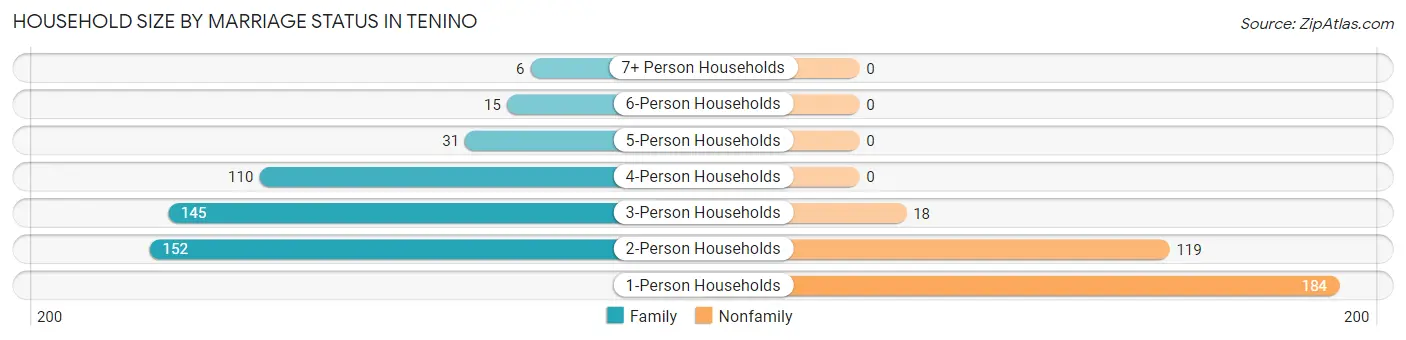
| Household Size | Family Households | Nonfamily Households |
| 1-Person Households | - | 184 (23.6%) |
| 2-Person Households | 152 (19.5%) | 119 (15.3%) |
| 3-Person Households | 145 (18.6%) | 18 (2.3%) |
| 4-Person Households | 110 (14.1%) | 0 (0.0%) |
| 5-Person Households | 31 (4.0%) | 0 (0.0%) |
| 6-Person Households | 15 (1.9%) | 0 (0.0%) |
| 7+ Person Households | 6 (0.8%) | 0 (0.0%) |
| Total | 459 (58.9%) | 321 (41.1%) |
Female Fertility in Tenino
Fertility by Age in Tenino
Average fertility rate in Tenino is 58.0 births per 1,000 women. Women in the age bracket of 35 to 50 years have the highest fertility rate with 102.0 births per 1,000 women. Women in the age bracket of 35 to 50 years acount for 61.8% of all women with births.
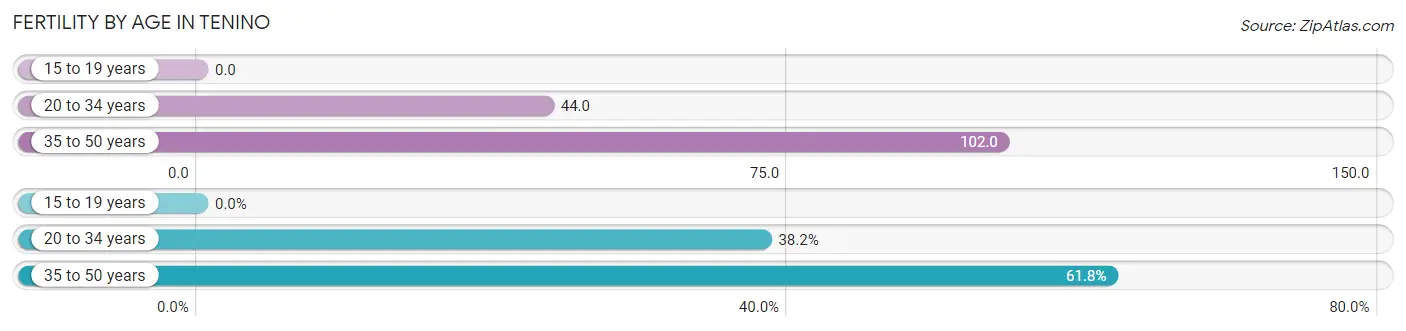
| Age Bracket | Women with Births | Births / 1,000 Women |
| 15 to 19 years | 0 (0.0%) | 0.0 |
| 20 to 34 years | 13 (38.2%) | 44.0 |
| 35 to 50 years | 21 (61.8%) | 102.0 |
| Total | 34 (100.0%) | 58.0 |
Fertility by Age by Marriage Status in Tenino
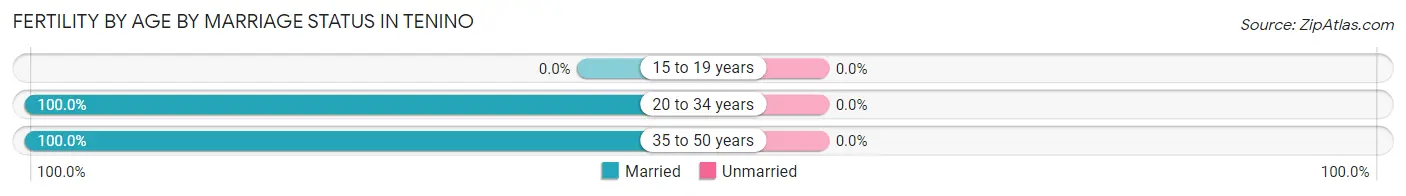
| Age Bracket | Married | Unmarried |
| 15 to 19 years | 0 (0.0%) | 0 (0.0%) |
| 20 to 34 years | 13 (100.0%) | 0 (0.0%) |
| 35 to 50 years | 21 (100.0%) | 0 (0.0%) |
| Total | 34 (100.0%) | 0 (0.0%) |
Fertility by Education in Tenino
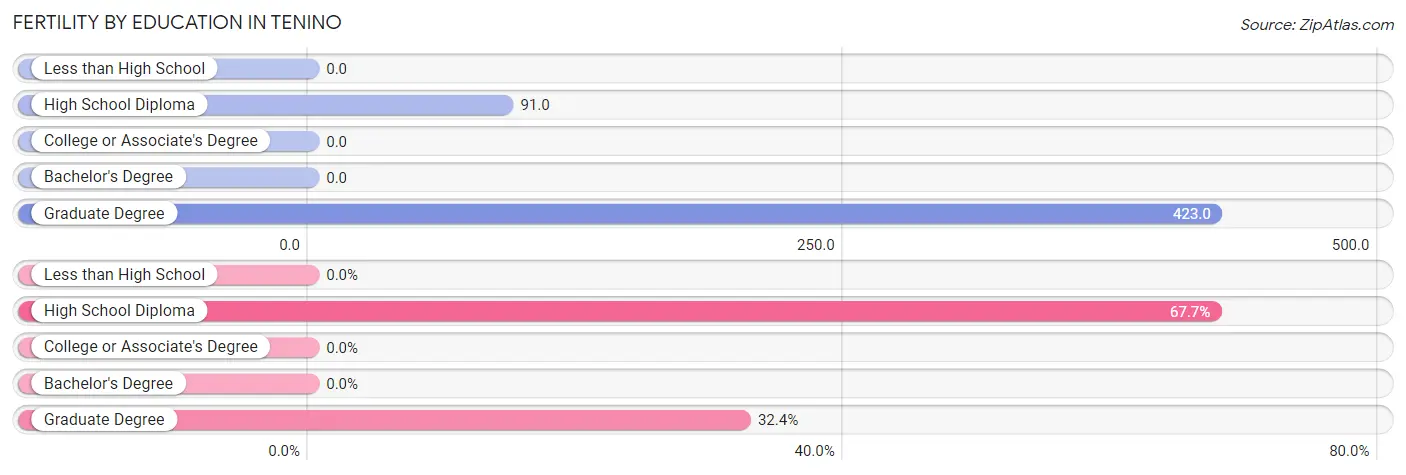
| Educational Attainment | Women with Births | Births / 1,000 Women |
| Less than High School | 0 (0.0%) | 0.0 |
| High School Diploma | 23 (67.6%) | 91.0 |
| College or Associate's Degree | 0 (0.0%) | 0.0 |
| Bachelor's Degree | 0 (0.0%) | 0.0 |
| Graduate Degree | 11 (32.4%) | 423.0 |
| Total | 34 (100.0%) | 58.0 |
Fertility by Education by Marriage Status in Tenino
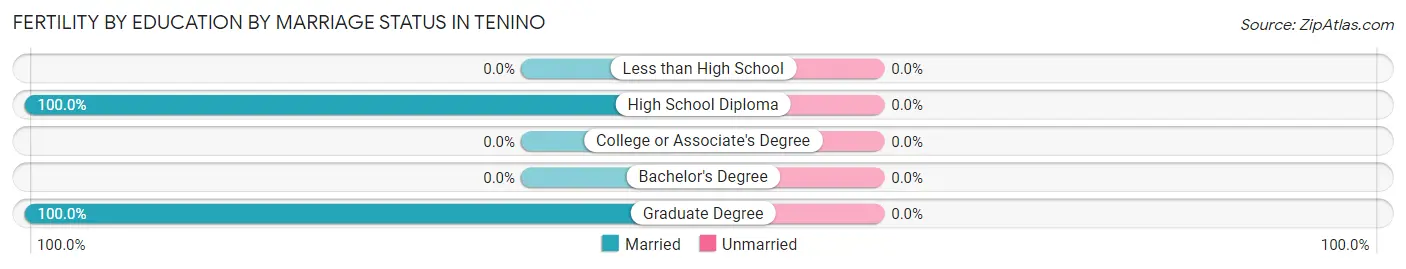
| Educational Attainment | Married | Unmarried |
| Less than High School | 0 (0.0%) | 0 (0.0%) |
| High School Diploma | 23 (100.0%) | 0 (0.0%) |
| College or Associate's Degree | 0 (0.0%) | 0 (0.0%) |
| Bachelor's Degree | 0 (0.0%) | 0 (0.0%) |
| Graduate Degree | 11 (100.0%) | 0 (0.0%) |
| Total | 34 (100.0%) | 0 (0.0%) |
Employment Characteristics in Tenino
Employment by Class of Employer in Tenino
Among the 983 employed individuals in Tenino, private company employees (586 | 59.6%), state government employees (219 | 22.3%), and not-for-profit organizations (59 | 6.0%) make up the most common classes of employment.
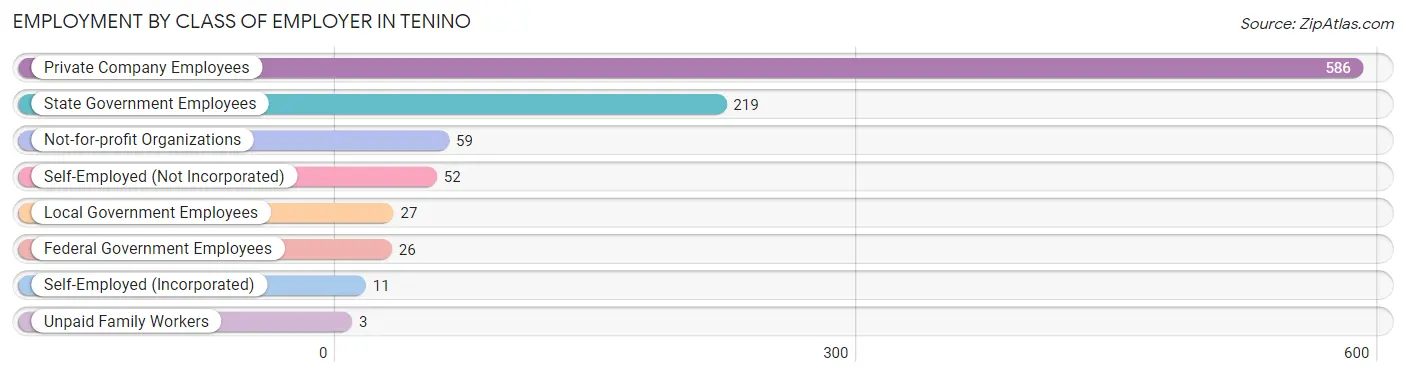
| Employer Class | # Employees | % Employees |
| Private Company Employees | 586 | 59.6% |
| Self-Employed (Incorporated) | 11 | 1.1% |
| Self-Employed (Not Incorporated) | 52 | 5.3% |
| Not-for-profit Organizations | 59 | 6.0% |
| Local Government Employees | 27 | 2.8% |
| State Government Employees | 219 | 22.3% |
| Federal Government Employees | 26 | 2.6% |
| Unpaid Family Workers | 3 | 0.3% |
| Total | 983 | 100.0% |
Employment Status by Age in Tenino
According to the labor force statistics for Tenino, out of the total population over 16 years of age (1,617), 64.6% or 1,045 individuals are in the labor force, with 4.6% or 48 of them unemployed. The age group with the highest labor force participation rate is 25 to 29 years, with 92.5% or 123 individuals in the labor force. Within the labor force, the 65 to 74 years age range has the highest percentage of unemployed individuals, with 33.3% or 6 of them being unemployed.
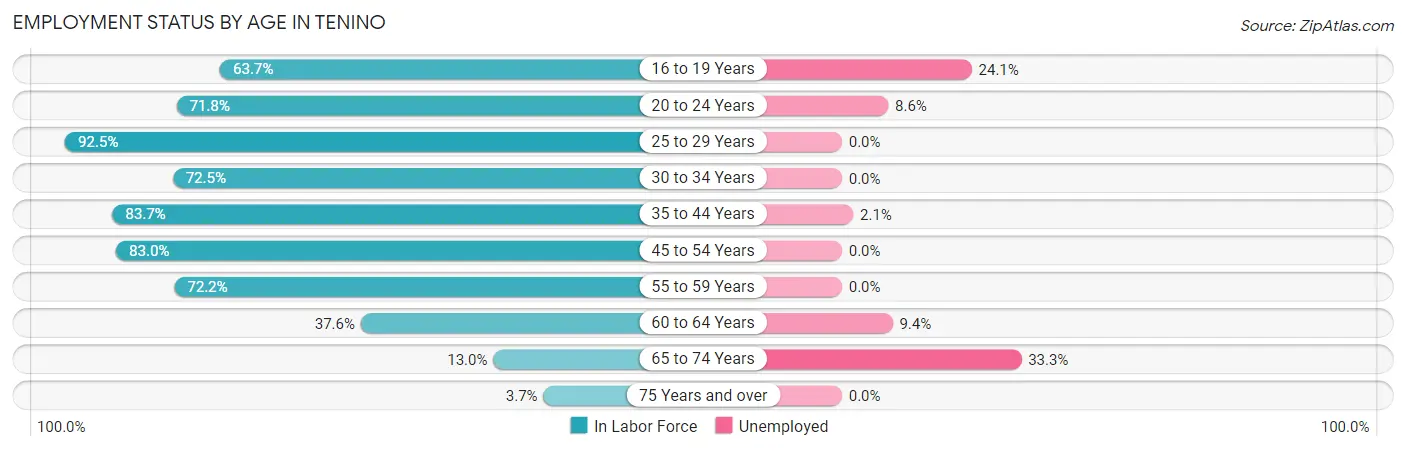
| Age Bracket | In Labor Force | Unemployed |
| 16 to 19 Years | 58 (63.7%) | 14 (24.1%) |
| 20 to 24 Years | 199 (71.8%) | 17 (8.6%) |
| 25 to 29 Years | 123 (92.5%) | 0 (0.0%) |
| 30 to 34 Years | 129 (72.5%) | 0 (0.0%) |
| 35 to 44 Years | 237 (83.7%) | 5 (2.1%) |
| 45 to 54 Years | 161 (83.0%) | 0 (0.0%) |
| 55 to 59 Years | 52 (72.2%) | 0 (0.0%) |
| 60 to 64 Years | 64 (37.6%) | 6 (9.4%) |
| 65 to 74 Years | 18 (13.0%) | 6 (33.3%) |
| 75 Years and over | 3 (3.7%) | 0 (0.0%) |
| Total | 1,045 (64.6%) | 48 (4.6%) |
Employment Status by Educational Attainment in Tenino
According to labor force statistics for Tenino, 74.4% of individuals (766) out of the total population between 25 and 64 years of age (1,030) are in the labor force, with 1.4% or 11 of them being unemployed. The group with the highest labor force participation rate are those with the educational attainment of bachelor's degree or higher, with 88.2% or 201 individuals in the labor force. Within the labor force, individuals with bachelor's degree or higher education have the highest percentage of unemployment, with 4.0% or 8 of them being unemployed.
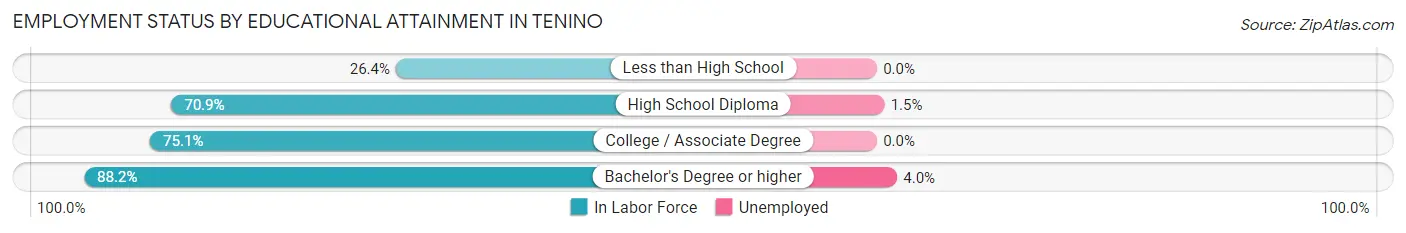
| Educational Attainment | In Labor Force | Unemployed |
| Less than High School | 14 (26.4%) | 0 (0.0%) |
| High School Diploma | 195 (70.9%) | 4 (1.5%) |
| College / Associate Degree | 356 (75.1%) | 0 (0.0%) |
| Bachelor's Degree or higher | 201 (88.2%) | 9 (4.0%) |
| Total | 766 (74.4%) | 14 (1.4%) |
Employment Occupations by Sex in Tenino
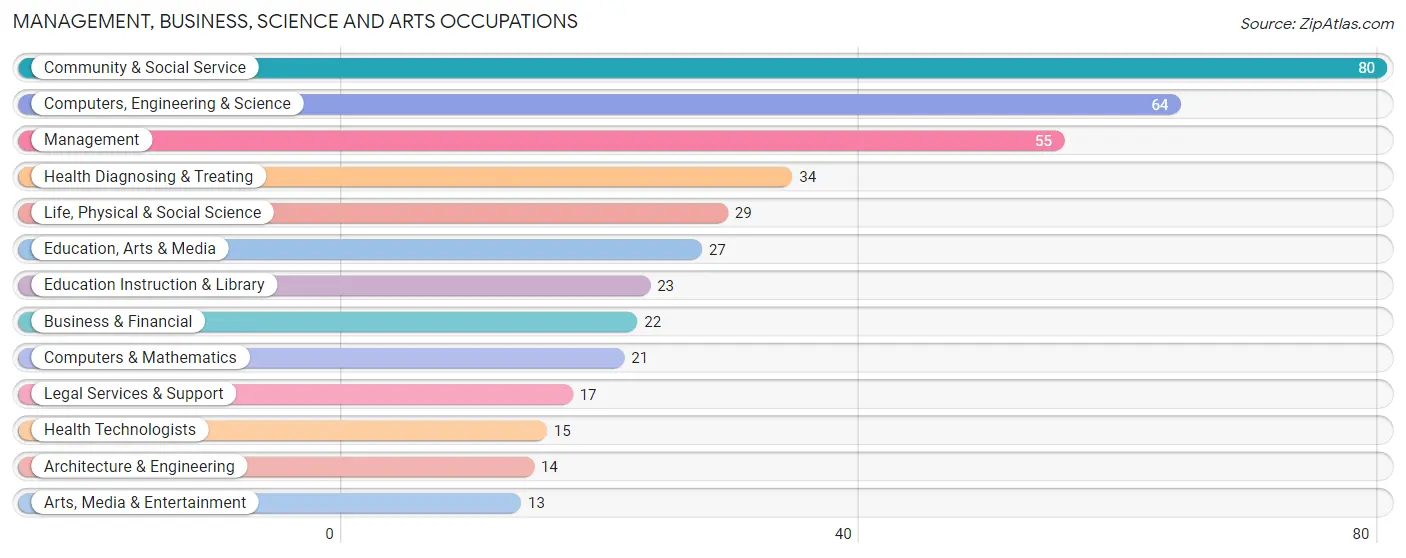
Management, Business, Science and Arts Occupations
The most common Management, Business, Science and Arts occupations in Tenino are Community & Social Service (80 | 8.2%), Computers, Engineering & Science (64 | 6.5%), Management (55 | 5.6%), Health Diagnosing & Treating (34 | 3.5%), and Life, Physical & Social Science (29 | 3.0%).
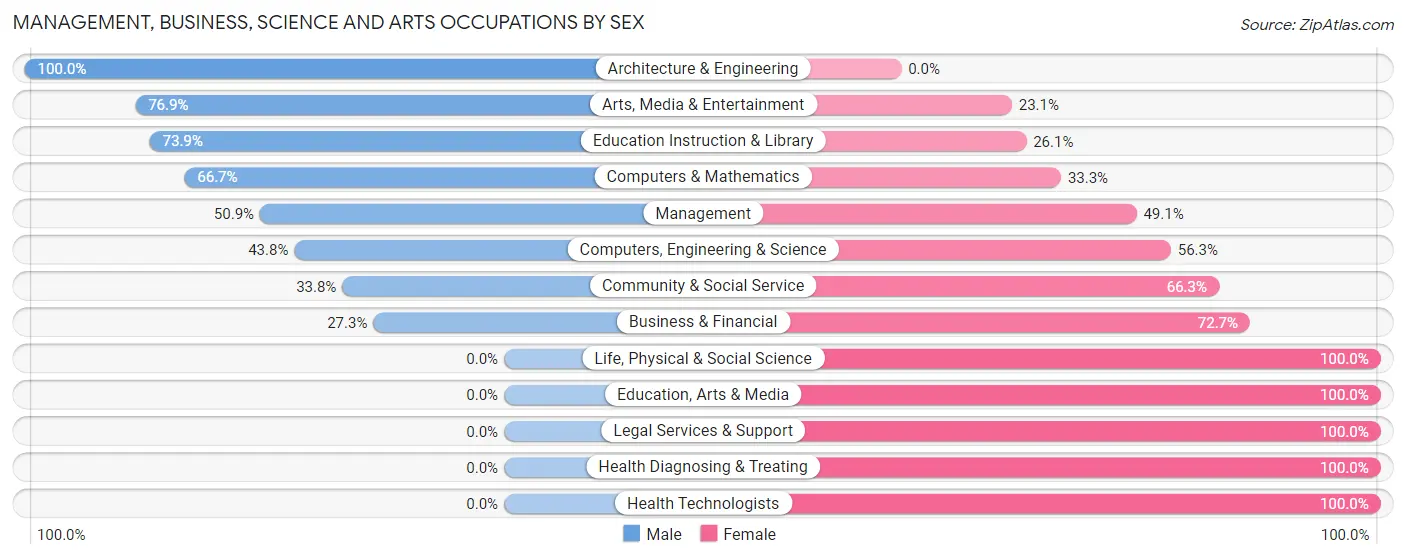
Management, Business, Science and Arts Occupations by Sex
Within the Management, Business, Science and Arts occupations in Tenino, the most male-oriented occupations are Architecture & Engineering (100.0%), Arts, Media & Entertainment (76.9%), and Education Instruction & Library (73.9%), while the most female-oriented occupations are Life, Physical & Social Science (100.0%), Education, Arts & Media (100.0%), and Legal Services & Support (100.0%).
| Occupation | Male | Female |
| Management | 28 (50.9%) | 27 (49.1%) |
| Business & Financial | 6 (27.3%) | 16 (72.7%) |
| Computers, Engineering & Science | 28 (43.8%) | 36 (56.2%) |
| Computers & Mathematics | 14 (66.7%) | 7 (33.3%) |
| Architecture & Engineering | 14 (100.0%) | 0 (0.0%) |
| Life, Physical & Social Science | 0 (0.0%) | 29 (100.0%) |
| Community & Social Service | 27 (33.8%) | 53 (66.2%) |
| Education, Arts & Media | 0 (0.0%) | 27 (100.0%) |
| Legal Services & Support | 0 (0.0%) | 17 (100.0%) |
| Education Instruction & Library | 17 (73.9%) | 6 (26.1%) |
| Arts, Media & Entertainment | 10 (76.9%) | 3 (23.1%) |
| Health Diagnosing & Treating | 0 (0.0%) | 34 (100.0%) |
| Health Technologists | 0 (0.0%) | 15 (100.0%) |
| Total (Category) | 89 (34.9%) | 166 (65.1%) |
| Total (Overall) | 475 (48.4%) | 506 (51.6%) |
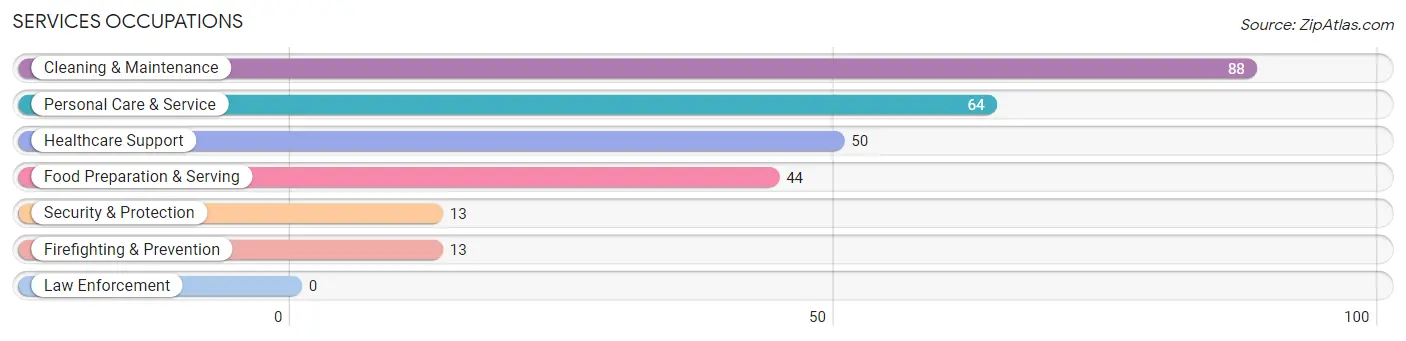
Services Occupations
The most common Services occupations in Tenino are Cleaning & Maintenance (88 | 9.0%), Personal Care & Service (64 | 6.5%), Healthcare Support (50 | 5.1%), Food Preparation & Serving (44 | 4.5%), and Security & Protection (13 | 1.3%).
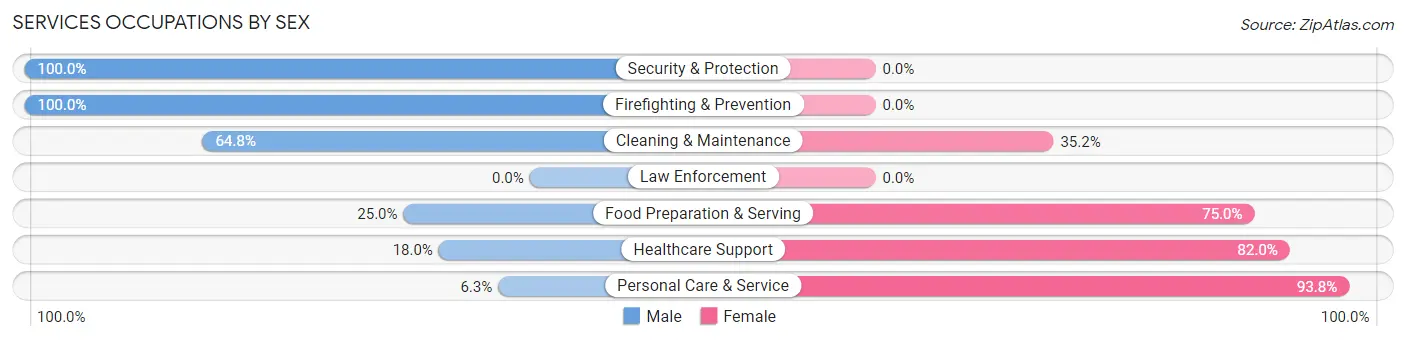
Services Occupations by Sex
Within the Services occupations in Tenino, the most male-oriented occupations are Security & Protection (100.0%), Firefighting & Prevention (100.0%), and Cleaning & Maintenance (64.8%), while the most female-oriented occupations are Personal Care & Service (93.8%), Healthcare Support (82.0%), and Food Preparation & Serving (75.0%).
| Occupation | Male | Female |
| Healthcare Support | 9 (18.0%) | 41 (82.0%) |
| Security & Protection | 13 (100.0%) | 0 (0.0%) |
| Firefighting & Prevention | 13 (100.0%) | 0 (0.0%) |
| Law Enforcement | 0 (0.0%) | 0 (0.0%) |
| Food Preparation & Serving | 11 (25.0%) | 33 (75.0%) |
| Cleaning & Maintenance | 57 (64.8%) | 31 (35.2%) |
| Personal Care & Service | 4 (6.2%) | 60 (93.8%) |
| Total (Category) | 94 (36.3%) | 165 (63.7%) |
| Total (Overall) | 475 (48.4%) | 506 (51.6%) |
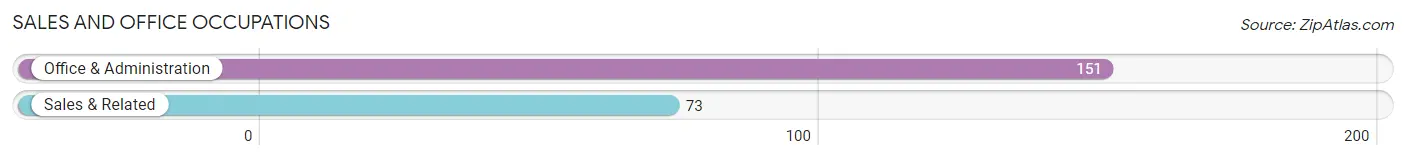
Sales and Office Occupations
The most common Sales and Office occupations in Tenino are Office & Administration (151 | 15.4%), and Sales & Related (73 | 7.4%).
Sales and Office Occupations by Sex
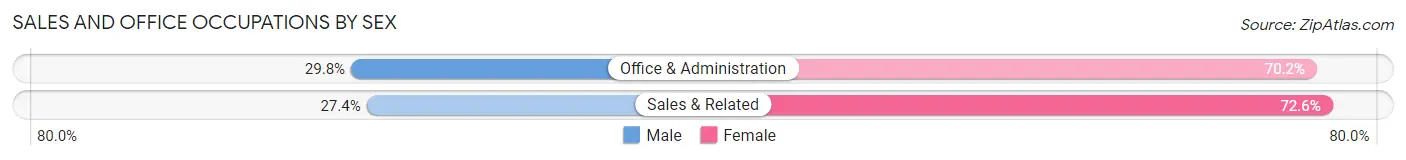
| Occupation | Male | Female |
| Sales & Related | 20 (27.4%) | 53 (72.6%) |
| Office & Administration | 45 (29.8%) | 106 (70.2%) |
| Total (Category) | 65 (29.0%) | 159 (71.0%) |
| Total (Overall) | 475 (48.4%) | 506 (51.6%) |
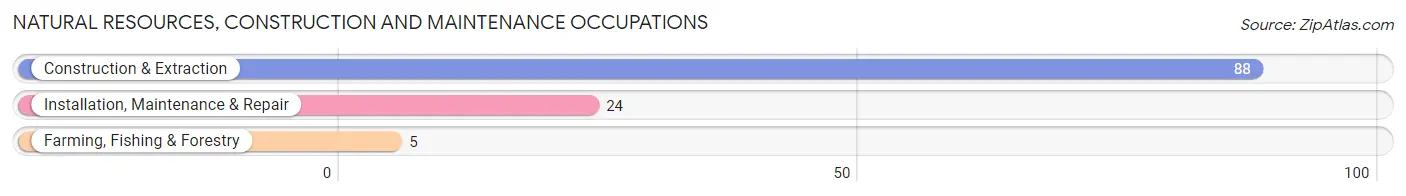
Natural Resources, Construction and Maintenance Occupations
The most common Natural Resources, Construction and Maintenance occupations in Tenino are Construction & Extraction (88 | 9.0%), Installation, Maintenance & Repair (24 | 2.5%), and Farming, Fishing & Forestry (5 | 0.5%).
Natural Resources, Construction and Maintenance Occupations by Sex
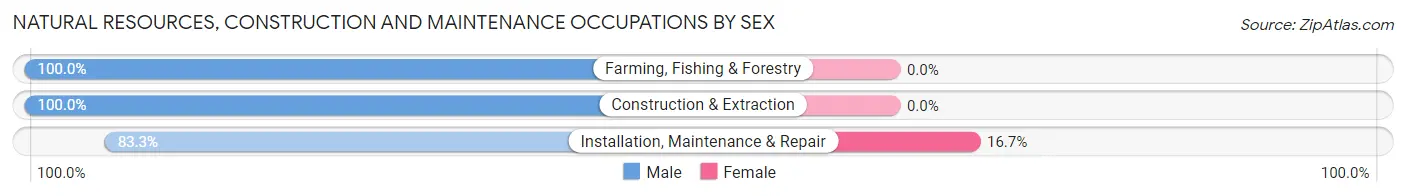
| Occupation | Male | Female |
| Farming, Fishing & Forestry | 5 (100.0%) | 0 (0.0%) |
| Construction & Extraction | 88 (100.0%) | 0 (0.0%) |
| Installation, Maintenance & Repair | 20 (83.3%) | 4 (16.7%) |
| Total (Category) | 113 (96.6%) | 4 (3.4%) |
| Total (Overall) | 475 (48.4%) | 506 (51.6%) |
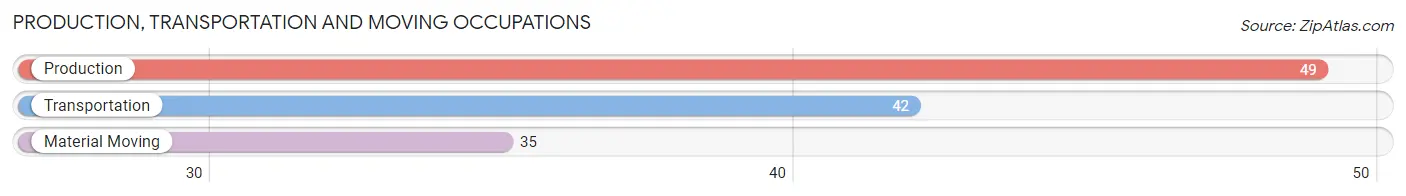
Production, Transportation and Moving Occupations
The most common Production, Transportation and Moving occupations in Tenino are Production (49 | 5.0%), Transportation (42 | 4.3%), and Material Moving (35 | 3.6%).
Production, Transportation and Moving Occupations by Sex
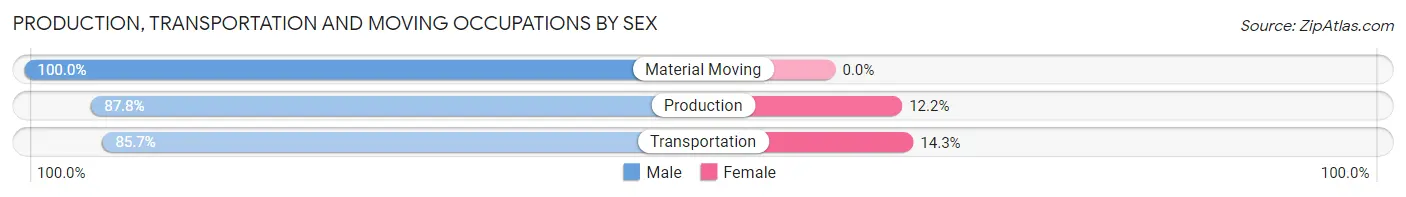
| Occupation | Male | Female |
| Production | 43 (87.8%) | 6 (12.2%) |
| Transportation | 36 (85.7%) | 6 (14.3%) |
| Material Moving | 35 (100.0%) | 0 (0.0%) |
| Total (Category) | 114 (90.5%) | 12 (9.5%) |
| Total (Overall) | 475 (48.4%) | 506 (51.6%) |
Employment Industries by Sex in Tenino
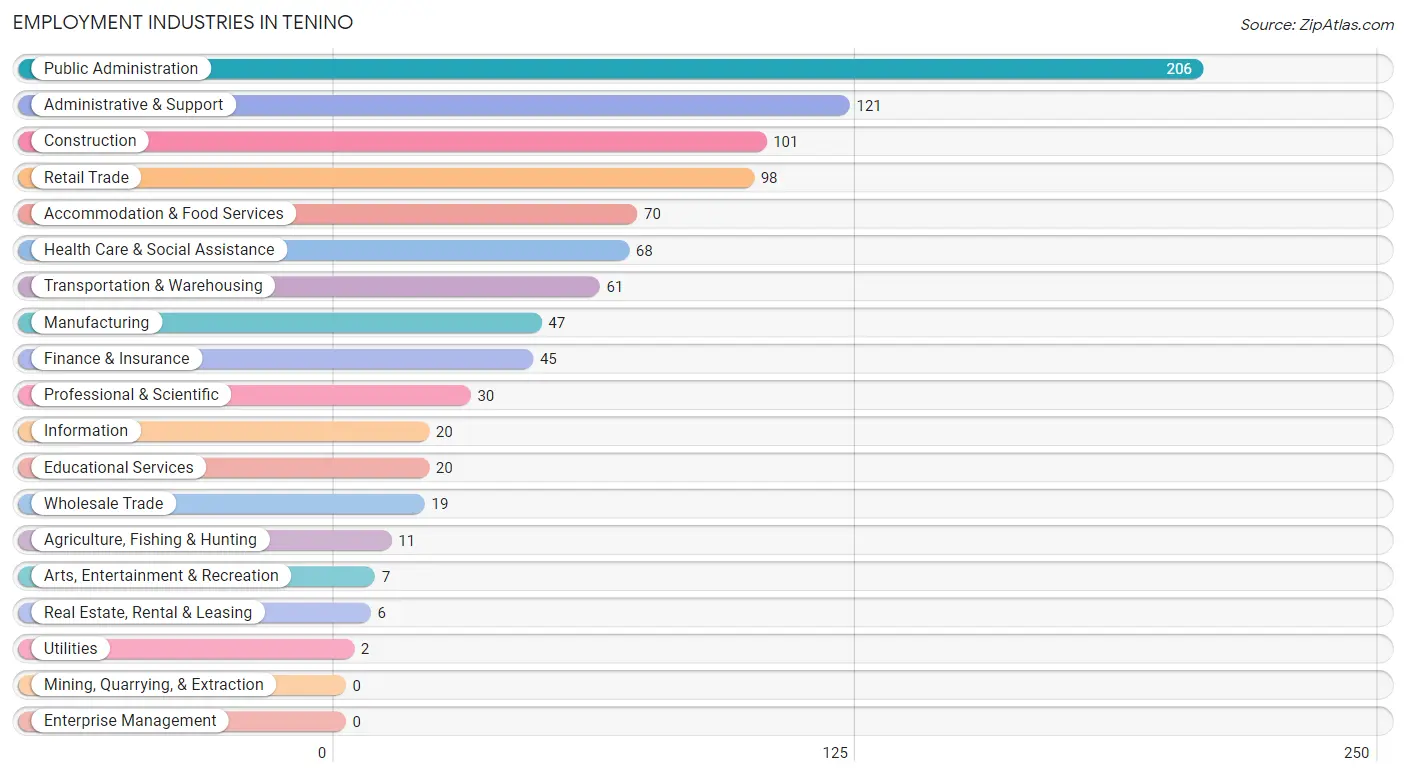
Employment Industries in Tenino
The major employment industries in Tenino include Public Administration (206 | 21.0%), Administrative & Support (121 | 12.3%), Construction (101 | 10.3%), Retail Trade (98 | 10.0%), and Accommodation & Food Services (70 | 7.1%).
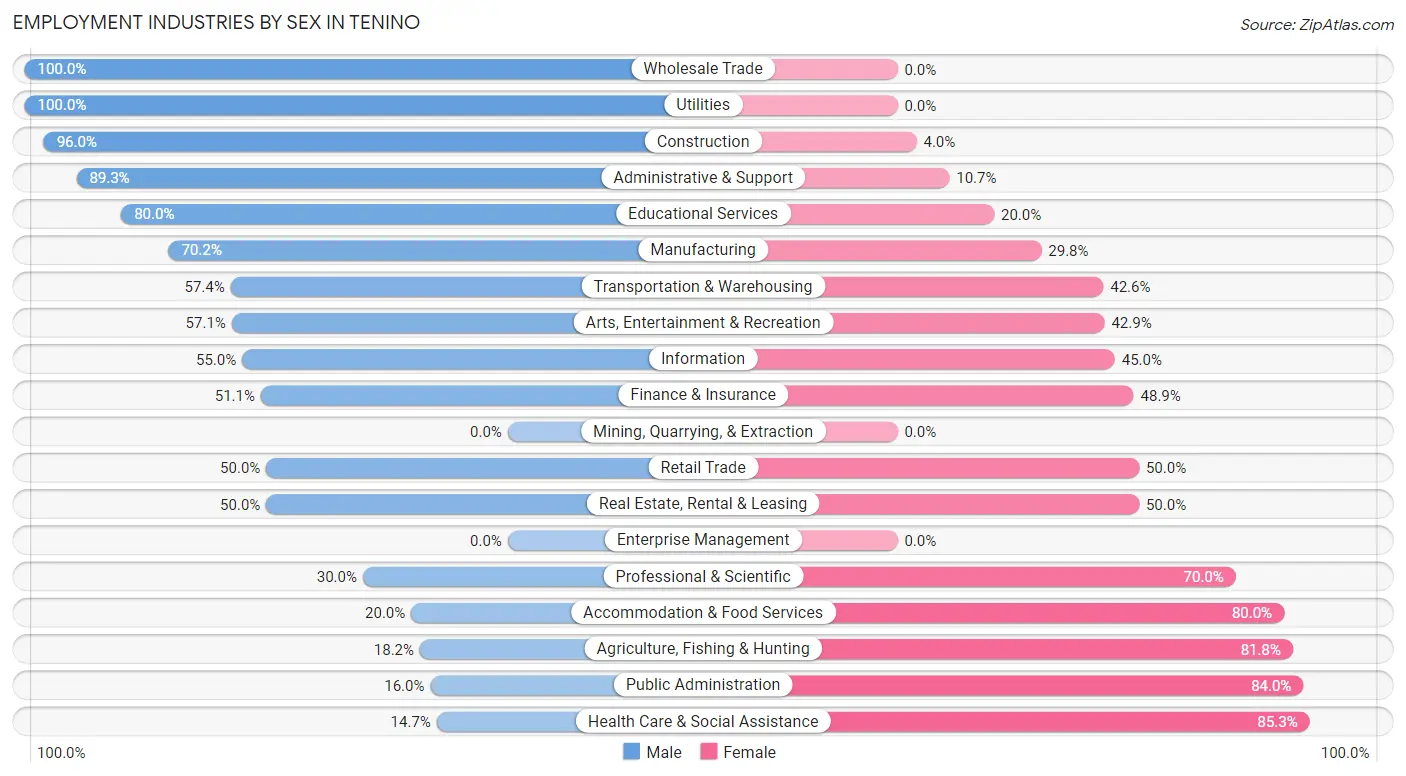
Employment Industries by Sex in Tenino
The Tenino industries that see more men than women are Wholesale Trade (100.0%), Utilities (100.0%), and Construction (96.0%), whereas the industries that tend to have a higher number of women are Health Care & Social Assistance (85.3%), Public Administration (84.0%), and Agriculture, Fishing & Hunting (81.8%).
| Industry | Male | Female |
| Agriculture, Fishing & Hunting | 2 (18.2%) | 9 (81.8%) |
| Mining, Quarrying, & Extraction | 0 (0.0%) | 0 (0.0%) |
| Construction | 97 (96.0%) | 4 (4.0%) |
| Manufacturing | 33 (70.2%) | 14 (29.8%) |
| Wholesale Trade | 19 (100.0%) | 0 (0.0%) |
| Retail Trade | 49 (50.0%) | 49 (50.0%) |
| Transportation & Warehousing | 35 (57.4%) | 26 (42.6%) |
| Utilities | 2 (100.0%) | 0 (0.0%) |
| Information | 11 (55.0%) | 9 (45.0%) |
| Finance & Insurance | 23 (51.1%) | 22 (48.9%) |
| Real Estate, Rental & Leasing | 3 (50.0%) | 3 (50.0%) |
| Professional & Scientific | 9 (30.0%) | 21 (70.0%) |
| Enterprise Management | 0 (0.0%) | 0 (0.0%) |
| Administrative & Support | 108 (89.3%) | 13 (10.7%) |
| Educational Services | 16 (80.0%) | 4 (20.0%) |
| Health Care & Social Assistance | 10 (14.7%) | 58 (85.3%) |
| Arts, Entertainment & Recreation | 4 (57.1%) | 3 (42.9%) |
| Accommodation & Food Services | 14 (20.0%) | 56 (80.0%) |
| Public Administration | 33 (16.0%) | 173 (84.0%) |
| Total | 475 (48.4%) | 506 (51.6%) |
Education in Tenino
School Enrollment in Tenino
The most common levels of schooling among the 357 students in Tenino are middle school (89 | 24.9%), high school (78 | 21.8%), and college / undergraduate (75 | 21.0%).
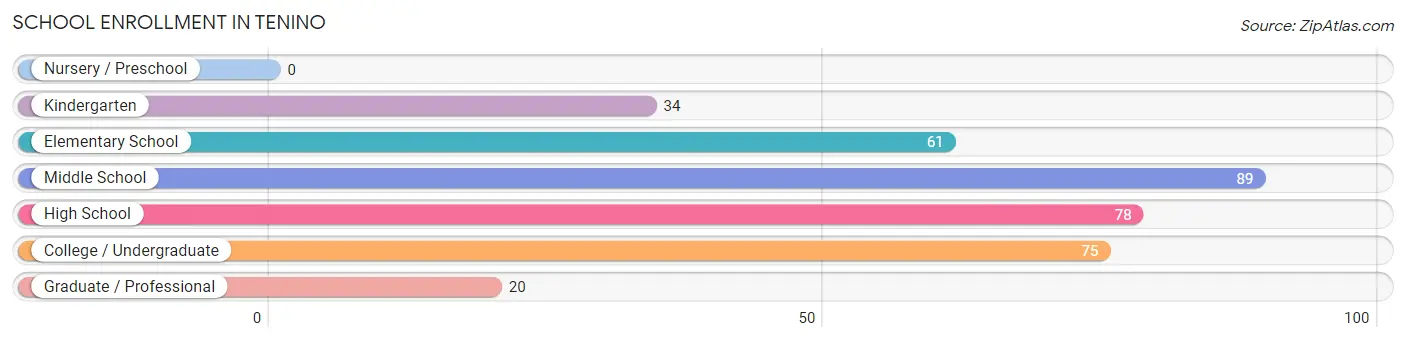
| School Level | # Students | % Students |
| Nursery / Preschool | 0 | 0.0% |
| Kindergarten | 34 | 9.5% |
| Elementary School | 61 | 17.1% |
| Middle School | 89 | 24.9% |
| High School | 78 | 21.8% |
| College / Undergraduate | 75 | 21.0% |
| Graduate / Professional | 20 | 5.6% |
| Total | 357 | 100.0% |
School Enrollment by Age by Funding Source in Tenino
Out of a total of 357 students who are enrolled in schools in Tenino, 58 (16.2%) attend a private institution, while the remaining 299 (83.8%) are enrolled in public schools. The age group of 35 years and over has the highest likelihood of being enrolled in private schools, with 15 (51.7% in the age bracket) enrolled. Conversely, the age group of 5 to 9 year old has the lowest likelihood of being enrolled in a private school, with 77 (100.0% in the age bracket) attending a public institution.
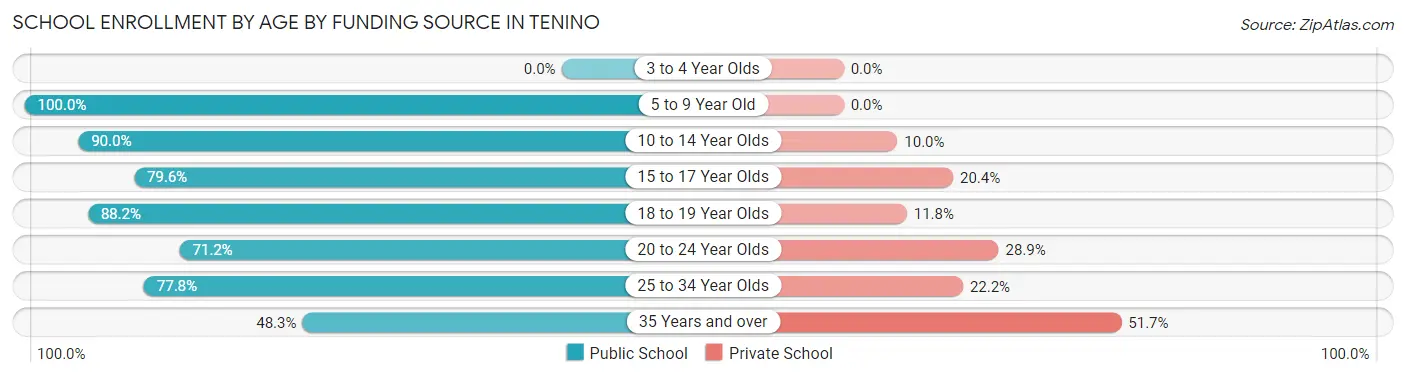
| Age Bracket | Public School | Private School |
| 3 to 4 Year Olds | 0 (0.0%) | 0 (0.0%) |
| 5 to 9 Year Old | 77 (100.0%) | 0 (0.0%) |
| 10 to 14 Year Olds | 99 (90.0%) | 11 (10.0%) |
| 15 to 17 Year Olds | 43 (79.6%) | 11 (20.4%) |
| 18 to 19 Year Olds | 15 (88.2%) | 2 (11.8%) |
| 20 to 24 Year Olds | 37 (71.2%) | 15 (28.8%) |
| 25 to 34 Year Olds | 14 (77.8%) | 4 (22.2%) |
| 35 Years and over | 14 (48.3%) | 15 (51.7%) |
| Total | 299 (83.8%) | 58 (16.2%) |
Educational Attainment by Field of Study in Tenino
Business (64 | 22.6%), psychology (39 | 13.8%), education (36 | 12.7%), bio, nature & agricultural (31 | 11.0%), and arts & humanities (20 | 7.1%) are the most common fields of study among 283 individuals in Tenino who have obtained a bachelor's degree or higher.
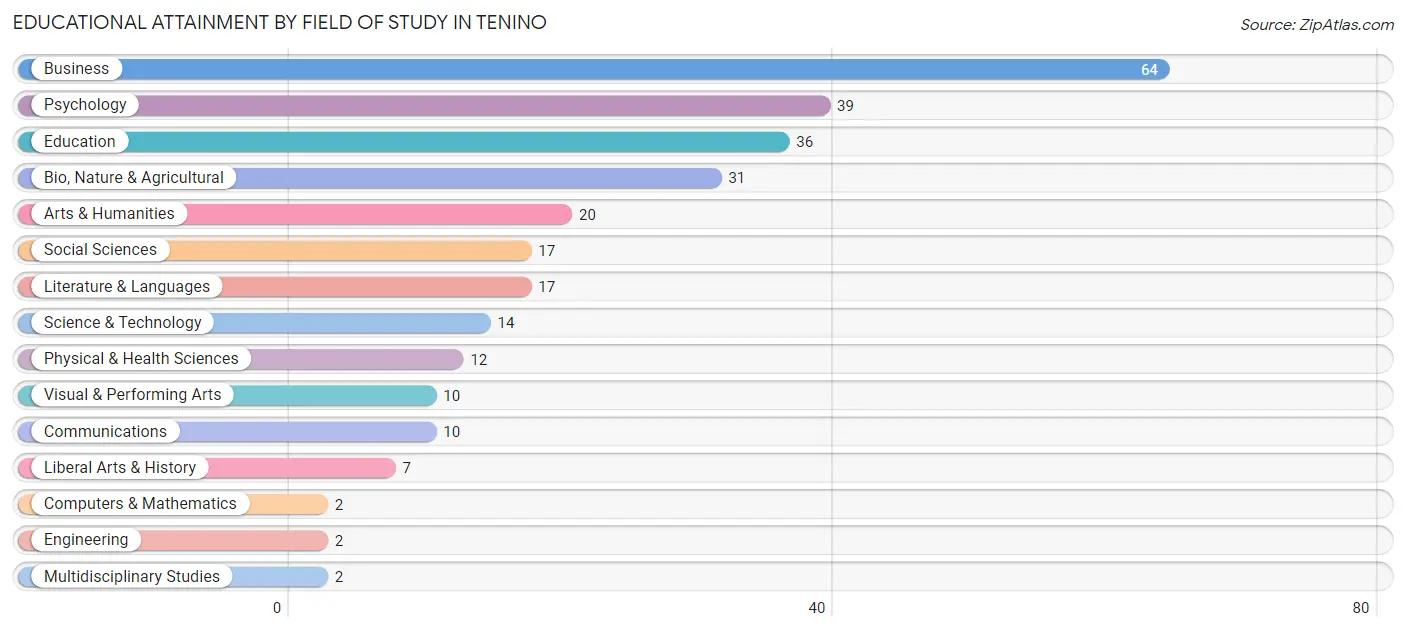
| Field of Study | # Graduates | % Graduates |
| Computers & Mathematics | 2 | 0.7% |
| Bio, Nature & Agricultural | 31 | 11.0% |
| Physical & Health Sciences | 12 | 4.2% |
| Psychology | 39 | 13.8% |
| Social Sciences | 17 | 6.0% |
| Engineering | 2 | 0.7% |
| Multidisciplinary Studies | 2 | 0.7% |
| Science & Technology | 14 | 5.0% |
| Business | 64 | 22.6% |
| Education | 36 | 12.7% |
| Literature & Languages | 17 | 6.0% |
| Liberal Arts & History | 7 | 2.5% |
| Visual & Performing Arts | 10 | 3.5% |
| Communications | 10 | 3.5% |
| Arts & Humanities | 20 | 7.1% |
| Total | 283 | 100.0% |
Transportation & Commute in Tenino
Vehicle Availability by Sex in Tenino
The most prevalent vehicle ownership categories in Tenino are males with 2 vehicles (162, accounting for 33.9%) and females with 2 vehicles (177, making up 32.3%).
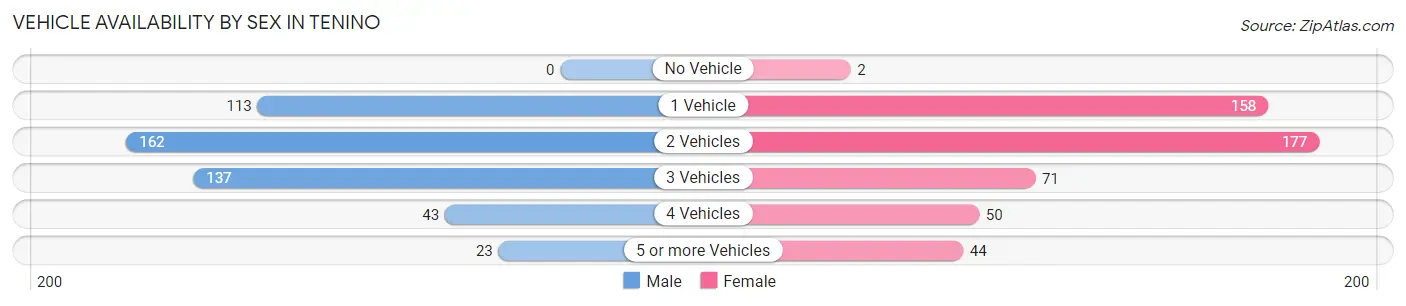
| Vehicles Available | Male | Female |
| No Vehicle | 0 (0.0%) | 2 (0.4%) |
| 1 Vehicle | 113 (23.6%) | 158 (31.5%) |
| 2 Vehicles | 162 (33.9%) | 177 (35.3%) |
| 3 Vehicles | 137 (28.7%) | 71 (14.1%) |
| 4 Vehicles | 43 (9.0%) | 50 (10.0%) |
| 5 or more Vehicles | 23 (4.8%) | 44 (8.8%) |
| Total | 478 (100.0%) | 502 (100.0%) |
Commute Time in Tenino
The most frequently occuring commute durations in Tenino are 30 to 34 minutes (247 commuters, 30.9%), 20 to 24 minutes (108 commuters, 13.5%), and 25 to 29 minutes (76 commuters, 9.5%).
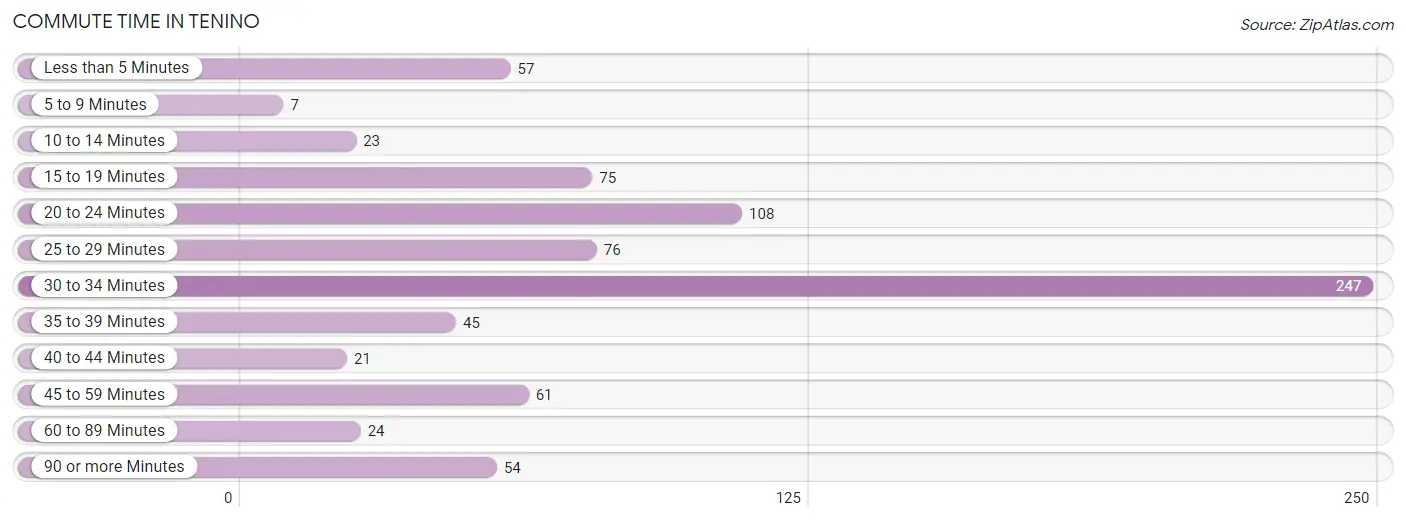
| Commute Time | # Commuters | % Commuters |
| Less than 5 Minutes | 57 | 7.1% |
| 5 to 9 Minutes | 7 | 0.9% |
| 10 to 14 Minutes | 23 | 2.9% |
| 15 to 19 Minutes | 75 | 9.4% |
| 20 to 24 Minutes | 108 | 13.5% |
| 25 to 29 Minutes | 76 | 9.5% |
| 30 to 34 Minutes | 247 | 30.9% |
| 35 to 39 Minutes | 45 | 5.6% |
| 40 to 44 Minutes | 21 | 2.6% |
| 45 to 59 Minutes | 61 | 7.6% |
| 60 to 89 Minutes | 24 | 3.0% |
| 90 or more Minutes | 54 | 6.8% |
Commute Time by Sex in Tenino
The most common commute times in Tenino are 30 to 34 minutes (125 commuters, 28.3%) for males and 30 to 34 minutes (122 commuters, 34.2%) for females.
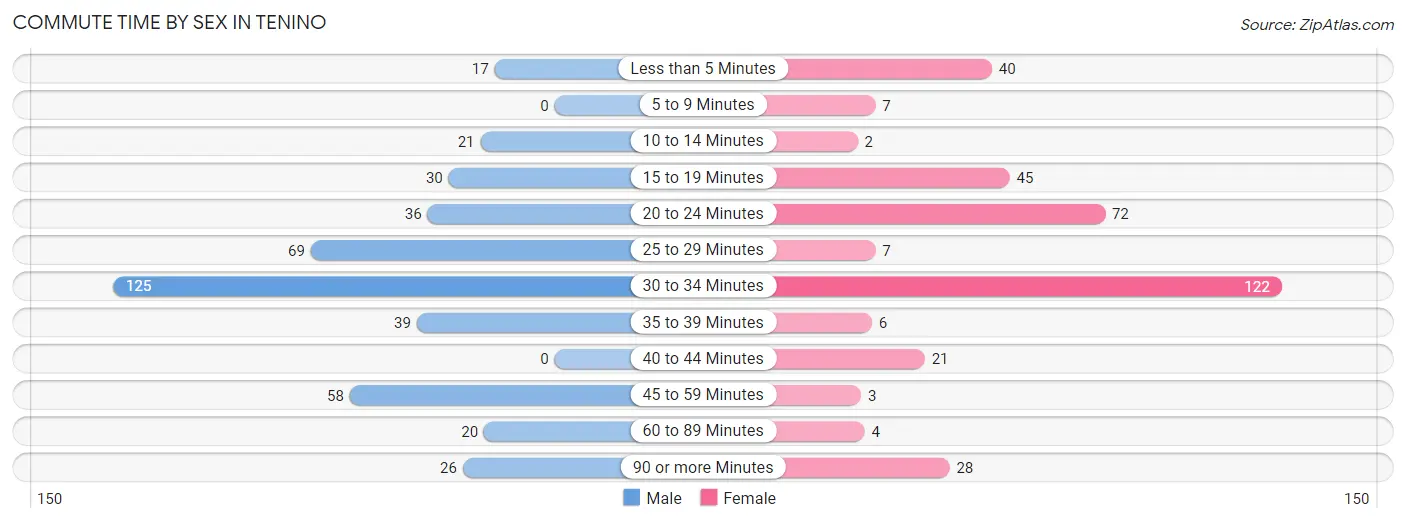
| Commute Time | Male | Female |
| Less than 5 Minutes | 17 (3.8%) | 40 (11.2%) |
| 5 to 9 Minutes | 0 (0.0%) | 7 (2.0%) |
| 10 to 14 Minutes | 21 (4.8%) | 2 (0.6%) |
| 15 to 19 Minutes | 30 (6.8%) | 45 (12.6%) |
| 20 to 24 Minutes | 36 (8.2%) | 72 (20.2%) |
| 25 to 29 Minutes | 69 (15.7%) | 7 (2.0%) |
| 30 to 34 Minutes | 125 (28.3%) | 122 (34.2%) |
| 35 to 39 Minutes | 39 (8.8%) | 6 (1.7%) |
| 40 to 44 Minutes | 0 (0.0%) | 21 (5.9%) |
| 45 to 59 Minutes | 58 (13.2%) | 3 (0.8%) |
| 60 to 89 Minutes | 20 (4.5%) | 4 (1.1%) |
| 90 or more Minutes | 26 (5.9%) | 28 (7.8%) |
Time of Departure to Work by Sex in Tenino
The most frequent times of departure to work in Tenino are 6:00 AM to 6:29 AM (91, 20.6%) for males and 7:00 AM to 7:29 AM (71, 19.9%) for females.
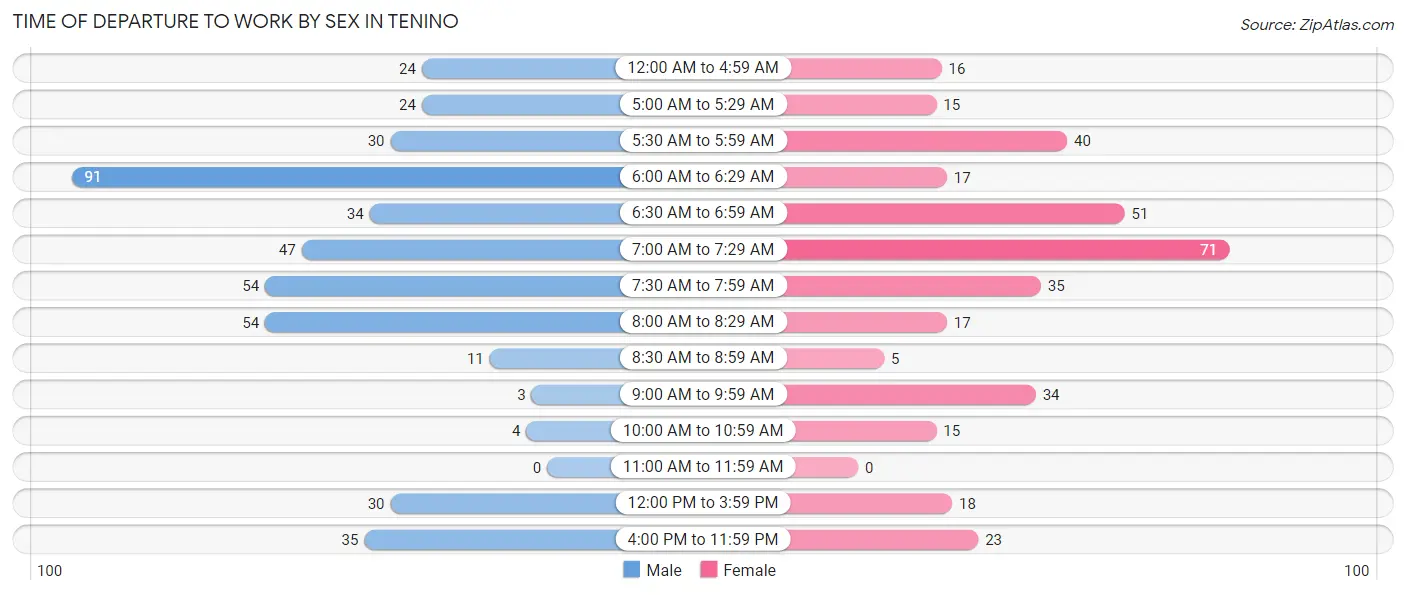
| Time of Departure | Male | Female |
| 12:00 AM to 4:59 AM | 24 (5.4%) | 16 (4.5%) |
| 5:00 AM to 5:29 AM | 24 (5.4%) | 15 (4.2%) |
| 5:30 AM to 5:59 AM | 30 (6.8%) | 40 (11.2%) |
| 6:00 AM to 6:29 AM | 91 (20.6%) | 17 (4.8%) |
| 6:30 AM to 6:59 AM | 34 (7.7%) | 51 (14.3%) |
| 7:00 AM to 7:29 AM | 47 (10.7%) | 71 (19.9%) |
| 7:30 AM to 7:59 AM | 54 (12.2%) | 35 (9.8%) |
| 8:00 AM to 8:29 AM | 54 (12.2%) | 17 (4.8%) |
| 8:30 AM to 8:59 AM | 11 (2.5%) | 5 (1.4%) |
| 9:00 AM to 9:59 AM | 3 (0.7%) | 34 (9.5%) |
| 10:00 AM to 10:59 AM | 4 (0.9%) | 15 (4.2%) |
| 11:00 AM to 11:59 AM | 0 (0.0%) | 0 (0.0%) |
| 12:00 PM to 3:59 PM | 30 (6.8%) | 18 (5.0%) |
| 4:00 PM to 11:59 PM | 35 (7.9%) | 23 (6.4%) |
| Total | 441 (100.0%) | 357 (100.0%) |
Housing Occupancy in Tenino
Occupancy by Ownership in Tenino
Of the total 780 dwellings in Tenino, owner-occupied units account for 449 (57.6%), while renter-occupied units make up 331 (42.4%).
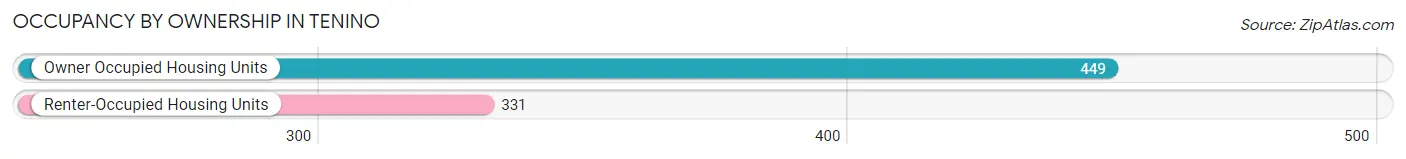
| Occupancy | # Housing Units | % Housing Units |
| Owner Occupied Housing Units | 449 | 57.6% |
| Renter-Occupied Housing Units | 331 | 42.4% |
| Total Occupied Housing Units | 780 | 100.0% |
Occupancy by Household Size in Tenino
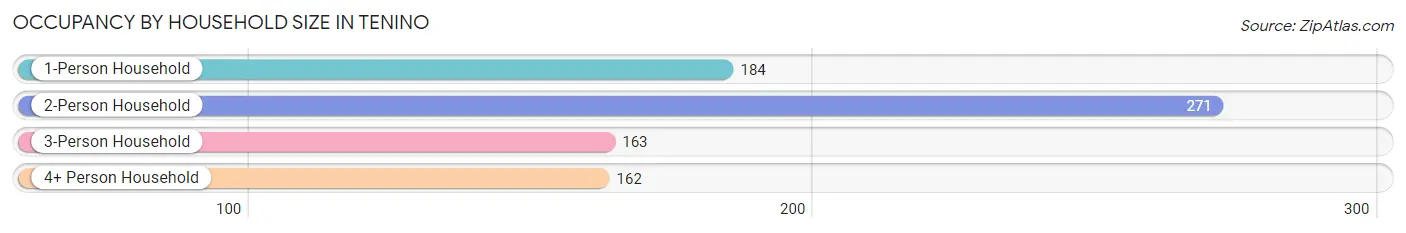
| Household Size | # Housing Units | % Housing Units |
| 1-Person Household | 184 | 23.6% |
| 2-Person Household | 271 | 34.7% |
| 3-Person Household | 163 | 20.9% |
| 4+ Person Household | 162 | 20.8% |
| Total Housing Units | 780 | 100.0% |
Occupancy by Ownership by Household Size in Tenino
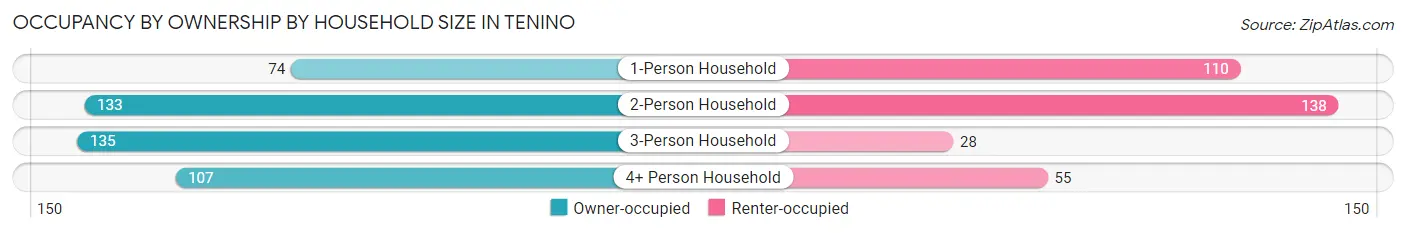
| Household Size | Owner-occupied | Renter-occupied |
| 1-Person Household | 74 (40.2%) | 110 (59.8%) |
| 2-Person Household | 133 (49.1%) | 138 (50.9%) |
| 3-Person Household | 135 (82.8%) | 28 (17.2%) |
| 4+ Person Household | 107 (66.0%) | 55 (34.0%) |
| Total Housing Units | 449 (57.6%) | 331 (42.4%) |
Occupancy by Educational Attainment in Tenino
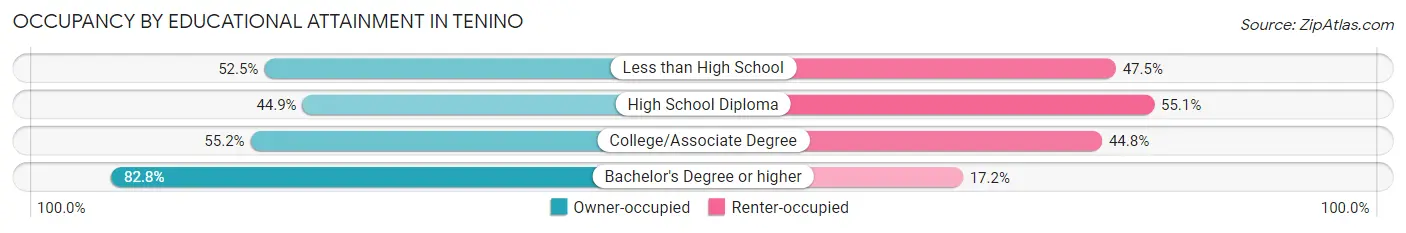
| Household Size | Owner-occupied | Renter-occupied |
| Less than High School | 21 (52.5%) | 19 (47.5%) |
| High School Diploma | 119 (44.9%) | 146 (55.1%) |
| College/Associate Degree | 169 (55.2%) | 137 (44.8%) |
| Bachelor's Degree or higher | 140 (82.8%) | 29 (17.2%) |
Occupancy by Age of Householder in Tenino
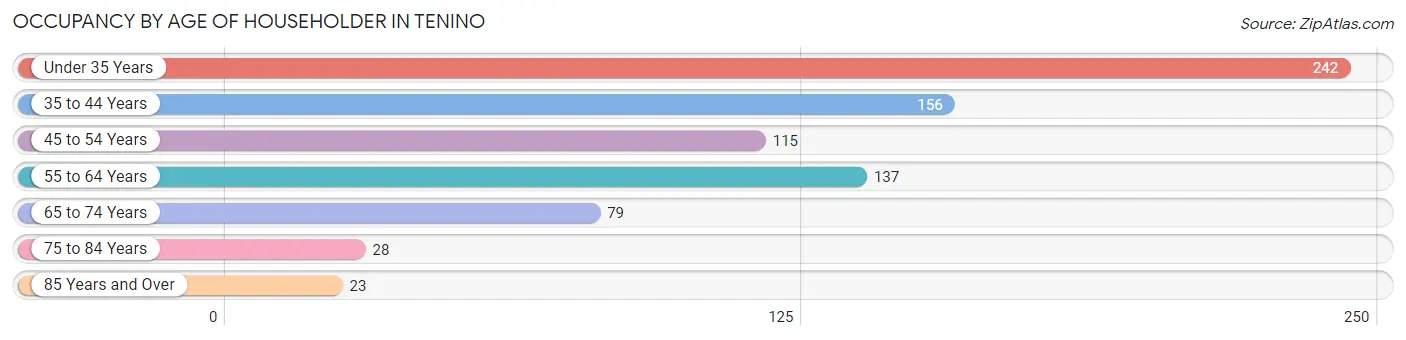
| Age Bracket | # Households | % Households |
| Under 35 Years | 242 | 31.0% |
| 35 to 44 Years | 156 | 20.0% |
| 45 to 54 Years | 115 | 14.7% |
| 55 to 64 Years | 137 | 17.6% |
| 65 to 74 Years | 79 | 10.1% |
| 75 to 84 Years | 28 | 3.6% |
| 85 Years and Over | 23 | 2.9% |
| Total | 780 | 100.0% |
Housing Finances in Tenino
Median Income by Occupancy in Tenino
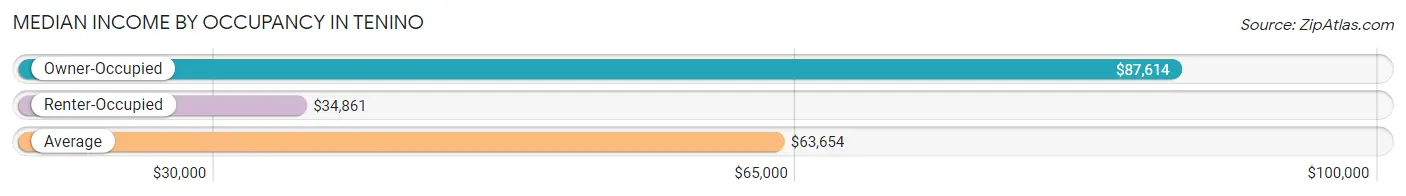
| Occupancy Type | # Households | Median Income |
| Owner-Occupied | 449 (57.6%) | $87,614 |
| Renter-Occupied | 331 (42.4%) | $34,861 |
| Average | 780 (100.0%) | $63,654 |
Occupancy by Householder Income Bracket in Tenino
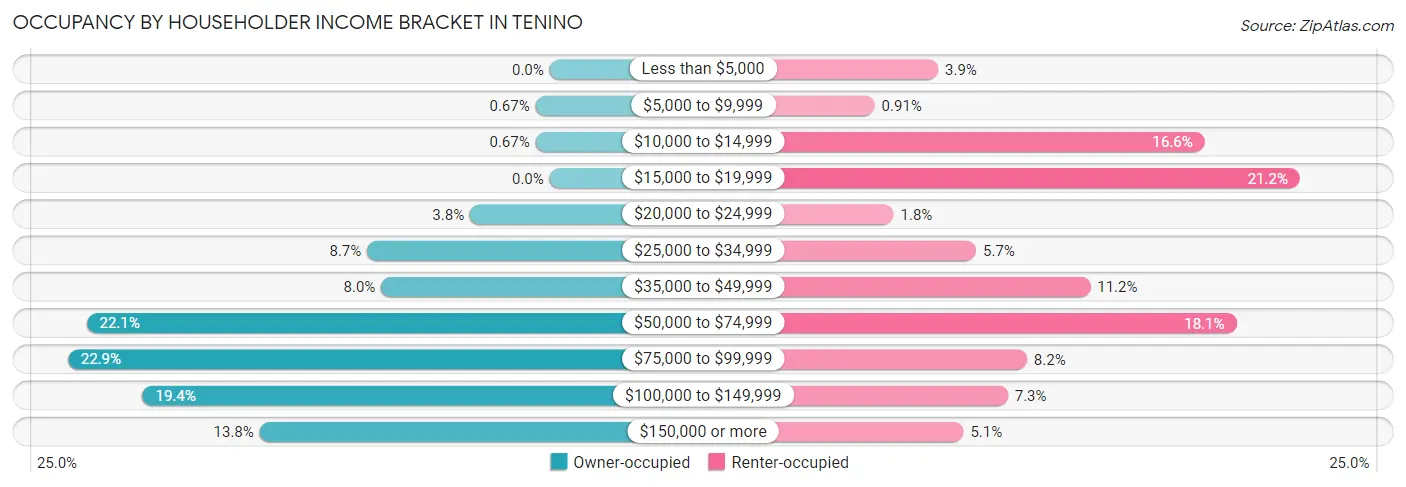
| Income Bracket | Owner-occupied | Renter-occupied |
| Less than $5,000 | 0 (0.0%) | 13 (3.9%) |
| $5,000 to $9,999 | 3 (0.7%) | 3 (0.9%) |
| $10,000 to $14,999 | 3 (0.7%) | 55 (16.6%) |
| $15,000 to $19,999 | 0 (0.0%) | 70 (21.1%) |
| $20,000 to $24,999 | 17 (3.8%) | 6 (1.8%) |
| $25,000 to $34,999 | 39 (8.7%) | 19 (5.7%) |
| $35,000 to $49,999 | 36 (8.0%) | 37 (11.2%) |
| $50,000 to $74,999 | 99 (22.1%) | 60 (18.1%) |
| $75,000 to $99,999 | 103 (22.9%) | 27 (8.2%) |
| $100,000 to $149,999 | 87 (19.4%) | 24 (7.2%) |
| $150,000 or more | 62 (13.8%) | 17 (5.1%) |
| Total | 449 (100.0%) | 331 (100.0%) |
Monthly Housing Cost Tiers in Tenino
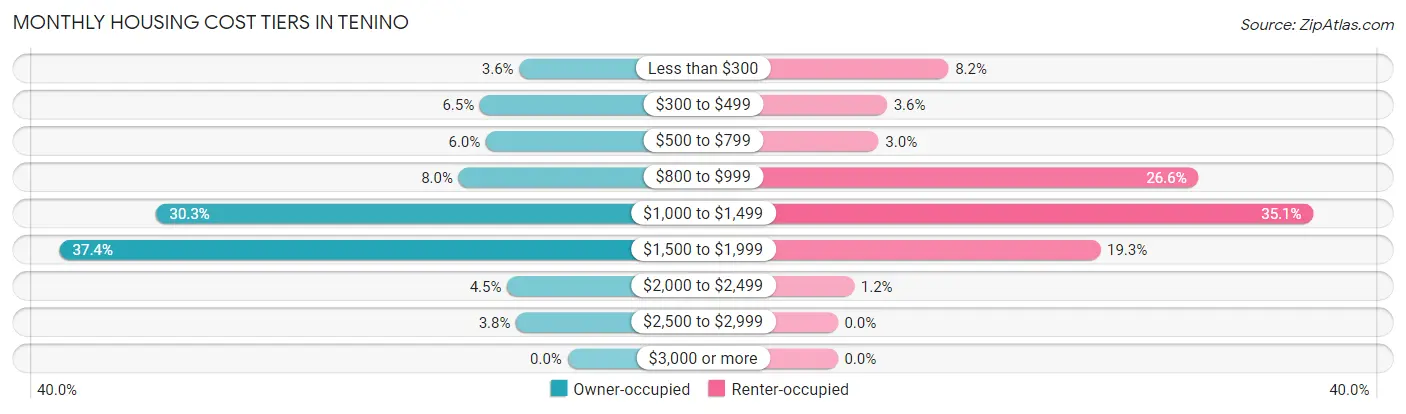
| Monthly Cost | Owner-occupied | Renter-occupied |
| Less than $300 | 16 (3.6%) | 27 (8.2%) |
| $300 to $499 | 29 (6.5%) | 12 (3.6%) |
| $500 to $799 | 27 (6.0%) | 10 (3.0%) |
| $800 to $999 | 36 (8.0%) | 88 (26.6%) |
| $1,000 to $1,499 | 136 (30.3%) | 116 (35.0%) |
| $1,500 to $1,999 | 168 (37.4%) | 64 (19.3%) |
| $2,000 to $2,499 | 20 (4.4%) | 4 (1.2%) |
| $2,500 to $2,999 | 17 (3.8%) | 0 (0.0%) |
| $3,000 or more | 0 (0.0%) | 0 (0.0%) |
| Total | 449 (100.0%) | 331 (100.0%) |
Physical Housing Characteristics in Tenino
Housing Structures in Tenino
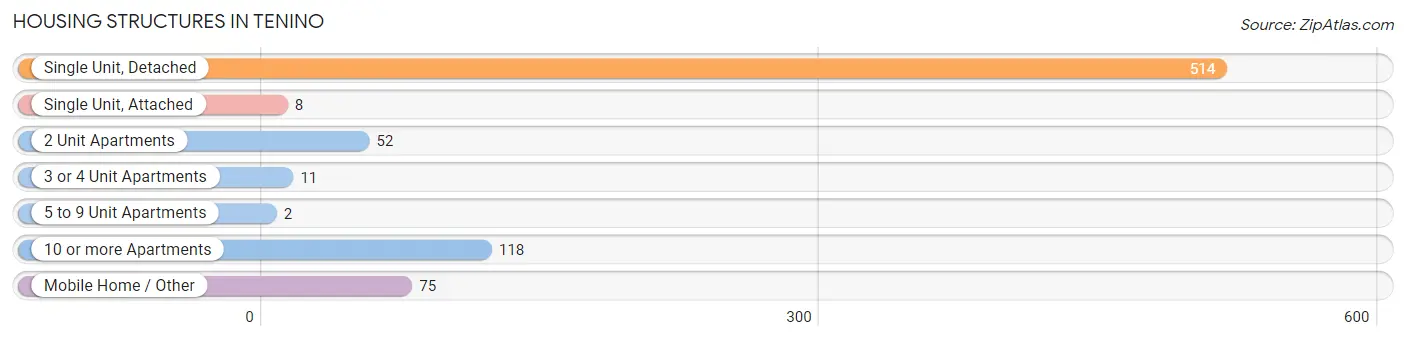
| Structure Type | # Housing Units | % Housing Units |
| Single Unit, Detached | 514 | 65.9% |
| Single Unit, Attached | 8 | 1.0% |
| 2 Unit Apartments | 52 | 6.7% |
| 3 or 4 Unit Apartments | 11 | 1.4% |
| 5 to 9 Unit Apartments | 2 | 0.3% |
| 10 or more Apartments | 118 | 15.1% |
| Mobile Home / Other | 75 | 9.6% |
| Total | 780 | 100.0% |
Housing Structures by Occupancy in Tenino
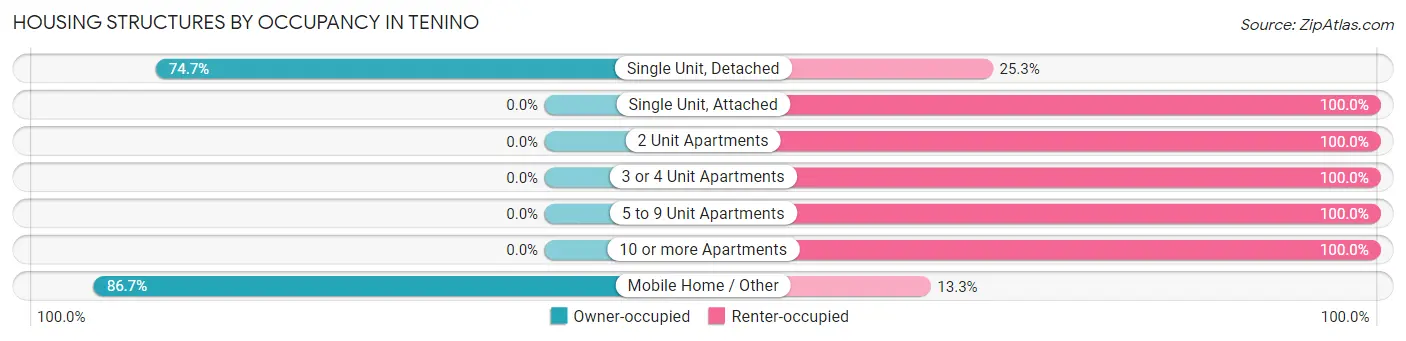
| Structure Type | Owner-occupied | Renter-occupied |
| Single Unit, Detached | 384 (74.7%) | 130 (25.3%) |
| Single Unit, Attached | 0 (0.0%) | 8 (100.0%) |
| 2 Unit Apartments | 0 (0.0%) | 52 (100.0%) |
| 3 or 4 Unit Apartments | 0 (0.0%) | 11 (100.0%) |
| 5 to 9 Unit Apartments | 0 (0.0%) | 2 (100.0%) |
| 10 or more Apartments | 0 (0.0%) | 118 (100.0%) |
| Mobile Home / Other | 65 (86.7%) | 10 (13.3%) |
| Total | 449 (57.6%) | 331 (42.4%) |
Housing Structures by Number of Rooms in Tenino
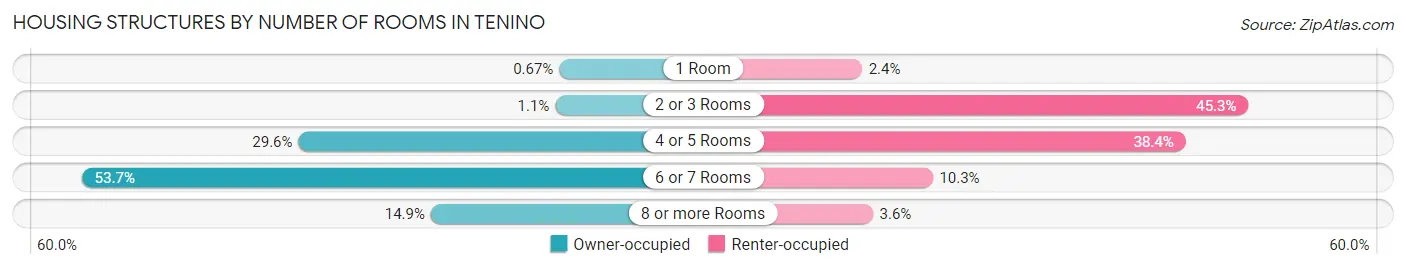
| Number of Rooms | Owner-occupied | Renter-occupied |
| 1 Room | 3 (0.7%) | 8 (2.4%) |
| 2 or 3 Rooms | 5 (1.1%) | 150 (45.3%) |
| 4 or 5 Rooms | 133 (29.6%) | 127 (38.4%) |
| 6 or 7 Rooms | 241 (53.7%) | 34 (10.3%) |
| 8 or more Rooms | 67 (14.9%) | 12 (3.6%) |
| Total | 449 (100.0%) | 331 (100.0%) |
Housing Structure by Heating Type in Tenino
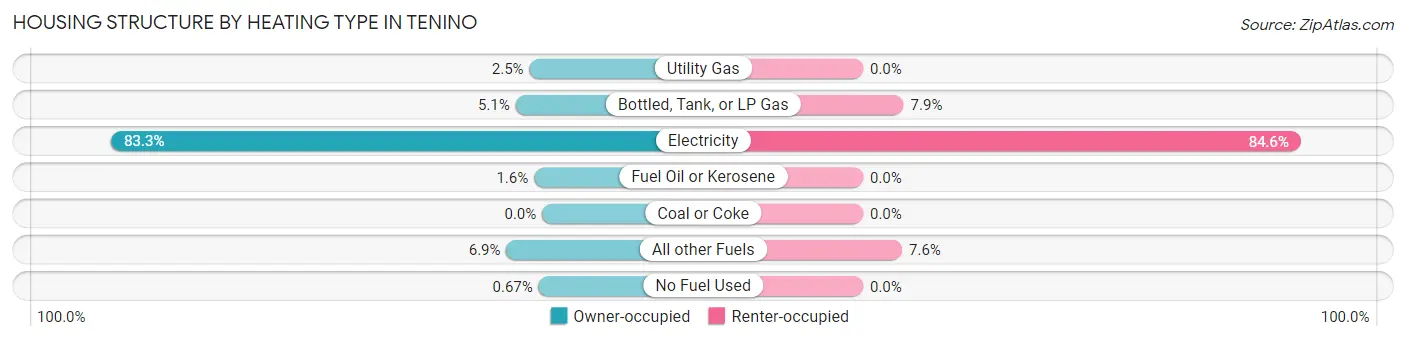
| Heating Type | Owner-occupied | Renter-occupied |
| Utility Gas | 11 (2.5%) | 0 (0.0%) |
| Bottled, Tank, or LP Gas | 23 (5.1%) | 26 (7.9%) |
| Electricity | 374 (83.3%) | 280 (84.6%) |
| Fuel Oil or Kerosene | 7 (1.6%) | 0 (0.0%) |
| Coal or Coke | 0 (0.0%) | 0 (0.0%) |
| All other Fuels | 31 (6.9%) | 25 (7.5%) |
| No Fuel Used | 3 (0.7%) | 0 (0.0%) |
| Total | 449 (100.0%) | 331 (100.0%) |
Household Vehicle Usage in Tenino
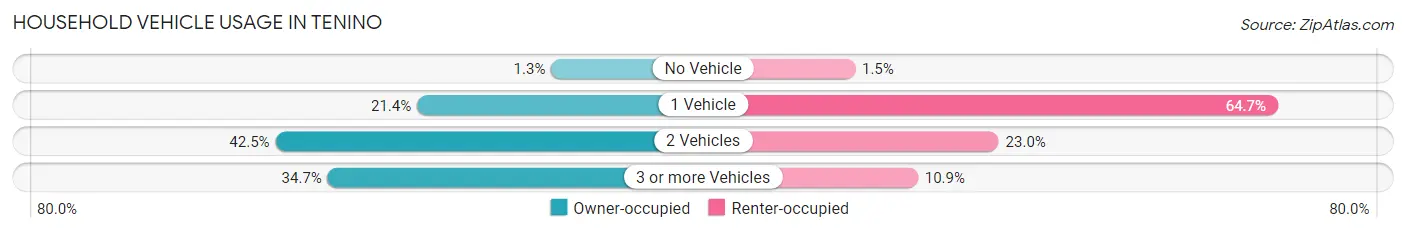
| Vehicles per Household | Owner-occupied | Renter-occupied |
| No Vehicle | 6 (1.3%) | 5 (1.5%) |
| 1 Vehicle | 96 (21.4%) | 214 (64.6%) |
| 2 Vehicles | 191 (42.5%) | 76 (23.0%) |
| 3 or more Vehicles | 156 (34.7%) | 36 (10.9%) |
| Total | 449 (100.0%) | 331 (100.0%) |
Real Estate & Mortgages in Tenino
Real Estate and Mortgage Overview in Tenino
| Characteristic | Without Mortgage | With Mortgage |
| Housing Units | 78 | 371 |
| Median Property Value | $235,000 | $296,600 |
| Median Household Income | $62,167 | $46 |
| Monthly Housing Costs | $478 | $0 |
| Real Estate Taxes | $2,031 | $29 |
Property Value by Mortgage Status in Tenino
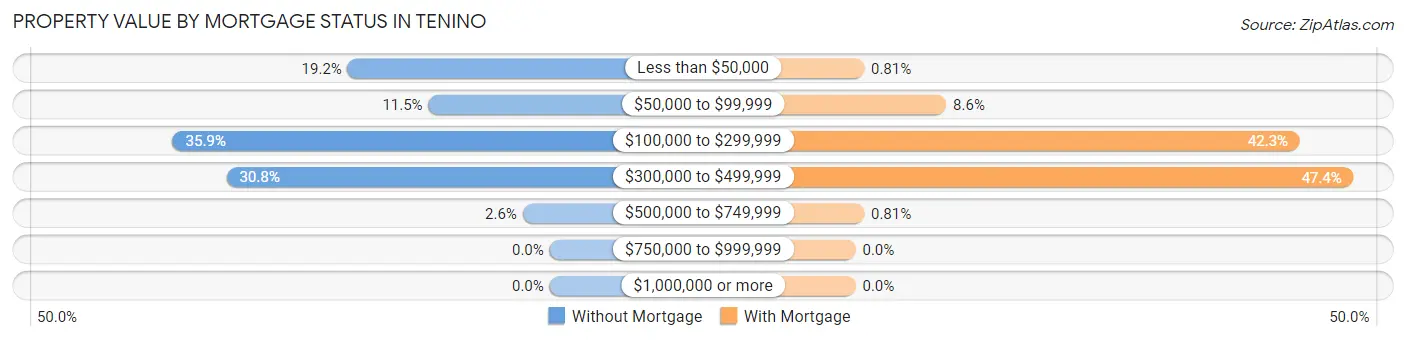
| Property Value | Without Mortgage | With Mortgage |
| Less than $50,000 | 15 (19.2%) | 3 (0.8%) |
| $50,000 to $99,999 | 9 (11.5%) | 32 (8.6%) |
| $100,000 to $299,999 | 28 (35.9%) | 157 (42.3%) |
| $300,000 to $499,999 | 24 (30.8%) | 176 (47.4%) |
| $500,000 to $749,999 | 2 (2.6%) | 3 (0.8%) |
| $750,000 to $999,999 | 0 (0.0%) | 0 (0.0%) |
| $1,000,000 or more | 0 (0.0%) | 0 (0.0%) |
| Total | 78 (100.0%) | 371 (100.0%) |
Household Income by Mortgage Status in Tenino
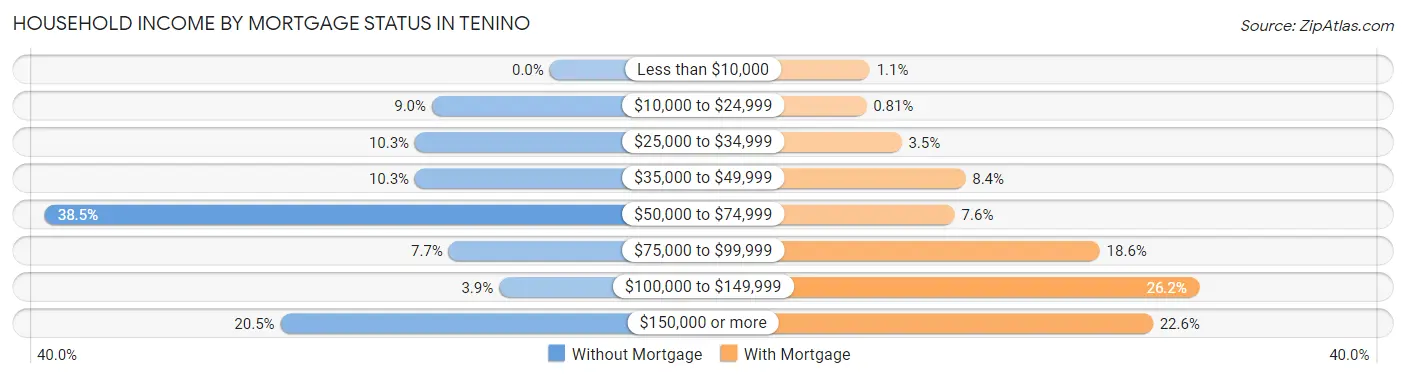
| Household Income | Without Mortgage | With Mortgage |
| Less than $10,000 | 0 (0.0%) | 4 (1.1%) |
| $10,000 to $24,999 | 7 (9.0%) | 3 (0.8%) |
| $25,000 to $34,999 | 8 (10.3%) | 13 (3.5%) |
| $35,000 to $49,999 | 8 (10.3%) | 31 (8.4%) |
| $50,000 to $74,999 | 30 (38.5%) | 28 (7.5%) |
| $75,000 to $99,999 | 6 (7.7%) | 69 (18.6%) |
| $100,000 to $149,999 | 3 (3.8%) | 97 (26.2%) |
| $150,000 or more | 16 (20.5%) | 84 (22.6%) |
| Total | 78 (100.0%) | 371 (100.0%) |
Property Value to Household Income Ratio in Tenino
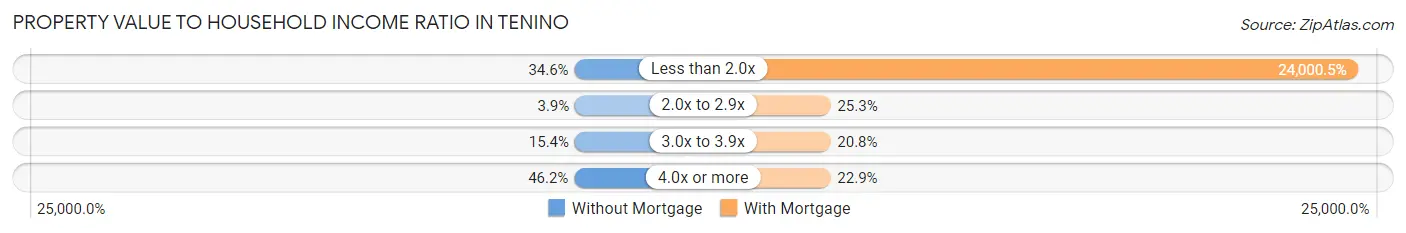
| Value-to-Income Ratio | Without Mortgage | With Mortgage |
| Less than 2.0x | 27 (34.6%) | 89,042 (24,000.5%) |
| 2.0x to 2.9x | 3 (3.8%) | 94 (25.3%) |
| 3.0x to 3.9x | 12 (15.4%) | 77 (20.7%) |
| 4.0x or more | 36 (46.2%) | 85 (22.9%) |
| Total | 78 (100.0%) | 371 (100.0%) |
Real Estate Taxes by Mortgage Status in Tenino
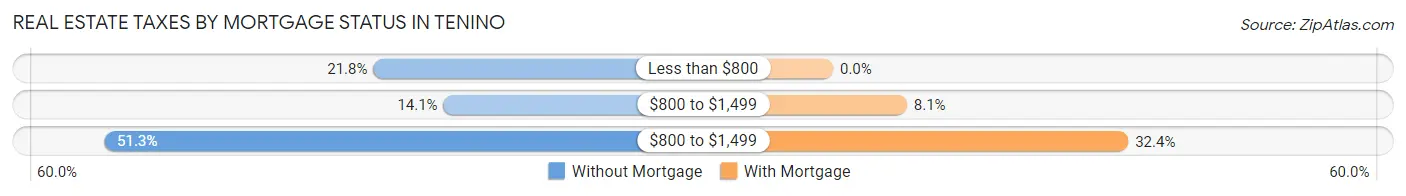
| Property Taxes | Without Mortgage | With Mortgage |
| Less than $800 | 17 (21.8%) | 0 (0.0%) |
| $800 to $1,499 | 11 (14.1%) | 30 (8.1%) |
| $800 to $1,499 | 40 (51.3%) | 120 (32.4%) |
| Total | 78 (100.0%) | 371 (100.0%) |
Health & Disability in Tenino
Health Insurance Coverage by Age in Tenino
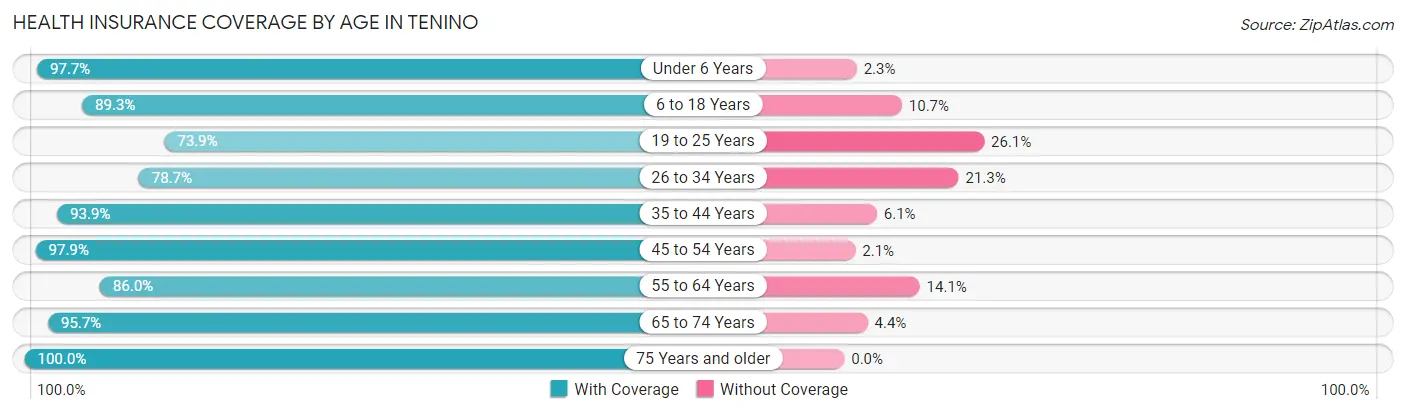
| Age Bracket | With Coverage | Without Coverage |
| Under 6 Years | 211 (97.7%) | 5 (2.3%) |
| 6 to 18 Years | 233 (89.3%) | 28 (10.7%) |
| 19 to 25 Years | 241 (73.9%) | 85 (26.1%) |
| 26 to 34 Years | 229 (78.7%) | 62 (21.3%) |
| 35 to 44 Years | 263 (93.9%) | 17 (6.1%) |
| 45 to 54 Years | 190 (97.9%) | 4 (2.1%) |
| 55 to 64 Years | 208 (86.0%) | 34 (14.1%) |
| 65 to 74 Years | 132 (95.7%) | 6 (4.3%) |
| 75 Years and older | 81 (100.0%) | 0 (0.0%) |
| Total | 1,788 (88.1%) | 241 (11.9%) |
Health Insurance Coverage by Citizenship Status in Tenino
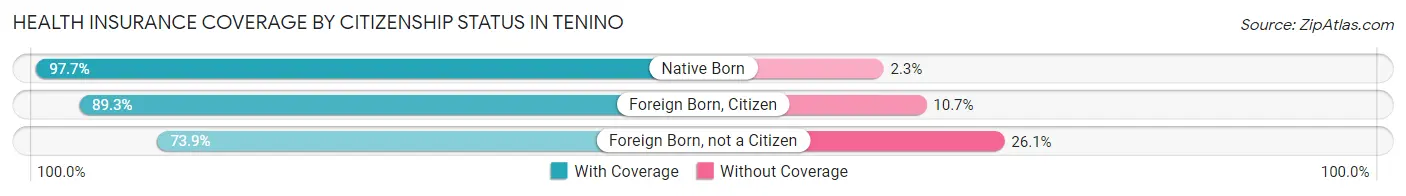
| Citizenship Status | With Coverage | Without Coverage |
| Native Born | 211 (97.7%) | 5 (2.3%) |
| Foreign Born, Citizen | 233 (89.3%) | 28 (10.7%) |
| Foreign Born, not a Citizen | 241 (73.9%) | 85 (26.1%) |
Health Insurance Coverage by Household Income in Tenino
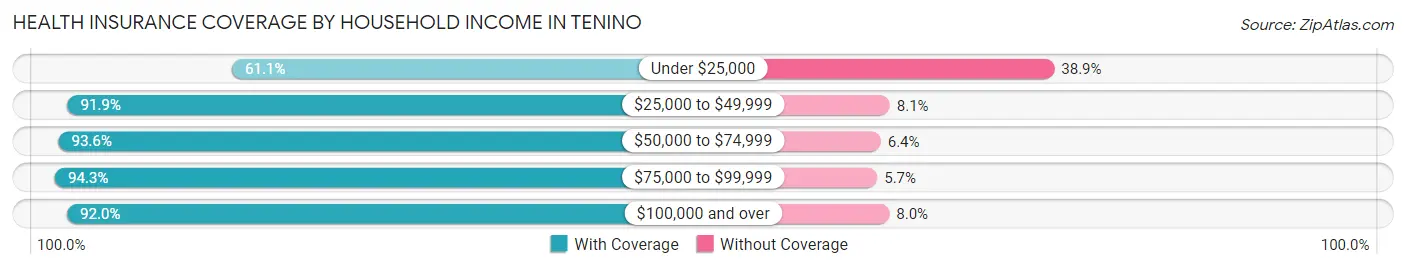
| Household Income | With Coverage | Without Coverage |
| Under $25,000 | 187 (61.1%) | 119 (38.9%) |
| $25,000 to $49,999 | 251 (91.9%) | 22 (8.1%) |
| $50,000 to $74,999 | 382 (93.6%) | 26 (6.4%) |
| $75,000 to $99,999 | 380 (94.3%) | 23 (5.7%) |
| $100,000 and over | 566 (92.0%) | 49 (8.0%) |
Public vs Private Health Insurance Coverage by Age in Tenino
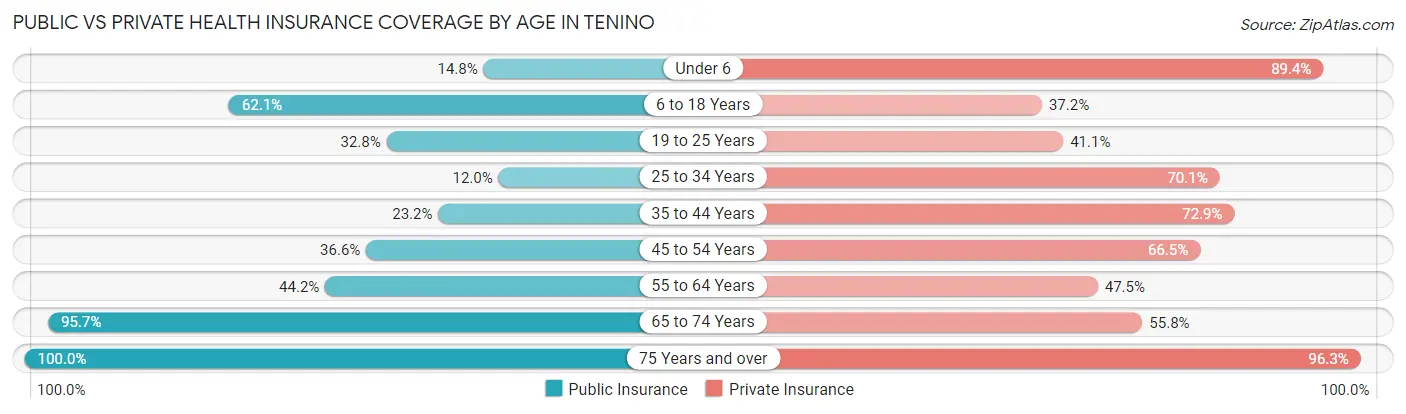
| Age Bracket | Public Insurance | Private Insurance |
| Under 6 | 32 (14.8%) | 193 (89.3%) |
| 6 to 18 Years | 162 (62.1%) | 97 (37.2%) |
| 19 to 25 Years | 107 (32.8%) | 134 (41.1%) |
| 25 to 34 Years | 35 (12.0%) | 204 (70.1%) |
| 35 to 44 Years | 65 (23.2%) | 204 (72.9%) |
| 45 to 54 Years | 71 (36.6%) | 129 (66.5%) |
| 55 to 64 Years | 107 (44.2%) | 115 (47.5%) |
| 65 to 74 Years | 132 (95.7%) | 77 (55.8%) |
| 75 Years and over | 81 (100.0%) | 78 (96.3%) |
| Total | 792 (39.0%) | 1,231 (60.7%) |
Disability Status by Sex by Age in Tenino
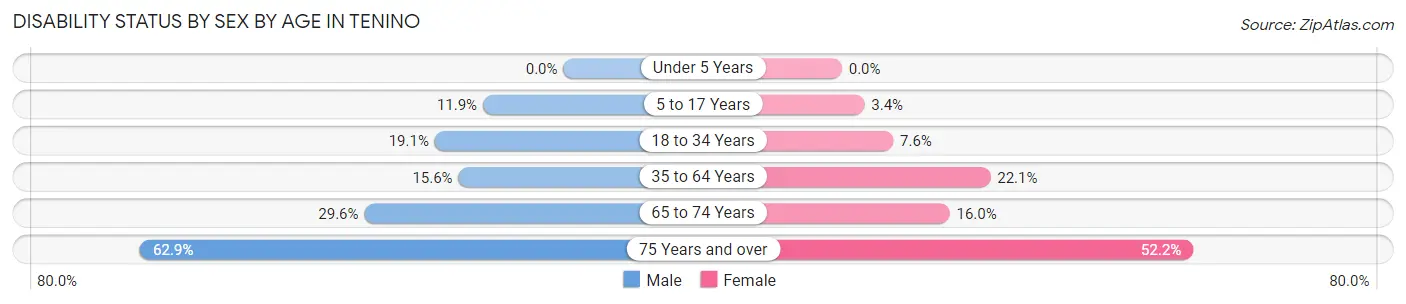
| Age Bracket | Male | Female |
| Under 5 Years | 0 (0.0%) | 0 (0.0%) |
| 5 to 17 Years | 8 (11.9%) | 7 (3.4%) |
| 18 to 34 Years | 55 (19.1%) | 26 (7.6%) |
| 35 to 64 Years | 43 (15.6%) | 97 (22.1%) |
| 65 to 74 Years | 26 (29.5%) | 8 (16.0%) |
| 75 Years and over | 22 (62.9%) | 24 (52.2%) |
Disability Class by Sex by Age in Tenino
Disability Class: Hearing Difficulty
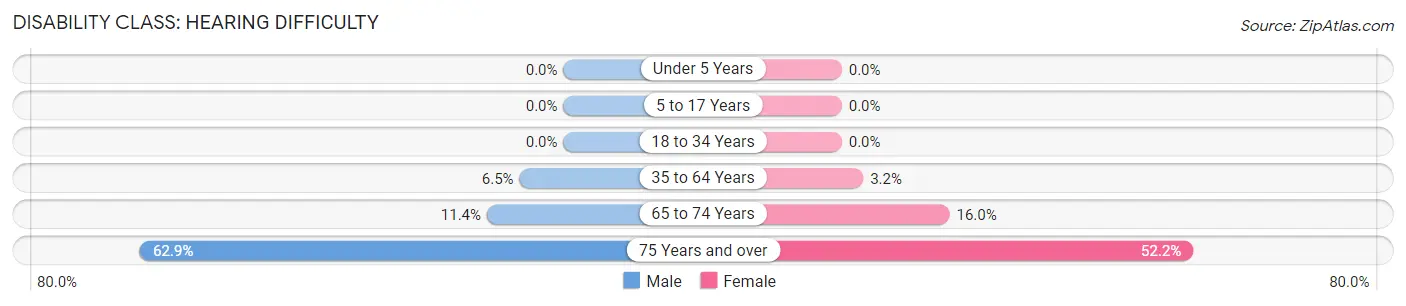
| Age Bracket | Male | Female |
| Under 5 Years | 0 (0.0%) | 0 (0.0%) |
| 5 to 17 Years | 0 (0.0%) | 0 (0.0%) |
| 18 to 34 Years | 0 (0.0%) | 0 (0.0%) |
| 35 to 64 Years | 18 (6.5%) | 14 (3.2%) |
| 65 to 74 Years | 10 (11.4%) | 8 (16.0%) |
| 75 Years and over | 22 (62.9%) | 24 (52.2%) |
Disability Class: Vision Difficulty
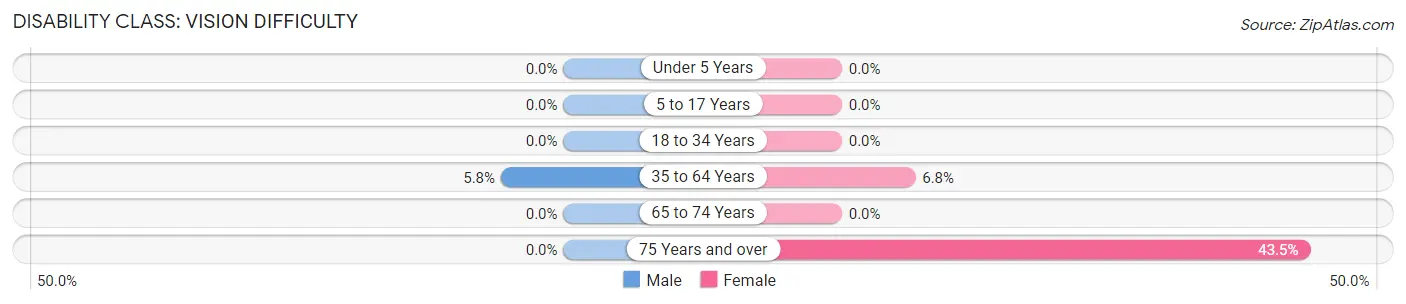
| Age Bracket | Male | Female |
| Under 5 Years | 0 (0.0%) | 0 (0.0%) |
| 5 to 17 Years | 0 (0.0%) | 0 (0.0%) |
| 18 to 34 Years | 0 (0.0%) | 0 (0.0%) |
| 35 to 64 Years | 16 (5.8%) | 30 (6.8%) |
| 65 to 74 Years | 0 (0.0%) | 0 (0.0%) |
| 75 Years and over | 0 (0.0%) | 20 (43.5%) |
Disability Class: Cognitive Difficulty
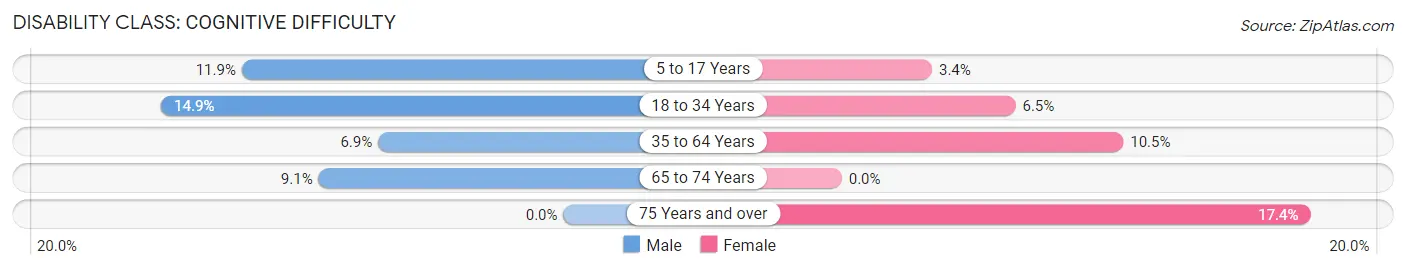
| Age Bracket | Male | Female |
| 5 to 17 Years | 8 (11.9%) | 7 (3.4%) |
| 18 to 34 Years | 43 (14.9%) | 22 (6.5%) |
| 35 to 64 Years | 19 (6.9%) | 46 (10.4%) |
| 65 to 74 Years | 8 (9.1%) | 0 (0.0%) |
| 75 Years and over | 0 (0.0%) | 8 (17.4%) |
Disability Class: Ambulatory Difficulty
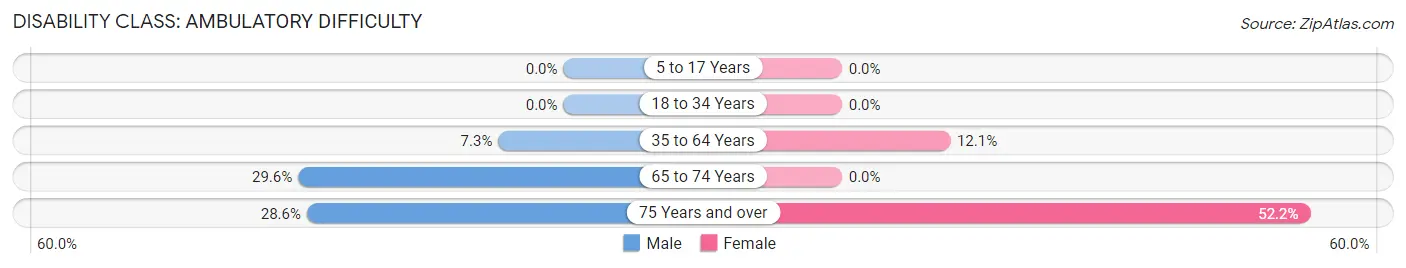
| Age Bracket | Male | Female |
| 5 to 17 Years | 0 (0.0%) | 0 (0.0%) |
| 18 to 34 Years | 0 (0.0%) | 0 (0.0%) |
| 35 to 64 Years | 20 (7.2%) | 53 (12.0%) |
| 65 to 74 Years | 26 (29.5%) | 0 (0.0%) |
| 75 Years and over | 10 (28.6%) | 24 (52.2%) |
Disability Class: Self-Care Difficulty

| Age Bracket | Male | Female |
| 5 to 17 Years | 0 (0.0%) | 0 (0.0%) |
| 18 to 34 Years | 17 (5.9%) | 0 (0.0%) |
| 35 to 64 Years | 6 (2.2%) | 19 (4.3%) |
| 65 to 74 Years | 17 (19.3%) | 0 (0.0%) |
| 75 Years and over | 0 (0.0%) | 4 (8.7%) |
Technology Access in Tenino
Computing Device Access in Tenino
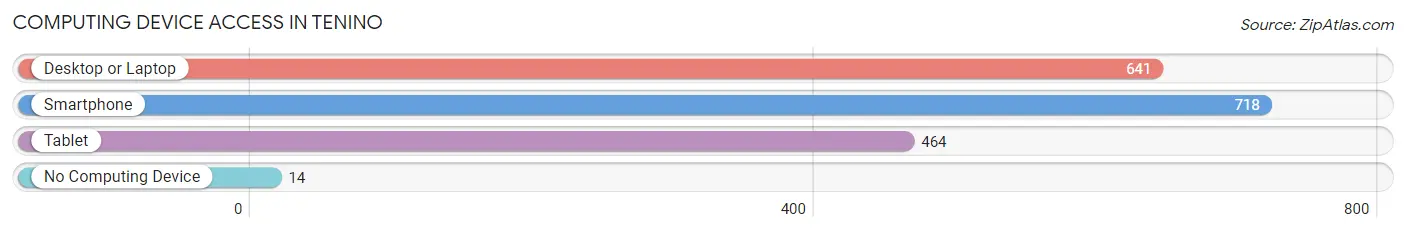
| Device Type | # Households | % Households |
| Desktop or Laptop | 641 | 82.2% |
| Smartphone | 718 | 92.0% |
| Tablet | 464 | 59.5% |
| No Computing Device | 14 | 1.8% |
| Total | 780 | 100.0% |
Internet Access in Tenino
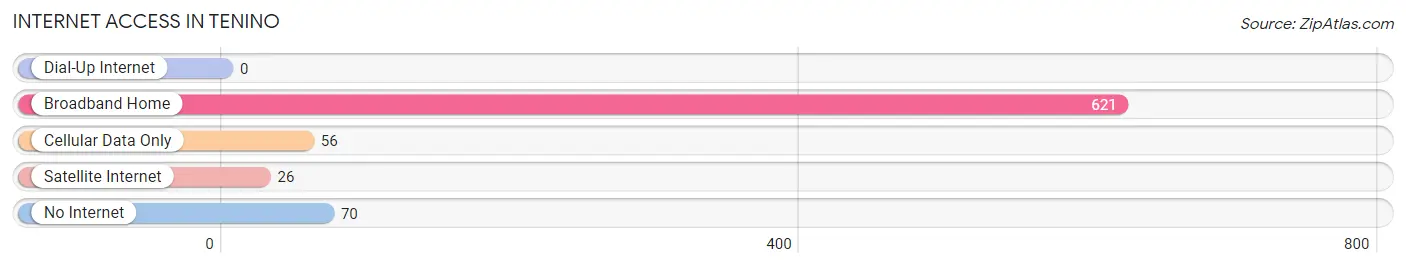
| Internet Type | # Households | % Households |
| Dial-Up Internet | 0 | 0.0% |
| Broadband Home | 621 | 79.6% |
| Cellular Data Only | 56 | 7.2% |
| Satellite Internet | 26 | 3.3% |
| No Internet | 70 | 9.0% |
| Total | 780 | 100.0% |
Tenino Summary
Tenino, Washington is a small city located in Thurston County, Washington, United States. It is situated approximately 25 miles south of the state capital, Olympia. The city is located on the banks of the Deschutes River and is home to a population of approximately 2,000 people.
History
Tenino was first settled in 1853 by a group of settlers from the Oregon Territory. The town was originally named “Deschutes” after the river that runs through it. In 1883, the name was changed to Tenino, after the Tenino Indians who lived in the area.
The town was officially incorporated in 1891 and quickly became a thriving logging and farming community. The town was also home to a number of sawmills and other industries. In the early 1900s, Tenino was a popular tourist destination, with many visitors coming to enjoy the natural beauty of the area.
In the 1950s, Tenino began to experience a decline in population as many of its residents moved away to larger cities. However, in recent years, the city has seen a resurgence in population and is now home to a diverse population of people from all walks of life.
Geography
Tenino is located in the western part of Thurston County, Washington. It is situated on the banks of the Deschutes River, which flows through the city. The city is surrounded by a number of small lakes and ponds, as well as the Black Hills, which are part of the Cascade Range.
The city has a total area of 1.7 square miles, all of which is land. The city has a humid continental climate, with warm summers and cold winters.
Economy
Tenino’s economy is largely based on the timber industry. The city is home to a number of sawmills and other wood-related businesses. In addition, the city is home to a number of small businesses, including restaurants, retail stores, and other services.
The city is also home to a number of manufacturing companies, including a paper mill and a furniture factory. The city is also home to a number of agricultural businesses, including dairy farms and fruit orchards.
Demographics
As of the 2010 census, Tenino had a population of 2,037 people. The racial makeup of the city was 91.3% White, 0.7% African American, 0.7% Native American, 0.7% Asian, 0.2% Pacific Islander, and 5.9% from other races. Hispanic or Latino of any race were 4.2% of the population.
The median income for a household in the city was $41,250, and the median income for a family was $50,000. The per capita income for the city was $20,845. About 11.2% of families and 14.2% of the population were below the poverty line, including 18.2% of those under age 18 and 8.2% of those age 65 or over.
Tenino is a small city with a rich history and a diverse population. The city is home to a number of businesses and industries, as well as a number of agricultural businesses. The city is also home to a number of small businesses, including restaurants, retail stores, and other services. The city has a humid continental climate, with warm summers and cold winters.
Common Questions
What is Per Capita Income in Tenino?
Per Capita income in Tenino is $29,367.
What is the Median Family Income in Tenino?
Median Family Income in Tenino is $87,656.
What is the Median Household income in Tenino?
Median Household Income in Tenino is $63,654.
What is Income or Wage Gap in Tenino?
Income or Wage Gap in Tenino is 36.7%.
Women in Tenino earn 63.3 cents for every dollar earned by a man.
What is Inequality or Gini Index in Tenino?
Inequality or Gini Index in Tenino is 0.42.
What is the Total Population of Tenino?
Total Population of Tenino is 2,045.
What is the Total Male Population of Tenino?
Total Male Population of Tenino is 805.
What is the Total Female Population of Tenino?
Total Female Population of Tenino is 1,240.
What is the Ratio of Males per 100 Females in Tenino?
There are 64.92 Males per 100 Females in Tenino.
What is the Ratio of Females per 100 Males in Tenino?
There are 154.04 Females per 100 Males in Tenino.
What is the Median Population Age in Tenino?
Median Population Age in Tenino is 33.3 Years.
What is the Average Family Size in Tenino
Average Family Size in Tenino is 3.2 People.
What is the Average Household Size in Tenino
Average Household Size in Tenino is 2.6 People.
How Large is the Labor Force in Tenino?
There are 1,045 People in the Labor Forcein in Tenino.
What is the Percentage of People in the Labor Force in Tenino?
64.6% of People are in the Labor Force in Tenino.
What is the Unemployment Rate in Tenino?
Unemployment Rate in Tenino is 4.6%.