Mountlake Terrace, WA Map & Demographics
Mountlake Terrace Map
Mountlake Terrace Overview
$50,480
PER CAPITA INCOME
$109,827
AVG FAMILY INCOME
$96,104
AVG HOUSEHOLD INCOME
19.1%
WAGE / INCOME GAP [ % ]
80.9¢/ $1
WAGE / INCOME GAP [ $ ]
0.40
INEQUALITY / GINI INDEX
21,350
TOTAL POPULATION
10,471
MALE POPULATION
10,879
FEMALE POPULATION
96.25
MALES / 100 FEMALES
103.90
FEMALES / 100 MALES
38.6
MEDIAN AGE
2.9
AVG FAMILY SIZE
2.4
AVG HOUSEHOLD SIZE
12,234
LABOR FORCE [ PEOPLE ]
68.4%
PERCENT IN LABOR FORCE
4.1%
UNEMPLOYMENT RATE
Mountlake Terrace Zip Codes
Mountlake Terrace Area Codes
Income in Mountlake Terrace
Income Overview in Mountlake Terrace
Per Capita Income in Mountlake Terrace is $50,480, while median incomes of families and households are $109,827 and $96,104 respectively.
| Characteristic | Number | Measure |
| Per Capita Income | 21,350 | $50,480 |
| Median Family Income | 5,510 | $109,827 |
| Mean Family Income | 5,510 | $135,487 |
| Median Household Income | 8,937 | $96,104 |
| Mean Household Income | 8,937 | $116,644 |
| Income Deficit | 5,510 | $0 |
| Wage / Income Gap (%) | 21,350 | 19.10% |
| Wage / Income Gap ($) | 21,350 | 80.90¢ per $1 |
| Gini / Inequality Index | 21,350 | 0.40 |
Earnings by Sex in Mountlake Terrace
Average Earnings in Mountlake Terrace are $57,576, $63,908 for men and $51,699 for women, a difference of 19.1%.
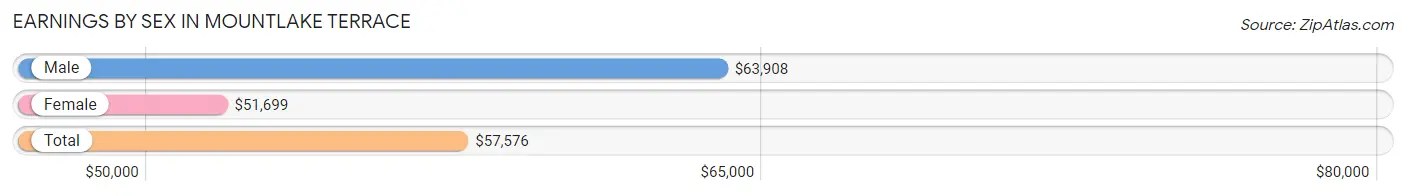
| Sex | Number | Average Earnings |
| Male | 6,157 (48.2%) | $63,908 |
| Female | 6,618 (51.8%) | $51,699 |
| Total | 12,775 (100.0%) | $57,576 |
Earnings by Sex by Income Bracket in Mountlake Terrace
The most common earnings brackets in Mountlake Terrace are $100,000+ for men (1,450 | 23.5%) and $75,000 to $99,999 for women (1,090 | 16.5%).
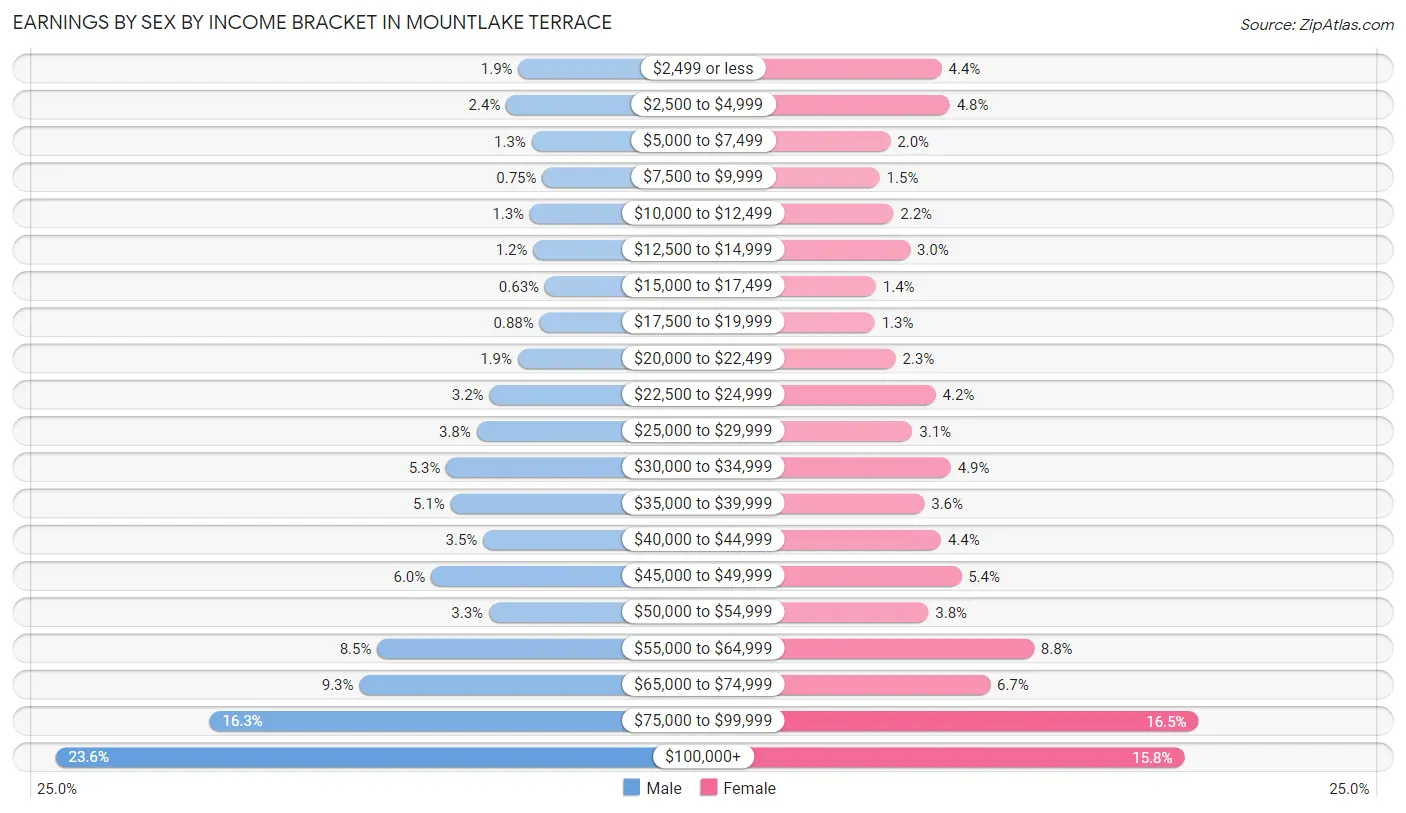
| Income | Male | Female |
| $2,499 or less | 115 (1.9%) | 294 (4.4%) |
| $2,500 to $4,999 | 150 (2.4%) | 319 (4.8%) |
| $5,000 to $7,499 | 77 (1.3%) | 135 (2.0%) |
| $7,500 to $9,999 | 46 (0.7%) | 102 (1.5%) |
| $10,000 to $12,499 | 82 (1.3%) | 144 (2.2%) |
| $12,500 to $14,999 | 72 (1.2%) | 196 (3.0%) |
| $15,000 to $17,499 | 39 (0.6%) | 90 (1.4%) |
| $17,500 to $19,999 | 54 (0.9%) | 87 (1.3%) |
| $20,000 to $22,499 | 117 (1.9%) | 151 (2.3%) |
| $22,500 to $24,999 | 199 (3.2%) | 275 (4.2%) |
| $25,000 to $29,999 | 236 (3.8%) | 203 (3.1%) |
| $30,000 to $34,999 | 323 (5.2%) | 322 (4.9%) |
| $35,000 to $39,999 | 311 (5.1%) | 240 (3.6%) |
| $40,000 to $44,999 | 217 (3.5%) | 292 (4.4%) |
| $45,000 to $49,999 | 367 (6.0%) | 355 (5.4%) |
| $50,000 to $54,999 | 200 (3.3%) | 253 (3.8%) |
| $55,000 to $64,999 | 522 (8.5%) | 580 (8.8%) |
| $65,000 to $74,999 | 574 (9.3%) | 444 (6.7%) |
| $75,000 to $99,999 | 1,006 (16.3%) | 1,090 (16.5%) |
| $100,000+ | 1,450 (23.5%) | 1,046 (15.8%) |
| Total | 6,157 (100.0%) | 6,618 (100.0%) |
Earnings by Sex by Educational Attainment in Mountlake Terrace
Average earnings in Mountlake Terrace are $69,375 for men and $56,780 for women, a difference of 18.1%. Men with an educational attainment of graduate degree enjoy the highest average annual earnings of $115,982, while those with less than high school education earn the least with $35,625. Women with an educational attainment of graduate degree earn the most with the average annual earnings of $97,371, while those with less than high school education have the smallest earnings of $30,260.
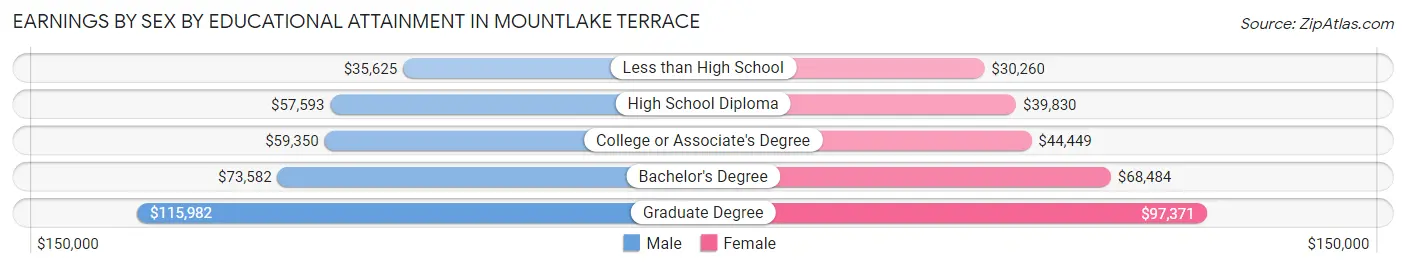
| Educational Attainment | Male Income | Female Income |
| Less than High School | $35,625 | $30,260 |
| High School Diploma | $57,593 | $39,830 |
| College or Associate's Degree | $59,350 | $44,449 |
| Bachelor's Degree | $73,582 | $68,484 |
| Graduate Degree | $115,982 | $97,371 |
| Total | $69,375 | $56,780 |
Family Income in Mountlake Terrace
Family Income Brackets in Mountlake Terrace
According to the Mountlake Terrace family income data, there are 1,477 families falling into the $100,000 to $149,999 income range, which is the most common income bracket and makes up 26.8% of all families. Conversely, the $10,000 to $14,999 income bracket is the least frequent group with only 6 families (0.1%) belonging to this category.
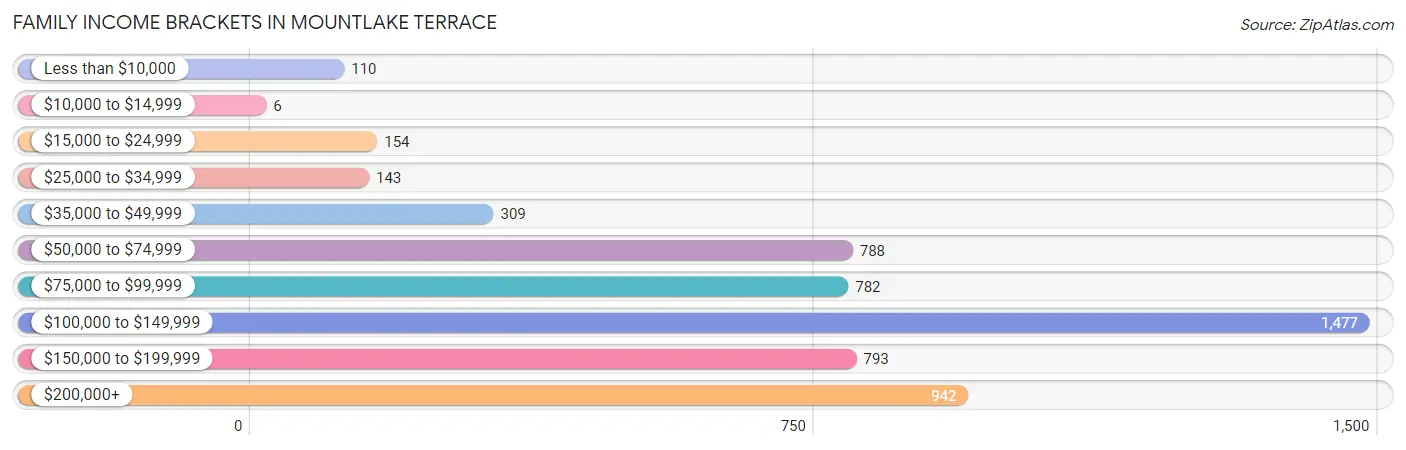
| Income Bracket | # Families | % Families |
| Less than $10,000 | 110 | 2.0% |
| $10,000 to $14,999 | 6 | 0.1% |
| $15,000 to $24,999 | 154 | 2.8% |
| $25,000 to $34,999 | 143 | 2.6% |
| $35,000 to $49,999 | 309 | 5.6% |
| $50,000 to $74,999 | 788 | 14.3% |
| $75,000 to $99,999 | 782 | 14.2% |
| $100,000 to $149,999 | 1,477 | 26.8% |
| $150,000 to $199,999 | 793 | 14.4% |
| $200,000+ | 942 | 17.1% |
Family Income by Famaliy Size in Mountlake Terrace
4-person families (748 | 13.6%) account for the highest median family income in Mountlake Terrace with $163,304 per family, while 2-person families (2,895 | 52.5%) have the highest median income of $51,648 per family member.
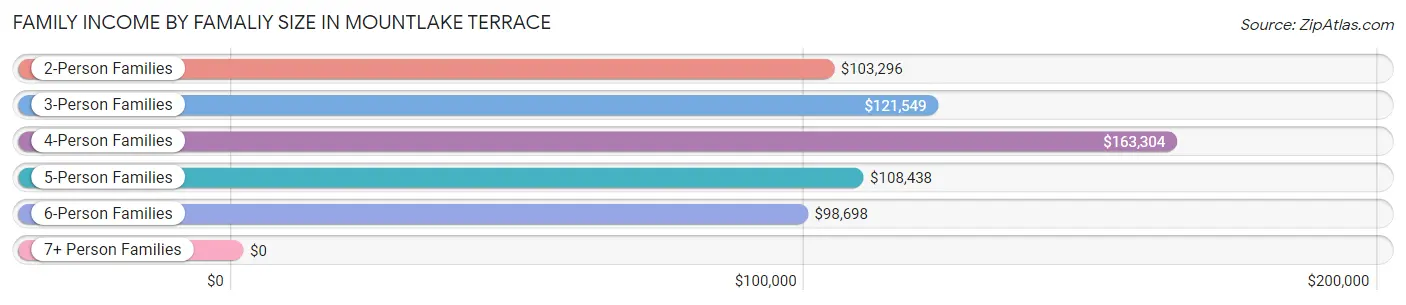
| Income Bracket | # Families | Median Income |
| 2-Person Families | 2,895 (52.5%) | $103,296 |
| 3-Person Families | 1,369 (24.8%) | $121,549 |
| 4-Person Families | 748 (13.6%) | $163,304 |
| 5-Person Families | 378 (6.9%) | $108,438 |
| 6-Person Families | 75 (1.4%) | $98,698 |
| 7+ Person Families | 45 (0.8%) | $0 |
| Total | 5,510 (100.0%) | $109,827 |
Family Income by Number of Earners in Mountlake Terrace
The median family income in Mountlake Terrace is $109,827, with families comprising 3+ earners (520) having the highest median family income of $146,875, while families with no earners (549) have the lowest median family income of $65,208, accounting for 9.4% and 10.0% of families, respectively.
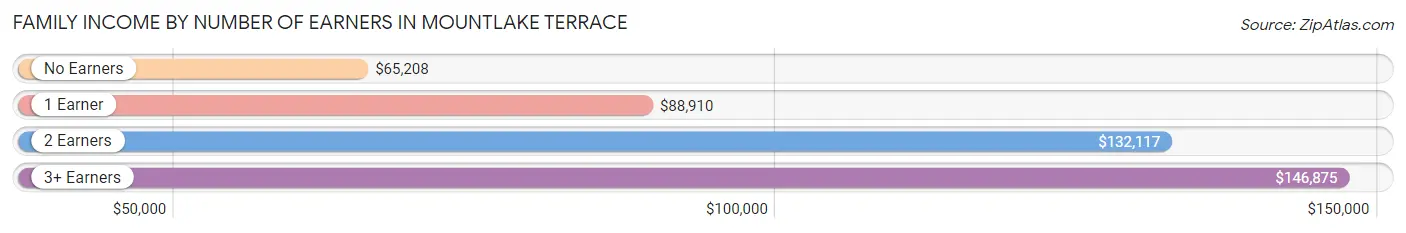
| Number of Earners | # Families | Median Income |
| No Earners | 549 (10.0%) | $65,208 |
| 1 Earner | 1,786 (32.4%) | $88,910 |
| 2 Earners | 2,655 (48.2%) | $132,117 |
| 3+ Earners | 520 (9.4%) | $146,875 |
| Total | 5,510 (100.0%) | $109,827 |
Household Income in Mountlake Terrace
Household Income Brackets in Mountlake Terrace
With 1,966 households falling in the category, the $100,000 to $149,999 income range is the most frequent in Mountlake Terrace, accounting for 22.0% of all households. In contrast, only 116 households (1.3%) fall into the $10,000 to $14,999 income bracket, making it the least populous group.
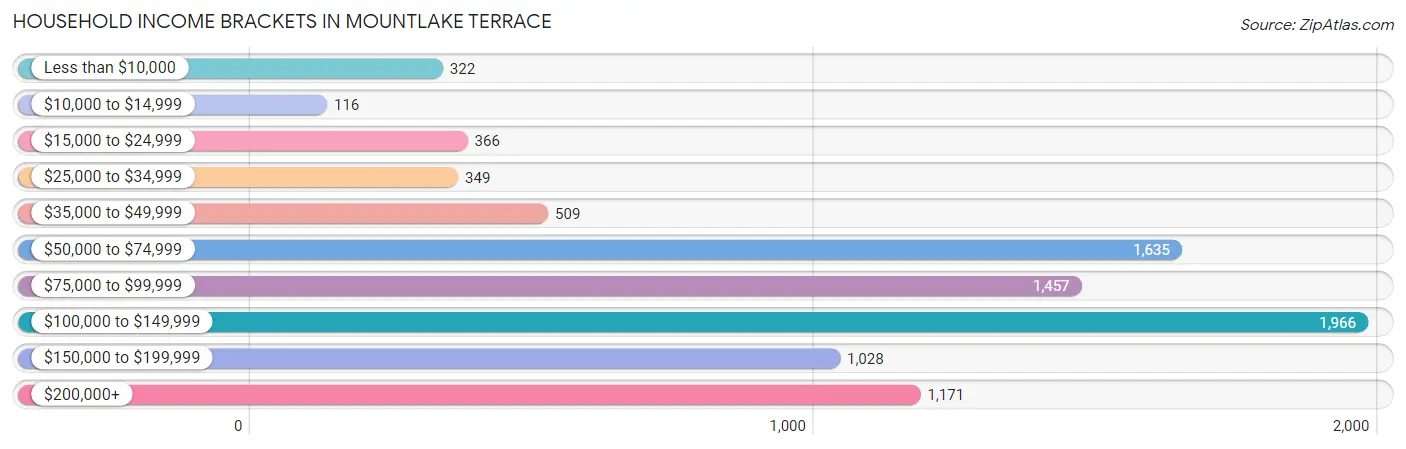
| Income Bracket | # Households | % Households |
| Less than $10,000 | 322 | 3.6% |
| $10,000 to $14,999 | 116 | 1.3% |
| $15,000 to $24,999 | 366 | 4.1% |
| $25,000 to $34,999 | 349 | 3.9% |
| $35,000 to $49,999 | 509 | 5.7% |
| $50,000 to $74,999 | 1,635 | 18.3% |
| $75,000 to $99,999 | 1,457 | 16.3% |
| $100,000 to $149,999 | 1,966 | 22.0% |
| $150,000 to $199,999 | 1,028 | 11.5% |
| $200,000+ | 1,171 | 13.1% |
Household Income by Householder Age in Mountlake Terrace
The median household income in Mountlake Terrace is $96,104, with the highest median household income of $114,183 found in the 25 to 44 years age bracket for the primary householder. A total of 3,288 households (36.8%) fall into this category. Meanwhile, the 15 to 24 years age bracket for the primary householder has the lowest median household income of $54,833, with 280 households (3.1%) in this group.
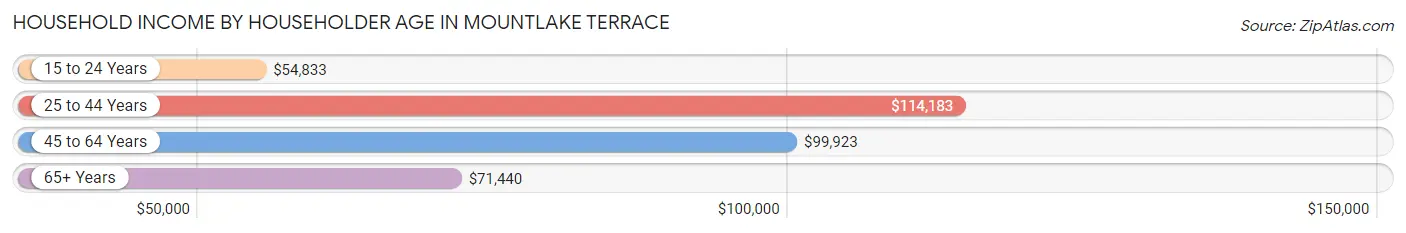
| Income Bracket | # Households | Median Income |
| 15 to 24 Years | 280 (3.1%) | $54,833 |
| 25 to 44 Years | 3,288 (36.8%) | $114,183 |
| 45 to 64 Years | 3,302 (36.9%) | $99,923 |
| 65+ Years | 2,067 (23.1%) | $71,440 |
| Total | 8,937 (100.0%) | $96,104 |
Poverty in Mountlake Terrace
Income Below Poverty by Sex and Age in Mountlake Terrace
With 6.5% poverty level for males and 8.1% for females among the residents of Mountlake Terrace, 16 and 17 year old males and 35 to 44 year old females are the most vulnerable to poverty, with 36 males (17.1%) and 223 females (10.8%) in their respective age groups living below the poverty level.
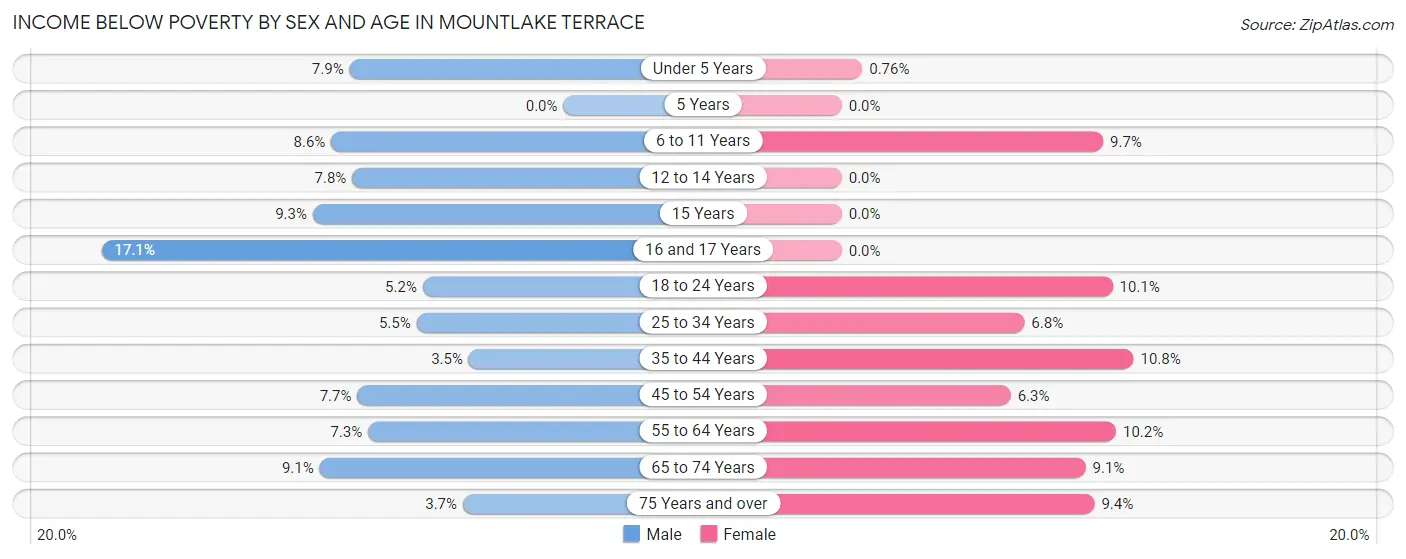
| Age Bracket | Male | Female |
| Under 5 Years | 35 (7.9%) | 3 (0.8%) |
| 5 Years | 0 (0.0%) | 0 (0.0%) |
| 6 to 11 Years | 55 (8.6%) | 68 (9.7%) |
| 12 to 14 Years | 38 (7.8%) | 0 (0.0%) |
| 15 Years | 20 (9.3%) | 0 (0.0%) |
| 16 and 17 Years | 36 (17.1%) | 0 (0.0%) |
| 18 to 24 Years | 41 (5.2%) | 56 (10.1%) |
| 25 to 34 Years | 85 (5.4%) | 127 (6.8%) |
| 35 to 44 Years | 62 (3.5%) | 223 (10.8%) |
| 45 to 54 Years | 101 (7.6%) | 73 (6.3%) |
| 55 to 64 Years | 101 (7.2%) | 169 (10.2%) |
| 65 to 74 Years | 82 (9.0%) | 80 (9.0%) |
| 75 Years and over | 22 (3.7%) | 80 (9.4%) |
| Total | 678 (6.5%) | 879 (8.1%) |
Income Above Poverty by Sex and Age in Mountlake Terrace
According to the poverty statistics in Mountlake Terrace, males aged 5 years and females aged 5 years are the age groups that are most secure financially, with 100.0% of males and 100.0% of females in these age groups living above the poverty line.
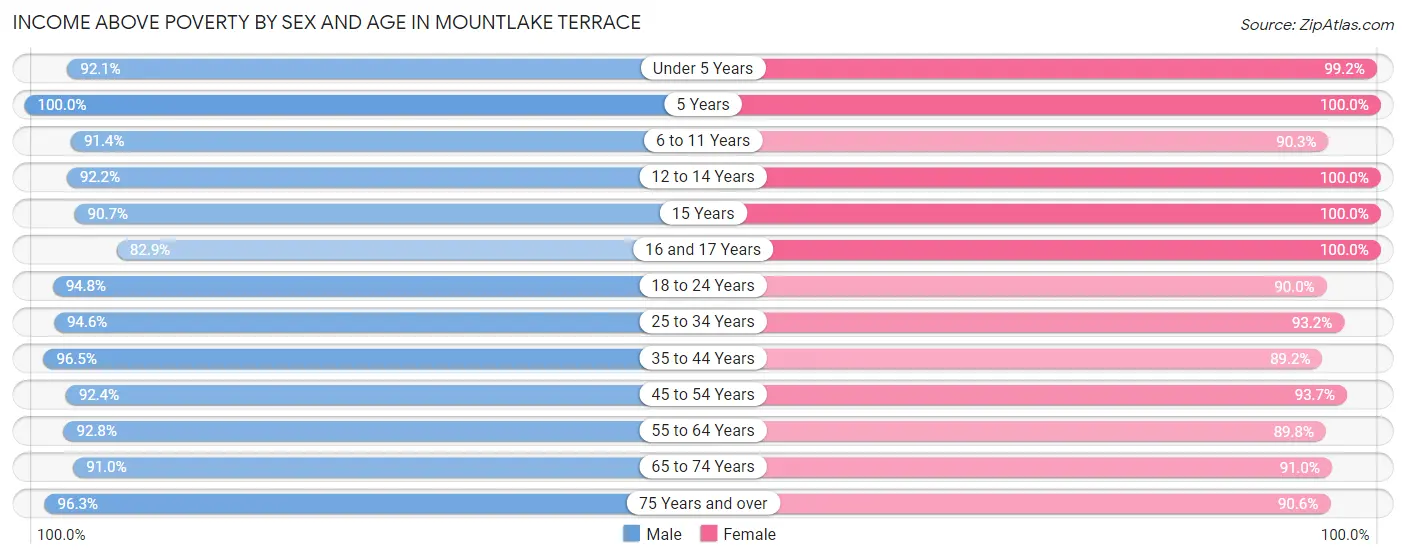
| Age Bracket | Male | Female |
| Under 5 Years | 406 (92.1%) | 390 (99.2%) |
| 5 Years | 86 (100.0%) | 164 (100.0%) |
| 6 to 11 Years | 583 (91.4%) | 633 (90.3%) |
| 12 to 14 Years | 447 (92.2%) | 274 (100.0%) |
| 15 Years | 195 (90.7%) | 21 (100.0%) |
| 16 and 17 Years | 174 (82.9%) | 249 (100.0%) |
| 18 to 24 Years | 745 (94.8%) | 501 (89.9%) |
| 25 to 34 Years | 1,476 (94.6%) | 1,747 (93.2%) |
| 35 to 44 Years | 1,703 (96.5%) | 1,837 (89.2%) |
| 45 to 54 Years | 1,219 (92.3%) | 1,091 (93.7%) |
| 55 to 64 Years | 1,292 (92.7%) | 1,491 (89.8%) |
| 65 to 74 Years | 824 (90.9%) | 804 (90.9%) |
| 75 Years and over | 568 (96.3%) | 773 (90.6%) |
| Total | 9,718 (93.5%) | 9,975 (91.9%) |
Income Below Poverty Among Married-Couple Families in Mountlake Terrace
The poverty statistics for married-couple families in Mountlake Terrace show that 2.5% or 100 of the total 3,921 families live below the poverty line. Families with no children have the highest poverty rate of 2.8%, comprising of 70 families. On the other hand, families with 3 or 4 children have the lowest poverty rate of 0.0%, which includes 0 families.
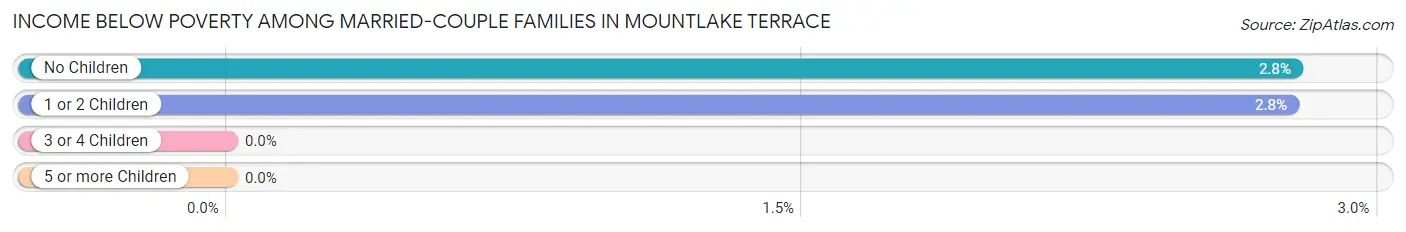
| Children | Above Poverty | Below Poverty |
| No Children | 2,448 (97.2%) | 70 (2.8%) |
| 1 or 2 Children | 1,054 (97.2%) | 30 (2.8%) |
| 3 or 4 Children | 287 (100.0%) | 0 (0.0%) |
| 5 or more Children | 32 (100.0%) | 0 (0.0%) |
| Total | 3,821 (97.5%) | 100 (2.5%) |
Income Below Poverty Among Single-Parent Households in Mountlake Terrace
According to the poverty data in Mountlake Terrace, 3.7% or 23 single-father households and 6.5% or 63 single-mother households are living below the poverty line. Among single-father households, those with 1 or 2 children have the highest poverty rate, with 23 households (7.5%) experiencing poverty. Likewise, among single-mother households, those with 1 or 2 children have the highest poverty rate, with 57 households (10.1%) falling below the poverty line.
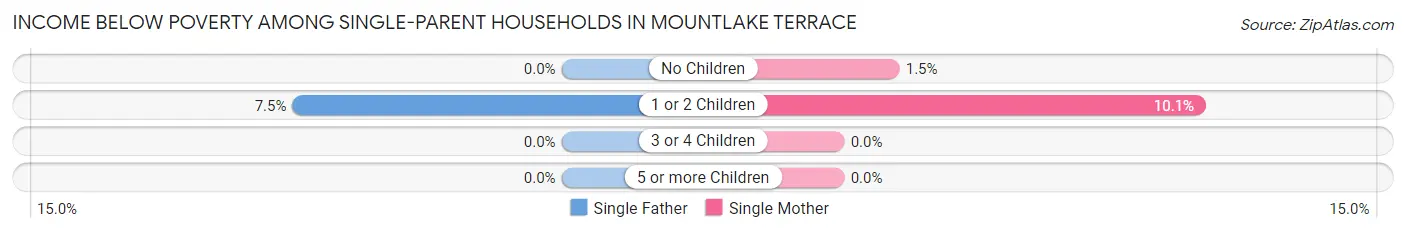
| Children | Single Father | Single Mother |
| No Children | 0 (0.0%) | 6 (1.5%) |
| 1 or 2 Children | 23 (7.5%) | 57 (10.1%) |
| 3 or 4 Children | 0 (0.0%) | 0 (0.0%) |
| 5 or more Children | 0 (0.0%) | 0 (0.0%) |
| Total | 23 (3.7%) | 63 (6.5%) |
Income Below Poverty Among Married-Couple vs Single-Parent Households in Mountlake Terrace
The poverty data for Mountlake Terrace shows that 100 of the married-couple family households (2.5%) and 86 of the single-parent households (5.4%) are living below the poverty level. Within the married-couple family households, those with no children have the highest poverty rate, with 70 households (2.8%) falling below the poverty line. Among the single-parent households, those with 1 or 2 children have the highest poverty rate, with 80 household (9.2%) living below poverty.
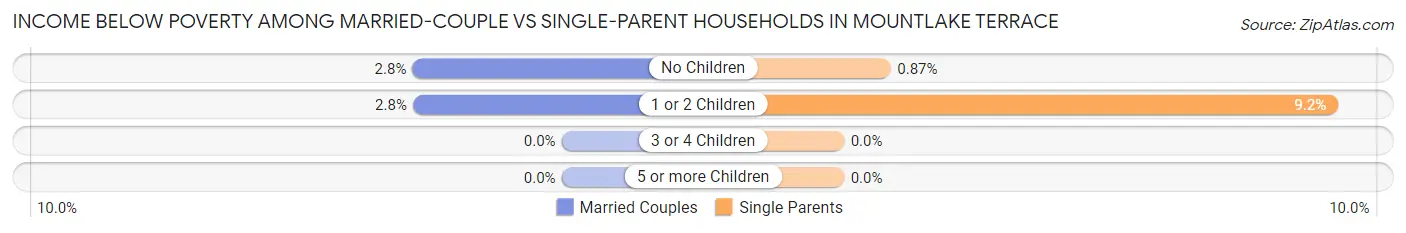
| Children | Married-Couple Families | Single-Parent Households |
| No Children | 70 (2.8%) | 6 (0.9%) |
| 1 or 2 Children | 30 (2.8%) | 80 (9.2%) |
| 3 or 4 Children | 0 (0.0%) | 0 (0.0%) |
| 5 or more Children | 0 (0.0%) | 0 (0.0%) |
| Total | 100 (2.5%) | 86 (5.4%) |
Race in Mountlake Terrace
The most populous races in Mountlake Terrace are White / Caucasian (14,108 | 66.1%), Hispanic or Latino (2,708 | 12.7%), and Asian (2,313 | 10.8%).
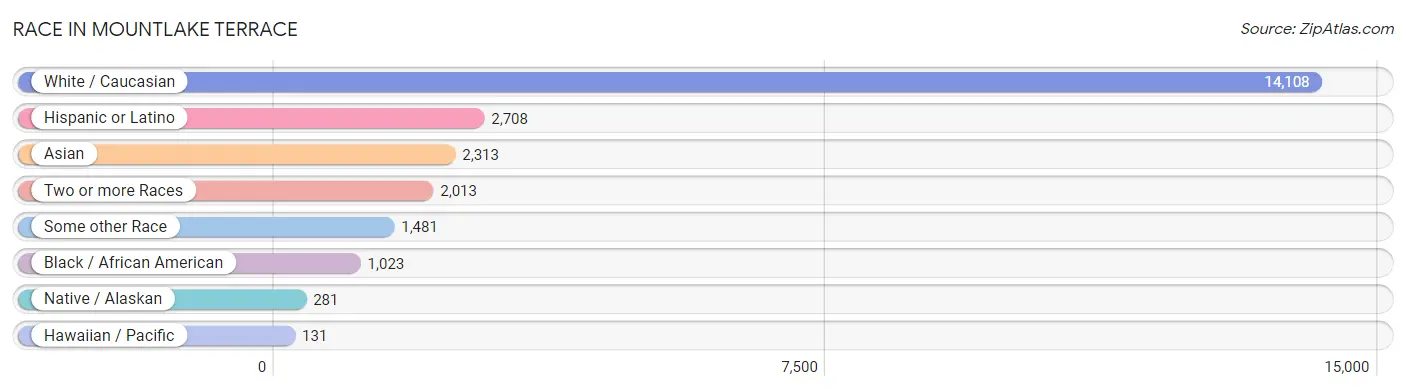
| Race | # Population | % Population |
| Asian | 2,313 | 10.8% |
| Black / African American | 1,023 | 4.8% |
| Hawaiian / Pacific | 131 | 0.6% |
| Hispanic or Latino | 2,708 | 12.7% |
| Native / Alaskan | 281 | 1.3% |
| White / Caucasian | 14,108 | 66.1% |
| Two or more Races | 2,013 | 9.4% |
| Some other Race | 1,481 | 6.9% |
| Total | 21,350 | 100.0% |
Ancestry in Mountlake Terrace
The most populous ancestries reported in Mountlake Terrace are German (3,613 | 16.9%), English (2,617 | 12.3%), Irish (2,457 | 11.5%), Mexican (1,958 | 9.2%), and Norwegian (1,194 | 5.6%), together accounting for 55.4% of all Mountlake Terrace residents.
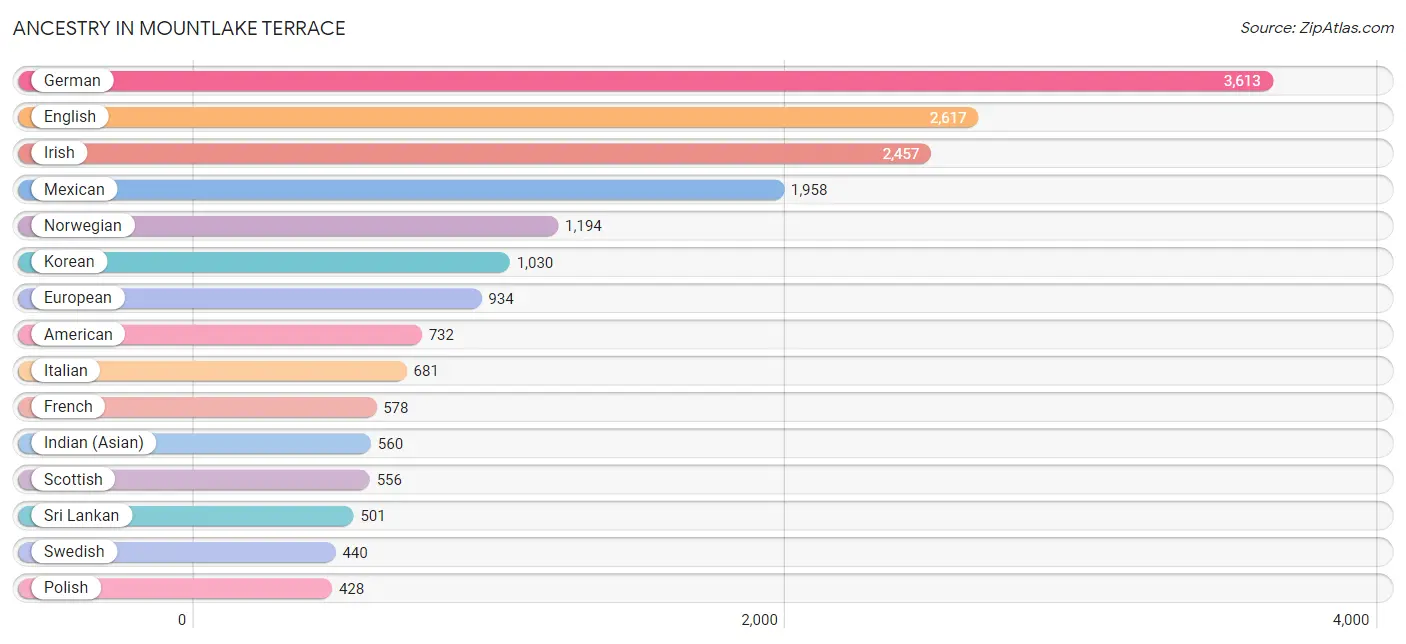
| Ancestry | # Population | % Population |
| Afghan | 22 | 0.1% |
| African | 96 | 0.4% |
| American | 732 | 3.4% |
| Arab | 263 | 1.2% |
| Australian | 11 | 0.1% |
| Austrian | 45 | 0.2% |
| Belgian | 133 | 0.6% |
| Bhutanese | 331 | 1.5% |
| Blackfeet | 7 | 0.0% |
| Brazilian | 11 | 0.1% |
| British | 178 | 0.8% |
| Bulgarian | 59 | 0.3% |
| Burmese | 293 | 1.4% |
| Canadian | 68 | 0.3% |
| Celtic | 14 | 0.1% |
| Central American | 179 | 0.8% |
| Cherokee | 67 | 0.3% |
| Cheyenne | 24 | 0.1% |
| Chilean | 50 | 0.2% |
| Colombian | 104 | 0.5% |
| Colville | 7 | 0.0% |
| Cree | 13 | 0.1% |
| Croatian | 7 | 0.0% |
| Cuban | 20 | 0.1% |
| Czech | 100 | 0.5% |
| Czechoslovakian | 35 | 0.2% |
| Danish | 176 | 0.8% |
| Dutch | 246 | 1.1% |
| Eastern European | 8 | 0.0% |
| Ecuadorian | 86 | 0.4% |
| English | 2,617 | 12.3% |
| Ethiopian | 248 | 1.2% |
| European | 934 | 4.4% |
| Filipino | 22 | 0.1% |
| Finnish | 90 | 0.4% |
| French | 578 | 2.7% |
| French American Indian | 7 | 0.0% |
| French Canadian | 139 | 0.6% |
| German | 3,613 | 16.9% |
| Greek | 193 | 0.9% |
| Guamanian / Chamorro | 194 | 0.9% |
| Guatemalan | 30 | 0.1% |
| Hungarian | 38 | 0.2% |
| Icelander | 16 | 0.1% |
| Indian (Asian) | 560 | 2.6% |
| Inupiat | 4 | 0.0% |
| Iranian | 56 | 0.3% |
| Iraqi | 25 | 0.1% |
| Irish | 2,457 | 11.5% |
| Italian | 681 | 3.2% |
| Jamaican | 10 | 0.1% |
| Japanese | 67 | 0.3% |
| Kenyan | 50 | 0.2% |
| Korean | 1,030 | 4.8% |
| Laotian | 86 | 0.4% |
| Latvian | 18 | 0.1% |
| Lebanese | 7 | 0.0% |
| Lithuanian | 16 | 0.1% |
| Mexican | 1,958 | 9.2% |
| Mexican American Indian | 205 | 1.0% |
| Moroccan | 177 | 0.8% |
| Native Hawaiian | 39 | 0.2% |
| Navajo | 4 | 0.0% |
| Northern European | 59 | 0.3% |
| Norwegian | 1,194 | 5.6% |
| Pakistani | 204 | 1.0% |
| Panamanian | 45 | 0.2% |
| Pennsylvania German | 14 | 0.1% |
| Peruvian | 13 | 0.1% |
| Polish | 428 | 2.0% |
| Portuguese | 56 | 0.3% |
| Puerto Rican | 39 | 0.2% |
| Puget Sound Salish | 19 | 0.1% |
| Russian | 183 | 0.9% |
| Salvadoran | 104 | 0.5% |
| Samoan | 14 | 0.1% |
| Scandinavian | 305 | 1.4% |
| Scotch-Irish | 185 | 0.9% |
| Scottish | 556 | 2.6% |
| Slovak | 8 | 0.0% |
| South American | 326 | 1.5% |
| South American Indian | 74 | 0.4% |
| Spaniard | 80 | 0.4% |
| Spanish | 39 | 0.2% |
| Sri Lankan | 501 | 2.4% |
| Subsaharan African | 409 | 1.9% |
| Sudanese | 15 | 0.1% |
| Swedish | 440 | 2.1% |
| Swiss | 49 | 0.2% |
| Syrian | 54 | 0.3% |
| Thai | 236 | 1.1% |
| Tlingit-Haida | 8 | 0.0% |
| Turkish | 7 | 0.0% |
| Ukrainian | 69 | 0.3% |
| Uruguayan | 58 | 0.3% |
| Venezuelan | 15 | 0.1% |
| Welsh | 130 | 0.6% |
| West Indian | 6 | 0.0% |
| Yakama | 22 | 0.1% |
| Yugoslavian | 39 | 0.2% | View All 100 Rows |
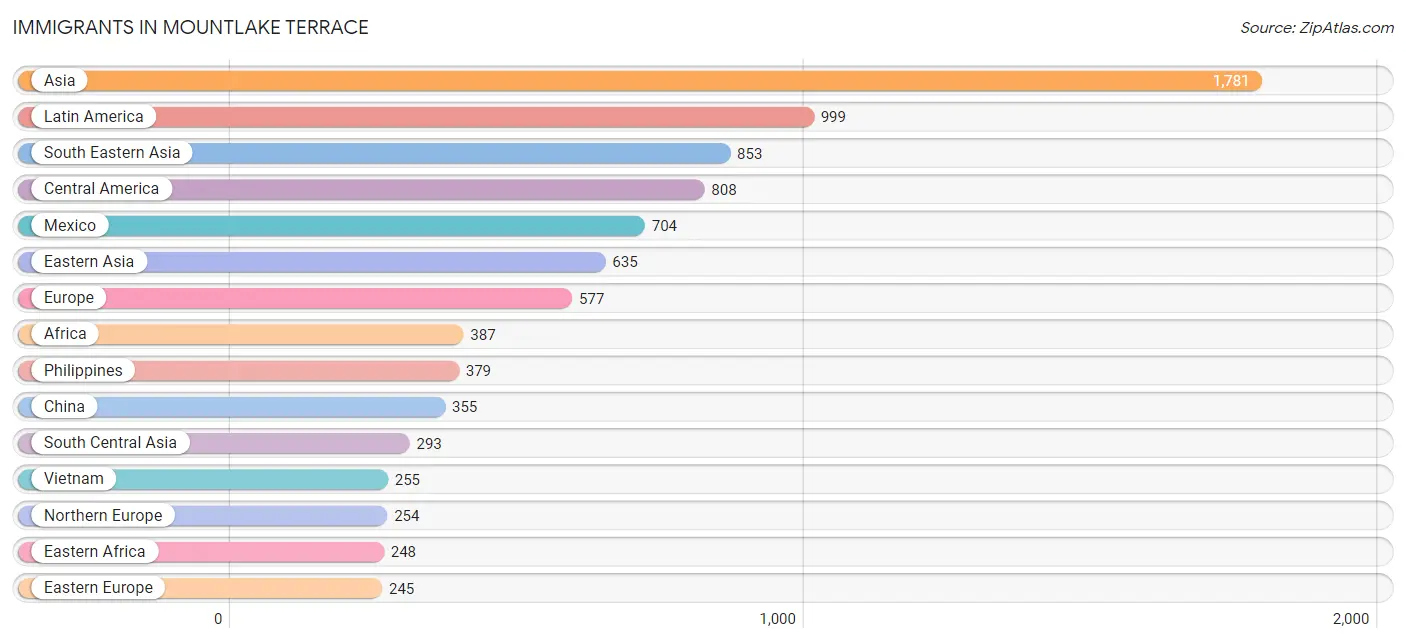
Immigrants in Mountlake Terrace
The most numerous immigrant groups reported in Mountlake Terrace came from Asia (1,781 | 8.3%), Latin America (999 | 4.7%), South Eastern Asia (853 | 4.0%), Central America (808 | 3.8%), and Mexico (704 | 3.3%), together accounting for 24.1% of all Mountlake Terrace residents.
| Immigration Origin | # Population | % Population |
| Afghanistan | 14 | 0.1% |
| Africa | 387 | 1.8% |
| Asia | 1,781 | 8.3% |
| Australia | 27 | 0.1% |
| Austria | 6 | 0.0% |
| Belarus | 32 | 0.2% |
| Bosnia and Herzegovina | 19 | 0.1% |
| Brazil | 31 | 0.2% |
| Bulgaria | 59 | 0.3% |
| Cambodia | 11 | 0.1% |
| Canada | 88 | 0.4% |
| Caribbean | 9 | 0.0% |
| Central America | 808 | 3.8% |
| Chile | 53 | 0.3% |
| China | 355 | 1.7% |
| Colombia | 30 | 0.1% |
| Cuba | 9 | 0.0% |
| Czechoslovakia | 13 | 0.1% |
| Eastern Africa | 248 | 1.2% |
| Eastern Asia | 635 | 3.0% |
| Eastern Europe | 245 | 1.1% |
| Ecuador | 68 | 0.3% |
| El Salvador | 82 | 0.4% |
| England | 50 | 0.2% |
| Eritrea | 12 | 0.1% |
| Ethiopia | 186 | 0.9% |
| Europe | 577 | 2.7% |
| Germany | 67 | 0.3% |
| Hong Kong | 32 | 0.2% |
| India | 207 | 1.0% |
| Indonesia | 49 | 0.2% |
| Iran | 36 | 0.2% |
| Japan | 92 | 0.4% |
| Kenya | 50 | 0.2% |
| Korea | 188 | 0.9% |
| Latin America | 999 | 4.7% |
| Mexico | 704 | 3.3% |
| Micronesia | 40 | 0.2% |
| Morocco | 110 | 0.5% |
| Northern Africa | 125 | 0.6% |
| Northern Europe | 254 | 1.2% |
| Norway | 12 | 0.1% |
| Oceania | 67 | 0.3% |
| Pakistan | 36 | 0.2% |
| Panama | 22 | 0.1% |
| Philippines | 379 | 1.8% |
| Russia | 86 | 0.4% |
| South America | 182 | 0.9% |
| South Central Asia | 293 | 1.4% |
| South Eastern Asia | 853 | 4.0% |
| Sudan | 15 | 0.1% |
| Sweden | 60 | 0.3% |
| Switzerland | 5 | 0.0% |
| Taiwan | 26 | 0.1% |
| Thailand | 159 | 0.7% |
| Ukraine | 15 | 0.1% |
| Vietnam | 255 | 1.2% |
| Western Africa | 14 | 0.1% |
| Western Europe | 78 | 0.4% | View All 59 Rows |
Sex and Age in Mountlake Terrace
Sex and Age in Mountlake Terrace
The most populous age groups in Mountlake Terrace are 35 to 39 Years (1,092 | 10.4%) for men and 35 to 39 Years (1,297 | 11.9%) for women.
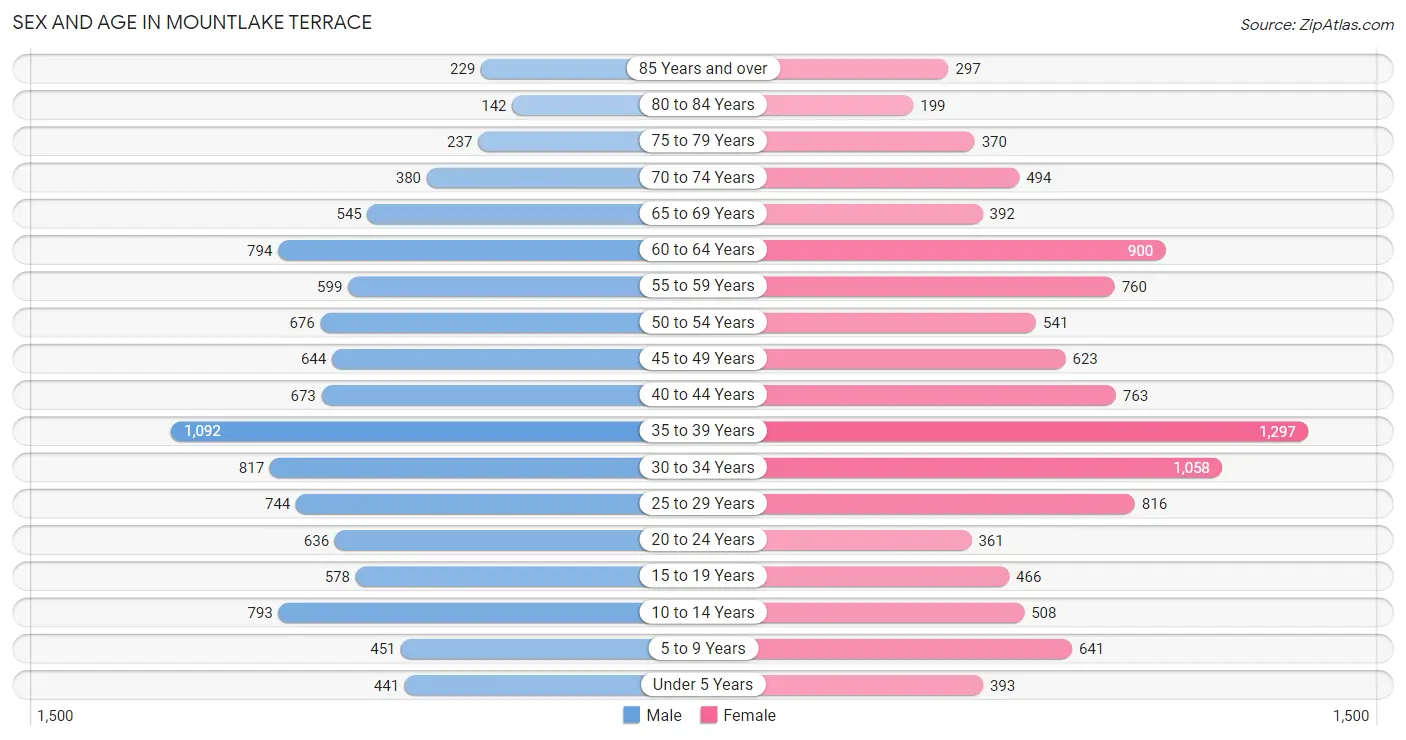
| Age Bracket | Male | Female |
| Under 5 Years | 441 (4.2%) | 393 (3.6%) |
| 5 to 9 Years | 451 (4.3%) | 641 (5.9%) |
| 10 to 14 Years | 793 (7.6%) | 508 (4.7%) |
| 15 to 19 Years | 578 (5.5%) | 466 (4.3%) |
| 20 to 24 Years | 636 (6.1%) | 361 (3.3%) |
| 25 to 29 Years | 744 (7.1%) | 816 (7.5%) |
| 30 to 34 Years | 817 (7.8%) | 1,058 (9.7%) |
| 35 to 39 Years | 1,092 (10.4%) | 1,297 (11.9%) |
| 40 to 44 Years | 673 (6.4%) | 763 (7.0%) |
| 45 to 49 Years | 644 (6.1%) | 623 (5.7%) |
| 50 to 54 Years | 676 (6.5%) | 541 (5.0%) |
| 55 to 59 Years | 599 (5.7%) | 760 (7.0%) |
| 60 to 64 Years | 794 (7.6%) | 900 (8.3%) |
| 65 to 69 Years | 545 (5.2%) | 392 (3.6%) |
| 70 to 74 Years | 380 (3.6%) | 494 (4.5%) |
| 75 to 79 Years | 237 (2.3%) | 370 (3.4%) |
| 80 to 84 Years | 142 (1.4%) | 199 (1.8%) |
| 85 Years and over | 229 (2.2%) | 297 (2.7%) |
| Total | 10,471 (100.0%) | 10,879 (100.0%) |
Families and Households in Mountlake Terrace
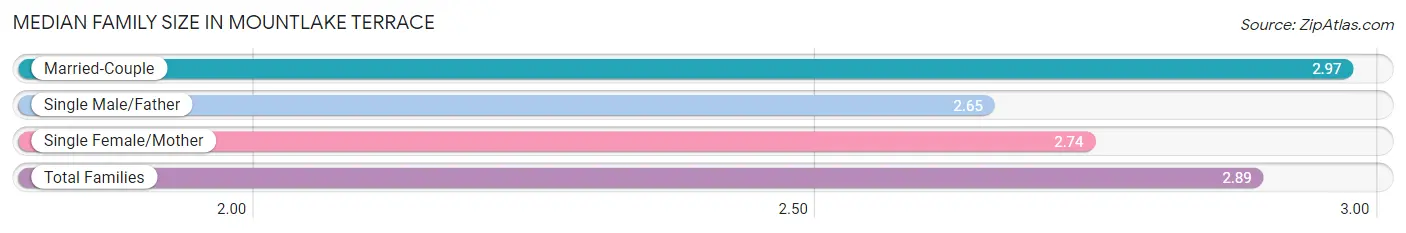
Median Family Size in Mountlake Terrace
The median family size in Mountlake Terrace is 2.89 persons per family, with married-couple families (3,921 | 71.2%) accounting for the largest median family size of 2.97 persons per family. On the other hand, single male/father families (615 | 11.2%) represent the smallest median family size with 2.65 persons per family.
| Family Type | # Families | Family Size |
| Married-Couple | 3,921 (71.2%) | 2.97 |
| Single Male/Father | 615 (11.2%) | 2.65 |
| Single Female/Mother | 974 (17.7%) | 2.74 |
| Total Families | 5,510 (100.0%) | 2.89 |
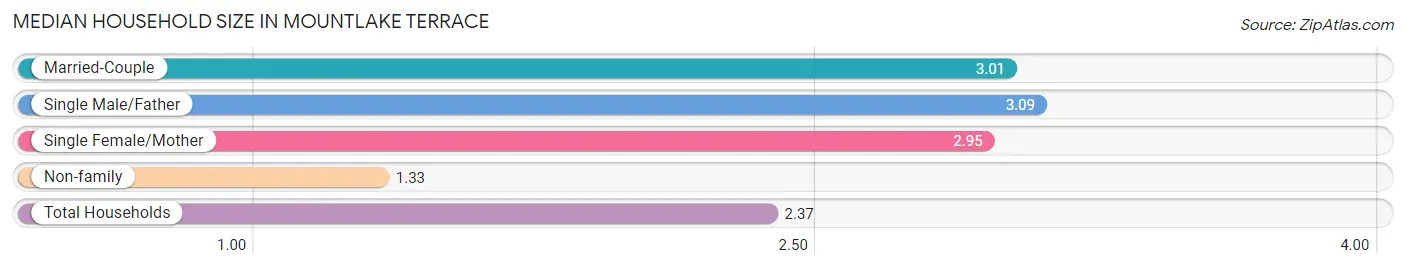
Median Household Size in Mountlake Terrace
The median household size in Mountlake Terrace is 2.37 persons per household, with single male/father households (615 | 6.9%) accounting for the largest median household size of 3.09 persons per household. non-family households (3,427 | 38.4%) represent the smallest median household size with 1.33 persons per household.
| Household Type | # Households | Household Size |
| Married-Couple | 3,921 (43.9%) | 3.01 |
| Single Male/Father | 615 (6.9%) | 3.09 |
| Single Female/Mother | 974 (10.9%) | 2.95 |
| Non-family | 3,427 (38.4%) | 1.33 |
| Total Households | 8,937 (100.0%) | 2.37 |
Household Size by Marriage Status in Mountlake Terrace
Out of a total of 8,937 households in Mountlake Terrace, 5,510 (61.7%) are family households, while 3,427 (38.4%) are nonfamily households. The most numerous type of family households are 2-person households, comprising 2,700, and the most common type of nonfamily households are 1-person households, comprising 2,573.
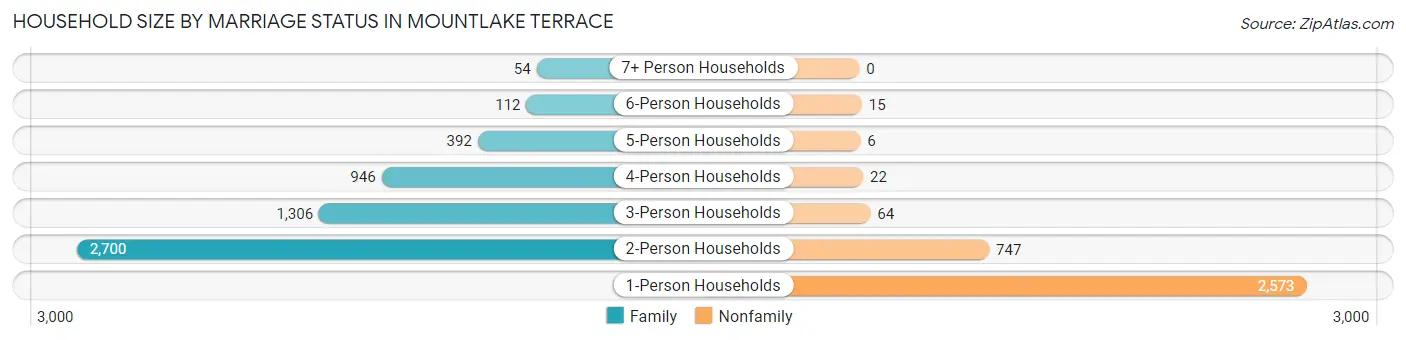
| Household Size | Family Households | Nonfamily Households |
| 1-Person Households | - | 2,573 (28.8%) |
| 2-Person Households | 2,700 (30.2%) | 747 (8.4%) |
| 3-Person Households | 1,306 (14.6%) | 64 (0.7%) |
| 4-Person Households | 946 (10.6%) | 22 (0.3%) |
| 5-Person Households | 392 (4.4%) | 6 (0.1%) |
| 6-Person Households | 112 (1.3%) | 15 (0.2%) |
| 7+ Person Households | 54 (0.6%) | 0 (0.0%) |
| Total | 5,510 (61.7%) | 3,427 (38.4%) |
Female Fertility in Mountlake Terrace
Fertility by Age in Mountlake Terrace
Average fertility rate in Mountlake Terrace is 24.0 births per 1,000 women. Women in the age bracket of 20 to 34 years have the highest fertility rate with 43.0 births per 1,000 women. Women in the age bracket of 20 to 34 years acount for 73.3% of all women with births.
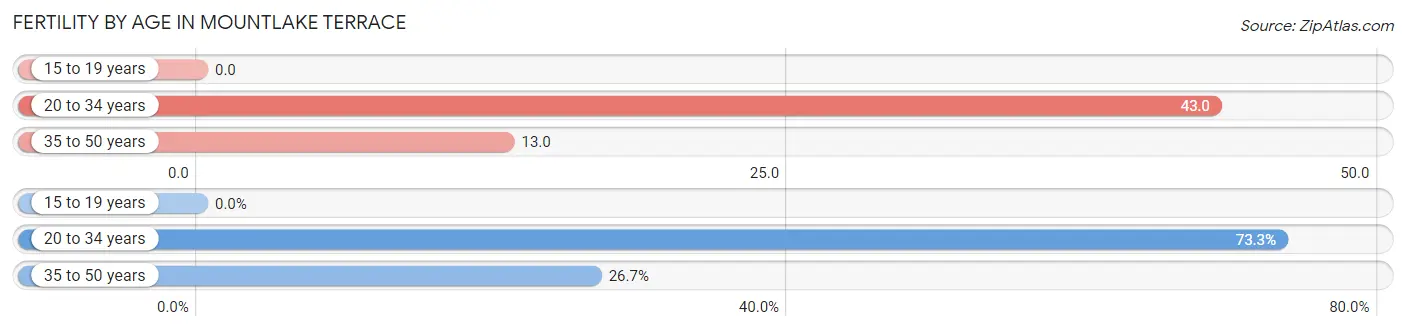
| Age Bracket | Women with Births | Births / 1,000 Women |
| 15 to 19 years | 0 (0.0%) | 0.0 |
| 20 to 34 years | 96 (73.3%) | 43.0 |
| 35 to 50 years | 35 (26.7%) | 13.0 |
| Total | 131 (100.0%) | 24.0 |
Fertility by Age by Marriage Status in Mountlake Terrace
84.0% of women with births (131) in Mountlake Terrace are married. The highest percentage of unmarried women with births falls into 20 to 34 years age bracket with 21.9% of them unmarried at the time of birth, while the lowest percentage of unmarried women with births belong to 35 to 50 years age bracket with 0.0% of them unmarried.
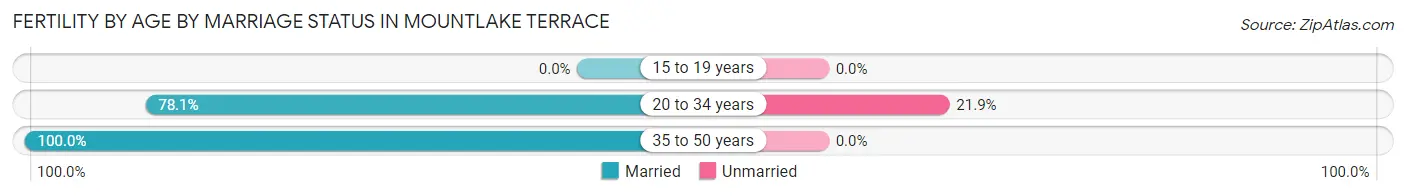
| Age Bracket | Married | Unmarried |
| 15 to 19 years | 0 (0.0%) | 0 (0.0%) |
| 20 to 34 years | 75 (78.1%) | 21 (21.9%) |
| 35 to 50 years | 35 (100.0%) | 0 (0.0%) |
| Total | 110 (84.0%) | 21 (16.0%) |
Fertility by Education in Mountlake Terrace
Average fertility rate in Mountlake Terrace is 24.0 births per 1,000 women. Women with the education attainment of high school diploma have the highest fertility rate of 64.0 births per 1,000 women, while women with the education attainment of less than high school have the lowest fertility at 4.0 births per 1,000 women. Women with the education attainment of high school diploma represent 40.5% of all women with births.
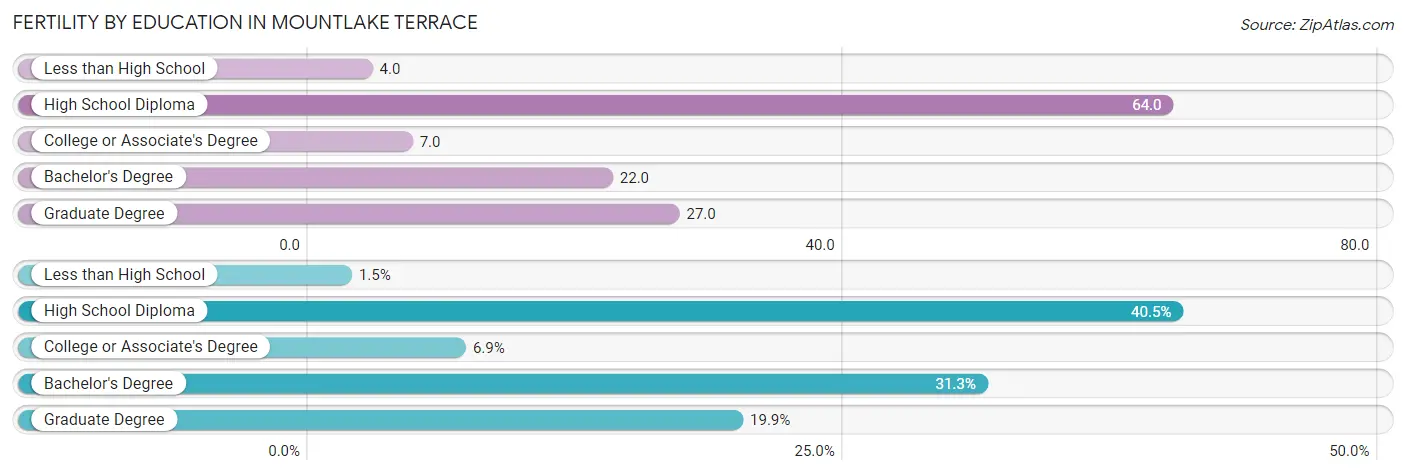
| Educational Attainment | Women with Births | Births / 1,000 Women |
| Less than High School | 2 (1.5%) | 4.0 |
| High School Diploma | 53 (40.5%) | 64.0 |
| College or Associate's Degree | 9 (6.9%) | 7.0 |
| Bachelor's Degree | 41 (31.3%) | 22.0 |
| Graduate Degree | 26 (19.9%) | 27.0 |
| Total | 131 (100.0%) | 24.0 |
Fertility by Education by Marriage Status in Mountlake Terrace
16.0% of women with births in Mountlake Terrace are unmarried. Women with the educational attainment of college or associate's degree are most likely to be married with 100.0% of them married at childbirth, while women with the educational attainment of less than high school are least likely to be married with 100.0% of them unmarried at childbirth.
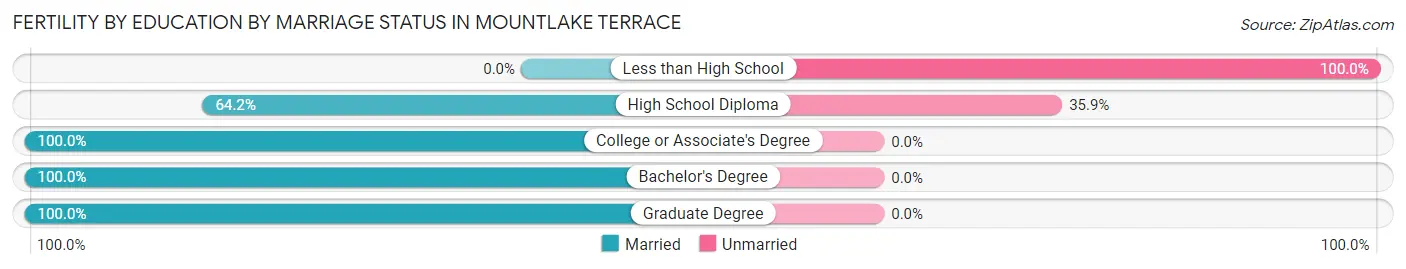
| Educational Attainment | Married | Unmarried |
| Less than High School | 0 (0.0%) | 2 (100.0%) |
| High School Diploma | 34 (64.1%) | 19 (35.8%) |
| College or Associate's Degree | 9 (100.0%) | 0 (0.0%) |
| Bachelor's Degree | 41 (100.0%) | 0 (0.0%) |
| Graduate Degree | 26 (100.0%) | 0 (0.0%) |
| Total | 110 (84.0%) | 21 (16.0%) |
Employment Characteristics in Mountlake Terrace
Employment by Class of Employer in Mountlake Terrace
Among the 11,502 employed individuals in Mountlake Terrace, private company employees (7,750 | 67.4%), not-for-profit organizations (967 | 8.4%), and self-employed (not incorporated) (858 | 7.5%) make up the most common classes of employment.
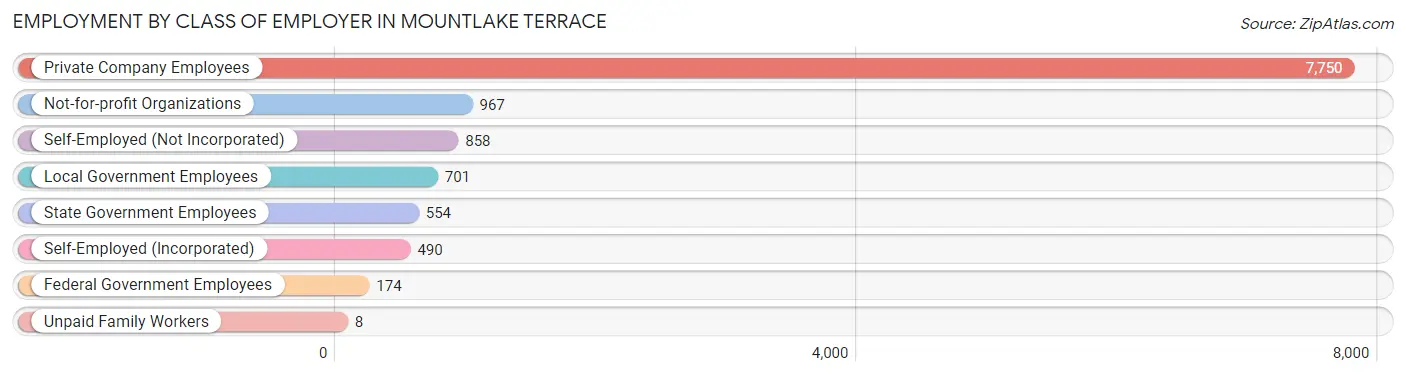
| Employer Class | # Employees | % Employees |
| Private Company Employees | 7,750 | 67.4% |
| Self-Employed (Incorporated) | 490 | 4.3% |
| Self-Employed (Not Incorporated) | 858 | 7.5% |
| Not-for-profit Organizations | 967 | 8.4% |
| Local Government Employees | 701 | 6.1% |
| State Government Employees | 554 | 4.8% |
| Federal Government Employees | 174 | 1.5% |
| Unpaid Family Workers | 8 | 0.1% |
| Total | 11,502 | 100.0% |
Employment Status by Age in Mountlake Terrace
According to the labor force statistics for Mountlake Terrace, out of the total population over 16 years of age (17,886), 68.4% or 12,234 individuals are in the labor force, with 4.1% or 502 of them unemployed. The age group with the highest labor force participation rate is 45 to 54 years, with 87.2% or 2,166 individuals in the labor force. Within the labor force, the 55 to 59 years age range has the highest percentage of unemployed individuals, with 8.4% or 95 of them being unemployed.
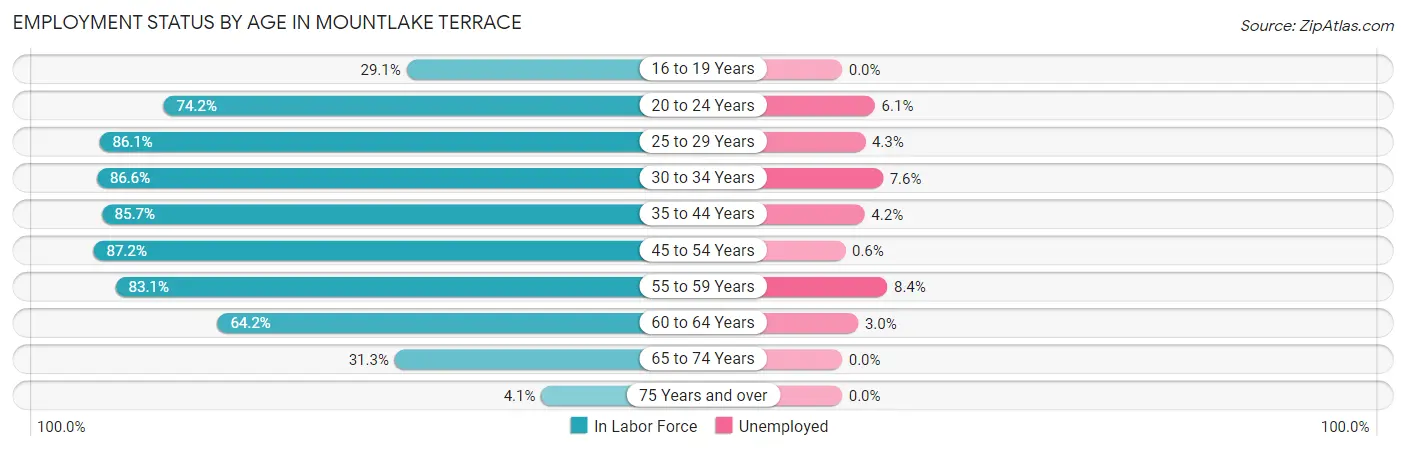
| Age Bracket | In Labor Force | Unemployed |
| 16 to 19 Years | 235 (29.1%) | 0 (0.0%) |
| 20 to 24 Years | 740 (74.2%) | 45 (6.1%) |
| 25 to 29 Years | 1,343 (86.1%) | 58 (4.3%) |
| 30 to 34 Years | 1,624 (86.6%) | 123 (7.6%) |
| 35 to 44 Years | 3,278 (85.7%) | 138 (4.2%) |
| 45 to 54 Years | 2,166 (87.2%) | 13 (0.6%) |
| 55 to 59 Years | 1,129 (83.1%) | 95 (8.4%) |
| 60 to 64 Years | 1,088 (64.2%) | 33 (3.0%) |
| 65 to 74 Years | 567 (31.3%) | 0 (0.0%) |
| 75 Years and over | 60 (4.1%) | 0 (0.0%) |
| Total | 12,234 (68.4%) | 502 (4.1%) |
Employment Status by Educational Attainment in Mountlake Terrace
According to labor force statistics for Mountlake Terrace, 83.0% of individuals (10,622) out of the total population between 25 and 64 years of age (12,797) are in the labor force, with 4.3% or 457 of them being unemployed. The group with the highest labor force participation rate are those with the educational attainment of bachelor's degree or higher, with 87.9% or 4,878 individuals in the labor force. Within the labor force, individuals with high school diploma education have the highest percentage of unemployment, with 8.1% or 169 of them being unemployed.
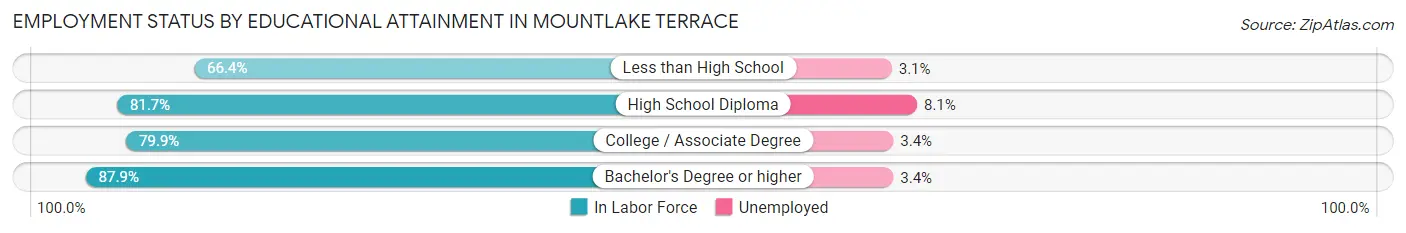
| Educational Attainment | In Labor Force | Unemployed |
| Less than High School | 455 (66.4%) | 21 (3.1%) |
| High School Diploma | 2,091 (81.7%) | 207 (8.1%) |
| College / Associate Degree | 3,199 (79.9%) | 136 (3.4%) |
| Bachelor's Degree or higher | 4,878 (87.9%) | 189 (3.4%) |
| Total | 10,622 (83.0%) | 550 (4.3%) |
Employment Occupations by Sex in Mountlake Terrace
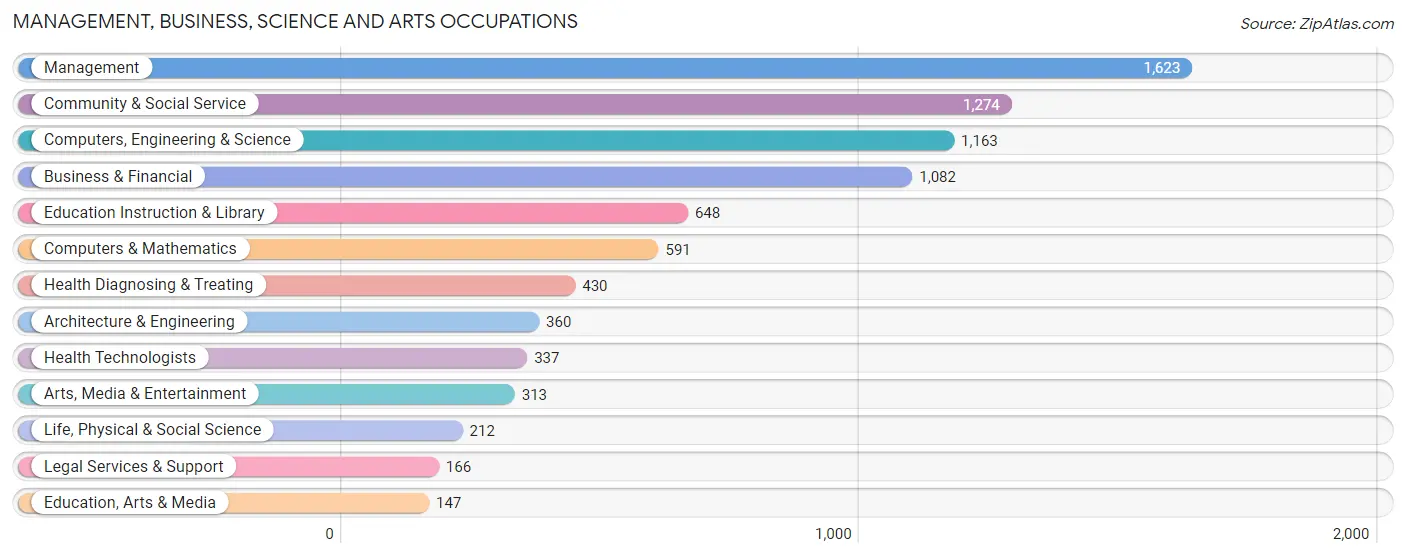
Management, Business, Science and Arts Occupations
The most common Management, Business, Science and Arts occupations in Mountlake Terrace are Management (1,623 | 13.9%), Community & Social Service (1,274 | 10.9%), Computers, Engineering & Science (1,163 | 10.0%), Business & Financial (1,082 | 9.3%), and Education Instruction & Library (648 | 5.6%).
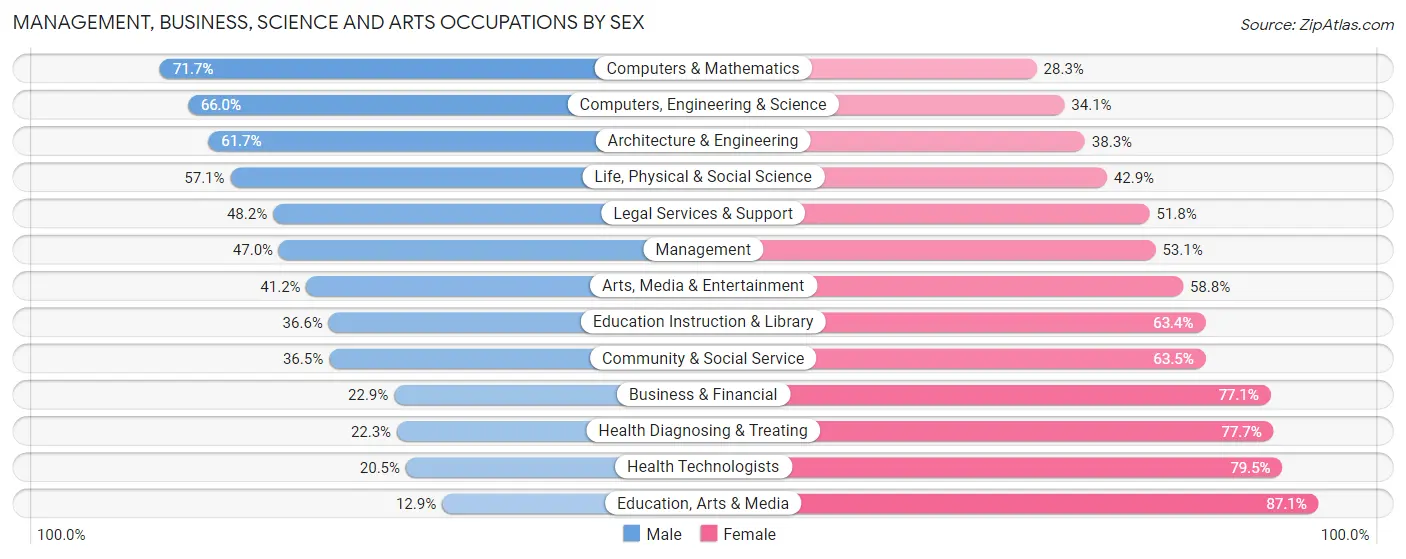
Management, Business, Science and Arts Occupations by Sex
Within the Management, Business, Science and Arts occupations in Mountlake Terrace, the most male-oriented occupations are Computers & Mathematics (71.7%), Computers, Engineering & Science (65.9%), and Architecture & Engineering (61.7%), while the most female-oriented occupations are Education, Arts & Media (87.1%), Health Technologists (79.5%), and Health Diagnosing & Treating (77.7%).
| Occupation | Male | Female |
| Management | 762 (46.9%) | 861 (53.0%) |
| Business & Financial | 248 (22.9%) | 834 (77.1%) |
| Computers, Engineering & Science | 767 (65.9%) | 396 (34.1%) |
| Computers & Mathematics | 424 (71.7%) | 167 (28.3%) |
| Architecture & Engineering | 222 (61.7%) | 138 (38.3%) |
| Life, Physical & Social Science | 121 (57.1%) | 91 (42.9%) |
| Community & Social Service | 465 (36.5%) | 809 (63.5%) |
| Education, Arts & Media | 19 (12.9%) | 128 (87.1%) |
| Legal Services & Support | 80 (48.2%) | 86 (51.8%) |
| Education Instruction & Library | 237 (36.6%) | 411 (63.4%) |
| Arts, Media & Entertainment | 129 (41.2%) | 184 (58.8%) |
| Health Diagnosing & Treating | 96 (22.3%) | 334 (77.7%) |
| Health Technologists | 69 (20.5%) | 268 (79.5%) |
| Total (Category) | 2,338 (42.0%) | 3,234 (58.0%) |
| Total (Overall) | 5,777 (49.5%) | 5,893 (50.5%) |
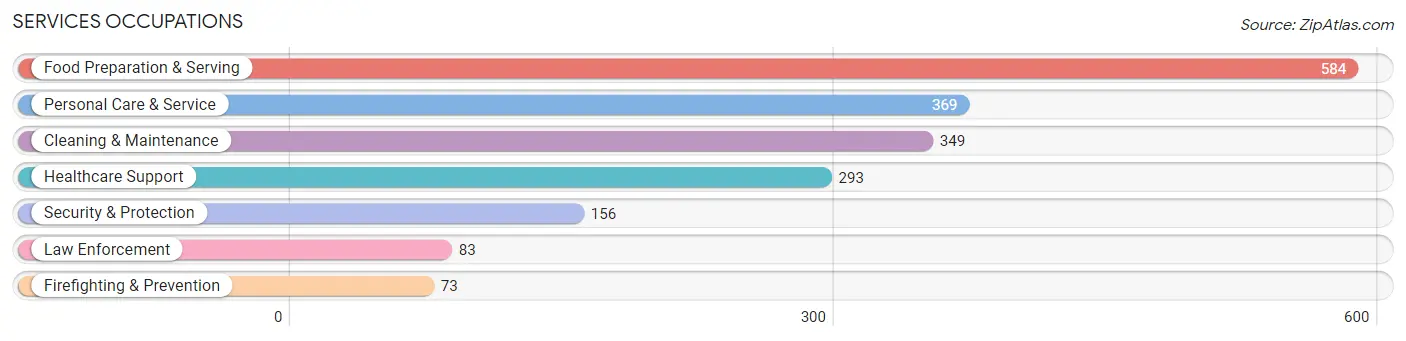
Services Occupations
The most common Services occupations in Mountlake Terrace are Food Preparation & Serving (584 | 5.0%), Personal Care & Service (369 | 3.2%), Cleaning & Maintenance (349 | 3.0%), Healthcare Support (293 | 2.5%), and Security & Protection (156 | 1.3%).
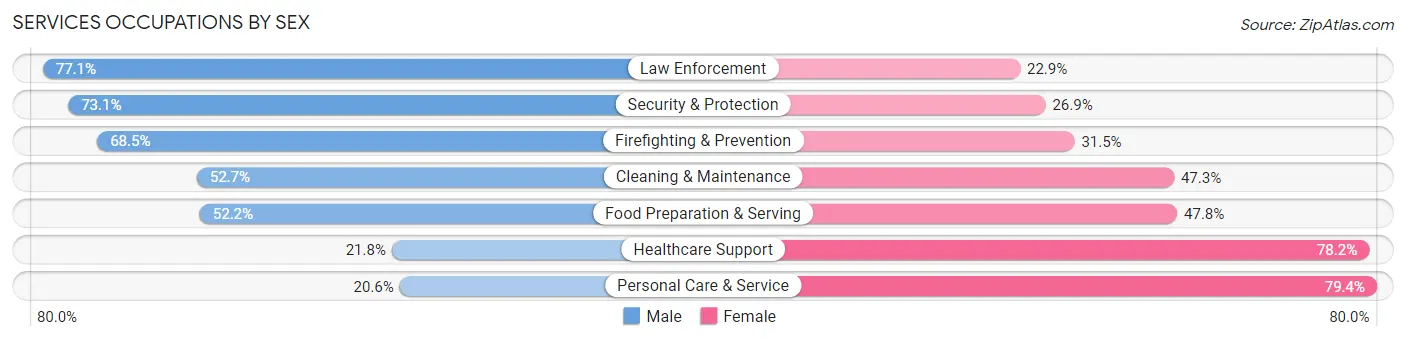
Services Occupations by Sex
Within the Services occupations in Mountlake Terrace, the most male-oriented occupations are Law Enforcement (77.1%), Security & Protection (73.1%), and Firefighting & Prevention (68.5%), while the most female-oriented occupations are Personal Care & Service (79.4%), Healthcare Support (78.2%), and Food Preparation & Serving (47.8%).
| Occupation | Male | Female |
| Healthcare Support | 64 (21.8%) | 229 (78.2%) |
| Security & Protection | 114 (73.1%) | 42 (26.9%) |
| Firefighting & Prevention | 50 (68.5%) | 23 (31.5%) |
| Law Enforcement | 64 (77.1%) | 19 (22.9%) |
| Food Preparation & Serving | 305 (52.2%) | 279 (47.8%) |
| Cleaning & Maintenance | 184 (52.7%) | 165 (47.3%) |
| Personal Care & Service | 76 (20.6%) | 293 (79.4%) |
| Total (Category) | 743 (42.4%) | 1,008 (57.6%) |
| Total (Overall) | 5,777 (49.5%) | 5,893 (50.5%) |
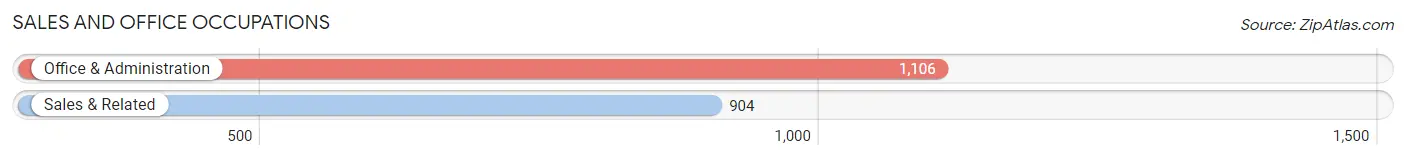
Sales and Office Occupations
The most common Sales and Office occupations in Mountlake Terrace are Office & Administration (1,106 | 9.5%), and Sales & Related (904 | 7.7%).
Sales and Office Occupations by Sex
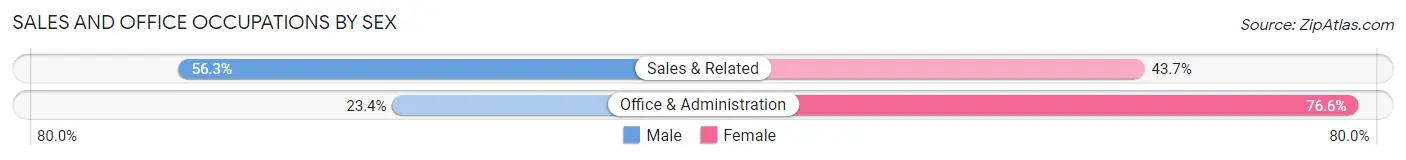
| Occupation | Male | Female |
| Sales & Related | 509 (56.3%) | 395 (43.7%) |
| Office & Administration | 259 (23.4%) | 847 (76.6%) |
| Total (Category) | 768 (38.2%) | 1,242 (61.8%) |
| Total (Overall) | 5,777 (49.5%) | 5,893 (50.5%) |
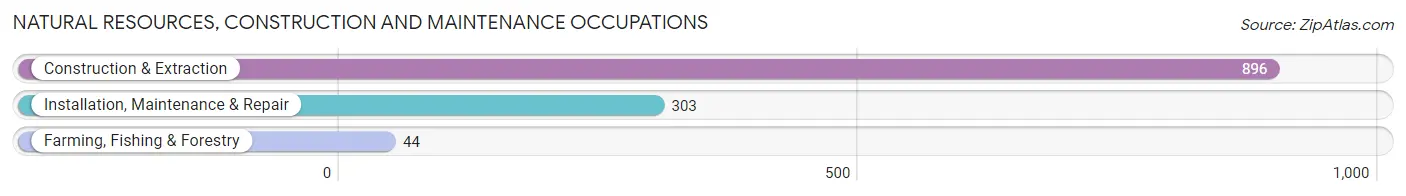
Natural Resources, Construction and Maintenance Occupations
The most common Natural Resources, Construction and Maintenance occupations in Mountlake Terrace are Construction & Extraction (896 | 7.7%), Installation, Maintenance & Repair (303 | 2.6%), and Farming, Fishing & Forestry (44 | 0.4%).
Natural Resources, Construction and Maintenance Occupations by Sex
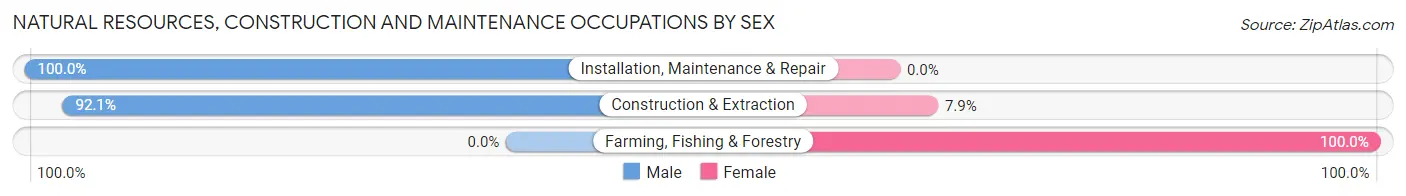
| Occupation | Male | Female |
| Farming, Fishing & Forestry | 0 (0.0%) | 44 (100.0%) |
| Construction & Extraction | 825 (92.1%) | 71 (7.9%) |
| Installation, Maintenance & Repair | 303 (100.0%) | 0 (0.0%) |
| Total (Category) | 1,128 (90.7%) | 115 (9.2%) |
| Total (Overall) | 5,777 (49.5%) | 5,893 (50.5%) |
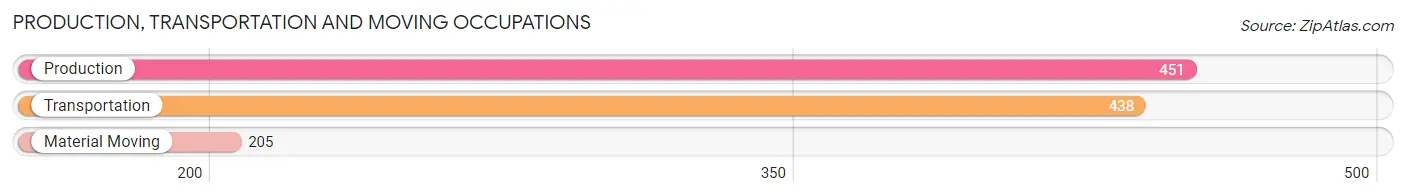
Production, Transportation and Moving Occupations
The most common Production, Transportation and Moving occupations in Mountlake Terrace are Production (451 | 3.9%), Transportation (438 | 3.7%), and Material Moving (205 | 1.8%).
Production, Transportation and Moving Occupations by Sex
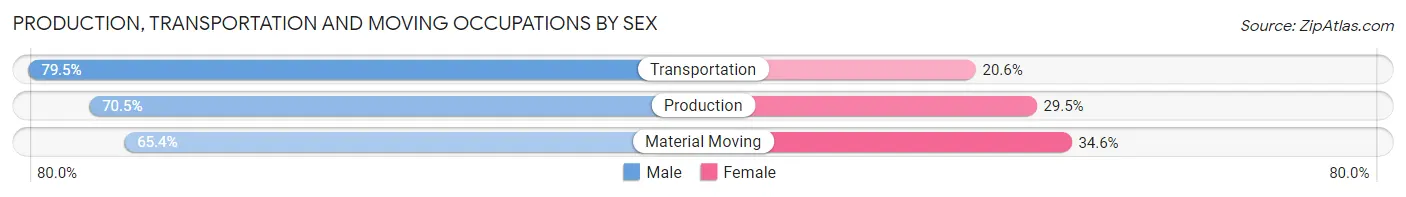
| Occupation | Male | Female |
| Production | 318 (70.5%) | 133 (29.5%) |
| Transportation | 348 (79.4%) | 90 (20.5%) |
| Material Moving | 134 (65.4%) | 71 (34.6%) |
| Total (Category) | 800 (73.1%) | 294 (26.9%) |
| Total (Overall) | 5,777 (49.5%) | 5,893 (50.5%) |
Employment Industries by Sex in Mountlake Terrace
Employment Industries in Mountlake Terrace
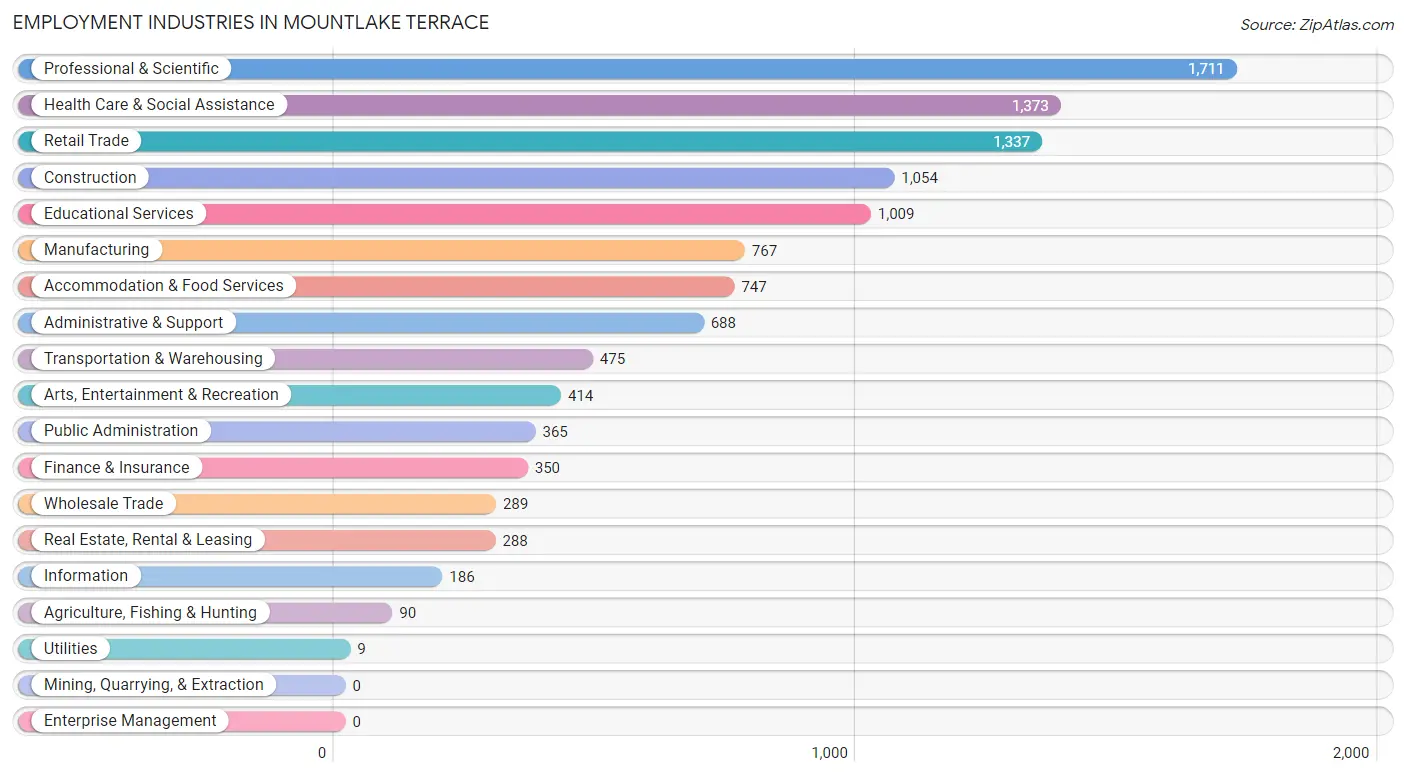
The major employment industries in Mountlake Terrace include Professional & Scientific (1,711 | 14.7%), Health Care & Social Assistance (1,373 | 11.8%), Retail Trade (1,337 | 11.5%), Construction (1,054 | 9.0%), and Educational Services (1,009 | 8.6%).
Employment Industries by Sex in Mountlake Terrace
The Mountlake Terrace industries that see more men than women are Construction (89.7%), Real Estate, Rental & Leasing (88.9%), and Transportation & Warehousing (67.2%), whereas the industries that tend to have a higher number of women are Utilities (100.0%), Health Care & Social Assistance (82.3%), and Finance & Insurance (77.7%).
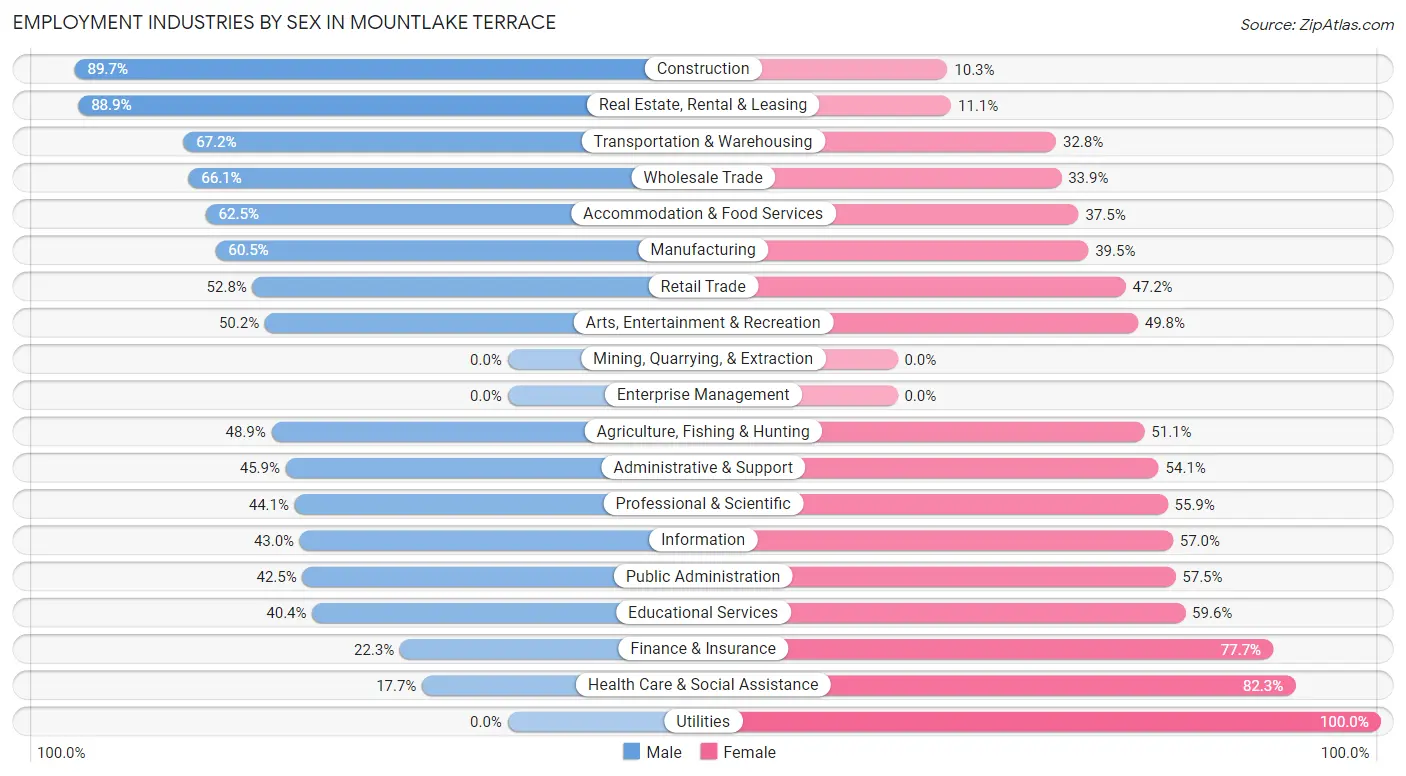
| Industry | Male | Female |
| Agriculture, Fishing & Hunting | 44 (48.9%) | 46 (51.1%) |
| Mining, Quarrying, & Extraction | 0 (0.0%) | 0 (0.0%) |
| Construction | 945 (89.7%) | 109 (10.3%) |
| Manufacturing | 464 (60.5%) | 303 (39.5%) |
| Wholesale Trade | 191 (66.1%) | 98 (33.9%) |
| Retail Trade | 706 (52.8%) | 631 (47.2%) |
| Transportation & Warehousing | 319 (67.2%) | 156 (32.8%) |
| Utilities | 0 (0.0%) | 9 (100.0%) |
| Information | 80 (43.0%) | 106 (57.0%) |
| Finance & Insurance | 78 (22.3%) | 272 (77.7%) |
| Real Estate, Rental & Leasing | 256 (88.9%) | 32 (11.1%) |
| Professional & Scientific | 754 (44.1%) | 957 (55.9%) |
| Enterprise Management | 0 (0.0%) | 0 (0.0%) |
| Administrative & Support | 316 (45.9%) | 372 (54.1%) |
| Educational Services | 408 (40.4%) | 601 (59.6%) |
| Health Care & Social Assistance | 243 (17.7%) | 1,130 (82.3%) |
| Arts, Entertainment & Recreation | 208 (50.2%) | 206 (49.8%) |
| Accommodation & Food Services | 467 (62.5%) | 280 (37.5%) |
| Public Administration | 155 (42.5%) | 210 (57.5%) |
| Total | 5,777 (49.5%) | 5,893 (50.5%) |
Education in Mountlake Terrace
School Enrollment in Mountlake Terrace
The most common levels of schooling among the 4,640 students in Mountlake Terrace are college / undergraduate (1,085 | 23.4%), middle school (1,014 | 21.8%), and elementary school (967 | 20.8%).
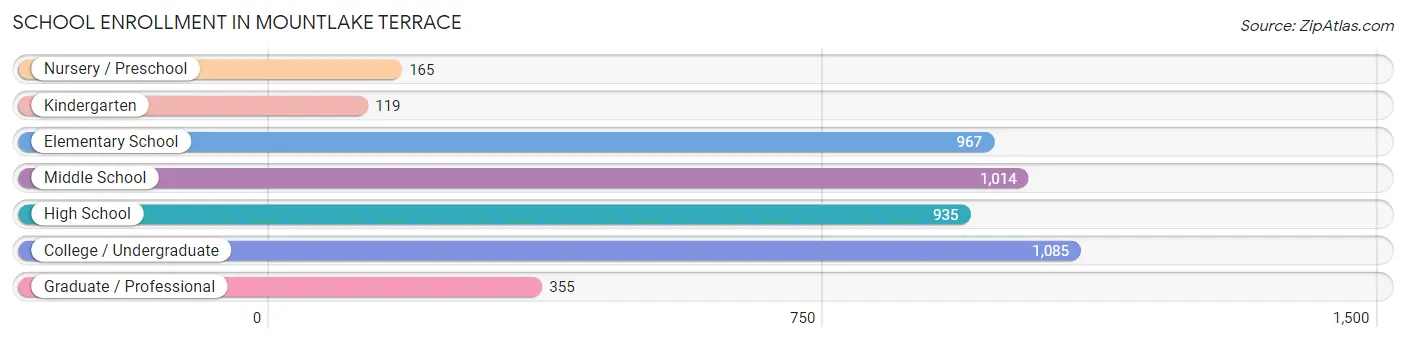
| School Level | # Students | % Students |
| Nursery / Preschool | 165 | 3.6% |
| Kindergarten | 119 | 2.6% |
| Elementary School | 967 | 20.8% |
| Middle School | 1,014 | 21.8% |
| High School | 935 | 20.2% |
| College / Undergraduate | 1,085 | 23.4% |
| Graduate / Professional | 355 | 7.6% |
| Total | 4,640 | 100.0% |
School Enrollment by Age by Funding Source in Mountlake Terrace
Out of a total of 4,640 students who are enrolled in schools in Mountlake Terrace, 524 (11.3%) attend a private institution, while the remaining 4,116 (88.7%) are enrolled in public schools. The age group of 3 to 4 year olds has the highest likelihood of being enrolled in private schools, with 95 (81.2% in the age bracket) enrolled. Conversely, the age group of 20 to 24 year olds has the lowest likelihood of being enrolled in a private school, with 400 (95.0% in the age bracket) attending a public institution.
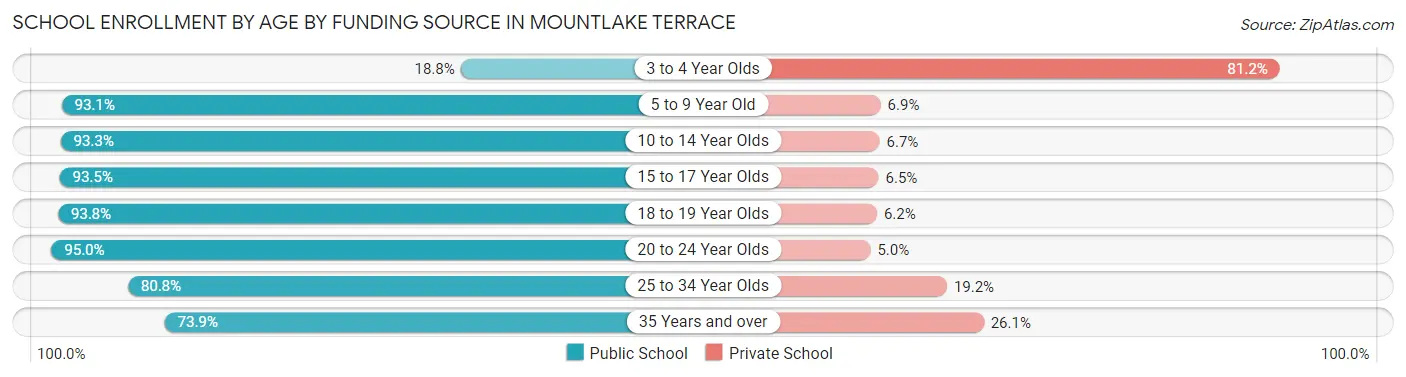
| Age Bracket | Public School | Private School |
| 3 to 4 Year Olds | 22 (18.8%) | 95 (81.2%) |
| 5 to 9 Year Old | 919 (93.1%) | 68 (6.9%) |
| 10 to 14 Year Olds | 1,214 (93.3%) | 87 (6.7%) |
| 15 to 17 Year Olds | 632 (93.5%) | 44 (6.5%) |
| 18 to 19 Year Olds | 257 (93.8%) | 17 (6.2%) |
| 20 to 24 Year Olds | 400 (95.0%) | 21 (5.0%) |
| 25 to 34 Year Olds | 382 (80.8%) | 91 (19.2%) |
| 35 Years and over | 289 (73.9%) | 102 (26.1%) |
| Total | 4,116 (88.7%) | 524 (11.3%) |
Educational Attainment by Field of Study in Mountlake Terrace
Business (1,231 | 16.9%), social sciences (739 | 10.2%), engineering (625 | 8.6%), arts & humanities (618 | 8.5%), and literature & languages (490 | 6.7%) are the most common fields of study among 7,280 individuals in Mountlake Terrace who have obtained a bachelor's degree or higher.
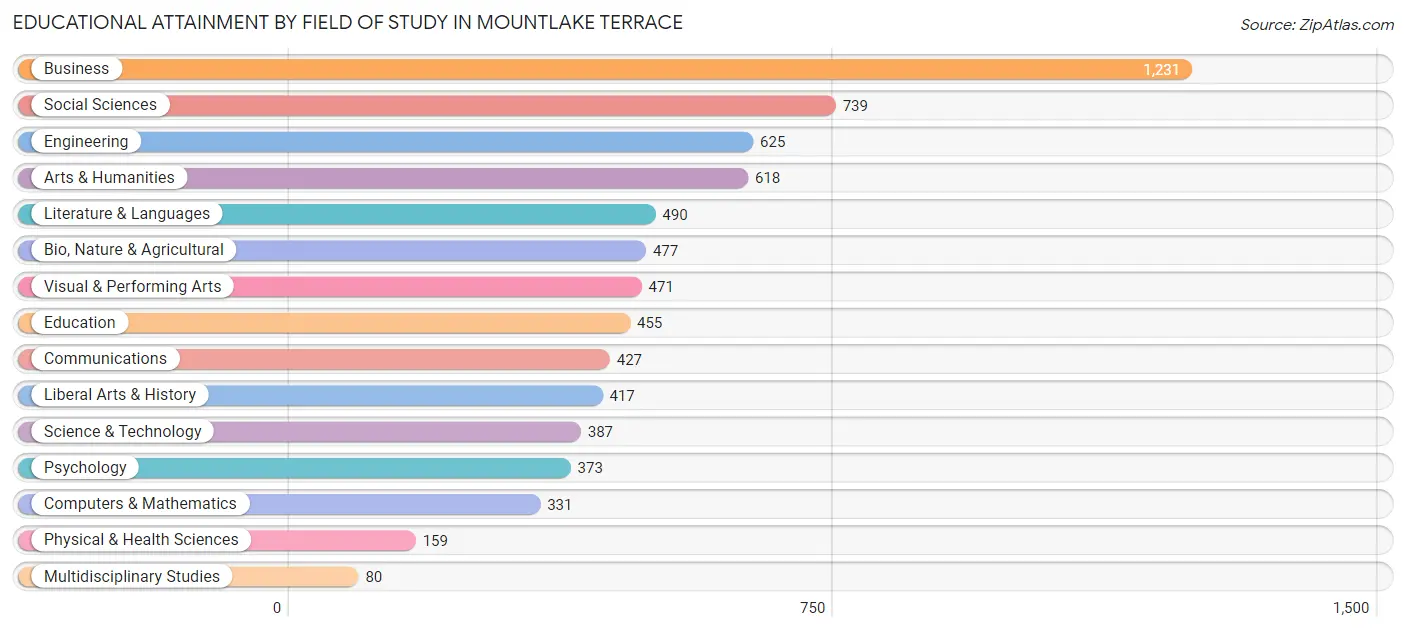
| Field of Study | # Graduates | % Graduates |
| Computers & Mathematics | 331 | 4.5% |
| Bio, Nature & Agricultural | 477 | 6.6% |
| Physical & Health Sciences | 159 | 2.2% |
| Psychology | 373 | 5.1% |
| Social Sciences | 739 | 10.2% |
| Engineering | 625 | 8.6% |
| Multidisciplinary Studies | 80 | 1.1% |
| Science & Technology | 387 | 5.3% |
| Business | 1,231 | 16.9% |
| Education | 455 | 6.2% |
| Literature & Languages | 490 | 6.7% |
| Liberal Arts & History | 417 | 5.7% |
| Visual & Performing Arts | 471 | 6.5% |
| Communications | 427 | 5.9% |
| Arts & Humanities | 618 | 8.5% |
| Total | 7,280 | 100.0% |
Transportation & Commute in Mountlake Terrace
Vehicle Availability by Sex in Mountlake Terrace
The most prevalent vehicle ownership categories in Mountlake Terrace are males with 2 vehicles (2,714, accounting for 47.5%) and females with 2 vehicles (2,418, making up 47.0%).
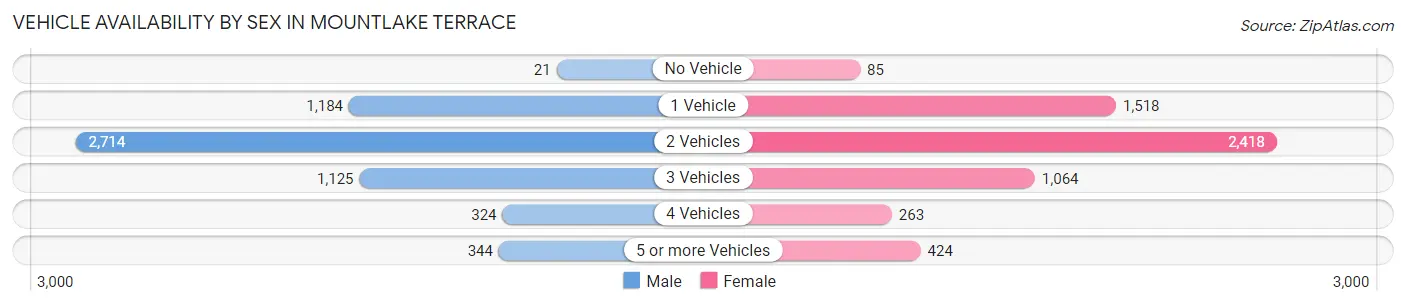
| Vehicles Available | Male | Female |
| No Vehicle | 21 (0.4%) | 85 (1.5%) |
| 1 Vehicle | 1,184 (20.7%) | 1,518 (26.3%) |
| 2 Vehicles | 2,714 (47.5%) | 2,418 (41.9%) |
| 3 Vehicles | 1,125 (19.7%) | 1,064 (18.4%) |
| 4 Vehicles | 324 (5.7%) | 263 (4.6%) |
| 5 or more Vehicles | 344 (6.0%) | 424 (7.3%) |
| Total | 5,712 (100.0%) | 5,772 (100.0%) |
Commute Time in Mountlake Terrace
The most frequently occuring commute durations in Mountlake Terrace are 20 to 24 minutes (1,683 commuters, 18.1%), 30 to 34 minutes (1,410 commuters, 15.1%), and 60 to 89 minutes (1,105 commuters, 11.9%).
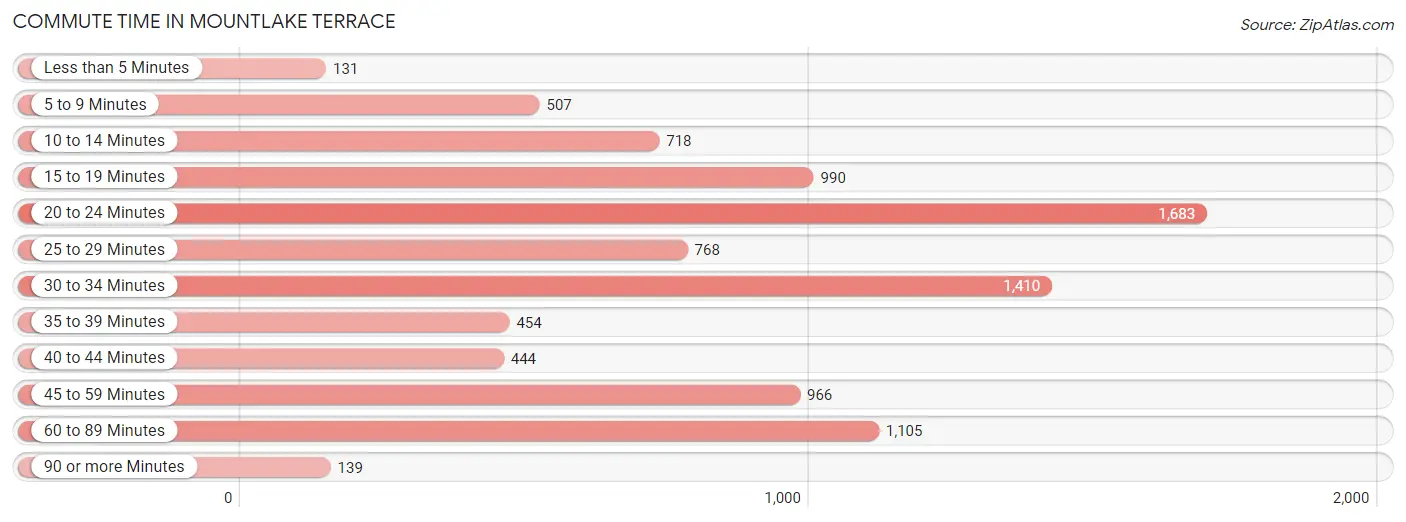
| Commute Time | # Commuters | % Commuters |
| Less than 5 Minutes | 131 | 1.4% |
| 5 to 9 Minutes | 507 | 5.4% |
| 10 to 14 Minutes | 718 | 7.7% |
| 15 to 19 Minutes | 990 | 10.6% |
| 20 to 24 Minutes | 1,683 | 18.1% |
| 25 to 29 Minutes | 768 | 8.2% |
| 30 to 34 Minutes | 1,410 | 15.1% |
| 35 to 39 Minutes | 454 | 4.9% |
| 40 to 44 Minutes | 444 | 4.8% |
| 45 to 59 Minutes | 966 | 10.4% |
| 60 to 89 Minutes | 1,105 | 11.9% |
| 90 or more Minutes | 139 | 1.5% |
Commute Time by Sex in Mountlake Terrace
The most common commute times in Mountlake Terrace are 30 to 34 minutes (1,009 commuters, 20.5%) for males and 20 to 24 minutes (750 commuters, 17.0%) for females.
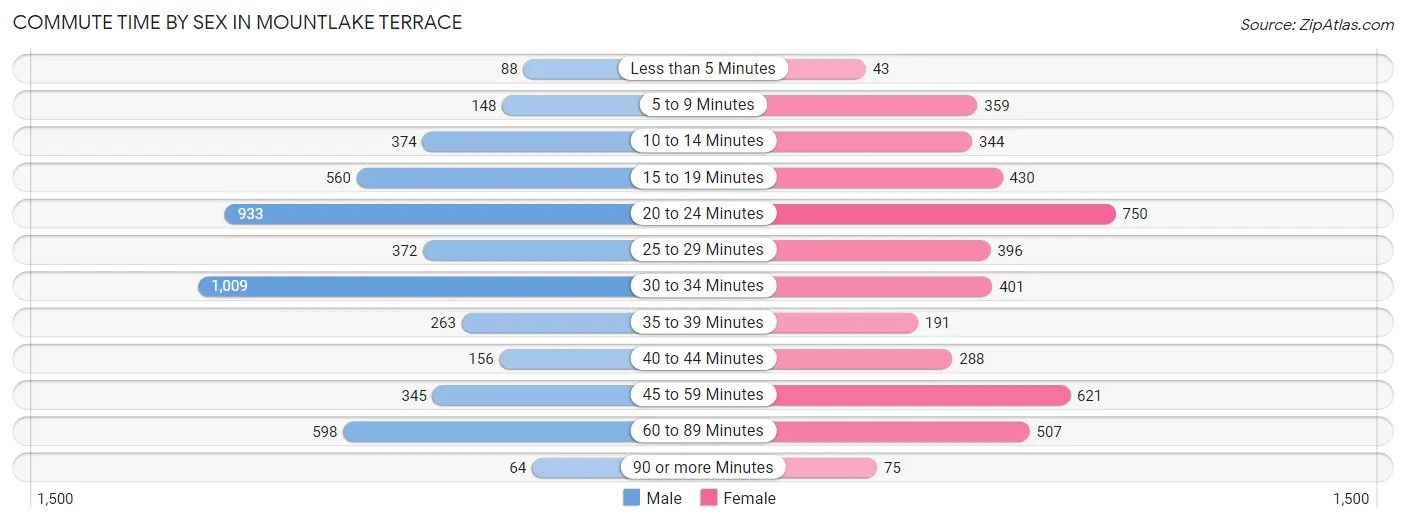
| Commute Time | Male | Female |
| Less than 5 Minutes | 88 (1.8%) | 43 (1.0%) |
| 5 to 9 Minutes | 148 (3.0%) | 359 (8.2%) |
| 10 to 14 Minutes | 374 (7.6%) | 344 (7.8%) |
| 15 to 19 Minutes | 560 (11.4%) | 430 (9.8%) |
| 20 to 24 Minutes | 933 (19.0%) | 750 (17.0%) |
| 25 to 29 Minutes | 372 (7.6%) | 396 (9.0%) |
| 30 to 34 Minutes | 1,009 (20.5%) | 401 (9.1%) |
| 35 to 39 Minutes | 263 (5.4%) | 191 (4.3%) |
| 40 to 44 Minutes | 156 (3.2%) | 288 (6.5%) |
| 45 to 59 Minutes | 345 (7.0%) | 621 (14.1%) |
| 60 to 89 Minutes | 598 (12.2%) | 507 (11.5%) |
| 90 or more Minutes | 64 (1.3%) | 75 (1.7%) |
Time of Departure to Work by Sex in Mountlake Terrace
The most frequent times of departure to work in Mountlake Terrace are 7:00 AM to 7:29 AM (621, 12.7%) for males and 8:00 AM to 8:29 AM (677, 15.4%) for females.
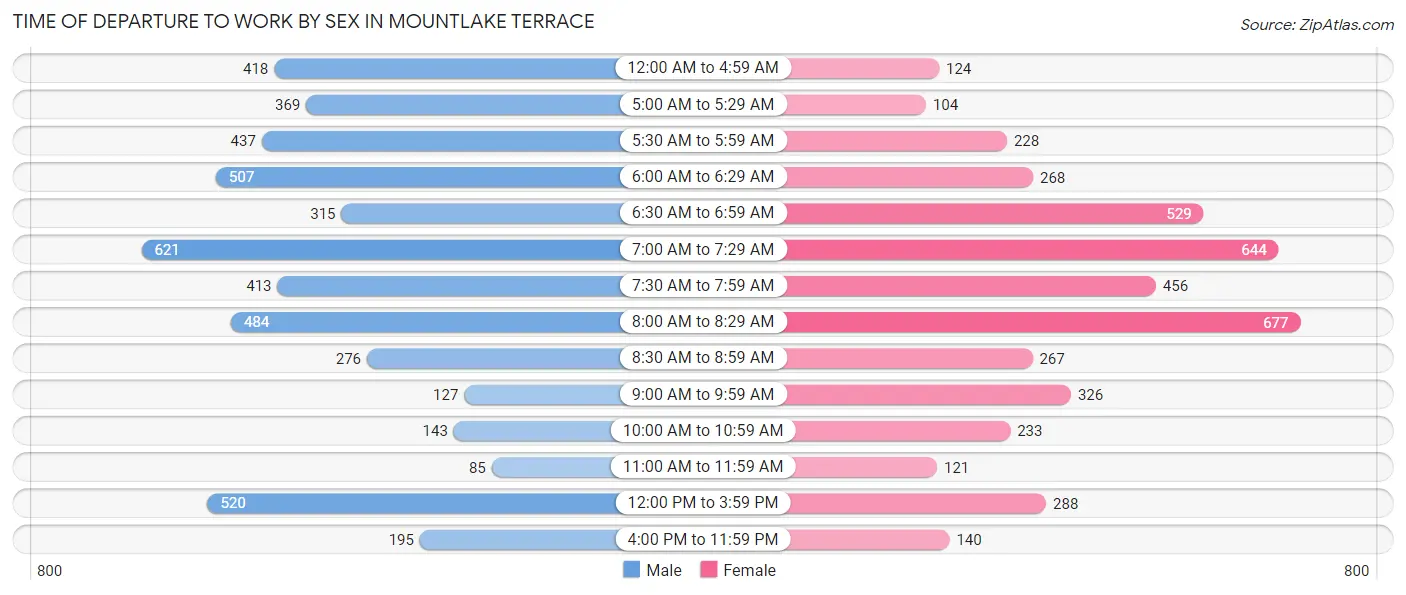
| Time of Departure | Male | Female |
| 12:00 AM to 4:59 AM | 418 (8.5%) | 124 (2.8%) |
| 5:00 AM to 5:29 AM | 369 (7.5%) | 104 (2.4%) |
| 5:30 AM to 5:59 AM | 437 (8.9%) | 228 (5.2%) |
| 6:00 AM to 6:29 AM | 507 (10.3%) | 268 (6.1%) |
| 6:30 AM to 6:59 AM | 315 (6.4%) | 529 (12.0%) |
| 7:00 AM to 7:29 AM | 621 (12.7%) | 644 (14.6%) |
| 7:30 AM to 7:59 AM | 413 (8.4%) | 456 (10.3%) |
| 8:00 AM to 8:29 AM | 484 (9.9%) | 677 (15.4%) |
| 8:30 AM to 8:59 AM | 276 (5.6%) | 267 (6.1%) |
| 9:00 AM to 9:59 AM | 127 (2.6%) | 326 (7.4%) |
| 10:00 AM to 10:59 AM | 143 (2.9%) | 233 (5.3%) |
| 11:00 AM to 11:59 AM | 85 (1.7%) | 121 (2.8%) |
| 12:00 PM to 3:59 PM | 520 (10.6%) | 288 (6.5%) |
| 4:00 PM to 11:59 PM | 195 (4.0%) | 140 (3.2%) |
| Total | 4,910 (100.0%) | 4,405 (100.0%) |
Housing Occupancy in Mountlake Terrace
Occupancy by Ownership in Mountlake Terrace
Of the total 8,937 dwellings in Mountlake Terrace, owner-occupied units account for 5,202 (58.2%), while renter-occupied units make up 3,735 (41.8%).
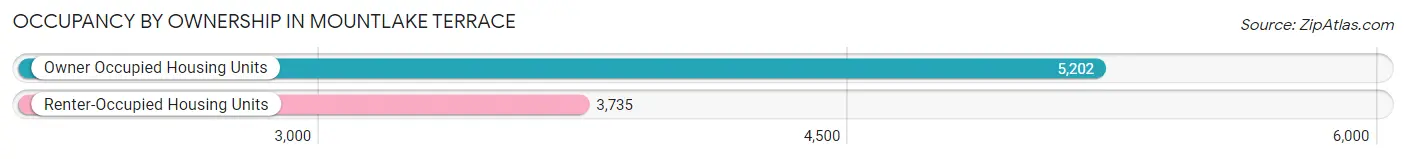
| Occupancy | # Housing Units | % Housing Units |
| Owner Occupied Housing Units | 5,202 | 58.2% |
| Renter-Occupied Housing Units | 3,735 | 41.8% |
| Total Occupied Housing Units | 8,937 | 100.0% |
Occupancy by Household Size in Mountlake Terrace
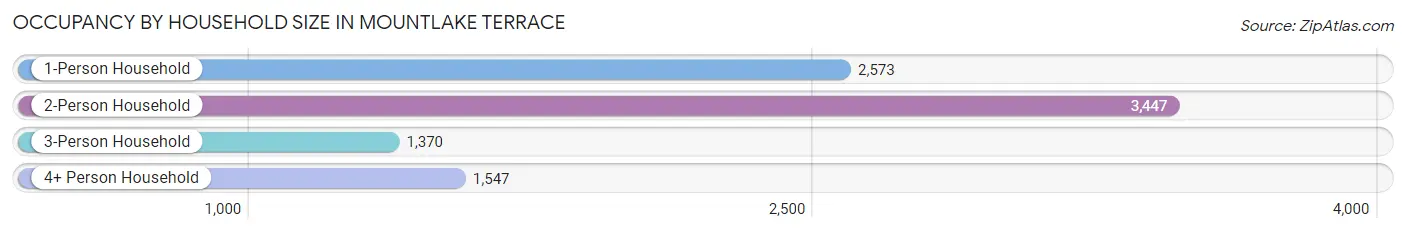
| Household Size | # Housing Units | % Housing Units |
| 1-Person Household | 2,573 | 28.8% |
| 2-Person Household | 3,447 | 38.6% |
| 3-Person Household | 1,370 | 15.3% |
| 4+ Person Household | 1,547 | 17.3% |
| Total Housing Units | 8,937 | 100.0% |
Occupancy by Ownership by Household Size in Mountlake Terrace
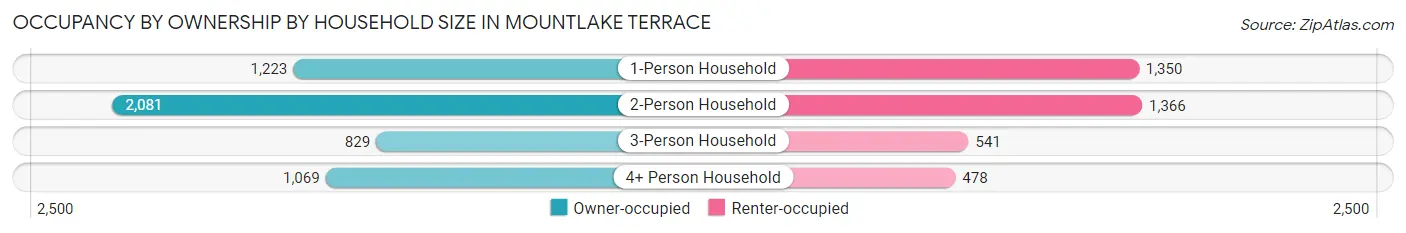
| Household Size | Owner-occupied | Renter-occupied |
| 1-Person Household | 1,223 (47.5%) | 1,350 (52.5%) |
| 2-Person Household | 2,081 (60.4%) | 1,366 (39.6%) |
| 3-Person Household | 829 (60.5%) | 541 (39.5%) |
| 4+ Person Household | 1,069 (69.1%) | 478 (30.9%) |
| Total Housing Units | 5,202 (58.2%) | 3,735 (41.8%) |
Occupancy by Educational Attainment in Mountlake Terrace
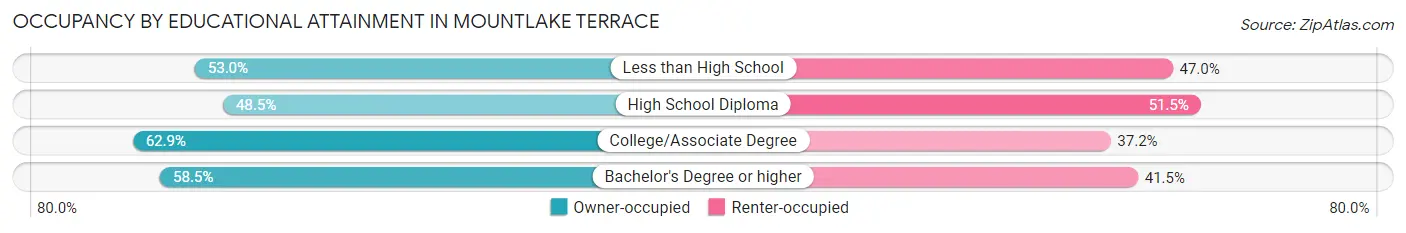
| Household Size | Owner-occupied | Renter-occupied |
| Less than High School | 284 (53.0%) | 252 (47.0%) |
| High School Diploma | 626 (48.5%) | 664 (51.5%) |
| College/Associate Degree | 1,905 (62.8%) | 1,126 (37.1%) |
| Bachelor's Degree or higher | 2,387 (58.5%) | 1,693 (41.5%) |
Occupancy by Age of Householder in Mountlake Terrace
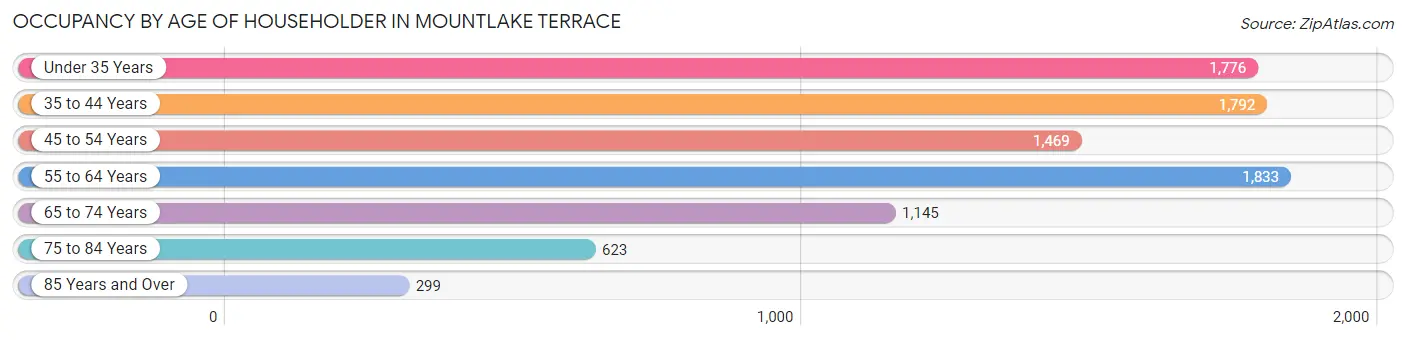
| Age Bracket | # Households | % Households |
| Under 35 Years | 1,776 | 19.9% |
| 35 to 44 Years | 1,792 | 20.1% |
| 45 to 54 Years | 1,469 | 16.4% |
| 55 to 64 Years | 1,833 | 20.5% |
| 65 to 74 Years | 1,145 | 12.8% |
| 75 to 84 Years | 623 | 7.0% |
| 85 Years and Over | 299 | 3.4% |
| Total | 8,937 | 100.0% |
Housing Finances in Mountlake Terrace
Median Income by Occupancy in Mountlake Terrace
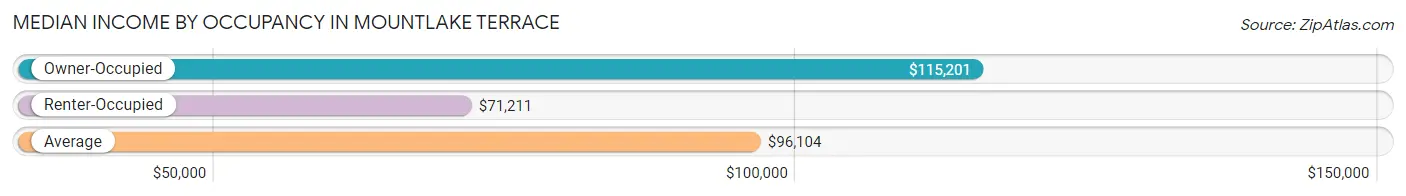
| Occupancy Type | # Households | Median Income |
| Owner-Occupied | 5,202 (58.2%) | $115,201 |
| Renter-Occupied | 3,735 (41.8%) | $71,211 |
| Average | 8,937 (100.0%) | $96,104 |
Occupancy by Householder Income Bracket in Mountlake Terrace
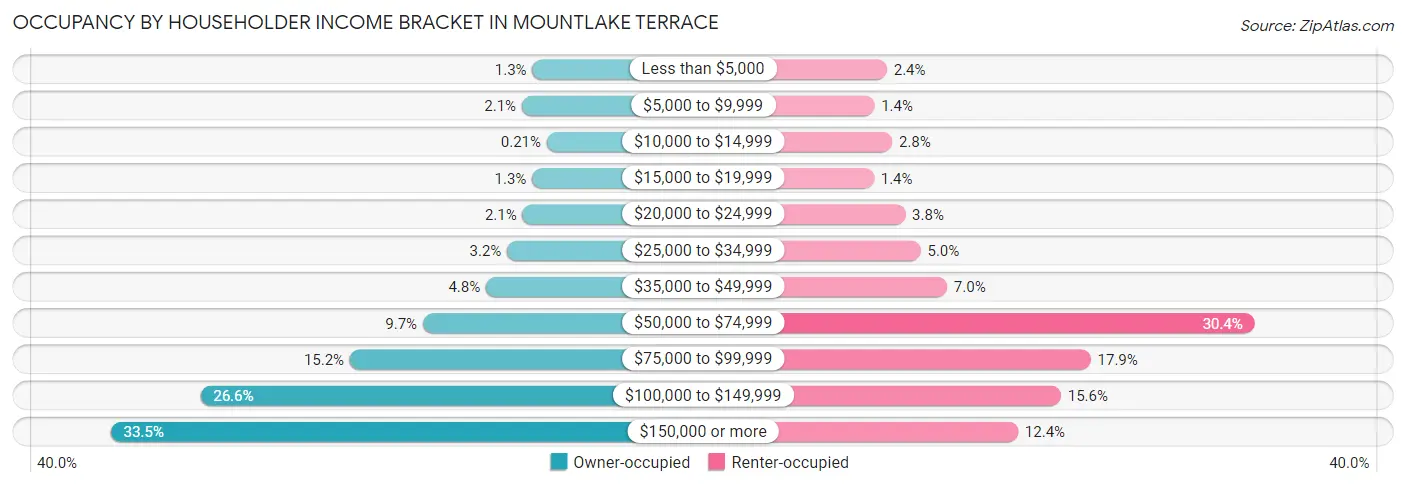
| Income Bracket | Owner-occupied | Renter-occupied |
| Less than $5,000 | 68 (1.3%) | 89 (2.4%) |
| $5,000 to $9,999 | 110 (2.1%) | 53 (1.4%) |
| $10,000 to $14,999 | 11 (0.2%) | 104 (2.8%) |
| $15,000 to $19,999 | 69 (1.3%) | 52 (1.4%) |
| $20,000 to $24,999 | 107 (2.1%) | 141 (3.8%) |
| $25,000 to $34,999 | 168 (3.2%) | 185 (5.0%) |
| $35,000 to $49,999 | 252 (4.8%) | 260 (7.0%) |
| $50,000 to $74,999 | 502 (9.7%) | 1,136 (30.4%) |
| $75,000 to $99,999 | 791 (15.2%) | 669 (17.9%) |
| $100,000 to $149,999 | 1,384 (26.6%) | 584 (15.6%) |
| $150,000 or more | 1,740 (33.5%) | 462 (12.4%) |
| Total | 5,202 (100.0%) | 3,735 (100.0%) |
Monthly Housing Cost Tiers in Mountlake Terrace
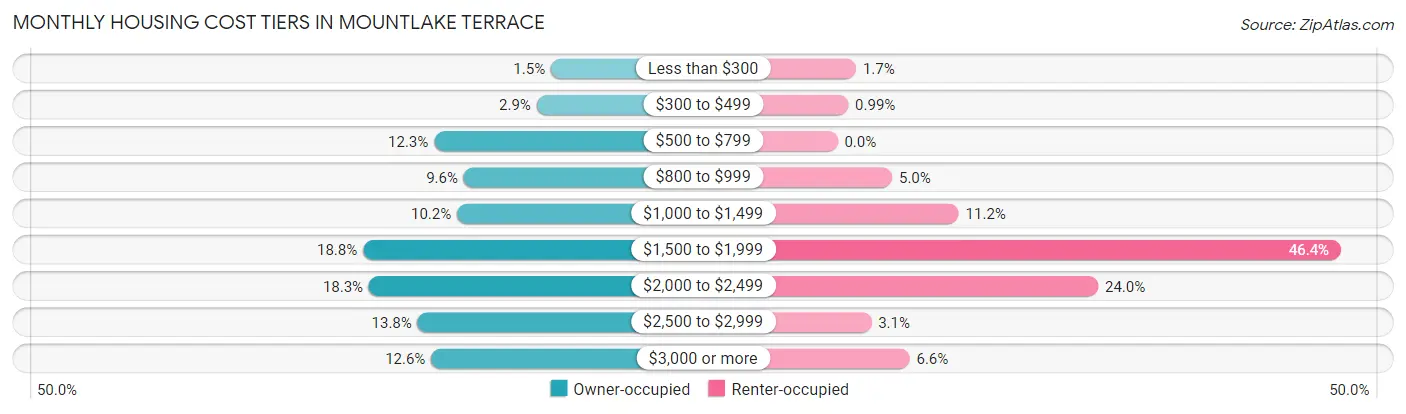
| Monthly Cost | Owner-occupied | Renter-occupied |
| Less than $300 | 80 (1.5%) | 64 (1.7%) |
| $300 to $499 | 149 (2.9%) | 37 (1.0%) |
| $500 to $799 | 640 (12.3%) | 0 (0.0%) |
| $800 to $999 | 498 (9.6%) | 188 (5.0%) |
| $1,000 to $1,499 | 530 (10.2%) | 417 (11.2%) |
| $1,500 to $1,999 | 980 (18.8%) | 1,731 (46.4%) |
| $2,000 to $2,499 | 952 (18.3%) | 896 (24.0%) |
| $2,500 to $2,999 | 719 (13.8%) | 116 (3.1%) |
| $3,000 or more | 654 (12.6%) | 248 (6.6%) |
| Total | 5,202 (100.0%) | 3,735 (100.0%) |
Physical Housing Characteristics in Mountlake Terrace
Housing Structures in Mountlake Terrace
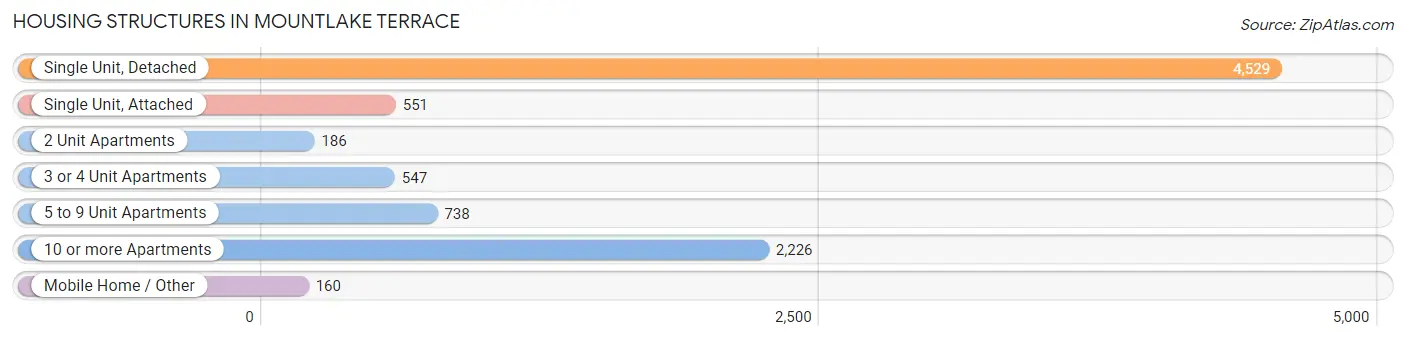
| Structure Type | # Housing Units | % Housing Units |
| Single Unit, Detached | 4,529 | 50.7% |
| Single Unit, Attached | 551 | 6.2% |
| 2 Unit Apartments | 186 | 2.1% |
| 3 or 4 Unit Apartments | 547 | 6.1% |
| 5 to 9 Unit Apartments | 738 | 8.3% |
| 10 or more Apartments | 2,226 | 24.9% |
| Mobile Home / Other | 160 | 1.8% |
| Total | 8,937 | 100.0% |
Housing Structures by Occupancy in Mountlake Terrace
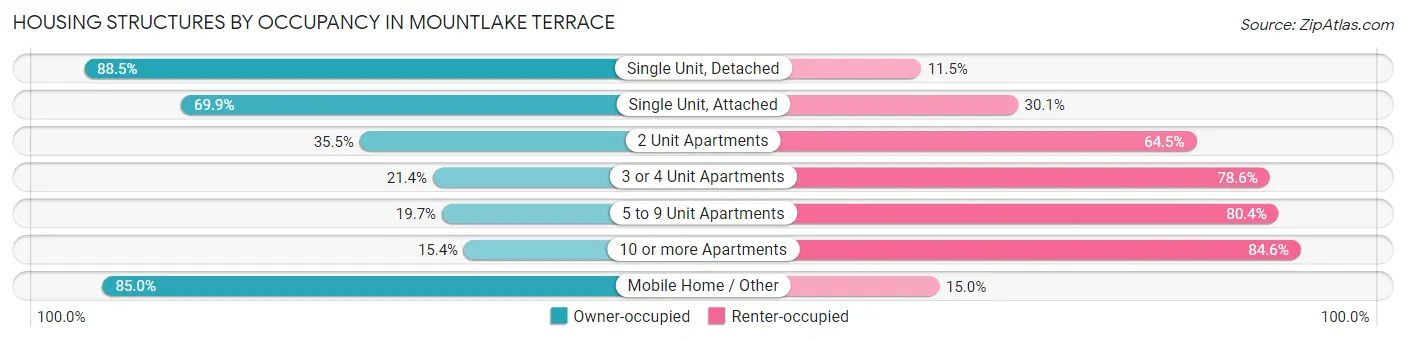
| Structure Type | Owner-occupied | Renter-occupied |
| Single Unit, Detached | 4,010 (88.5%) | 519 (11.5%) |
| Single Unit, Attached | 385 (69.9%) | 166 (30.1%) |
| 2 Unit Apartments | 66 (35.5%) | 120 (64.5%) |
| 3 or 4 Unit Apartments | 117 (21.4%) | 430 (78.6%) |
| 5 to 9 Unit Apartments | 145 (19.7%) | 593 (80.3%) |
| 10 or more Apartments | 343 (15.4%) | 1,883 (84.6%) |
| Mobile Home / Other | 136 (85.0%) | 24 (15.0%) |
| Total | 5,202 (58.2%) | 3,735 (41.8%) |
Housing Structures by Number of Rooms in Mountlake Terrace
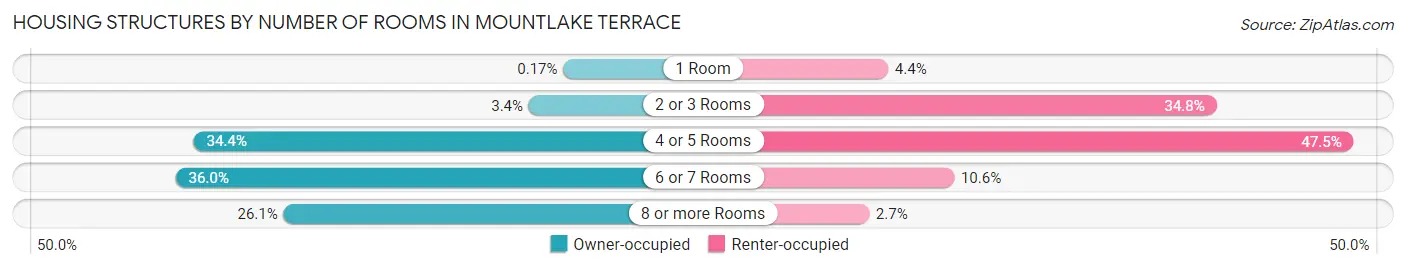
| Number of Rooms | Owner-occupied | Renter-occupied |
| 1 Room | 9 (0.2%) | 166 (4.4%) |
| 2 or 3 Rooms | 175 (3.4%) | 1,301 (34.8%) |
| 4 or 5 Rooms | 1,788 (34.4%) | 1,774 (47.5%) |
| 6 or 7 Rooms | 1,875 (36.0%) | 394 (10.5%) |
| 8 or more Rooms | 1,355 (26.1%) | 100 (2.7%) |
| Total | 5,202 (100.0%) | 3,735 (100.0%) |
Housing Structure by Heating Type in Mountlake Terrace
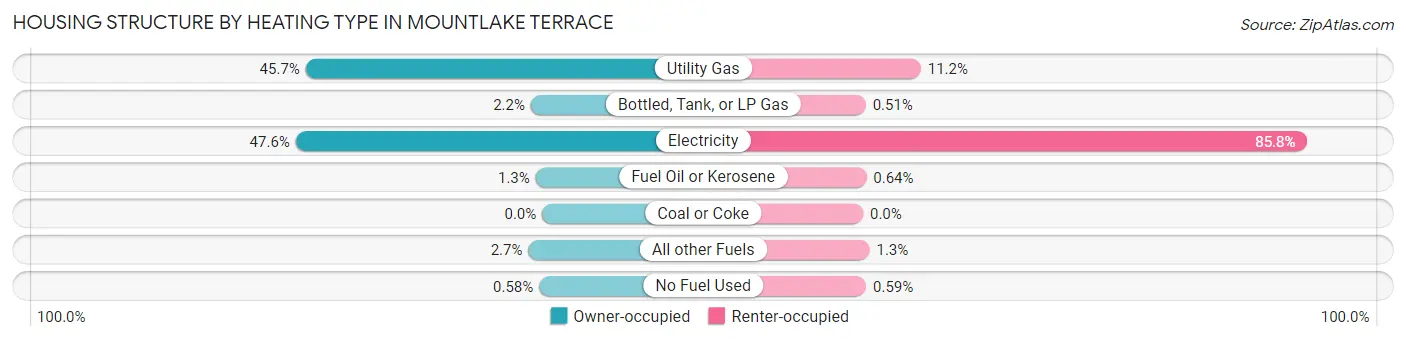
| Heating Type | Owner-occupied | Renter-occupied |
| Utility Gas | 2,377 (45.7%) | 417 (11.2%) |
| Bottled, Tank, or LP Gas | 114 (2.2%) | 19 (0.5%) |
| Electricity | 2,477 (47.6%) | 3,206 (85.8%) |
| Fuel Oil or Kerosene | 65 (1.3%) | 24 (0.6%) |
| Coal or Coke | 0 (0.0%) | 0 (0.0%) |
| All other Fuels | 139 (2.7%) | 47 (1.3%) |
| No Fuel Used | 30 (0.6%) | 22 (0.6%) |
| Total | 5,202 (100.0%) | 3,735 (100.0%) |
Household Vehicle Usage in Mountlake Terrace
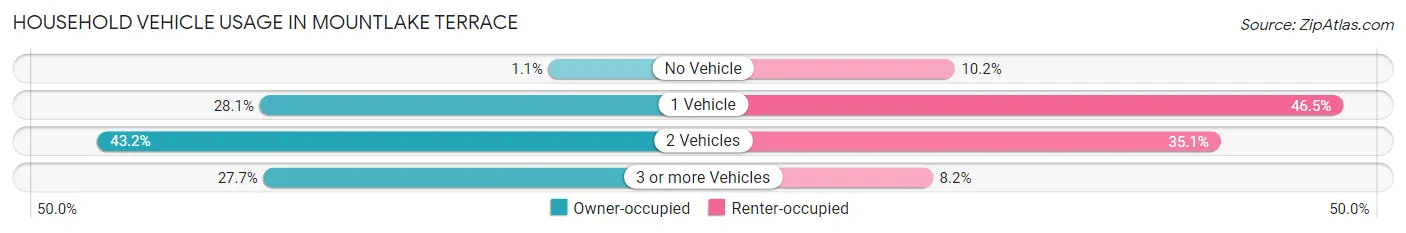
| Vehicles per Household | Owner-occupied | Renter-occupied |
| No Vehicle | 55 (1.1%) | 382 (10.2%) |
| 1 Vehicle | 1,459 (28.1%) | 1,737 (46.5%) |
| 2 Vehicles | 2,248 (43.2%) | 1,310 (35.1%) |
| 3 or more Vehicles | 1,440 (27.7%) | 306 (8.2%) |
| Total | 5,202 (100.0%) | 3,735 (100.0%) |
Real Estate & Mortgages in Mountlake Terrace
Real Estate and Mortgage Overview in Mountlake Terrace
| Characteristic | Without Mortgage | With Mortgage |
| Housing Units | 1,467 | 3,735 |
| Median Property Value | $530,100 | $572,300 |
| Median Household Income | $78,565 | $1,485 |
| Monthly Housing Costs | $758 | $654 |
| Real Estate Taxes | $3,893 | $88 |
Property Value by Mortgage Status in Mountlake Terrace
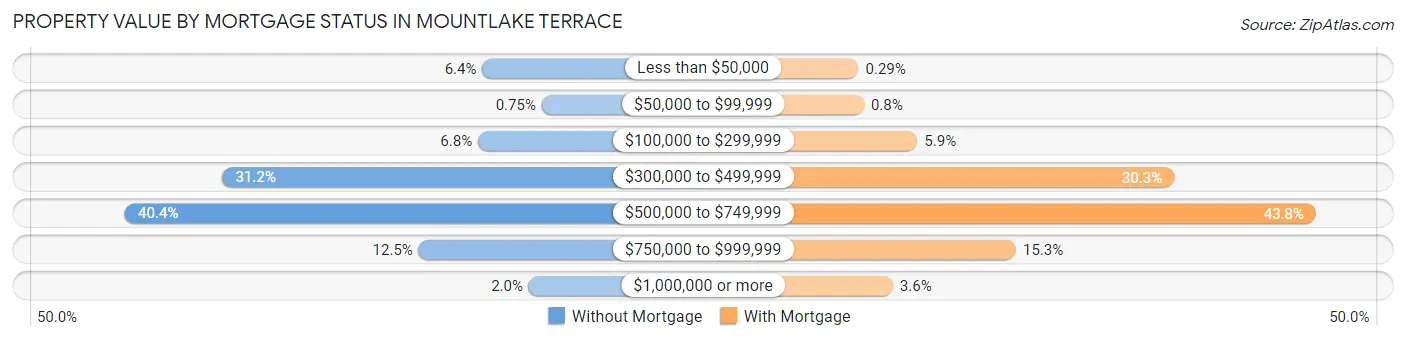
| Property Value | Without Mortgage | With Mortgage |
| Less than $50,000 | 94 (6.4%) | 11 (0.3%) |
| $50,000 to $99,999 | 11 (0.7%) | 30 (0.8%) |
| $100,000 to $299,999 | 100 (6.8%) | 220 (5.9%) |
| $300,000 to $499,999 | 457 (31.1%) | 1,133 (30.3%) |
| $500,000 to $749,999 | 593 (40.4%) | 1,637 (43.8%) |
| $750,000 to $999,999 | 183 (12.5%) | 571 (15.3%) |
| $1,000,000 or more | 29 (2.0%) | 133 (3.6%) |
| Total | 1,467 (100.0%) | 3,735 (100.0%) |
Household Income by Mortgage Status in Mountlake Terrace
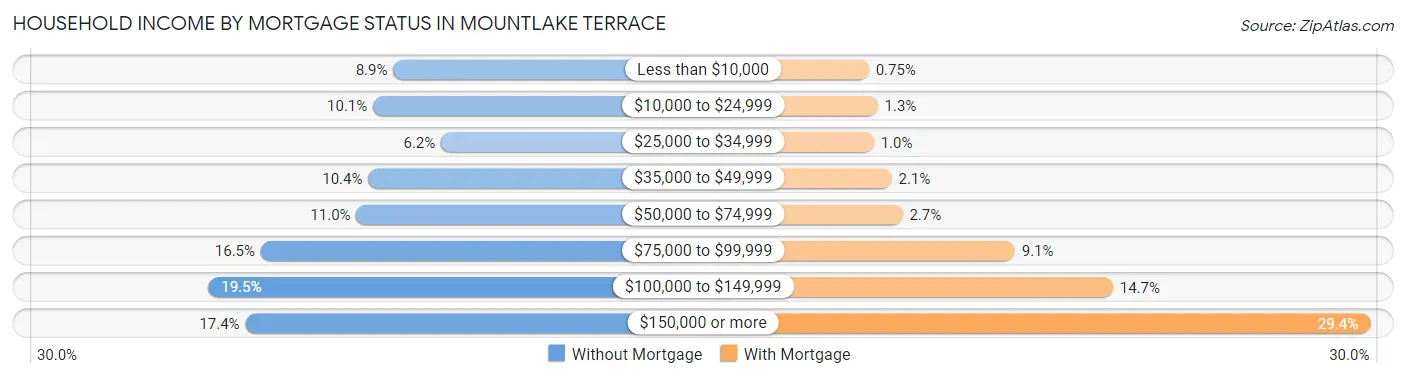
| Household Income | Without Mortgage | With Mortgage |
| Less than $10,000 | 131 (8.9%) | 28 (0.7%) |
| $10,000 to $24,999 | 148 (10.1%) | 47 (1.3%) |
| $25,000 to $34,999 | 91 (6.2%) | 39 (1.0%) |
| $35,000 to $49,999 | 152 (10.4%) | 77 (2.1%) |
| $50,000 to $74,999 | 162 (11.0%) | 100 (2.7%) |
| $75,000 to $99,999 | 242 (16.5%) | 340 (9.1%) |
| $100,000 to $149,999 | 286 (19.5%) | 549 (14.7%) |
| $150,000 or more | 255 (17.4%) | 1,098 (29.4%) |
| Total | 1,467 (100.0%) | 3,735 (100.0%) |
Property Value to Household Income Ratio in Mountlake Terrace
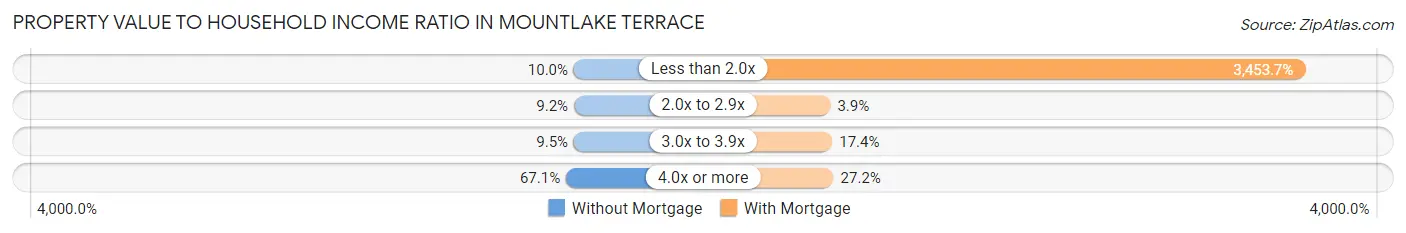
| Value-to-Income Ratio | Without Mortgage | With Mortgage |
| Less than 2.0x | 146 (10.0%) | 128,996 (3,453.7%) |
| 2.0x to 2.9x | 135 (9.2%) | 147 (3.9%) |
| 3.0x to 3.9x | 139 (9.5%) | 651 (17.4%) |
| 4.0x or more | 985 (67.1%) | 1,015 (27.2%) |
| Total | 1,467 (100.0%) | 3,735 (100.0%) |
Real Estate Taxes by Mortgage Status in Mountlake Terrace
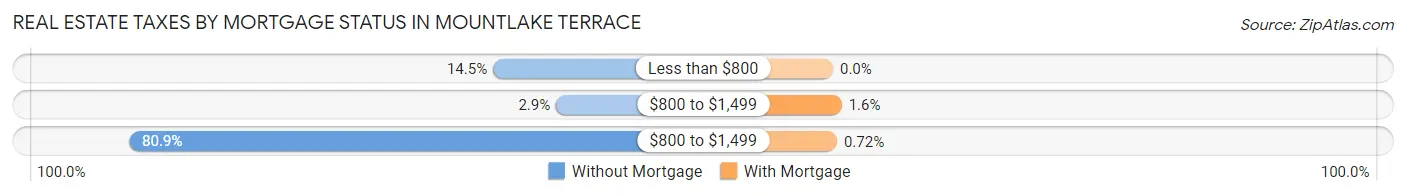
| Property Taxes | Without Mortgage | With Mortgage |
| Less than $800 | 212 (14.4%) | 0 (0.0%) |
| $800 to $1,499 | 43 (2.9%) | 59 (1.6%) |
| $800 to $1,499 | 1,187 (80.9%) | 27 (0.7%) |
| Total | 1,467 (100.0%) | 3,735 (100.0%) |
Health & Disability in Mountlake Terrace
Health Insurance Coverage by Age in Mountlake Terrace
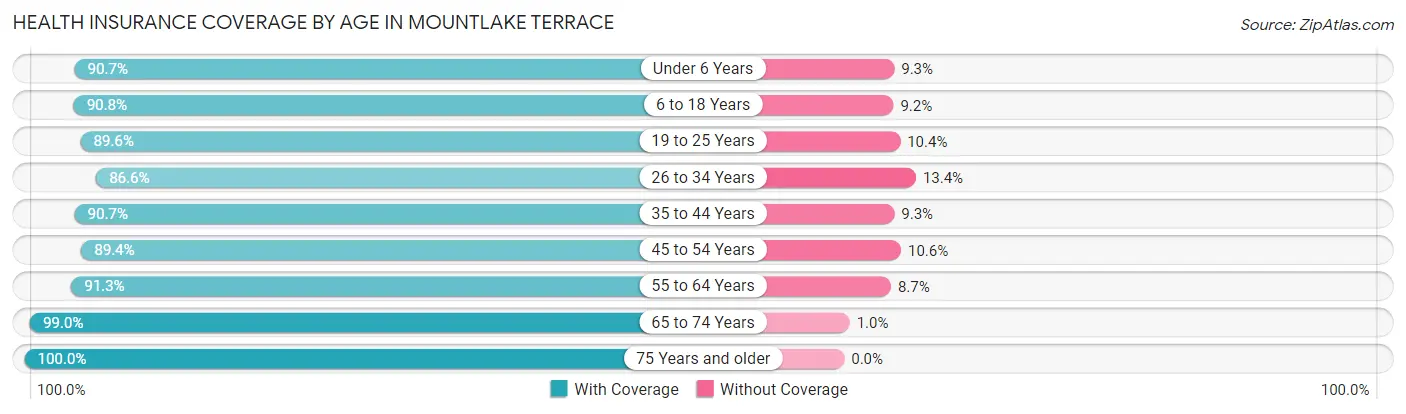
| Age Bracket | With Coverage | Without Coverage |
| Under 6 Years | 983 (90.7%) | 101 (9.3%) |
| 6 to 18 Years | 2,774 (90.8%) | 280 (9.2%) |
| 19 to 25 Years | 1,194 (89.6%) | 139 (10.4%) |
| 26 to 34 Years | 2,749 (86.6%) | 424 (13.4%) |
| 35 to 44 Years | 3,468 (90.7%) | 357 (9.3%) |
| 45 to 54 Years | 2,221 (89.4%) | 263 (10.6%) |
| 55 to 64 Years | 2,787 (91.3%) | 266 (8.7%) |
| 65 to 74 Years | 1,772 (99.0%) | 18 (1.0%) |
| 75 Years and older | 1,443 (100.0%) | 0 (0.0%) |
| Total | 19,391 (91.3%) | 1,848 (8.7%) |
Health Insurance Coverage by Citizenship Status in Mountlake Terrace
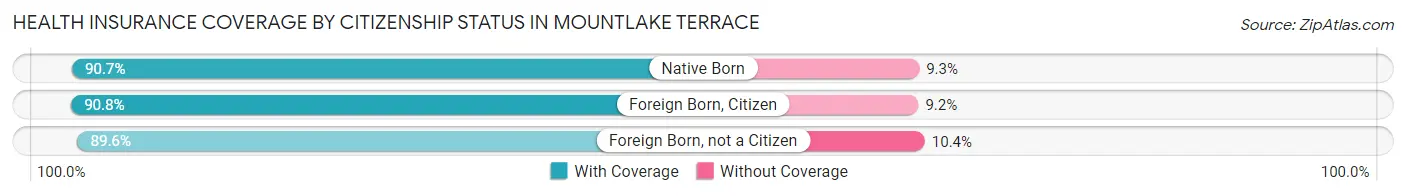
| Citizenship Status | With Coverage | Without Coverage |
| Native Born | 983 (90.7%) | 101 (9.3%) |
| Foreign Born, Citizen | 2,774 (90.8%) | 280 (9.2%) |
| Foreign Born, not a Citizen | 1,194 (89.6%) | 139 (10.4%) |
Health Insurance Coverage by Household Income in Mountlake Terrace
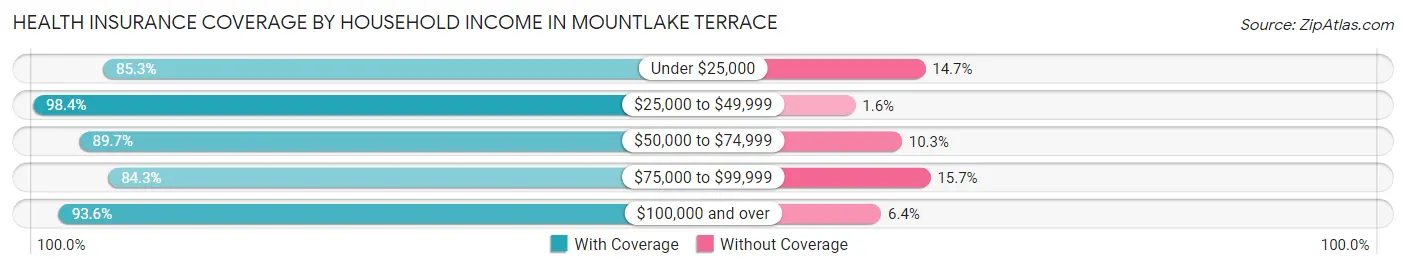
| Household Income | With Coverage | Without Coverage |
| Under $25,000 | 1,055 (85.3%) | 182 (14.7%) |
| $25,000 to $49,999 | 1,526 (98.4%) | 25 (1.6%) |
| $50,000 to $74,999 | 2,525 (89.7%) | 290 (10.3%) |
| $75,000 to $99,999 | 3,057 (84.3%) | 568 (15.7%) |
| $100,000 and over | 11,100 (93.6%) | 762 (6.4%) |
Public vs Private Health Insurance Coverage by Age in Mountlake Terrace
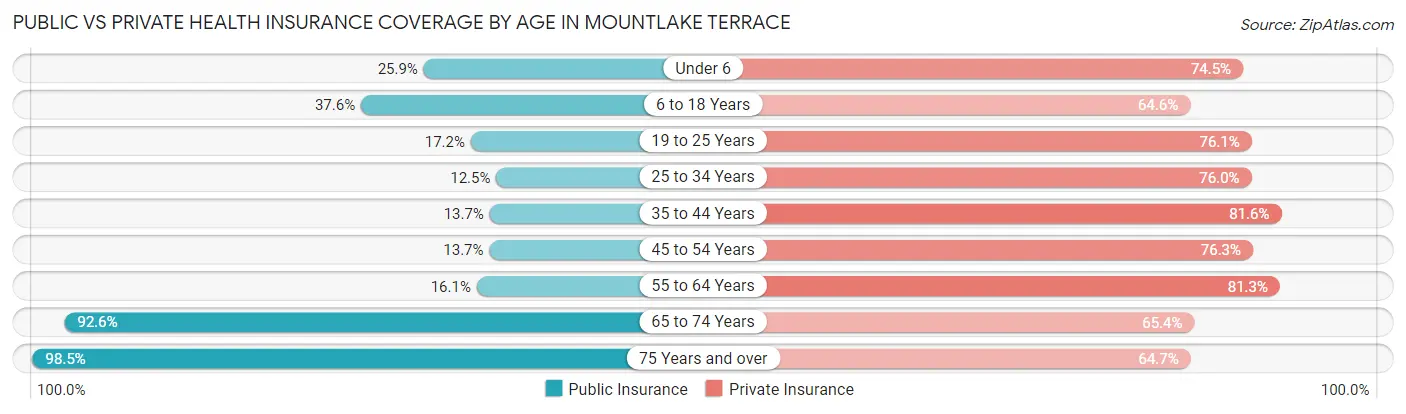
| Age Bracket | Public Insurance | Private Insurance |
| Under 6 | 281 (25.9%) | 807 (74.5%) |
| 6 to 18 Years | 1,147 (37.6%) | 1,974 (64.6%) |
| 19 to 25 Years | 229 (17.2%) | 1,014 (76.1%) |
| 25 to 34 Years | 395 (12.4%) | 2,412 (76.0%) |
| 35 to 44 Years | 523 (13.7%) | 3,120 (81.6%) |
| 45 to 54 Years | 341 (13.7%) | 1,895 (76.3%) |
| 55 to 64 Years | 491 (16.1%) | 2,482 (81.3%) |
| 65 to 74 Years | 1,658 (92.6%) | 1,171 (65.4%) |
| 75 Years and over | 1,422 (98.5%) | 934 (64.7%) |
| Total | 6,487 (30.5%) | 15,809 (74.4%) |
Disability Status by Sex by Age in Mountlake Terrace
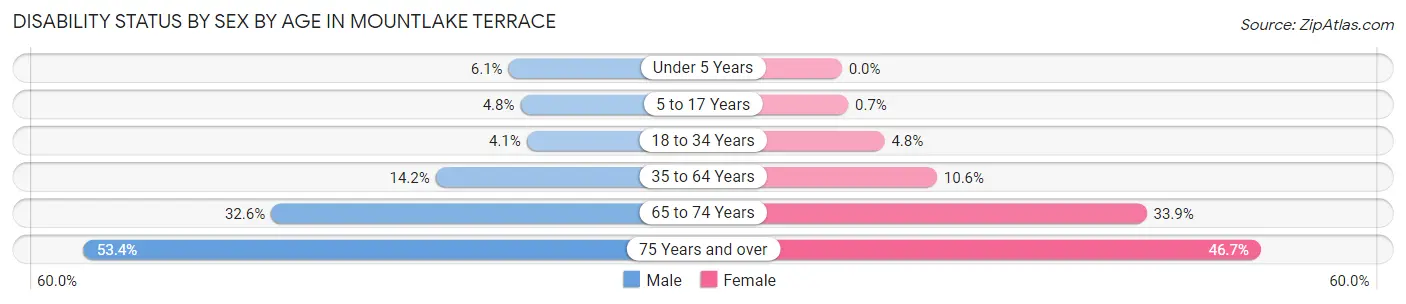
| Age Bracket | Male | Female |
| Under 5 Years | 27 (6.1%) | 0 (0.0%) |
| 5 to 17 Years | 80 (4.8%) | 10 (0.7%) |
| 18 to 34 Years | 95 (4.1%) | 114 (4.8%) |
| 35 to 64 Years | 637 (14.2%) | 517 (10.6%) |
| 65 to 74 Years | 295 (32.6%) | 300 (33.9%) |
| 75 Years and over | 315 (53.4%) | 398 (46.7%) |
Disability Class by Sex by Age in Mountlake Terrace
Disability Class: Hearing Difficulty
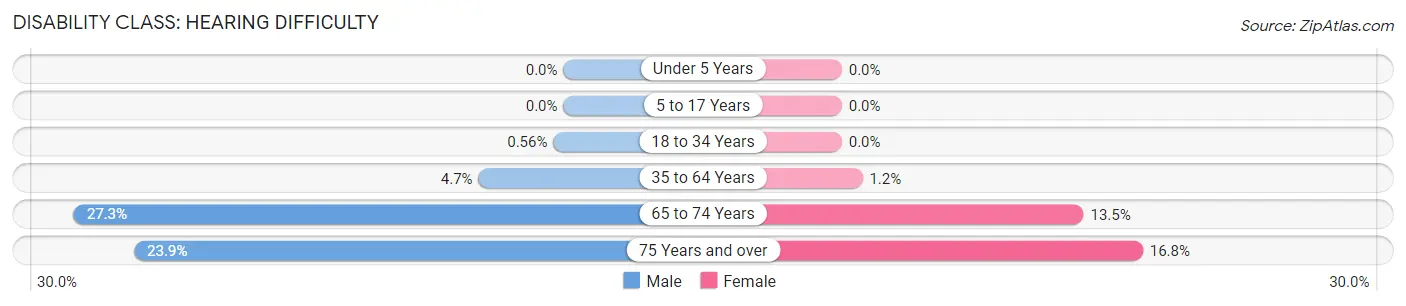
| Age Bracket | Male | Female |
| Under 5 Years | 0 (0.0%) | 0 (0.0%) |
| 5 to 17 Years | 0 (0.0%) | 0 (0.0%) |
| 18 to 34 Years | 13 (0.6%) | 0 (0.0%) |
| 35 to 64 Years | 212 (4.7%) | 56 (1.1%) |
| 65 to 74 Years | 247 (27.3%) | 119 (13.5%) |
| 75 Years and over | 141 (23.9%) | 143 (16.8%) |
Disability Class: Vision Difficulty
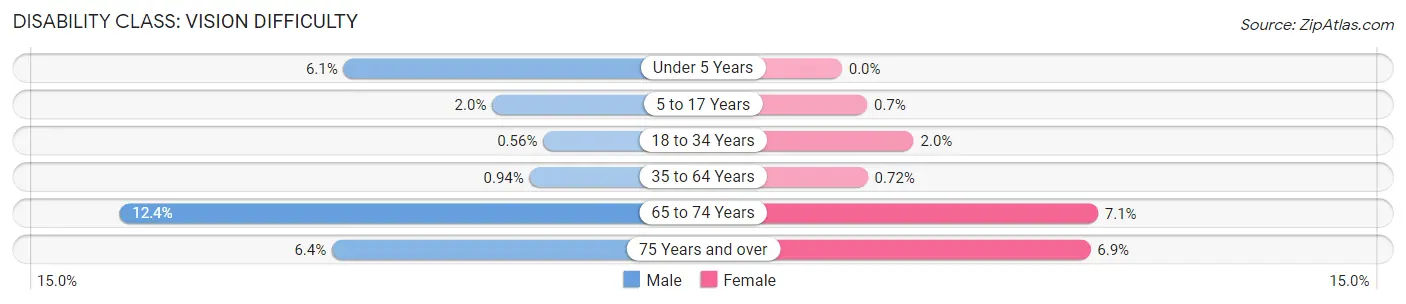
| Age Bracket | Male | Female |
| Under 5 Years | 27 (6.1%) | 0 (0.0%) |
| 5 to 17 Years | 33 (2.0%) | 10 (0.7%) |
| 18 to 34 Years | 13 (0.6%) | 48 (2.0%) |
| 35 to 64 Years | 42 (0.9%) | 35 (0.7%) |
| 65 to 74 Years | 112 (12.4%) | 63 (7.1%) |
| 75 Years and over | 38 (6.4%) | 59 (6.9%) |
Disability Class: Cognitive Difficulty
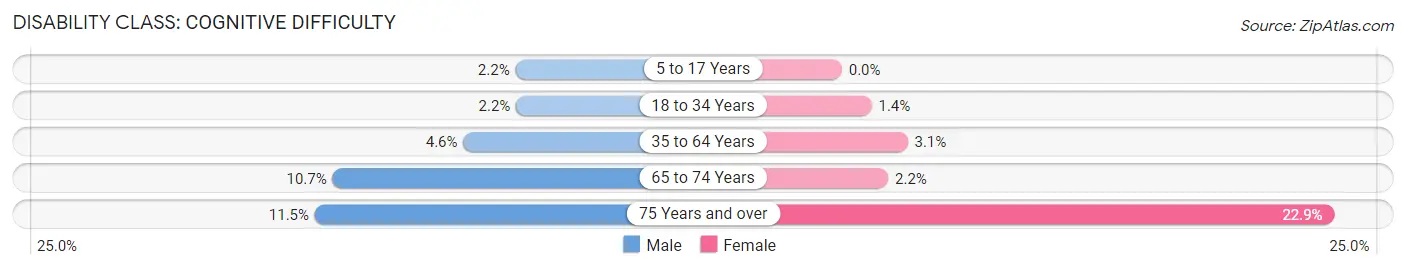
| Age Bracket | Male | Female |
| 5 to 17 Years | 37 (2.2%) | 0 (0.0%) |
| 18 to 34 Years | 51 (2.2%) | 33 (1.4%) |
| 35 to 64 Years | 208 (4.6%) | 149 (3.0%) |
| 65 to 74 Years | 97 (10.7%) | 19 (2.1%) |
| 75 Years and over | 68 (11.5%) | 195 (22.9%) |
Disability Class: Ambulatory Difficulty
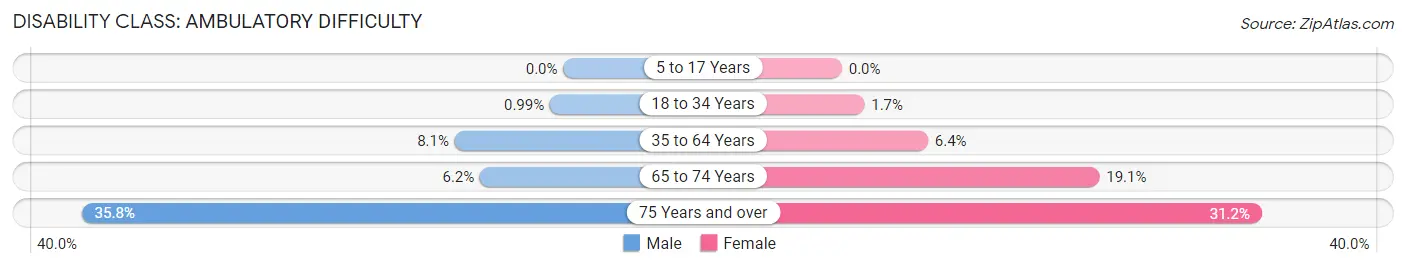
| Age Bracket | Male | Female |
| 5 to 17 Years | 0 (0.0%) | 0 (0.0%) |
| 18 to 34 Years | 23 (1.0%) | 40 (1.7%) |
| 35 to 64 Years | 361 (8.1%) | 312 (6.4%) |
| 65 to 74 Years | 56 (6.2%) | 169 (19.1%) |
| 75 Years and over | 211 (35.8%) | 266 (31.2%) |
Disability Class: Self-Care Difficulty
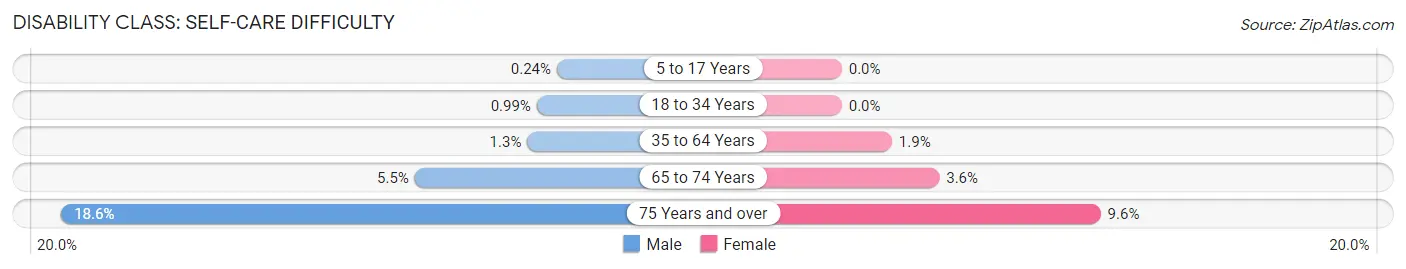
| Age Bracket | Male | Female |
| 5 to 17 Years | 4 (0.2%) | 0 (0.0%) |
| 18 to 34 Years | 23 (1.0%) | 0 (0.0%) |
| 35 to 64 Years | 60 (1.3%) | 91 (1.9%) |
| 65 to 74 Years | 50 (5.5%) | 32 (3.6%) |
| 75 Years and over | 110 (18.6%) | 82 (9.6%) |
Technology Access in Mountlake Terrace
Computing Device Access in Mountlake Terrace
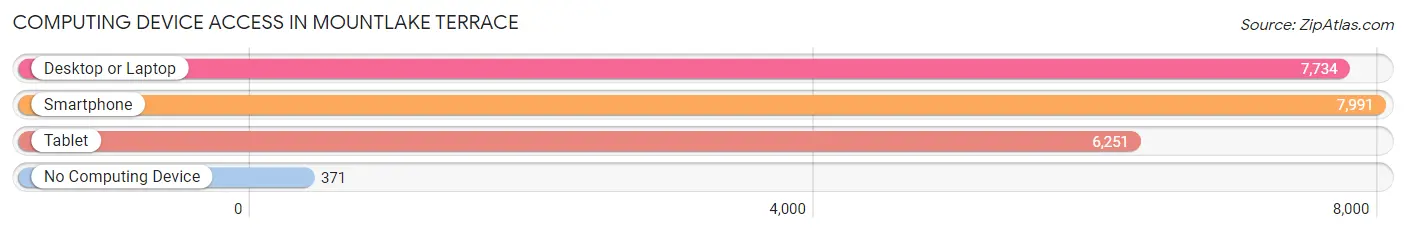
| Device Type | # Households | % Households |
| Desktop or Laptop | 7,734 | 86.5% |
| Smartphone | 7,991 | 89.4% |
| Tablet | 6,251 | 70.0% |
| No Computing Device | 371 | 4.2% |
| Total | 8,937 | 100.0% |
Internet Access in Mountlake Terrace
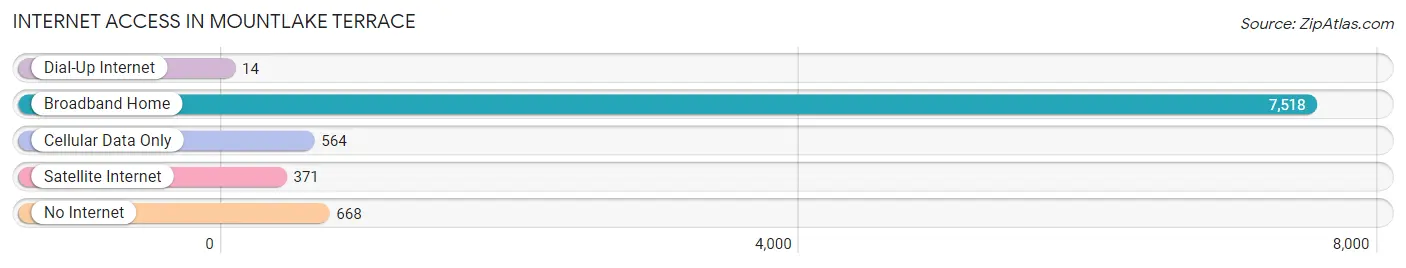
| Internet Type | # Households | % Households |
| Dial-Up Internet | 14 | 0.2% |
| Broadband Home | 7,518 | 84.1% |
| Cellular Data Only | 564 | 6.3% |
| Satellite Internet | 371 | 4.2% |
| No Internet | 668 | 7.5% |
| Total | 8,937 | 100.0% |
Mountlake Terrace Summary
Mountlake Terrace is a city located in Snohomish County, Washington, United States. It is located just north of Seattle and is part of the Seattle metropolitan area. As of the 2010 census, the city had a population of 19,909.
History
Mountlake Terrace was first settled in the late 1800s by homesteaders who were attracted to the area by its abundant timber and fertile soil. The area was originally known as Alderwood Manor, and the first post office was established in 1891. In the early 1900s, the area was developed as a residential community, and the name was changed to Mountlake Terrace in 1949.
The city was officially incorporated in 1954, and the first mayor was elected in 1955. The city has grown steadily since then, and today it is a vibrant and diverse community.
Geography
Mountlake Terrace is located in Snohomish County, Washington, just north of Seattle. It is bordered by the cities of Lynnwood to the north, Edmonds to the west, and Shoreline to the south. The city is situated on the shores of Lake Ballinger, a freshwater lake that is part of the Sammamish River watershed.
The city has a total area of 4.7 square miles, of which 4.6 square miles is land and 0.1 square miles is water. The terrain is mostly flat, with some hills in the northern part of the city.
Economy
Mountlake Terrace is a vibrant and diverse community with a strong economy. The city is home to a variety of businesses, including retail stores, restaurants, and professional services. The city is also home to several large employers, including Boeing, Microsoft, and Premera Blue Cross.
The city is also home to several educational institutions, including Edmonds Community College and the University of Washington Bothell.
Demographics
As of the 2010 census, the population of Mountlake Terrace was 19,909. The racial makeup of the city was 73.3% White, 8.2% Asian, 6.2% African American, 0.7% Native American, 0.2% Pacific Islander, and 8.3% from other races. The median household income was $60,945, and the median family income was $71,945.
The city is home to a variety of religious denominations, including Christianity, Judaism, Islam, and Buddhism. The city also has a large population of immigrants, with the largest groups coming from Mexico, Vietnam, and the Philippines.
Conclusion
Mountlake Terrace is a vibrant and diverse city located in Snohomish County, Washington. It is home to a variety of businesses, educational institutions, and religious denominations. The city has a strong economy and a median household income of $60,945. The city is also home to a large population of immigrants, with the largest groups coming from Mexico, Vietnam, and the Philippines.
Common Questions
What is Per Capita Income in Mountlake Terrace?
Per Capita income in Mountlake Terrace is $50,480.
What is the Median Family Income in Mountlake Terrace?
Median Family Income in Mountlake Terrace is $109,827.
What is the Median Household income in Mountlake Terrace?
Median Household Income in Mountlake Terrace is $96,104.
What is Income or Wage Gap in Mountlake Terrace?
Income or Wage Gap in Mountlake Terrace is 19.1%.
Women in Mountlake Terrace earn 80.9 cents for every dollar earned by a man.
What is Inequality or Gini Index in Mountlake Terrace?
Inequality or Gini Index in Mountlake Terrace is 0.40.
What is the Total Population of Mountlake Terrace?
Total Population of Mountlake Terrace is 21,350.
What is the Total Male Population of Mountlake Terrace?
Total Male Population of Mountlake Terrace is 10,471.
What is the Total Female Population of Mountlake Terrace?
Total Female Population of Mountlake Terrace is 10,879.
What is the Ratio of Males per 100 Females in Mountlake Terrace?
There are 96.25 Males per 100 Females in Mountlake Terrace.
What is the Ratio of Females per 100 Males in Mountlake Terrace?
There are 103.90 Females per 100 Males in Mountlake Terrace.
What is the Median Population Age in Mountlake Terrace?
Median Population Age in Mountlake Terrace is 38.6 Years.
What is the Average Family Size in Mountlake Terrace
Average Family Size in Mountlake Terrace is 2.9 People.
What is the Average Household Size in Mountlake Terrace
Average Household Size in Mountlake Terrace is 2.4 People.
How Large is the Labor Force in Mountlake Terrace?
There are 12,234 People in the Labor Forcein in Mountlake Terrace.
What is the Percentage of People in the Labor Force in Mountlake Terrace?
68.4% of People are in the Labor Force in Mountlake Terrace.
What is the Unemployment Rate in Mountlake Terrace?
Unemployment Rate in Mountlake Terrace is 4.1%.