Barberton, WA Map & Demographics
Barberton Map
Barberton Overview
$52,088
PER CAPITA INCOME
$124,360
AVG FAMILY INCOME
$115,357
AVG HOUSEHOLD INCOME
36.7%
WAGE / INCOME GAP [ % ]
63.3¢/ $1
WAGE / INCOME GAP [ $ ]
0.39
INEQUALITY / GINI INDEX
7,945
TOTAL POPULATION
4,051
MALE POPULATION
3,894
FEMALE POPULATION
104.03
MALES / 100 FEMALES
96.12
FEMALES / 100 MALES
44.2
MEDIAN AGE
3.1
AVG FAMILY SIZE
2.7
AVG HOUSEHOLD SIZE
4,038
LABOR FORCE [ PEOPLE ]
60.2%
PERCENT IN LABOR FORCE
4.7%
UNEMPLOYMENT RATE
Income in Barberton
Income Overview in Barberton
Per Capita Income in Barberton is $52,088, while median incomes of families and households are $124,360 and $115,357 respectively.
| Characteristic | Number | Measure |
| Per Capita Income | 7,945 | $52,088 |
| Median Family Income | 2,274 | $124,360 |
| Mean Family Income | 2,274 | $147,480 |
| Median Household Income | 2,890 | $115,357 |
| Mean Household Income | 2,890 | $138,144 |
| Income Deficit | 2,274 | $0 |
| Wage / Income Gap (%) | 7,945 | 36.72% |
| Wage / Income Gap ($) | 7,945 | 63.28¢ per $1 |
| Gini / Inequality Index | 7,945 | 0.39 |
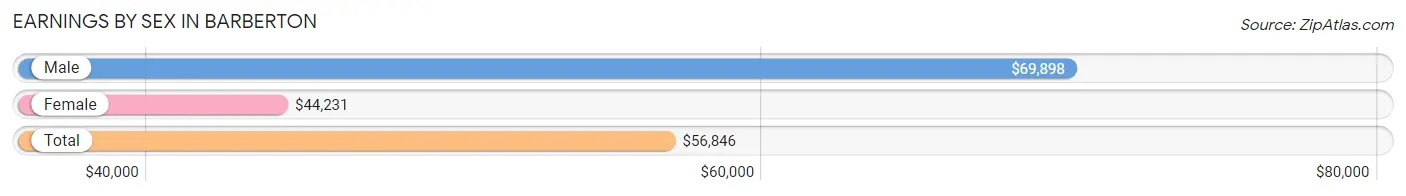
Earnings by Sex in Barberton
Average Earnings in Barberton are $56,846, $69,898 for men and $44,231 for women, a difference of 36.7%.
| Sex | Number | Average Earnings |
| Male | 2,415 (57.4%) | $69,898 |
| Female | 1,796 (42.6%) | $44,231 |
| Total | 4,211 (100.0%) | $56,846 |
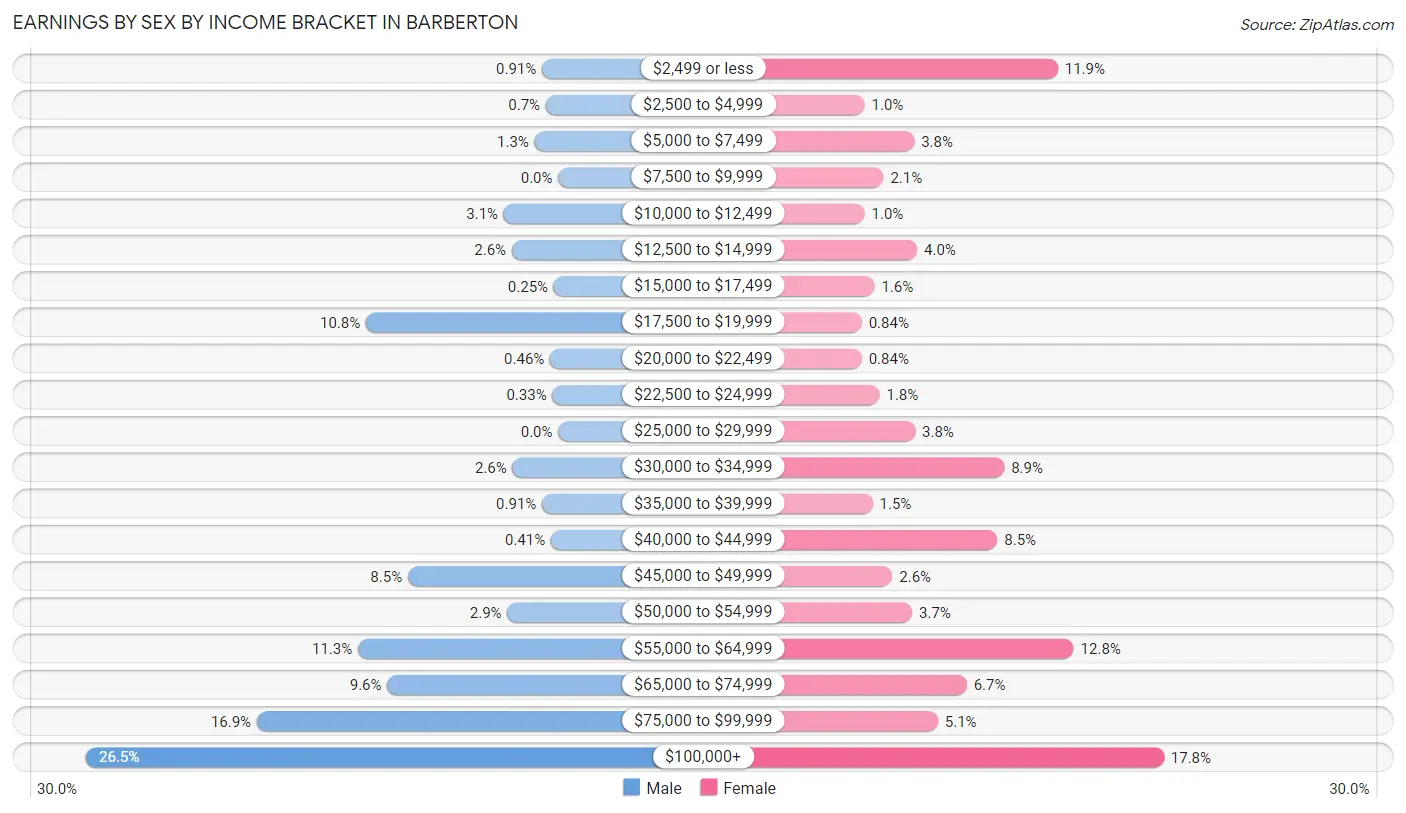
Earnings by Sex by Income Bracket in Barberton
The most common earnings brackets in Barberton are $100,000+ for men (641 | 26.5%) and $100,000+ for women (320 | 17.8%).
| Income | Male | Female |
| $2,499 or less | 22 (0.9%) | 213 (11.9%) |
| $2,500 to $4,999 | 17 (0.7%) | 18 (1.0%) |
| $5,000 to $7,499 | 32 (1.3%) | 68 (3.8%) |
| $7,500 to $9,999 | 0 (0.0%) | 37 (2.1%) |
| $10,000 to $12,499 | 74 (3.1%) | 18 (1.0%) |
| $12,500 to $14,999 | 63 (2.6%) | 71 (4.0%) |
| $15,000 to $17,499 | 6 (0.3%) | 28 (1.6%) |
| $17,500 to $19,999 | 261 (10.8%) | 15 (0.8%) |
| $20,000 to $22,499 | 11 (0.5%) | 15 (0.8%) |
| $22,500 to $24,999 | 8 (0.3%) | 33 (1.8%) |
| $25,000 to $29,999 | 0 (0.0%) | 69 (3.8%) |
| $30,000 to $34,999 | 62 (2.6%) | 159 (8.8%) |
| $35,000 to $39,999 | 22 (0.9%) | 26 (1.5%) |
| $40,000 to $44,999 | 10 (0.4%) | 152 (8.5%) |
| $45,000 to $49,999 | 204 (8.5%) | 46 (2.6%) |
| $50,000 to $54,999 | 69 (2.9%) | 66 (3.7%) |
| $55,000 to $64,999 | 272 (11.3%) | 229 (12.8%) |
| $65,000 to $74,999 | 232 (9.6%) | 121 (6.7%) |
| $75,000 to $99,999 | 409 (16.9%) | 92 (5.1%) |
| $100,000+ | 641 (26.5%) | 320 (17.8%) |
| Total | 2,415 (100.0%) | 1,796 (100.0%) |
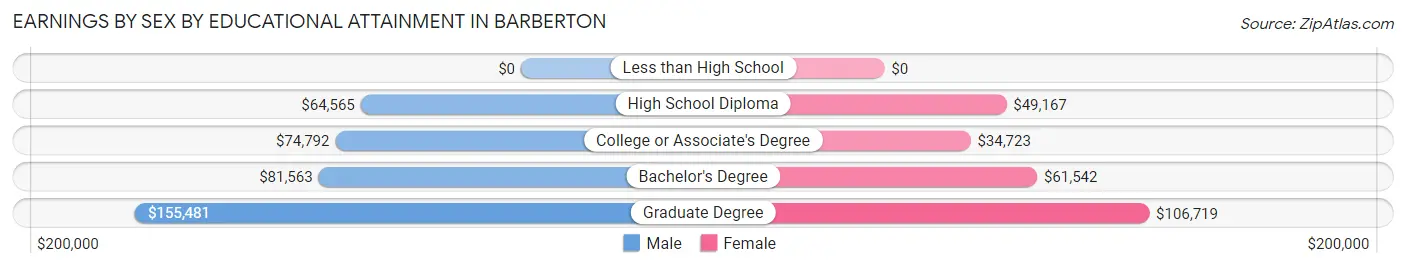
Earnings by Sex by Educational Attainment in Barberton
Average earnings in Barberton are $75,429 for men and $51,864 for women, a difference of 31.2%. Men with an educational attainment of graduate degree enjoy the highest average annual earnings of $155,481, while those with high school diploma education earn the least with $64,565. Women with an educational attainment of graduate degree earn the most with the average annual earnings of $106,719, while those with college or associate's degree education have the smallest earnings of $34,723.
| Educational Attainment | Male Income | Female Income |
| Less than High School | - | - |
| High School Diploma | $64,565 | $49,167 |
| College or Associate's Degree | $74,792 | $34,723 |
| Bachelor's Degree | $81,563 | $61,542 |
| Graduate Degree | $155,481 | $106,719 |
| Total | $75,429 | $51,864 |
Family Income in Barberton
Family Income Brackets in Barberton
According to the Barberton family income data, there are 603 families falling into the $100,000 to $149,999 income range, which is the most common income bracket and makes up 26.5% of all families.
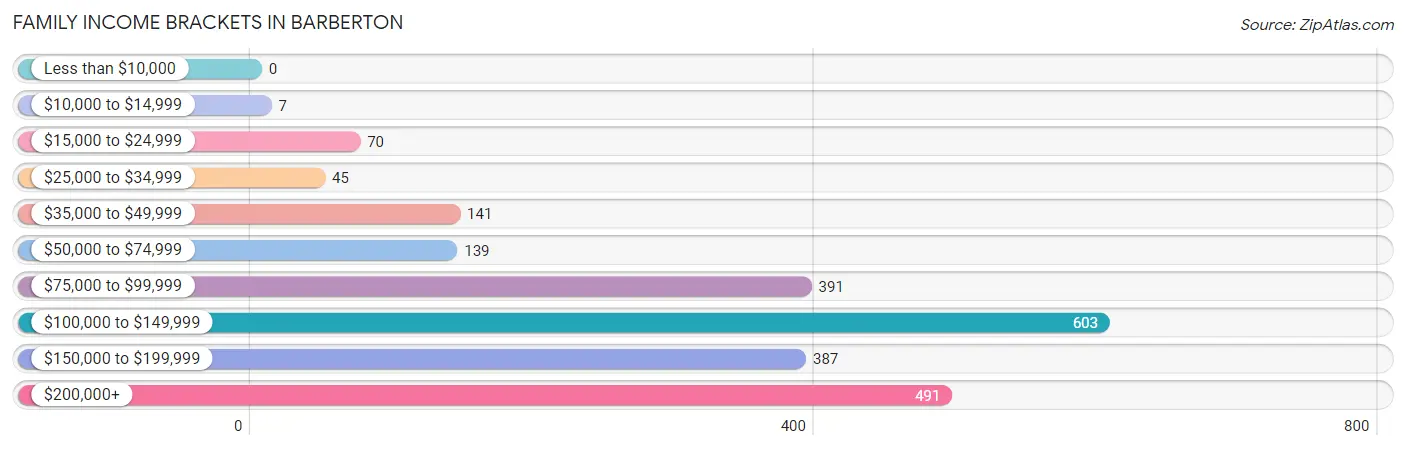
| Income Bracket | # Families | % Families |
| Less than $10,000 | 0 | 0.0% |
| $10,000 to $14,999 | 7 | 0.3% |
| $15,000 to $24,999 | 70 | 3.1% |
| $25,000 to $34,999 | 45 | 2.0% |
| $35,000 to $49,999 | 141 | 6.2% |
| $50,000 to $74,999 | 139 | 6.1% |
| $75,000 to $99,999 | 391 | 17.2% |
| $100,000 to $149,999 | 603 | 26.5% |
| $150,000 to $199,999 | 387 | 17.0% |
| $200,000+ | 491 | 21.6% |
Family Income by Famaliy Size in Barberton
5-person families (90 | 4.0%) account for the highest median family income in Barberton with $250,001 per family, while 2-person families (1,232 | 54.2%) have the highest median income of $56,534 per family member.
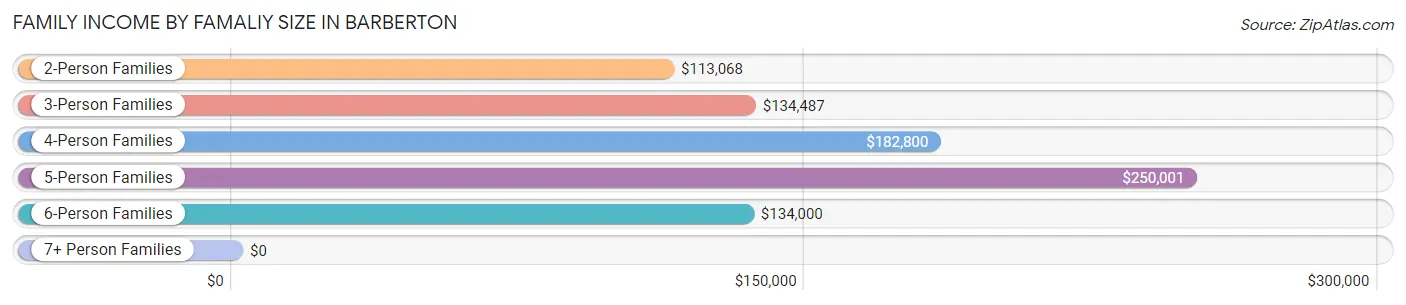
| Income Bracket | # Families | Median Income |
| 2-Person Families | 1,232 (54.2%) | $113,068 |
| 3-Person Families | 435 (19.1%) | $134,487 |
| 4-Person Families | 386 (17.0%) | $182,800 |
| 5-Person Families | 90 (4.0%) | $250,001 |
| 6-Person Families | 114 (5.0%) | $134,000 |
| 7+ Person Families | 17 (0.7%) | $0 |
| Total | 2,274 (100.0%) | $124,360 |
Family Income by Number of Earners in Barberton
The median family income in Barberton is $124,360, with families comprising 3+ earners (300) having the highest median family income of $233,281, while families with no earners (502) have the lowest median family income of $79,211, accounting for 13.2% and 22.1% of families, respectively.
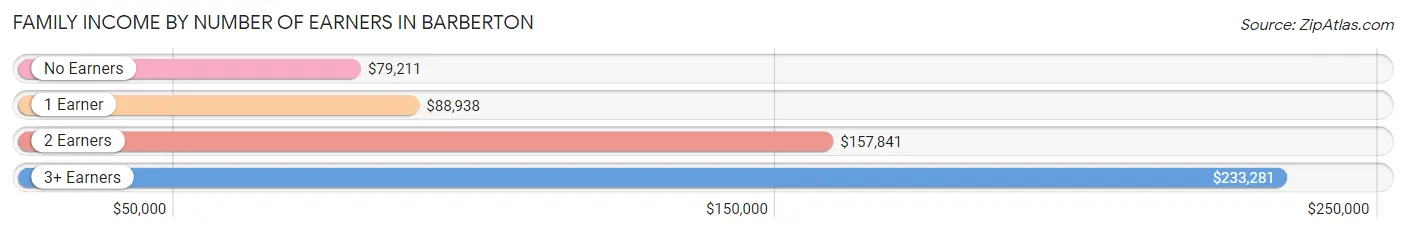
| Number of Earners | # Families | Median Income |
| No Earners | 502 (22.1%) | $79,211 |
| 1 Earner | 469 (20.6%) | $88,938 |
| 2 Earners | 1,003 (44.1%) | $157,841 |
| 3+ Earners | 300 (13.2%) | $233,281 |
| Total | 2,274 (100.0%) | $124,360 |
Household Income in Barberton
Household Income Brackets in Barberton
With 728 households falling in the category, the $100,000 to $149,999 income range is the most frequent in Barberton, accounting for 25.2% of all households. In contrast, only 32 households (1.1%) fall into the less than $10,000 income bracket, making it the least populous group.
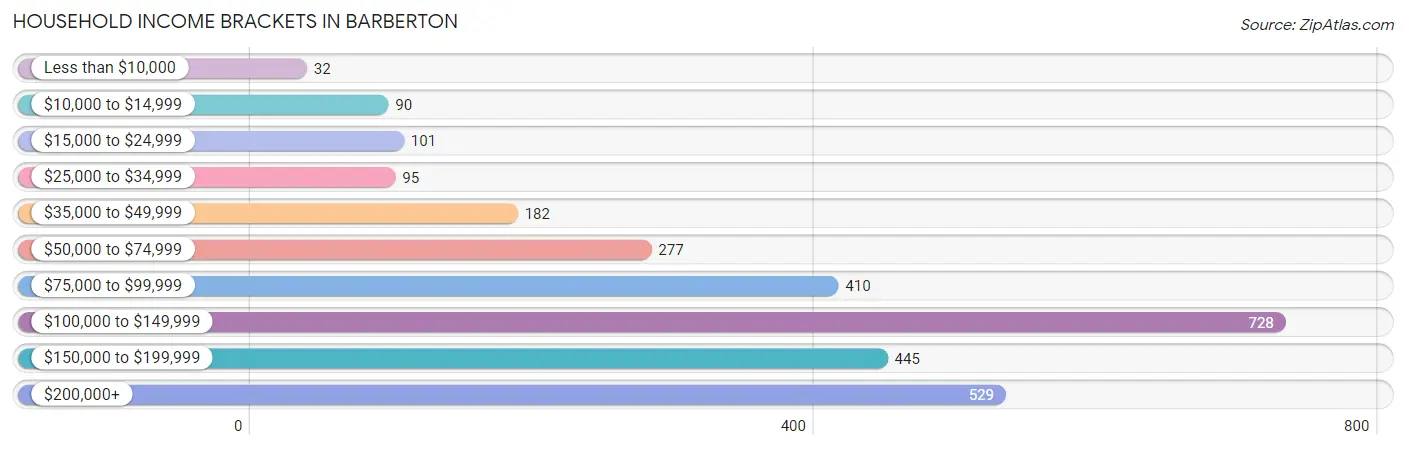
| Income Bracket | # Households | % Households |
| Less than $10,000 | 32 | 1.1% |
| $10,000 to $14,999 | 90 | 3.1% |
| $15,000 to $24,999 | 101 | 3.5% |
| $25,000 to $34,999 | 95 | 3.3% |
| $35,000 to $49,999 | 182 | 6.3% |
| $50,000 to $74,999 | 277 | 9.6% |
| $75,000 to $99,999 | 410 | 14.2% |
| $100,000 to $149,999 | 728 | 25.2% |
| $150,000 to $199,999 | 445 | 15.4% |
| $200,000+ | 529 | 18.3% |
Household Income by Householder Age in Barberton
The median household income in Barberton is $115,357, with the highest median household income of $134,308 found in the 25 to 44 years age bracket for the primary householder. A total of 823 households (28.5%) fall into this category. Meanwhile, the 65+ years age bracket for the primary householder has the lowest median household income of $80,724, with 1,018 households (35.2%) in this group.
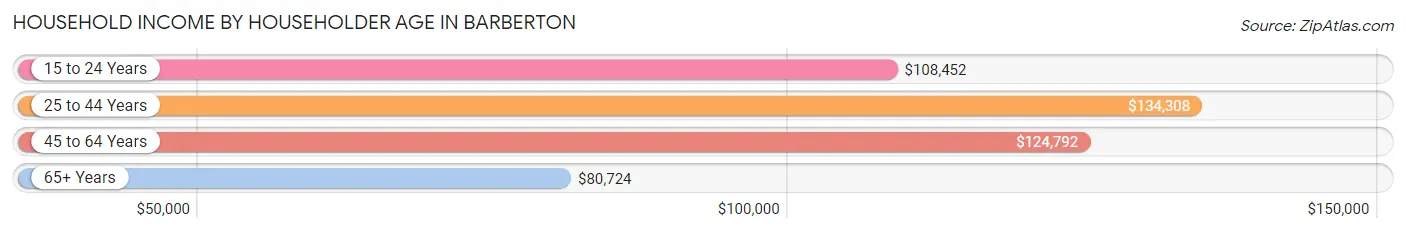
| Income Bracket | # Households | Median Income |
| 15 to 24 Years | 50 (1.7%) | $108,452 |
| 25 to 44 Years | 823 (28.5%) | $134,308 |
| 45 to 64 Years | 999 (34.6%) | $124,792 |
| 65+ Years | 1,018 (35.2%) | $80,724 |
| Total | 2,890 (100.0%) | $115,357 |
Poverty in Barberton
Income Below Poverty by Sex and Age in Barberton
With 1.5% poverty level for males and 7.1% for females among the residents of Barberton, 55 to 64 year old males and 65 to 74 year old females are the most vulnerable to poverty, with 38 males (12.3%) and 152 females (23.2%) in their respective age groups living below the poverty level.
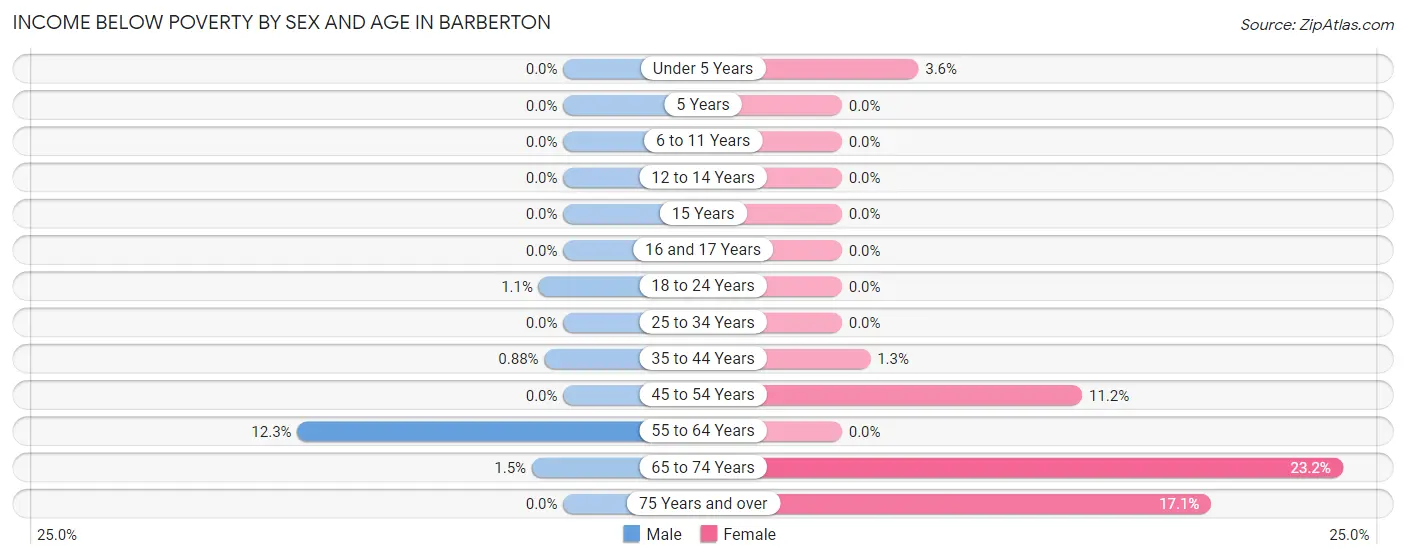
| Age Bracket | Male | Female |
| Under 5 Years | 0 (0.0%) | 6 (3.5%) |
| 5 Years | 0 (0.0%) | 0 (0.0%) |
| 6 to 11 Years | 0 (0.0%) | 0 (0.0%) |
| 12 to 14 Years | 0 (0.0%) | 0 (0.0%) |
| 15 Years | 0 (0.0%) | 0 (0.0%) |
| 16 and 17 Years | 0 (0.0%) | 0 (0.0%) |
| 18 to 24 Years | 7 (1.1%) | 0 (0.0%) |
| 25 to 34 Years | 0 (0.0%) | 0 (0.0%) |
| 35 to 44 Years | 5 (0.9%) | 6 (1.3%) |
| 45 to 54 Years | 0 (0.0%) | 71 (11.2%) |
| 55 to 64 Years | 38 (12.3%) | 0 (0.0%) |
| 65 to 74 Years | 9 (1.5%) | 152 (23.2%) |
| 75 Years and over | 0 (0.0%) | 42 (17.1%) |
| Total | 59 (1.5%) | 277 (7.1%) |
Income Above Poverty by Sex and Age in Barberton
According to the poverty statistics in Barberton, males aged under 5 years and females aged 5 years are the age groups that are most secure financially, with 100.0% of males and 100.0% of females in these age groups living above the poverty line.
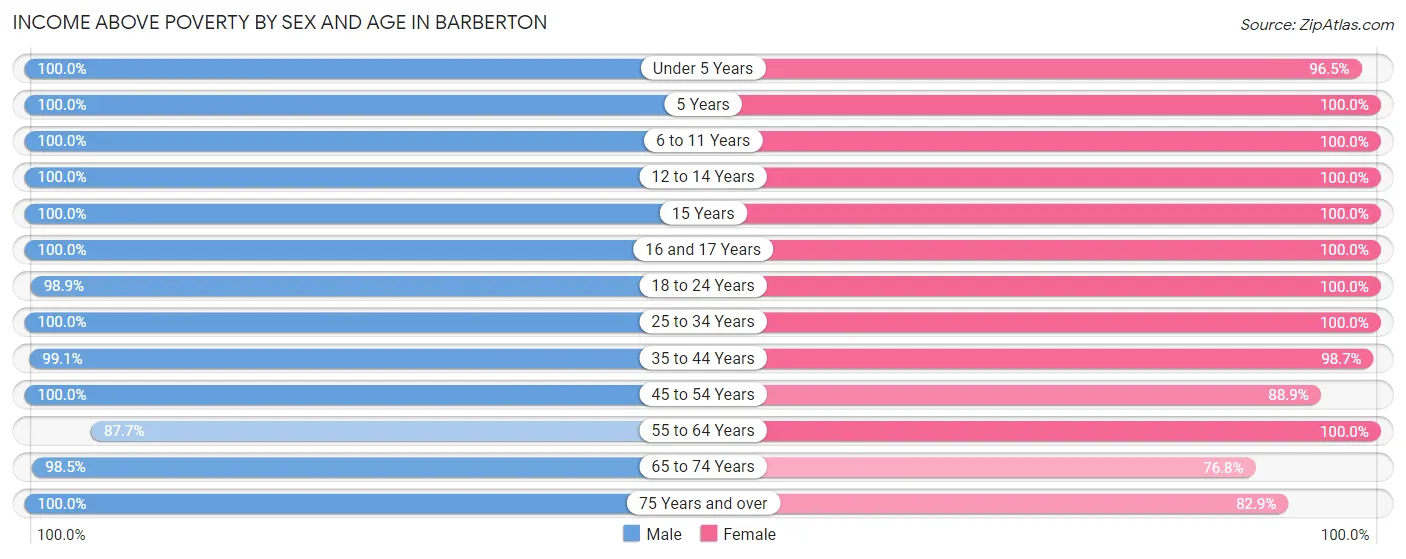
| Age Bracket | Male | Female |
| Under 5 Years | 143 (100.0%) | 163 (96.5%) |
| 5 Years | 56 (100.0%) | 22 (100.0%) |
| 6 to 11 Years | 263 (100.0%) | 294 (100.0%) |
| 12 to 14 Years | 110 (100.0%) | 102 (100.0%) |
| 15 Years | 31 (100.0%) | 47 (100.0%) |
| 16 and 17 Years | 50 (100.0%) | 65 (100.0%) |
| 18 to 24 Years | 606 (98.9%) | 269 (100.0%) |
| 25 to 34 Years | 527 (100.0%) | 373 (100.0%) |
| 35 to 44 Years | 565 (99.1%) | 449 (98.7%) |
| 45 to 54 Years | 564 (100.0%) | 566 (88.8%) |
| 55 to 64 Years | 270 (87.7%) | 558 (100.0%) |
| 65 to 74 Years | 606 (98.5%) | 502 (76.8%) |
| 75 Years and over | 199 (100.0%) | 203 (82.9%) |
| Total | 3,990 (98.5%) | 3,613 (92.9%) |
Income Below Poverty Among Married-Couple Families in Barberton
The poverty statistics for married-couple families in Barberton show that 0.5% or 9 of the total 1,947 families live below the poverty line. Families with no children have the highest poverty rate of 0.7%, comprising of 9 families. On the other hand, families with 1 or 2 children have the lowest poverty rate of 0.0%, which includes 0 families.
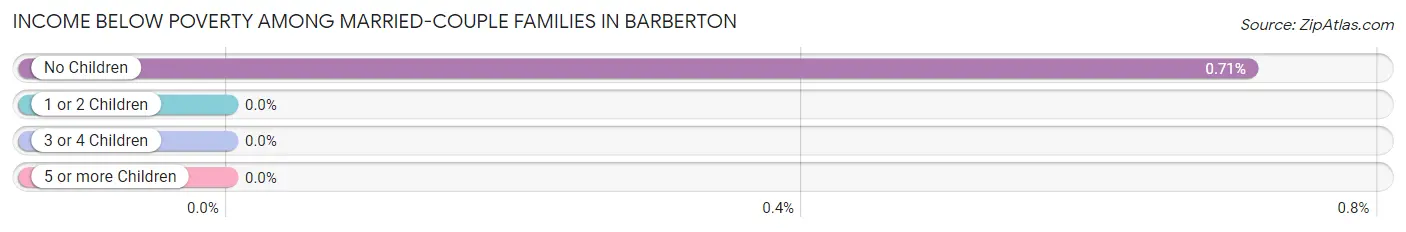
| Children | Above Poverty | Below Poverty |
| No Children | 1,253 (99.3%) | 9 (0.7%) |
| 1 or 2 Children | 593 (100.0%) | 0 (0.0%) |
| 3 or 4 Children | 92 (100.0%) | 0 (0.0%) |
| 5 or more Children | 0 (0.0%) | 0 (0.0%) |
| Total | 1,938 (99.5%) | 9 (0.5%) |
Income Below Poverty Among Single-Parent Households in Barberton
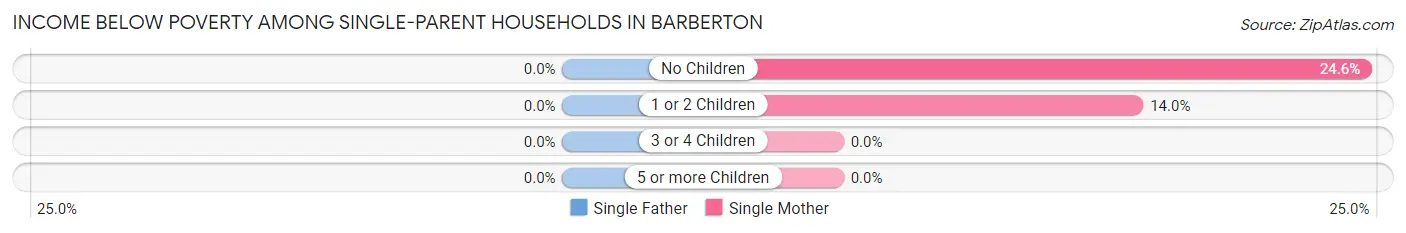
| Children | Single Father | Single Mother |
| No Children | 0 (0.0%) | 62 (24.6%) |
| 1 or 2 Children | 0 (0.0%) | 6 (14.0%) |
| 3 or 4 Children | 0 (0.0%) | 0 (0.0%) |
| 5 or more Children | 0 (0.0%) | 0 (0.0%) |
| Total | 0 (0.0%) | 68 (23.1%) |
Income Below Poverty Among Married-Couple vs Single-Parent Households in Barberton
The poverty data for Barberton shows that 9 of the married-couple family households (0.5%) and 68 of the single-parent households (20.8%) are living below the poverty level. Within the married-couple family households, those with no children have the highest poverty rate, with 9 households (0.7%) falling below the poverty line. Among the single-parent households, those with no children have the highest poverty rate, with 62 household (22.6%) living below poverty.
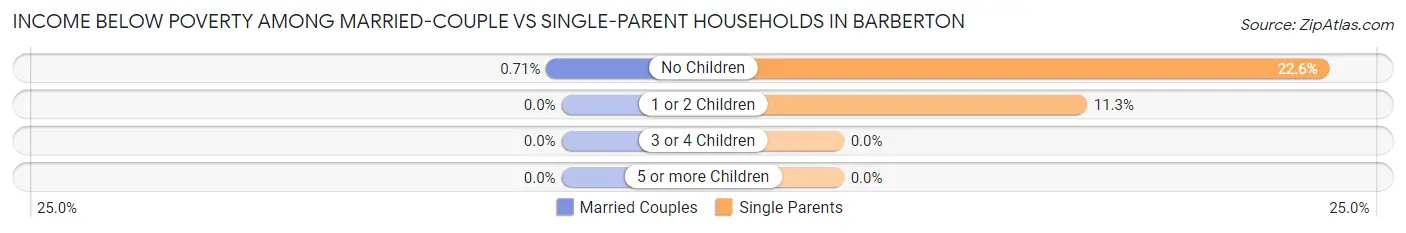
| Children | Married-Couple Families | Single-Parent Households |
| No Children | 9 (0.7%) | 62 (22.6%) |
| 1 or 2 Children | 0 (0.0%) | 6 (11.3%) |
| 3 or 4 Children | 0 (0.0%) | 0 (0.0%) |
| 5 or more Children | 0 (0.0%) | 0 (0.0%) |
| Total | 9 (0.5%) | 68 (20.8%) |
Race in Barberton
The most populous races in Barberton are White / Caucasian (6,692 | 84.2%), Hispanic or Latino (590 | 7.4%), and Two or more Races (481 | 6.0%).
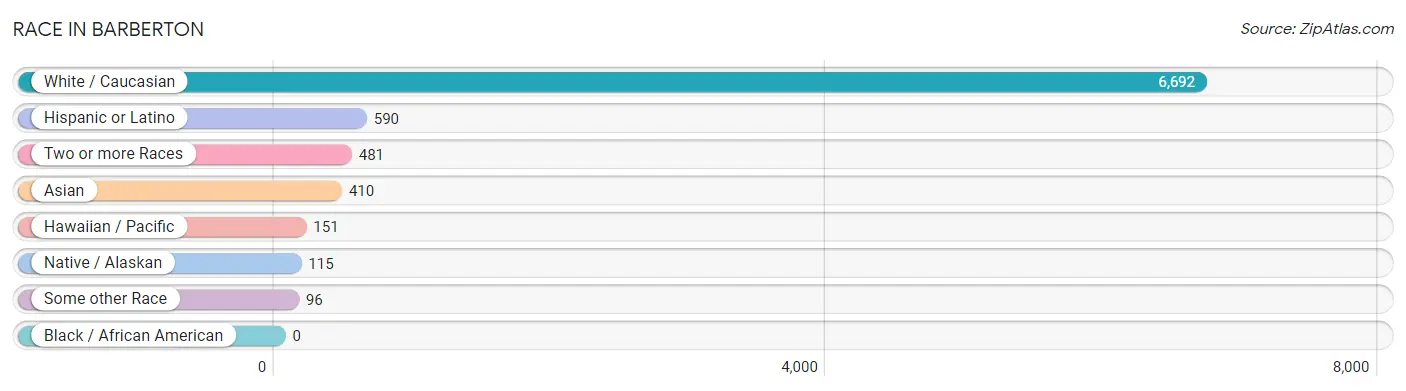
| Race | # Population | % Population |
| Asian | 410 | 5.2% |
| Black / African American | 0 | 0.0% |
| Hawaiian / Pacific | 151 | 1.9% |
| Hispanic or Latino | 590 | 7.4% |
| Native / Alaskan | 115 | 1.5% |
| White / Caucasian | 6,692 | 84.2% |
| Two or more Races | 481 | 6.0% |
| Some other Race | 96 | 1.2% |
| Total | 7,945 | 100.0% |
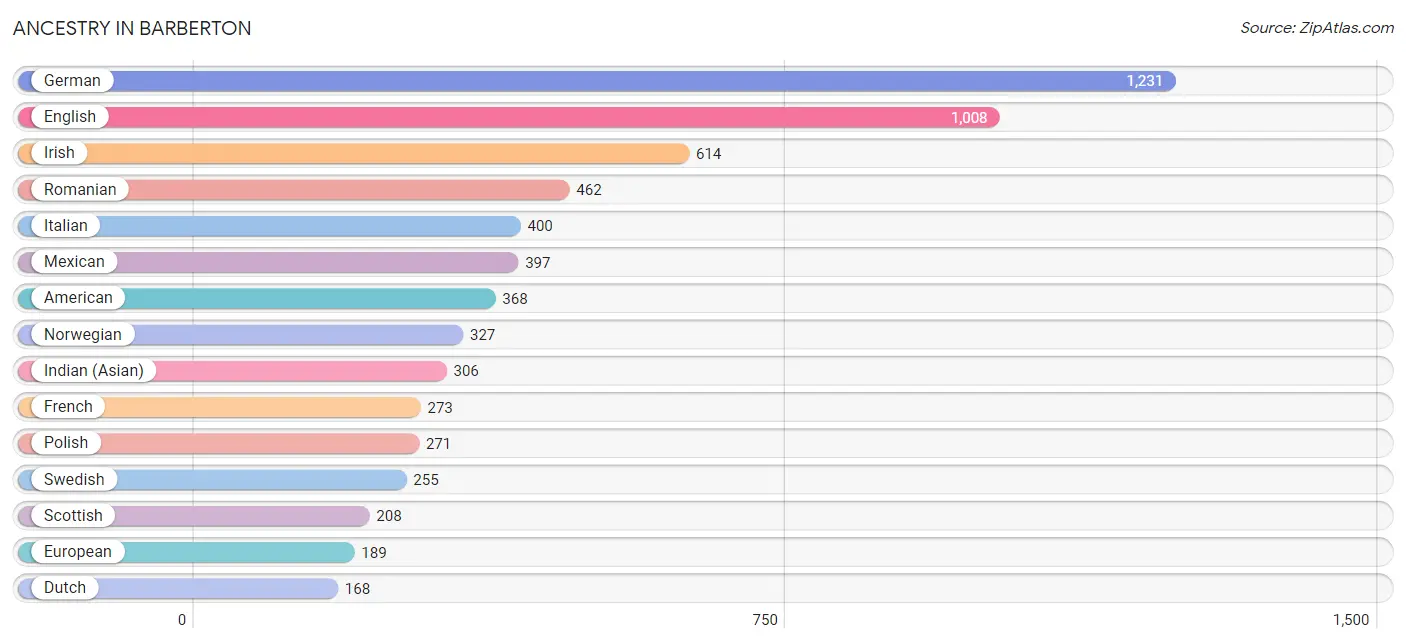
Ancestry in Barberton
The most populous ancestries reported in Barberton are German (1,231 | 15.5%), English (1,008 | 12.7%), Irish (614 | 7.7%), Romanian (462 | 5.8%), and Italian (400 | 5.0%), together accounting for 46.8% of all Barberton residents.
| Ancestry | # Population | % Population |
| African | 9 | 0.1% |
| American | 368 | 4.6% |
| Arab | 19 | 0.2% |
| Argentinean | 27 | 0.3% |
| Belgian | 46 | 0.6% |
| Bhutanese | 75 | 0.9% |
| British | 76 | 1.0% |
| Burmese | 39 | 0.5% |
| Canadian | 18 | 0.2% |
| Central American | 50 | 0.6% |
| Cherokee | 29 | 0.4% |
| Croatian | 10 | 0.1% |
| Danish | 40 | 0.5% |
| Dominican | 18 | 0.2% |
| Dutch | 168 | 2.1% |
| Eastern European | 29 | 0.4% |
| English | 1,008 | 12.7% |
| European | 189 | 2.4% |
| Finnish | 82 | 1.0% |
| French | 273 | 3.4% |
| French Canadian | 77 | 1.0% |
| German | 1,231 | 15.5% |
| Guamanian / Chamorro | 151 | 1.9% |
| Hungarian | 18 | 0.2% |
| Icelander | 17 | 0.2% |
| Indian (Asian) | 306 | 3.8% |
| Irish | 614 | 7.7% |
| Italian | 400 | 5.0% |
| Japanese | 17 | 0.2% |
| Korean | 47 | 0.6% |
| Lebanese | 19 | 0.2% |
| Lithuanian | 28 | 0.4% |
| Malaysian | 13 | 0.2% |
| Mexican | 397 | 5.0% |
| Nicaraguan | 50 | 0.6% |
| Northern European | 9 | 0.1% |
| Norwegian | 327 | 4.1% |
| Pennsylvania German | 13 | 0.2% |
| Polish | 271 | 3.4% |
| Portuguese | 52 | 0.6% |
| Puerto Rican | 29 | 0.4% |
| Romanian | 462 | 5.8% |
| Russian | 96 | 1.2% |
| Scandinavian | 69 | 0.9% |
| Scotch-Irish | 165 | 2.1% |
| Scottish | 208 | 2.6% |
| Slavic | 37 | 0.5% |
| Slovak | 66 | 0.8% |
| South American | 27 | 0.3% |
| Spaniard | 41 | 0.5% |
| Spanish | 10 | 0.1% |
| Subsaharan African | 9 | 0.1% |
| Swedish | 255 | 3.2% |
| Swiss | 24 | 0.3% |
| Thai | 79 | 1.0% |
| Ukrainian | 53 | 0.7% |
| Welsh | 69 | 0.9% |
| Yakama | 18 | 0.2% |
| Yugoslavian | 17 | 0.2% | View All 59 Rows |
Immigrants in Barberton
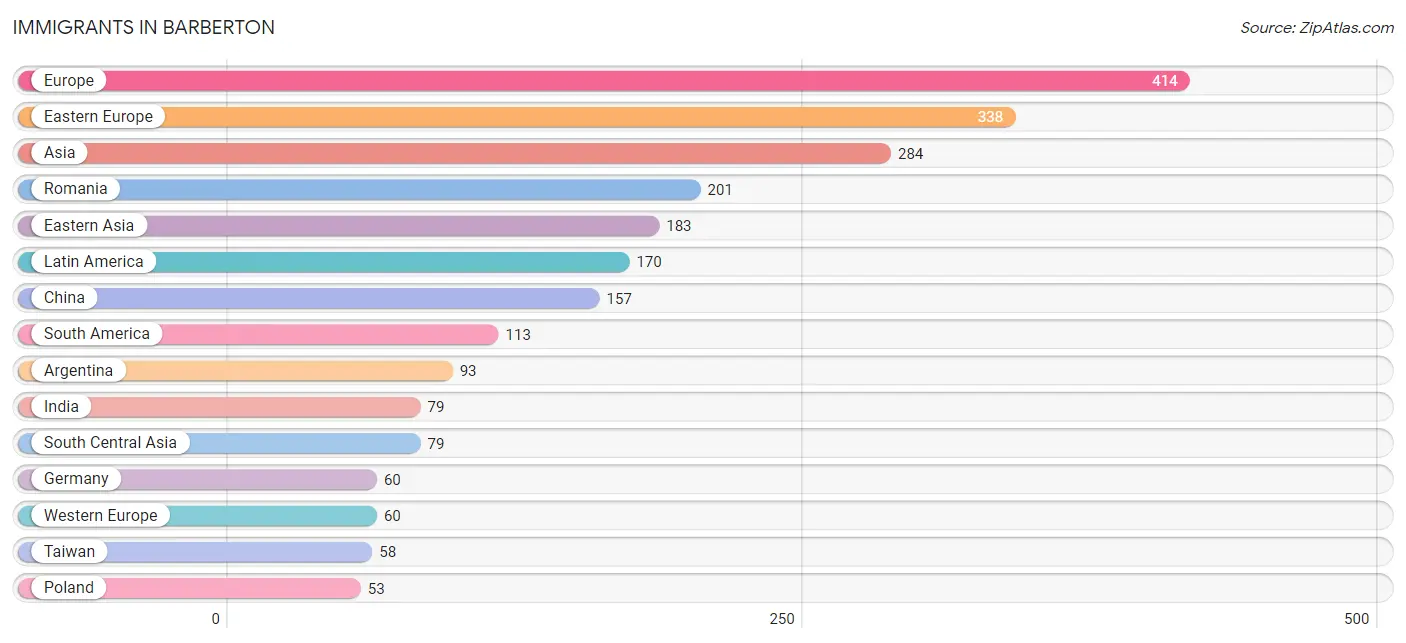
The most numerous immigrant groups reported in Barberton came from Europe (414 | 5.2%), Eastern Europe (338 | 4.3%), Asia (284 | 3.6%), Romania (201 | 2.5%), and Eastern Asia (183 | 2.3%), together accounting for 17.9% of all Barberton residents.
| Immigration Origin | # Population | % Population |
| Argentina | 93 | 1.2% |
| Asia | 284 | 3.6% |
| Azores | 7 | 0.1% |
| Bosnia and Herzegovina | 17 | 0.2% |
| Brazil | 20 | 0.3% |
| Canada | 12 | 0.2% |
| Caribbean | 5 | 0.1% |
| Central America | 52 | 0.6% |
| China | 157 | 2.0% |
| Denmark | 9 | 0.1% |
| Dominican Republic | 5 | 0.1% |
| Eastern Asia | 183 | 2.3% |
| Eastern Europe | 338 | 4.3% |
| Europe | 414 | 5.2% |
| Germany | 60 | 0.8% |
| India | 79 | 1.0% |
| Korea | 26 | 0.3% |
| Latin America | 170 | 2.1% |
| Mexico | 27 | 0.3% |
| Moldova | 36 | 0.4% |
| Nicaragua | 25 | 0.3% |
| Northern Europe | 9 | 0.1% |
| Philippines | 9 | 0.1% |
| Poland | 53 | 0.7% |
| Portugal | 7 | 0.1% |
| Romania | 201 | 2.5% |
| Russia | 1 | 0.0% |
| South America | 113 | 1.4% |
| South Central Asia | 79 | 1.0% |
| South Eastern Asia | 22 | 0.3% |
| Southern Europe | 7 | 0.1% |
| Taiwan | 58 | 0.7% |
| Thailand | 13 | 0.2% |
| Ukraine | 30 | 0.4% |
| Western Europe | 60 | 0.8% | View All 35 Rows |
Sex and Age in Barberton
Sex and Age in Barberton
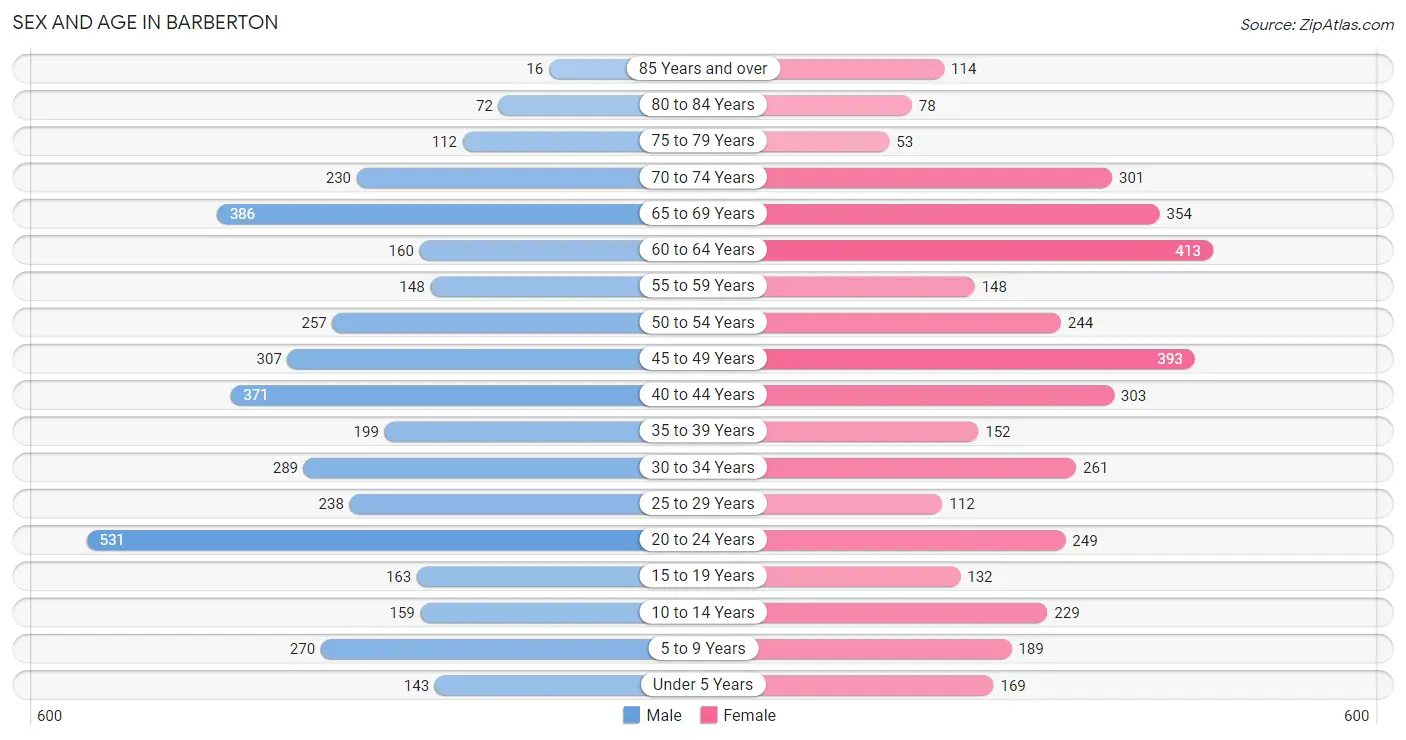
The most populous age groups in Barberton are 20 to 24 Years (531 | 13.1%) for men and 60 to 64 Years (413 | 10.6%) for women.
| Age Bracket | Male | Female |
| Under 5 Years | 143 (3.5%) | 169 (4.3%) |
| 5 to 9 Years | 270 (6.7%) | 189 (4.9%) |
| 10 to 14 Years | 159 (3.9%) | 229 (5.9%) |
| 15 to 19 Years | 163 (4.0%) | 132 (3.4%) |
| 20 to 24 Years | 531 (13.1%) | 249 (6.4%) |
| 25 to 29 Years | 238 (5.9%) | 112 (2.9%) |
| 30 to 34 Years | 289 (7.1%) | 261 (6.7%) |
| 35 to 39 Years | 199 (4.9%) | 152 (3.9%) |
| 40 to 44 Years | 371 (9.2%) | 303 (7.8%) |
| 45 to 49 Years | 307 (7.6%) | 393 (10.1%) |
| 50 to 54 Years | 257 (6.3%) | 244 (6.3%) |
| 55 to 59 Years | 148 (3.6%) | 148 (3.8%) |
| 60 to 64 Years | 160 (4.0%) | 413 (10.6%) |
| 65 to 69 Years | 386 (9.5%) | 354 (9.1%) |
| 70 to 74 Years | 230 (5.7%) | 301 (7.7%) |
| 75 to 79 Years | 112 (2.8%) | 53 (1.4%) |
| 80 to 84 Years | 72 (1.8%) | 78 (2.0%) |
| 85 Years and over | 16 (0.4%) | 114 (2.9%) |
| Total | 4,051 (100.0%) | 3,894 (100.0%) |
Families and Households in Barberton
Median Family Size in Barberton
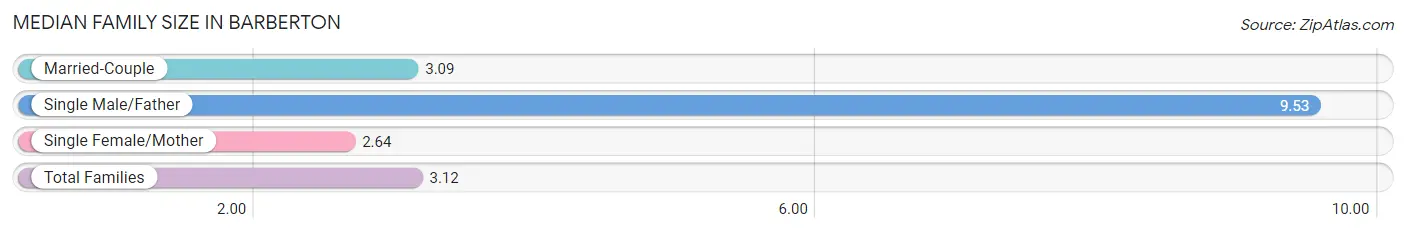
The median family size in Barberton is 3.12 persons per family, with single male/father families (32 | 1.4%) accounting for the largest median family size of 9.53 persons per family. On the other hand, single female/mother families (295 | 13.0%) represent the smallest median family size with 2.64 persons per family.
| Family Type | # Families | Family Size |
| Married-Couple | 1,947 (85.6%) | 3.09 |
| Single Male/Father | 32 (1.4%) | 9.53 |
| Single Female/Mother | 295 (13.0%) | 2.64 |
| Total Families | 2,274 (100.0%) | 3.12 |
Median Household Size in Barberton
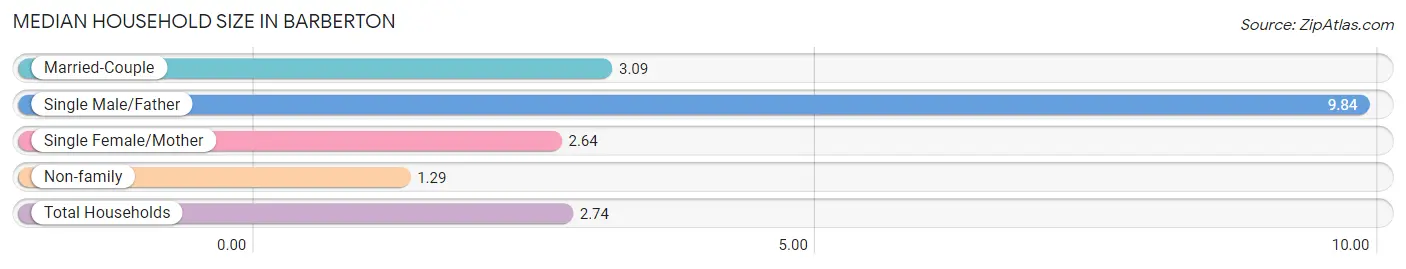
The median household size in Barberton is 2.74 persons per household, with single male/father households (32 | 1.1%) accounting for the largest median household size of 9.84 persons per household. non-family households (616 | 21.3%) represent the smallest median household size with 1.29 persons per household.
| Household Type | # Households | Household Size |
| Married-Couple | 1,947 (67.4%) | 3.09 |
| Single Male/Father | 32 (1.1%) | 9.84 |
| Single Female/Mother | 295 (10.2%) | 2.64 |
| Non-family | 616 (21.3%) | 1.29 |
| Total Households | 2,890 (100.0%) | 2.74 |
Household Size by Marriage Status in Barberton
Out of a total of 2,890 households in Barberton, 2,274 (78.7%) are family households, while 616 (21.3%) are nonfamily households. The most numerous type of family households are 2-person households, comprising 1,232, and the most common type of nonfamily households are 1-person households, comprising 446.
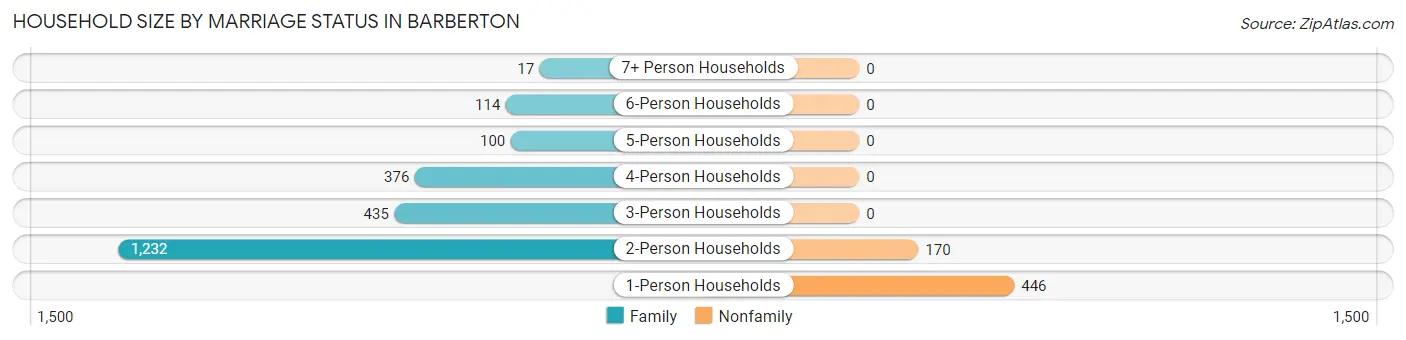
| Household Size | Family Households | Nonfamily Households |
| 1-Person Households | - | 446 (15.4%) |
| 2-Person Households | 1,232 (42.6%) | 170 (5.9%) |
| 3-Person Households | 435 (15.0%) | 0 (0.0%) |
| 4-Person Households | 376 (13.0%) | 0 (0.0%) |
| 5-Person Households | 100 (3.5%) | 0 (0.0%) |
| 6-Person Households | 114 (3.9%) | 0 (0.0%) |
| 7+ Person Households | 17 (0.6%) | 0 (0.0%) |
| Total | 2,274 (78.7%) | 616 (21.3%) |
Female Fertility in Barberton
Fertility by Age in Barberton
Average fertility rate in Barberton is 18.0 births per 1,000 women. Women in the age bracket of 20 to 34 years have the highest fertility rate with 26.0 births per 1,000 women. Women in the age bracket of 20 to 34 years acount for 55.2% of all women with births.
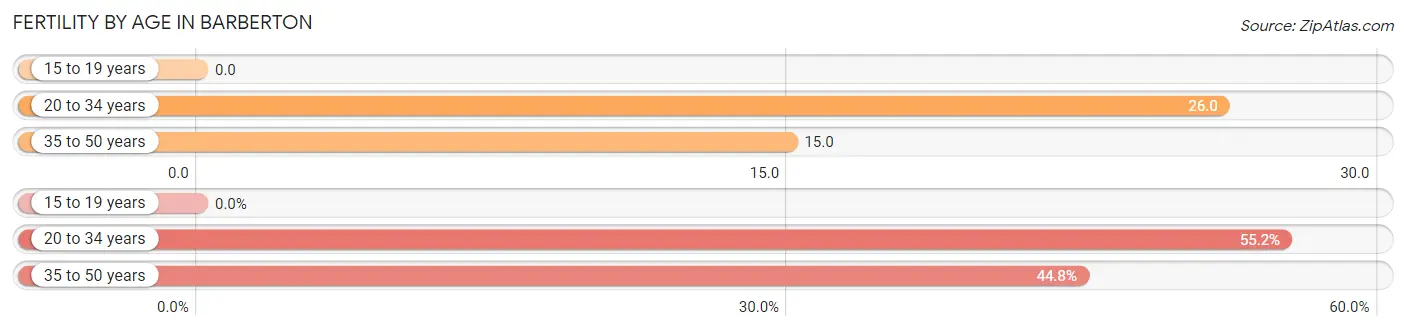
| Age Bracket | Women with Births | Births / 1,000 Women |
| 15 to 19 years | 0 (0.0%) | 0.0 |
| 20 to 34 years | 16 (55.2%) | 26.0 |
| 35 to 50 years | 13 (44.8%) | 15.0 |
| Total | 29 (100.0%) | 18.0 |
Fertility by Age by Marriage Status in Barberton
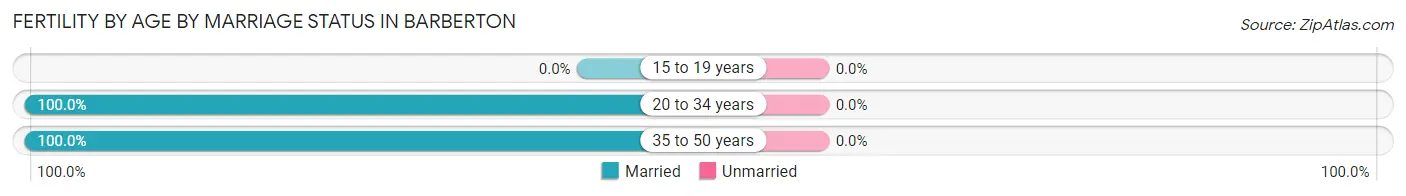
| Age Bracket | Married | Unmarried |
| 15 to 19 years | 0 (0.0%) | 0 (0.0%) |
| 20 to 34 years | 16 (100.0%) | 0 (0.0%) |
| 35 to 50 years | 13 (100.0%) | 0 (0.0%) |
| Total | 29 (100.0%) | 0 (0.0%) |
Fertility by Education in Barberton
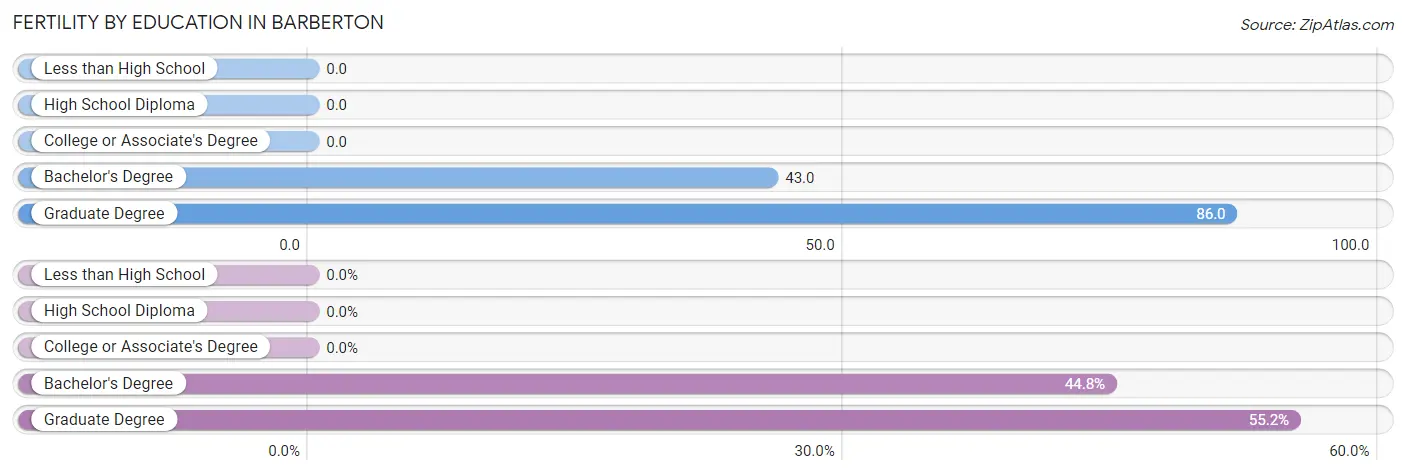
| Educational Attainment | Women with Births | Births / 1,000 Women |
| Less than High School | 0 (0.0%) | 0.0 |
| High School Diploma | 0 (0.0%) | 0.0 |
| College or Associate's Degree | 0 (0.0%) | 0.0 |
| Bachelor's Degree | 13 (44.8%) | 43.0 |
| Graduate Degree | 16 (55.2%) | 86.0 |
| Total | 29 (100.0%) | 18.0 |
Fertility by Education by Marriage Status in Barberton
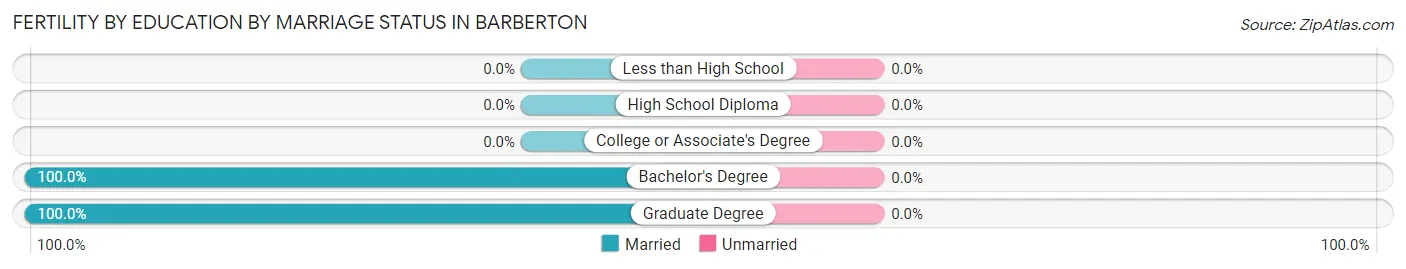
| Educational Attainment | Married | Unmarried |
| Less than High School | 0 (0.0%) | 0 (0.0%) |
| High School Diploma | 0 (0.0%) | 0 (0.0%) |
| College or Associate's Degree | 0 (0.0%) | 0 (0.0%) |
| Bachelor's Degree | 13 (100.0%) | 0 (0.0%) |
| Graduate Degree | 16 (100.0%) | 0 (0.0%) |
| Total | 29 (100.0%) | 0 (0.0%) |
Employment Characteristics in Barberton
Employment by Class of Employer in Barberton
Among the 3,741 employed individuals in Barberton, private company employees (2,398 | 64.1%), local government employees (337 | 9.0%), and self-employed (not incorporated) (331 | 8.8%) make up the most common classes of employment.
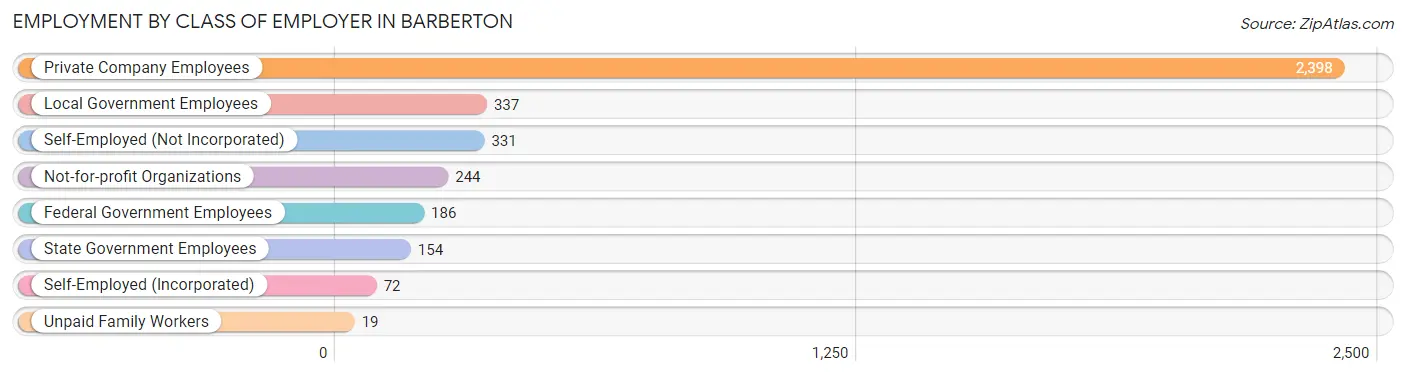
| Employer Class | # Employees | % Employees |
| Private Company Employees | 2,398 | 64.1% |
| Self-Employed (Incorporated) | 72 | 1.9% |
| Self-Employed (Not Incorporated) | 331 | 8.8% |
| Not-for-profit Organizations | 244 | 6.5% |
| Local Government Employees | 337 | 9.0% |
| State Government Employees | 154 | 4.1% |
| Federal Government Employees | 186 | 5.0% |
| Unpaid Family Workers | 19 | 0.5% |
| Total | 3,741 | 100.0% |
Employment Status by Age in Barberton
According to the labor force statistics for Barberton, out of the total population over 16 years of age (6,708), 60.2% or 4,038 individuals are in the labor force, with 4.7% or 190 of them unemployed. The age group with the highest labor force participation rate is 25 to 29 years, with 92.3% or 323 individuals in the labor force. Within the labor force, the 16 to 19 years age range has the highest percentage of unemployed individuals, with 36.4% or 36 of them being unemployed.
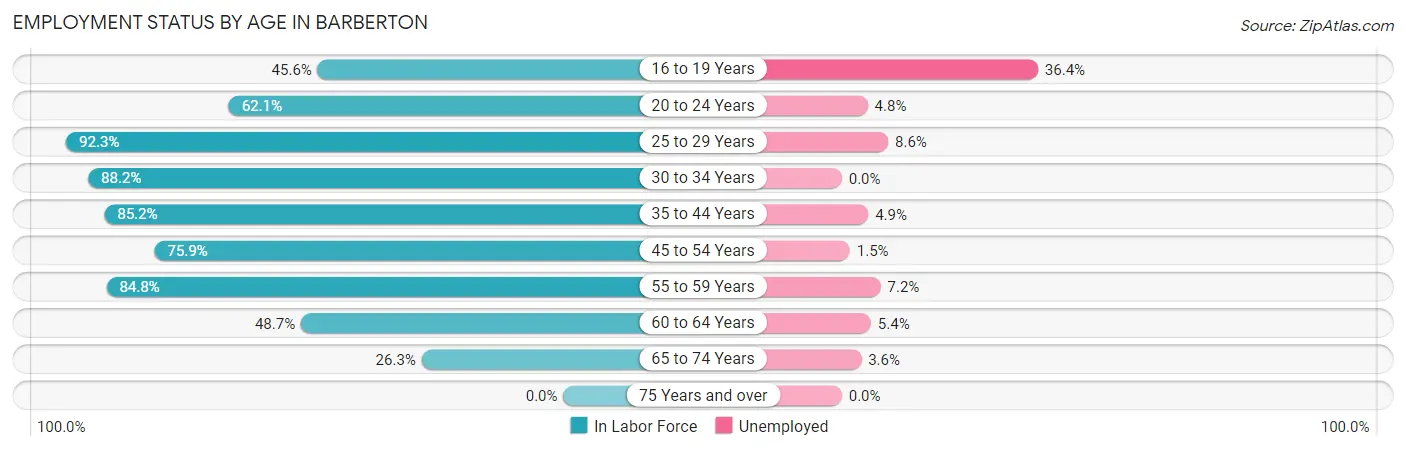
| Age Bracket | In Labor Force | Unemployed |
| 16 to 19 Years | 99 (45.6%) | 36 (36.4%) |
| 20 to 24 Years | 484 (62.1%) | 23 (4.8%) |
| 25 to 29 Years | 323 (92.3%) | 28 (8.6%) |
| 30 to 34 Years | 485 (88.2%) | 0 (0.0%) |
| 35 to 44 Years | 873 (85.2%) | 43 (4.9%) |
| 45 to 54 Years | 912 (75.9%) | 14 (1.5%) |
| 55 to 59 Years | 251 (84.8%) | 18 (7.2%) |
| 60 to 64 Years | 279 (48.7%) | 15 (5.4%) |
| 65 to 74 Years | 334 (26.3%) | 12 (3.6%) |
| 75 Years and over | 0 (0.0%) | 0 (0.0%) |
| Total | 4,038 (60.2%) | 190 (4.7%) |
Employment Status by Educational Attainment in Barberton
According to labor force statistics for Barberton, 78.2% of individuals (3,124) out of the total population between 25 and 64 years of age (3,995) are in the labor force, with 3.7% or 116 of them being unemployed. The group with the highest labor force participation rate are those with the educational attainment of bachelor's degree or higher, with 86.4% or 1,062 individuals in the labor force. Within the labor force, individuals with bachelor's degree or higher education have the highest percentage of unemployment, with 4.1% or 44 of them being unemployed.
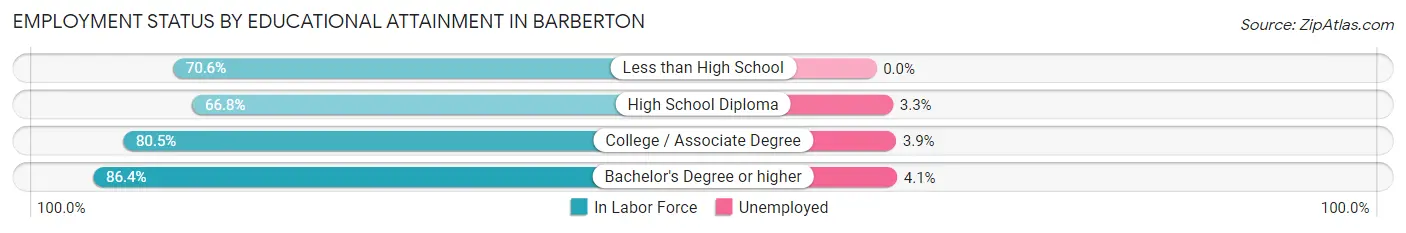
| Educational Attainment | In Labor Force | Unemployed |
| Less than High School | 60 (70.6%) | 0 (0.0%) |
| High School Diploma | 765 (66.8%) | 38 (3.3%) |
| College / Associate Degree | 1,236 (80.5%) | 60 (3.9%) |
| Bachelor's Degree or higher | 1,062 (86.4%) | 50 (4.1%) |
| Total | 3,124 (78.2%) | 148 (3.7%) |
Employment Occupations by Sex in Barberton
Management, Business, Science and Arts Occupations
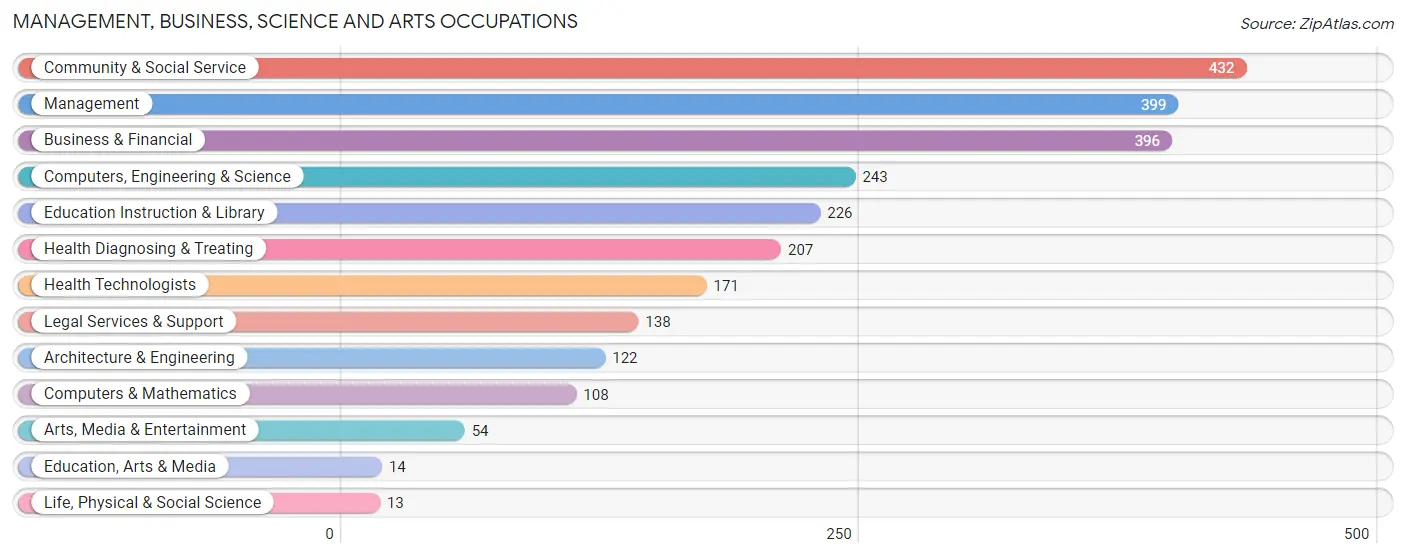
The most common Management, Business, Science and Arts occupations in Barberton are Community & Social Service (432 | 11.3%), Management (399 | 10.4%), Business & Financial (396 | 10.3%), Computers, Engineering & Science (243 | 6.3%), and Education Instruction & Library (226 | 5.9%).
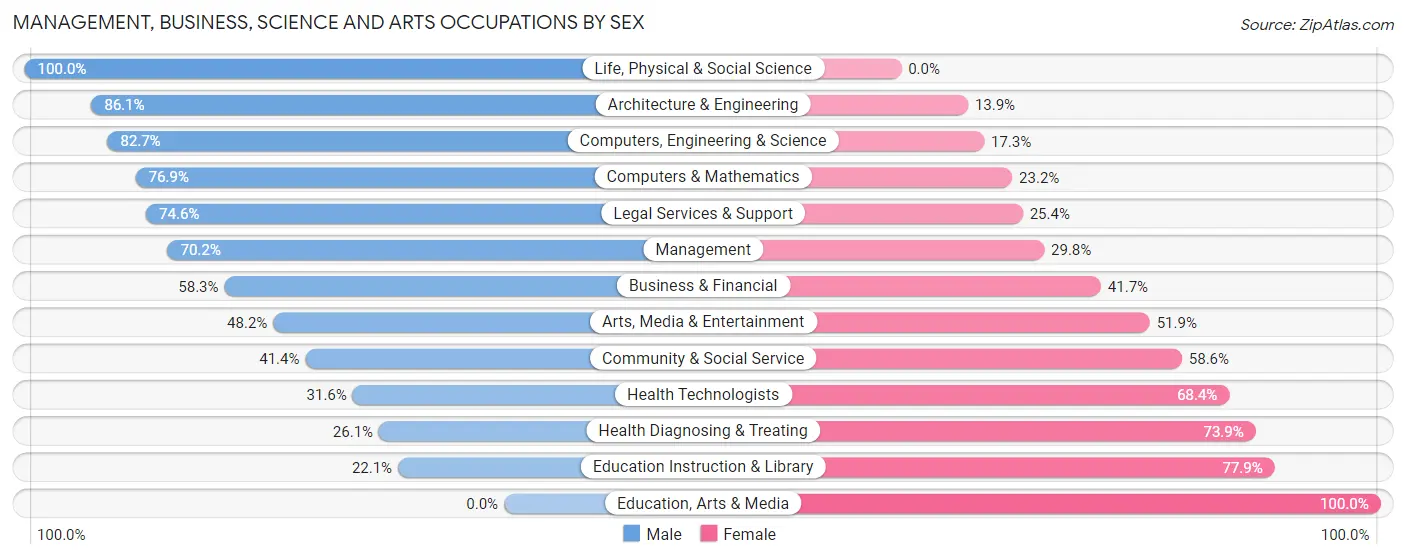
Management, Business, Science and Arts Occupations by Sex
Within the Management, Business, Science and Arts occupations in Barberton, the most male-oriented occupations are Life, Physical & Social Science (100.0%), Architecture & Engineering (86.1%), and Computers, Engineering & Science (82.7%), while the most female-oriented occupations are Education, Arts & Media (100.0%), Education Instruction & Library (77.9%), and Health Diagnosing & Treating (73.9%).
| Occupation | Male | Female |
| Management | 280 (70.2%) | 119 (29.8%) |
| Business & Financial | 231 (58.3%) | 165 (41.7%) |
| Computers, Engineering & Science | 201 (82.7%) | 42 (17.3%) |
| Computers & Mathematics | 83 (76.8%) | 25 (23.2%) |
| Architecture & Engineering | 105 (86.1%) | 17 (13.9%) |
| Life, Physical & Social Science | 13 (100.0%) | 0 (0.0%) |
| Community & Social Service | 179 (41.4%) | 253 (58.6%) |
| Education, Arts & Media | 0 (0.0%) | 14 (100.0%) |
| Legal Services & Support | 103 (74.6%) | 35 (25.4%) |
| Education Instruction & Library | 50 (22.1%) | 176 (77.9%) |
| Arts, Media & Entertainment | 26 (48.1%) | 28 (51.8%) |
| Health Diagnosing & Treating | 54 (26.1%) | 153 (73.9%) |
| Health Technologists | 54 (31.6%) | 117 (68.4%) |
| Total (Category) | 945 (56.4%) | 732 (43.6%) |
| Total (Overall) | 2,232 (58.2%) | 1,601 (41.8%) |
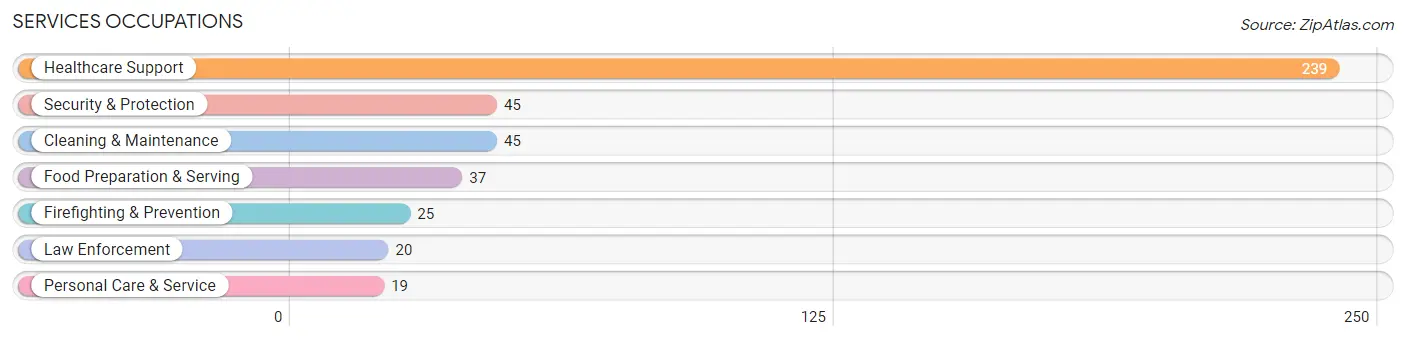
Services Occupations
The most common Services occupations in Barberton are Healthcare Support (239 | 6.2%), Security & Protection (45 | 1.2%), Cleaning & Maintenance (45 | 1.2%), Food Preparation & Serving (37 | 1.0%), and Firefighting & Prevention (25 | 0.6%).
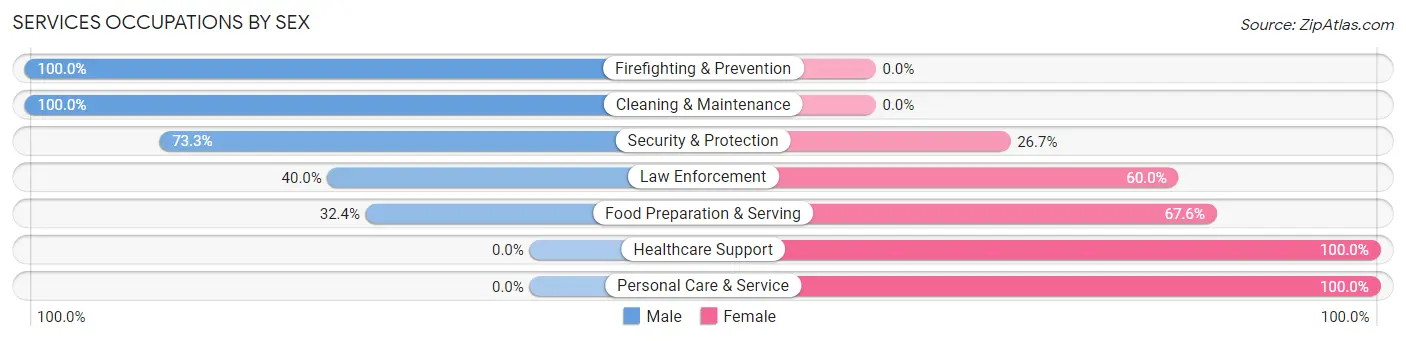
Services Occupations by Sex
Within the Services occupations in Barberton, the most male-oriented occupations are Firefighting & Prevention (100.0%), Cleaning & Maintenance (100.0%), and Security & Protection (73.3%), while the most female-oriented occupations are Healthcare Support (100.0%), Personal Care & Service (100.0%), and Food Preparation & Serving (67.6%).
| Occupation | Male | Female |
| Healthcare Support | 0 (0.0%) | 239 (100.0%) |
| Security & Protection | 33 (73.3%) | 12 (26.7%) |
| Firefighting & Prevention | 25 (100.0%) | 0 (0.0%) |
| Law Enforcement | 8 (40.0%) | 12 (60.0%) |
| Food Preparation & Serving | 12 (32.4%) | 25 (67.6%) |
| Cleaning & Maintenance | 45 (100.0%) | 0 (0.0%) |
| Personal Care & Service | 0 (0.0%) | 19 (100.0%) |
| Total (Category) | 90 (23.4%) | 295 (76.6%) |
| Total (Overall) | 2,232 (58.2%) | 1,601 (41.8%) |
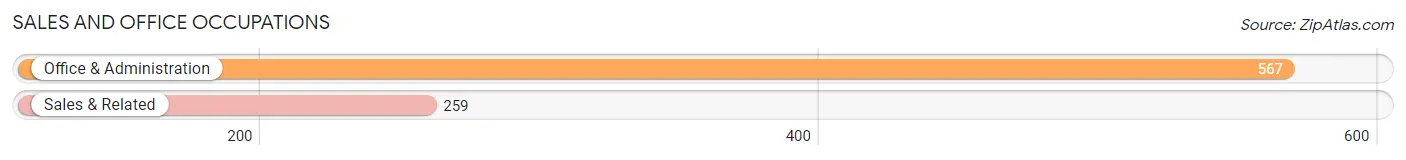
Sales and Office Occupations
The most common Sales and Office occupations in Barberton are Office & Administration (567 | 14.8%), and Sales & Related (259 | 6.8%).
Sales and Office Occupations by Sex
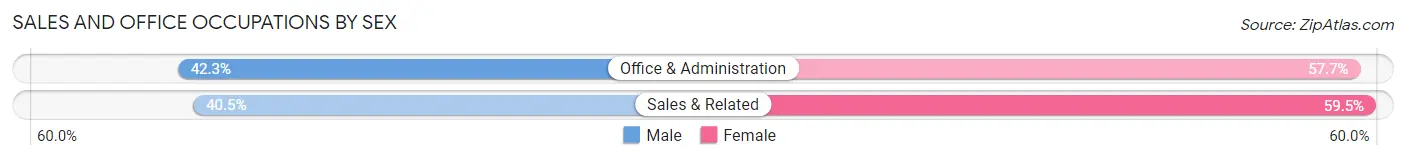
| Occupation | Male | Female |
| Sales & Related | 105 (40.5%) | 154 (59.5%) |
| Office & Administration | 240 (42.3%) | 327 (57.7%) |
| Total (Category) | 345 (41.8%) | 481 (58.2%) |
| Total (Overall) | 2,232 (58.2%) | 1,601 (41.8%) |
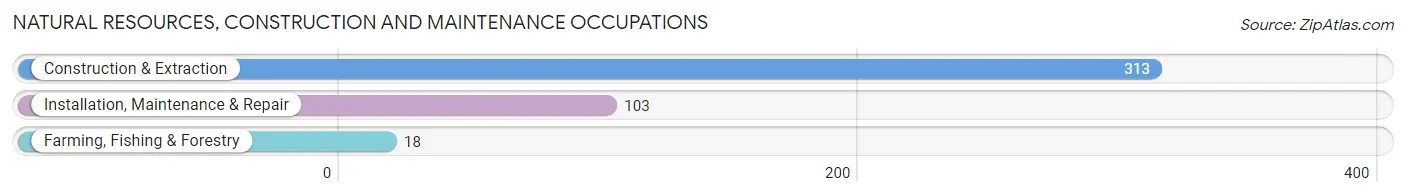
Natural Resources, Construction and Maintenance Occupations
The most common Natural Resources, Construction and Maintenance occupations in Barberton are Construction & Extraction (313 | 8.2%), Installation, Maintenance & Repair (103 | 2.7%), and Farming, Fishing & Forestry (18 | 0.5%).
Natural Resources, Construction and Maintenance Occupations by Sex
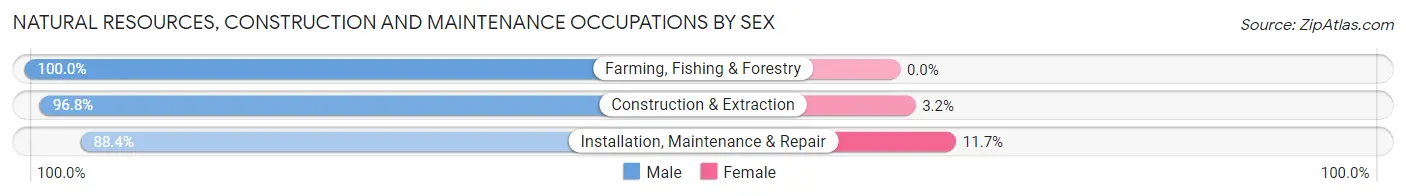
| Occupation | Male | Female |
| Farming, Fishing & Forestry | 18 (100.0%) | 0 (0.0%) |
| Construction & Extraction | 303 (96.8%) | 10 (3.2%) |
| Installation, Maintenance & Repair | 91 (88.3%) | 12 (11.7%) |
| Total (Category) | 412 (94.9%) | 22 (5.1%) |
| Total (Overall) | 2,232 (58.2%) | 1,601 (41.8%) |
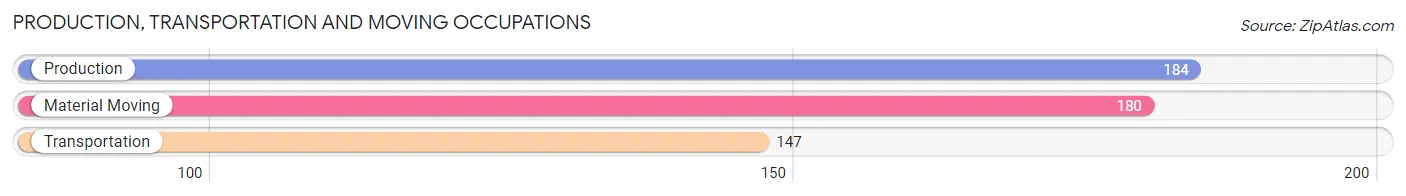
Production, Transportation and Moving Occupations
The most common Production, Transportation and Moving occupations in Barberton are Production (184 | 4.8%), Material Moving (180 | 4.7%), and Transportation (147 | 3.8%).
Production, Transportation and Moving Occupations by Sex
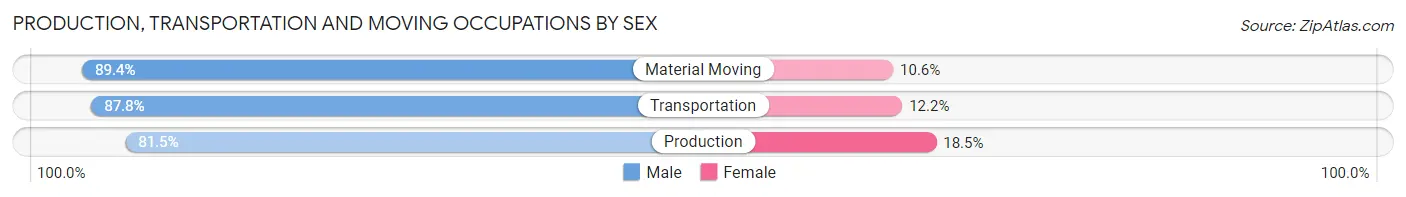
| Occupation | Male | Female |
| Production | 150 (81.5%) | 34 (18.5%) |
| Transportation | 129 (87.8%) | 18 (12.2%) |
| Material Moving | 161 (89.4%) | 19 (10.6%) |
| Total (Category) | 440 (86.1%) | 71 (13.9%) |
| Total (Overall) | 2,232 (58.2%) | 1,601 (41.8%) |
Employment Industries by Sex in Barberton
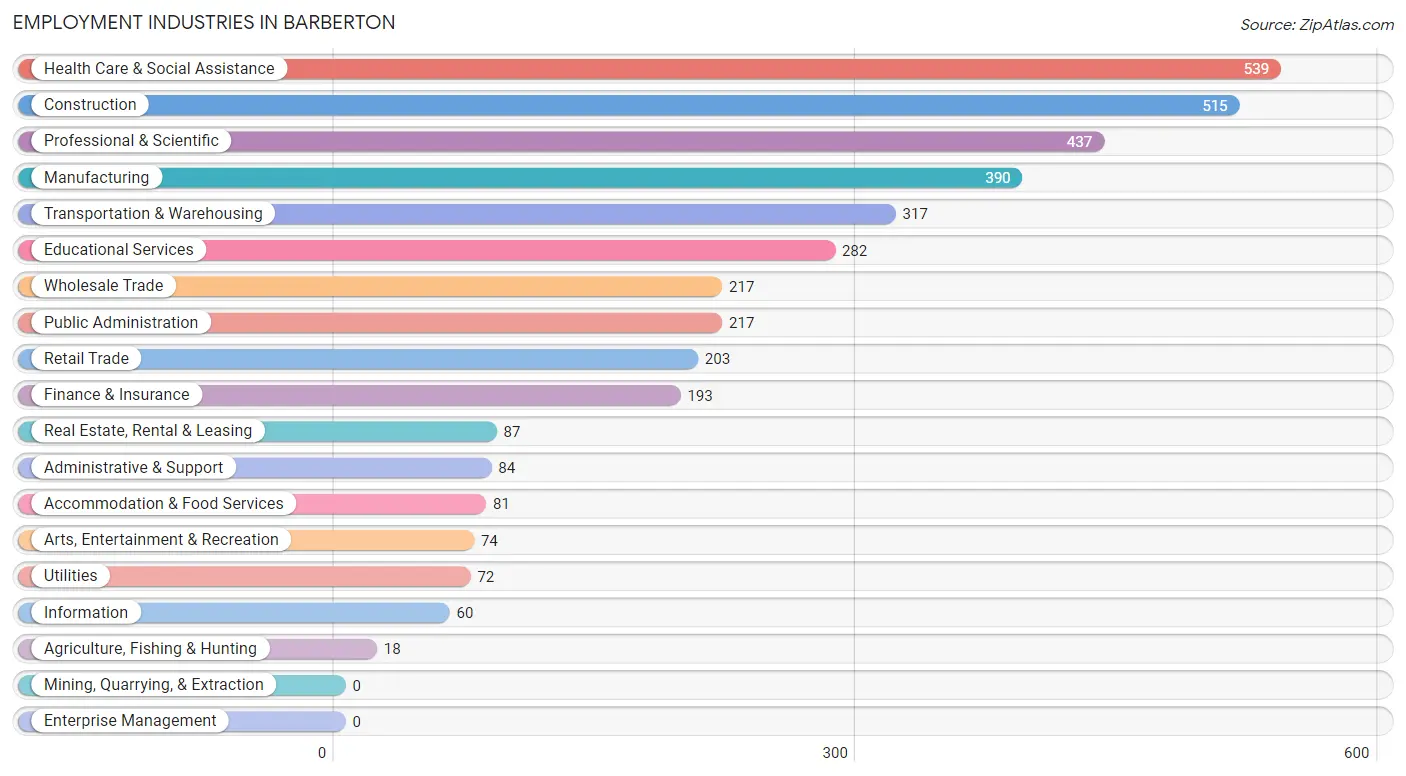
Employment Industries in Barberton
The major employment industries in Barberton include Health Care & Social Assistance (539 | 14.1%), Construction (515 | 13.4%), Professional & Scientific (437 | 11.4%), Manufacturing (390 | 10.2%), and Transportation & Warehousing (317 | 8.3%).
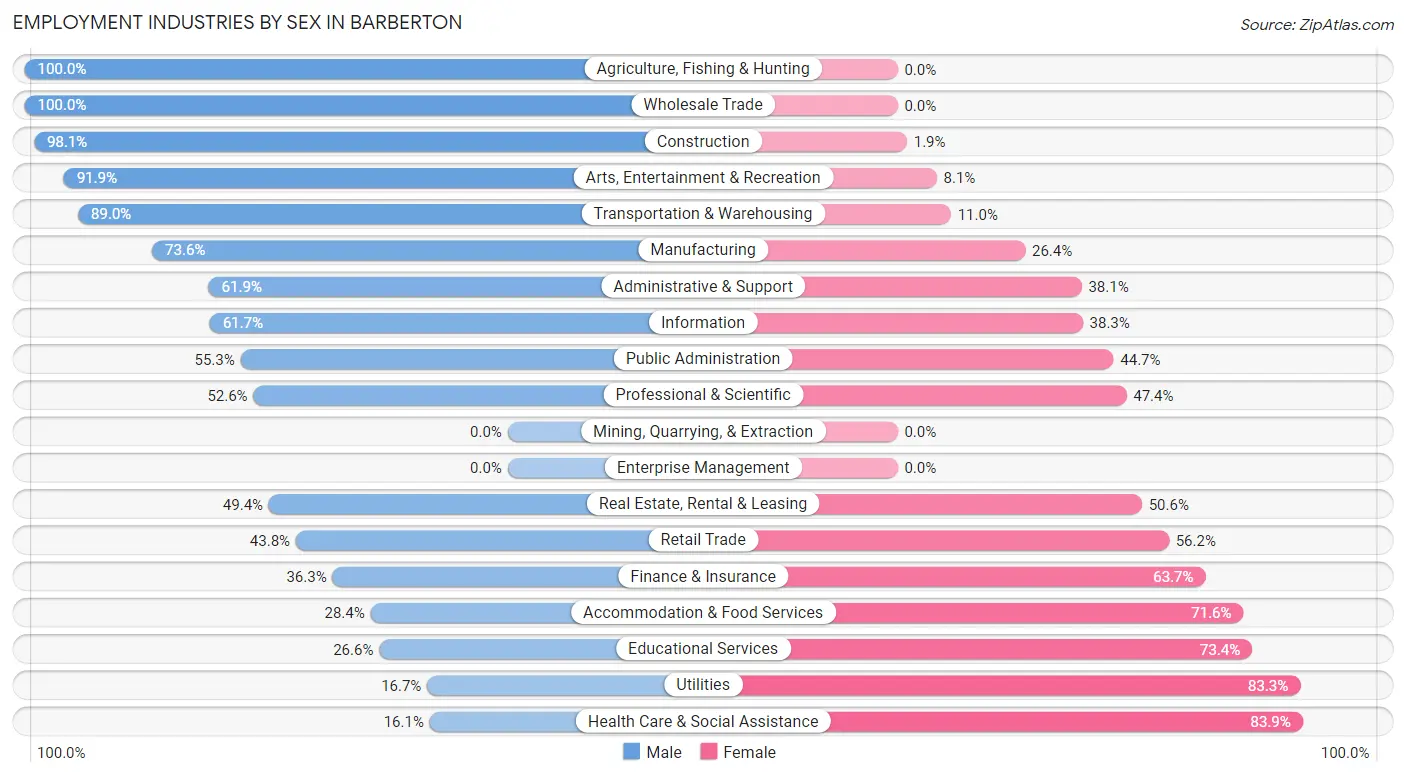
Employment Industries by Sex in Barberton
The Barberton industries that see more men than women are Agriculture, Fishing & Hunting (100.0%), Wholesale Trade (100.0%), and Construction (98.1%), whereas the industries that tend to have a higher number of women are Health Care & Social Assistance (83.9%), Utilities (83.3%), and Educational Services (73.4%).
| Industry | Male | Female |
| Agriculture, Fishing & Hunting | 18 (100.0%) | 0 (0.0%) |
| Mining, Quarrying, & Extraction | 0 (0.0%) | 0 (0.0%) |
| Construction | 505 (98.1%) | 10 (1.9%) |
| Manufacturing | 287 (73.6%) | 103 (26.4%) |
| Wholesale Trade | 217 (100.0%) | 0 (0.0%) |
| Retail Trade | 89 (43.8%) | 114 (56.2%) |
| Transportation & Warehousing | 282 (89.0%) | 35 (11.0%) |
| Utilities | 12 (16.7%) | 60 (83.3%) |
| Information | 37 (61.7%) | 23 (38.3%) |
| Finance & Insurance | 70 (36.3%) | 123 (63.7%) |
| Real Estate, Rental & Leasing | 43 (49.4%) | 44 (50.6%) |
| Professional & Scientific | 230 (52.6%) | 207 (47.4%) |
| Enterprise Management | 0 (0.0%) | 0 (0.0%) |
| Administrative & Support | 52 (61.9%) | 32 (38.1%) |
| Educational Services | 75 (26.6%) | 207 (73.4%) |
| Health Care & Social Assistance | 87 (16.1%) | 452 (83.9%) |
| Arts, Entertainment & Recreation | 68 (91.9%) | 6 (8.1%) |
| Accommodation & Food Services | 23 (28.4%) | 58 (71.6%) |
| Public Administration | 120 (55.3%) | 97 (44.7%) |
| Total | 2,232 (58.2%) | 1,601 (41.8%) |
Education in Barberton
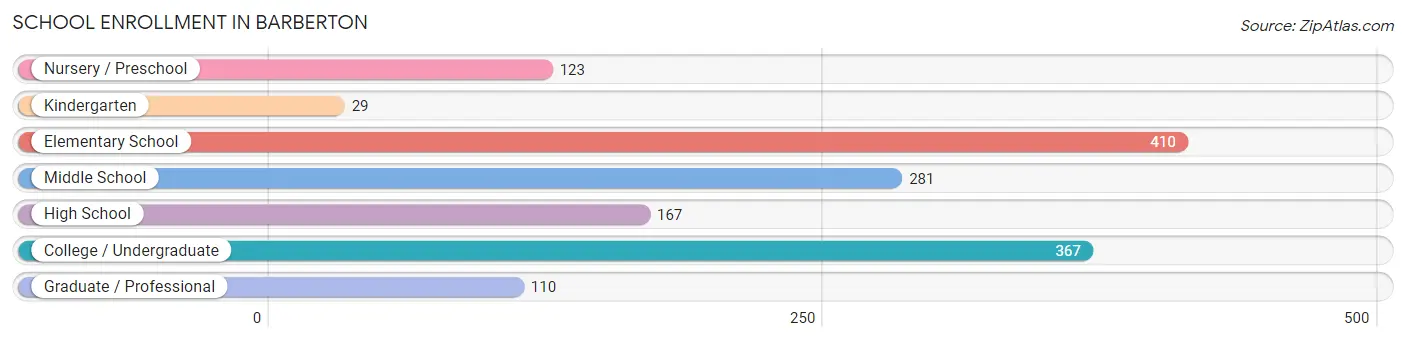
School Enrollment in Barberton
The most common levels of schooling among the 1,487 students in Barberton are elementary school (410 | 27.6%), college / undergraduate (367 | 24.7%), and middle school (281 | 18.9%).
| School Level | # Students | % Students |
| Nursery / Preschool | 123 | 8.3% |
| Kindergarten | 29 | 1.9% |
| Elementary School | 410 | 27.6% |
| Middle School | 281 | 18.9% |
| High School | 167 | 11.2% |
| College / Undergraduate | 367 | 24.7% |
| Graduate / Professional | 110 | 7.4% |
| Total | 1,487 | 100.0% |
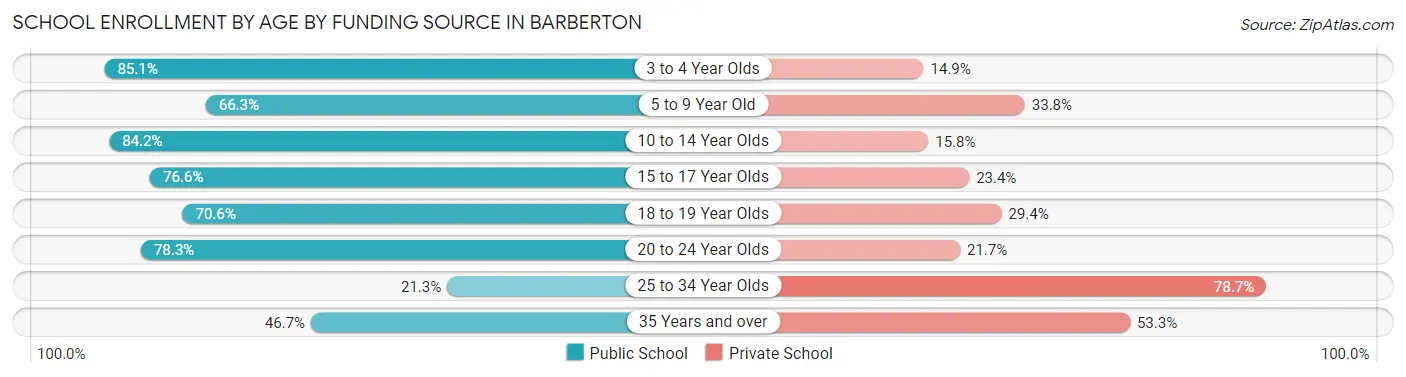
School Enrollment by Age by Funding Source in Barberton
Out of a total of 1,487 students who are enrolled in schools in Barberton, 410 (27.6%) attend a private institution, while the remaining 1,077 (72.4%) are enrolled in public schools. The age group of 25 to 34 year olds has the highest likelihood of being enrolled in private schools, with 48 (78.7% in the age bracket) enrolled. Conversely, the age group of 3 to 4 year olds has the lowest likelihood of being enrolled in a private school, with 80 (85.1% in the age bracket) attending a public institution.
| Age Bracket | Public School | Private School |
| 3 to 4 Year Olds | 80 (85.1%) | 14 (14.9%) |
| 5 to 9 Year Old | 265 (66.2%) | 135 (33.8%) |
| 10 to 14 Year Olds | 294 (84.2%) | 55 (15.8%) |
| 15 to 17 Year Olds | 118 (76.6%) | 36 (23.4%) |
| 18 to 19 Year Olds | 48 (70.6%) | 20 (29.4%) |
| 20 to 24 Year Olds | 224 (78.3%) | 62 (21.7%) |
| 25 to 34 Year Olds | 13 (21.3%) | 48 (78.7%) |
| 35 Years and over | 35 (46.7%) | 40 (53.3%) |
| Total | 1,077 (72.4%) | 410 (27.6%) |
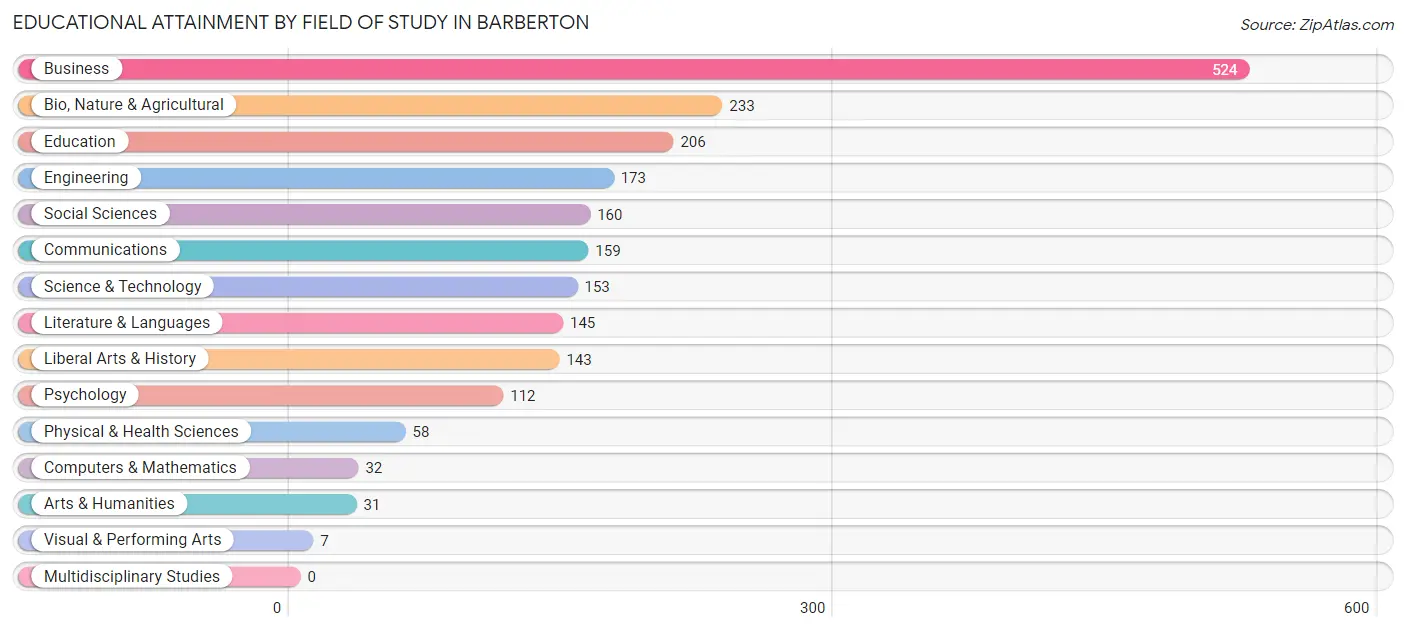
Educational Attainment by Field of Study in Barberton
Business (524 | 24.5%), bio, nature & agricultural (233 | 10.9%), education (206 | 9.6%), engineering (173 | 8.1%), and social sciences (160 | 7.5%) are the most common fields of study among 2,136 individuals in Barberton who have obtained a bachelor's degree or higher.
| Field of Study | # Graduates | % Graduates |
| Computers & Mathematics | 32 | 1.5% |
| Bio, Nature & Agricultural | 233 | 10.9% |
| Physical & Health Sciences | 58 | 2.7% |
| Psychology | 112 | 5.2% |
| Social Sciences | 160 | 7.5% |
| Engineering | 173 | 8.1% |
| Multidisciplinary Studies | 0 | 0.0% |
| Science & Technology | 153 | 7.2% |
| Business | 524 | 24.5% |
| Education | 206 | 9.6% |
| Literature & Languages | 145 | 6.8% |
| Liberal Arts & History | 143 | 6.7% |
| Visual & Performing Arts | 7 | 0.3% |
| Communications | 159 | 7.4% |
| Arts & Humanities | 31 | 1.5% |
| Total | 2,136 | 100.0% |
Transportation & Commute in Barberton
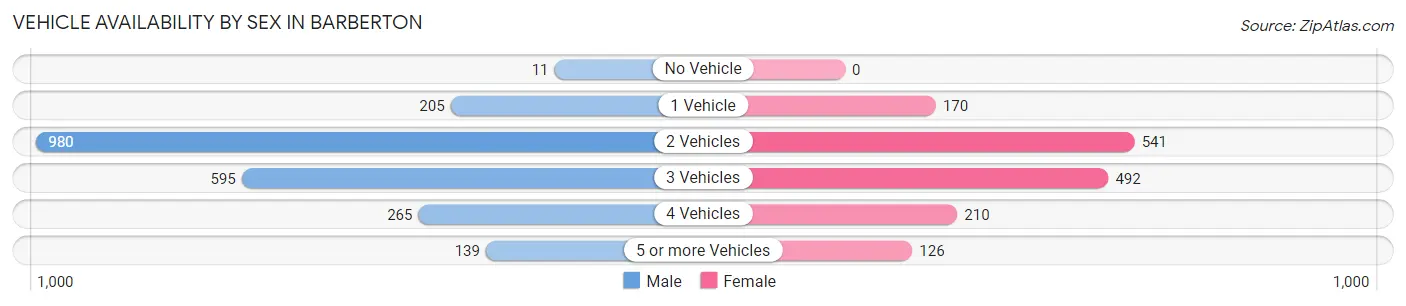
Vehicle Availability by Sex in Barberton
The most prevalent vehicle ownership categories in Barberton are males with 2 vehicles (980, accounting for 44.7%) and females with 2 vehicles (541, making up 63.7%).
| Vehicles Available | Male | Female |
| No Vehicle | 11 (0.5%) | 0 (0.0%) |
| 1 Vehicle | 205 (9.3%) | 170 (11.1%) |
| 2 Vehicles | 980 (44.7%) | 541 (35.1%) |
| 3 Vehicles | 595 (27.1%) | 492 (32.0%) |
| 4 Vehicles | 265 (12.1%) | 210 (13.7%) |
| 5 or more Vehicles | 139 (6.3%) | 126 (8.2%) |
| Total | 2,195 (100.0%) | 1,539 (100.0%) |
Commute Time in Barberton
The most frequently occuring commute durations in Barberton are 30 to 34 minutes (574 commuters, 18.8%), 15 to 19 minutes (562 commuters, 18.4%), and 20 to 24 minutes (500 commuters, 16.4%).
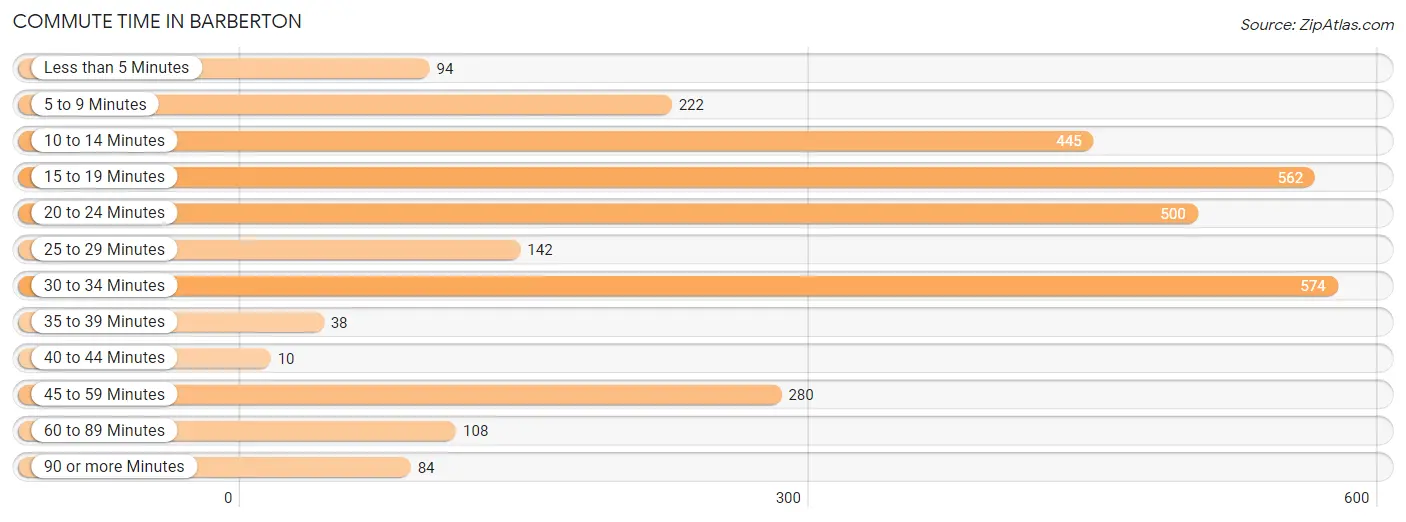
| Commute Time | # Commuters | % Commuters |
| Less than 5 Minutes | 94 | 3.1% |
| 5 to 9 Minutes | 222 | 7.3% |
| 10 to 14 Minutes | 445 | 14.5% |
| 15 to 19 Minutes | 562 | 18.4% |
| 20 to 24 Minutes | 500 | 16.4% |
| 25 to 29 Minutes | 142 | 4.6% |
| 30 to 34 Minutes | 574 | 18.8% |
| 35 to 39 Minutes | 38 | 1.2% |
| 40 to 44 Minutes | 10 | 0.3% |
| 45 to 59 Minutes | 280 | 9.1% |
| 60 to 89 Minutes | 108 | 3.5% |
| 90 or more Minutes | 84 | 2.8% |
Commute Time by Sex in Barberton
The most common commute times in Barberton are 30 to 34 minutes (475 commuters, 25.3%) for males and 15 to 19 minutes (289 commuters, 24.5%) for females.
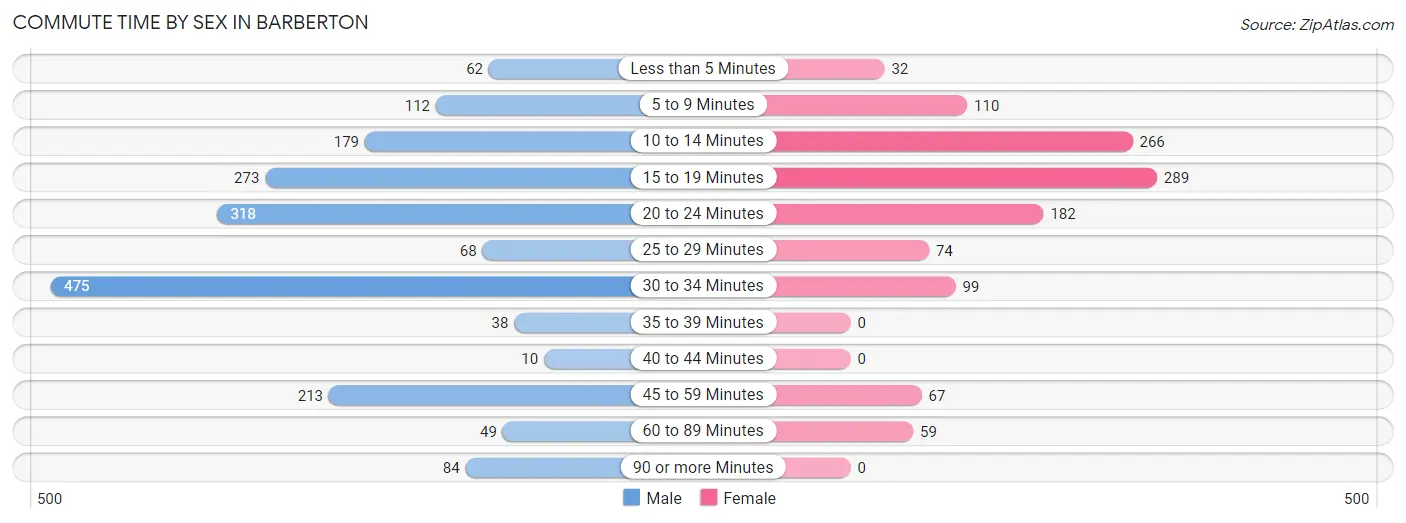
| Commute Time | Male | Female |
| Less than 5 Minutes | 62 (3.3%) | 32 (2.7%) |
| 5 to 9 Minutes | 112 (5.9%) | 110 (9.3%) |
| 10 to 14 Minutes | 179 (9.5%) | 266 (22.6%) |
| 15 to 19 Minutes | 273 (14.5%) | 289 (24.5%) |
| 20 to 24 Minutes | 318 (16.9%) | 182 (15.4%) |
| 25 to 29 Minutes | 68 (3.6%) | 74 (6.3%) |
| 30 to 34 Minutes | 475 (25.3%) | 99 (8.4%) |
| 35 to 39 Minutes | 38 (2.0%) | 0 (0.0%) |
| 40 to 44 Minutes | 10 (0.5%) | 0 (0.0%) |
| 45 to 59 Minutes | 213 (11.3%) | 67 (5.7%) |
| 60 to 89 Minutes | 49 (2.6%) | 59 (5.0%) |
| 90 or more Minutes | 84 (4.5%) | 0 (0.0%) |
Time of Departure to Work by Sex in Barberton
The most frequent times of departure to work in Barberton are 5:30 AM to 5:59 AM (288, 15.3%) for males and 7:00 AM to 7:29 AM (235, 20.0%) for females.
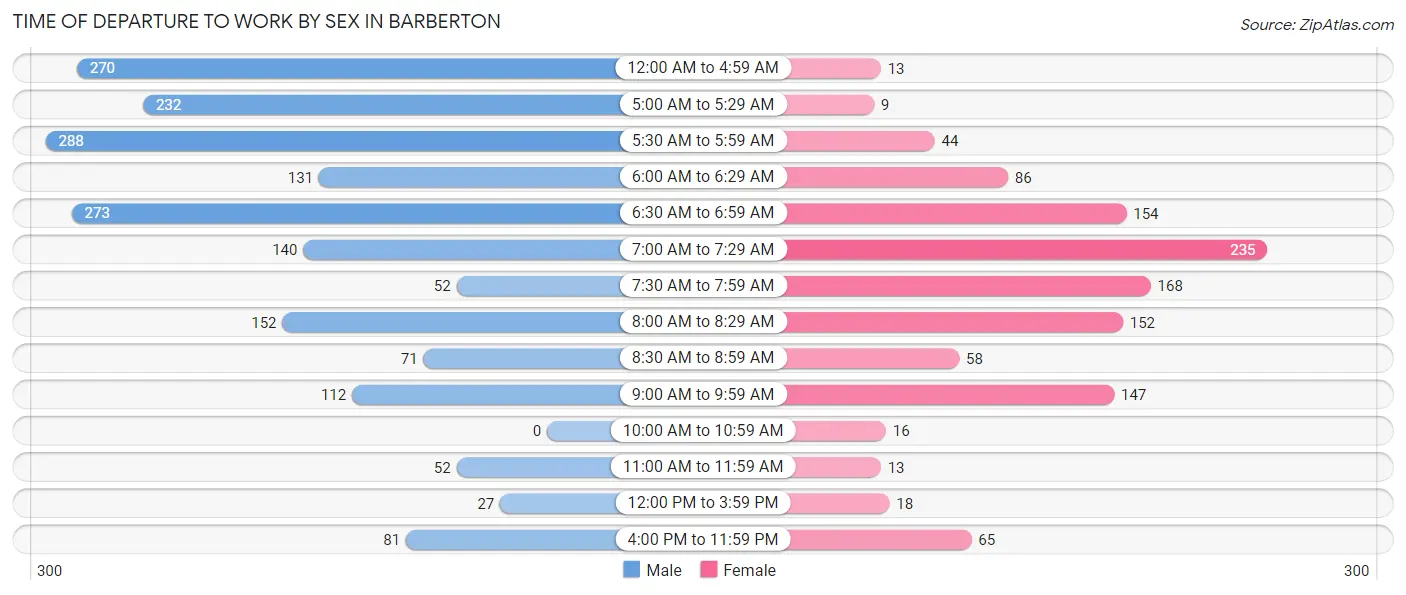
| Time of Departure | Male | Female |
| 12:00 AM to 4:59 AM | 270 (14.3%) | 13 (1.1%) |
| 5:00 AM to 5:29 AM | 232 (12.3%) | 9 (0.8%) |
| 5:30 AM to 5:59 AM | 288 (15.3%) | 44 (3.7%) |
| 6:00 AM to 6:29 AM | 131 (7.0%) | 86 (7.3%) |
| 6:30 AM to 6:59 AM | 273 (14.5%) | 154 (13.1%) |
| 7:00 AM to 7:29 AM | 140 (7.4%) | 235 (20.0%) |
| 7:30 AM to 7:59 AM | 52 (2.8%) | 168 (14.3%) |
| 8:00 AM to 8:29 AM | 152 (8.1%) | 152 (12.9%) |
| 8:30 AM to 8:59 AM | 71 (3.8%) | 58 (4.9%) |
| 9:00 AM to 9:59 AM | 112 (5.9%) | 147 (12.5%) |
| 10:00 AM to 10:59 AM | 0 (0.0%) | 16 (1.4%) |
| 11:00 AM to 11:59 AM | 52 (2.8%) | 13 (1.1%) |
| 12:00 PM to 3:59 PM | 27 (1.4%) | 18 (1.5%) |
| 4:00 PM to 11:59 PM | 81 (4.3%) | 65 (5.5%) |
| Total | 1,881 (100.0%) | 1,178 (100.0%) |
Housing Occupancy in Barberton
Occupancy by Ownership in Barberton
Of the total 2,890 dwellings in Barberton, owner-occupied units account for 2,466 (85.3%), while renter-occupied units make up 424 (14.7%).
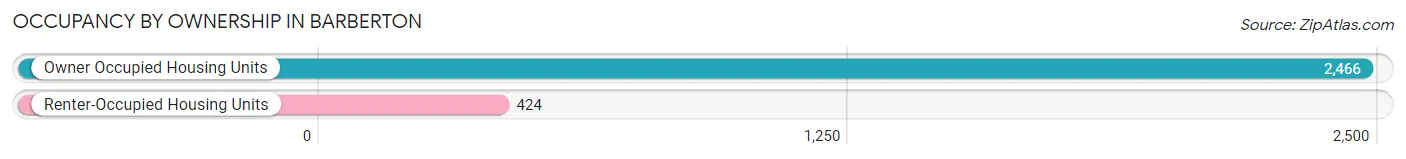
| Occupancy | # Housing Units | % Housing Units |
| Owner Occupied Housing Units | 2,466 | 85.3% |
| Renter-Occupied Housing Units | 424 | 14.7% |
| Total Occupied Housing Units | 2,890 | 100.0% |
Occupancy by Household Size in Barberton
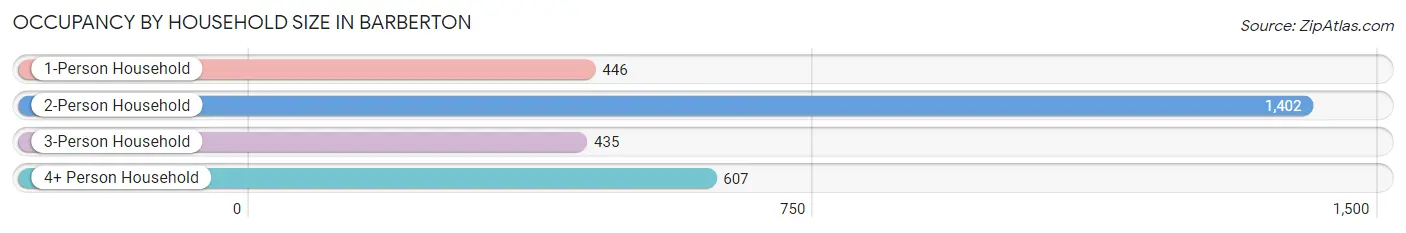
| Household Size | # Housing Units | % Housing Units |
| 1-Person Household | 446 | 15.4% |
| 2-Person Household | 1,402 | 48.5% |
| 3-Person Household | 435 | 15.0% |
| 4+ Person Household | 607 | 21.0% |
| Total Housing Units | 2,890 | 100.0% |
Occupancy by Ownership by Household Size in Barberton
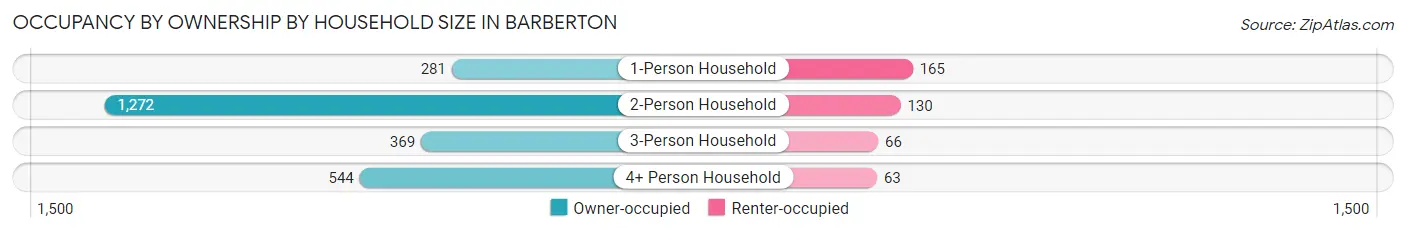
| Household Size | Owner-occupied | Renter-occupied |
| 1-Person Household | 281 (63.0%) | 165 (37.0%) |
| 2-Person Household | 1,272 (90.7%) | 130 (9.3%) |
| 3-Person Household | 369 (84.8%) | 66 (15.2%) |
| 4+ Person Household | 544 (89.6%) | 63 (10.4%) |
| Total Housing Units | 2,466 (85.3%) | 424 (14.7%) |
Occupancy by Educational Attainment in Barberton
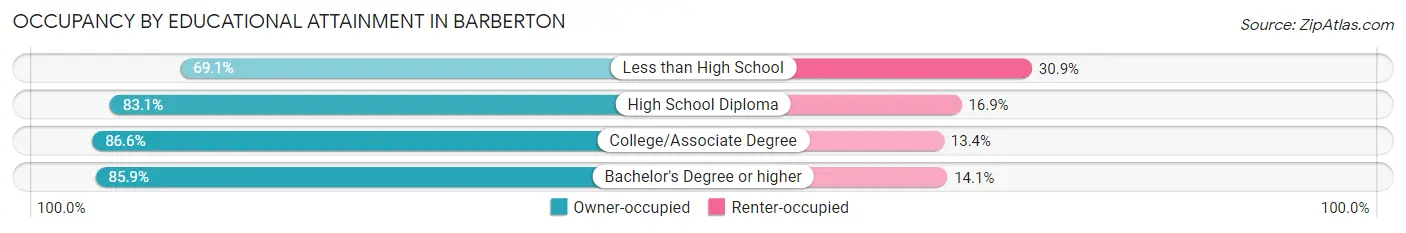
| Household Size | Owner-occupied | Renter-occupied |
| Less than High School | 47 (69.1%) | 21 (30.9%) |
| High School Diploma | 403 (83.1%) | 82 (16.9%) |
| College/Associate Degree | 1,058 (86.6%) | 164 (13.4%) |
| Bachelor's Degree or higher | 958 (85.9%) | 157 (14.1%) |
Occupancy by Age of Householder in Barberton
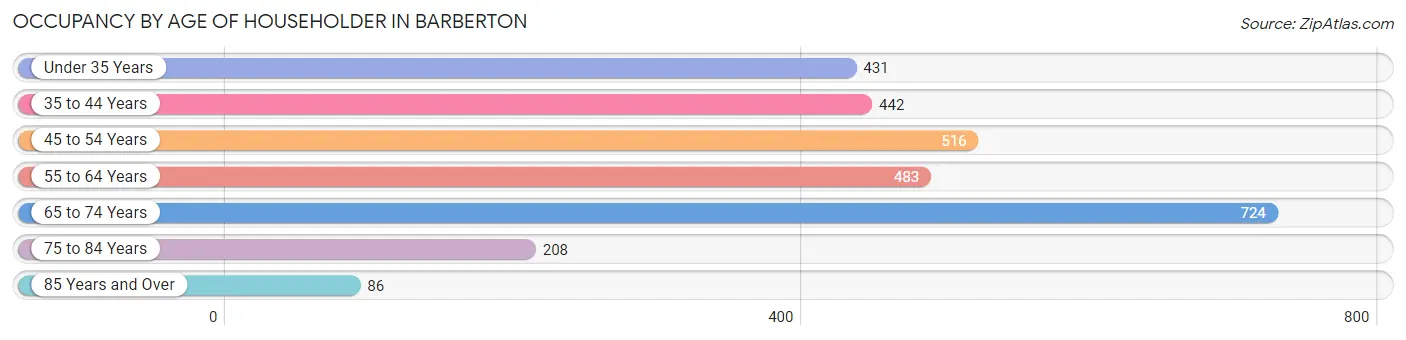
| Age Bracket | # Households | % Households |
| Under 35 Years | 431 | 14.9% |
| 35 to 44 Years | 442 | 15.3% |
| 45 to 54 Years | 516 | 17.8% |
| 55 to 64 Years | 483 | 16.7% |
| 65 to 74 Years | 724 | 25.1% |
| 75 to 84 Years | 208 | 7.2% |
| 85 Years and Over | 86 | 3.0% |
| Total | 2,890 | 100.0% |
Housing Finances in Barberton
Median Income by Occupancy in Barberton
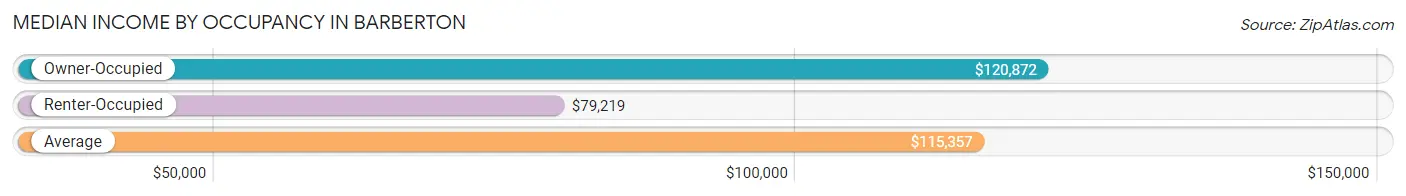
| Occupancy Type | # Households | Median Income |
| Owner-Occupied | 2,466 (85.3%) | $120,872 |
| Renter-Occupied | 424 (14.7%) | $79,219 |
| Average | 2,890 (100.0%) | $115,357 |
Occupancy by Householder Income Bracket in Barberton
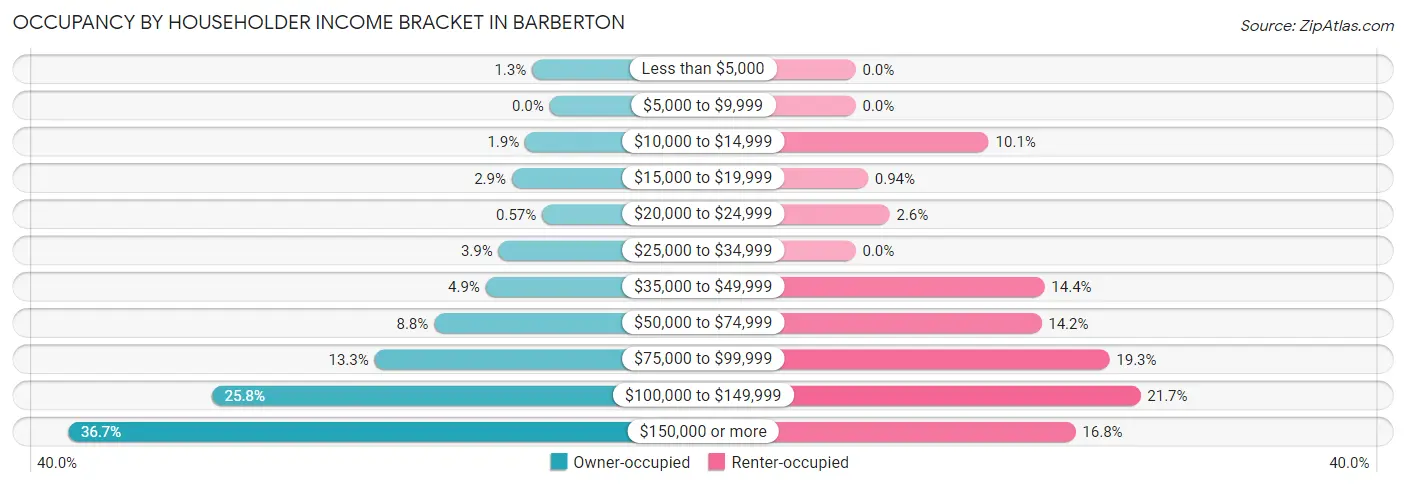
| Income Bracket | Owner-occupied | Renter-occupied |
| Less than $5,000 | 33 (1.3%) | 0 (0.0%) |
| $5,000 to $9,999 | 0 (0.0%) | 0 (0.0%) |
| $10,000 to $14,999 | 46 (1.9%) | 43 (10.1%) |
| $15,000 to $19,999 | 71 (2.9%) | 4 (0.9%) |
| $20,000 to $24,999 | 14 (0.6%) | 11 (2.6%) |
| $25,000 to $34,999 | 96 (3.9%) | 0 (0.0%) |
| $35,000 to $49,999 | 120 (4.9%) | 61 (14.4%) |
| $50,000 to $74,999 | 217 (8.8%) | 60 (14.1%) |
| $75,000 to $99,999 | 329 (13.3%) | 82 (19.3%) |
| $100,000 to $149,999 | 635 (25.8%) | 92 (21.7%) |
| $150,000 or more | 905 (36.7%) | 71 (16.8%) |
| Total | 2,466 (100.0%) | 424 (100.0%) |
Monthly Housing Cost Tiers in Barberton
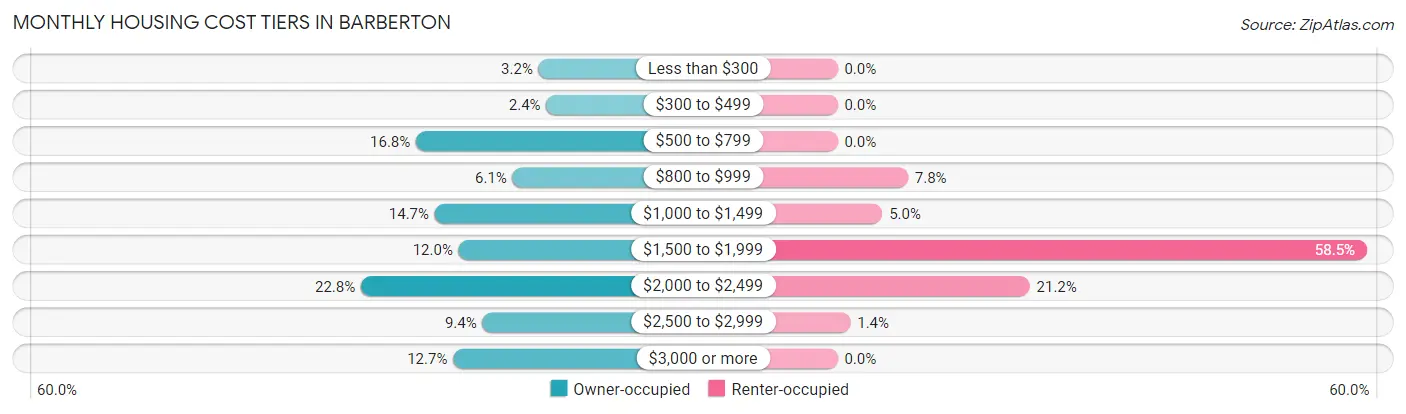
| Monthly Cost | Owner-occupied | Renter-occupied |
| Less than $300 | 79 (3.2%) | 0 (0.0%) |
| $300 to $499 | 58 (2.4%) | 0 (0.0%) |
| $500 to $799 | 413 (16.8%) | 0 (0.0%) |
| $800 to $999 | 150 (6.1%) | 33 (7.8%) |
| $1,000 to $1,499 | 362 (14.7%) | 21 (5.0%) |
| $1,500 to $1,999 | 297 (12.0%) | 248 (58.5%) |
| $2,000 to $2,499 | 563 (22.8%) | 90 (21.2%) |
| $2,500 to $2,999 | 232 (9.4%) | 6 (1.4%) |
| $3,000 or more | 312 (12.7%) | 0 (0.0%) |
| Total | 2,466 (100.0%) | 424 (100.0%) |
Physical Housing Characteristics in Barberton
Housing Structures in Barberton
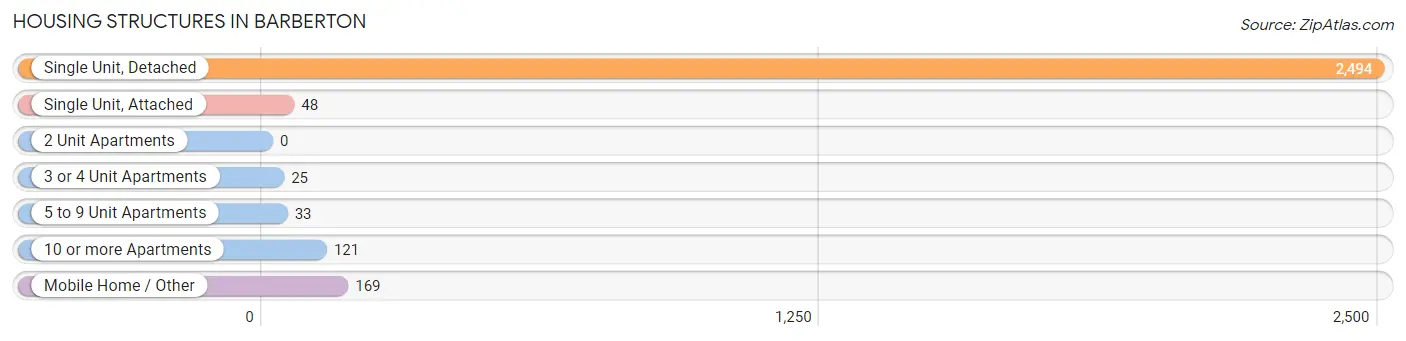
| Structure Type | # Housing Units | % Housing Units |
| Single Unit, Detached | 2,494 | 86.3% |
| Single Unit, Attached | 48 | 1.7% |
| 2 Unit Apartments | 0 | 0.0% |
| 3 or 4 Unit Apartments | 25 | 0.9% |
| 5 to 9 Unit Apartments | 33 | 1.1% |
| 10 or more Apartments | 121 | 4.2% |
| Mobile Home / Other | 169 | 5.9% |
| Total | 2,890 | 100.0% |
Housing Structures by Occupancy in Barberton
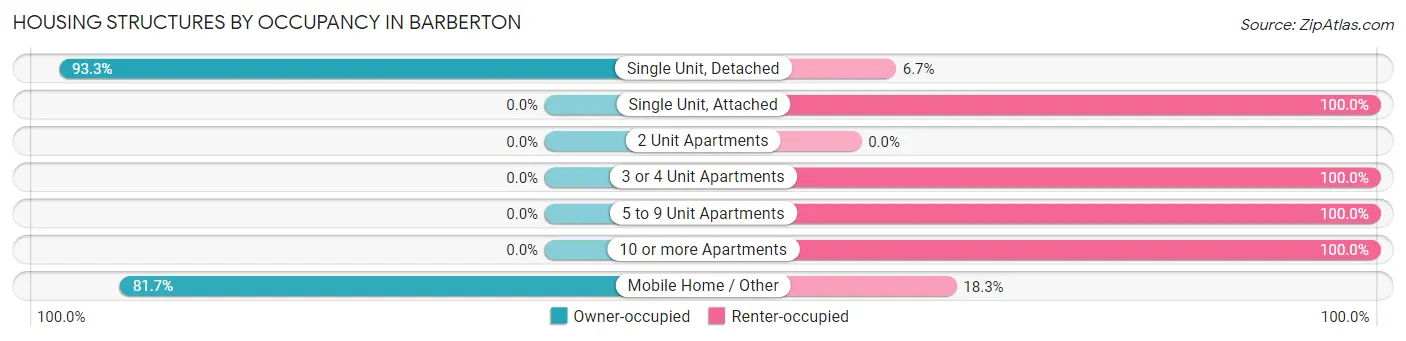
| Structure Type | Owner-occupied | Renter-occupied |
| Single Unit, Detached | 2,328 (93.3%) | 166 (6.7%) |
| Single Unit, Attached | 0 (0.0%) | 48 (100.0%) |
| 2 Unit Apartments | 0 (0.0%) | 0 (0.0%) |
| 3 or 4 Unit Apartments | 0 (0.0%) | 25 (100.0%) |
| 5 to 9 Unit Apartments | 0 (0.0%) | 33 (100.0%) |
| 10 or more Apartments | 0 (0.0%) | 121 (100.0%) |
| Mobile Home / Other | 138 (81.7%) | 31 (18.3%) |
| Total | 2,466 (85.3%) | 424 (14.7%) |
Housing Structures by Number of Rooms in Barberton
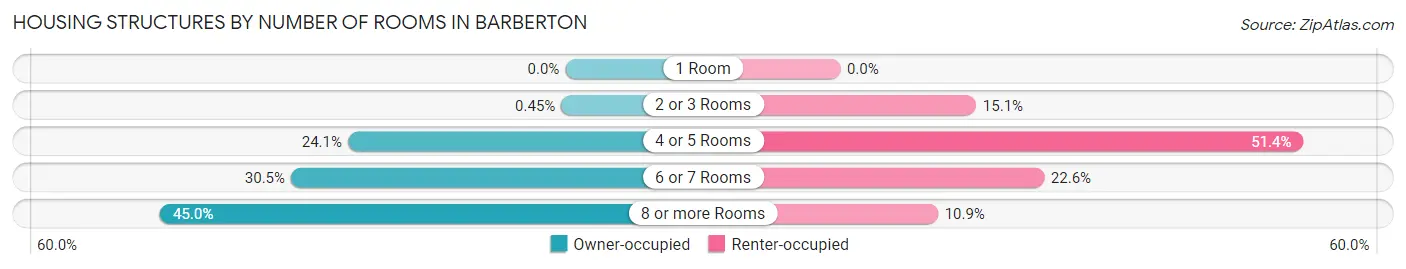
| Number of Rooms | Owner-occupied | Renter-occupied |
| 1 Room | 0 (0.0%) | 0 (0.0%) |
| 2 or 3 Rooms | 11 (0.4%) | 64 (15.1%) |
| 4 or 5 Rooms | 595 (24.1%) | 218 (51.4%) |
| 6 or 7 Rooms | 751 (30.4%) | 96 (22.6%) |
| 8 or more Rooms | 1,109 (45.0%) | 46 (10.8%) |
| Total | 2,466 (100.0%) | 424 (100.0%) |
Housing Structure by Heating Type in Barberton
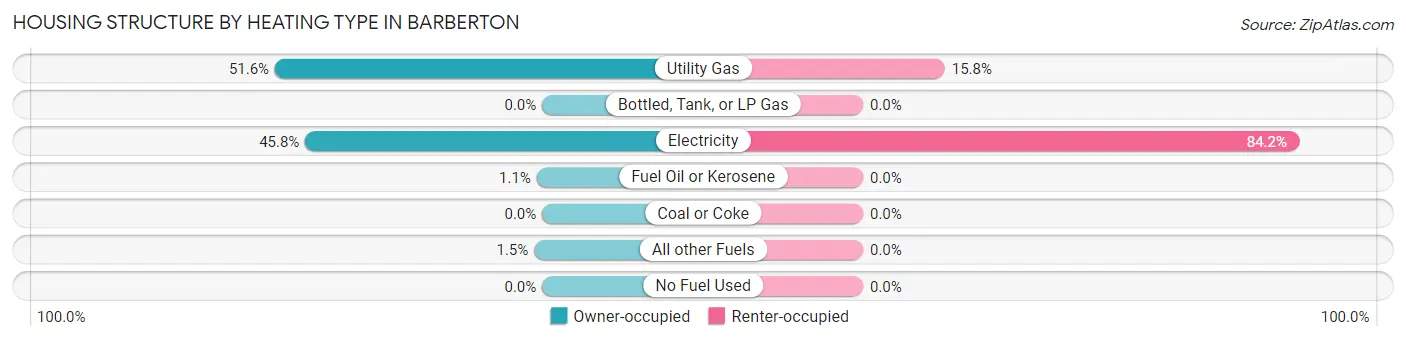
| Heating Type | Owner-occupied | Renter-occupied |
| Utility Gas | 1,273 (51.6%) | 67 (15.8%) |
| Bottled, Tank, or LP Gas | 0 (0.0%) | 0 (0.0%) |
| Electricity | 1,129 (45.8%) | 357 (84.2%) |
| Fuel Oil or Kerosene | 26 (1.1%) | 0 (0.0%) |
| Coal or Coke | 0 (0.0%) | 0 (0.0%) |
| All other Fuels | 38 (1.5%) | 0 (0.0%) |
| No Fuel Used | 0 (0.0%) | 0 (0.0%) |
| Total | 2,466 (100.0%) | 424 (100.0%) |
Household Vehicle Usage in Barberton
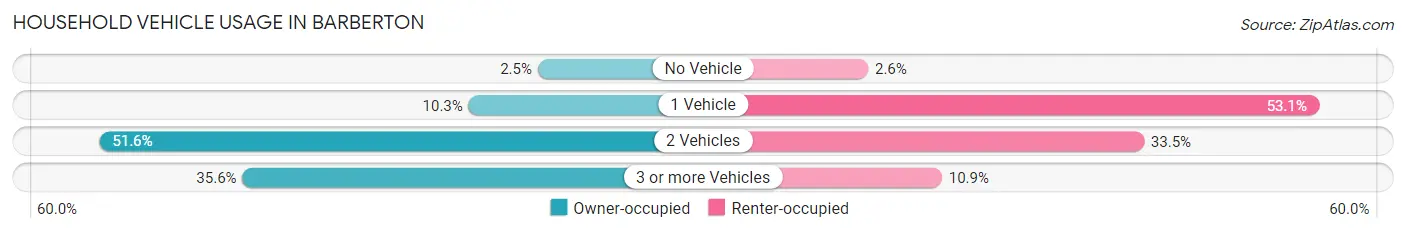
| Vehicles per Household | Owner-occupied | Renter-occupied |
| No Vehicle | 62 (2.5%) | 11 (2.6%) |
| 1 Vehicle | 253 (10.3%) | 225 (53.1%) |
| 2 Vehicles | 1,273 (51.6%) | 142 (33.5%) |
| 3 or more Vehicles | 878 (35.6%) | 46 (10.8%) |
| Total | 2,466 (100.0%) | 424 (100.0%) |
Real Estate & Mortgages in Barberton
Real Estate and Mortgage Overview in Barberton
| Characteristic | Without Mortgage | With Mortgage |
| Housing Units | 766 | 1,700 |
| Median Property Value | $582,700 | $540,600 |
| Median Household Income | $91,167 | $659 |
| Monthly Housing Costs | $644 | $306 |
| Real Estate Taxes | $5,442 | $40 |
Property Value by Mortgage Status in Barberton
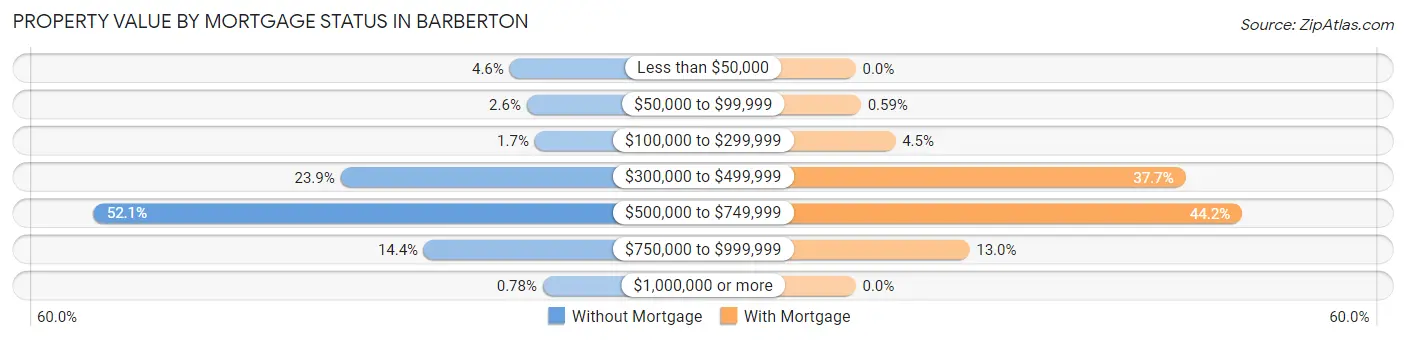
| Property Value | Without Mortgage | With Mortgage |
| Less than $50,000 | 35 (4.6%) | 0 (0.0%) |
| $50,000 to $99,999 | 20 (2.6%) | 10 (0.6%) |
| $100,000 to $299,999 | 13 (1.7%) | 77 (4.5%) |
| $300,000 to $499,999 | 183 (23.9%) | 641 (37.7%) |
| $500,000 to $749,999 | 399 (52.1%) | 751 (44.2%) |
| $750,000 to $999,999 | 110 (14.4%) | 221 (13.0%) |
| $1,000,000 or more | 6 (0.8%) | 0 (0.0%) |
| Total | 766 (100.0%) | 1,700 (100.0%) |
Household Income by Mortgage Status in Barberton
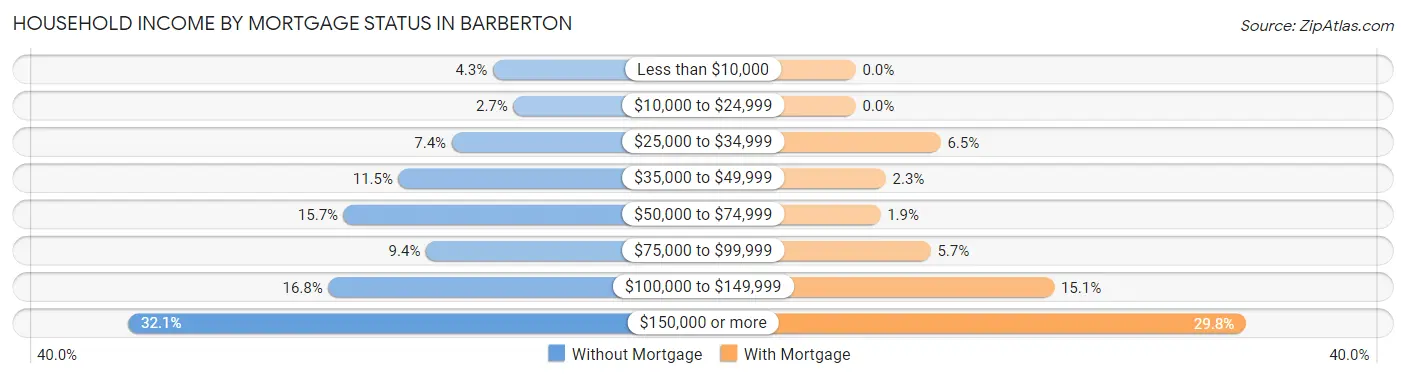
| Household Income | Without Mortgage | With Mortgage |
| Less than $10,000 | 33 (4.3%) | 0 (0.0%) |
| $10,000 to $24,999 | 21 (2.7%) | 0 (0.0%) |
| $25,000 to $34,999 | 57 (7.4%) | 110 (6.5%) |
| $35,000 to $49,999 | 88 (11.5%) | 39 (2.3%) |
| $50,000 to $74,999 | 120 (15.7%) | 32 (1.9%) |
| $75,000 to $99,999 | 72 (9.4%) | 97 (5.7%) |
| $100,000 to $149,999 | 129 (16.8%) | 257 (15.1%) |
| $150,000 or more | 246 (32.1%) | 506 (29.8%) |
| Total | 766 (100.0%) | 1,700 (100.0%) |
Property Value to Household Income Ratio in Barberton
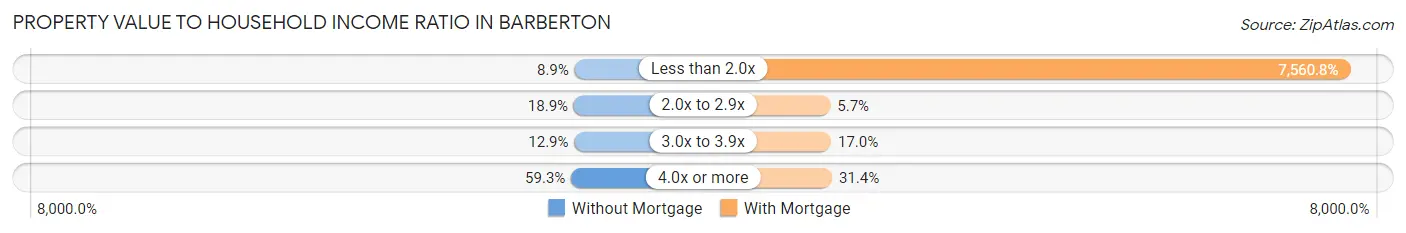
| Value-to-Income Ratio | Without Mortgage | With Mortgage |
| Less than 2.0x | 68 (8.9%) | 128,534 (7,560.8%) |
| 2.0x to 2.9x | 145 (18.9%) | 97 (5.7%) |
| 3.0x to 3.9x | 99 (12.9%) | 289 (17.0%) |
| 4.0x or more | 454 (59.3%) | 534 (31.4%) |
| Total | 766 (100.0%) | 1,700 (100.0%) |
Real Estate Taxes by Mortgage Status in Barberton
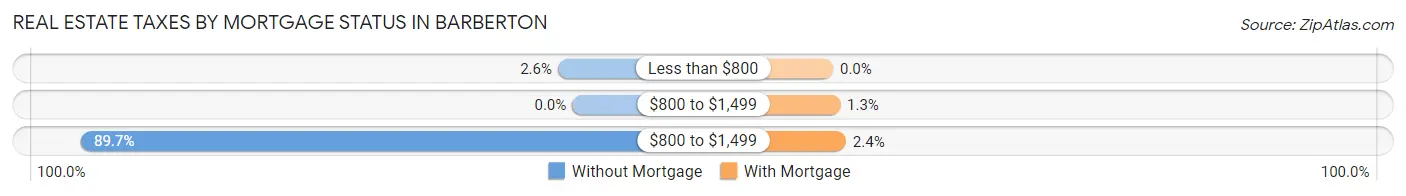
| Property Taxes | Without Mortgage | With Mortgage |
| Less than $800 | 20 (2.6%) | 0 (0.0%) |
| $800 to $1,499 | 0 (0.0%) | 22 (1.3%) |
| $800 to $1,499 | 687 (89.7%) | 40 (2.4%) |
| Total | 766 (100.0%) | 1,700 (100.0%) |
Health & Disability in Barberton
Health Insurance Coverage by Age in Barberton
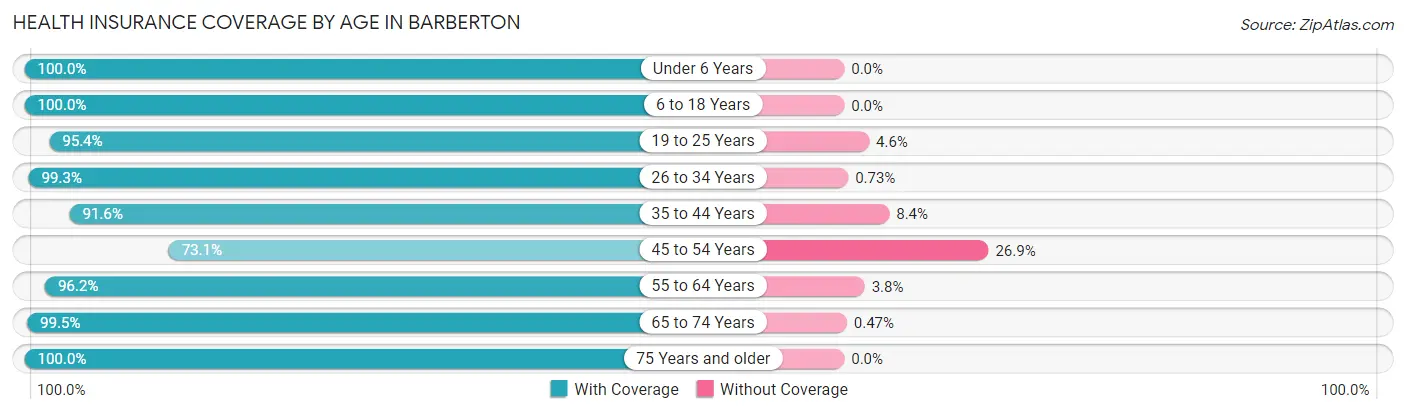
| Age Bracket | With Coverage | Without Coverage |
| Under 6 Years | 390 (100.0%) | 0 (0.0%) |
| 6 to 18 Years | 995 (100.0%) | 0 (0.0%) |
| 19 to 25 Years | 868 (95.4%) | 42 (4.6%) |
| 26 to 34 Years | 813 (99.3%) | 6 (0.7%) |
| 35 to 44 Years | 939 (91.6%) | 86 (8.4%) |
| 45 to 54 Years | 878 (73.1%) | 323 (26.9%) |
| 55 to 64 Years | 833 (96.2%) | 33 (3.8%) |
| 65 to 74 Years | 1,263 (99.5%) | 6 (0.5%) |
| 75 Years and older | 444 (100.0%) | 0 (0.0%) |
| Total | 7,423 (93.7%) | 496 (6.3%) |
Health Insurance Coverage by Citizenship Status in Barberton
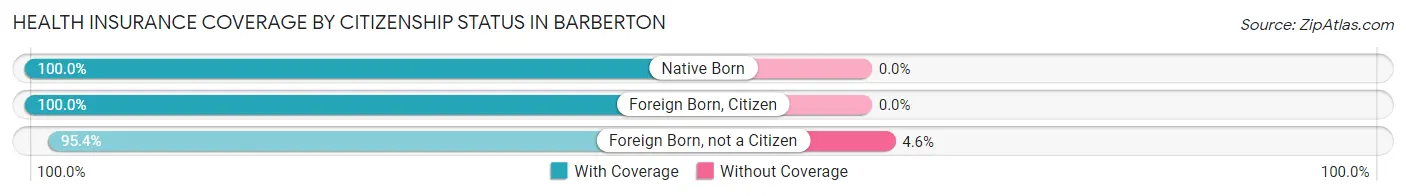
| Citizenship Status | With Coverage | Without Coverage |
| Native Born | 390 (100.0%) | 0 (0.0%) |
| Foreign Born, Citizen | 995 (100.0%) | 0 (0.0%) |
| Foreign Born, not a Citizen | 868 (95.4%) | 42 (4.6%) |
Health Insurance Coverage by Household Income in Barberton
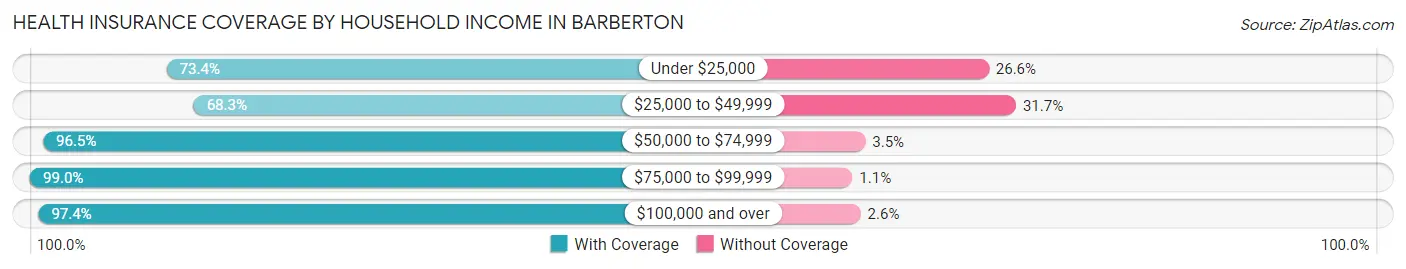
| Household Income | With Coverage | Without Coverage |
| Under $25,000 | 226 (73.4%) | 82 (26.6%) |
| $25,000 to $49,999 | 515 (68.3%) | 239 (31.7%) |
| $50,000 to $74,999 | 557 (96.5%) | 20 (3.5%) |
| $75,000 to $99,999 | 1,230 (99.0%) | 13 (1.1%) |
| $100,000 and over | 4,877 (97.4%) | 130 (2.6%) |
Public vs Private Health Insurance Coverage by Age in Barberton
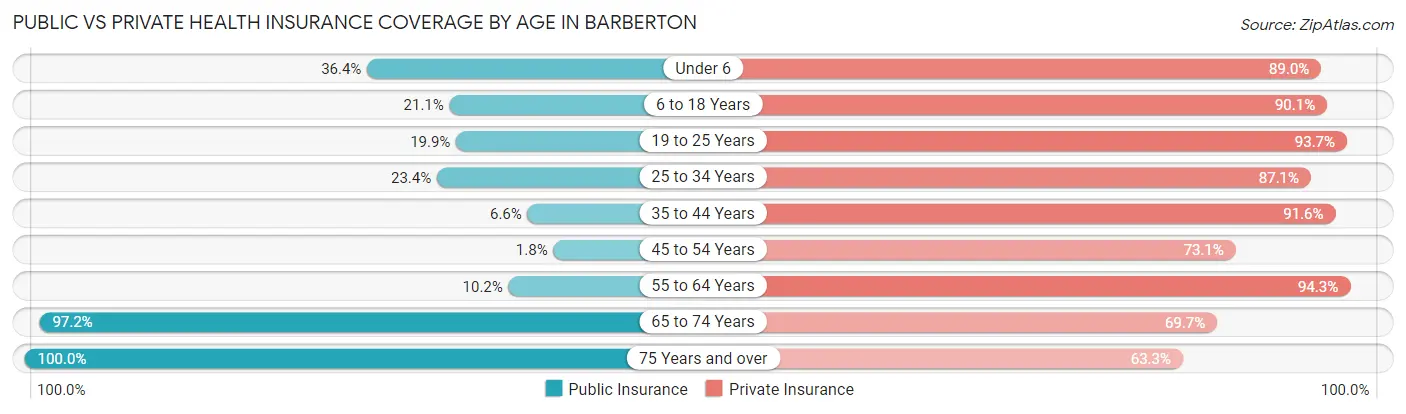
| Age Bracket | Public Insurance | Private Insurance |
| Under 6 | 142 (36.4%) | 347 (89.0%) |
| 6 to 18 Years | 210 (21.1%) | 896 (90.0%) |
| 19 to 25 Years | 181 (19.9%) | 853 (93.7%) |
| 25 to 34 Years | 192 (23.4%) | 713 (87.1%) |
| 35 to 44 Years | 68 (6.6%) | 939 (91.6%) |
| 45 to 54 Years | 22 (1.8%) | 878 (73.1%) |
| 55 to 64 Years | 88 (10.2%) | 817 (94.3%) |
| 65 to 74 Years | 1,234 (97.2%) | 884 (69.7%) |
| 75 Years and over | 444 (100.0%) | 281 (63.3%) |
| Total | 2,581 (32.6%) | 6,608 (83.4%) |
Disability Status by Sex by Age in Barberton
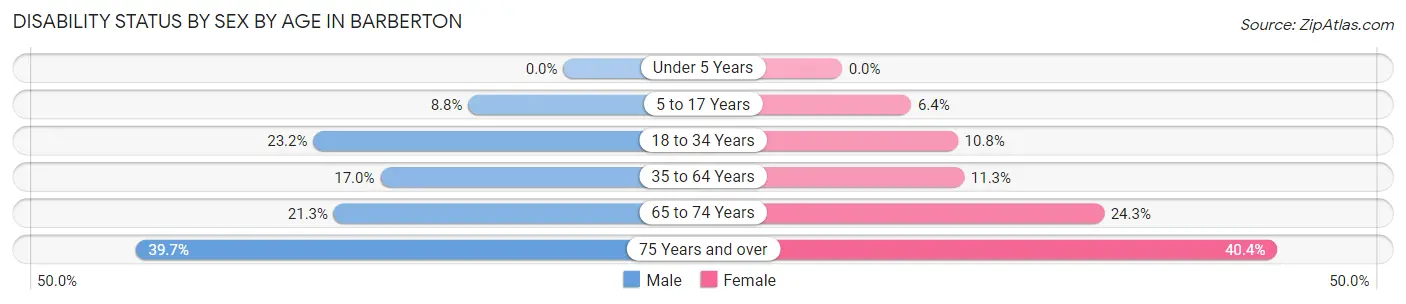
| Age Bracket | Male | Female |
| Under 5 Years | 0 (0.0%) | 0 (0.0%) |
| 5 to 17 Years | 45 (8.8%) | 34 (6.4%) |
| 18 to 34 Years | 260 (23.2%) | 69 (10.7%) |
| 35 to 64 Years | 245 (17.0%) | 187 (11.3%) |
| 65 to 74 Years | 131 (21.3%) | 159 (24.3%) |
| 75 Years and over | 79 (39.7%) | 99 (40.4%) |
Disability Class by Sex by Age in Barberton
Disability Class: Hearing Difficulty
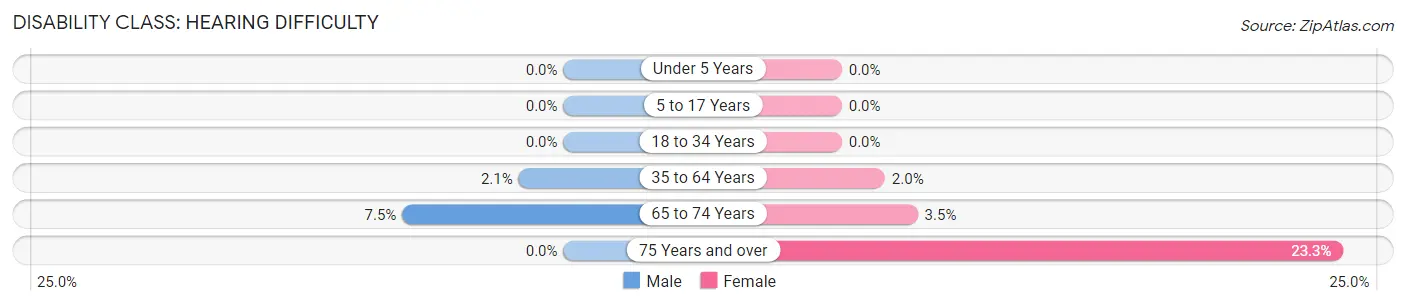
| Age Bracket | Male | Female |
| Under 5 Years | 0 (0.0%) | 0 (0.0%) |
| 5 to 17 Years | 0 (0.0%) | 0 (0.0%) |
| 18 to 34 Years | 0 (0.0%) | 0 (0.0%) |
| 35 to 64 Years | 30 (2.1%) | 33 (2.0%) |
| 65 to 74 Years | 46 (7.5%) | 23 (3.5%) |
| 75 Years and over | 0 (0.0%) | 57 (23.3%) |
Disability Class: Vision Difficulty
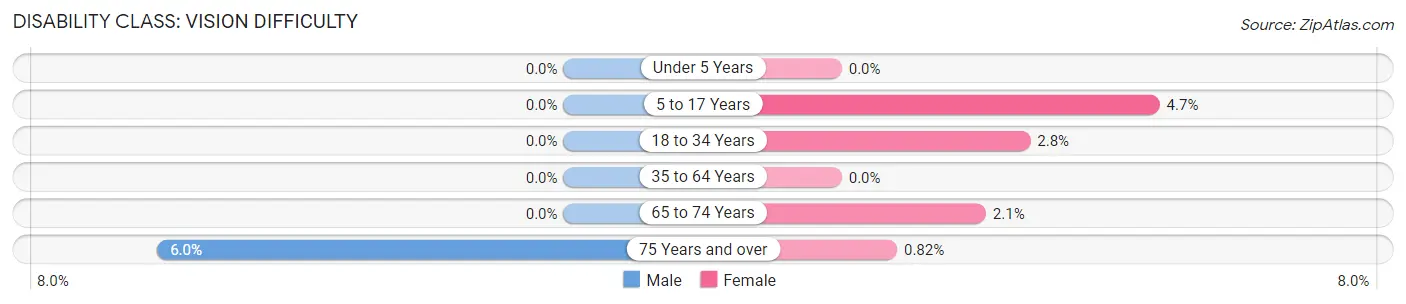
| Age Bracket | Male | Female |
| Under 5 Years | 0 (0.0%) | 0 (0.0%) |
| 5 to 17 Years | 0 (0.0%) | 25 (4.7%) |
| 18 to 34 Years | 0 (0.0%) | 18 (2.8%) |
| 35 to 64 Years | 0 (0.0%) | 0 (0.0%) |
| 65 to 74 Years | 0 (0.0%) | 14 (2.1%) |
| 75 Years and over | 12 (6.0%) | 2 (0.8%) |
Disability Class: Cognitive Difficulty
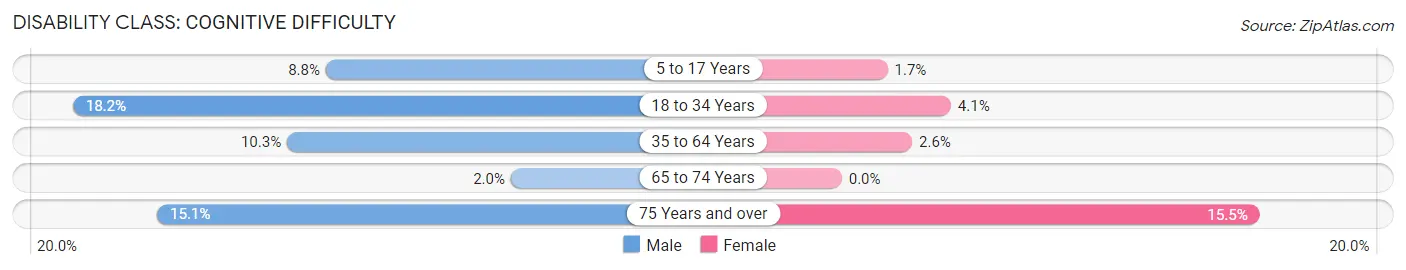
| Age Bracket | Male | Female |
| 5 to 17 Years | 45 (8.8%) | 9 (1.7%) |
| 18 to 34 Years | 204 (18.2%) | 26 (4.1%) |
| 35 to 64 Years | 148 (10.3%) | 43 (2.6%) |
| 65 to 74 Years | 12 (1.9%) | 0 (0.0%) |
| 75 Years and over | 30 (15.1%) | 38 (15.5%) |
Disability Class: Ambulatory Difficulty
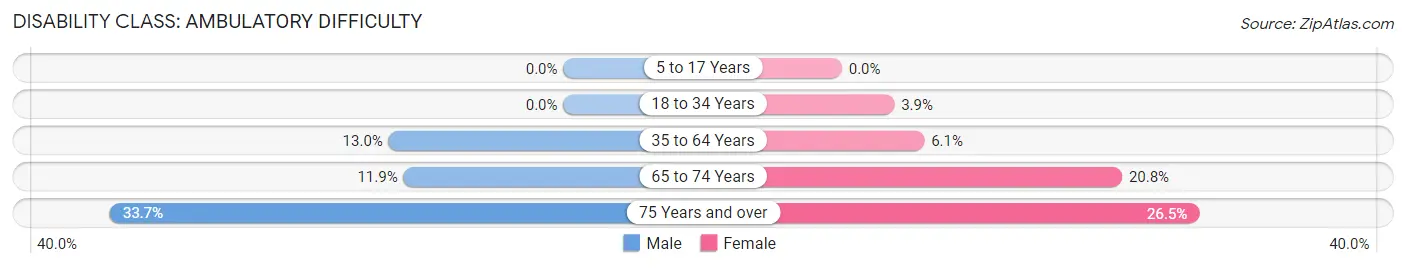
| Age Bracket | Male | Female |
| 5 to 17 Years | 0 (0.0%) | 0 (0.0%) |
| 18 to 34 Years | 0 (0.0%) | 25 (3.9%) |
| 35 to 64 Years | 187 (13.0%) | 101 (6.1%) |
| 65 to 74 Years | 73 (11.9%) | 136 (20.8%) |
| 75 Years and over | 67 (33.7%) | 65 (26.5%) |
Disability Class: Self-Care Difficulty
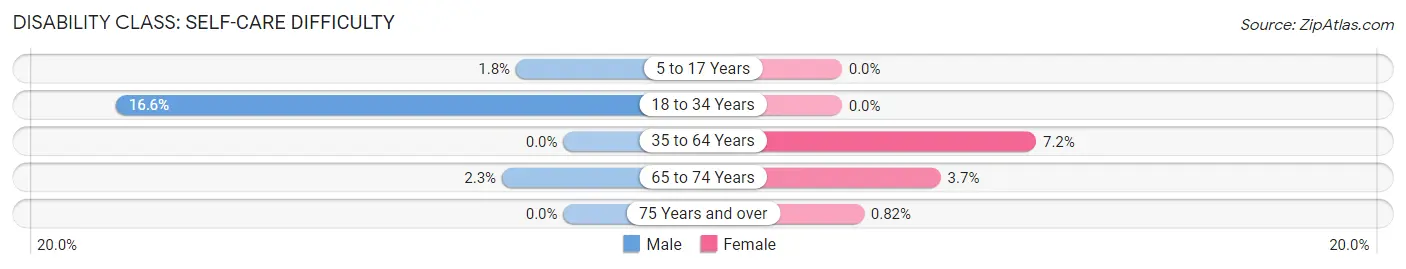
| Age Bracket | Male | Female |
| 5 to 17 Years | 9 (1.8%) | 0 (0.0%) |
| 18 to 34 Years | 186 (16.6%) | 0 (0.0%) |
| 35 to 64 Years | 0 (0.0%) | 119 (7.2%) |
| 65 to 74 Years | 14 (2.3%) | 24 (3.7%) |
| 75 Years and over | 0 (0.0%) | 2 (0.8%) |
Technology Access in Barberton
Computing Device Access in Barberton
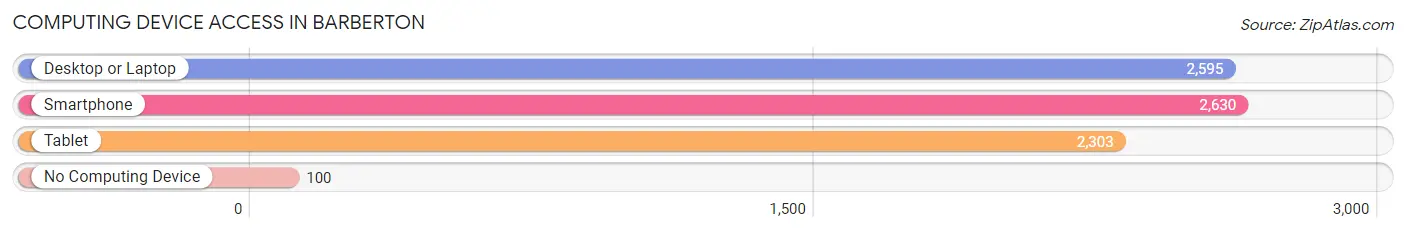
| Device Type | # Households | % Households |
| Desktop or Laptop | 2,595 | 89.8% |
| Smartphone | 2,630 | 91.0% |
| Tablet | 2,303 | 79.7% |
| No Computing Device | 100 | 3.5% |
| Total | 2,890 | 100.0% |
Internet Access in Barberton
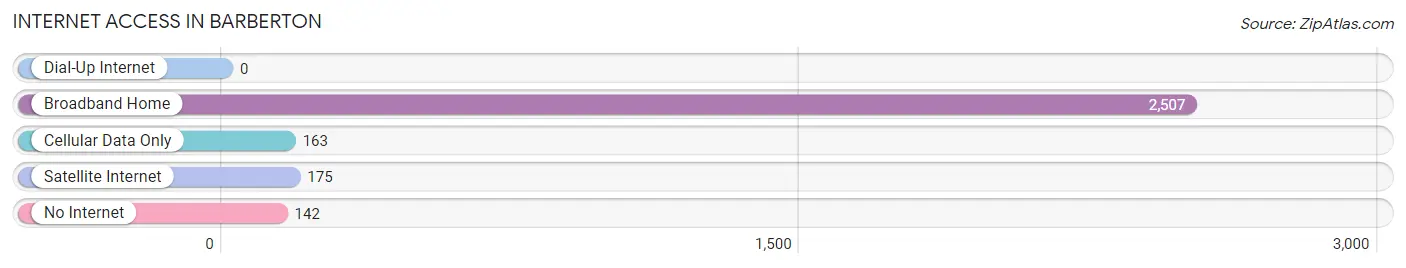
| Internet Type | # Households | % Households |
| Dial-Up Internet | 0 | 0.0% |
| Broadband Home | 2,507 | 86.8% |
| Cellular Data Only | 163 | 5.6% |
| Satellite Internet | 175 | 6.1% |
| No Internet | 142 | 4.9% |
| Total | 2,890 | 100.0% |
Barberton Summary
Barberton, WA is a small town located in the south-central part of Washington State. It is situated in the foothills of the Cascade Mountains, about 25 miles east of Seattle. The town has a population of about 1,500 people and is known for its rural charm and small-town atmosphere.
History
Barberton was founded in 1883 by a group of settlers from the Midwest. The town was named after the Barber family, who were among the first settlers. The town was originally a logging and farming community, and the first post office was established in 1884.
In the early 1900s, Barberton became a popular tourist destination due to its proximity to Seattle and its scenic beauty. The town was also known for its mineral springs, which were believed to have healing properties.
In the 1920s, Barberton experienced a period of growth and prosperity. The town was home to several businesses, including a hotel, a bank, a movie theater, and a variety of shops.
Geography
Barberton is located in the foothills of the Cascade Mountains, about 25 miles east of Seattle. The town is situated at an elevation of about 1,000 feet, and the surrounding area is characterized by rolling hills and lush forests. The town is located in a temperate climate, with mild winters and warm summers.
Economy
Barberton’s economy is largely based on tourism and agriculture. The town is home to several small businesses, including restaurants, shops, and a variety of services. The town is also home to a number of farms, which produce a variety of fruits and vegetables.
Demographics
As of the 2010 census, Barberton had a population of 1,500 people. The town is predominantly white, with about 90% of the population identifying as Caucasian. The median household income is about $50,000, and the median age is about 40 years old.
Conclusion
Barberton, WA is a small town located in the south-central part of Washington State. It is situated in the foothills of the Cascade Mountains, about 25 miles east of Seattle. The town has a population of about 1,500 people and is known for its rural charm and small-town atmosphere. The town’s economy is largely based on tourism and agriculture, and the town is home to several small businesses. The town is predominantly white, with about 90% of the population identifying as Caucasian.
Common Questions
What is Per Capita Income in Barberton?
Per Capita income in Barberton is $52,088.
What is the Median Family Income in Barberton?
Median Family Income in Barberton is $124,360.
What is the Median Household income in Barberton?
Median Household Income in Barberton is $115,357.
What is Income or Wage Gap in Barberton?
Income or Wage Gap in Barberton is 36.7%.
Women in Barberton earn 63.3 cents for every dollar earned by a man.
What is Inequality or Gini Index in Barberton?
Inequality or Gini Index in Barberton is 0.39.
What is the Total Population of Barberton?
Total Population of Barberton is 7,945.
What is the Total Male Population of Barberton?
Total Male Population of Barberton is 4,051.
What is the Total Female Population of Barberton?
Total Female Population of Barberton is 3,894.
What is the Ratio of Males per 100 Females in Barberton?
There are 104.03 Males per 100 Females in Barberton.
What is the Ratio of Females per 100 Males in Barberton?
There are 96.12 Females per 100 Males in Barberton.
What is the Median Population Age in Barberton?
Median Population Age in Barberton is 44.2 Years.
What is the Average Family Size in Barberton
Average Family Size in Barberton is 3.1 People.
What is the Average Household Size in Barberton
Average Household Size in Barberton is 2.7 People.
How Large is the Labor Force in Barberton?
There are 4,038 People in the Labor Forcein in Barberton.
What is the Percentage of People in the Labor Force in Barberton?
60.2% of People are in the Labor Force in Barberton.
What is the Unemployment Rate in Barberton?
Unemployment Rate in Barberton is 4.7%.