Key Center, WA Map & Demographics
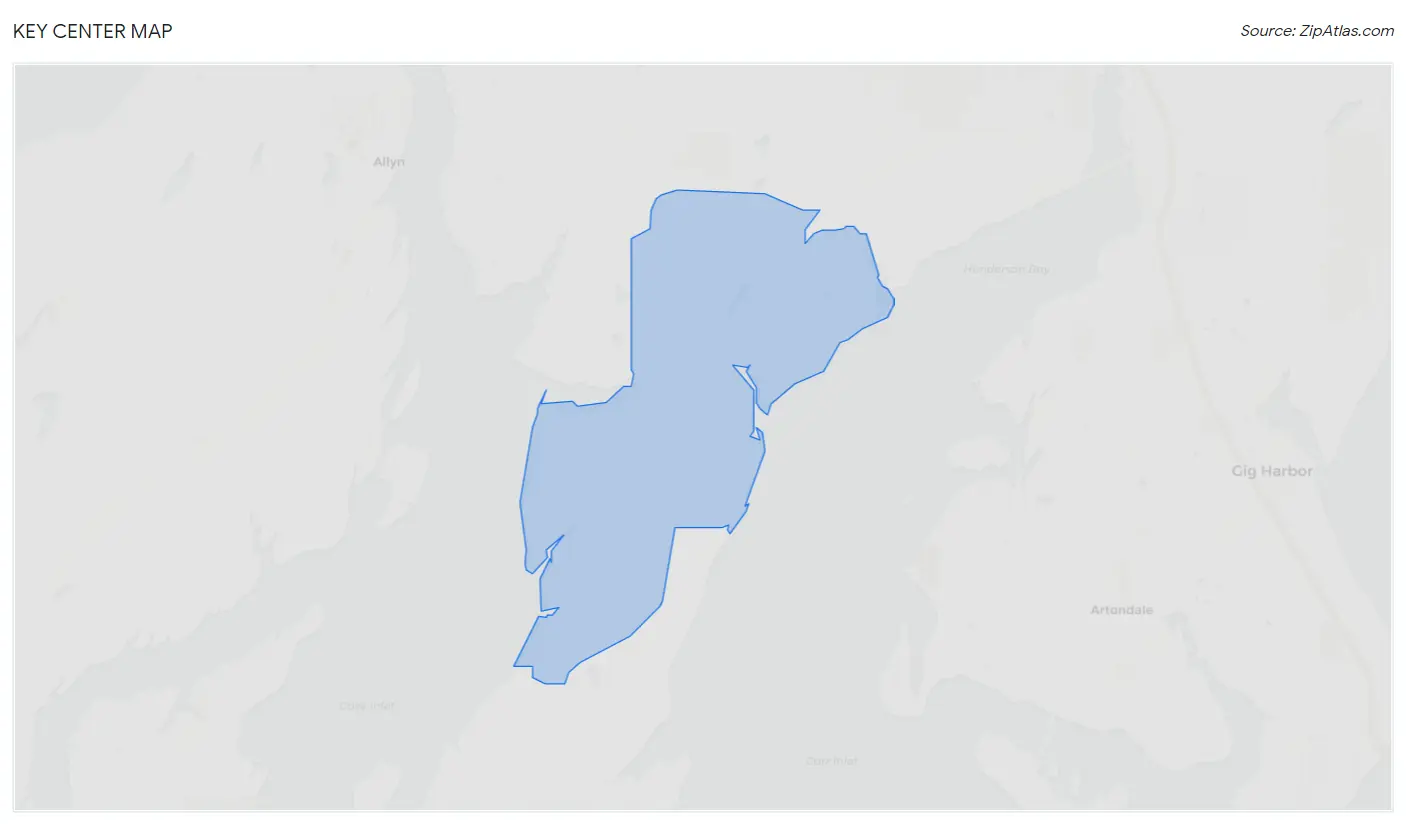
Key Center Map
Key Center Overview
$46,081
PER CAPITA INCOME
$98,561
AVG FAMILY INCOME
$92,241
AVG HOUSEHOLD INCOME
52.6%
WAGE / INCOME GAP [ % ]
47.4¢/ $1
WAGE / INCOME GAP [ $ ]
0.42
INEQUALITY / GINI INDEX
3,359
TOTAL POPULATION
1,638
MALE POPULATION
1,721
FEMALE POPULATION
95.18
MALES / 100 FEMALES
105.07
FEMALES / 100 MALES
49.0
MEDIAN AGE
2.8
AVG FAMILY SIZE
2.4
AVG HOUSEHOLD SIZE
1,558
LABOR FORCE [ PEOPLE ]
54.1%
PERCENT IN LABOR FORCE
5.9%
UNEMPLOYMENT RATE
Income in Key Center
Income Overview in Key Center
Per Capita Income in Key Center is $46,081, while median incomes of families and households are $98,561 and $92,241 respectively.
| Characteristic | Number | Measure |
| Per Capita Income | 3,359 | $46,081 |
| Median Family Income | 946 | $98,561 |
| Mean Family Income | 946 | $125,017 |
| Median Household Income | 1,396 | $92,241 |
| Mean Household Income | 1,396 | $109,139 |
| Income Deficit | 946 | $0 |
| Wage / Income Gap (%) | 3,359 | 52.63% |
| Wage / Income Gap ($) | 3,359 | 47.37¢ per $1 |
| Gini / Inequality Index | 3,359 | 0.42 |
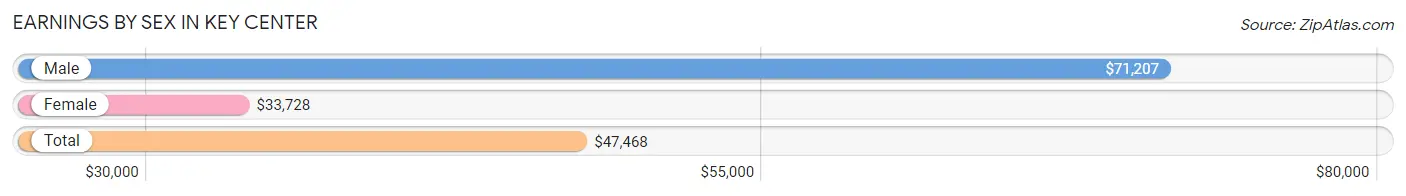
Earnings by Sex in Key Center
Average Earnings in Key Center are $47,468, $71,207 for men and $33,728 for women, a difference of 52.6%.
| Sex | Number | Average Earnings |
| Male | 914 (52.1%) | $71,207 |
| Female | 841 (47.9%) | $33,728 |
| Total | 1,755 (100.0%) | $47,468 |
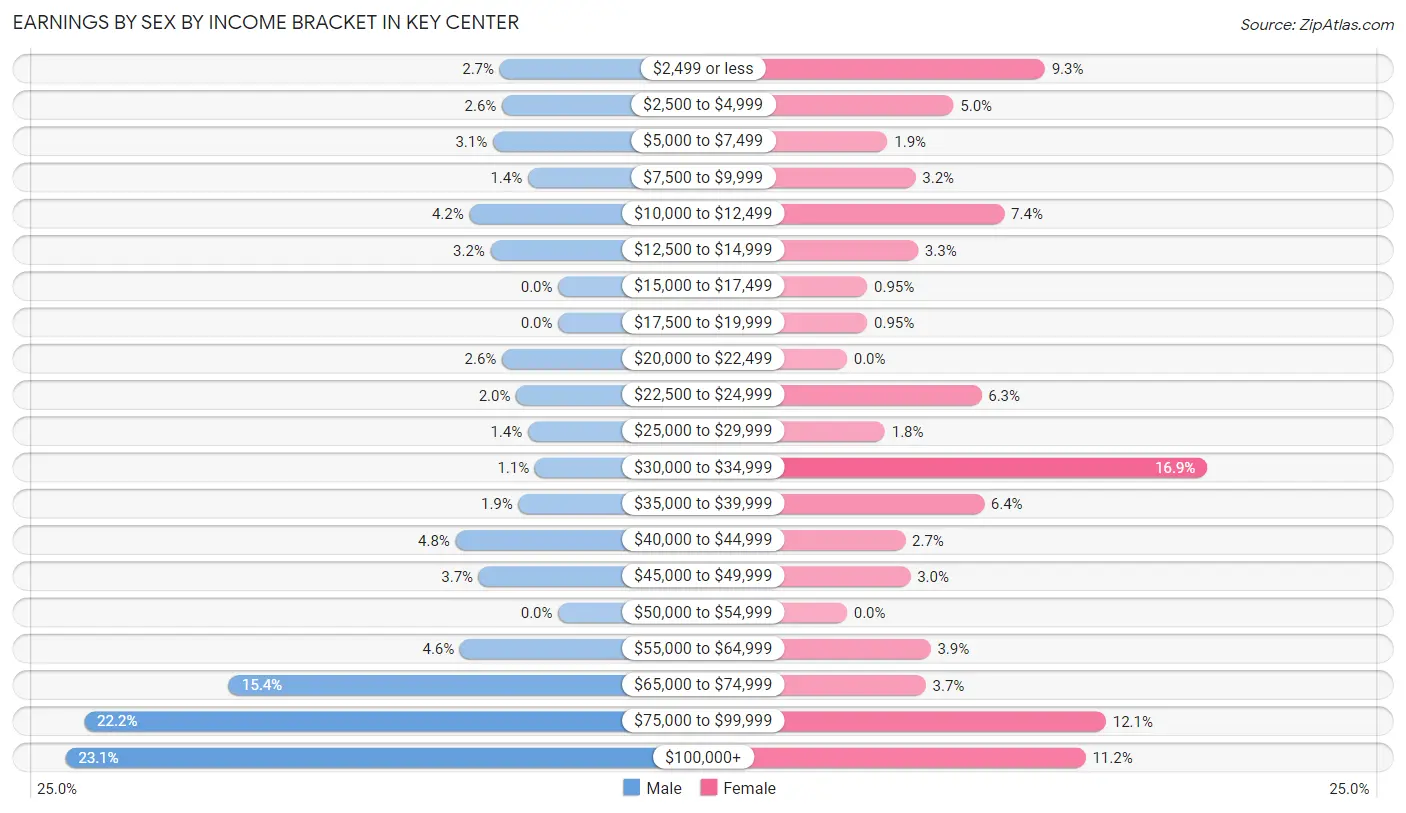
Earnings by Sex by Income Bracket in Key Center
The most common earnings brackets in Key Center are $100,000+ for men (211 | 23.1%) and $30,000 to $34,999 for women (142 | 16.9%).
| Income | Male | Female |
| $2,499 or less | 25 (2.7%) | 78 (9.3%) |
| $2,500 to $4,999 | 24 (2.6%) | 42 (5.0%) |
| $5,000 to $7,499 | 28 (3.1%) | 16 (1.9%) |
| $7,500 to $9,999 | 13 (1.4%) | 27 (3.2%) |
| $10,000 to $12,499 | 38 (4.2%) | 62 (7.4%) |
| $12,500 to $14,999 | 29 (3.2%) | 28 (3.3%) |
| $15,000 to $17,499 | 0 (0.0%) | 8 (0.9%) |
| $17,500 to $19,999 | 0 (0.0%) | 8 (0.9%) |
| $20,000 to $22,499 | 24 (2.6%) | 0 (0.0%) |
| $22,500 to $24,999 | 18 (2.0%) | 53 (6.3%) |
| $25,000 to $29,999 | 13 (1.4%) | 15 (1.8%) |
| $30,000 to $34,999 | 10 (1.1%) | 142 (16.9%) |
| $35,000 to $39,999 | 17 (1.9%) | 54 (6.4%) |
| $40,000 to $44,999 | 44 (4.8%) | 23 (2.7%) |
| $45,000 to $49,999 | 34 (3.7%) | 25 (3.0%) |
| $50,000 to $54,999 | 0 (0.0%) | 0 (0.0%) |
| $55,000 to $64,999 | 42 (4.6%) | 33 (3.9%) |
| $65,000 to $74,999 | 141 (15.4%) | 31 (3.7%) |
| $75,000 to $99,999 | 203 (22.2%) | 102 (12.1%) |
| $100,000+ | 211 (23.1%) | 94 (11.2%) |
| Total | 914 (100.0%) | 841 (100.0%) |
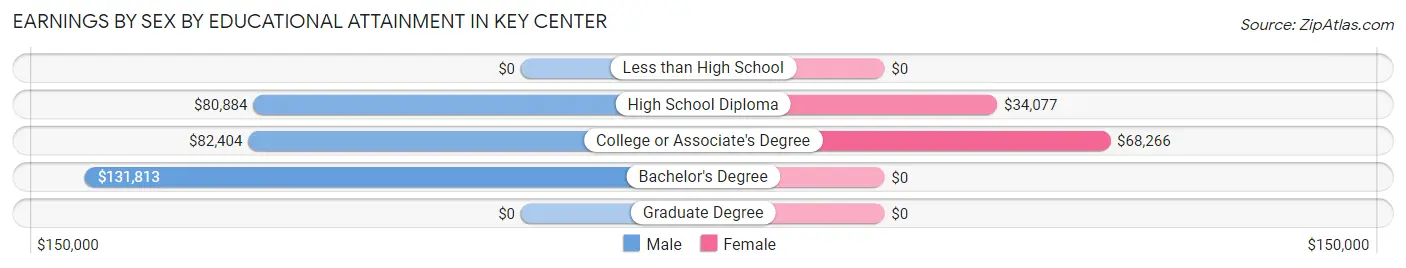
Earnings by Sex by Educational Attainment in Key Center
Average earnings in Key Center are $81,134 for men and $35,824 for women, a difference of 55.8%. Men with an educational attainment of bachelor's degree enjoy the highest average annual earnings of $131,813, while those with high school diploma education earn the least with $80,884. Women with an educational attainment of college or associate's degree earn the most with the average annual earnings of $68,266, while those with high school diploma education have the smallest earnings of $34,077.
| Educational Attainment | Male Income | Female Income |
| Less than High School | - | - |
| High School Diploma | $80,884 | $34,077 |
| College or Associate's Degree | $82,404 | $68,266 |
| Bachelor's Degree | $131,813 | $0 |
| Graduate Degree | - | - |
| Total | $81,134 | $35,824 |
Family Income in Key Center
Family Income Brackets in Key Center
According to the Key Center family income data, there are 187 families falling into the $100,000 to $149,999 income range, which is the most common income bracket and makes up 19.8% of all families.
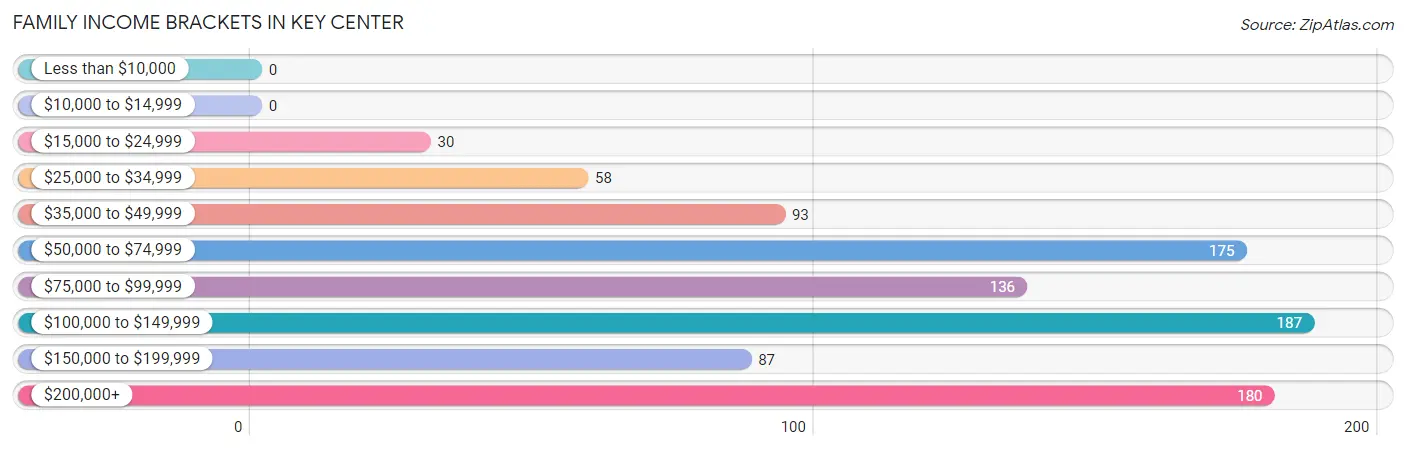
| Income Bracket | # Families | % Families |
| Less than $10,000 | 0 | 0.0% |
| $10,000 to $14,999 | 0 | 0.0% |
| $15,000 to $24,999 | 30 | 3.2% |
| $25,000 to $34,999 | 58 | 6.1% |
| $35,000 to $49,999 | 93 | 9.8% |
| $50,000 to $74,999 | 175 | 18.5% |
| $75,000 to $99,999 | 136 | 14.4% |
| $100,000 to $149,999 | 187 | 19.8% |
| $150,000 to $199,999 | 87 | 9.2% |
| $200,000+ | 180 | 19.0% |
Family Income by Famaliy Size in Key Center
6-person families (41 | 4.3%) account for the highest median family income in Key Center with $240,670 per family, while 3-person families (164 | 17.3%) have the highest median income of $45,648 per family member.
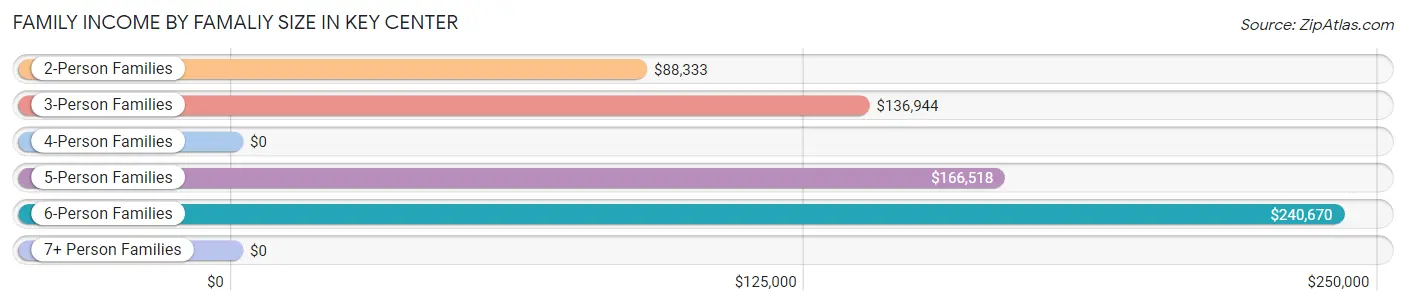
| Income Bracket | # Families | Median Income |
| 2-Person Families | 576 (60.9%) | $88,333 |
| 3-Person Families | 164 (17.3%) | $136,944 |
| 4-Person Families | 122 (12.9%) | $0 |
| 5-Person Families | 43 (4.5%) | $166,518 |
| 6-Person Families | 41 (4.3%) | $240,670 |
| 7+ Person Families | 0 (0.0%) | $0 |
| Total | 946 (100.0%) | $98,561 |
Family Income by Number of Earners in Key Center
The median family income in Key Center is $98,561, with families comprising 3+ earners (121) having the highest median family income of $231,089, while families with no earners (193) have the lowest median family income of $53,162, accounting for 12.8% and 20.4% of families, respectively.
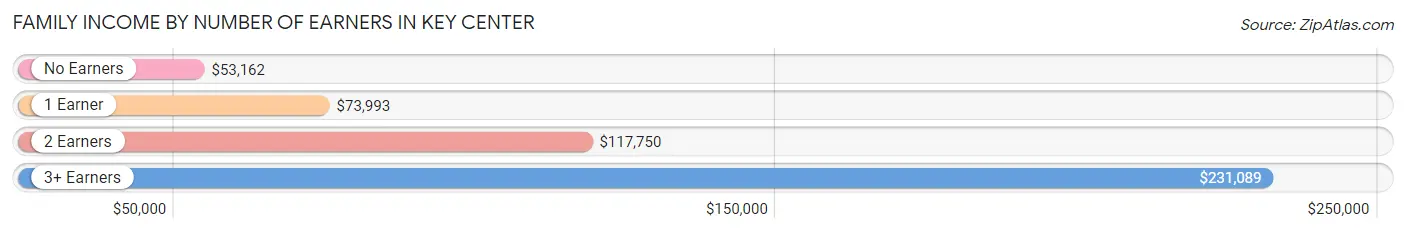
| Number of Earners | # Families | Median Income |
| No Earners | 193 (20.4%) | $53,162 |
| 1 Earner | 308 (32.6%) | $73,993 |
| 2 Earners | 324 (34.3%) | $117,750 |
| 3+ Earners | 121 (12.8%) | $231,089 |
| Total | 946 (100.0%) | $98,561 |
Household Income in Key Center
Household Income Brackets in Key Center
With 279 households falling in the category, the $100,000 to $149,999 income range is the most frequent in Key Center, accounting for 20.0% of all households. In contrast, only 36 households (2.6%) fall into the less than $10,000 income bracket, making it the least populous group.
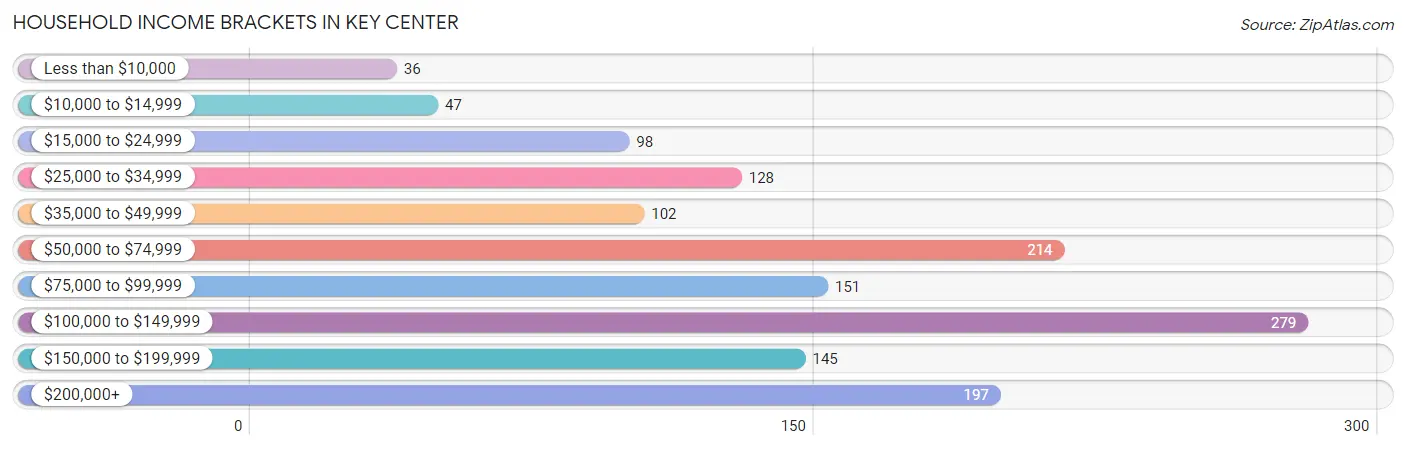
| Income Bracket | # Households | % Households |
| Less than $10,000 | 36 | 2.6% |
| $10,000 to $14,999 | 47 | 3.4% |
| $15,000 to $24,999 | 98 | 7.0% |
| $25,000 to $34,999 | 128 | 9.2% |
| $35,000 to $49,999 | 102 | 7.3% |
| $50,000 to $74,999 | 214 | 15.3% |
| $75,000 to $99,999 | 151 | 10.8% |
| $100,000 to $149,999 | 279 | 20.0% |
| $150,000 to $199,999 | 145 | 10.4% |
| $200,000+ | 197 | 14.1% |
Household Income by Householder Age in Key Center
The median household income in Key Center is $92,241, with the highest median household income of $118,250 found in the 25 to 44 years age bracket for the primary householder. A total of 304 households (21.8%) fall into this category. Meanwhile, the 15 to 24 years age bracket for the primary householder has the lowest median household income of $0, with 66 households (4.7%) in this group.
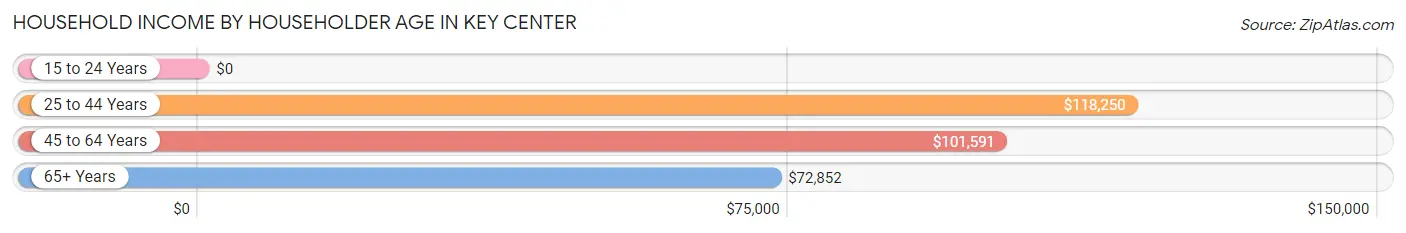
| Income Bracket | # Households | Median Income |
| 15 to 24 Years | 66 (4.7%) | $0 |
| 25 to 44 Years | 304 (21.8%) | $118,250 |
| 45 to 64 Years | 510 (36.5%) | $101,591 |
| 65+ Years | 516 (37.0%) | $72,852 |
| Total | 1,396 (100.0%) | $92,241 |
Poverty in Key Center
Income Below Poverty by Sex and Age in Key Center
With 7.8% poverty level for males and 7.7% for females among the residents of Key Center, 18 to 24 year old males and 18 to 24 year old females are the most vulnerable to poverty, with 73 males (42.4%) and 58 females (36.0%) in their respective age groups living below the poverty level.
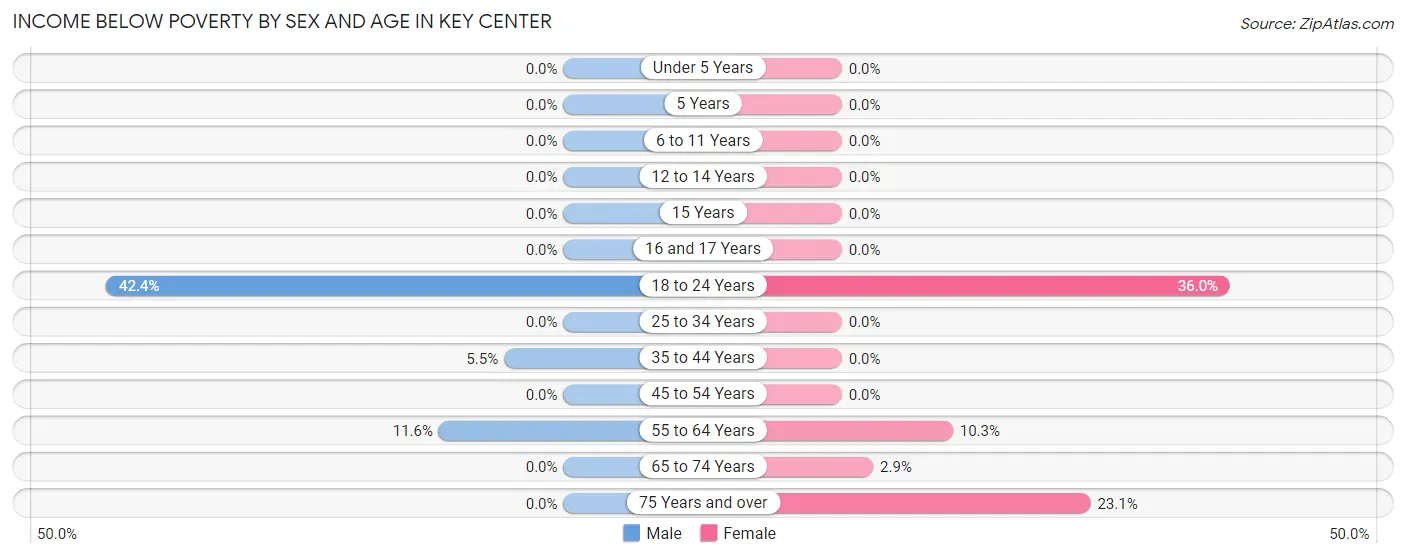
| Age Bracket | Male | Female |
| Under 5 Years | 0 (0.0%) | 0 (0.0%) |
| 5 Years | 0 (0.0%) | 0 (0.0%) |
| 6 to 11 Years | 0 (0.0%) | 0 (0.0%) |
| 12 to 14 Years | 0 (0.0%) | 0 (0.0%) |
| 15 Years | 0 (0.0%) | 0 (0.0%) |
| 16 and 17 Years | 0 (0.0%) | 0 (0.0%) |
| 18 to 24 Years | 73 (42.4%) | 58 (36.0%) |
| 25 to 34 Years | 0 (0.0%) | 0 (0.0%) |
| 35 to 44 Years | 13 (5.5%) | 0 (0.0%) |
| 45 to 54 Years | 0 (0.0%) | 0 (0.0%) |
| 55 to 64 Years | 40 (11.6%) | 34 (10.3%) |
| 65 to 74 Years | 0 (0.0%) | 9 (2.9%) |
| 75 Years and over | 0 (0.0%) | 30 (23.1%) |
| Total | 126 (7.8%) | 131 (7.7%) |
Income Above Poverty by Sex and Age in Key Center
According to the poverty statistics in Key Center, males aged under 5 years and females aged under 5 years are the age groups that are most secure financially, with 100.0% of males and 100.0% of females in these age groups living above the poverty line.
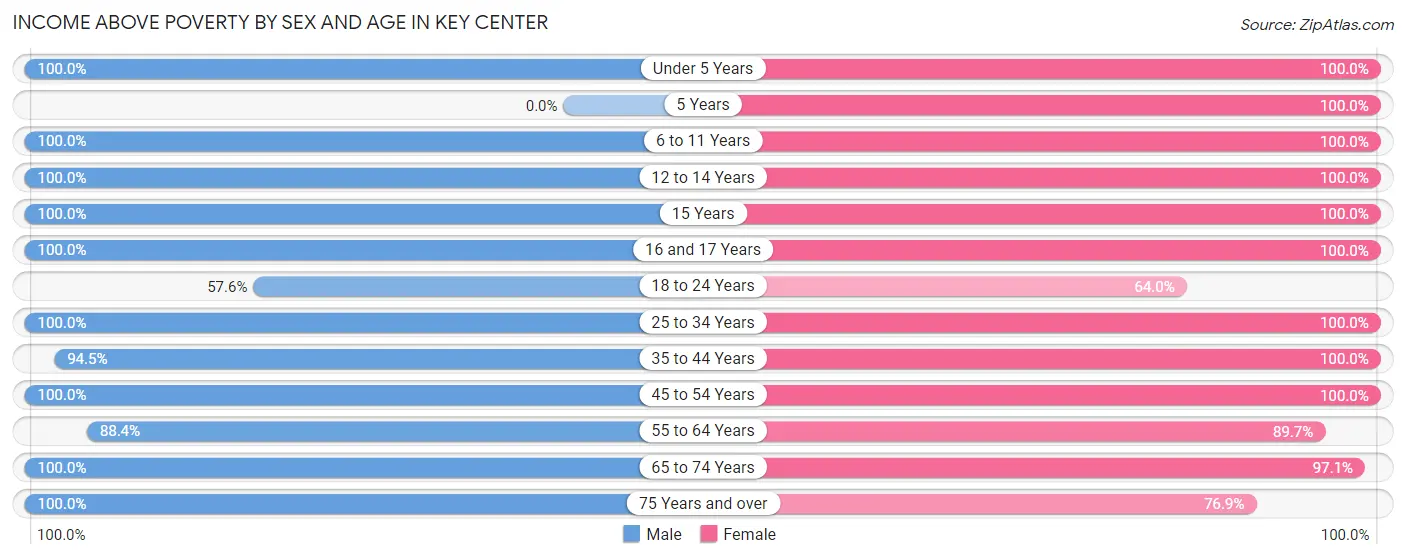
| Age Bracket | Male | Female |
| Under 5 Years | 41 (100.0%) | 90 (100.0%) |
| 5 Years | 0 (0.0%) | 22 (100.0%) |
| 6 to 11 Years | 93 (100.0%) | 16 (100.0%) |
| 12 to 14 Years | 9 (100.0%) | 155 (100.0%) |
| 15 Years | 14 (100.0%) | 3 (100.0%) |
| 16 and 17 Years | 100 (100.0%) | 9 (100.0%) |
| 18 to 24 Years | 99 (57.6%) | 103 (64.0%) |
| 25 to 34 Years | 97 (100.0%) | 105 (100.0%) |
| 35 to 44 Years | 223 (94.5%) | 205 (100.0%) |
| 45 to 54 Years | 206 (100.0%) | 168 (100.0%) |
| 55 to 64 Years | 306 (88.4%) | 296 (89.7%) |
| 65 to 74 Years | 166 (100.0%) | 300 (97.1%) |
| 75 Years and over | 140 (100.0%) | 100 (76.9%) |
| Total | 1,494 (92.2%) | 1,572 (92.3%) |
Income Below Poverty Among Married-Couple Families in Key Center
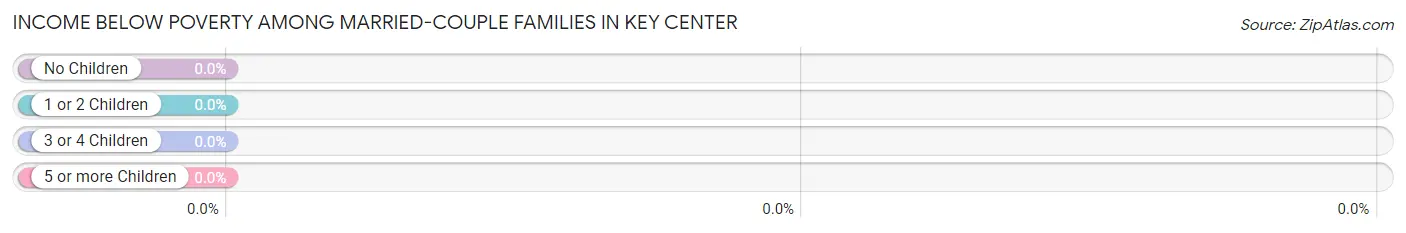
| Children | Above Poverty | Below Poverty |
| No Children | 472 (100.0%) | 0 (0.0%) |
| 1 or 2 Children | 190 (100.0%) | 0 (0.0%) |
| 3 or 4 Children | 27 (100.0%) | 0 (0.0%) |
| 5 or more Children | 0 (0.0%) | 0 (0.0%) |
| Total | 689 (100.0%) | 0 (0.0%) |
Income Below Poverty Among Single-Parent Households in Key Center
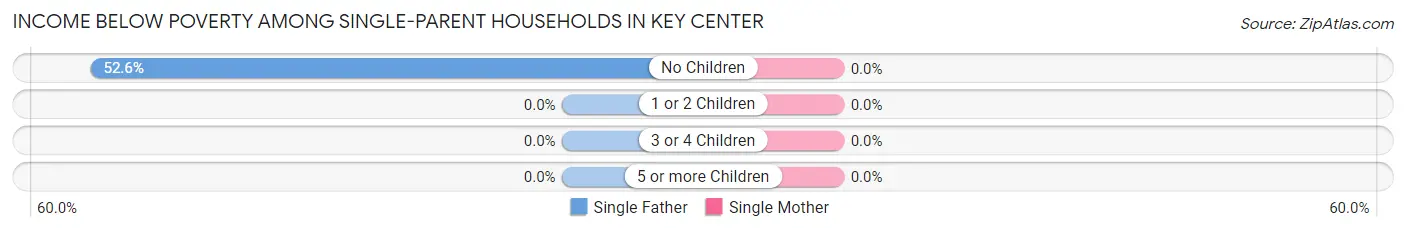
| Children | Single Father | Single Mother |
| No Children | 30 (52.6%) | 0 (0.0%) |
| 1 or 2 Children | 0 (0.0%) | 0 (0.0%) |
| 3 or 4 Children | 0 (0.0%) | 0 (0.0%) |
| 5 or more Children | 0 (0.0%) | 0 (0.0%) |
| Total | 30 (38.0%) | 0 (0.0%) |
Income Below Poverty Among Married-Couple vs Single-Parent Households in Key Center
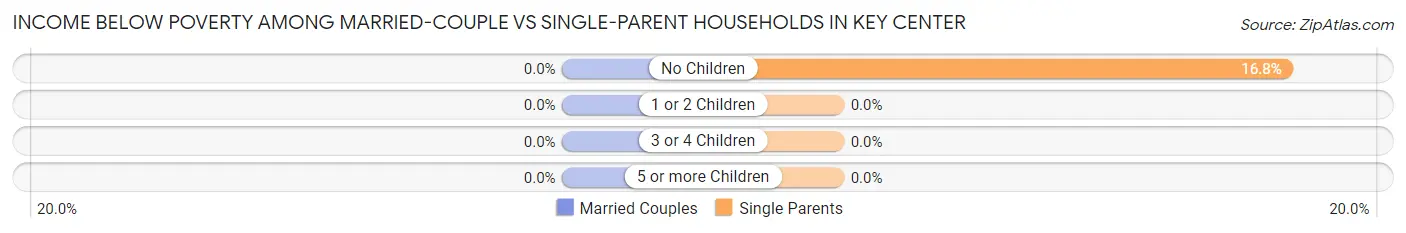
| Children | Married-Couple Families | Single-Parent Households |
| No Children | 0 (0.0%) | 30 (16.8%) |
| 1 or 2 Children | 0 (0.0%) | 0 (0.0%) |
| 3 or 4 Children | 0 (0.0%) | 0 (0.0%) |
| 5 or more Children | 0 (0.0%) | 0 (0.0%) |
| Total | 0 (0.0%) | 30 (11.7%) |
Race in Key Center
The most populous races in Key Center are White / Caucasian (2,917 | 86.8%), Two or more Races (420 | 12.5%), and Hispanic or Latino (57 | 1.7%).
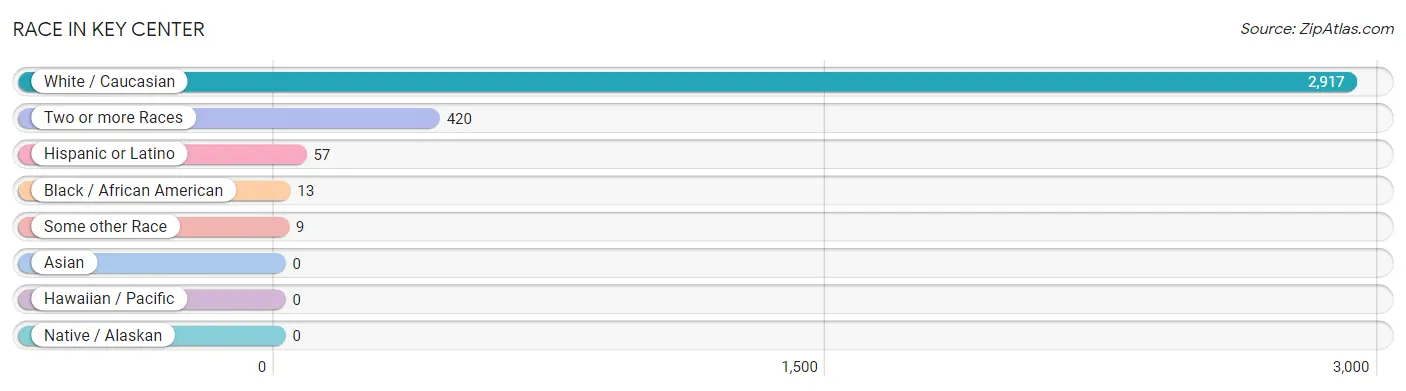
| Race | # Population | % Population |
| Asian | 0 | 0.0% |
| Black / African American | 13 | 0.4% |
| Hawaiian / Pacific | 0 | 0.0% |
| Hispanic or Latino | 57 | 1.7% |
| Native / Alaskan | 0 | 0.0% |
| White / Caucasian | 2,917 | 86.8% |
| Two or more Races | 420 | 12.5% |
| Some other Race | 9 | 0.3% |
| Total | 3,359 | 100.0% |
Ancestry in Key Center
The most populous ancestries reported in Key Center are Irish (633 | 18.8%), German (610 | 18.2%), English (595 | 17.7%), American (364 | 10.8%), and Norwegian (352 | 10.5%), together accounting for 76.0% of all Key Center residents.
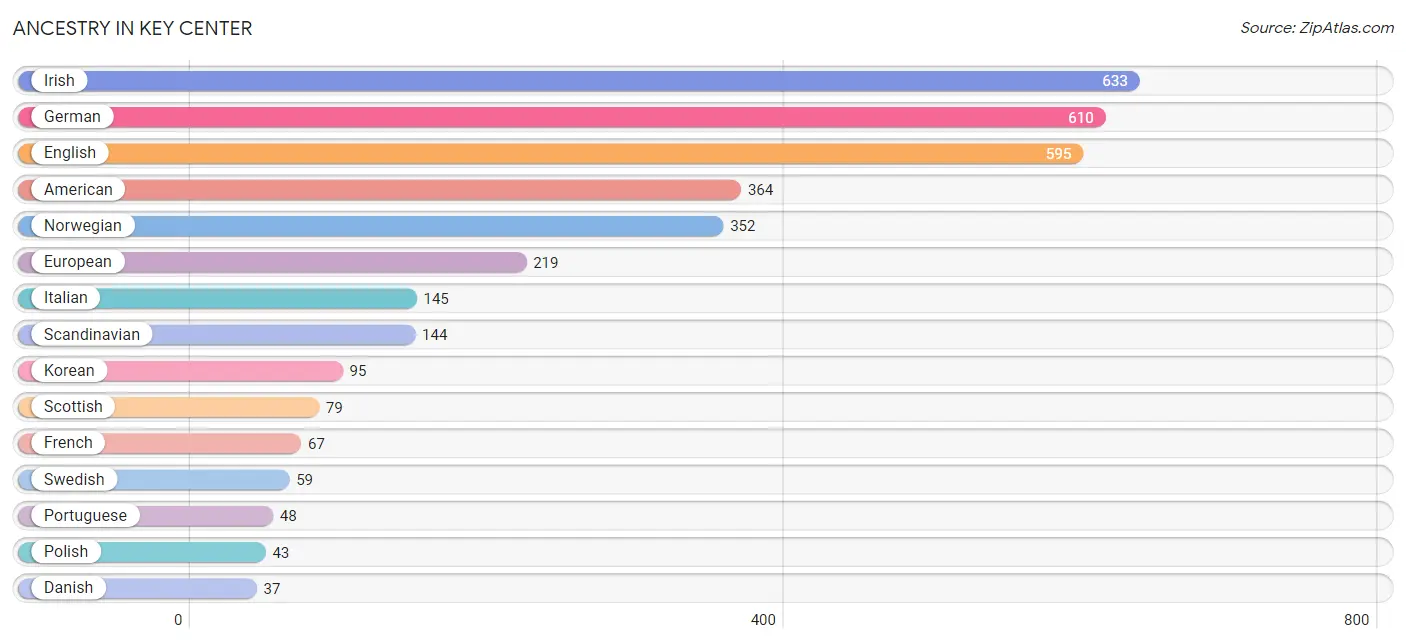
| Ancestry | # Population | % Population |
| American | 364 | 10.8% |
| Bhutanese | 26 | 0.8% |
| British | 35 | 1.0% |
| Canadian | 28 | 0.8% |
| Croatian | 16 | 0.5% |
| Danish | 37 | 1.1% |
| Dutch | 9 | 0.3% |
| English | 595 | 17.7% |
| European | 219 | 6.5% |
| French | 67 | 2.0% |
| German | 610 | 18.2% |
| Hungarian | 8 | 0.2% |
| Irish | 633 | 18.8% |
| Italian | 145 | 4.3% |
| Korean | 95 | 2.8% |
| Mexican | 23 | 0.7% |
| Norwegian | 352 | 10.5% |
| Polish | 43 | 1.3% |
| Portuguese | 48 | 1.4% |
| Scandinavian | 144 | 4.3% |
| Scotch-Irish | 28 | 0.8% |
| Scottish | 79 | 2.4% |
| Sioux | 30 | 0.9% |
| Spaniard | 34 | 1.0% |
| Swedish | 59 | 1.8% |
| Welsh | 16 | 0.5% | View All 26 Rows |
Immigrants in Key Center
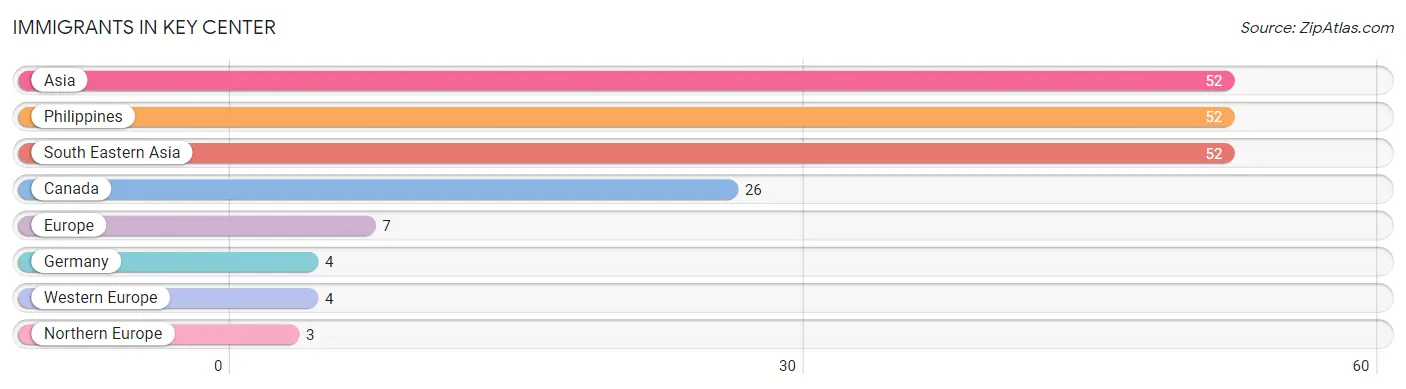
The most numerous immigrant groups reported in Key Center came from Asia (52 | 1.5%), Philippines (52 | 1.5%), South Eastern Asia (52 | 1.5%), Canada (26 | 0.8%), and Europe (7 | 0.2%), together accounting for 5.6% of all Key Center residents.
| Immigration Origin | # Population | % Population |
| Asia | 52 | 1.5% |
| Canada | 26 | 0.8% |
| Europe | 7 | 0.2% |
| Germany | 4 | 0.1% |
| Northern Europe | 3 | 0.1% |
| Philippines | 52 | 1.5% |
| South Eastern Asia | 52 | 1.5% |
| Western Europe | 4 | 0.1% | View All 8 Rows |
Sex and Age in Key Center
Sex and Age in Key Center
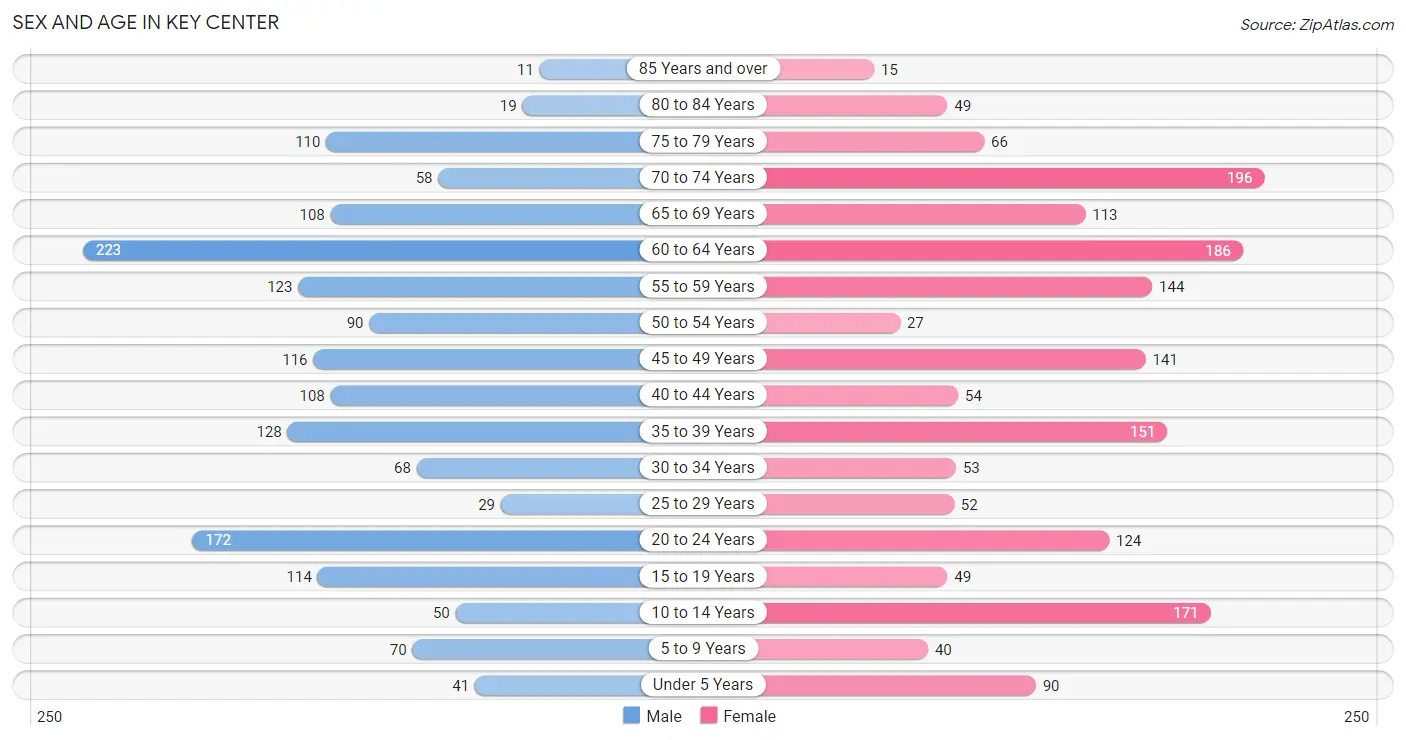
The most populous age groups in Key Center are 60 to 64 Years (223 | 13.6%) for men and 70 to 74 Years (196 | 11.4%) for women.
| Age Bracket | Male | Female |
| Under 5 Years | 41 (2.5%) | 90 (5.2%) |
| 5 to 9 Years | 70 (4.3%) | 40 (2.3%) |
| 10 to 14 Years | 50 (3.0%) | 171 (9.9%) |
| 15 to 19 Years | 114 (7.0%) | 49 (2.9%) |
| 20 to 24 Years | 172 (10.5%) | 124 (7.2%) |
| 25 to 29 Years | 29 (1.8%) | 52 (3.0%) |
| 30 to 34 Years | 68 (4.2%) | 53 (3.1%) |
| 35 to 39 Years | 128 (7.8%) | 151 (8.8%) |
| 40 to 44 Years | 108 (6.6%) | 54 (3.1%) |
| 45 to 49 Years | 116 (7.1%) | 141 (8.2%) |
| 50 to 54 Years | 90 (5.5%) | 27 (1.6%) |
| 55 to 59 Years | 123 (7.5%) | 144 (8.4%) |
| 60 to 64 Years | 223 (13.6%) | 186 (10.8%) |
| 65 to 69 Years | 108 (6.6%) | 113 (6.6%) |
| 70 to 74 Years | 58 (3.5%) | 196 (11.4%) |
| 75 to 79 Years | 110 (6.7%) | 66 (3.8%) |
| 80 to 84 Years | 19 (1.2%) | 49 (2.9%) |
| 85 Years and over | 11 (0.7%) | 15 (0.9%) |
| Total | 1,638 (100.0%) | 1,721 (100.0%) |
Families and Households in Key Center
Median Family Size in Key Center
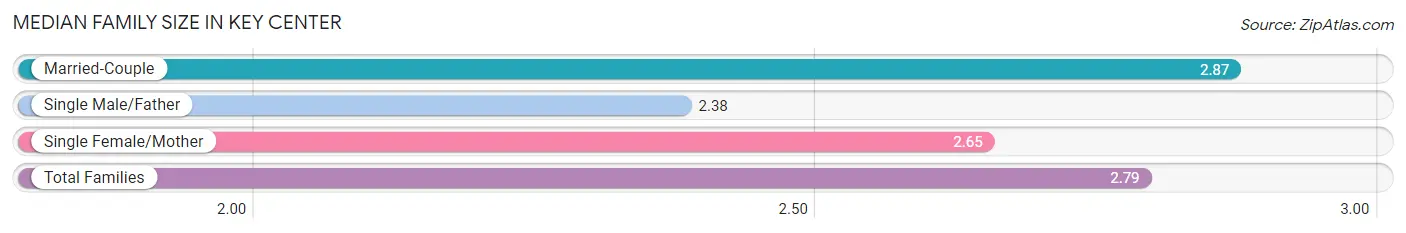
The median family size in Key Center is 2.79 persons per family, with married-couple families (689 | 72.8%) accounting for the largest median family size of 2.87 persons per family. On the other hand, single male/father families (79 | 8.4%) represent the smallest median family size with 2.38 persons per family.
| Family Type | # Families | Family Size |
| Married-Couple | 689 (72.8%) | 2.87 |
| Single Male/Father | 79 (8.4%) | 2.38 |
| Single Female/Mother | 178 (18.8%) | 2.65 |
| Total Families | 946 (100.0%) | 2.79 |
Median Household Size in Key Center
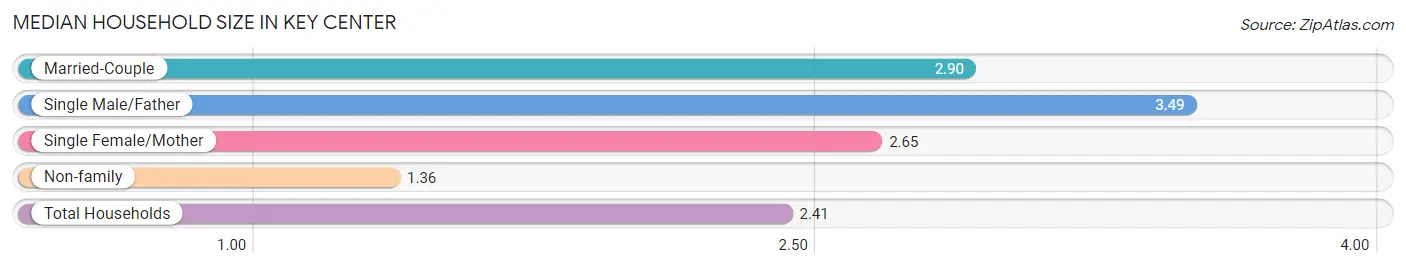
The median household size in Key Center is 2.41 persons per household, with single male/father households (79 | 5.7%) accounting for the largest median household size of 3.49 persons per household. non-family households (450 | 32.2%) represent the smallest median household size with 1.36 persons per household.
| Household Type | # Households | Household Size |
| Married-Couple | 689 (49.4%) | 2.90 |
| Single Male/Father | 79 (5.7%) | 3.49 |
| Single Female/Mother | 178 (12.8%) | 2.65 |
| Non-family | 450 (32.2%) | 1.36 |
| Total Households | 1,396 (100.0%) | 2.41 |
Household Size by Marriage Status in Key Center
Out of a total of 1,396 households in Key Center, 946 (67.8%) are family households, while 450 (32.2%) are nonfamily households. The most numerous type of family households are 2-person households, comprising 521, and the most common type of nonfamily households are 1-person households, comprising 294.
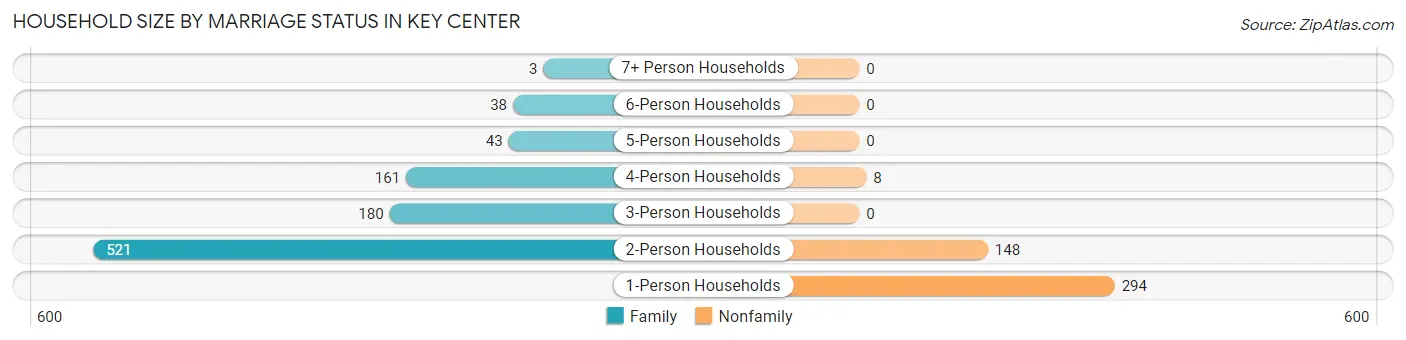
| Household Size | Family Households | Nonfamily Households |
| 1-Person Households | - | 294 (21.1%) |
| 2-Person Households | 521 (37.3%) | 148 (10.6%) |
| 3-Person Households | 180 (12.9%) | 0 (0.0%) |
| 4-Person Households | 161 (11.5%) | 8 (0.6%) |
| 5-Person Households | 43 (3.1%) | 0 (0.0%) |
| 6-Person Households | 38 (2.7%) | 0 (0.0%) |
| 7+ Person Households | 3 (0.2%) | 0 (0.0%) |
| Total | 946 (67.8%) | 450 (32.2%) |
Female Fertility in Key Center
Fertility by Age in Key Center
Average fertility rate in Key Center is 42.0 births per 1,000 women. Women in the age bracket of 20 to 34 years have the highest fertility rate with 114.0 births per 1,000 women. Women in the age bracket of 20 to 34 years acount for 100.0% of all women with births.
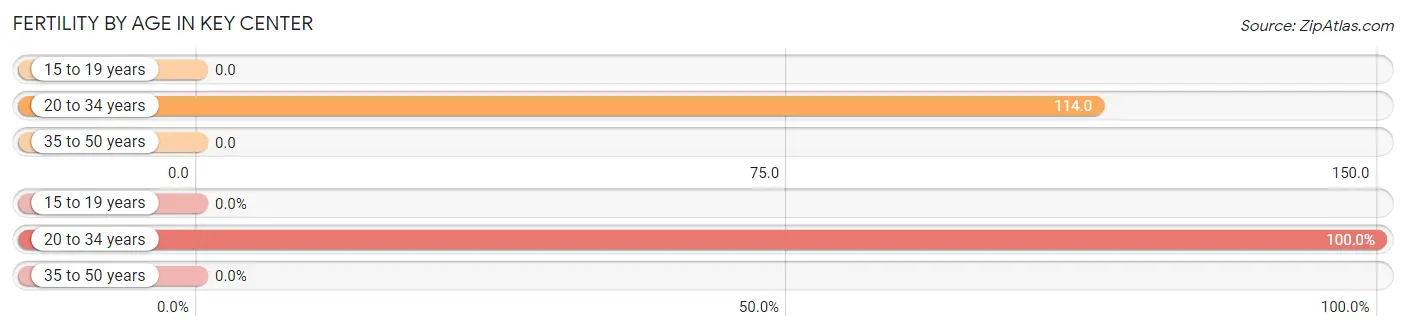
| Age Bracket | Women with Births | Births / 1,000 Women |
| 15 to 19 years | 0 (0.0%) | 0.0 |
| 20 to 34 years | 26 (100.0%) | 114.0 |
| 35 to 50 years | 0 (0.0%) | 0.0 |
| Total | 26 (100.0%) | 42.0 |
Fertility by Age by Marriage Status in Key Center
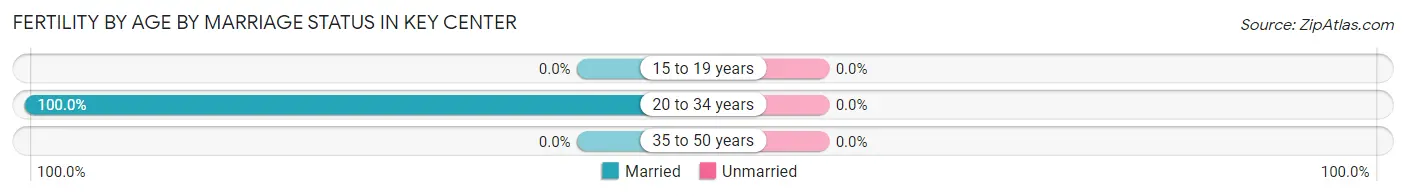
| Age Bracket | Married | Unmarried |
| 15 to 19 years | 0 (0.0%) | 0 (0.0%) |
| 20 to 34 years | 26 (100.0%) | 0 (0.0%) |
| 35 to 50 years | 0 (0.0%) | 0 (0.0%) |
| Total | 26 (100.0%) | 0 (0.0%) |
Fertility by Education in Key Center
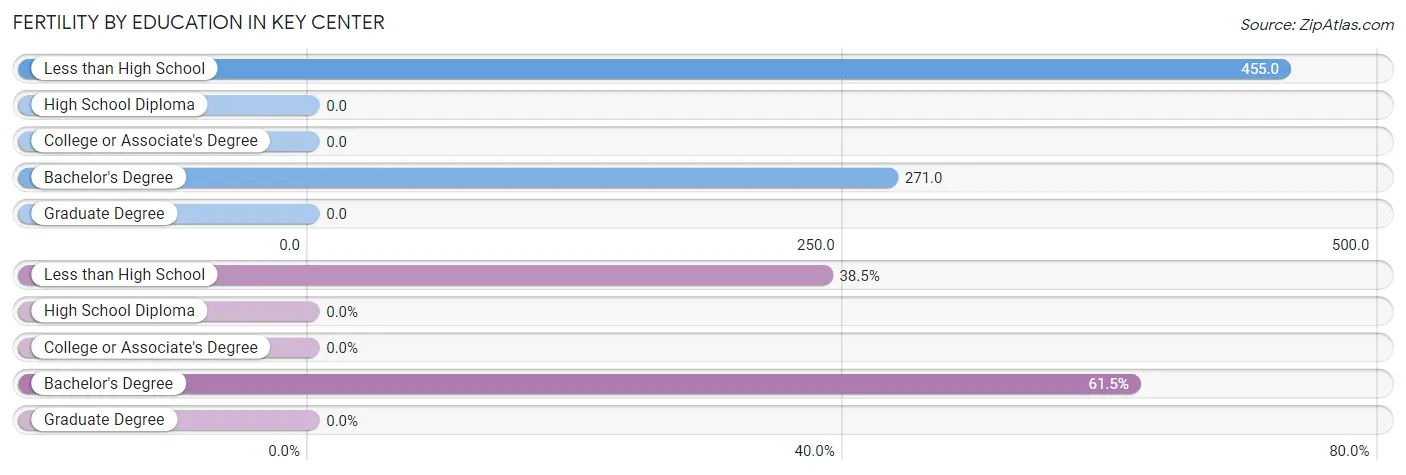
| Educational Attainment | Women with Births | Births / 1,000 Women |
| Less than High School | 10 (38.5%) | 455.0 |
| High School Diploma | 0 (0.0%) | 0.0 |
| College or Associate's Degree | 0 (0.0%) | 0.0 |
| Bachelor's Degree | 16 (61.5%) | 271.0 |
| Graduate Degree | 0 (0.0%) | 0.0 |
| Total | 26 (100.0%) | 42.0 |
Fertility by Education by Marriage Status in Key Center
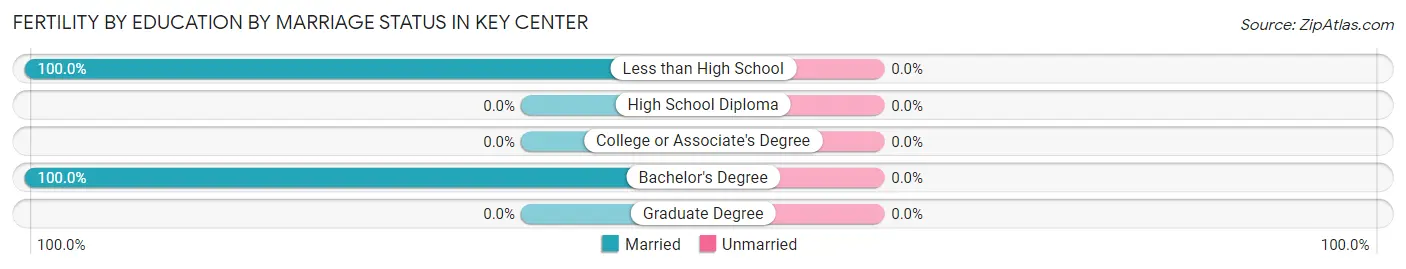
| Educational Attainment | Married | Unmarried |
| Less than High School | 10 (100.0%) | 0 (0.0%) |
| High School Diploma | 0 (0.0%) | 0 (0.0%) |
| College or Associate's Degree | 0 (0.0%) | 0 (0.0%) |
| Bachelor's Degree | 16 (100.0%) | 0 (0.0%) |
| Graduate Degree | 0 (0.0%) | 0 (0.0%) |
| Total | 26 (100.0%) | 0 (0.0%) |
Employment Characteristics in Key Center
Employment by Class of Employer in Key Center
Among the 1,370 employed individuals in Key Center, private company employees (765 | 55.8%), federal government employees (165 | 12.0%), and self-employed (not incorporated) (152 | 11.1%) make up the most common classes of employment.
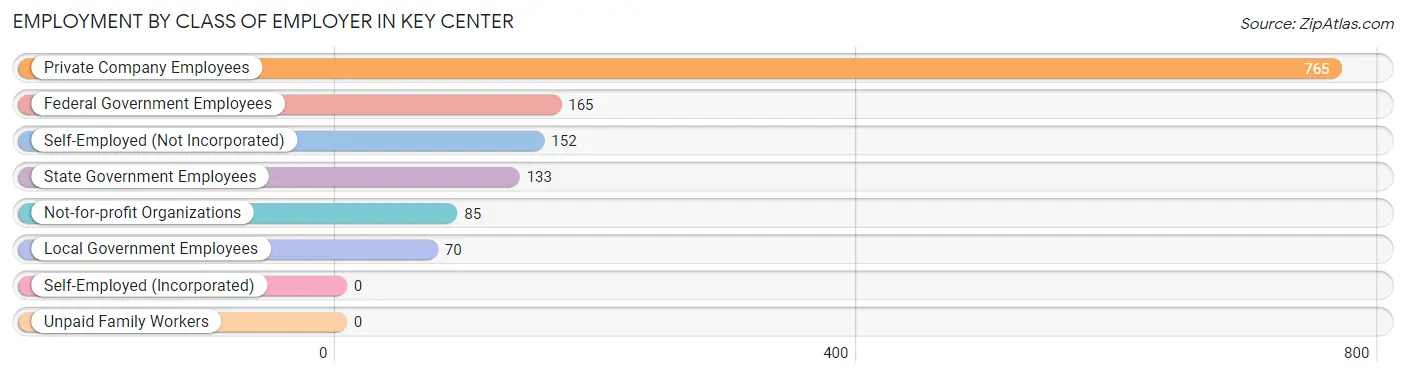
| Employer Class | # Employees | % Employees |
| Private Company Employees | 765 | 55.8% |
| Self-Employed (Incorporated) | 0 | 0.0% |
| Self-Employed (Not Incorporated) | 152 | 11.1% |
| Not-for-profit Organizations | 85 | 6.2% |
| Local Government Employees | 70 | 5.1% |
| State Government Employees | 133 | 9.7% |
| Federal Government Employees | 165 | 12.0% |
| Unpaid Family Workers | 0 | 0.0% |
| Total | 1,370 | 100.0% |
Employment Status by Age in Key Center
According to the labor force statistics for Key Center, out of the total population over 16 years of age (2,880), 54.1% or 1,558 individuals are in the labor force, with 5.9% or 92 of them unemployed. The age group with the highest labor force participation rate is 25 to 29 years, with 100.0% or 81 individuals in the labor force. Within the labor force, the 20 to 24 years age range has the highest percentage of unemployed individuals, with 18.9% or 37 of them being unemployed.
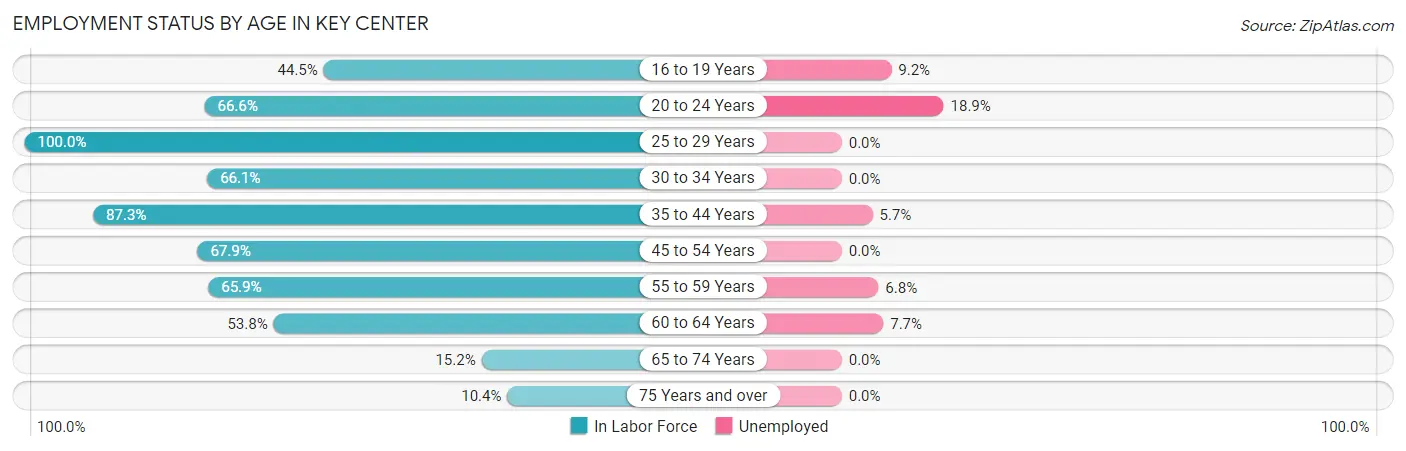
| Age Bracket | In Labor Force | Unemployed |
| 16 to 19 Years | 65 (44.5%) | 6 (9.2%) |
| 20 to 24 Years | 197 (66.6%) | 37 (18.9%) |
| 25 to 29 Years | 81 (100.0%) | 0 (0.0%) |
| 30 to 34 Years | 80 (66.1%) | 0 (0.0%) |
| 35 to 44 Years | 385 (87.3%) | 22 (5.7%) |
| 45 to 54 Years | 254 (67.9%) | 0 (0.0%) |
| 55 to 59 Years | 176 (65.9%) | 12 (6.8%) |
| 60 to 64 Years | 220 (53.8%) | 17 (7.7%) |
| 65 to 74 Years | 72 (15.2%) | 0 (0.0%) |
| 75 Years and over | 28 (10.4%) | 0 (0.0%) |
| Total | 1,558 (54.1%) | 92 (5.9%) |
Employment Status by Educational Attainment in Key Center
According to labor force statistics for Key Center, 70.6% of individuals (1,195) out of the total population between 25 and 64 years of age (1,693) are in the labor force, with 4.3% or 51 of them being unemployed. The group with the highest labor force participation rate are those with the educational attainment of bachelor's degree or higher, with 79.0% or 248 individuals in the labor force. Within the labor force, individuals with bachelor's degree or higher education have the highest percentage of unemployment, with 10.1% or 25 of them being unemployed.
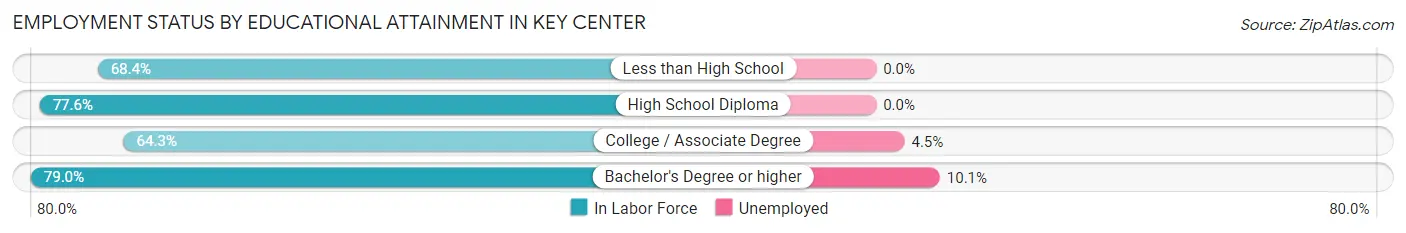
| Educational Attainment | In Labor Force | Unemployed |
| Less than High School | 26 (68.4%) | 0 (0.0%) |
| High School Diploma | 347 (77.6%) | 0 (0.0%) |
| College / Associate Degree | 575 (64.3%) | 40 (4.5%) |
| Bachelor's Degree or higher | 248 (79.0%) | 32 (10.1%) |
| Total | 1,195 (70.6%) | 73 (4.3%) |
Employment Occupations by Sex in Key Center
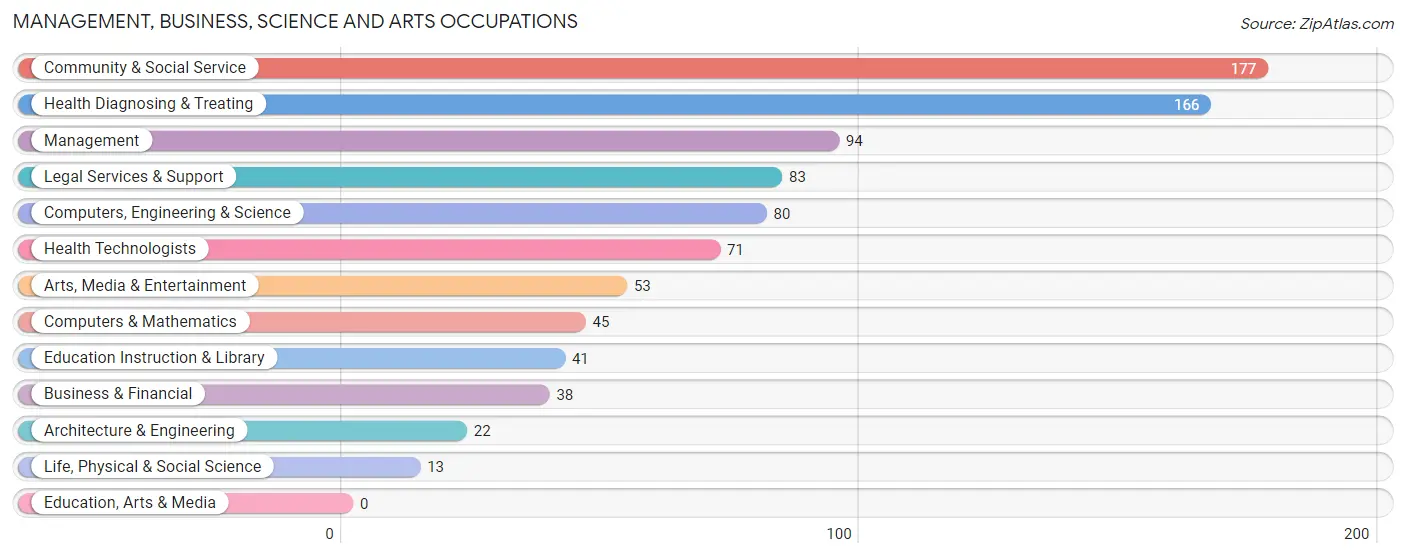
Management, Business, Science and Arts Occupations
The most common Management, Business, Science and Arts occupations in Key Center are Community & Social Service (177 | 12.2%), Health Diagnosing & Treating (166 | 11.5%), Management (94 | 6.5%), Legal Services & Support (83 | 5.7%), and Computers, Engineering & Science (80 | 5.5%).
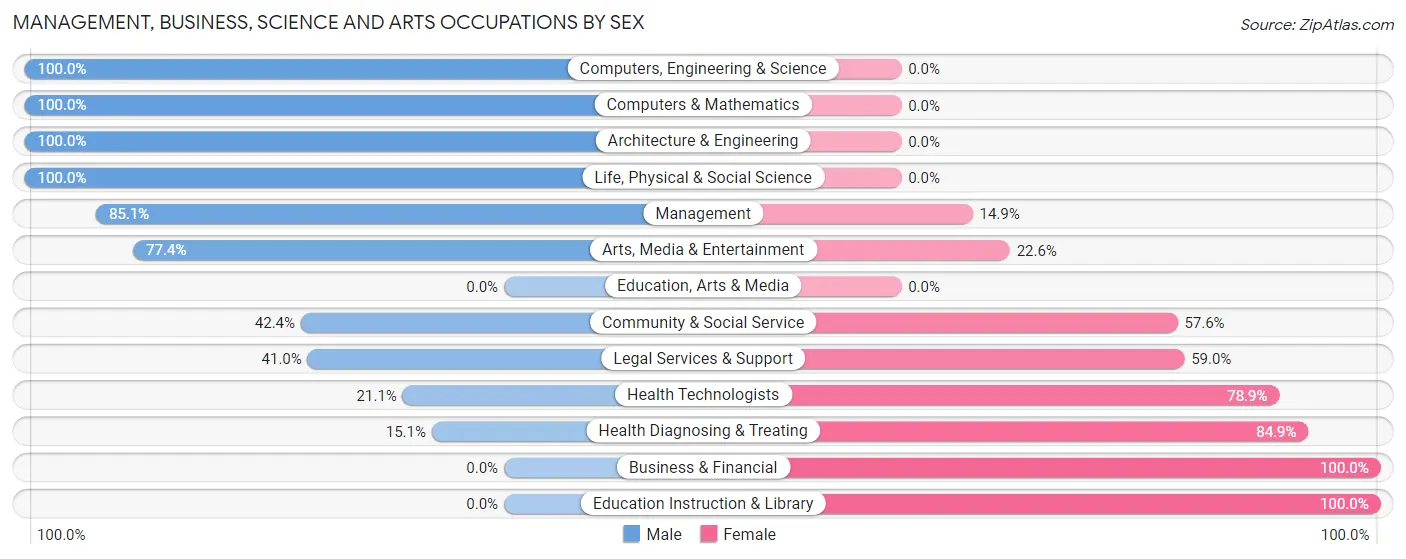
Management, Business, Science and Arts Occupations by Sex
Within the Management, Business, Science and Arts occupations in Key Center, the most male-oriented occupations are Computers, Engineering & Science (100.0%), Computers & Mathematics (100.0%), and Architecture & Engineering (100.0%), while the most female-oriented occupations are Business & Financial (100.0%), Education Instruction & Library (100.0%), and Health Diagnosing & Treating (84.9%).
| Occupation | Male | Female |
| Management | 80 (85.1%) | 14 (14.9%) |
| Business & Financial | 0 (0.0%) | 38 (100.0%) |
| Computers, Engineering & Science | 80 (100.0%) | 0 (0.0%) |
| Computers & Mathematics | 45 (100.0%) | 0 (0.0%) |
| Architecture & Engineering | 22 (100.0%) | 0 (0.0%) |
| Life, Physical & Social Science | 13 (100.0%) | 0 (0.0%) |
| Community & Social Service | 75 (42.4%) | 102 (57.6%) |
| Education, Arts & Media | 0 (0.0%) | 0 (0.0%) |
| Legal Services & Support | 34 (41.0%) | 49 (59.0%) |
| Education Instruction & Library | 0 (0.0%) | 41 (100.0%) |
| Arts, Media & Entertainment | 41 (77.4%) | 12 (22.6%) |
| Health Diagnosing & Treating | 25 (15.1%) | 141 (84.9%) |
| Health Technologists | 15 (21.1%) | 56 (78.9%) |
| Total (Category) | 260 (46.9%) | 295 (53.1%) |
| Total (Overall) | 770 (53.1%) | 680 (46.9%) |
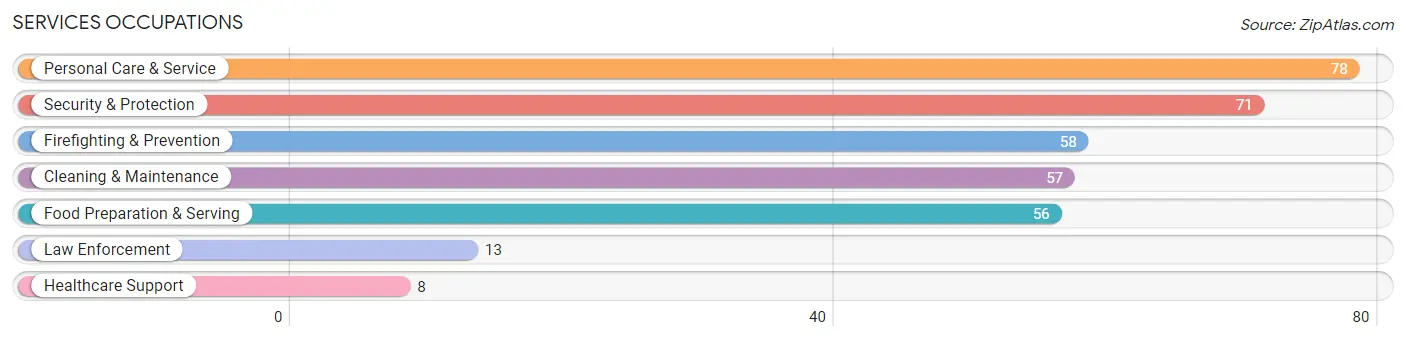
Services Occupations
The most common Services occupations in Key Center are Personal Care & Service (78 | 5.4%), Security & Protection (71 | 4.9%), Firefighting & Prevention (58 | 4.0%), Cleaning & Maintenance (57 | 3.9%), and Food Preparation & Serving (56 | 3.9%).
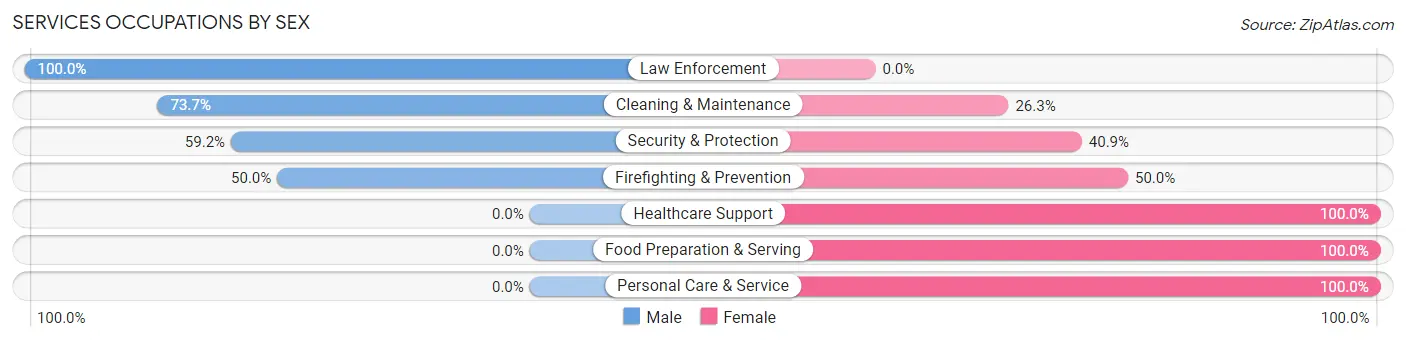
Services Occupations by Sex
Within the Services occupations in Key Center, the most male-oriented occupations are Law Enforcement (100.0%), Cleaning & Maintenance (73.7%), and Security & Protection (59.2%), while the most female-oriented occupations are Healthcare Support (100.0%), Food Preparation & Serving (100.0%), and Personal Care & Service (100.0%).
| Occupation | Male | Female |
| Healthcare Support | 0 (0.0%) | 8 (100.0%) |
| Security & Protection | 42 (59.2%) | 29 (40.8%) |
| Firefighting & Prevention | 29 (50.0%) | 29 (50.0%) |
| Law Enforcement | 13 (100.0%) | 0 (0.0%) |
| Food Preparation & Serving | 0 (0.0%) | 56 (100.0%) |
| Cleaning & Maintenance | 42 (73.7%) | 15 (26.3%) |
| Personal Care & Service | 0 (0.0%) | 78 (100.0%) |
| Total (Category) | 84 (31.1%) | 186 (68.9%) |
| Total (Overall) | 770 (53.1%) | 680 (46.9%) |
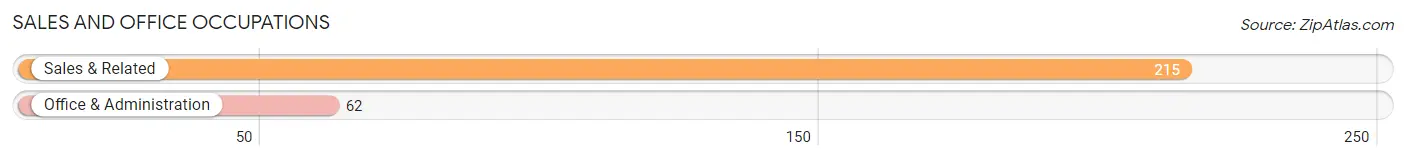
Sales and Office Occupations
The most common Sales and Office occupations in Key Center are Sales & Related (215 | 14.8%), and Office & Administration (62 | 4.3%).
Sales and Office Occupations by Sex
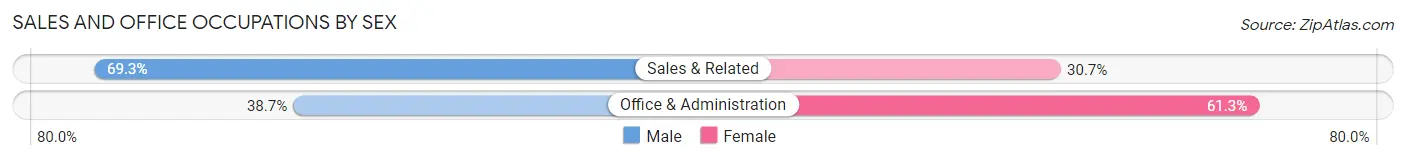
| Occupation | Male | Female |
| Sales & Related | 149 (69.3%) | 66 (30.7%) |
| Office & Administration | 24 (38.7%) | 38 (61.3%) |
| Total (Category) | 173 (62.5%) | 104 (37.6%) |
| Total (Overall) | 770 (53.1%) | 680 (46.9%) |
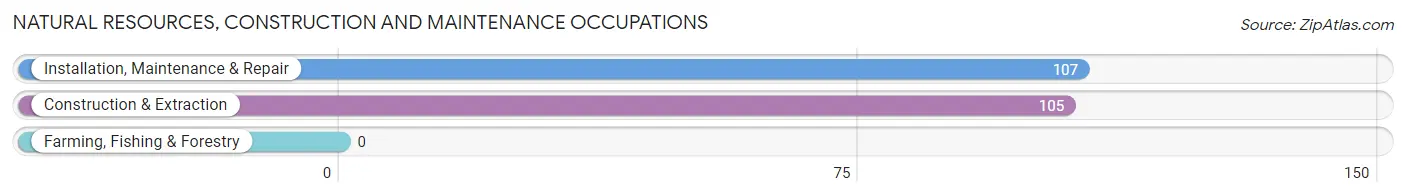
Natural Resources, Construction and Maintenance Occupations
The most common Natural Resources, Construction and Maintenance occupations in Key Center are Installation, Maintenance & Repair (107 | 7.4%), and Construction & Extraction (105 | 7.2%).
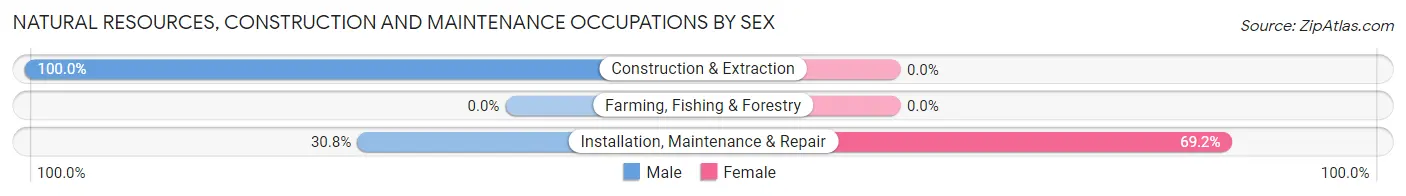
Natural Resources, Construction and Maintenance Occupations by Sex
| Occupation | Male | Female |
| Farming, Fishing & Forestry | 0 (0.0%) | 0 (0.0%) |
| Construction & Extraction | 105 (100.0%) | 0 (0.0%) |
| Installation, Maintenance & Repair | 33 (30.8%) | 74 (69.2%) |
| Total (Category) | 138 (65.1%) | 74 (34.9%) |
| Total (Overall) | 770 (53.1%) | 680 (46.9%) |
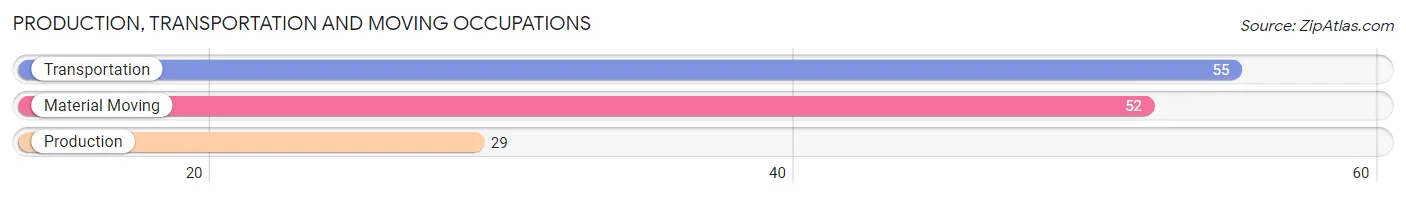
Production, Transportation and Moving Occupations
The most common Production, Transportation and Moving occupations in Key Center are Transportation (55 | 3.8%), Material Moving (52 | 3.6%), and Production (29 | 2.0%).
Production, Transportation and Moving Occupations by Sex
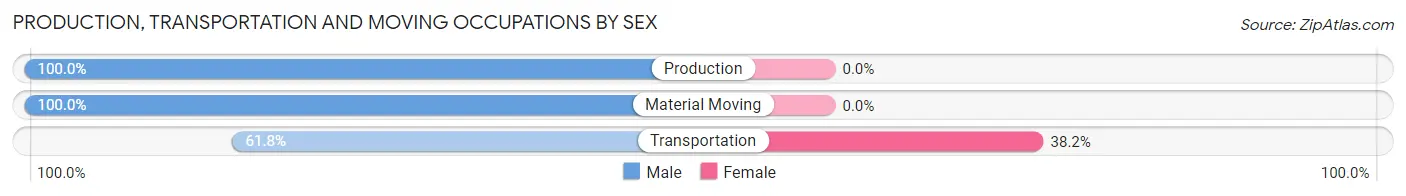
| Occupation | Male | Female |
| Production | 29 (100.0%) | 0 (0.0%) |
| Transportation | 34 (61.8%) | 21 (38.2%) |
| Material Moving | 52 (100.0%) | 0 (0.0%) |
| Total (Category) | 115 (84.6%) | 21 (15.4%) |
| Total (Overall) | 770 (53.1%) | 680 (46.9%) |
Employment Industries by Sex in Key Center
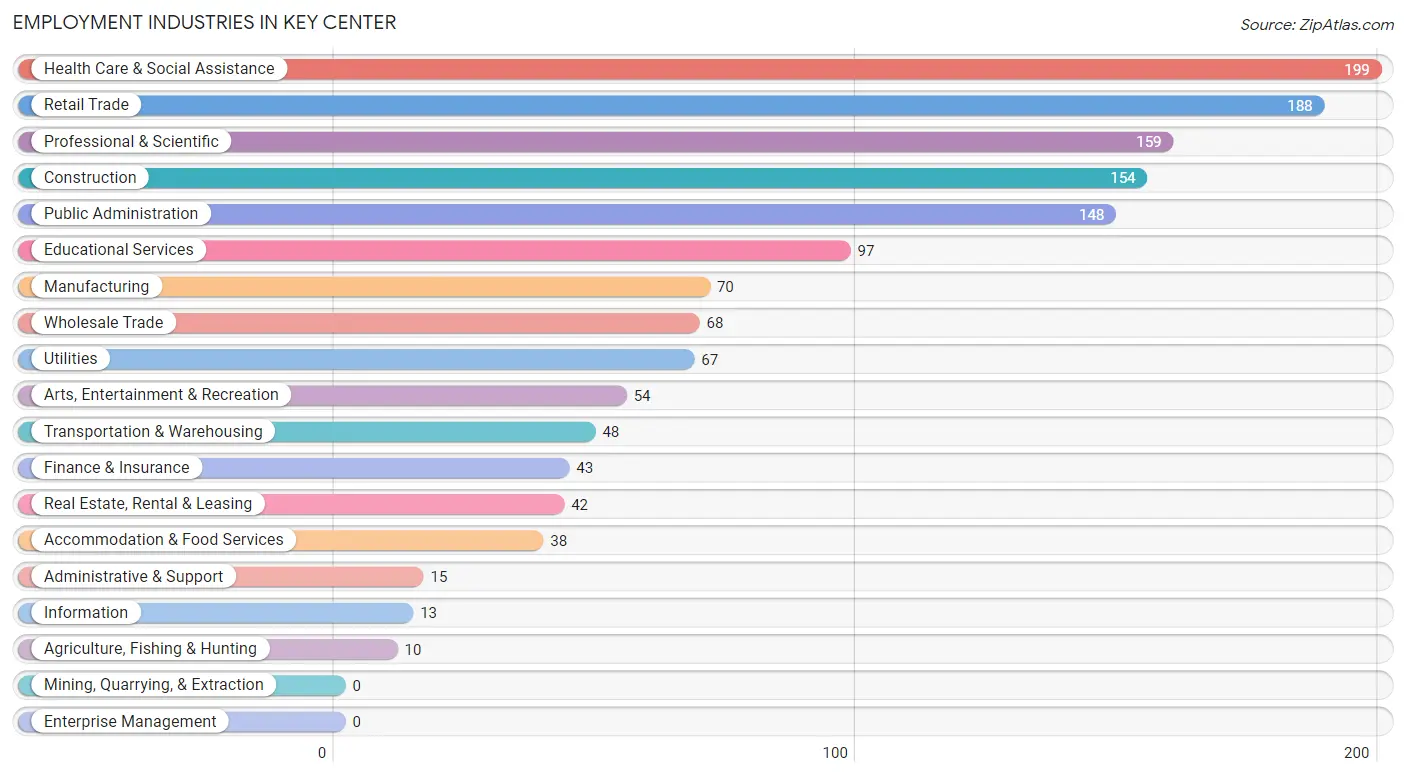
Employment Industries in Key Center
The major employment industries in Key Center include Health Care & Social Assistance (199 | 13.7%), Retail Trade (188 | 13.0%), Professional & Scientific (159 | 11.0%), Construction (154 | 10.6%), and Public Administration (148 | 10.2%).
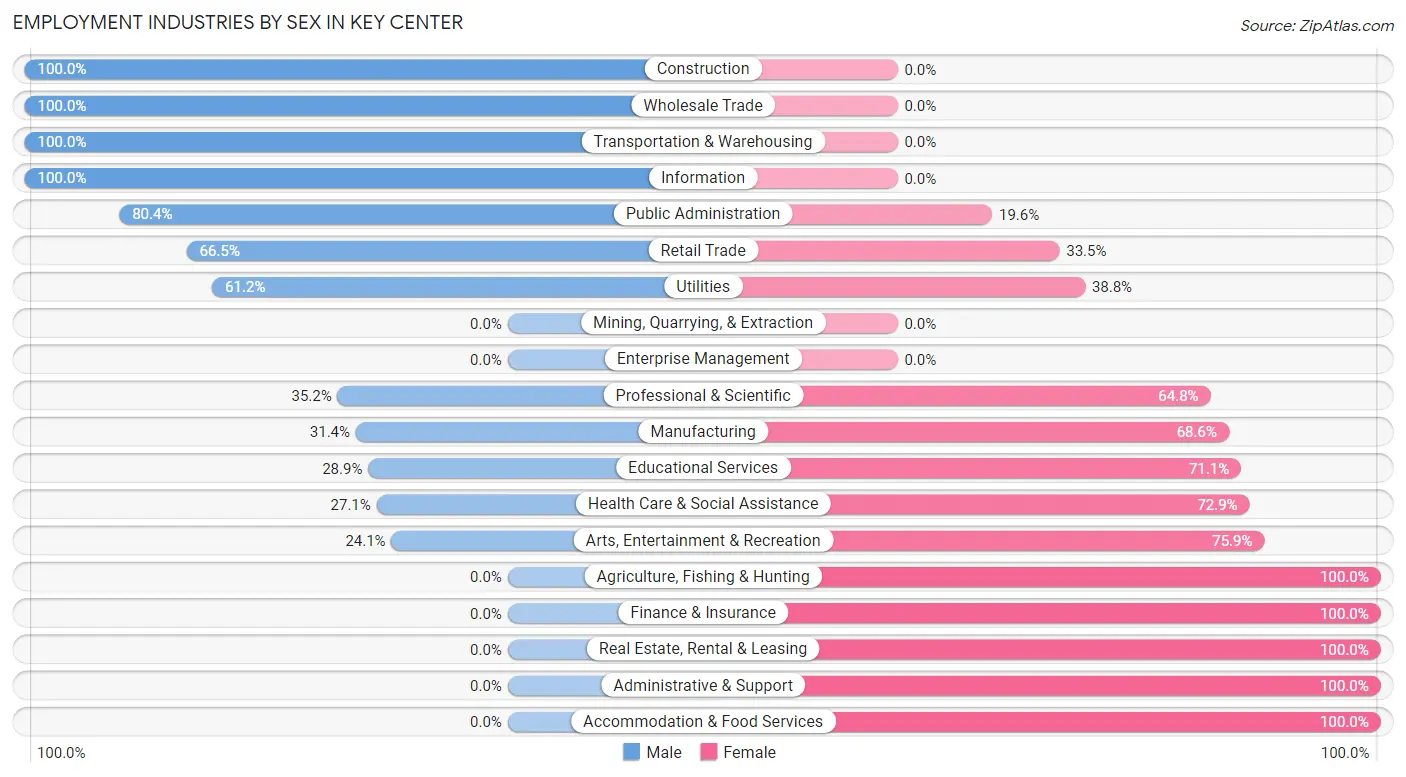
Employment Industries by Sex in Key Center
The Key Center industries that see more men than women are Construction (100.0%), Wholesale Trade (100.0%), and Transportation & Warehousing (100.0%), whereas the industries that tend to have a higher number of women are Agriculture, Fishing & Hunting (100.0%), Finance & Insurance (100.0%), and Real Estate, Rental & Leasing (100.0%).
| Industry | Male | Female |
| Agriculture, Fishing & Hunting | 0 (0.0%) | 10 (100.0%) |
| Mining, Quarrying, & Extraction | 0 (0.0%) | 0 (0.0%) |
| Construction | 154 (100.0%) | 0 (0.0%) |
| Manufacturing | 22 (31.4%) | 48 (68.6%) |
| Wholesale Trade | 68 (100.0%) | 0 (0.0%) |
| Retail Trade | 125 (66.5%) | 63 (33.5%) |
| Transportation & Warehousing | 48 (100.0%) | 0 (0.0%) |
| Utilities | 41 (61.2%) | 26 (38.8%) |
| Information | 13 (100.0%) | 0 (0.0%) |
| Finance & Insurance | 0 (0.0%) | 43 (100.0%) |
| Real Estate, Rental & Leasing | 0 (0.0%) | 42 (100.0%) |
| Professional & Scientific | 56 (35.2%) | 103 (64.8%) |
| Enterprise Management | 0 (0.0%) | 0 (0.0%) |
| Administrative & Support | 0 (0.0%) | 15 (100.0%) |
| Educational Services | 28 (28.9%) | 69 (71.1%) |
| Health Care & Social Assistance | 54 (27.1%) | 145 (72.9%) |
| Arts, Entertainment & Recreation | 13 (24.1%) | 41 (75.9%) |
| Accommodation & Food Services | 0 (0.0%) | 38 (100.0%) |
| Public Administration | 119 (80.4%) | 29 (19.6%) |
| Total | 770 (53.1%) | 680 (46.9%) |
Education in Key Center
School Enrollment in Key Center
The most common levels of schooling among the 690 students in Key Center are college / undergraduate (223 | 32.3%), middle school (207 | 30.0%), and high school (140 | 20.3%).
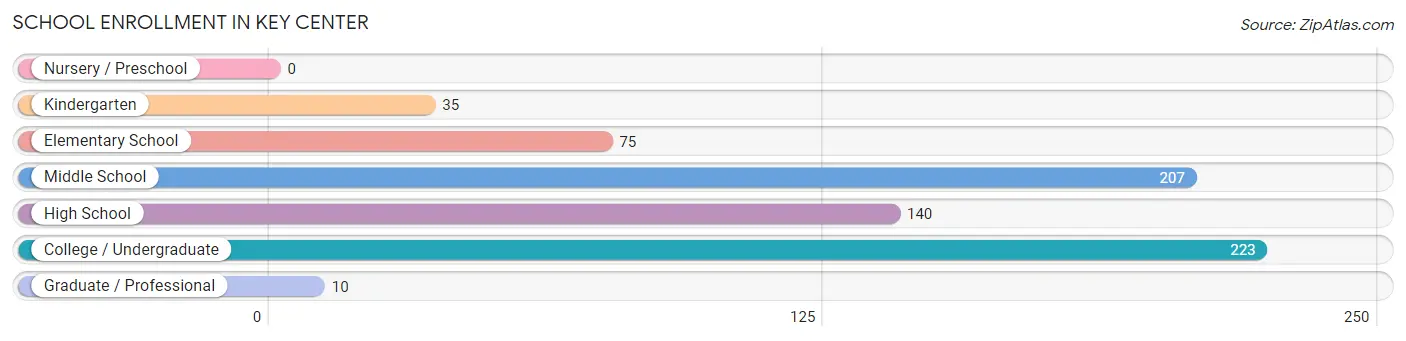
| School Level | # Students | % Students |
| Nursery / Preschool | 0 | 0.0% |
| Kindergarten | 35 | 5.1% |
| Elementary School | 75 | 10.9% |
| Middle School | 207 | 30.0% |
| High School | 140 | 20.3% |
| College / Undergraduate | 223 | 32.3% |
| Graduate / Professional | 10 | 1.5% |
| Total | 690 | 100.0% |
School Enrollment by Age by Funding Source in Key Center
Out of a total of 690 students who are enrolled in schools in Key Center, 87 (12.6%) attend a private institution, while the remaining 603 (87.4%) are enrolled in public schools. The age group of 18 to 19 year olds has the highest likelihood of being enrolled in private schools, with 9 (33.3% in the age bracket) enrolled. Conversely, the age group of 10 to 14 year olds has the lowest likelihood of being enrolled in a private school, with 221 (100.0% in the age bracket) attending a public institution.
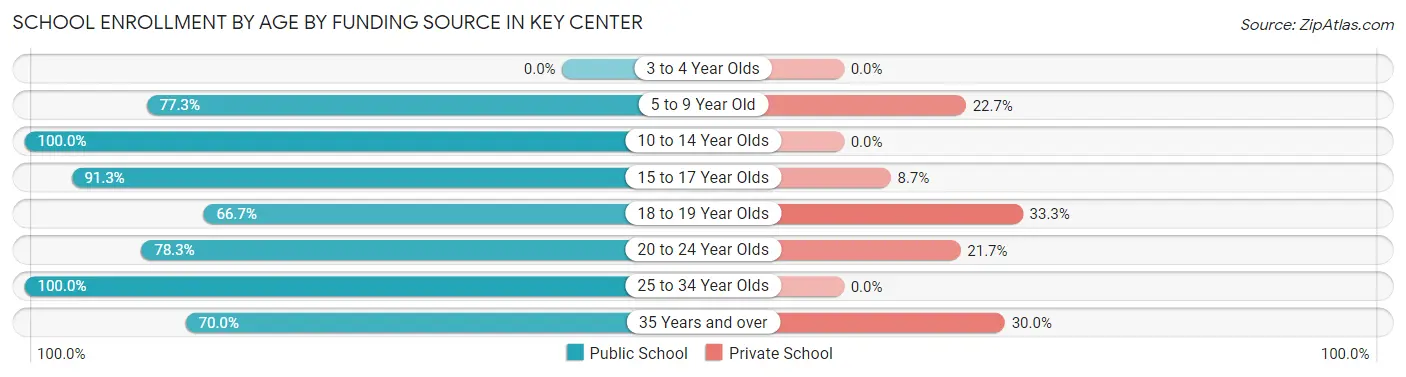
| Age Bracket | Public School | Private School |
| 3 to 4 Year Olds | 0 (0.0%) | 0 (0.0%) |
| 5 to 9 Year Old | 85 (77.3%) | 25 (22.7%) |
| 10 to 14 Year Olds | 221 (100.0%) | 0 (0.0%) |
| 15 to 17 Year Olds | 115 (91.3%) | 11 (8.7%) |
| 18 to 19 Year Olds | 18 (66.7%) | 9 (33.3%) |
| 20 to 24 Year Olds | 108 (78.3%) | 30 (21.7%) |
| 25 to 34 Year Olds | 28 (100.0%) | 0 (0.0%) |
| 35 Years and over | 28 (70.0%) | 12 (30.0%) |
| Total | 603 (87.4%) | 87 (12.6%) |
Educational Attainment by Field of Study in Key Center
Social sciences (99 | 15.1%), science & technology (75 | 11.5%), business (72 | 11.0%), education (68 | 10.4%), and engineering (59 | 9.0%) are the most common fields of study among 655 individuals in Key Center who have obtained a bachelor's degree or higher.
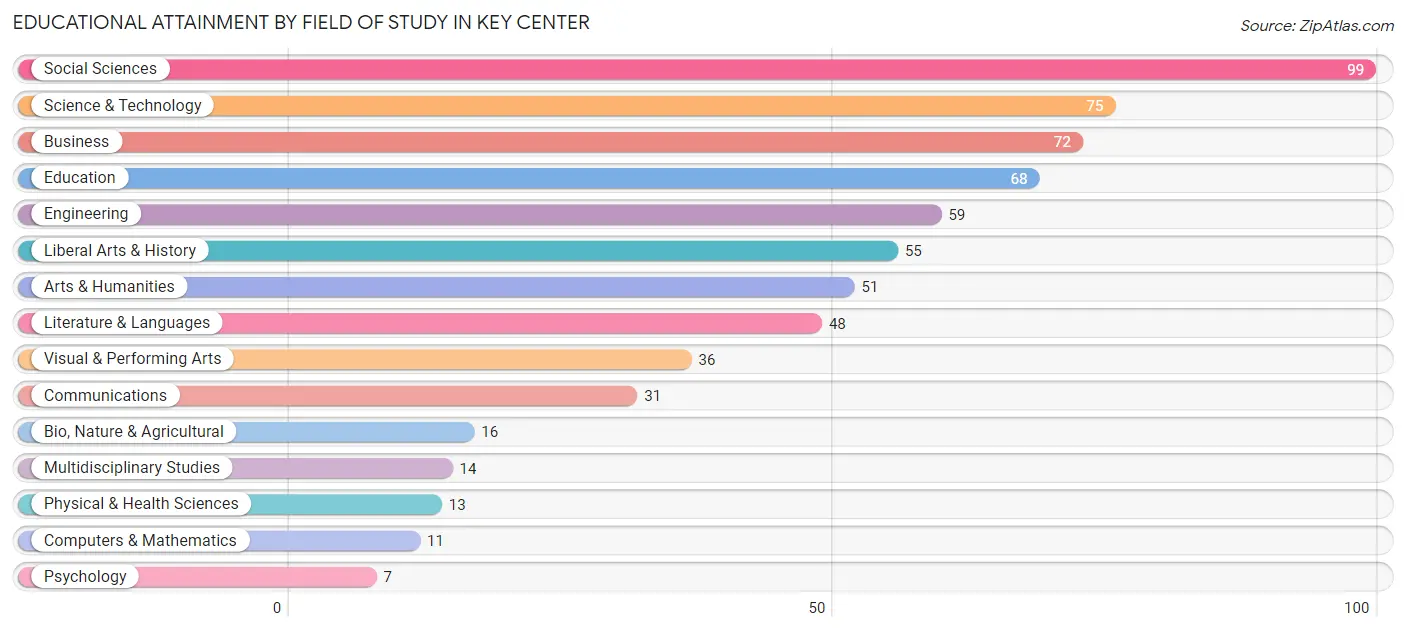
| Field of Study | # Graduates | % Graduates |
| Computers & Mathematics | 11 | 1.7% |
| Bio, Nature & Agricultural | 16 | 2.4% |
| Physical & Health Sciences | 13 | 2.0% |
| Psychology | 7 | 1.1% |
| Social Sciences | 99 | 15.1% |
| Engineering | 59 | 9.0% |
| Multidisciplinary Studies | 14 | 2.1% |
| Science & Technology | 75 | 11.5% |
| Business | 72 | 11.0% |
| Education | 68 | 10.4% |
| Literature & Languages | 48 | 7.3% |
| Liberal Arts & History | 55 | 8.4% |
| Visual & Performing Arts | 36 | 5.5% |
| Communications | 31 | 4.7% |
| Arts & Humanities | 51 | 7.8% |
| Total | 655 | 100.0% |
Transportation & Commute in Key Center
Vehicle Availability by Sex in Key Center
The most prevalent vehicle ownership categories in Key Center are males with 3 vehicles (309, accounting for 40.1%) and females with 3 vehicles (192, making up 51.6%).
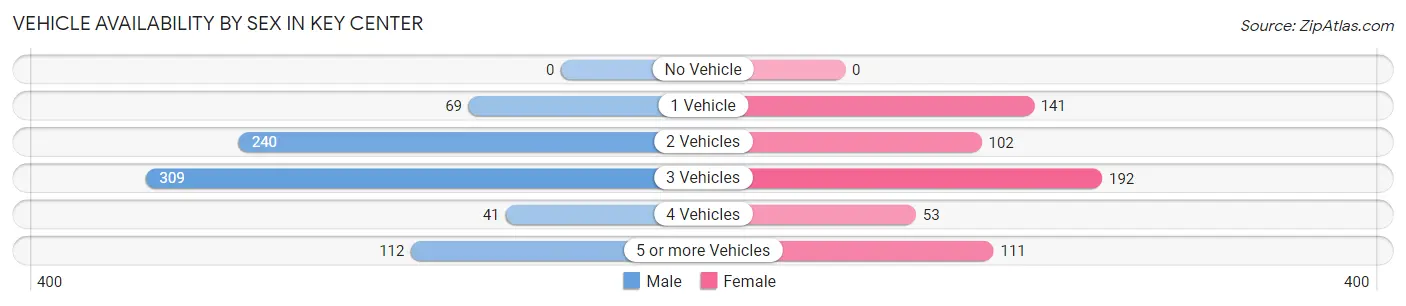
| Vehicles Available | Male | Female |
| No Vehicle | 0 (0.0%) | 0 (0.0%) |
| 1 Vehicle | 69 (8.9%) | 141 (23.5%) |
| 2 Vehicles | 240 (31.1%) | 102 (17.0%) |
| 3 Vehicles | 309 (40.1%) | 192 (32.1%) |
| 4 Vehicles | 41 (5.3%) | 53 (8.8%) |
| 5 or more Vehicles | 112 (14.5%) | 111 (18.5%) |
| Total | 771 (100.0%) | 599 (100.0%) |
Commute Time in Key Center
The most frequently occuring commute durations in Key Center are 30 to 34 minutes (256 commuters, 19.6%), 60 to 89 minutes (222 commuters, 17.0%), and 45 to 59 minutes (139 commuters, 10.6%).
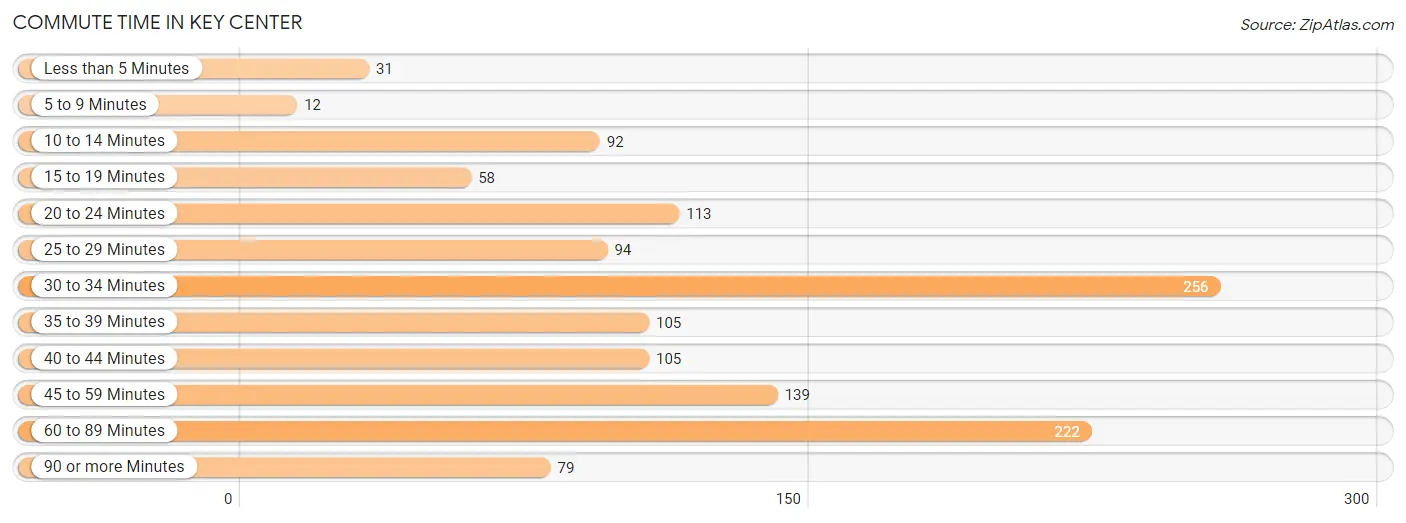
| Commute Time | # Commuters | % Commuters |
| Less than 5 Minutes | 31 | 2.4% |
| 5 to 9 Minutes | 12 | 0.9% |
| 10 to 14 Minutes | 92 | 7.0% |
| 15 to 19 Minutes | 58 | 4.4% |
| 20 to 24 Minutes | 113 | 8.6% |
| 25 to 29 Minutes | 94 | 7.2% |
| 30 to 34 Minutes | 256 | 19.6% |
| 35 to 39 Minutes | 105 | 8.0% |
| 40 to 44 Minutes | 105 | 8.0% |
| 45 to 59 Minutes | 139 | 10.6% |
| 60 to 89 Minutes | 222 | 17.0% |
| 90 or more Minutes | 79 | 6.0% |
Commute Time by Sex in Key Center
The most common commute times in Key Center are 60 to 89 minutes (145 commuters, 19.1%) for males and 30 to 34 minutes (119 commuters, 21.7%) for females.
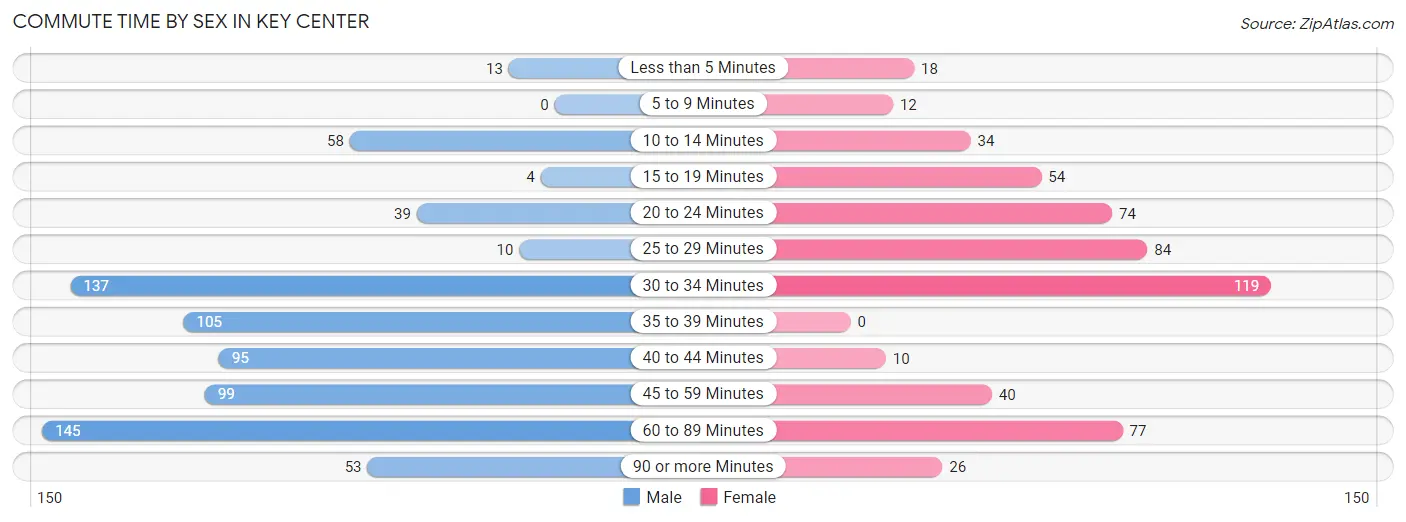
| Commute Time | Male | Female |
| Less than 5 Minutes | 13 (1.7%) | 18 (3.3%) |
| 5 to 9 Minutes | 0 (0.0%) | 12 (2.2%) |
| 10 to 14 Minutes | 58 (7.6%) | 34 (6.2%) |
| 15 to 19 Minutes | 4 (0.5%) | 54 (9.9%) |
| 20 to 24 Minutes | 39 (5.1%) | 74 (13.5%) |
| 25 to 29 Minutes | 10 (1.3%) | 84 (15.3%) |
| 30 to 34 Minutes | 137 (18.1%) | 119 (21.7%) |
| 35 to 39 Minutes | 105 (13.9%) | 0 (0.0%) |
| 40 to 44 Minutes | 95 (12.5%) | 10 (1.8%) |
| 45 to 59 Minutes | 99 (13.1%) | 40 (7.3%) |
| 60 to 89 Minutes | 145 (19.1%) | 77 (14.1%) |
| 90 or more Minutes | 53 (7.0%) | 26 (4.7%) |
Time of Departure to Work by Sex in Key Center
The most frequent times of departure to work in Key Center are 12:00 AM to 4:59 AM (128, 16.9%) for males and 8:00 AM to 8:29 AM (158, 28.8%) for females.
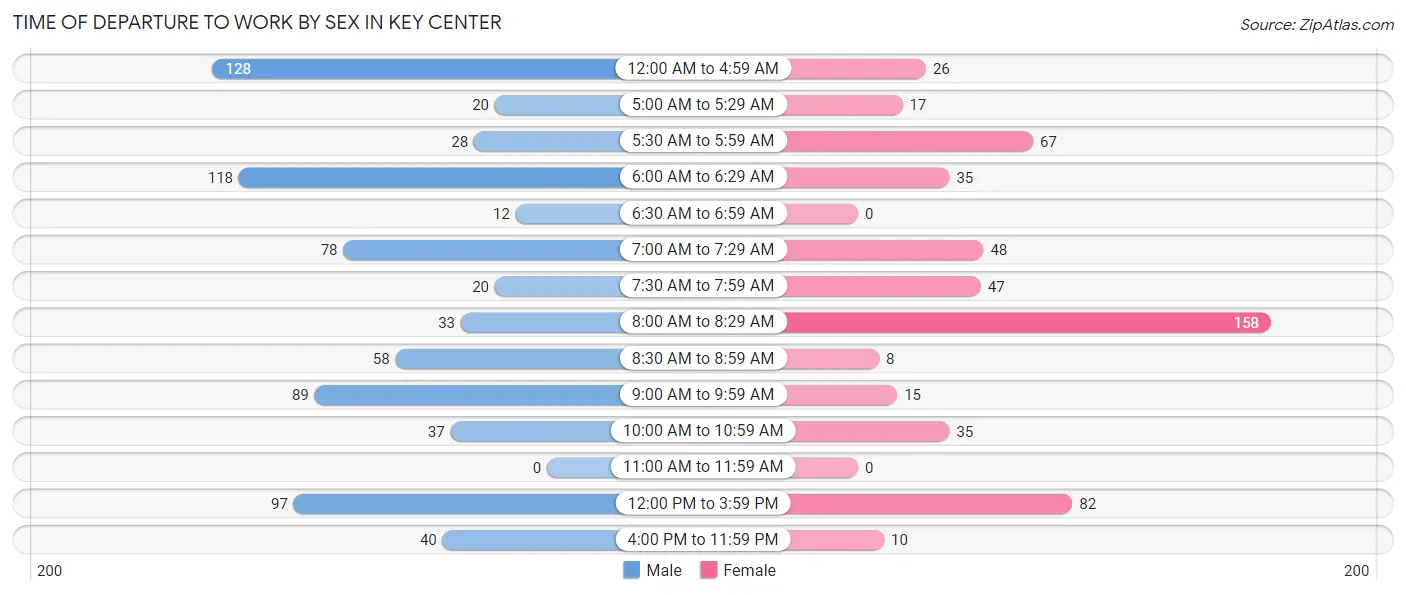
| Time of Departure | Male | Female |
| 12:00 AM to 4:59 AM | 128 (16.9%) | 26 (4.7%) |
| 5:00 AM to 5:29 AM | 20 (2.6%) | 17 (3.1%) |
| 5:30 AM to 5:59 AM | 28 (3.7%) | 67 (12.2%) |
| 6:00 AM to 6:29 AM | 118 (15.6%) | 35 (6.4%) |
| 6:30 AM to 6:59 AM | 12 (1.6%) | 0 (0.0%) |
| 7:00 AM to 7:29 AM | 78 (10.3%) | 48 (8.8%) |
| 7:30 AM to 7:59 AM | 20 (2.6%) | 47 (8.6%) |
| 8:00 AM to 8:29 AM | 33 (4.3%) | 158 (28.8%) |
| 8:30 AM to 8:59 AM | 58 (7.6%) | 8 (1.5%) |
| 9:00 AM to 9:59 AM | 89 (11.7%) | 15 (2.7%) |
| 10:00 AM to 10:59 AM | 37 (4.9%) | 35 (6.4%) |
| 11:00 AM to 11:59 AM | 0 (0.0%) | 0 (0.0%) |
| 12:00 PM to 3:59 PM | 97 (12.8%) | 82 (15.0%) |
| 4:00 PM to 11:59 PM | 40 (5.3%) | 10 (1.8%) |
| Total | 758 (100.0%) | 548 (100.0%) |
Housing Occupancy in Key Center
Occupancy by Ownership in Key Center
Of the total 1,396 dwellings in Key Center, owner-occupied units account for 1,147 (82.2%), while renter-occupied units make up 249 (17.8%).
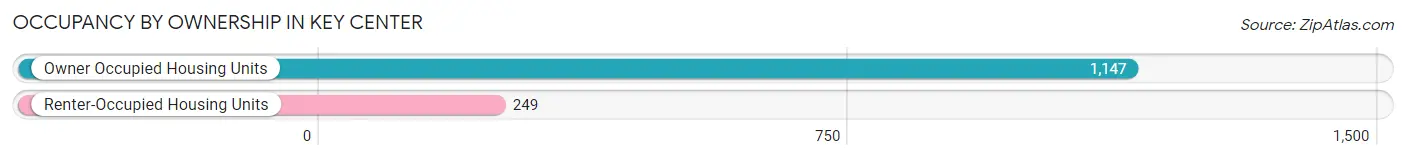
| Occupancy | # Housing Units | % Housing Units |
| Owner Occupied Housing Units | 1,147 | 82.2% |
| Renter-Occupied Housing Units | 249 | 17.8% |
| Total Occupied Housing Units | 1,396 | 100.0% |
Occupancy by Household Size in Key Center
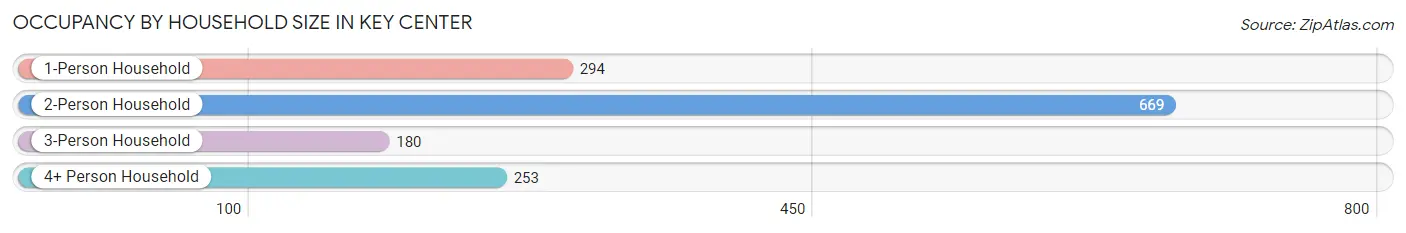
| Household Size | # Housing Units | % Housing Units |
| 1-Person Household | 294 | 21.1% |
| 2-Person Household | 669 | 47.9% |
| 3-Person Household | 180 | 12.9% |
| 4+ Person Household | 253 | 18.1% |
| Total Housing Units | 1,396 | 100.0% |
Occupancy by Ownership by Household Size in Key Center
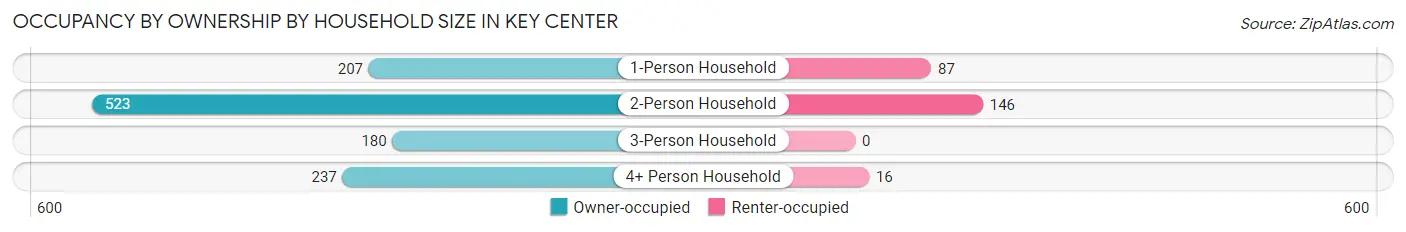
| Household Size | Owner-occupied | Renter-occupied |
| 1-Person Household | 207 (70.4%) | 87 (29.6%) |
| 2-Person Household | 523 (78.2%) | 146 (21.8%) |
| 3-Person Household | 180 (100.0%) | 0 (0.0%) |
| 4+ Person Household | 237 (93.7%) | 16 (6.3%) |
| Total Housing Units | 1,147 (82.2%) | 249 (17.8%) |
Occupancy by Educational Attainment in Key Center
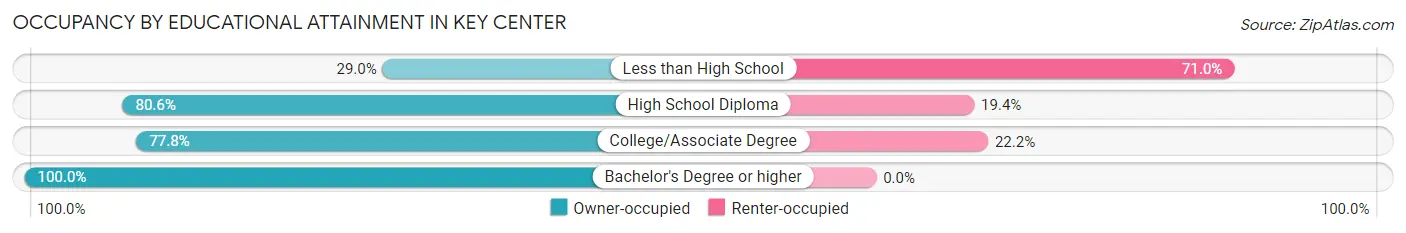
| Household Size | Owner-occupied | Renter-occupied |
| Less than High School | 18 (29.0%) | 44 (71.0%) |
| High School Diploma | 282 (80.6%) | 68 (19.4%) |
| College/Associate Degree | 481 (77.8%) | 137 (22.2%) |
| Bachelor's Degree or higher | 366 (100.0%) | 0 (0.0%) |
Occupancy by Age of Householder in Key Center
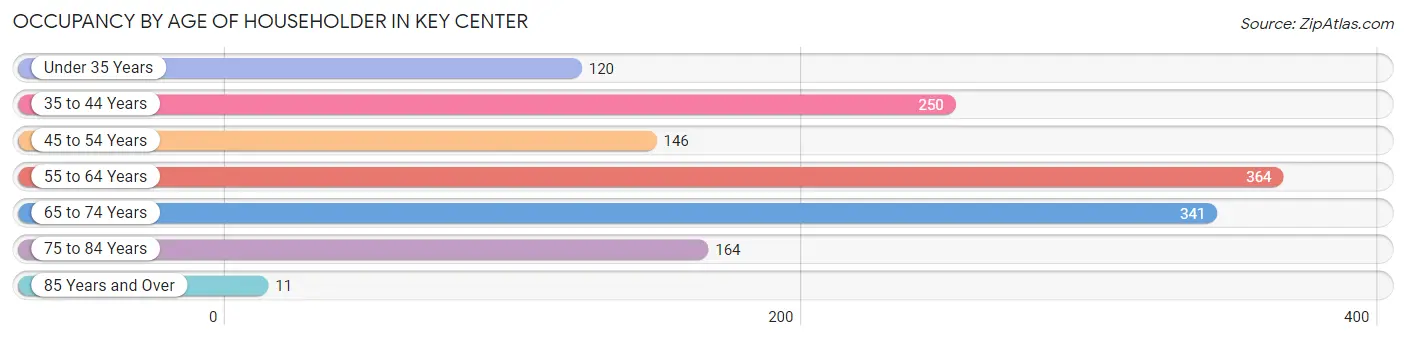
| Age Bracket | # Households | % Households |
| Under 35 Years | 120 | 8.6% |
| 35 to 44 Years | 250 | 17.9% |
| 45 to 54 Years | 146 | 10.5% |
| 55 to 64 Years | 364 | 26.1% |
| 65 to 74 Years | 341 | 24.4% |
| 75 to 84 Years | 164 | 11.7% |
| 85 Years and Over | 11 | 0.8% |
| Total | 1,396 | 100.0% |
Housing Finances in Key Center
Median Income by Occupancy in Key Center
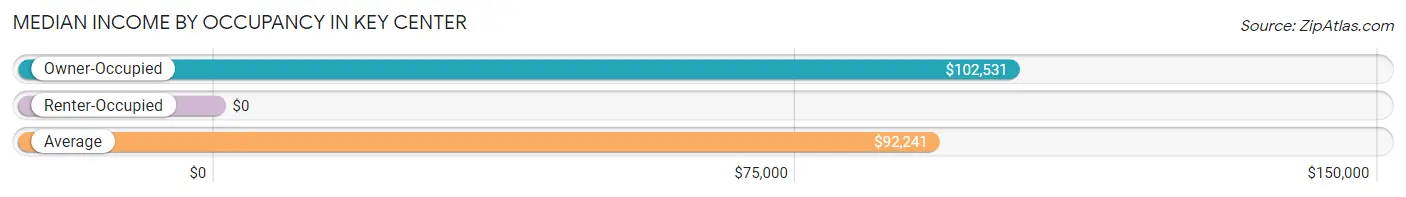
| Occupancy Type | # Households | Median Income |
| Owner-Occupied | 1,147 (82.2%) | $102,531 |
| Renter-Occupied | 249 (17.8%) | $0 |
| Average | 1,396 (100.0%) | $92,241 |
Occupancy by Householder Income Bracket in Key Center
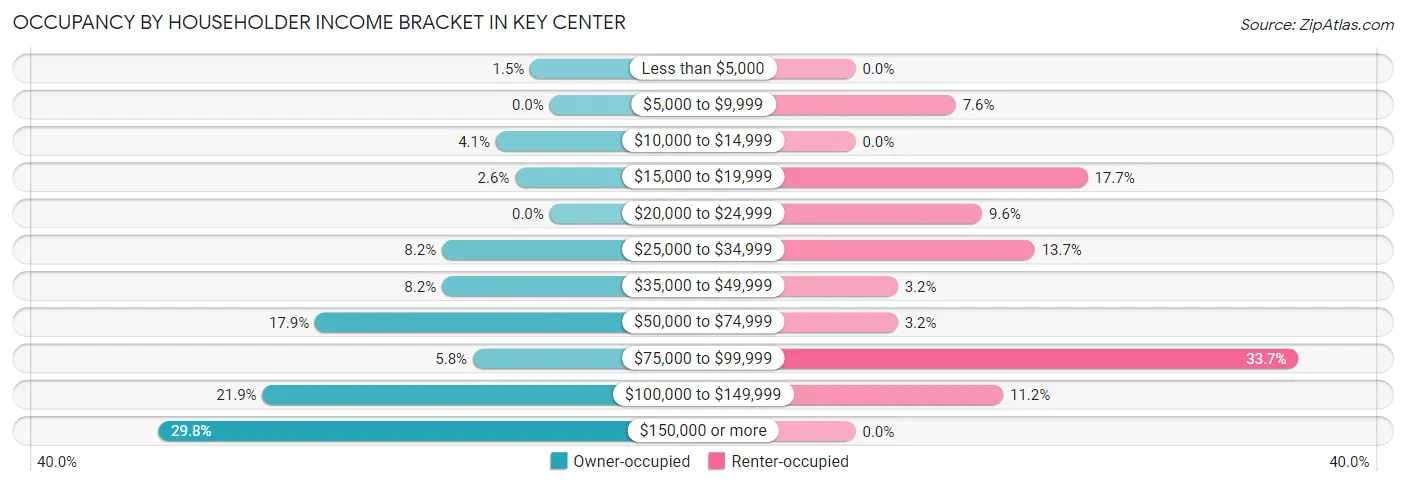
| Income Bracket | Owner-occupied | Renter-occupied |
| Less than $5,000 | 17 (1.5%) | 0 (0.0%) |
| $5,000 to $9,999 | 0 (0.0%) | 19 (7.6%) |
| $10,000 to $14,999 | 47 (4.1%) | 0 (0.0%) |
| $15,000 to $19,999 | 30 (2.6%) | 44 (17.7%) |
| $20,000 to $24,999 | 0 (0.0%) | 24 (9.6%) |
| $25,000 to $34,999 | 94 (8.2%) | 34 (13.7%) |
| $35,000 to $49,999 | 94 (8.2%) | 8 (3.2%) |
| $50,000 to $74,999 | 205 (17.9%) | 8 (3.2%) |
| $75,000 to $99,999 | 67 (5.8%) | 84 (33.7%) |
| $100,000 to $149,999 | 251 (21.9%) | 28 (11.2%) |
| $150,000 or more | 342 (29.8%) | 0 (0.0%) |
| Total | 1,147 (100.0%) | 249 (100.0%) |
Monthly Housing Cost Tiers in Key Center
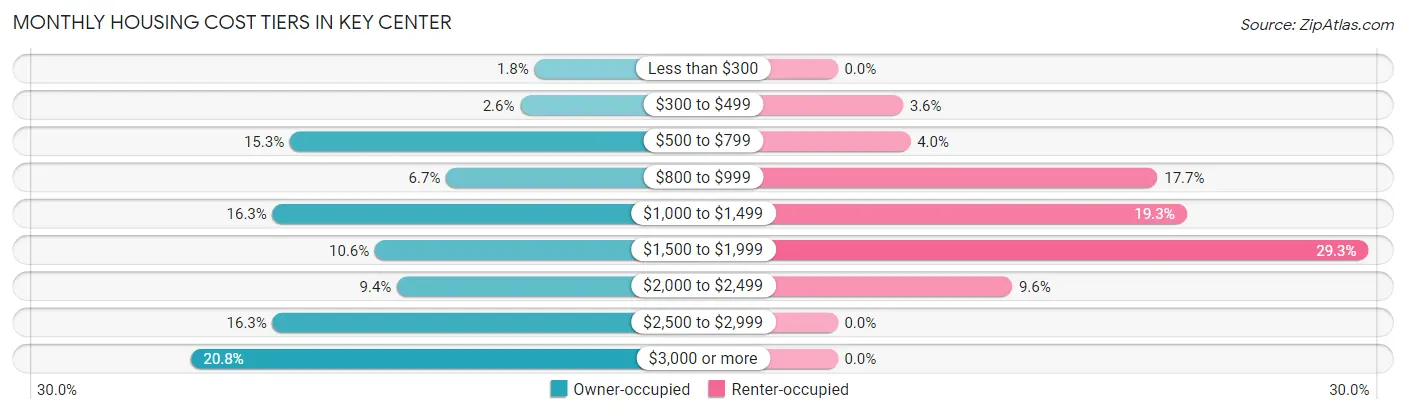
| Monthly Cost | Owner-occupied | Renter-occupied |
| Less than $300 | 21 (1.8%) | 0 (0.0%) |
| $300 to $499 | 30 (2.6%) | 9 (3.6%) |
| $500 to $799 | 176 (15.3%) | 10 (4.0%) |
| $800 to $999 | 77 (6.7%) | 44 (17.7%) |
| $1,000 to $1,499 | 187 (16.3%) | 48 (19.3%) |
| $1,500 to $1,999 | 122 (10.6%) | 73 (29.3%) |
| $2,000 to $2,499 | 108 (9.4%) | 24 (9.6%) |
| $2,500 to $2,999 | 187 (16.3%) | 0 (0.0%) |
| $3,000 or more | 239 (20.8%) | 0 (0.0%) |
| Total | 1,147 (100.0%) | 249 (100.0%) |
Physical Housing Characteristics in Key Center
Housing Structures in Key Center
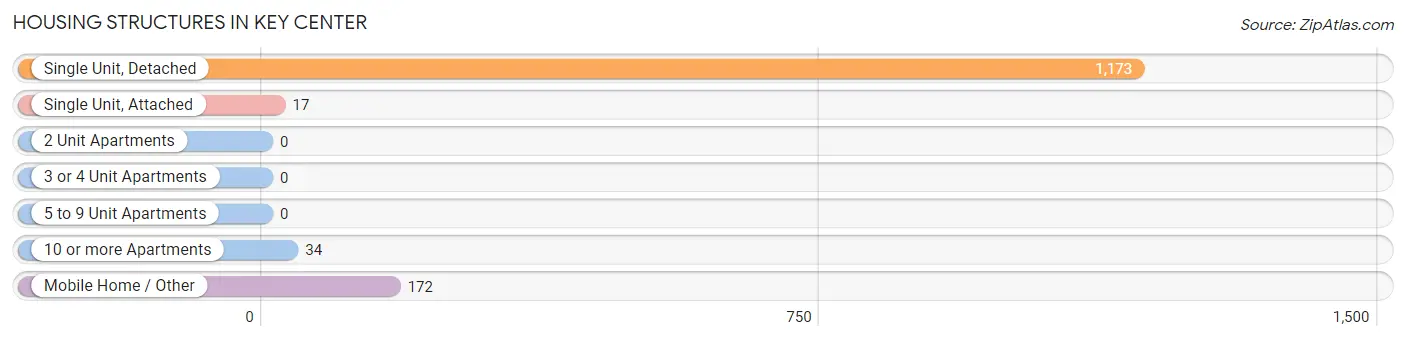
| Structure Type | # Housing Units | % Housing Units |
| Single Unit, Detached | 1,173 | 84.0% |
| Single Unit, Attached | 17 | 1.2% |
| 2 Unit Apartments | 0 | 0.0% |
| 3 or 4 Unit Apartments | 0 | 0.0% |
| 5 to 9 Unit Apartments | 0 | 0.0% |
| 10 or more Apartments | 34 | 2.4% |
| Mobile Home / Other | 172 | 12.3% |
| Total | 1,396 | 100.0% |
Housing Structures by Occupancy in Key Center
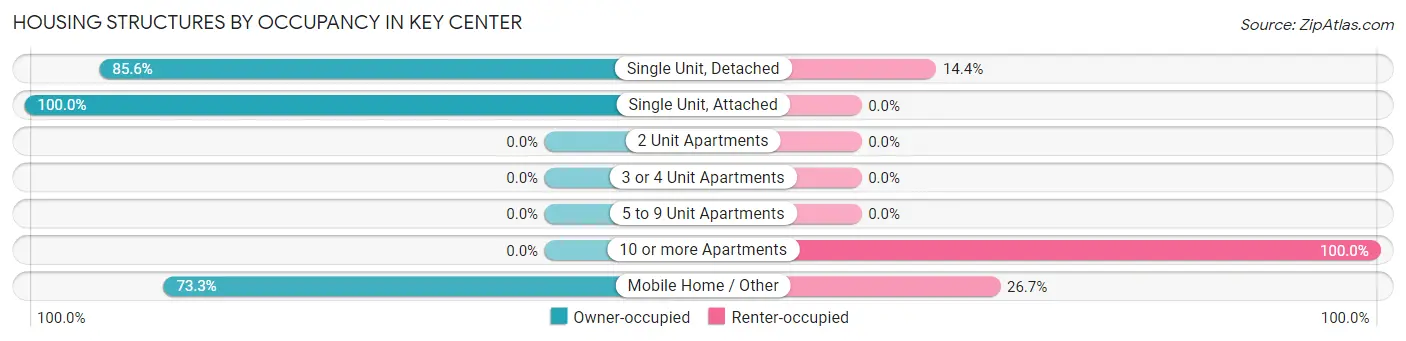
| Structure Type | Owner-occupied | Renter-occupied |
| Single Unit, Detached | 1,004 (85.6%) | 169 (14.4%) |
| Single Unit, Attached | 17 (100.0%) | 0 (0.0%) |
| 2 Unit Apartments | 0 (0.0%) | 0 (0.0%) |
| 3 or 4 Unit Apartments | 0 (0.0%) | 0 (0.0%) |
| 5 to 9 Unit Apartments | 0 (0.0%) | 0 (0.0%) |
| 10 or more Apartments | 0 (0.0%) | 34 (100.0%) |
| Mobile Home / Other | 126 (73.3%) | 46 (26.7%) |
| Total | 1,147 (82.2%) | 249 (17.8%) |
Housing Structures by Number of Rooms in Key Center
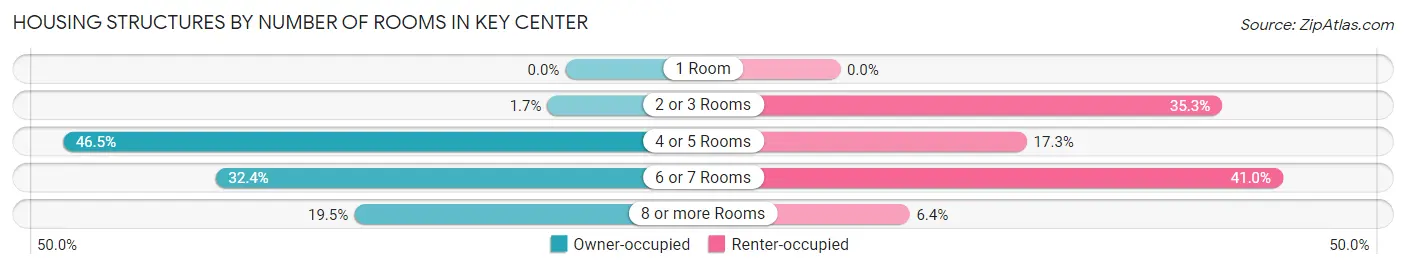
| Number of Rooms | Owner-occupied | Renter-occupied |
| 1 Room | 0 (0.0%) | 0 (0.0%) |
| 2 or 3 Rooms | 19 (1.7%) | 88 (35.3%) |
| 4 or 5 Rooms | 533 (46.5%) | 43 (17.3%) |
| 6 or 7 Rooms | 371 (32.4%) | 102 (41.0%) |
| 8 or more Rooms | 224 (19.5%) | 16 (6.4%) |
| Total | 1,147 (100.0%) | 249 (100.0%) |
Housing Structure by Heating Type in Key Center
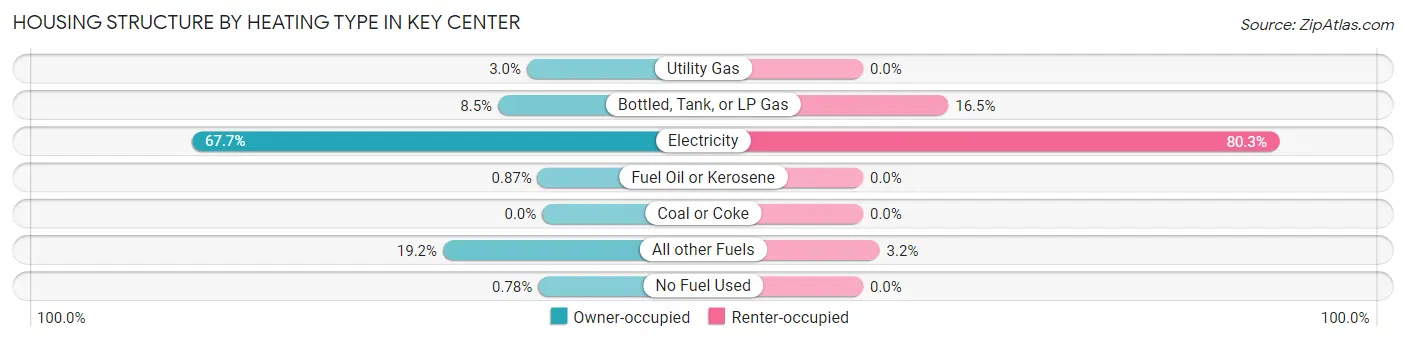
| Heating Type | Owner-occupied | Renter-occupied |
| Utility Gas | 34 (3.0%) | 0 (0.0%) |
| Bottled, Tank, or LP Gas | 98 (8.5%) | 41 (16.5%) |
| Electricity | 776 (67.6%) | 200 (80.3%) |
| Fuel Oil or Kerosene | 10 (0.9%) | 0 (0.0%) |
| Coal or Coke | 0 (0.0%) | 0 (0.0%) |
| All other Fuels | 220 (19.2%) | 8 (3.2%) |
| No Fuel Used | 9 (0.8%) | 0 (0.0%) |
| Total | 1,147 (100.0%) | 249 (100.0%) |
Household Vehicle Usage in Key Center
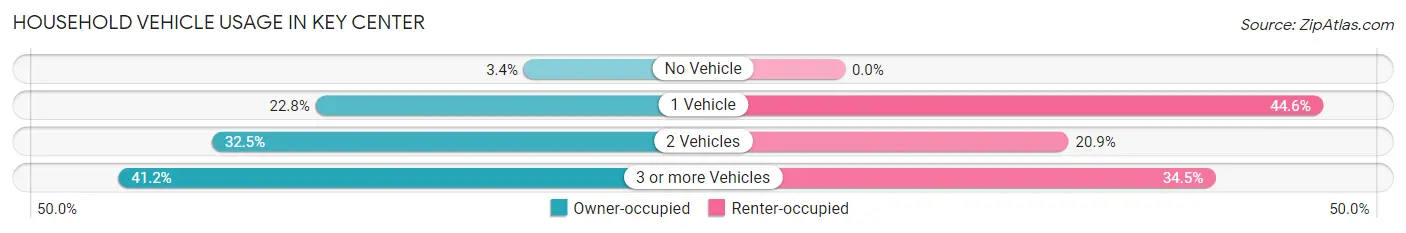
| Vehicles per Household | Owner-occupied | Renter-occupied |
| No Vehicle | 39 (3.4%) | 0 (0.0%) |
| 1 Vehicle | 262 (22.8%) | 111 (44.6%) |
| 2 Vehicles | 373 (32.5%) | 52 (20.9%) |
| 3 or more Vehicles | 473 (41.2%) | 86 (34.5%) |
| Total | 1,147 (100.0%) | 249 (100.0%) |
Real Estate & Mortgages in Key Center
Real Estate and Mortgage Overview in Key Center
| Characteristic | Without Mortgage | With Mortgage |
| Housing Units | 283 | 864 |
| Median Property Value | $447,900 | $488,100 |
| Median Household Income | $101,645 | $236 |
| Monthly Housing Costs | $642 | $239 |
| Real Estate Taxes | $3,885 | $0 |
Property Value by Mortgage Status in Key Center
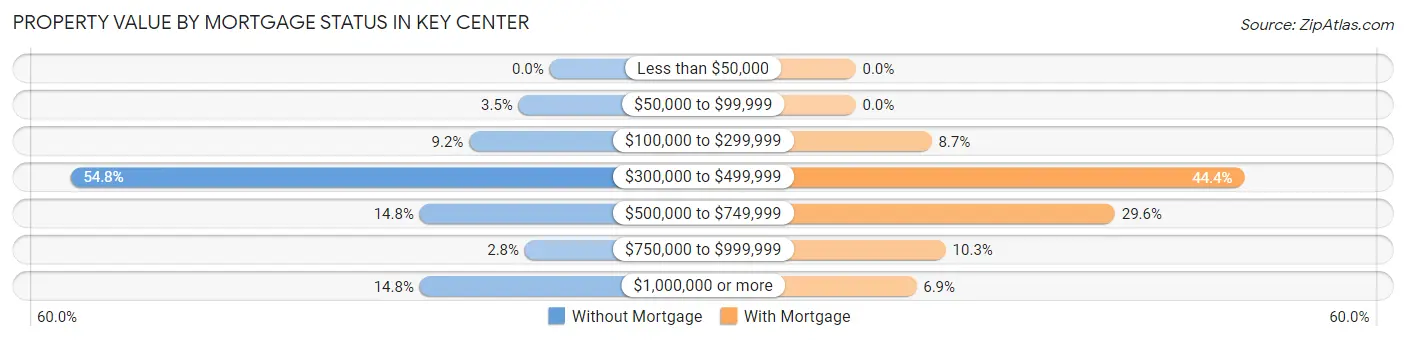
| Property Value | Without Mortgage | With Mortgage |
| Less than $50,000 | 0 (0.0%) | 0 (0.0%) |
| $50,000 to $99,999 | 10 (3.5%) | 0 (0.0%) |
| $100,000 to $299,999 | 26 (9.2%) | 75 (8.7%) |
| $300,000 to $499,999 | 155 (54.8%) | 384 (44.4%) |
| $500,000 to $749,999 | 42 (14.8%) | 256 (29.6%) |
| $750,000 to $999,999 | 8 (2.8%) | 89 (10.3%) |
| $1,000,000 or more | 42 (14.8%) | 60 (6.9%) |
| Total | 283 (100.0%) | 864 (100.0%) |
Household Income by Mortgage Status in Key Center
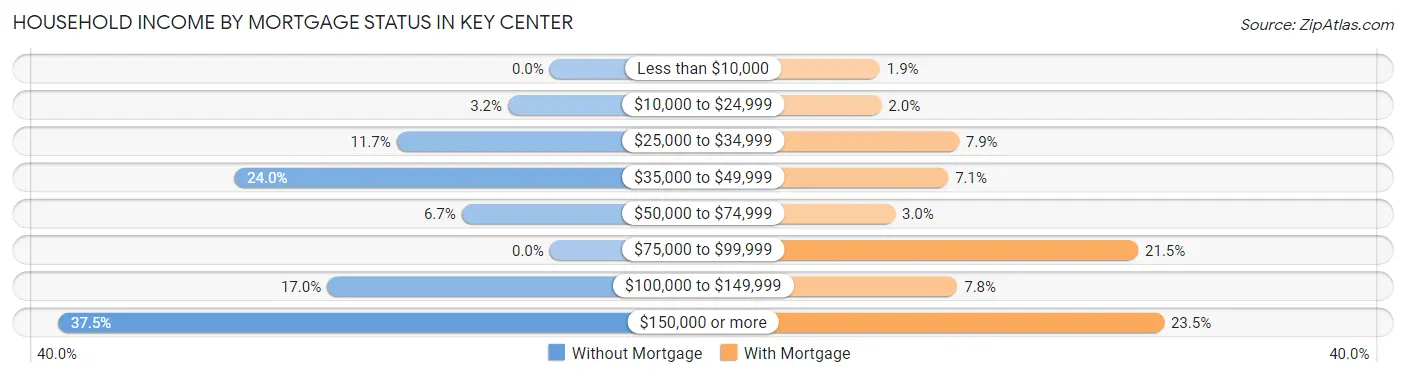
| Household Income | Without Mortgage | With Mortgage |
| Less than $10,000 | 0 (0.0%) | 16 (1.8%) |
| $10,000 to $24,999 | 9 (3.2%) | 17 (2.0%) |
| $25,000 to $34,999 | 33 (11.7%) | 68 (7.9%) |
| $35,000 to $49,999 | 68 (24.0%) | 61 (7.1%) |
| $50,000 to $74,999 | 19 (6.7%) | 26 (3.0%) |
| $75,000 to $99,999 | 0 (0.0%) | 186 (21.5%) |
| $100,000 to $149,999 | 48 (17.0%) | 67 (7.7%) |
| $150,000 or more | 106 (37.5%) | 203 (23.5%) |
| Total | 283 (100.0%) | 864 (100.0%) |
Property Value to Household Income Ratio in Key Center
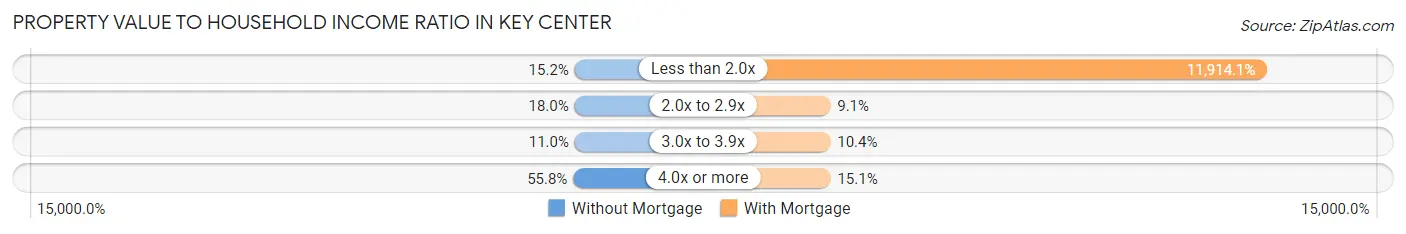
| Value-to-Income Ratio | Without Mortgage | With Mortgage |
| Less than 2.0x | 43 (15.2%) | 102,938 (11,914.1%) |
| 2.0x to 2.9x | 51 (18.0%) | 79 (9.1%) |
| 3.0x to 3.9x | 31 (11.0%) | 90 (10.4%) |
| 4.0x or more | 158 (55.8%) | 130 (15.0%) |
| Total | 283 (100.0%) | 864 (100.0%) |
Real Estate Taxes by Mortgage Status in Key Center
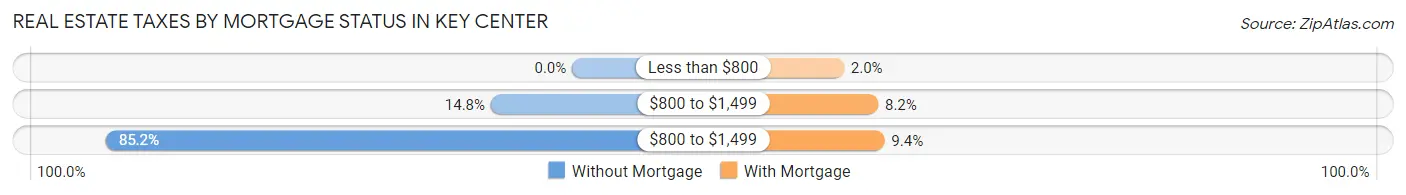
| Property Taxes | Without Mortgage | With Mortgage |
| Less than $800 | 0 (0.0%) | 17 (2.0%) |
| $800 to $1,499 | 42 (14.8%) | 71 (8.2%) |
| $800 to $1,499 | 241 (85.2%) | 81 (9.4%) |
| Total | 283 (100.0%) | 864 (100.0%) |
Health & Disability in Key Center
Health Insurance Coverage by Age in Key Center
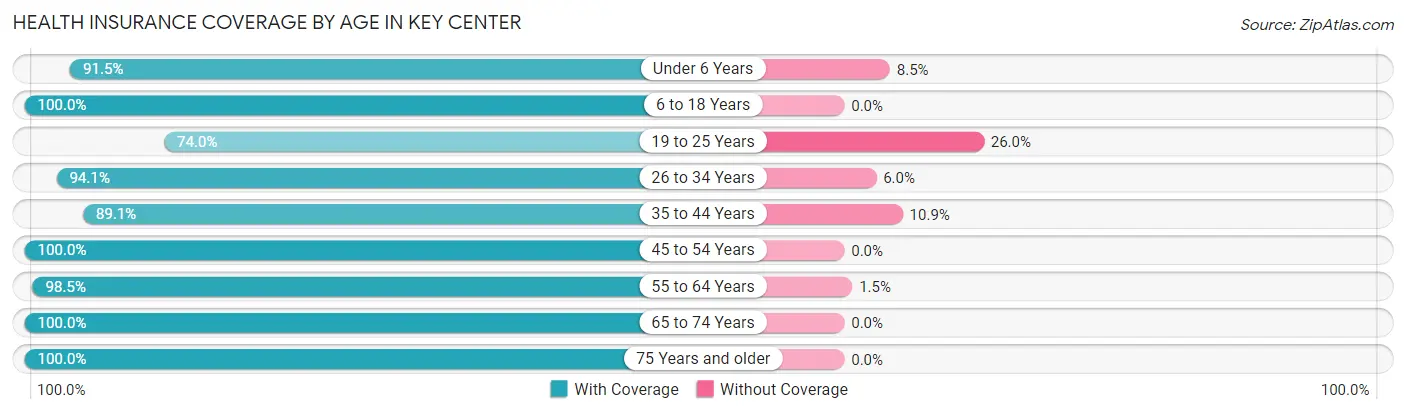
| Age Bracket | With Coverage | Without Coverage |
| Under 6 Years | 140 (91.5%) | 13 (8.5%) |
| 6 to 18 Years | 445 (100.0%) | 0 (0.0%) |
| 19 to 25 Years | 239 (74.0%) | 84 (26.0%) |
| 26 to 34 Years | 174 (94.1%) | 11 (5.9%) |
| 35 to 44 Years | 393 (89.1%) | 48 (10.9%) |
| 45 to 54 Years | 374 (100.0%) | 0 (0.0%) |
| 55 to 64 Years | 666 (98.5%) | 10 (1.5%) |
| 65 to 74 Years | 475 (100.0%) | 0 (0.0%) |
| 75 Years and older | 270 (100.0%) | 0 (0.0%) |
| Total | 3,176 (95.0%) | 166 (5.0%) |
Health Insurance Coverage by Citizenship Status in Key Center
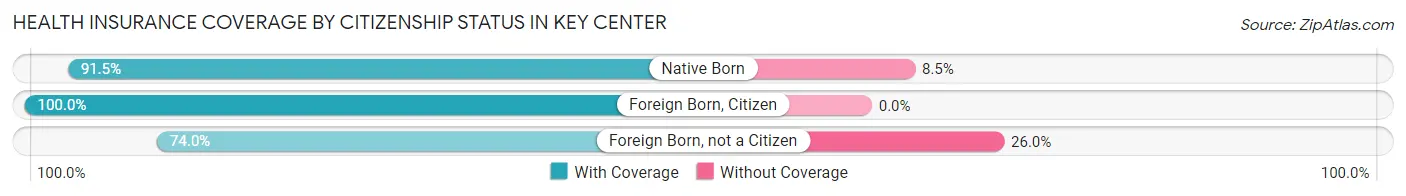
| Citizenship Status | With Coverage | Without Coverage |
| Native Born | 140 (91.5%) | 13 (8.5%) |
| Foreign Born, Citizen | 445 (100.0%) | 0 (0.0%) |
| Foreign Born, not a Citizen | 239 (74.0%) | 84 (26.0%) |
Health Insurance Coverage by Household Income in Key Center
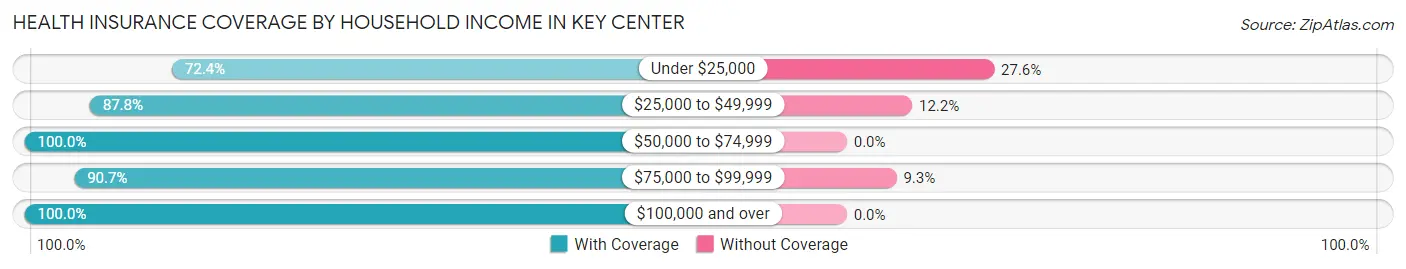
| Household Income | With Coverage | Without Coverage |
| Under $25,000 | 181 (72.4%) | 69 (27.6%) |
| $25,000 to $49,999 | 438 (87.8%) | 61 (12.2%) |
| $50,000 to $74,999 | 421 (100.0%) | 0 (0.0%) |
| $75,000 to $99,999 | 351 (90.7%) | 36 (9.3%) |
| $100,000 and over | 1,785 (100.0%) | 0 (0.0%) |
Public vs Private Health Insurance Coverage by Age in Key Center
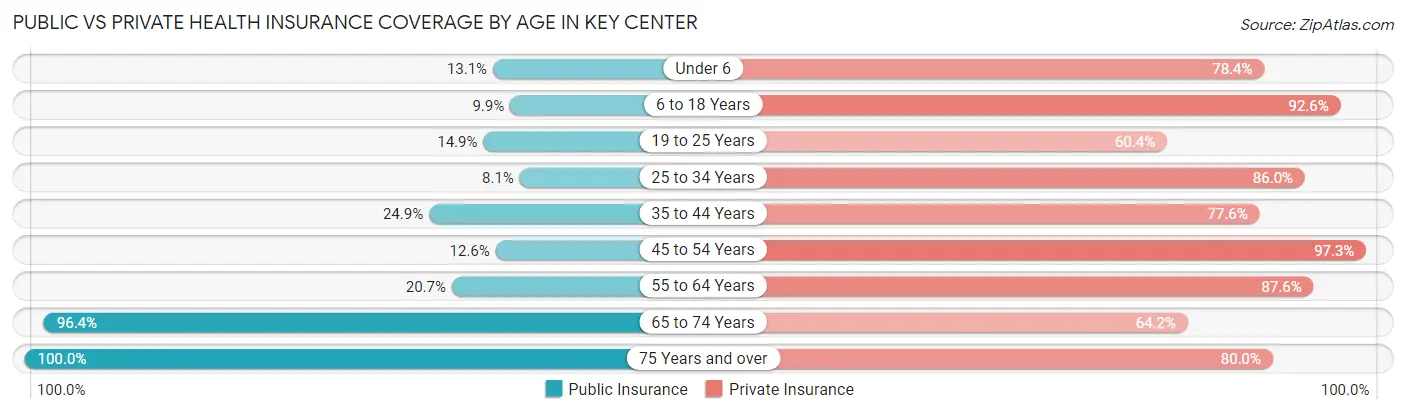
| Age Bracket | Public Insurance | Private Insurance |
| Under 6 | 20 (13.1%) | 120 (78.4%) |
| 6 to 18 Years | 44 (9.9%) | 412 (92.6%) |
| 19 to 25 Years | 48 (14.9%) | 195 (60.4%) |
| 25 to 34 Years | 15 (8.1%) | 159 (86.0%) |
| 35 to 44 Years | 110 (24.9%) | 342 (77.5%) |
| 45 to 54 Years | 47 (12.6%) | 364 (97.3%) |
| 55 to 64 Years | 140 (20.7%) | 592 (87.6%) |
| 65 to 74 Years | 458 (96.4%) | 305 (64.2%) |
| 75 Years and over | 270 (100.0%) | 216 (80.0%) |
| Total | 1,152 (34.5%) | 2,705 (80.9%) |
Disability Status by Sex by Age in Key Center
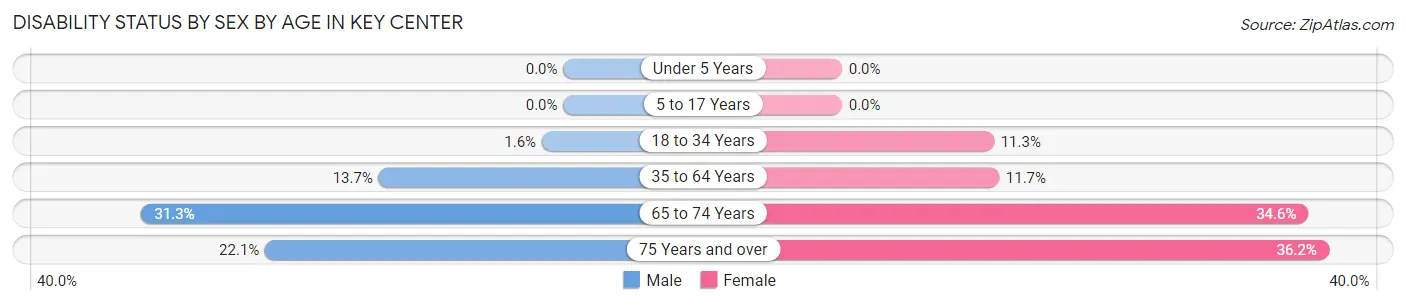
| Age Bracket | Male | Female |
| Under 5 Years | 0 (0.0%) | 0 (0.0%) |
| 5 to 17 Years | 0 (0.0%) | 0 (0.0%) |
| 18 to 34 Years | 4 (1.6%) | 30 (11.3%) |
| 35 to 64 Years | 108 (13.7%) | 82 (11.7%) |
| 65 to 74 Years | 52 (31.3%) | 107 (34.6%) |
| 75 Years and over | 31 (22.1%) | 47 (36.1%) |
Disability Class by Sex by Age in Key Center
Disability Class: Hearing Difficulty
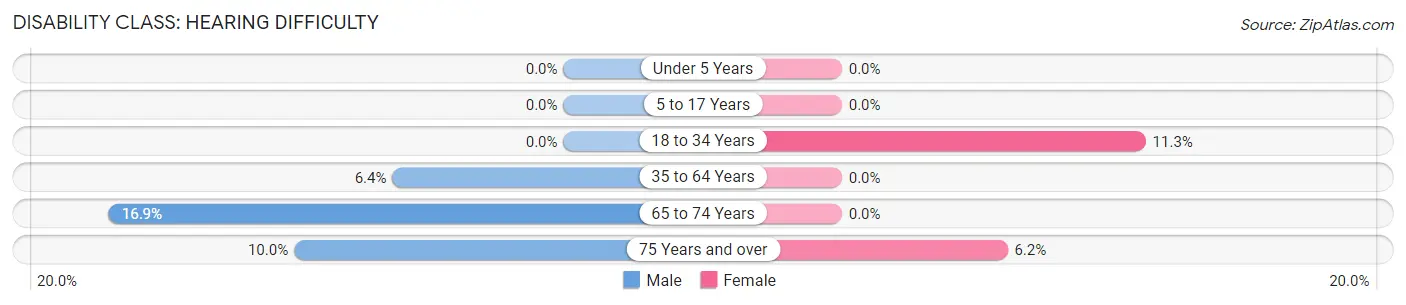
| Age Bracket | Male | Female |
| Under 5 Years | 0 (0.0%) | 0 (0.0%) |
| 5 to 17 Years | 0 (0.0%) | 0 (0.0%) |
| 18 to 34 Years | 0 (0.0%) | 30 (11.3%) |
| 35 to 64 Years | 50 (6.4%) | 0 (0.0%) |
| 65 to 74 Years | 28 (16.9%) | 0 (0.0%) |
| 75 Years and over | 14 (10.0%) | 8 (6.1%) |
Disability Class: Vision Difficulty
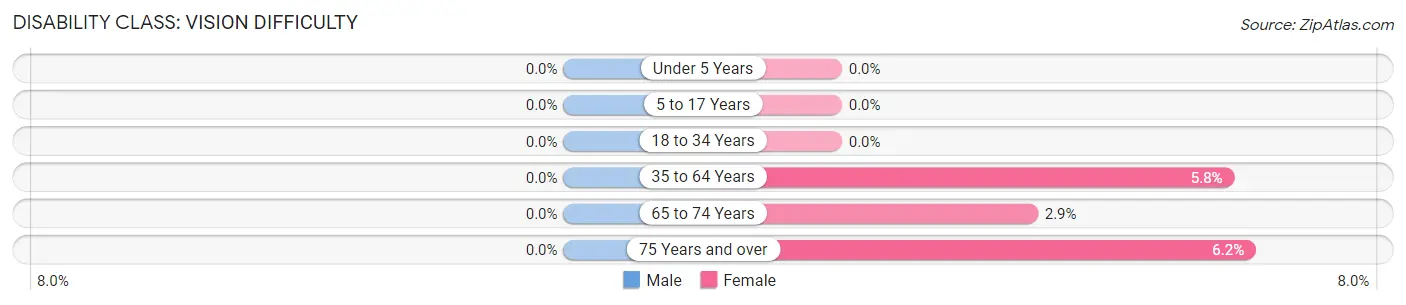
| Age Bracket | Male | Female |
| Under 5 Years | 0 (0.0%) | 0 (0.0%) |
| 5 to 17 Years | 0 (0.0%) | 0 (0.0%) |
| 18 to 34 Years | 0 (0.0%) | 0 (0.0%) |
| 35 to 64 Years | 0 (0.0%) | 41 (5.8%) |
| 65 to 74 Years | 0 (0.0%) | 9 (2.9%) |
| 75 Years and over | 0 (0.0%) | 8 (6.1%) |
Disability Class: Cognitive Difficulty
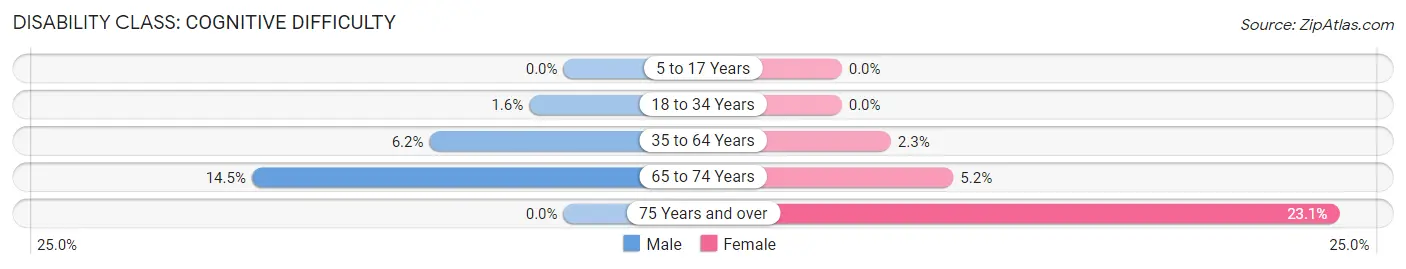
| Age Bracket | Male | Female |
| 5 to 17 Years | 0 (0.0%) | 0 (0.0%) |
| 18 to 34 Years | 4 (1.6%) | 0 (0.0%) |
| 35 to 64 Years | 49 (6.2%) | 16 (2.3%) |
| 65 to 74 Years | 24 (14.5%) | 16 (5.2%) |
| 75 Years and over | 0 (0.0%) | 30 (23.1%) |
Disability Class: Ambulatory Difficulty
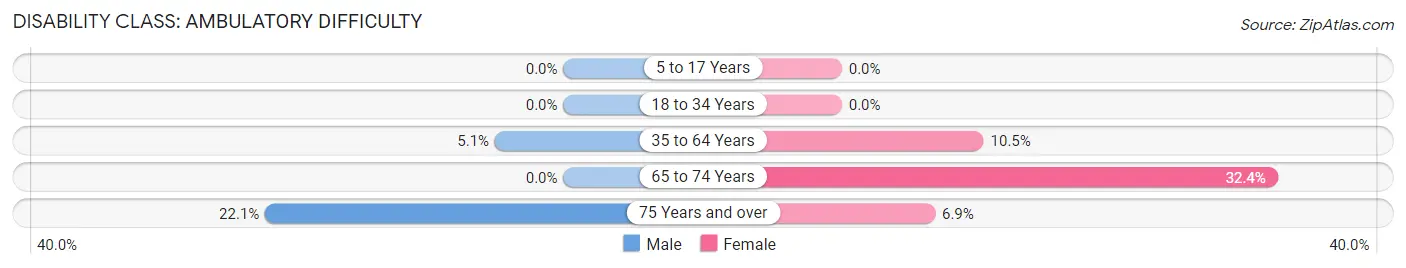
| Age Bracket | Male | Female |
| 5 to 17 Years | 0 (0.0%) | 0 (0.0%) |
| 18 to 34 Years | 0 (0.0%) | 0 (0.0%) |
| 35 to 64 Years | 40 (5.1%) | 74 (10.5%) |
| 65 to 74 Years | 0 (0.0%) | 100 (32.4%) |
| 75 Years and over | 31 (22.1%) | 9 (6.9%) |
Disability Class: Self-Care Difficulty
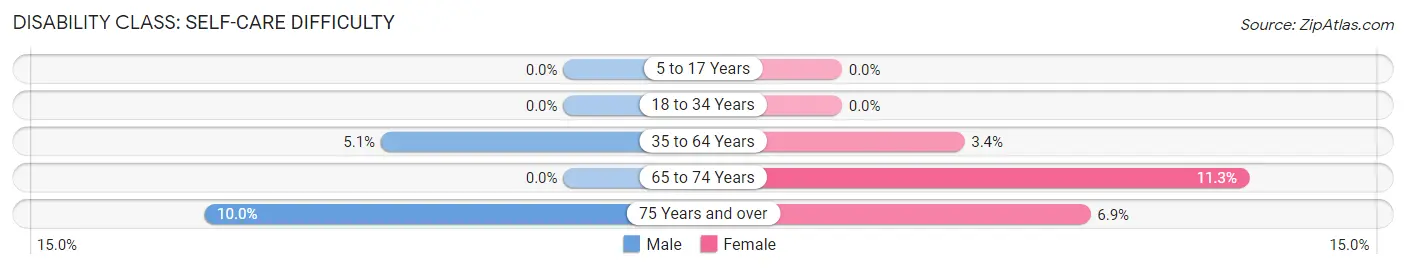
| Age Bracket | Male | Female |
| 5 to 17 Years | 0 (0.0%) | 0 (0.0%) |
| 18 to 34 Years | 0 (0.0%) | 0 (0.0%) |
| 35 to 64 Years | 40 (5.1%) | 24 (3.4%) |
| 65 to 74 Years | 0 (0.0%) | 35 (11.3%) |
| 75 Years and over | 14 (10.0%) | 9 (6.9%) |
Technology Access in Key Center
Computing Device Access in Key Center
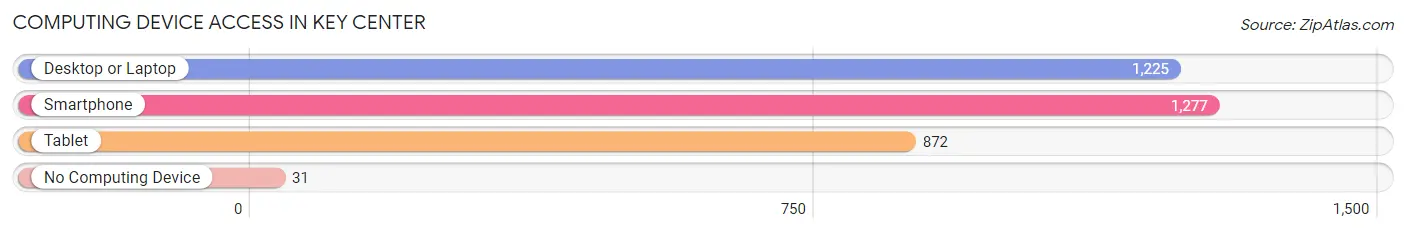
| Device Type | # Households | % Households |
| Desktop or Laptop | 1,225 | 87.7% |
| Smartphone | 1,277 | 91.5% |
| Tablet | 872 | 62.5% |
| No Computing Device | 31 | 2.2% |
| Total | 1,396 | 100.0% |
Internet Access in Key Center
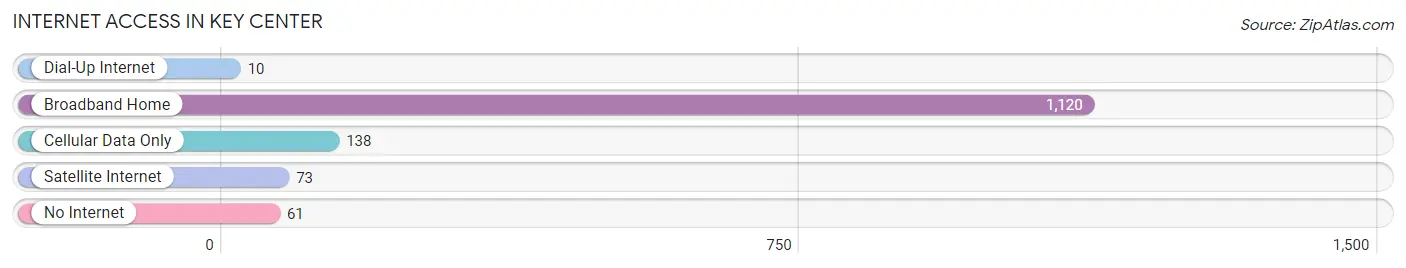
| Internet Type | # Households | % Households |
| Dial-Up Internet | 10 | 0.7% |
| Broadband Home | 1,120 | 80.2% |
| Cellular Data Only | 138 | 9.9% |
| Satellite Internet | 73 | 5.2% |
| No Internet | 61 | 4.4% |
| Total | 1,396 | 100.0% |
Key Center Summary
Key Center is an unincorporated community located in Pierce County, Washington, United States. It is located on the Key Peninsula, which is a peninsula in the Puget Sound region of Washington. The community is located approximately 25 miles south of Tacoma and 30 miles northwest of Olympia.
History
The area that is now Key Center was first settled in the late 1800s by homesteaders. The area was originally known as Key City, and the name was changed to Key Center in the early 1900s. The area was primarily used for logging and farming, and the community was home to a number of small businesses, including a general store, a post office, and a school.
In the 1950s, the area began to experience rapid growth due to the construction of the Tacoma Narrows Bridge, which connected the Key Peninsula to the mainland. This led to an influx of new residents and businesses, and the community began to develop into a small town.
Geography
Key Center is located on the Key Peninsula, which is a peninsula in the Puget Sound region of Washington. The peninsula is bordered by the Puget Sound to the west and the Hood Canal to the east. The community is located approximately 25 miles south of Tacoma and 30 miles northwest of Olympia.
The area is characterized by a temperate climate, with mild winters and warm summers. The average annual temperature is around 50 degrees Fahrenheit, and the average annual precipitation is around 40 inches.
Economy
The economy of Key Center is largely based on tourism and recreation. The area is home to a number of popular tourist attractions, including the Key Peninsula Historical Museum, the Key Peninsula Civic Center, and the Key Peninsula State Park. The area is also home to a number of small businesses, including restaurants, retail stores, and service providers.
Demographics
As of the 2010 census, the population of Key Center was 2,845. The racial makeup of the community was 94.3% White, 0.7% African American, 0.7% Native American, 0.7% Asian, 0.2% Pacific Islander, and 2.6% from other races. The median household income was $50,938, and the median family income was $56,250.
Conclusion
Key Center is a small unincorporated community located in Pierce County, Washington. The area was originally settled in the late 1800s by homesteaders, and the community has since grown into a small town due to the construction of the Tacoma Narrows Bridge. The economy of Key Center is largely based on tourism and recreation, and the area is home to a number of popular tourist attractions. The population of Key Center was 2,845 as of the 2010 census, and the median household income was $50,938.
Common Questions
What is Per Capita Income in Key Center?
Per Capita income in Key Center is $46,081.
What is the Median Family Income in Key Center?
Median Family Income in Key Center is $98,561.
What is the Median Household income in Key Center?
Median Household Income in Key Center is $92,241.
What is Income or Wage Gap in Key Center?
Income or Wage Gap in Key Center is 52.6%.
Women in Key Center earn 47.4 cents for every dollar earned by a man.
What is Inequality or Gini Index in Key Center?
Inequality or Gini Index in Key Center is 0.42.
What is the Total Population of Key Center?
Total Population of Key Center is 3,359.
What is the Total Male Population of Key Center?
Total Male Population of Key Center is 1,638.
What is the Total Female Population of Key Center?
Total Female Population of Key Center is 1,721.
What is the Ratio of Males per 100 Females in Key Center?
There are 95.18 Males per 100 Females in Key Center.
What is the Ratio of Females per 100 Males in Key Center?
There are 105.07 Females per 100 Males in Key Center.
What is the Median Population Age in Key Center?
Median Population Age in Key Center is 49.0 Years.
What is the Average Family Size in Key Center
Average Family Size in Key Center is 2.8 People.
What is the Average Household Size in Key Center
Average Household Size in Key Center is 2.4 People.
How Large is the Labor Force in Key Center?
There are 1,558 People in the Labor Forcein in Key Center.
What is the Percentage of People in the Labor Force in Key Center?
54.1% of People are in the Labor Force in Key Center.
What is the Unemployment Rate in Key Center?
Unemployment Rate in Key Center is 5.9%.