Fife Heights, WA Map & Demographics
Fife Heights Map
Fife Heights Overview
$51,136
PER CAPITA INCOME
$131,750
AVG FAMILY INCOME
$128,788
AVG HOUSEHOLD INCOME
42.0%
WAGE / INCOME GAP [ % ]
58.0¢/ $1
WAGE / INCOME GAP [ $ ]
0.33
INEQUALITY / GINI INDEX
1,573
TOTAL POPULATION
816
MALE POPULATION
757
FEMALE POPULATION
107.79
MALES / 100 FEMALES
92.77
FEMALES / 100 MALES
37.0
MEDIAN AGE
3.3
AVG FAMILY SIZE
2.9
AVG HOUSEHOLD SIZE
926
LABOR FORCE [ PEOPLE ]
74.1%
PERCENT IN LABOR FORCE
4.0%
UNEMPLOYMENT RATE
Income in Fife Heights
Income Overview in Fife Heights
Per Capita Income in Fife Heights is $51,136, while median incomes of families and households are $131,750 and $128,788 respectively.
| Characteristic | Number | Measure |
| Per Capita Income | 1,573 | $51,136 |
| Median Family Income | 435 | $131,750 |
| Mean Family Income | 435 | $155,697 |
| Median Household Income | 546 | $128,788 |
| Mean Household Income | 546 | $144,057 |
| Income Deficit | 435 | $0 |
| Wage / Income Gap (%) | 1,573 | 41.98% |
| Wage / Income Gap ($) | 1,573 | 58.02¢ per $1 |
| Gini / Inequality Index | 1,573 | 0.33 |
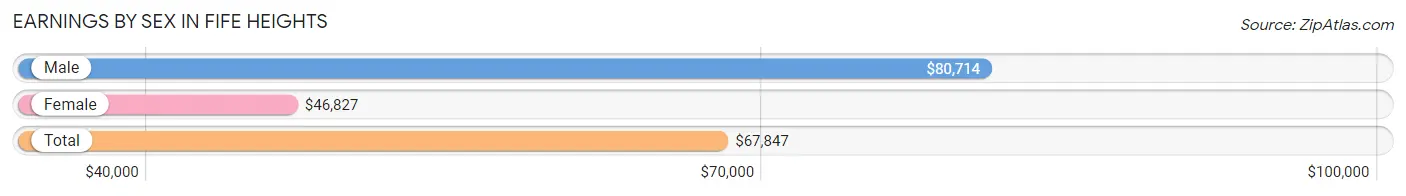
Earnings by Sex in Fife Heights
Average Earnings in Fife Heights are $67,847, $80,714 for men and $46,827 for women, a difference of 42.0%.
| Sex | Number | Average Earnings |
| Male | 540 (57.3%) | $80,714 |
| Female | 403 (42.7%) | $46,827 |
| Total | 943 (100.0%) | $67,847 |
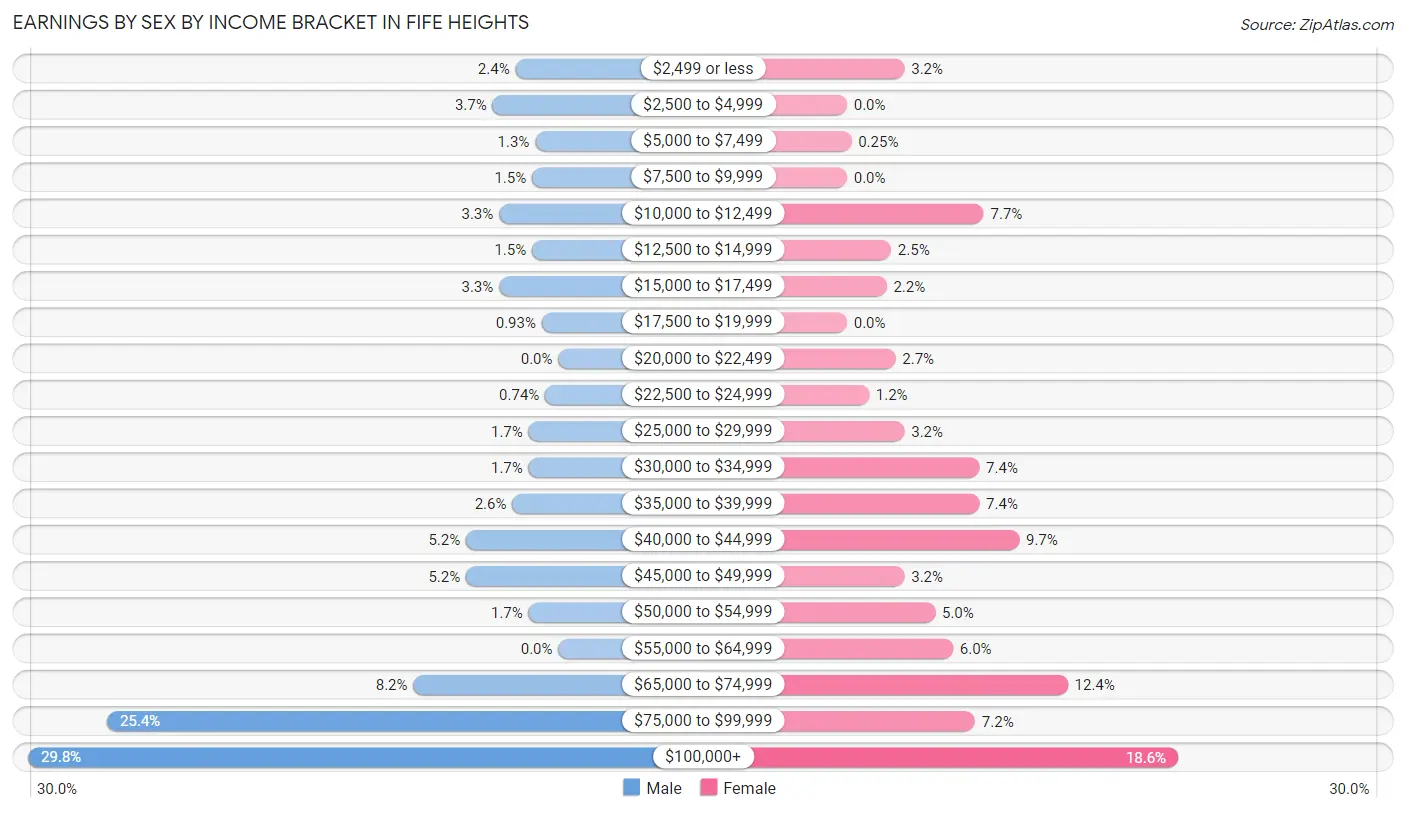
Earnings by Sex by Income Bracket in Fife Heights
The most common earnings brackets in Fife Heights are $100,000+ for men (161 | 29.8%) and $100,000+ for women (75 | 18.6%).
| Income | Male | Female |
| $2,499 or less | 13 (2.4%) | 13 (3.2%) |
| $2,500 to $4,999 | 20 (3.7%) | 0 (0.0%) |
| $5,000 to $7,499 | 7 (1.3%) | 1 (0.3%) |
| $7,500 to $9,999 | 8 (1.5%) | 0 (0.0%) |
| $10,000 to $12,499 | 18 (3.3%) | 31 (7.7%) |
| $12,500 to $14,999 | 8 (1.5%) | 10 (2.5%) |
| $15,000 to $17,499 | 18 (3.3%) | 9 (2.2%) |
| $17,500 to $19,999 | 5 (0.9%) | 0 (0.0%) |
| $20,000 to $22,499 | 0 (0.0%) | 11 (2.7%) |
| $22,500 to $24,999 | 4 (0.7%) | 5 (1.2%) |
| $25,000 to $29,999 | 9 (1.7%) | 13 (3.2%) |
| $30,000 to $34,999 | 9 (1.7%) | 30 (7.4%) |
| $35,000 to $39,999 | 14 (2.6%) | 30 (7.4%) |
| $40,000 to $44,999 | 28 (5.2%) | 39 (9.7%) |
| $45,000 to $49,999 | 28 (5.2%) | 13 (3.2%) |
| $50,000 to $54,999 | 9 (1.7%) | 20 (5.0%) |
| $55,000 to $64,999 | 0 (0.0%) | 24 (6.0%) |
| $65,000 to $74,999 | 44 (8.2%) | 50 (12.4%) |
| $75,000 to $99,999 | 137 (25.4%) | 29 (7.2%) |
| $100,000+ | 161 (29.8%) | 75 (18.6%) |
| Total | 540 (100.0%) | 403 (100.0%) |
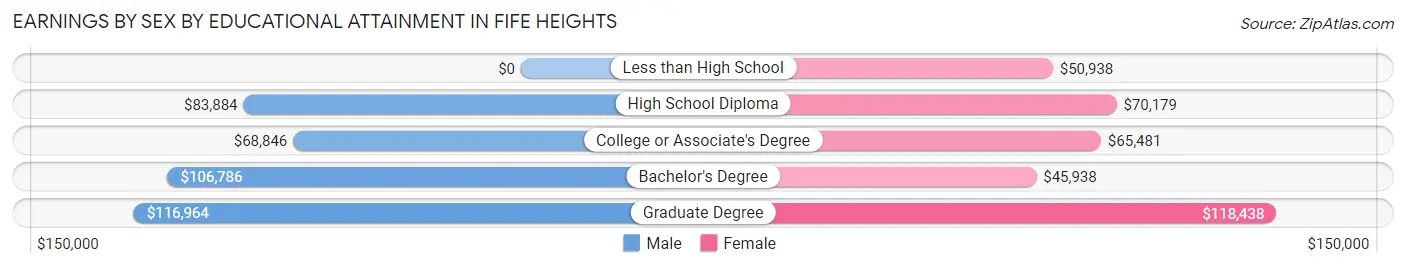
Earnings by Sex by Educational Attainment in Fife Heights
Average earnings in Fife Heights are $82,699 for men and $58,750 for women, a difference of 29.0%. Men with an educational attainment of graduate degree enjoy the highest average annual earnings of $116,964, while those with college or associate's degree education earn the least with $68,846. Women with an educational attainment of graduate degree earn the most with the average annual earnings of $118,438, while those with bachelor's degree education have the smallest earnings of $45,938.
| Educational Attainment | Male Income | Female Income |
| Less than High School | - | - |
| High School Diploma | $83,884 | $70,179 |
| College or Associate's Degree | $68,846 | $65,481 |
| Bachelor's Degree | $106,786 | $45,938 |
| Graduate Degree | $116,964 | $118,438 |
| Total | $82,699 | $58,750 |
Family Income in Fife Heights
Family Income Brackets in Fife Heights
According to the Fife Heights family income data, there are 115 families falling into the $200,000+ income range, which is the most common income bracket and makes up 26.4% of all families.
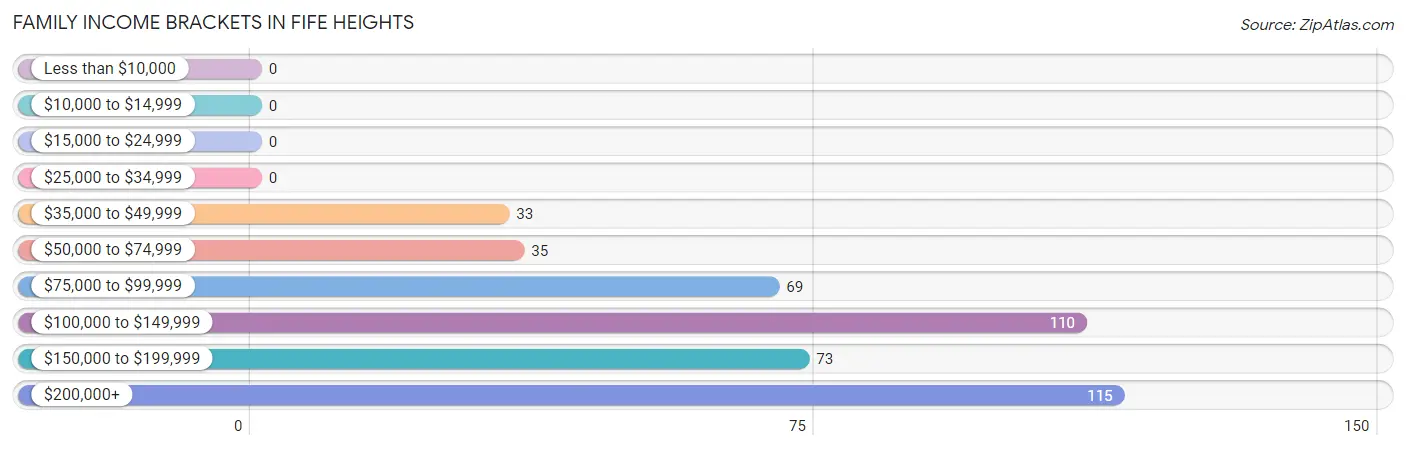
| Income Bracket | # Families | % Families |
| Less than $10,000 | 0 | 0.0% |
| $10,000 to $14,999 | 0 | 0.0% |
| $15,000 to $24,999 | 0 | 0.0% |
| $25,000 to $34,999 | 0 | 0.0% |
| $35,000 to $49,999 | 33 | 7.6% |
| $50,000 to $74,999 | 35 | 8.0% |
| $75,000 to $99,999 | 69 | 15.9% |
| $100,000 to $149,999 | 110 | 25.3% |
| $150,000 to $199,999 | 73 | 16.8% |
| $200,000+ | 115 | 26.4% |
Family Income by Famaliy Size in Fife Heights
4-person families (75 | 17.2%) account for the highest median family income in Fife Heights with $190,703 per family, while 2-person families (192 | 44.1%) have the highest median income of $58,928 per family member.
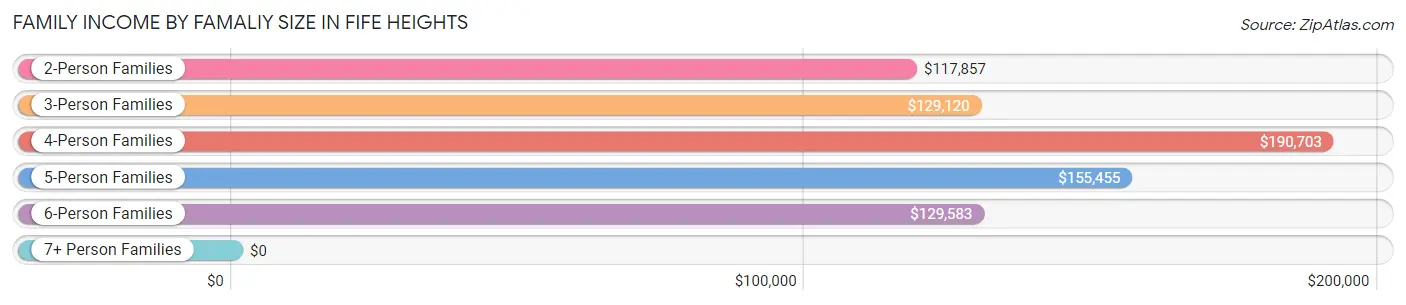
| Income Bracket | # Families | Median Income |
| 2-Person Families | 192 (44.1%) | $117,857 |
| 3-Person Families | 85 (19.5%) | $129,120 |
| 4-Person Families | 75 (17.2%) | $190,703 |
| 5-Person Families | 56 (12.9%) | $155,455 |
| 6-Person Families | 22 (5.1%) | $129,583 |
| 7+ Person Families | 5 (1.1%) | $0 |
| Total | 435 (100.0%) | $131,750 |
Family Income by Number of Earners in Fife Heights
The median family income in Fife Heights is $131,750, with families comprising 3+ earners (77) having the highest median family income of $247,250, while families with no earners (53) have the lowest median family income of $50,750, accounting for 17.7% and 12.2% of families, respectively.
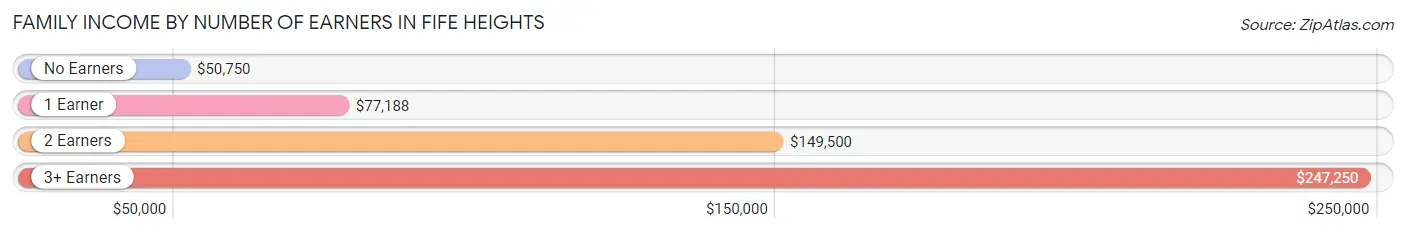
| Number of Earners | # Families | Median Income |
| No Earners | 53 (12.2%) | $50,750 |
| 1 Earner | 59 (13.6%) | $77,188 |
| 2 Earners | 246 (56.6%) | $149,500 |
| 3+ Earners | 77 (17.7%) | $247,250 |
| Total | 435 (100.0%) | $131,750 |
Household Income in Fife Heights
Household Income Brackets in Fife Heights
With 131 households falling in the category, the $100,000 to $149,999 income range is the most frequent in Fife Heights, accounting for 24.0% of all households.
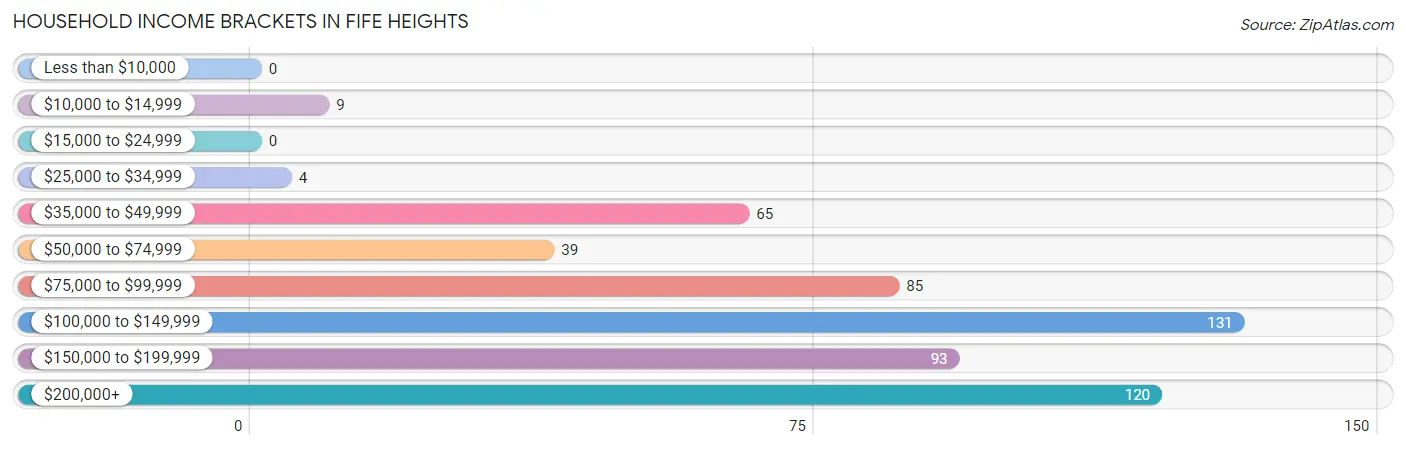
| Income Bracket | # Households | % Households |
| Less than $10,000 | 0 | 0.0% |
| $10,000 to $14,999 | 9 | 1.6% |
| $15,000 to $24,999 | 0 | 0.0% |
| $25,000 to $34,999 | 4 | 0.7% |
| $35,000 to $49,999 | 65 | 11.9% |
| $50,000 to $74,999 | 39 | 7.1% |
| $75,000 to $99,999 | 85 | 15.6% |
| $100,000 to $149,999 | 131 | 24.0% |
| $150,000 to $199,999 | 93 | 17.0% |
| $200,000+ | 120 | 22.0% |
Household Income by Householder Age in Fife Heights
The median household income in Fife Heights is $128,788, with the highest median household income of $134,250 found in the 45 to 64 years age bracket for the primary householder. A total of 247 households (45.2%) fall into this category.
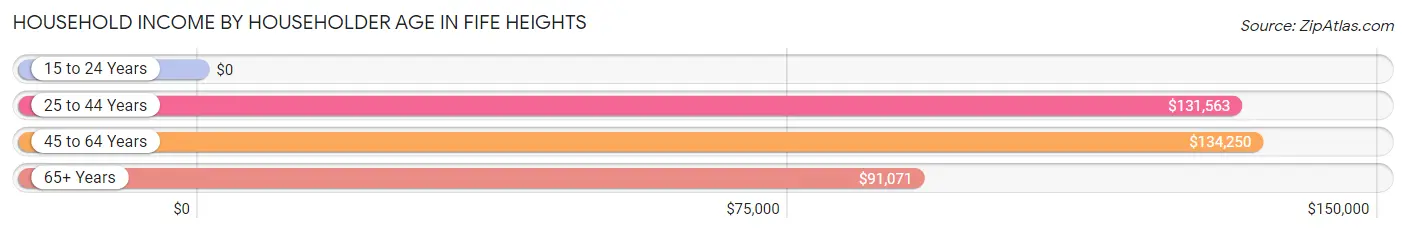
| Income Bracket | # Households | Median Income |
| 15 to 24 Years | 0 (0.0%) | $0 |
| 25 to 44 Years | 185 (33.9%) | $131,563 |
| 45 to 64 Years | 247 (45.2%) | $134,250 |
| 65+ Years | 114 (20.9%) | $91,071 |
| Total | 546 (100.0%) | $128,788 |
Poverty in Fife Heights
Income Below Poverty by Sex and Age in Fife Heights
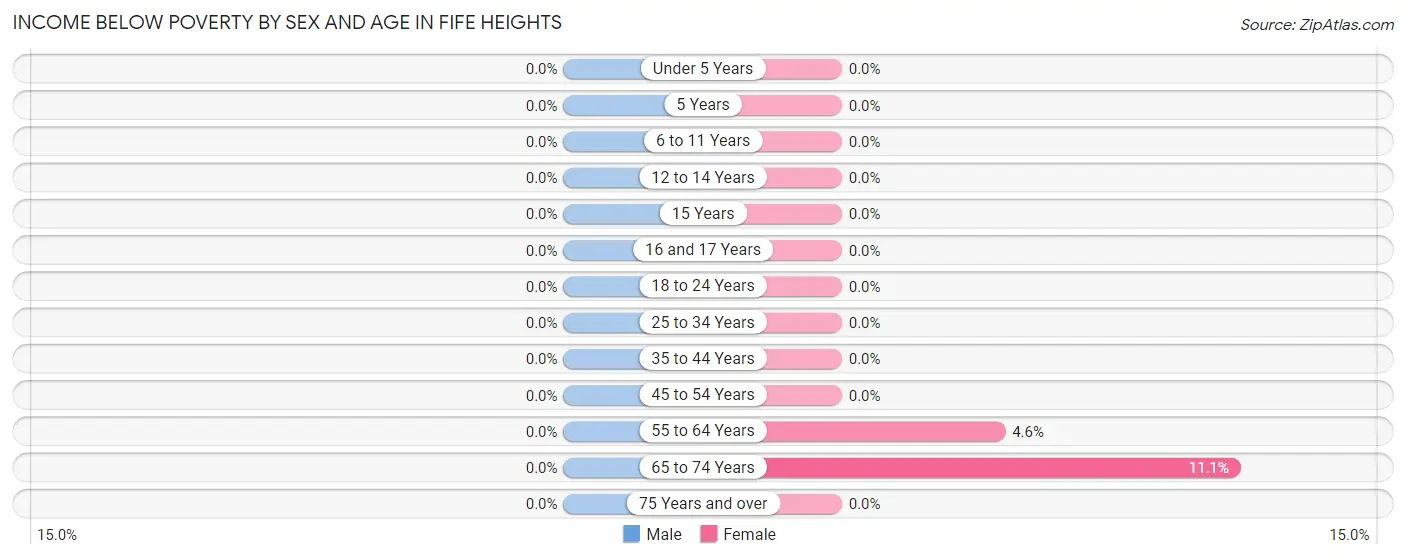
| Age Bracket | Male | Female |
| Under 5 Years | 0 (0.0%) | 0 (0.0%) |
| 5 Years | 0 (0.0%) | 0 (0.0%) |
| 6 to 11 Years | 0 (0.0%) | 0 (0.0%) |
| 12 to 14 Years | 0 (0.0%) | 0 (0.0%) |
| 15 Years | 0 (0.0%) | 0 (0.0%) |
| 16 and 17 Years | 0 (0.0%) | 0 (0.0%) |
| 18 to 24 Years | 0 (0.0%) | 0 (0.0%) |
| 25 to 34 Years | 0 (0.0%) | 0 (0.0%) |
| 35 to 44 Years | 0 (0.0%) | 0 (0.0%) |
| 45 to 54 Years | 0 (0.0%) | 0 (0.0%) |
| 55 to 64 Years | 0 (0.0%) | 4 (4.5%) |
| 65 to 74 Years | 0 (0.0%) | 5 (11.1%) |
| 75 Years and over | 0 (0.0%) | 0 (0.0%) |
| Total | 0 (0.0%) | 9 (1.2%) |
Income Above Poverty by Sex and Age in Fife Heights
According to the poverty statistics in Fife Heights, males aged under 5 years and females aged under 5 years are the age groups that are most secure financially, with 100.0% of males and 100.0% of females in these age groups living above the poverty line.
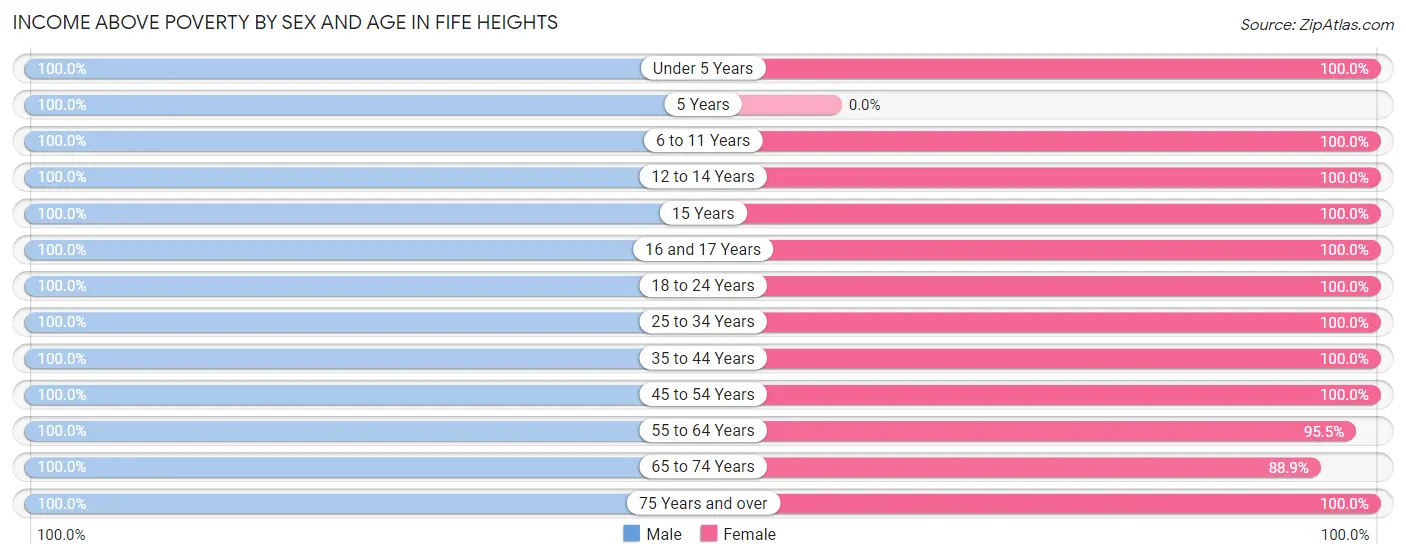
| Age Bracket | Male | Female |
| Under 5 Years | 15 (100.0%) | 41 (100.0%) |
| 5 Years | 7 (100.0%) | 0 (0.0%) |
| 6 to 11 Years | 65 (100.0%) | 91 (100.0%) |
| 12 to 14 Years | 32 (100.0%) | 29 (100.0%) |
| 15 Years | 19 (100.0%) | 25 (100.0%) |
| 16 and 17 Years | 46 (100.0%) | 29 (100.0%) |
| 18 to 24 Years | 79 (100.0%) | 65 (100.0%) |
| 25 to 34 Years | 132 (100.0%) | 91 (100.0%) |
| 35 to 44 Years | 87 (100.0%) | 86 (100.0%) |
| 45 to 54 Years | 143 (100.0%) | 131 (100.0%) |
| 55 to 64 Years | 108 (100.0%) | 84 (95.5%) |
| 65 to 74 Years | 50 (100.0%) | 40 (88.9%) |
| 75 Years and over | 33 (100.0%) | 36 (100.0%) |
| Total | 816 (100.0%) | 748 (98.8%) |
Income Below Poverty Among Married-Couple Families in Fife Heights
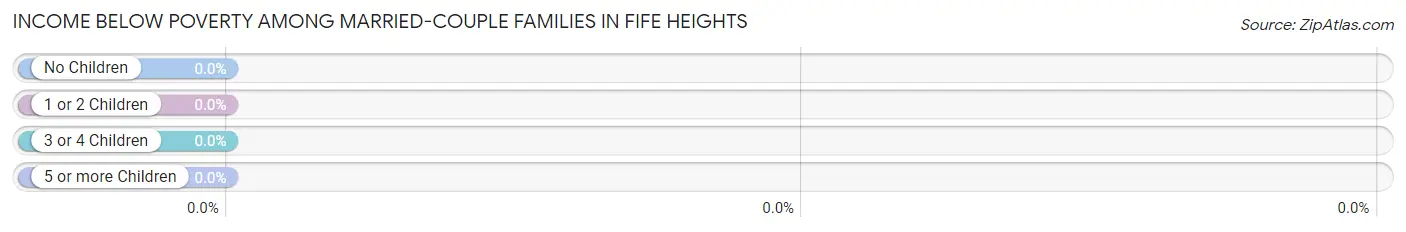
| Children | Above Poverty | Below Poverty |
| No Children | 226 (100.0%) | 0 (0.0%) |
| 1 or 2 Children | 132 (100.0%) | 0 (0.0%) |
| 3 or 4 Children | 41 (100.0%) | 0 (0.0%) |
| 5 or more Children | 0 (0.0%) | 0 (0.0%) |
| Total | 399 (100.0%) | 0 (0.0%) |
Income Below Poverty Among Single-Parent Households in Fife Heights
| Children | Single Father | Single Mother |
| No Children | 0 (0.0%) | 0 (0.0%) |
| 1 or 2 Children | 0 (0.0%) | 0 (0.0%) |
| 3 or 4 Children | 0 (0.0%) | 0 (0.0%) |
| 5 or more Children | 0 (0.0%) | 0 (0.0%) |
| Total | 0 (0.0%) | 0 (0.0%) |
Income Below Poverty Among Married-Couple vs Single-Parent Households in Fife Heights
| Children | Married-Couple Families | Single-Parent Households |
| No Children | 0 (0.0%) | 0 (0.0%) |
| 1 or 2 Children | 0 (0.0%) | 0 (0.0%) |
| 3 or 4 Children | 0 (0.0%) | 0 (0.0%) |
| 5 or more Children | 0 (0.0%) | 0 (0.0%) |
| Total | 0 (0.0%) | 0 (0.0%) |
Race in Fife Heights
The most populous races in Fife Heights are White / Caucasian (1,208 | 76.8%), Two or more Races (148 | 9.4%), and Hispanic or Latino (100 | 6.4%).
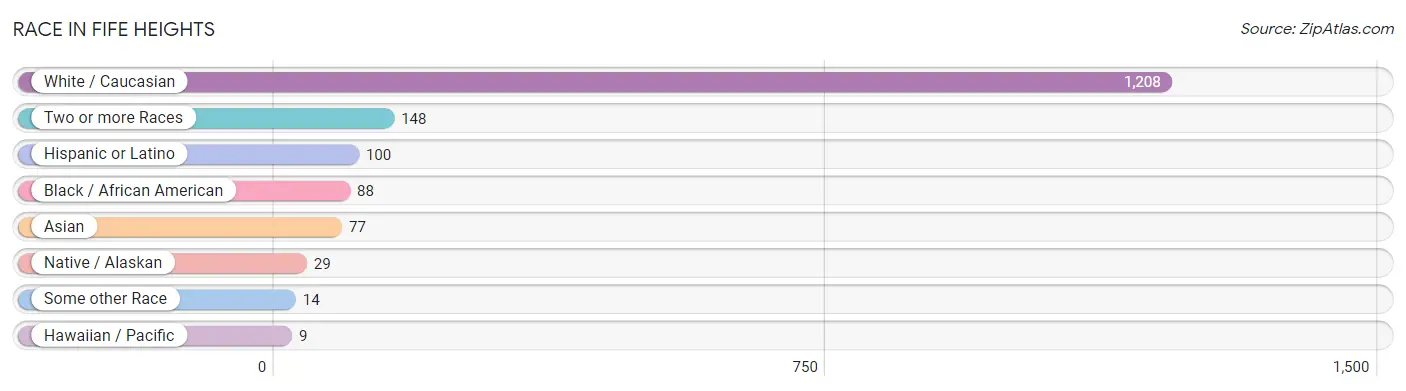
| Race | # Population | % Population |
| Asian | 77 | 4.9% |
| Black / African American | 88 | 5.6% |
| Hawaiian / Pacific | 9 | 0.6% |
| Hispanic or Latino | 100 | 6.4% |
| Native / Alaskan | 29 | 1.8% |
| White / Caucasian | 1,208 | 76.8% |
| Two or more Races | 148 | 9.4% |
| Some other Race | 14 | 0.9% |
| Total | 1,573 | 100.0% |
Ancestry in Fife Heights
The most populous ancestries reported in Fife Heights are German (198 | 12.6%), English (174 | 11.1%), Irish (150 | 9.5%), Norwegian (112 | 7.1%), and Korean (94 | 6.0%), together accounting for 46.3% of all Fife Heights residents.
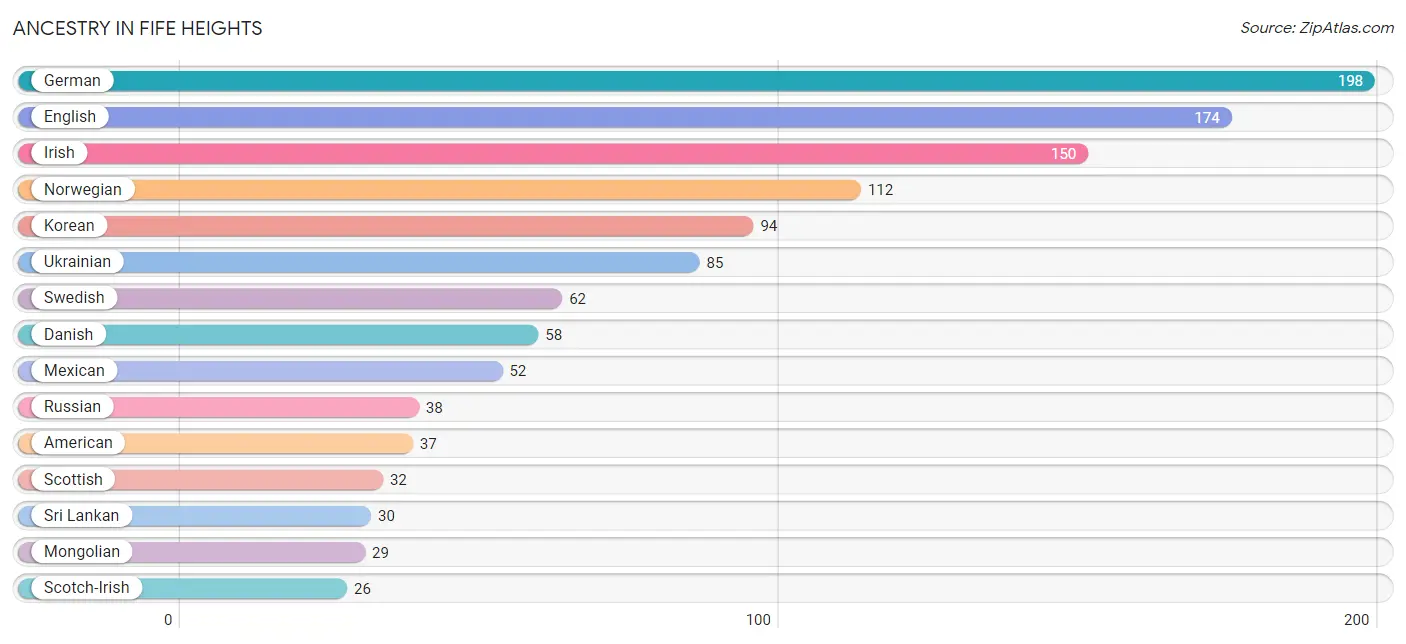
| Ancestry | # Population | % Population |
| American | 37 | 2.4% |
| Arab | 6 | 0.4% |
| Argentinean | 4 | 0.3% |
| Basque | 4 | 0.3% |
| Bhutanese | 8 | 0.5% |
| Blackfeet | 9 | 0.6% |
| British | 10 | 0.6% |
| Burmese | 9 | 0.6% |
| Cherokee | 11 | 0.7% |
| Chilean | 14 | 0.9% |
| Croatian | 5 | 0.3% |
| Cuban | 24 | 1.5% |
| Czech | 4 | 0.3% |
| Danish | 58 | 3.7% |
| Dutch | 10 | 0.6% |
| English | 174 | 11.1% |
| European | 18 | 1.1% |
| Finnish | 14 | 0.9% |
| French | 21 | 1.3% |
| French Canadian | 13 | 0.8% |
| German | 198 | 12.6% |
| Greek | 10 | 0.6% |
| Guamanian / Chamorro | 16 | 1.0% |
| Indian (Asian) | 13 | 0.8% |
| Irish | 150 | 9.5% |
| Italian | 19 | 1.2% |
| Japanese | 25 | 1.6% |
| Korean | 94 | 6.0% |
| Lebanese | 6 | 0.4% |
| Mexican | 52 | 3.3% |
| Mongolian | 29 | 1.8% |
| Native Hawaiian | 13 | 0.8% |
| Nigerian | 4 | 0.3% |
| Northern European | 5 | 0.3% |
| Norwegian | 112 | 7.1% |
| Pakistani | 4 | 0.3% |
| Polish | 23 | 1.5% |
| Portuguese | 7 | 0.4% |
| Romanian | 10 | 0.6% |
| Russian | 38 | 2.4% |
| Samoan | 16 | 1.0% |
| Scotch-Irish | 26 | 1.7% |
| Scottish | 32 | 2.0% |
| South American | 18 | 1.1% |
| Spaniard | 6 | 0.4% |
| Sri Lankan | 30 | 1.9% |
| Subsaharan African | 4 | 0.3% |
| Swedish | 62 | 3.9% |
| Swiss | 26 | 1.7% |
| Tsimshian | 7 | 0.4% |
| Ukrainian | 85 | 5.4% |
| Welsh | 5 | 0.3% |
| West Indian | 4 | 0.3% | View All 53 Rows |
Immigrants in Fife Heights
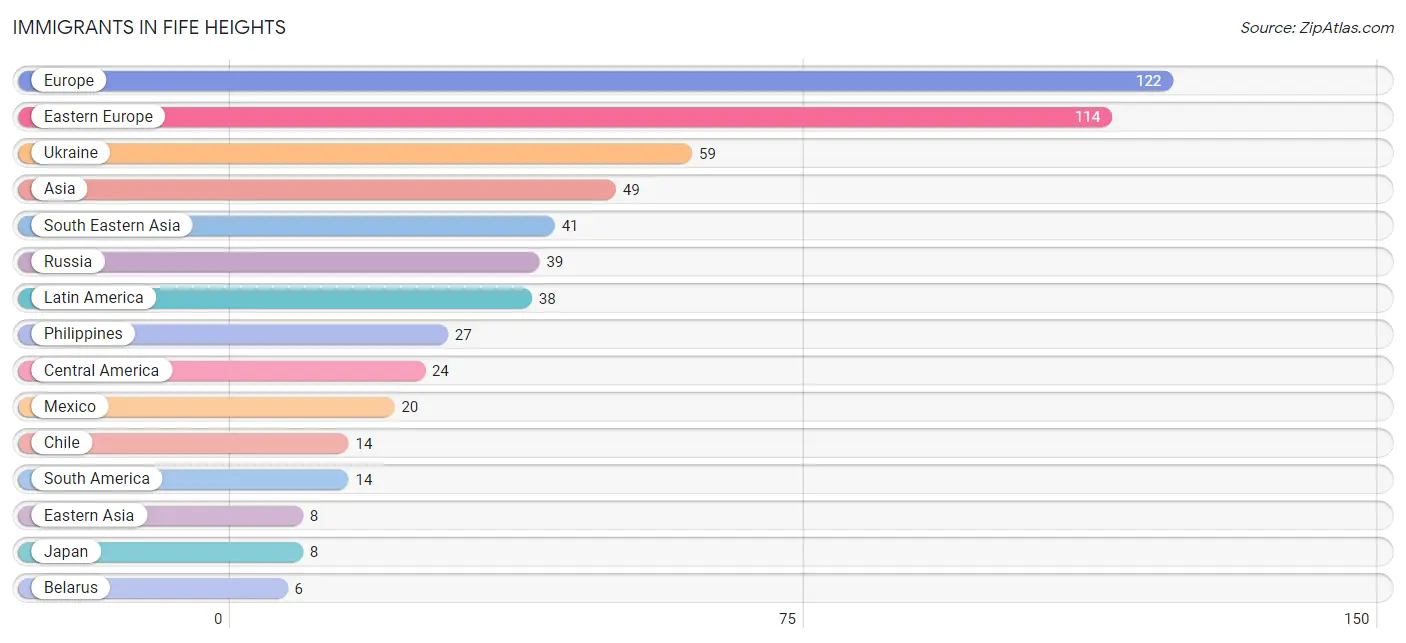
The most numerous immigrant groups reported in Fife Heights came from Europe (122 | 7.8%), Eastern Europe (114 | 7.2%), Ukraine (59 | 3.7%), Asia (49 | 3.1%), and South Eastern Asia (41 | 2.6%), together accounting for 24.5% of all Fife Heights residents.
| Immigration Origin | # Population | % Population |
| Africa | 2 | 0.1% |
| Asia | 49 | 3.1% |
| Belarus | 6 | 0.4% |
| Cambodia | 4 | 0.3% |
| Central America | 24 | 1.5% |
| Chile | 14 | 0.9% |
| Eastern Asia | 8 | 0.5% |
| Eastern Europe | 114 | 7.2% |
| England | 4 | 0.3% |
| Europe | 122 | 7.8% |
| Japan | 8 | 0.5% |
| Latin America | 38 | 2.4% |
| Malaysia | 6 | 0.4% |
| Mexico | 20 | 1.3% |
| Moldova | 6 | 0.4% |
| Netherlands | 4 | 0.3% |
| Nigeria | 2 | 0.1% |
| Northern Europe | 4 | 0.3% |
| Panama | 4 | 0.3% |
| Philippines | 27 | 1.7% |
| Poland | 4 | 0.3% |
| Russia | 39 | 2.5% |
| South America | 14 | 0.9% |
| South Eastern Asia | 41 | 2.6% |
| Thailand | 4 | 0.3% |
| Ukraine | 59 | 3.7% |
| Western Africa | 2 | 0.1% |
| Western Europe | 4 | 0.3% | View All 28 Rows |
Sex and Age in Fife Heights
Sex and Age in Fife Heights
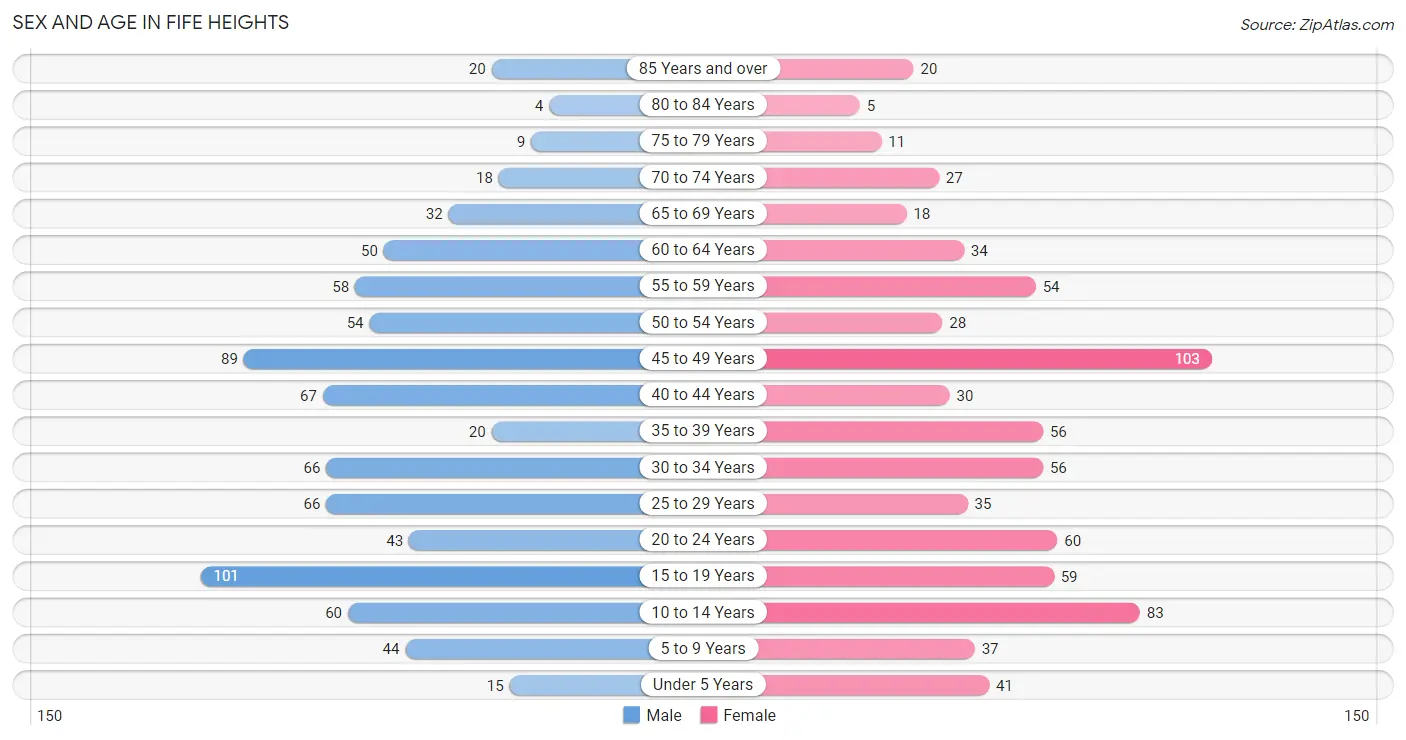
The most populous age groups in Fife Heights are 15 to 19 Years (101 | 12.4%) for men and 45 to 49 Years (103 | 13.6%) for women.
| Age Bracket | Male | Female |
| Under 5 Years | 15 (1.8%) | 41 (5.4%) |
| 5 to 9 Years | 44 (5.4%) | 37 (4.9%) |
| 10 to 14 Years | 60 (7.3%) | 83 (11.0%) |
| 15 to 19 Years | 101 (12.4%) | 59 (7.8%) |
| 20 to 24 Years | 43 (5.3%) | 60 (7.9%) |
| 25 to 29 Years | 66 (8.1%) | 35 (4.6%) |
| 30 to 34 Years | 66 (8.1%) | 56 (7.4%) |
| 35 to 39 Years | 20 (2.5%) | 56 (7.4%) |
| 40 to 44 Years | 67 (8.2%) | 30 (4.0%) |
| 45 to 49 Years | 89 (10.9%) | 103 (13.6%) |
| 50 to 54 Years | 54 (6.6%) | 28 (3.7%) |
| 55 to 59 Years | 58 (7.1%) | 54 (7.1%) |
| 60 to 64 Years | 50 (6.1%) | 34 (4.5%) |
| 65 to 69 Years | 32 (3.9%) | 18 (2.4%) |
| 70 to 74 Years | 18 (2.2%) | 27 (3.6%) |
| 75 to 79 Years | 9 (1.1%) | 11 (1.5%) |
| 80 to 84 Years | 4 (0.5%) | 5 (0.7%) |
| 85 Years and over | 20 (2.5%) | 20 (2.6%) |
| Total | 816 (100.0%) | 757 (100.0%) |
Families and Households in Fife Heights
Median Family Size in Fife Heights
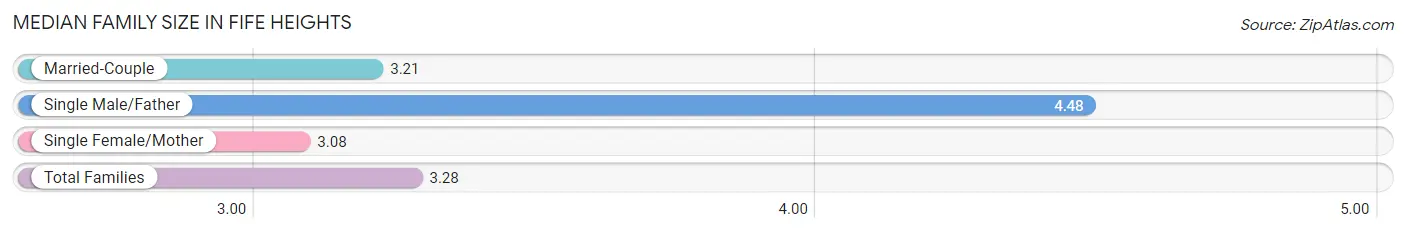
The median family size in Fife Heights is 3.28 persons per family, with single male/father families (23 | 5.3%) accounting for the largest median family size of 4.48 persons per family. On the other hand, single female/mother families (13 | 3.0%) represent the smallest median family size with 3.08 persons per family.
| Family Type | # Families | Family Size |
| Married-Couple | 399 (91.7%) | 3.21 |
| Single Male/Father | 23 (5.3%) | 4.48 |
| Single Female/Mother | 13 (3.0%) | 3.08 |
| Total Families | 435 (100.0%) | 3.28 |
Median Household Size in Fife Heights
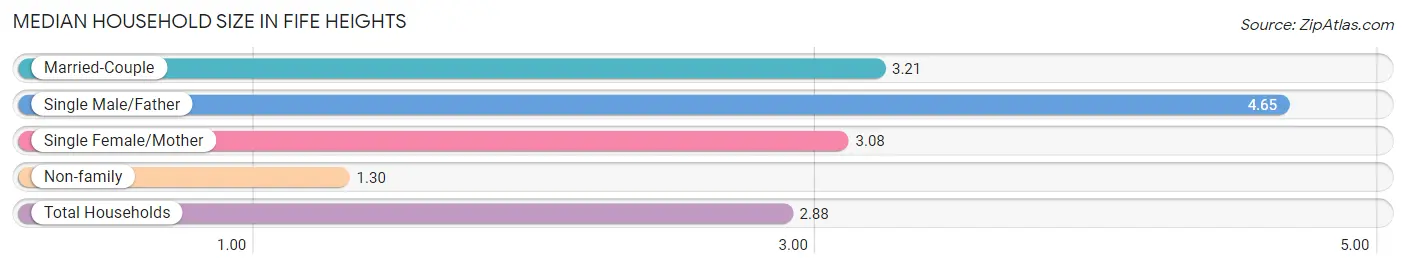
The median household size in Fife Heights is 2.88 persons per household, with single male/father households (23 | 4.2%) accounting for the largest median household size of 4.65 persons per household. non-family households (111 | 20.3%) represent the smallest median household size with 1.30 persons per household.
| Household Type | # Households | Household Size |
| Married-Couple | 399 (73.1%) | 3.21 |
| Single Male/Father | 23 (4.2%) | 4.65 |
| Single Female/Mother | 13 (2.4%) | 3.08 |
| Non-family | 111 (20.3%) | 1.30 |
| Total Households | 546 (100.0%) | 2.88 |
Household Size by Marriage Status in Fife Heights
Out of a total of 546 households in Fife Heights, 435 (79.7%) are family households, while 111 (20.3%) are nonfamily households. The most numerous type of family households are 2-person households, comprising 187, and the most common type of nonfamily households are 1-person households, comprising 84.
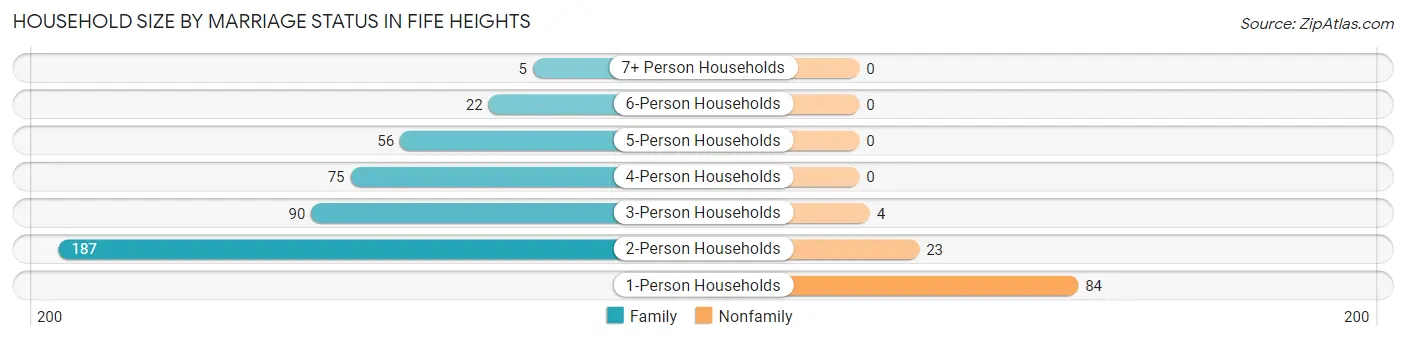
| Household Size | Family Households | Nonfamily Households |
| 1-Person Households | - | 84 (15.4%) |
| 2-Person Households | 187 (34.3%) | 23 (4.2%) |
| 3-Person Households | 90 (16.5%) | 4 (0.7%) |
| 4-Person Households | 75 (13.7%) | 0 (0.0%) |
| 5-Person Households | 56 (10.3%) | 0 (0.0%) |
| 6-Person Households | 22 (4.0%) | 0 (0.0%) |
| 7+ Person Households | 5 (0.9%) | 0 (0.0%) |
| Total | 435 (79.7%) | 111 (20.3%) |
Female Fertility in Fife Heights
Fertility by Age in Fife Heights
Average fertility rate in Fife Heights is 87.0 births per 1,000 women. Women in the age bracket of 20 to 34 years have the highest fertility rate with 205.0 births per 1,000 women. Women in the age bracket of 20 to 34 years acount for 88.6% of all women with births.
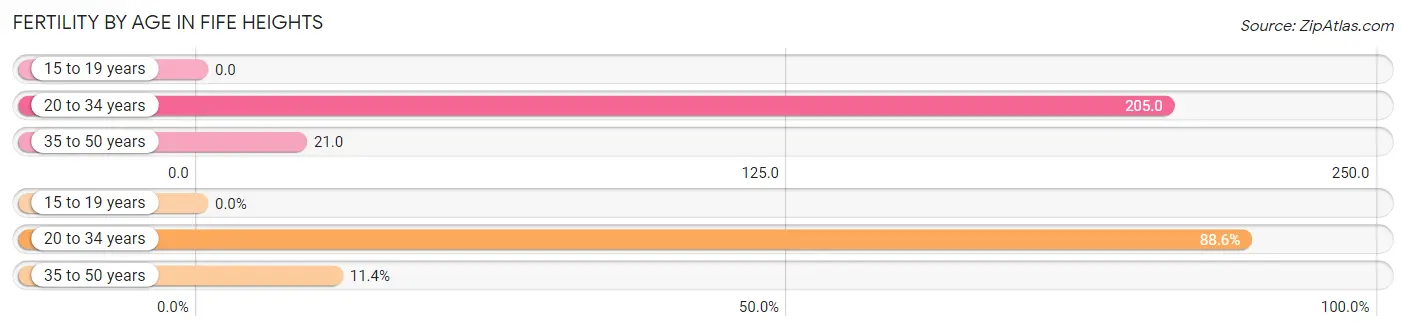
| Age Bracket | Women with Births | Births / 1,000 Women |
| 15 to 19 years | 0 (0.0%) | 0.0 |
| 20 to 34 years | 31 (88.6%) | 205.0 |
| 35 to 50 years | 4 (11.4%) | 21.0 |
| Total | 35 (100.0%) | 87.0 |
Fertility by Age by Marriage Status in Fife Heights
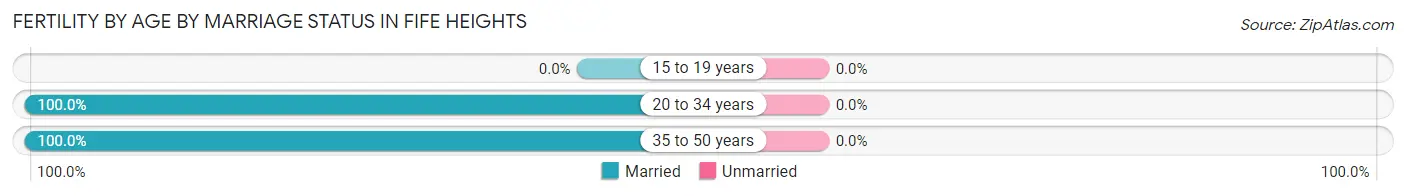
| Age Bracket | Married | Unmarried |
| 15 to 19 years | 0 (0.0%) | 0 (0.0%) |
| 20 to 34 years | 31 (100.0%) | 0 (0.0%) |
| 35 to 50 years | 4 (100.0%) | 0 (0.0%) |
| Total | 35 (100.0%) | 0 (0.0%) |
Fertility by Education in Fife Heights
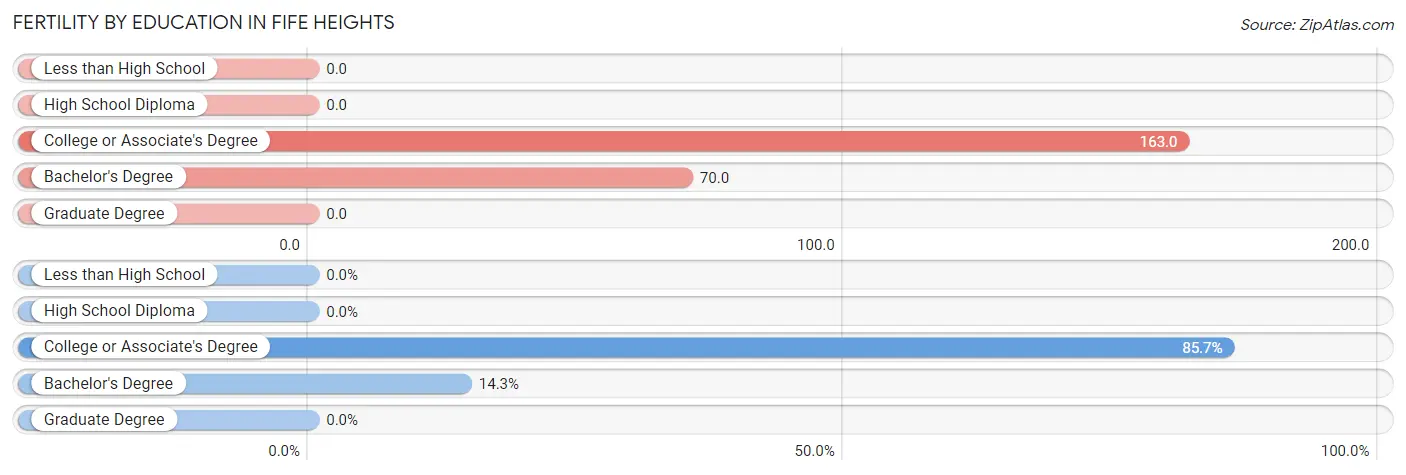
| Educational Attainment | Women with Births | Births / 1,000 Women |
| Less than High School | 0 (0.0%) | 0.0 |
| High School Diploma | 0 (0.0%) | 0.0 |
| College or Associate's Degree | 30 (85.7%) | 163.0 |
| Bachelor's Degree | 5 (14.3%) | 70.0 |
| Graduate Degree | 0 (0.0%) | 0.0 |
| Total | 35 (100.0%) | 87.0 |
Fertility by Education by Marriage Status in Fife Heights
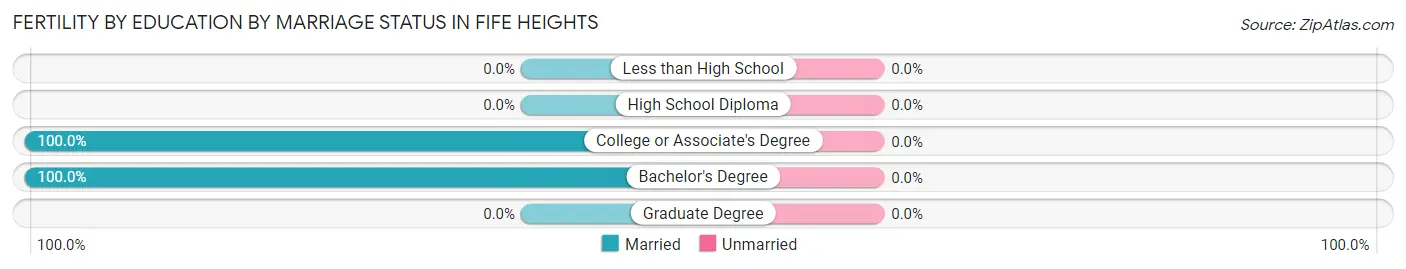
| Educational Attainment | Married | Unmarried |
| Less than High School | 0 (0.0%) | 0 (0.0%) |
| High School Diploma | 0 (0.0%) | 0 (0.0%) |
| College or Associate's Degree | 30 (100.0%) | 0 (0.0%) |
| Bachelor's Degree | 5 (100.0%) | 0 (0.0%) |
| Graduate Degree | 0 (0.0%) | 0 (0.0%) |
| Total | 35 (100.0%) | 0 (0.0%) |
Employment Characteristics in Fife Heights
Employment by Class of Employer in Fife Heights
Among the 883 employed individuals in Fife Heights, private company employees (637 | 72.1%), local government employees (64 | 7.2%), and not-for-profit organizations (53 | 6.0%) make up the most common classes of employment.
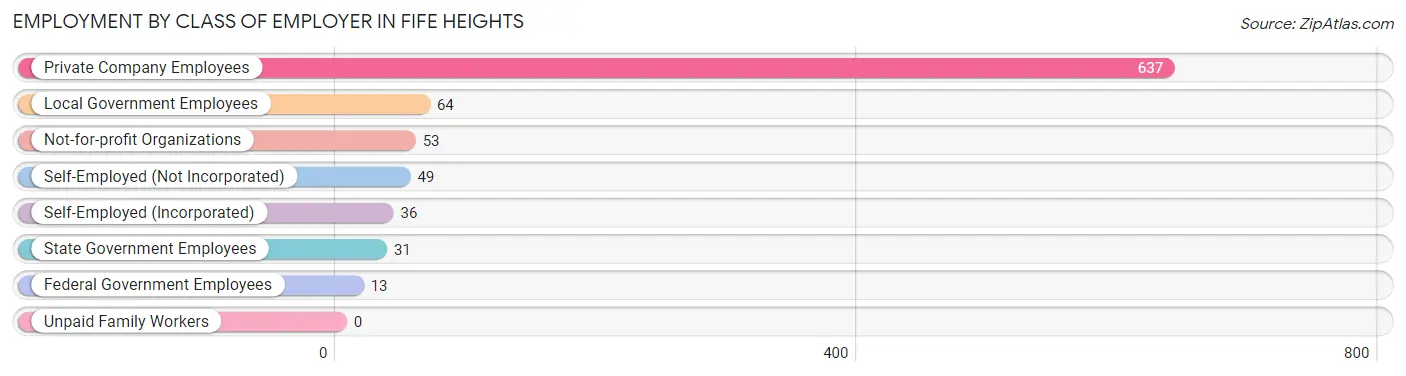
| Employer Class | # Employees | % Employees |
| Private Company Employees | 637 | 72.1% |
| Self-Employed (Incorporated) | 36 | 4.1% |
| Self-Employed (Not Incorporated) | 49 | 5.6% |
| Not-for-profit Organizations | 53 | 6.0% |
| Local Government Employees | 64 | 7.2% |
| State Government Employees | 31 | 3.5% |
| Federal Government Employees | 13 | 1.5% |
| Unpaid Family Workers | 0 | 0.0% |
| Total | 883 | 100.0% |
Employment Status by Age in Fife Heights
According to the labor force statistics for Fife Heights, out of the total population over 16 years of age (1,249), 74.1% or 926 individuals are in the labor force, with 4.0% or 37 of them unemployed. The age group with the highest labor force participation rate is 35 to 44 years, with 100.0% or 173 individuals in the labor force. Within the labor force, the 16 to 19 years age range has the highest percentage of unemployed individuals, with 70.2% or 33 of them being unemployed.
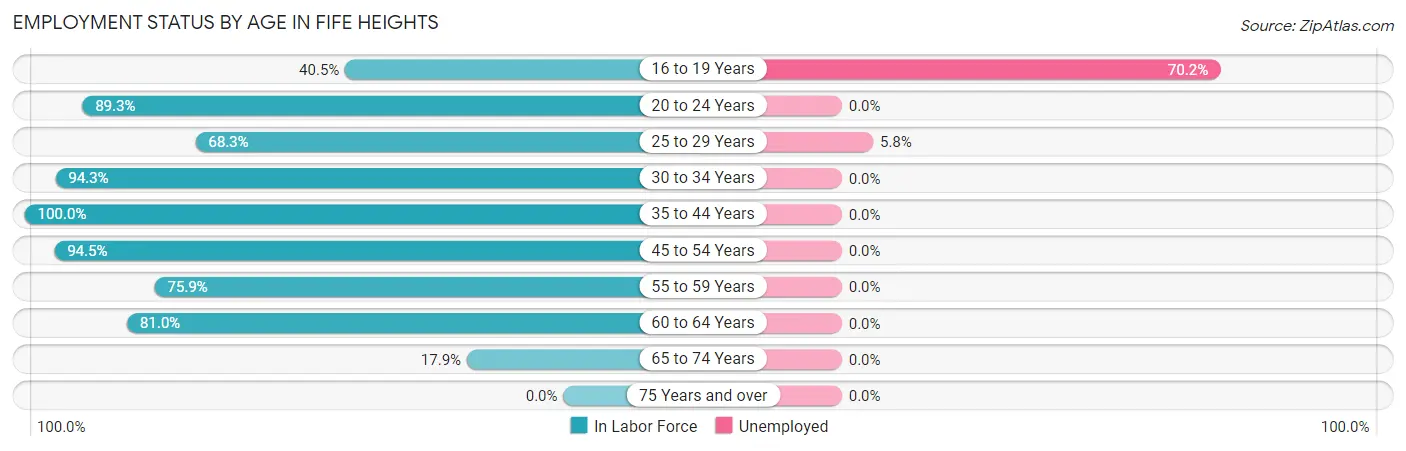
| Age Bracket | In Labor Force | Unemployed |
| 16 to 19 Years | 47 (40.5%) | 33 (70.2%) |
| 20 to 24 Years | 92 (89.3%) | 0 (0.0%) |
| 25 to 29 Years | 69 (68.3%) | 4 (5.8%) |
| 30 to 34 Years | 115 (94.3%) | 0 (0.0%) |
| 35 to 44 Years | 173 (100.0%) | 0 (0.0%) |
| 45 to 54 Years | 259 (94.5%) | 0 (0.0%) |
| 55 to 59 Years | 85 (75.9%) | 0 (0.0%) |
| 60 to 64 Years | 68 (81.0%) | 0 (0.0%) |
| 65 to 74 Years | 17 (17.9%) | 0 (0.0%) |
| 75 Years and over | 0 (0.0%) | 0 (0.0%) |
| Total | 926 (74.1%) | 37 (4.0%) |
Employment Status by Educational Attainment in Fife Heights
According to labor force statistics for Fife Heights, 88.8% of individuals (769) out of the total population between 25 and 64 years of age (866) are in the labor force, with 0.5% or 4 of them being unemployed. The group with the highest labor force participation rate are those with the educational attainment of bachelor's degree or higher, with 90.4% or 208 individuals in the labor force. Within the labor force, individuals with bachelor's degree or higher education have the highest percentage of unemployment, with 1.9% or 4 of them being unemployed.
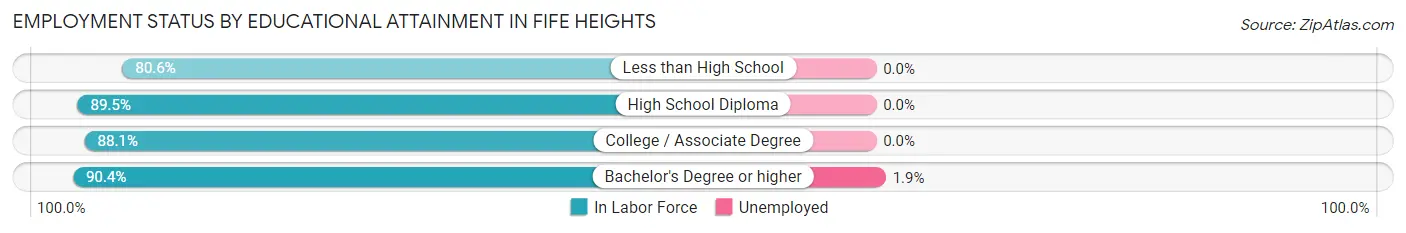
| Educational Attainment | In Labor Force | Unemployed |
| Less than High School | 29 (80.6%) | 0 (0.0%) |
| High School Diploma | 205 (89.5%) | 0 (0.0%) |
| College / Associate Degree | 327 (88.1%) | 0 (0.0%) |
| Bachelor's Degree or higher | 208 (90.4%) | 4 (1.9%) |
| Total | 769 (88.8%) | 4 (0.5%) |
Employment Occupations by Sex in Fife Heights
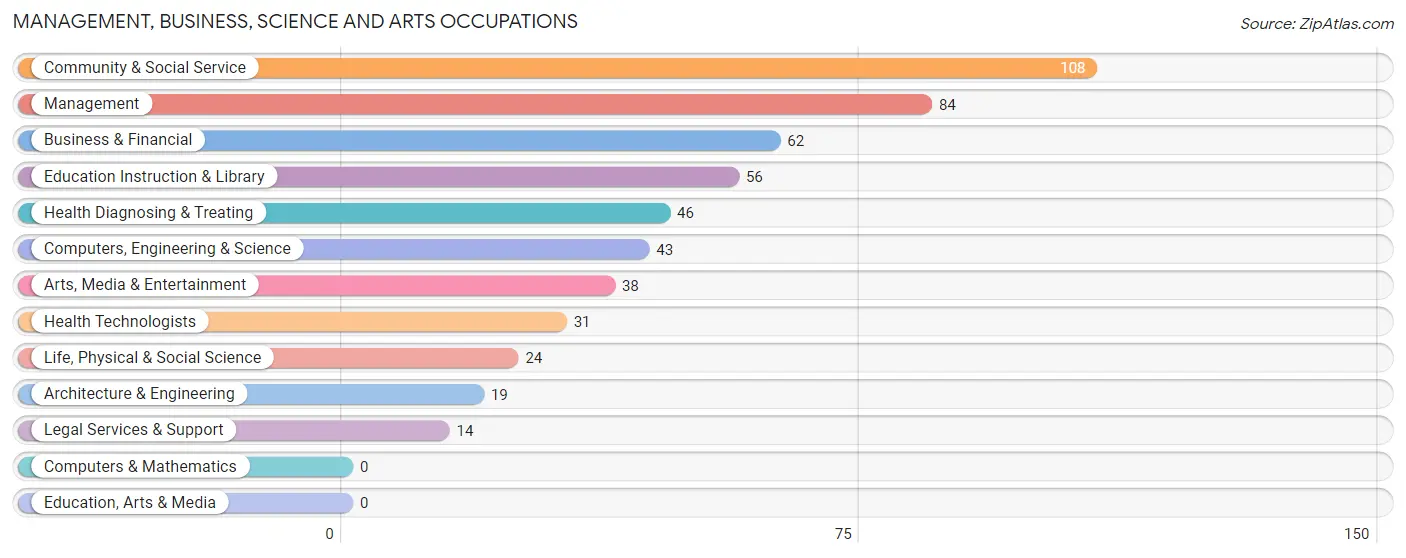
Management, Business, Science and Arts Occupations
The most common Management, Business, Science and Arts occupations in Fife Heights are Community & Social Service (108 | 12.2%), Management (84 | 9.5%), Business & Financial (62 | 7.0%), Education Instruction & Library (56 | 6.3%), and Health Diagnosing & Treating (46 | 5.2%).
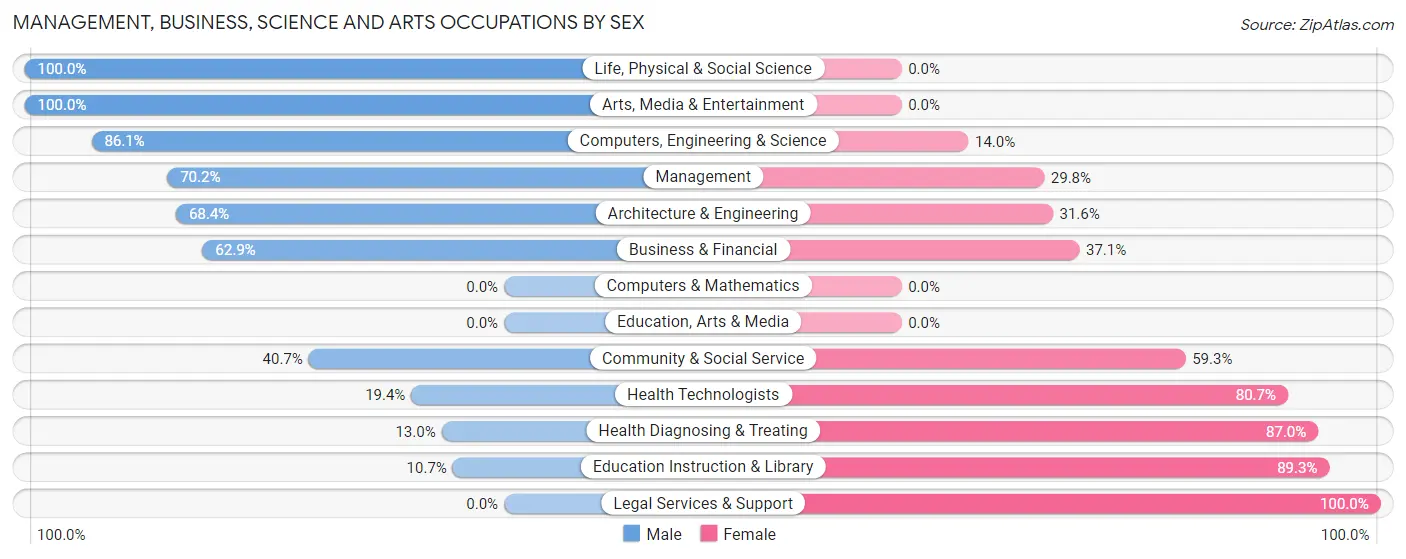
Management, Business, Science and Arts Occupations by Sex
Within the Management, Business, Science and Arts occupations in Fife Heights, the most male-oriented occupations are Life, Physical & Social Science (100.0%), Arts, Media & Entertainment (100.0%), and Computers, Engineering & Science (86.1%), while the most female-oriented occupations are Legal Services & Support (100.0%), Education Instruction & Library (89.3%), and Health Diagnosing & Treating (87.0%).
| Occupation | Male | Female |
| Management | 59 (70.2%) | 25 (29.8%) |
| Business & Financial | 39 (62.9%) | 23 (37.1%) |
| Computers, Engineering & Science | 37 (86.1%) | 6 (14.0%) |
| Computers & Mathematics | 0 (0.0%) | 0 (0.0%) |
| Architecture & Engineering | 13 (68.4%) | 6 (31.6%) |
| Life, Physical & Social Science | 24 (100.0%) | 0 (0.0%) |
| Community & Social Service | 44 (40.7%) | 64 (59.3%) |
| Education, Arts & Media | 0 (0.0%) | 0 (0.0%) |
| Legal Services & Support | 0 (0.0%) | 14 (100.0%) |
| Education Instruction & Library | 6 (10.7%) | 50 (89.3%) |
| Arts, Media & Entertainment | 38 (100.0%) | 0 (0.0%) |
| Health Diagnosing & Treating | 6 (13.0%) | 40 (87.0%) |
| Health Technologists | 6 (19.4%) | 25 (80.6%) |
| Total (Category) | 185 (53.9%) | 158 (46.1%) |
| Total (Overall) | 498 (56.1%) | 390 (43.9%) |
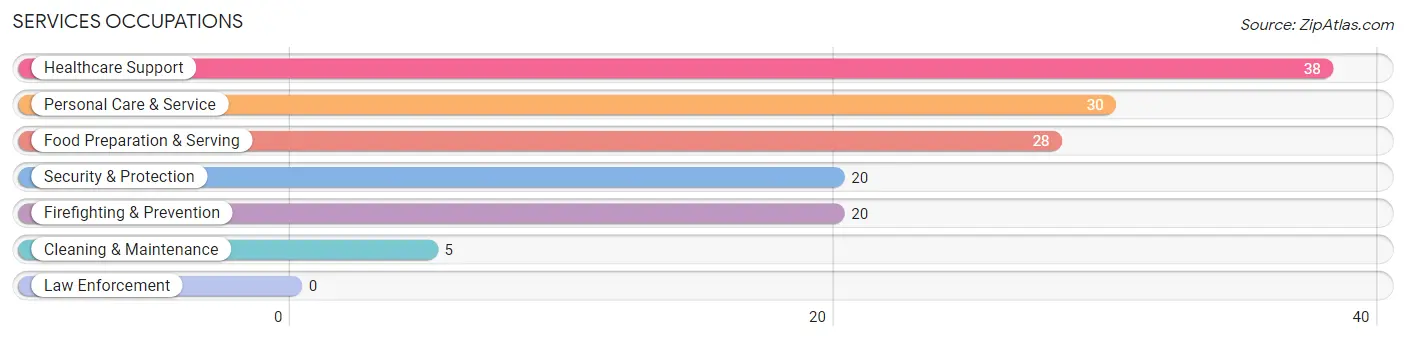
Services Occupations
The most common Services occupations in Fife Heights are Healthcare Support (38 | 4.3%), Personal Care & Service (30 | 3.4%), Food Preparation & Serving (28 | 3.2%), Security & Protection (20 | 2.2%), and Firefighting & Prevention (20 | 2.2%).
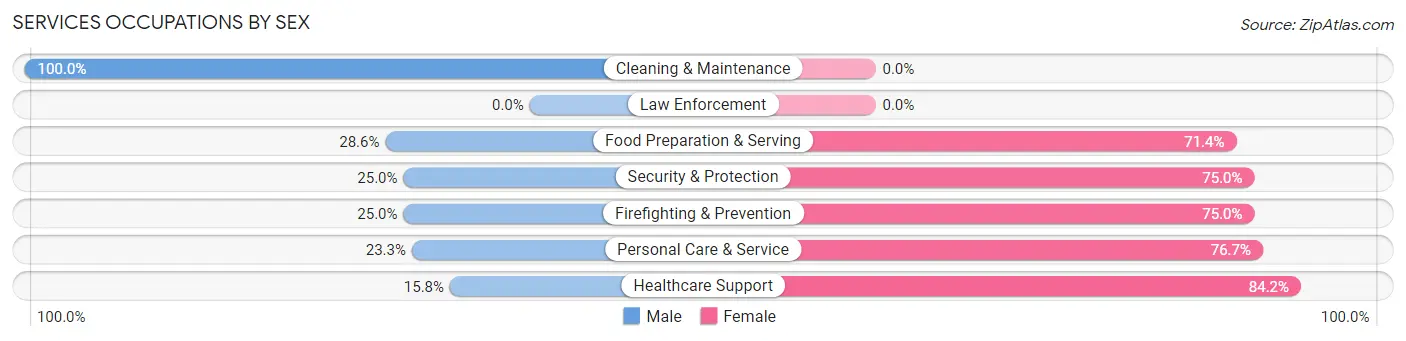
Services Occupations by Sex
Within the Services occupations in Fife Heights, the most male-oriented occupations are Cleaning & Maintenance (100.0%), Food Preparation & Serving (28.6%), and Security & Protection (25.0%), while the most female-oriented occupations are Healthcare Support (84.2%), Personal Care & Service (76.7%), and Security & Protection (75.0%).
| Occupation | Male | Female |
| Healthcare Support | 6 (15.8%) | 32 (84.2%) |
| Security & Protection | 5 (25.0%) | 15 (75.0%) |
| Firefighting & Prevention | 5 (25.0%) | 15 (75.0%) |
| Law Enforcement | 0 (0.0%) | 0 (0.0%) |
| Food Preparation & Serving | 8 (28.6%) | 20 (71.4%) |
| Cleaning & Maintenance | 5 (100.0%) | 0 (0.0%) |
| Personal Care & Service | 7 (23.3%) | 23 (76.7%) |
| Total (Category) | 31 (25.6%) | 90 (74.4%) |
| Total (Overall) | 498 (56.1%) | 390 (43.9%) |
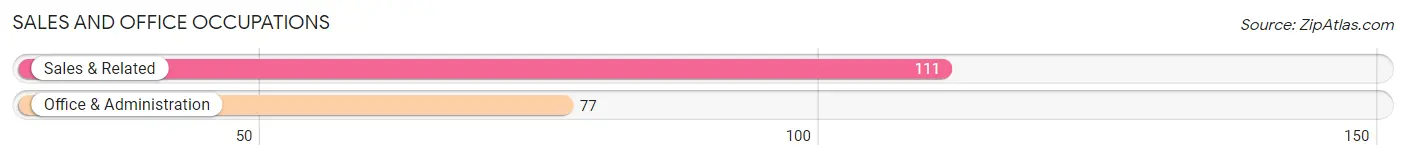
Sales and Office Occupations
The most common Sales and Office occupations in Fife Heights are Sales & Related (111 | 12.5%), and Office & Administration (77 | 8.7%).
Sales and Office Occupations by Sex
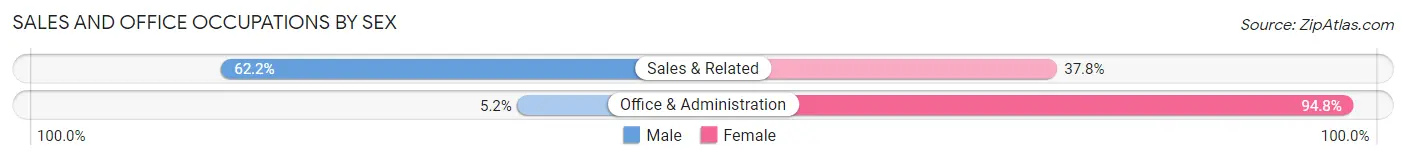
| Occupation | Male | Female |
| Sales & Related | 69 (62.2%) | 42 (37.8%) |
| Office & Administration | 4 (5.2%) | 73 (94.8%) |
| Total (Category) | 73 (38.8%) | 115 (61.2%) |
| Total (Overall) | 498 (56.1%) | 390 (43.9%) |
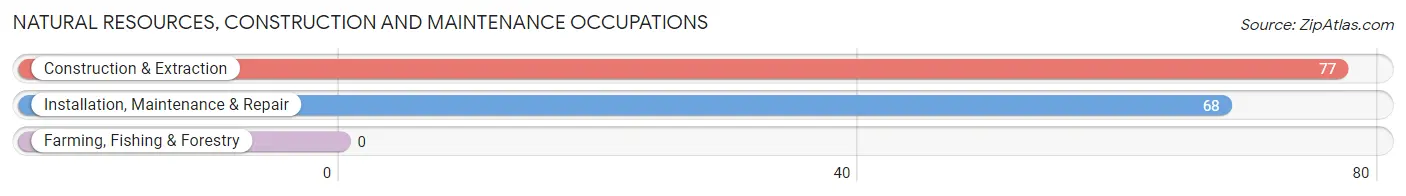
Natural Resources, Construction and Maintenance Occupations
The most common Natural Resources, Construction and Maintenance occupations in Fife Heights are Construction & Extraction (77 | 8.7%), and Installation, Maintenance & Repair (68 | 7.7%).
Natural Resources, Construction and Maintenance Occupations by Sex
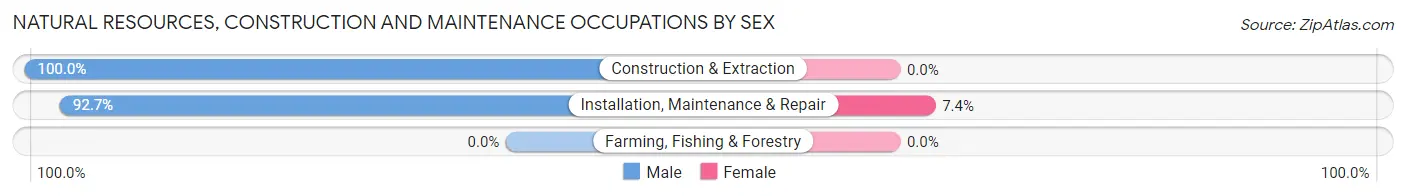
| Occupation | Male | Female |
| Farming, Fishing & Forestry | 0 (0.0%) | 0 (0.0%) |
| Construction & Extraction | 77 (100.0%) | 0 (0.0%) |
| Installation, Maintenance & Repair | 63 (92.6%) | 5 (7.3%) |
| Total (Category) | 140 (96.6%) | 5 (3.5%) |
| Total (Overall) | 498 (56.1%) | 390 (43.9%) |
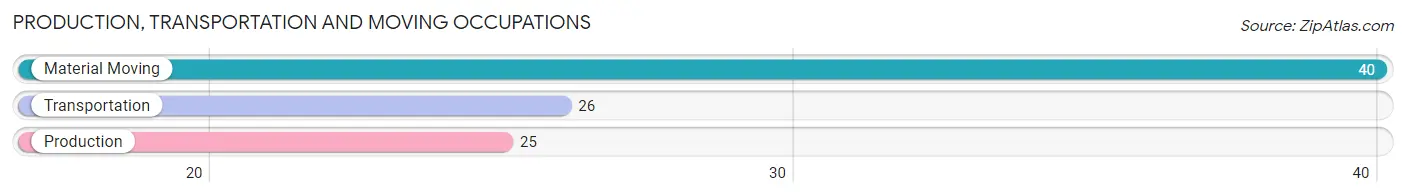
Production, Transportation and Moving Occupations
The most common Production, Transportation and Moving occupations in Fife Heights are Material Moving (40 | 4.5%), Transportation (26 | 2.9%), and Production (25 | 2.8%).
Production, Transportation and Moving Occupations by Sex
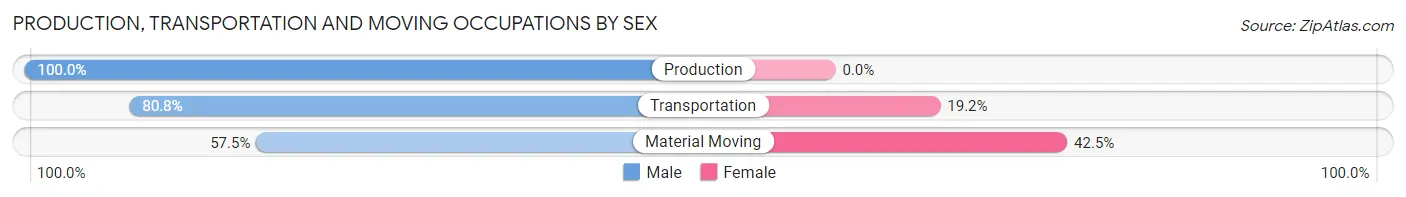
| Occupation | Male | Female |
| Production | 25 (100.0%) | 0 (0.0%) |
| Transportation | 21 (80.8%) | 5 (19.2%) |
| Material Moving | 23 (57.5%) | 17 (42.5%) |
| Total (Category) | 69 (75.8%) | 22 (24.2%) |
| Total (Overall) | 498 (56.1%) | 390 (43.9%) |
Employment Industries by Sex in Fife Heights
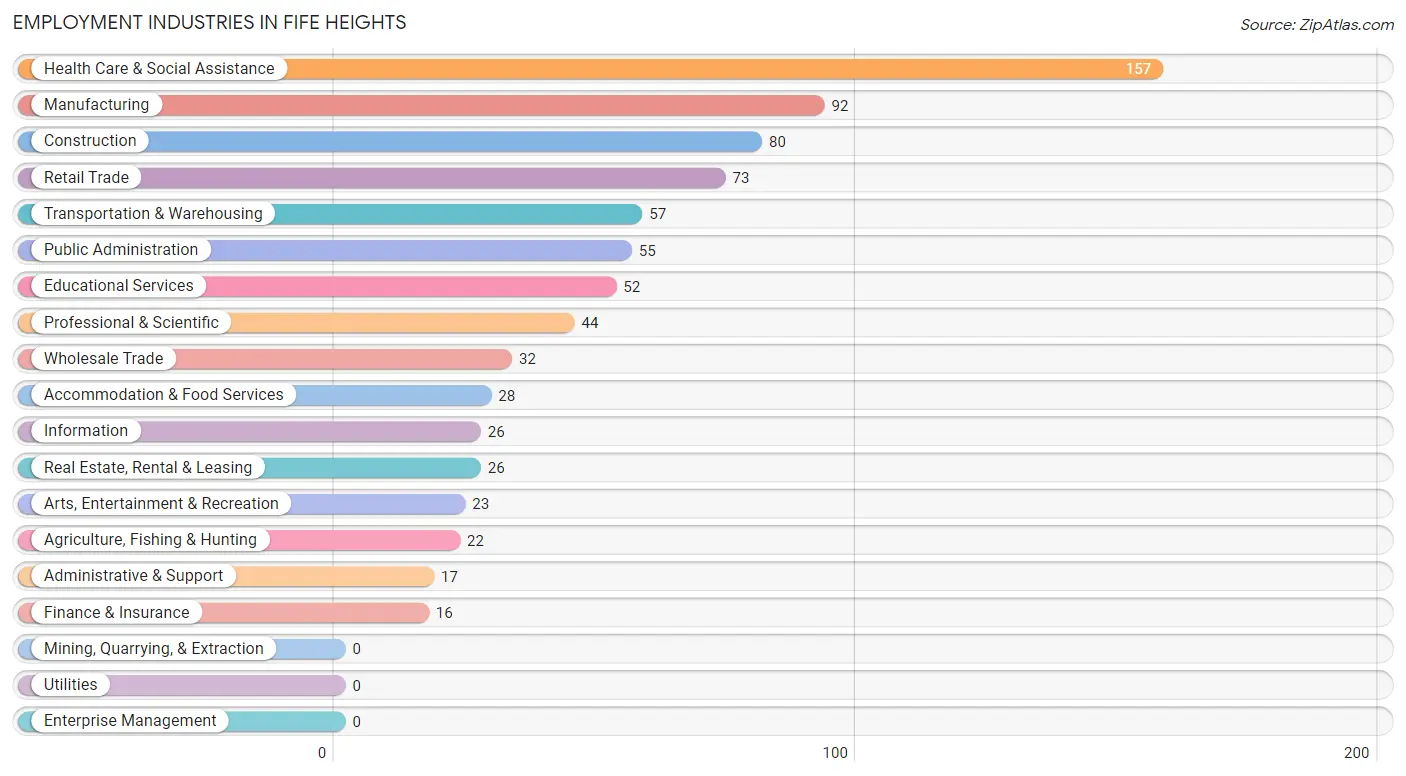
Employment Industries in Fife Heights
The major employment industries in Fife Heights include Health Care & Social Assistance (157 | 17.7%), Manufacturing (92 | 10.4%), Construction (80 | 9.0%), Retail Trade (73 | 8.2%), and Transportation & Warehousing (57 | 6.4%).
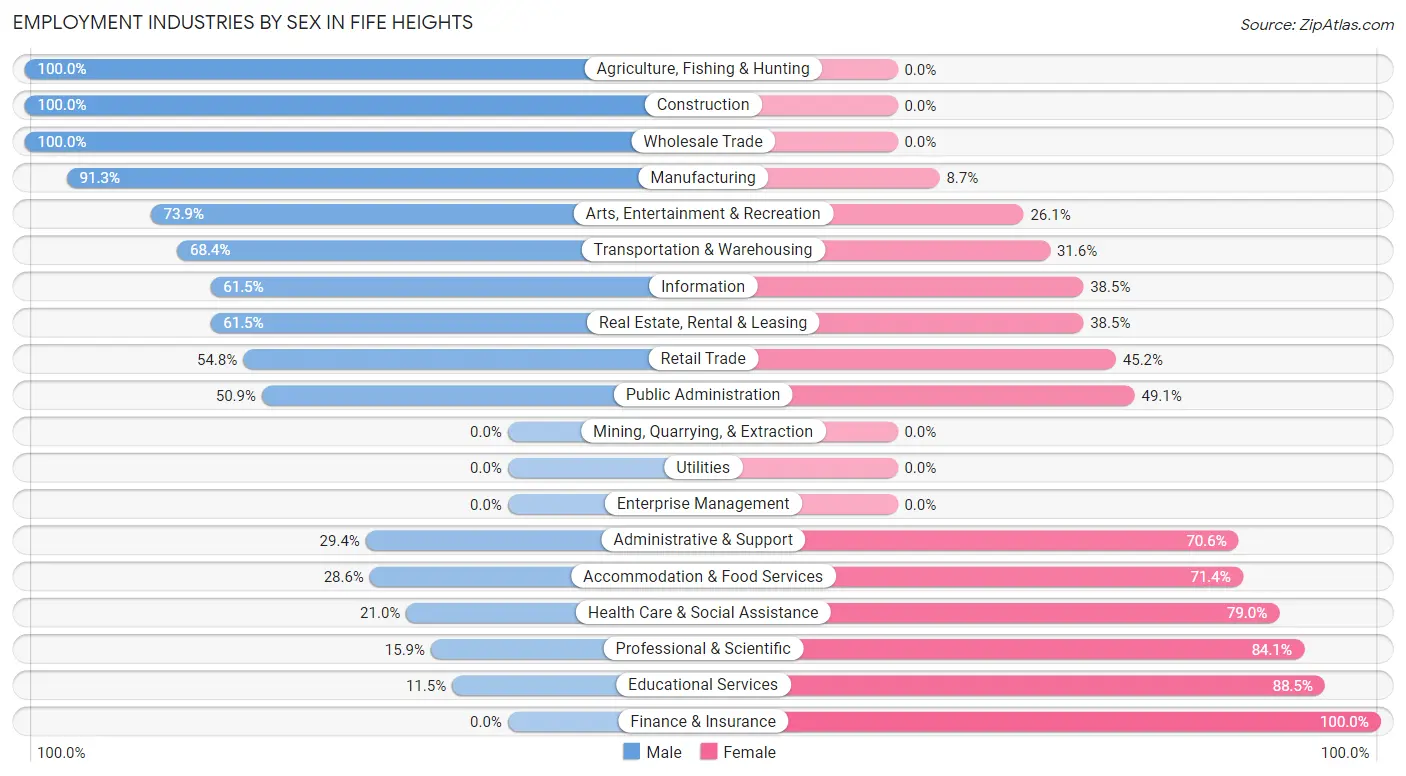
Employment Industries by Sex in Fife Heights
The Fife Heights industries that see more men than women are Agriculture, Fishing & Hunting (100.0%), Construction (100.0%), and Wholesale Trade (100.0%), whereas the industries that tend to have a higher number of women are Finance & Insurance (100.0%), Educational Services (88.5%), and Professional & Scientific (84.1%).
| Industry | Male | Female |
| Agriculture, Fishing & Hunting | 22 (100.0%) | 0 (0.0%) |
| Mining, Quarrying, & Extraction | 0 (0.0%) | 0 (0.0%) |
| Construction | 80 (100.0%) | 0 (0.0%) |
| Manufacturing | 84 (91.3%) | 8 (8.7%) |
| Wholesale Trade | 32 (100.0%) | 0 (0.0%) |
| Retail Trade | 40 (54.8%) | 33 (45.2%) |
| Transportation & Warehousing | 39 (68.4%) | 18 (31.6%) |
| Utilities | 0 (0.0%) | 0 (0.0%) |
| Information | 16 (61.5%) | 10 (38.5%) |
| Finance & Insurance | 0 (0.0%) | 16 (100.0%) |
| Real Estate, Rental & Leasing | 16 (61.5%) | 10 (38.5%) |
| Professional & Scientific | 7 (15.9%) | 37 (84.1%) |
| Enterprise Management | 0 (0.0%) | 0 (0.0%) |
| Administrative & Support | 5 (29.4%) | 12 (70.6%) |
| Educational Services | 6 (11.5%) | 46 (88.5%) |
| Health Care & Social Assistance | 33 (21.0%) | 124 (79.0%) |
| Arts, Entertainment & Recreation | 17 (73.9%) | 6 (26.1%) |
| Accommodation & Food Services | 8 (28.6%) | 20 (71.4%) |
| Public Administration | 28 (50.9%) | 27 (49.1%) |
| Total | 498 (56.1%) | 390 (43.9%) |
Education in Fife Heights
School Enrollment in Fife Heights
The most common levels of schooling among the 400 students in Fife Heights are high school (120 | 30.0%), middle school (95 | 23.7%), and elementary school (79 | 19.8%).
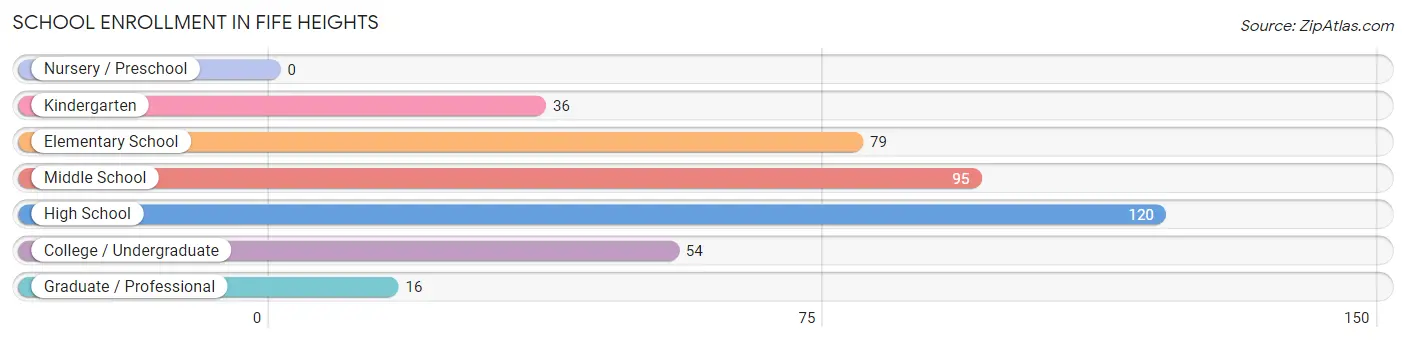
| School Level | # Students | % Students |
| Nursery / Preschool | 0 | 0.0% |
| Kindergarten | 36 | 9.0% |
| Elementary School | 79 | 19.8% |
| Middle School | 95 | 23.7% |
| High School | 120 | 30.0% |
| College / Undergraduate | 54 | 13.5% |
| Graduate / Professional | 16 | 4.0% |
| Total | 400 | 100.0% |
School Enrollment by Age by Funding Source in Fife Heights
Out of a total of 400 students who are enrolled in schools in Fife Heights, 61 (15.3%) attend a private institution, while the remaining 339 (84.7%) are enrolled in public schools. The age group of 20 to 24 year olds has the highest likelihood of being enrolled in private schools, with 14 (100.0% in the age bracket) enrolled. Conversely, the age group of 3 to 4 year olds has the lowest likelihood of being enrolled in a private school, with 4 (100.0% in the age bracket) attending a public institution.
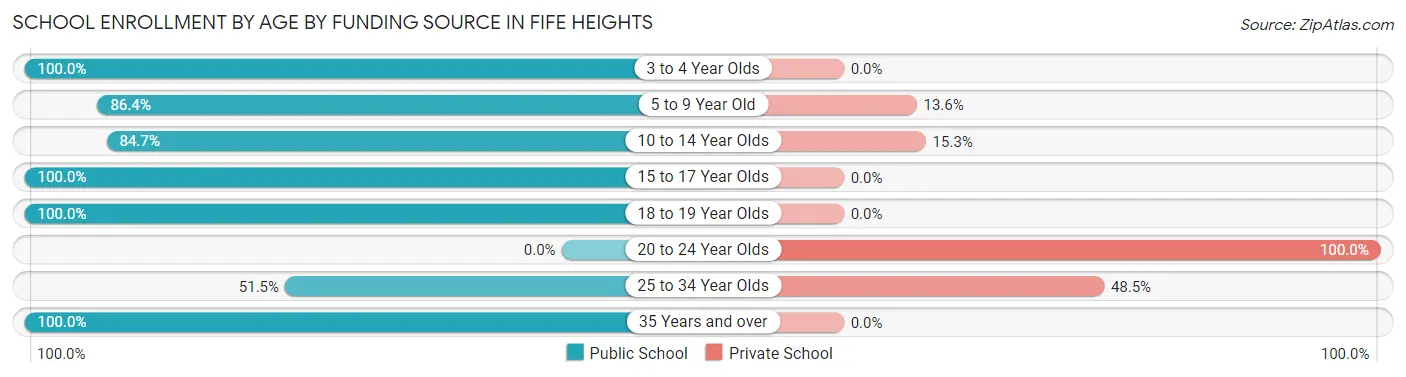
| Age Bracket | Public School | Private School |
| 3 to 4 Year Olds | 4 (100.0%) | 0 (0.0%) |
| 5 to 9 Year Old | 70 (86.4%) | 11 (13.6%) |
| 10 to 14 Year Olds | 111 (84.7%) | 20 (15.3%) |
| 15 to 17 Year Olds | 114 (100.0%) | 0 (0.0%) |
| 18 to 19 Year Olds | 8 (100.0%) | 0 (0.0%) |
| 20 to 24 Year Olds | 0 (0.0%) | 14 (100.0%) |
| 25 to 34 Year Olds | 17 (51.5%) | 16 (48.5%) |
| 35 Years and over | 15 (100.0%) | 0 (0.0%) |
| Total | 339 (84.8%) | 61 (15.3%) |
Educational Attainment by Field of Study in Fife Heights
Business (46 | 14.6%), arts & humanities (35 | 11.2%), education (32 | 10.2%), visual & performing arts (32 | 10.2%), and social sciences (29 | 9.2%) are the most common fields of study among 314 individuals in Fife Heights who have obtained a bachelor's degree or higher.
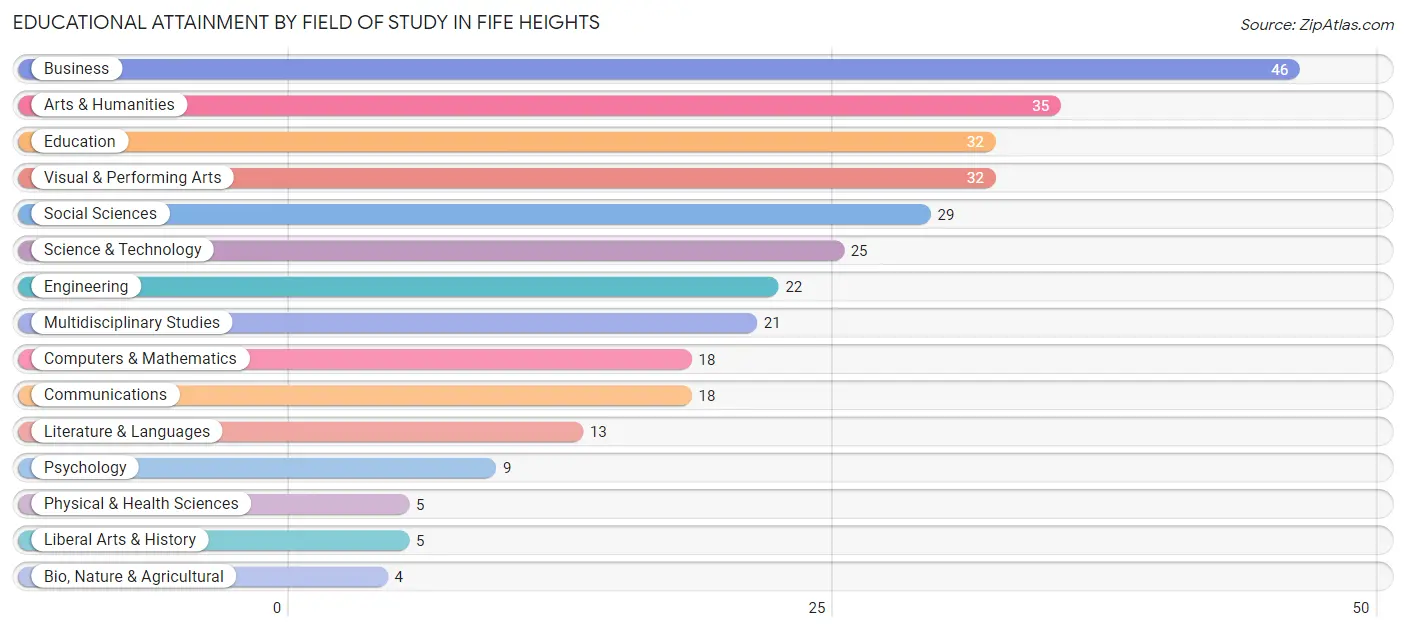
| Field of Study | # Graduates | % Graduates |
| Computers & Mathematics | 18 | 5.7% |
| Bio, Nature & Agricultural | 4 | 1.3% |
| Physical & Health Sciences | 5 | 1.6% |
| Psychology | 9 | 2.9% |
| Social Sciences | 29 | 9.2% |
| Engineering | 22 | 7.0% |
| Multidisciplinary Studies | 21 | 6.7% |
| Science & Technology | 25 | 8.0% |
| Business | 46 | 14.6% |
| Education | 32 | 10.2% |
| Literature & Languages | 13 | 4.1% |
| Liberal Arts & History | 5 | 1.6% |
| Visual & Performing Arts | 32 | 10.2% |
| Communications | 18 | 5.7% |
| Arts & Humanities | 35 | 11.2% |
| Total | 314 | 100.0% |
Transportation & Commute in Fife Heights
Vehicle Availability by Sex in Fife Heights
The most prevalent vehicle ownership categories in Fife Heights are males with 2 vehicles (185, accounting for 37.5%) and females with 2 vehicles (135, making up 47.4%).
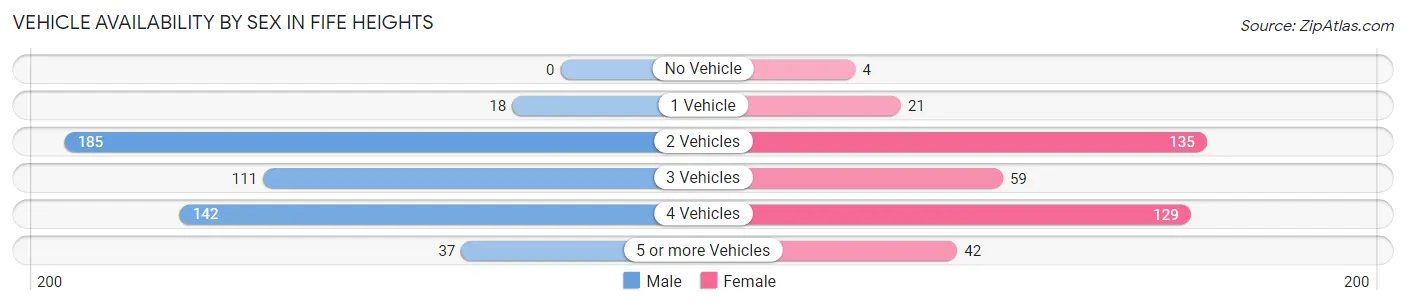
| Vehicles Available | Male | Female |
| No Vehicle | 0 (0.0%) | 4 (1.0%) |
| 1 Vehicle | 18 (3.6%) | 21 (5.4%) |
| 2 Vehicles | 185 (37.5%) | 135 (34.6%) |
| 3 Vehicles | 111 (22.5%) | 59 (15.1%) |
| 4 Vehicles | 142 (28.8%) | 129 (33.1%) |
| 5 or more Vehicles | 37 (7.5%) | 42 (10.8%) |
| Total | 493 (100.0%) | 390 (100.0%) |
Commute Time in Fife Heights
The most frequently occuring commute durations in Fife Heights are 30 to 34 minutes (171 commuters, 22.6%), 10 to 14 minutes (120 commuters, 15.9%), and 20 to 24 minutes (118 commuters, 15.6%).
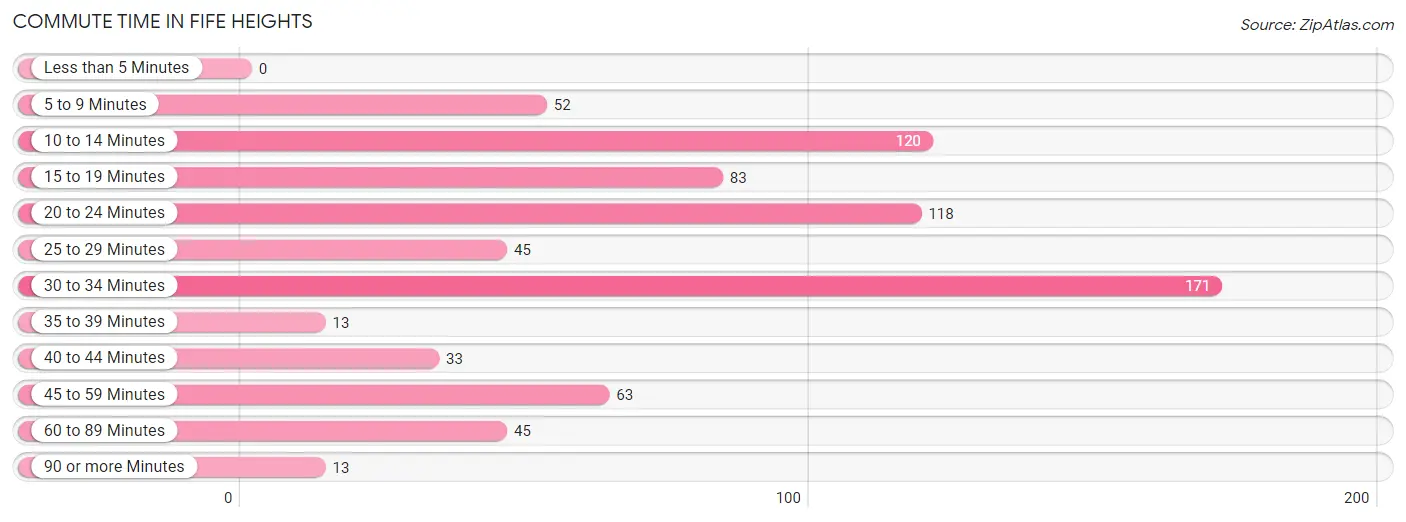
| Commute Time | # Commuters | % Commuters |
| Less than 5 Minutes | 0 | 0.0% |
| 5 to 9 Minutes | 52 | 6.9% |
| 10 to 14 Minutes | 120 | 15.9% |
| 15 to 19 Minutes | 83 | 11.0% |
| 20 to 24 Minutes | 118 | 15.6% |
| 25 to 29 Minutes | 45 | 5.9% |
| 30 to 34 Minutes | 171 | 22.6% |
| 35 to 39 Minutes | 13 | 1.7% |
| 40 to 44 Minutes | 33 | 4.4% |
| 45 to 59 Minutes | 63 | 8.3% |
| 60 to 89 Minutes | 45 | 5.9% |
| 90 or more Minutes | 13 | 1.7% |
Commute Time by Sex in Fife Heights
The most common commute times in Fife Heights are 10 to 14 minutes (95 commuters, 21.4%) for males and 20 to 24 minutes (90 commuters, 28.8%) for females.
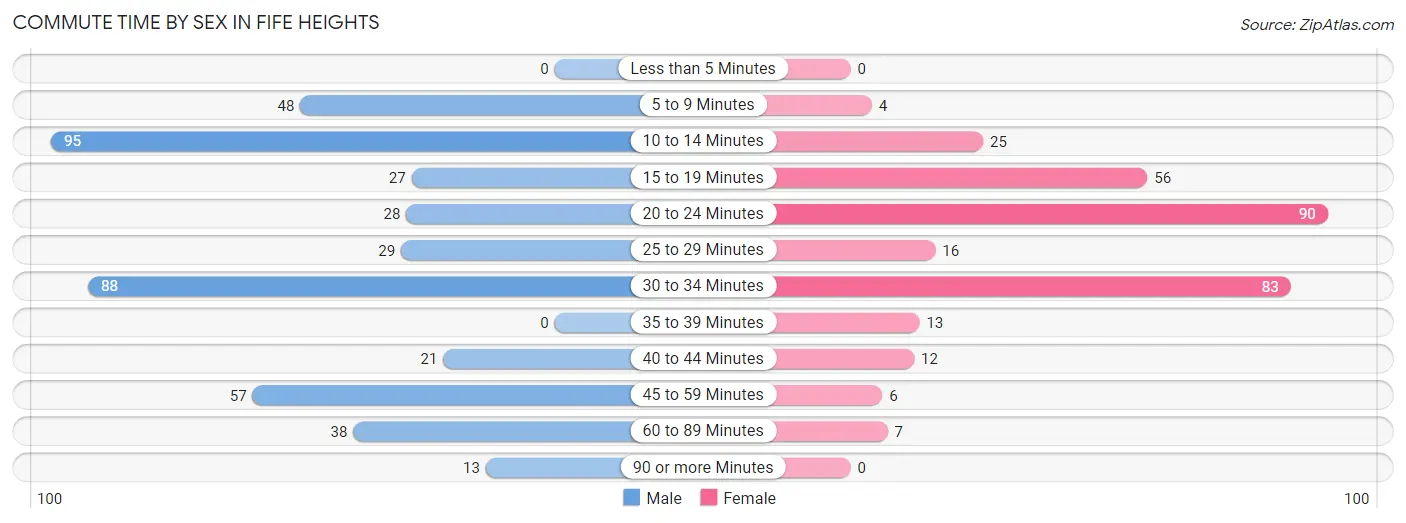
| Commute Time | Male | Female |
| Less than 5 Minutes | 0 (0.0%) | 0 (0.0%) |
| 5 to 9 Minutes | 48 (10.8%) | 4 (1.3%) |
| 10 to 14 Minutes | 95 (21.4%) | 25 (8.0%) |
| 15 to 19 Minutes | 27 (6.1%) | 56 (17.9%) |
| 20 to 24 Minutes | 28 (6.3%) | 90 (28.8%) |
| 25 to 29 Minutes | 29 (6.5%) | 16 (5.1%) |
| 30 to 34 Minutes | 88 (19.8%) | 83 (26.6%) |
| 35 to 39 Minutes | 0 (0.0%) | 13 (4.2%) |
| 40 to 44 Minutes | 21 (4.7%) | 12 (3.8%) |
| 45 to 59 Minutes | 57 (12.8%) | 6 (1.9%) |
| 60 to 89 Minutes | 38 (8.6%) | 7 (2.2%) |
| 90 or more Minutes | 13 (2.9%) | 0 (0.0%) |
Time of Departure to Work by Sex in Fife Heights
The most frequent times of departure to work in Fife Heights are 6:00 AM to 6:29 AM (98, 22.1%) for males and 8:00 AM to 8:29 AM (72, 23.1%) for females.
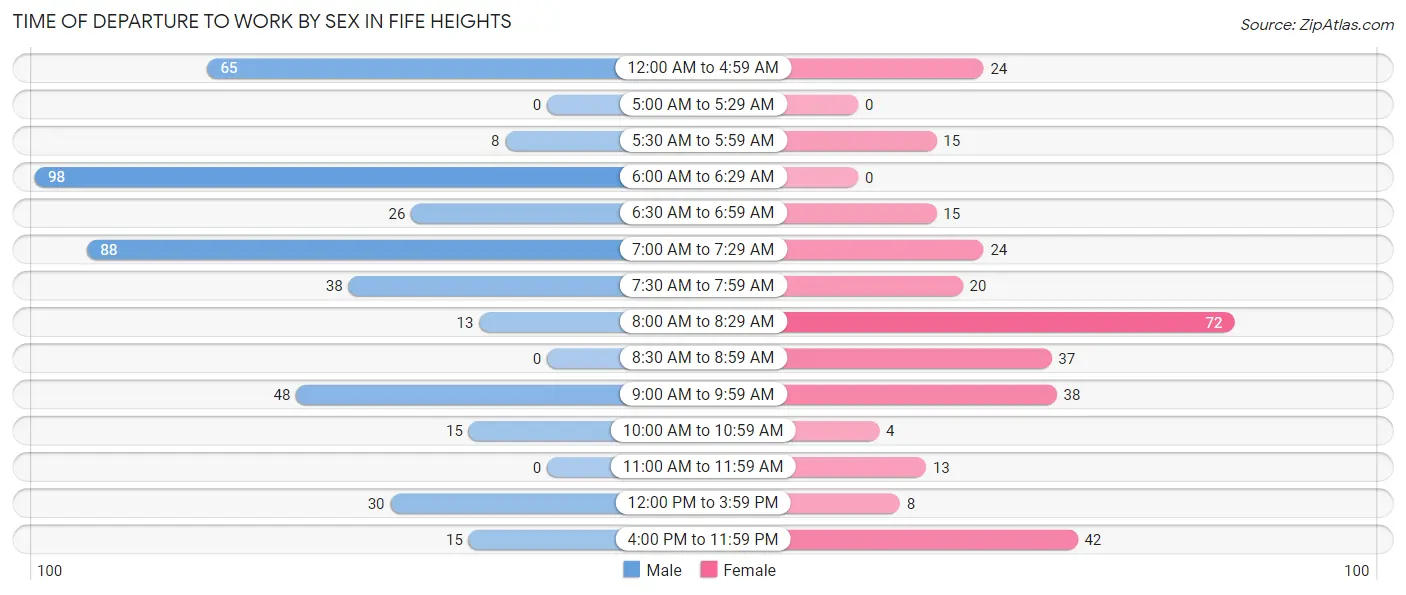
| Time of Departure | Male | Female |
| 12:00 AM to 4:59 AM | 65 (14.6%) | 24 (7.7%) |
| 5:00 AM to 5:29 AM | 0 (0.0%) | 0 (0.0%) |
| 5:30 AM to 5:59 AM | 8 (1.8%) | 15 (4.8%) |
| 6:00 AM to 6:29 AM | 98 (22.1%) | 0 (0.0%) |
| 6:30 AM to 6:59 AM | 26 (5.9%) | 15 (4.8%) |
| 7:00 AM to 7:29 AM | 88 (19.8%) | 24 (7.7%) |
| 7:30 AM to 7:59 AM | 38 (8.6%) | 20 (6.4%) |
| 8:00 AM to 8:29 AM | 13 (2.9%) | 72 (23.1%) |
| 8:30 AM to 8:59 AM | 0 (0.0%) | 37 (11.9%) |
| 9:00 AM to 9:59 AM | 48 (10.8%) | 38 (12.2%) |
| 10:00 AM to 10:59 AM | 15 (3.4%) | 4 (1.3%) |
| 11:00 AM to 11:59 AM | 0 (0.0%) | 13 (4.2%) |
| 12:00 PM to 3:59 PM | 30 (6.8%) | 8 (2.6%) |
| 4:00 PM to 11:59 PM | 15 (3.4%) | 42 (13.5%) |
| Total | 444 (100.0%) | 312 (100.0%) |
Housing Occupancy in Fife Heights
Occupancy by Ownership in Fife Heights
Of the total 546 dwellings in Fife Heights, owner-occupied units account for 474 (86.8%), while renter-occupied units make up 72 (13.2%).
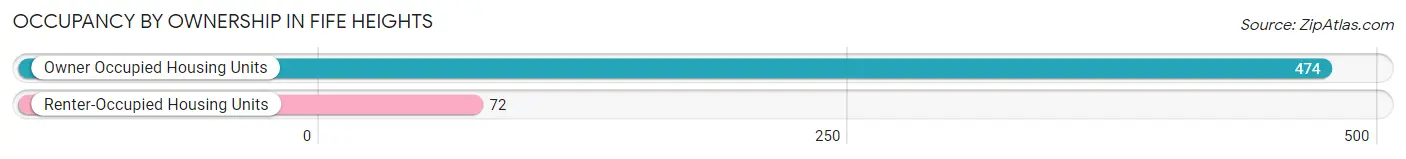
| Occupancy | # Housing Units | % Housing Units |
| Owner Occupied Housing Units | 474 | 86.8% |
| Renter-Occupied Housing Units | 72 | 13.2% |
| Total Occupied Housing Units | 546 | 100.0% |
Occupancy by Household Size in Fife Heights
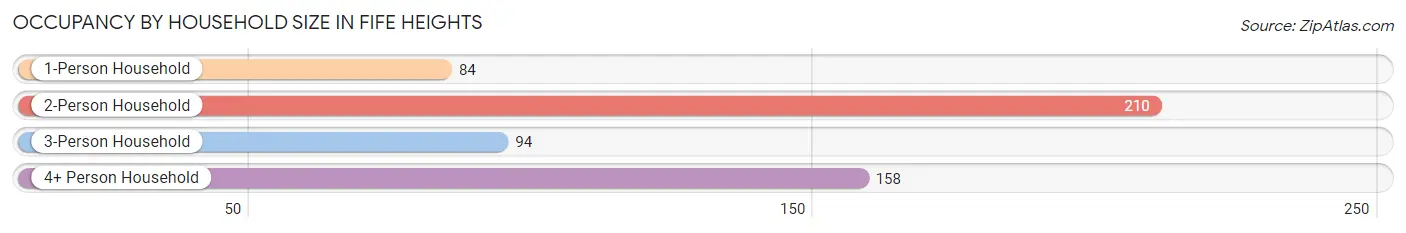
| Household Size | # Housing Units | % Housing Units |
| 1-Person Household | 84 | 15.4% |
| 2-Person Household | 210 | 38.5% |
| 3-Person Household | 94 | 17.2% |
| 4+ Person Household | 158 | 28.9% |
| Total Housing Units | 546 | 100.0% |
Occupancy by Ownership by Household Size in Fife Heights
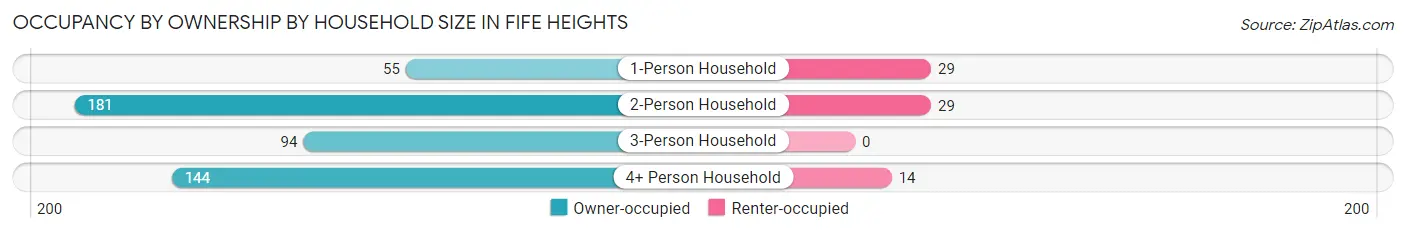
| Household Size | Owner-occupied | Renter-occupied |
| 1-Person Household | 55 (65.5%) | 29 (34.5%) |
| 2-Person Household | 181 (86.2%) | 29 (13.8%) |
| 3-Person Household | 94 (100.0%) | 0 (0.0%) |
| 4+ Person Household | 144 (91.1%) | 14 (8.9%) |
| Total Housing Units | 474 (86.8%) | 72 (13.2%) |
Occupancy by Educational Attainment in Fife Heights
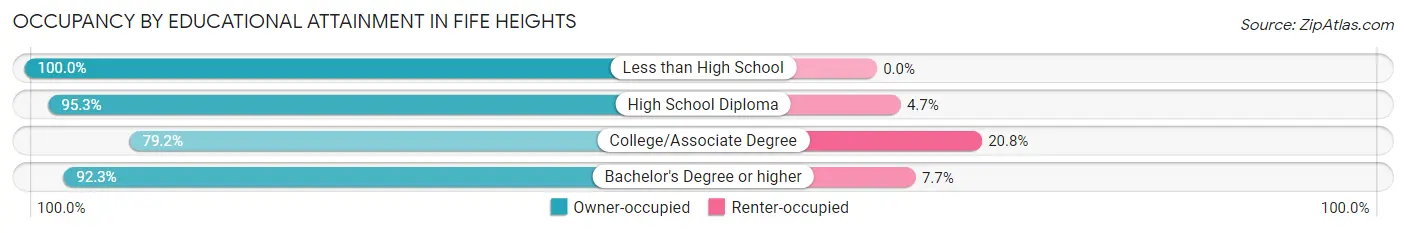
| Household Size | Owner-occupied | Renter-occupied |
| Less than High School | 28 (100.0%) | 0 (0.0%) |
| High School Diploma | 101 (95.3%) | 5 (4.7%) |
| College/Associate Degree | 213 (79.2%) | 56 (20.8%) |
| Bachelor's Degree or higher | 132 (92.3%) | 11 (7.7%) |
Occupancy by Age of Householder in Fife Heights
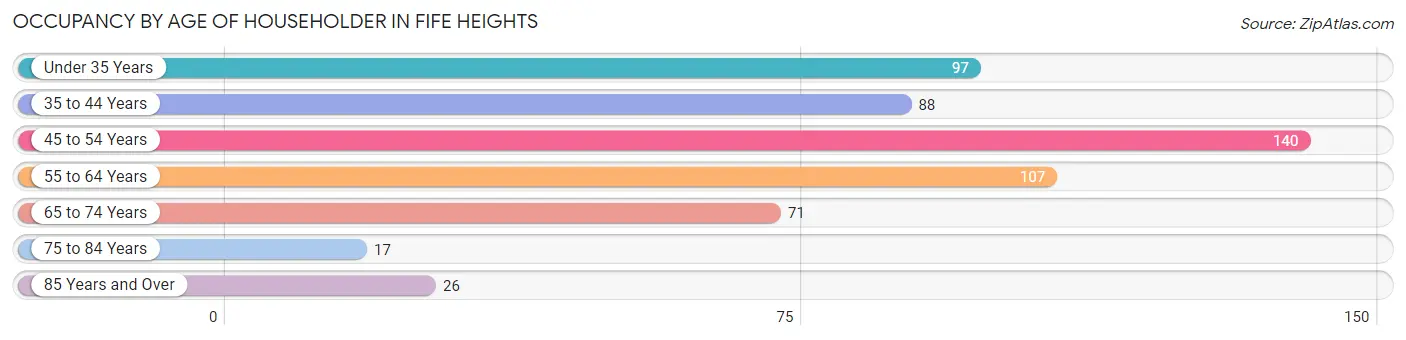
| Age Bracket | # Households | % Households |
| Under 35 Years | 97 | 17.8% |
| 35 to 44 Years | 88 | 16.1% |
| 45 to 54 Years | 140 | 25.6% |
| 55 to 64 Years | 107 | 19.6% |
| 65 to 74 Years | 71 | 13.0% |
| 75 to 84 Years | 17 | 3.1% |
| 85 Years and Over | 26 | 4.8% |
| Total | 546 | 100.0% |
Housing Finances in Fife Heights
Median Income by Occupancy in Fife Heights
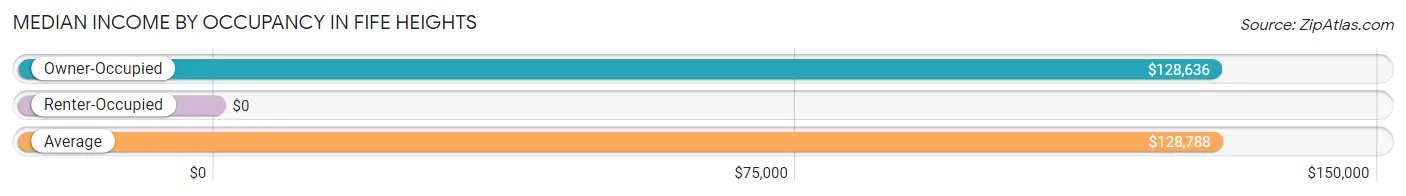
| Occupancy Type | # Households | Median Income |
| Owner-Occupied | 474 (86.8%) | $128,636 |
| Renter-Occupied | 72 (13.2%) | $0 |
| Average | 546 (100.0%) | $128,788 |
Occupancy by Householder Income Bracket in Fife Heights
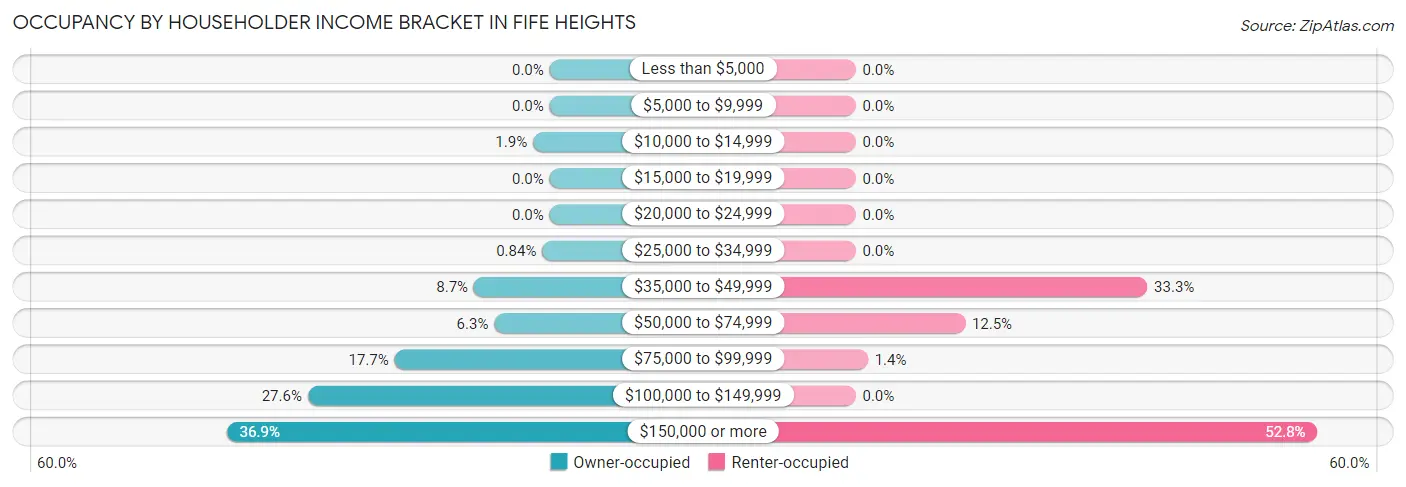
| Income Bracket | Owner-occupied | Renter-occupied |
| Less than $5,000 | 0 (0.0%) | 0 (0.0%) |
| $5,000 to $9,999 | 0 (0.0%) | 0 (0.0%) |
| $10,000 to $14,999 | 9 (1.9%) | 0 (0.0%) |
| $15,000 to $19,999 | 0 (0.0%) | 0 (0.0%) |
| $20,000 to $24,999 | 0 (0.0%) | 0 (0.0%) |
| $25,000 to $34,999 | 4 (0.8%) | 0 (0.0%) |
| $35,000 to $49,999 | 41 (8.6%) | 24 (33.3%) |
| $50,000 to $74,999 | 30 (6.3%) | 9 (12.5%) |
| $75,000 to $99,999 | 84 (17.7%) | 1 (1.4%) |
| $100,000 to $149,999 | 131 (27.6%) | 0 (0.0%) |
| $150,000 or more | 175 (36.9%) | 38 (52.8%) |
| Total | 474 (100.0%) | 72 (100.0%) |
Monthly Housing Cost Tiers in Fife Heights
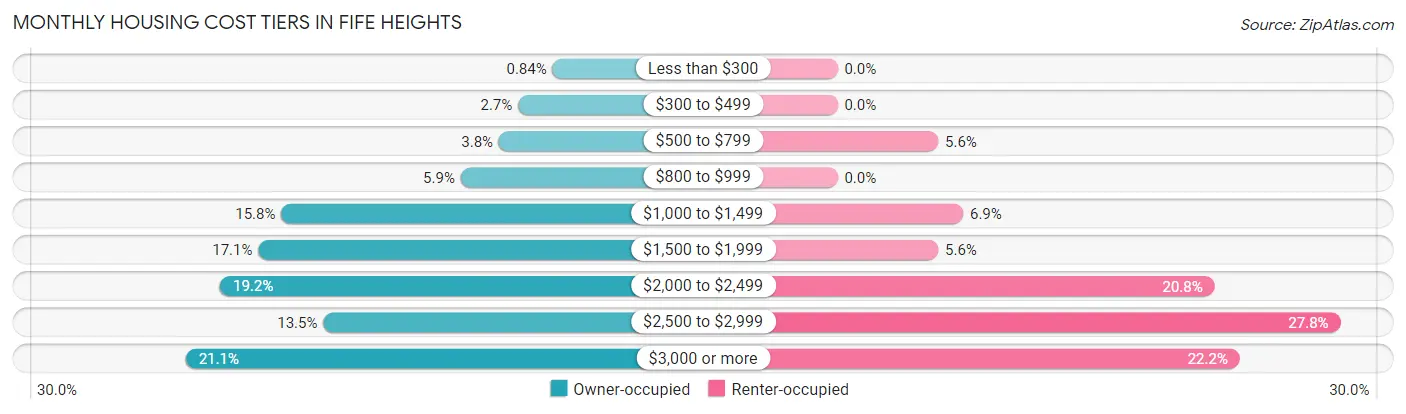
| Monthly Cost | Owner-occupied | Renter-occupied |
| Less than $300 | 4 (0.8%) | 0 (0.0%) |
| $300 to $499 | 13 (2.7%) | 0 (0.0%) |
| $500 to $799 | 18 (3.8%) | 4 (5.6%) |
| $800 to $999 | 28 (5.9%) | 0 (0.0%) |
| $1,000 to $1,499 | 75 (15.8%) | 5 (6.9%) |
| $1,500 to $1,999 | 81 (17.1%) | 4 (5.6%) |
| $2,000 to $2,499 | 91 (19.2%) | 15 (20.8%) |
| $2,500 to $2,999 | 64 (13.5%) | 20 (27.8%) |
| $3,000 or more | 100 (21.1%) | 16 (22.2%) |
| Total | 474 (100.0%) | 72 (100.0%) |
Physical Housing Characteristics in Fife Heights
Housing Structures in Fife Heights
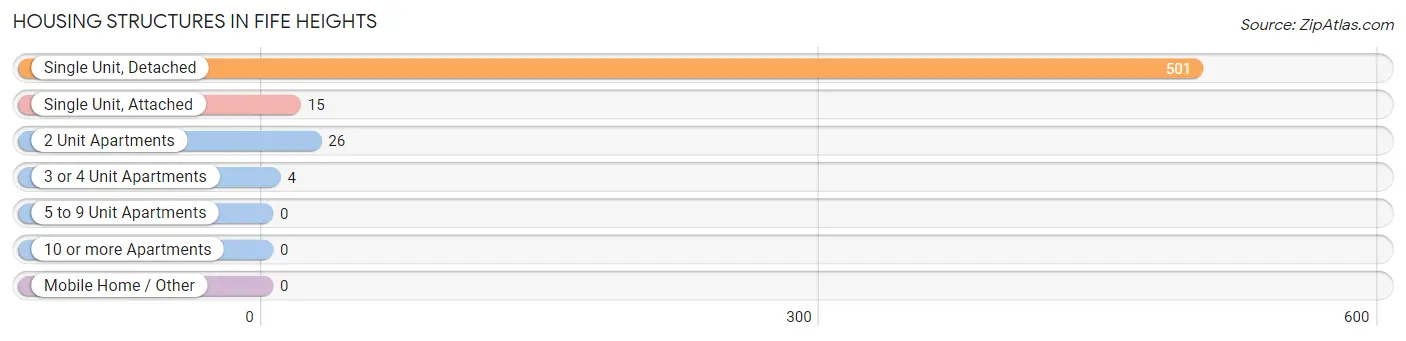
| Structure Type | # Housing Units | % Housing Units |
| Single Unit, Detached | 501 | 91.8% |
| Single Unit, Attached | 15 | 2.8% |
| 2 Unit Apartments | 26 | 4.8% |
| 3 or 4 Unit Apartments | 4 | 0.7% |
| 5 to 9 Unit Apartments | 0 | 0.0% |
| 10 or more Apartments | 0 | 0.0% |
| Mobile Home / Other | 0 | 0.0% |
| Total | 546 | 100.0% |
Housing Structures by Occupancy in Fife Heights
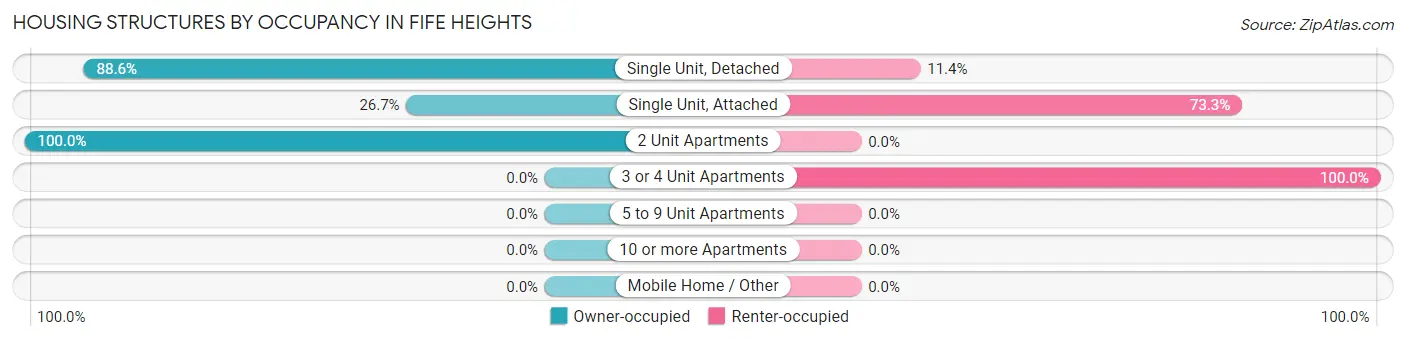
| Structure Type | Owner-occupied | Renter-occupied |
| Single Unit, Detached | 444 (88.6%) | 57 (11.4%) |
| Single Unit, Attached | 4 (26.7%) | 11 (73.3%) |
| 2 Unit Apartments | 26 (100.0%) | 0 (0.0%) |
| 3 or 4 Unit Apartments | 0 (0.0%) | 4 (100.0%) |
| 5 to 9 Unit Apartments | 0 (0.0%) | 0 (0.0%) |
| 10 or more Apartments | 0 (0.0%) | 0 (0.0%) |
| Mobile Home / Other | 0 (0.0%) | 0 (0.0%) |
| Total | 474 (86.8%) | 72 (13.2%) |
Housing Structures by Number of Rooms in Fife Heights
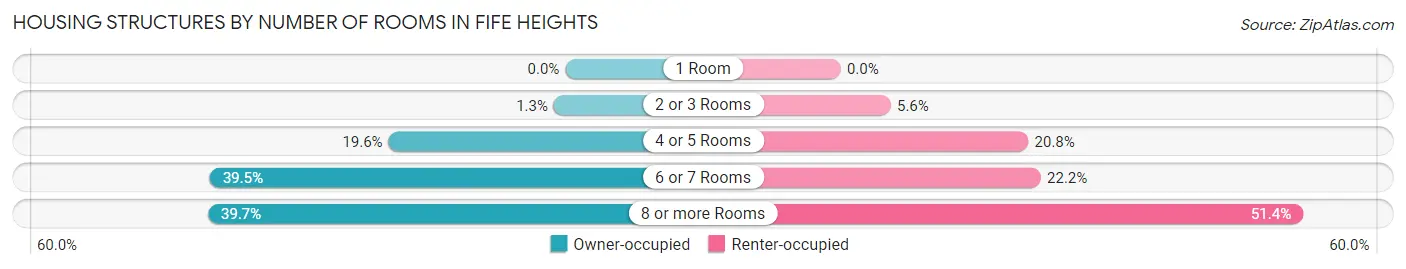
| Number of Rooms | Owner-occupied | Renter-occupied |
| 1 Room | 0 (0.0%) | 0 (0.0%) |
| 2 or 3 Rooms | 6 (1.3%) | 4 (5.6%) |
| 4 or 5 Rooms | 93 (19.6%) | 15 (20.8%) |
| 6 or 7 Rooms | 187 (39.5%) | 16 (22.2%) |
| 8 or more Rooms | 188 (39.7%) | 37 (51.4%) |
| Total | 474 (100.0%) | 72 (100.0%) |
Housing Structure by Heating Type in Fife Heights
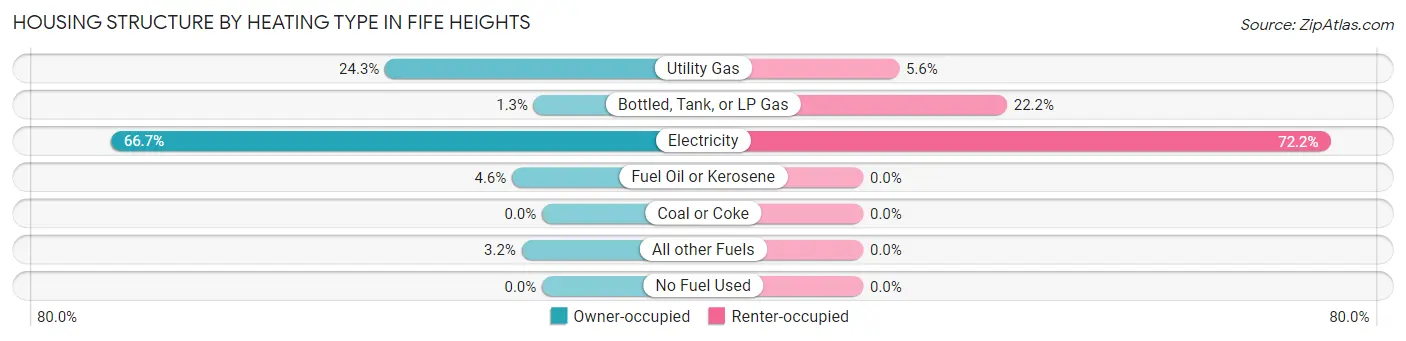
| Heating Type | Owner-occupied | Renter-occupied |
| Utility Gas | 115 (24.3%) | 4 (5.6%) |
| Bottled, Tank, or LP Gas | 6 (1.3%) | 16 (22.2%) |
| Electricity | 316 (66.7%) | 52 (72.2%) |
| Fuel Oil or Kerosene | 22 (4.6%) | 0 (0.0%) |
| Coal or Coke | 0 (0.0%) | 0 (0.0%) |
| All other Fuels | 15 (3.2%) | 0 (0.0%) |
| No Fuel Used | 0 (0.0%) | 0 (0.0%) |
| Total | 474 (100.0%) | 72 (100.0%) |
Household Vehicle Usage in Fife Heights
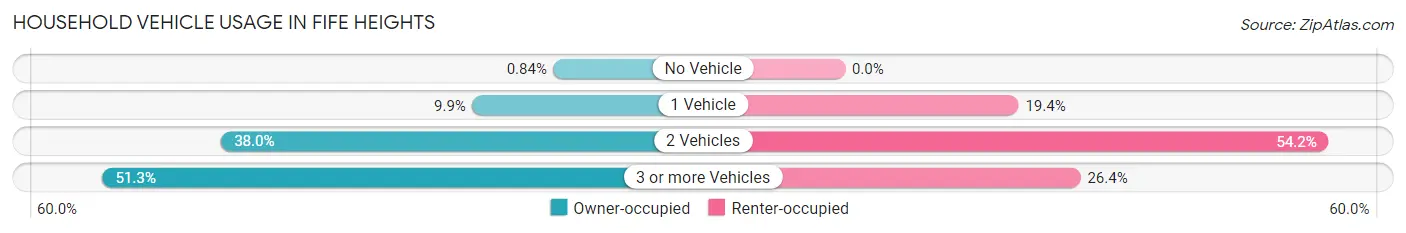
| Vehicles per Household | Owner-occupied | Renter-occupied |
| No Vehicle | 4 (0.8%) | 0 (0.0%) |
| 1 Vehicle | 47 (9.9%) | 14 (19.4%) |
| 2 Vehicles | 180 (38.0%) | 39 (54.2%) |
| 3 or more Vehicles | 243 (51.3%) | 19 (26.4%) |
| Total | 474 (100.0%) | 72 (100.0%) |
Real Estate & Mortgages in Fife Heights
Real Estate and Mortgage Overview in Fife Heights
| Characteristic | Without Mortgage | With Mortgage |
| Housing Units | 125 | 349 |
| Median Property Value | $585,400 | $536,100 |
| Median Household Income | $92,375 | $154 |
| Monthly Housing Costs | $1,108 | $100 |
| Real Estate Taxes | $6,291 | $4 |
Property Value by Mortgage Status in Fife Heights
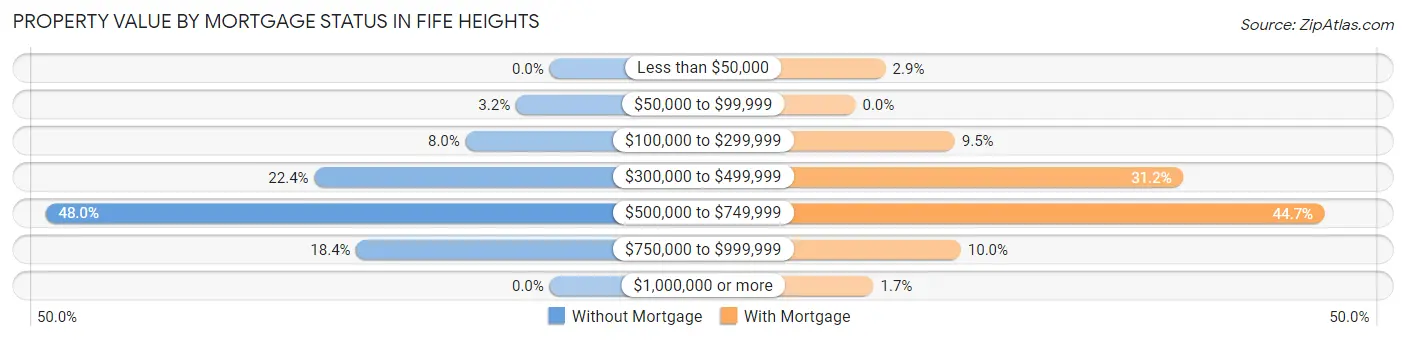
| Property Value | Without Mortgage | With Mortgage |
| Less than $50,000 | 0 (0.0%) | 10 (2.9%) |
| $50,000 to $99,999 | 4 (3.2%) | 0 (0.0%) |
| $100,000 to $299,999 | 10 (8.0%) | 33 (9.5%) |
| $300,000 to $499,999 | 28 (22.4%) | 109 (31.2%) |
| $500,000 to $749,999 | 60 (48.0%) | 156 (44.7%) |
| $750,000 to $999,999 | 23 (18.4%) | 35 (10.0%) |
| $1,000,000 or more | 0 (0.0%) | 6 (1.7%) |
| Total | 125 (100.0%) | 349 (100.0%) |
Household Income by Mortgage Status in Fife Heights
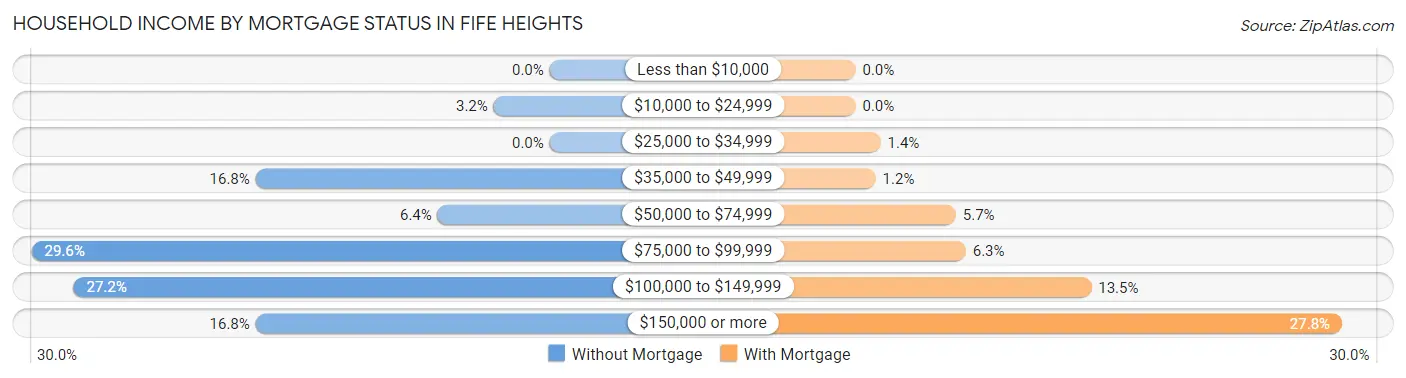
| Household Income | Without Mortgage | With Mortgage |
| Less than $10,000 | 0 (0.0%) | 0 (0.0%) |
| $10,000 to $24,999 | 4 (3.2%) | 0 (0.0%) |
| $25,000 to $34,999 | 0 (0.0%) | 5 (1.4%) |
| $35,000 to $49,999 | 21 (16.8%) | 4 (1.1%) |
| $50,000 to $74,999 | 8 (6.4%) | 20 (5.7%) |
| $75,000 to $99,999 | 37 (29.6%) | 22 (6.3%) |
| $100,000 to $149,999 | 34 (27.2%) | 47 (13.5%) |
| $150,000 or more | 21 (16.8%) | 97 (27.8%) |
| Total | 125 (100.0%) | 349 (100.0%) |
Property Value to Household Income Ratio in Fife Heights
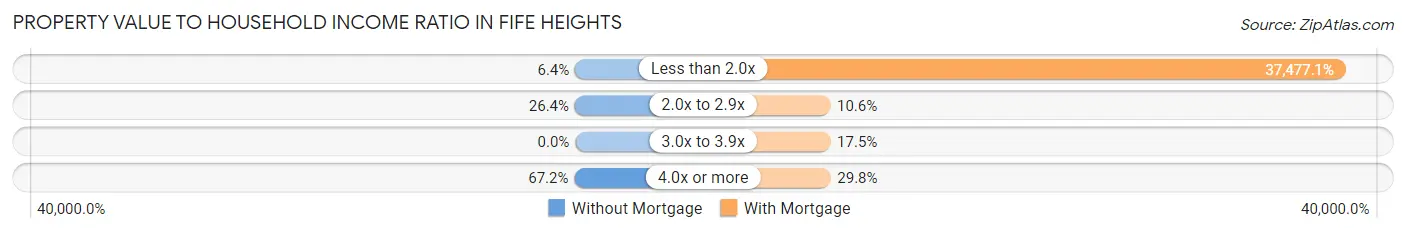
| Value-to-Income Ratio | Without Mortgage | With Mortgage |
| Less than 2.0x | 8 (6.4%) | 130,795 (37,477.1%) |
| 2.0x to 2.9x | 33 (26.4%) | 37 (10.6%) |
| 3.0x to 3.9x | 0 (0.0%) | 61 (17.5%) |
| 4.0x or more | 84 (67.2%) | 104 (29.8%) |
| Total | 125 (100.0%) | 349 (100.0%) |
Real Estate Taxes by Mortgage Status in Fife Heights
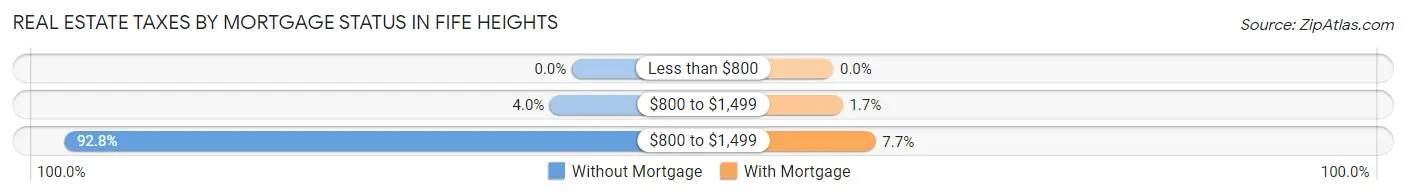
| Property Taxes | Without Mortgage | With Mortgage |
| Less than $800 | 0 (0.0%) | 0 (0.0%) |
| $800 to $1,499 | 5 (4.0%) | 6 (1.7%) |
| $800 to $1,499 | 116 (92.8%) | 27 (7.7%) |
| Total | 125 (100.0%) | 349 (100.0%) |
Health & Disability in Fife Heights
Health Insurance Coverage by Age in Fife Heights
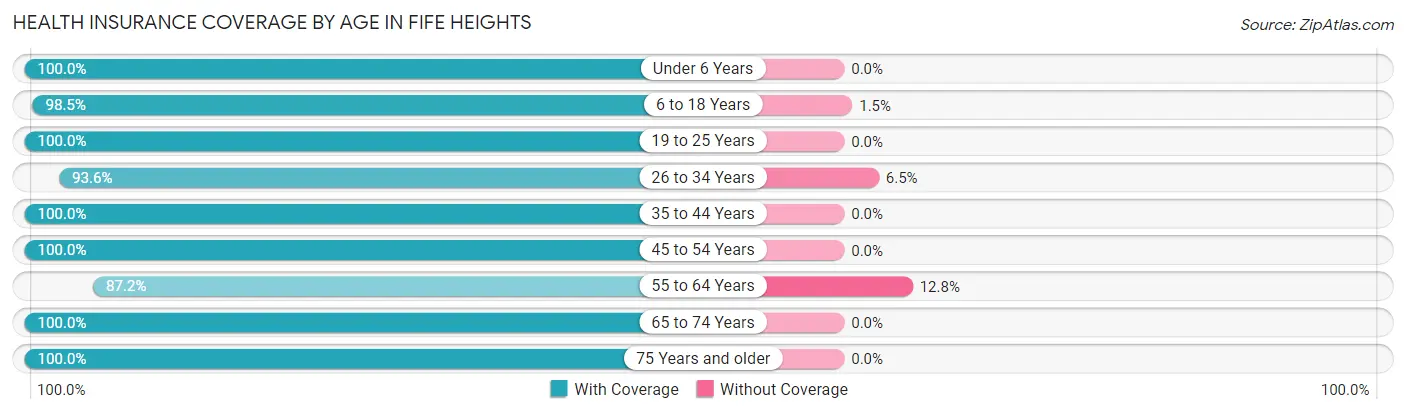
| Age Bracket | With Coverage | Without Coverage |
| Under 6 Years | 63 (100.0%) | 0 (0.0%) |
| 6 to 18 Years | 331 (98.5%) | 5 (1.5%) |
| 19 to 25 Years | 181 (100.0%) | 0 (0.0%) |
| 26 to 34 Years | 174 (93.5%) | 12 (6.5%) |
| 35 to 44 Years | 173 (100.0%) | 0 (0.0%) |
| 45 to 54 Years | 274 (100.0%) | 0 (0.0%) |
| 55 to 64 Years | 171 (87.2%) | 25 (12.8%) |
| 65 to 74 Years | 95 (100.0%) | 0 (0.0%) |
| 75 Years and older | 69 (100.0%) | 0 (0.0%) |
| Total | 1,531 (97.3%) | 42 (2.7%) |
Health Insurance Coverage by Citizenship Status in Fife Heights
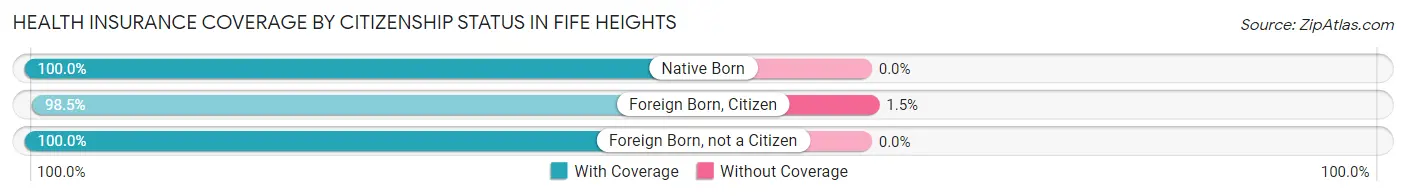
| Citizenship Status | With Coverage | Without Coverage |
| Native Born | 63 (100.0%) | 0 (0.0%) |
| Foreign Born, Citizen | 331 (98.5%) | 5 (1.5%) |
| Foreign Born, not a Citizen | 181 (100.0%) | 0 (0.0%) |
Health Insurance Coverage by Household Income in Fife Heights
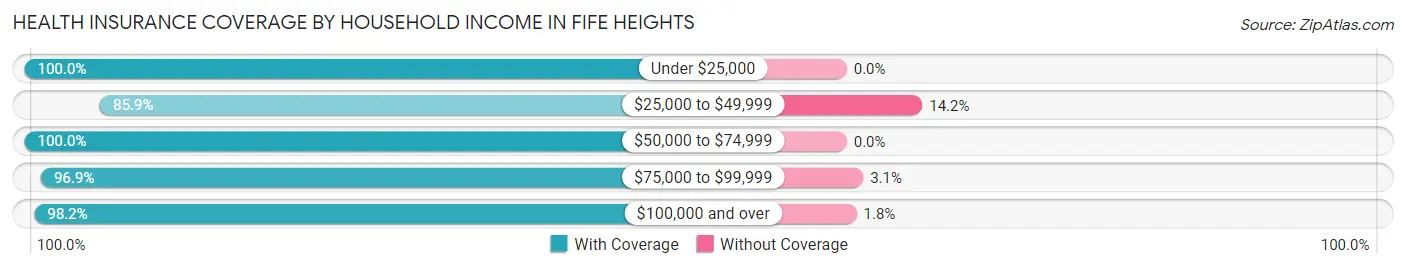
| Household Income | With Coverage | Without Coverage |
| Under $25,000 | 9 (100.0%) | 0 (0.0%) |
| $25,000 to $49,999 | 91 (85.9%) | 15 (14.1%) |
| $50,000 to $74,999 | 122 (100.0%) | 0 (0.0%) |
| $75,000 to $99,999 | 189 (96.9%) | 6 (3.1%) |
| $100,000 and over | 1,120 (98.2%) | 21 (1.8%) |
Public vs Private Health Insurance Coverage by Age in Fife Heights
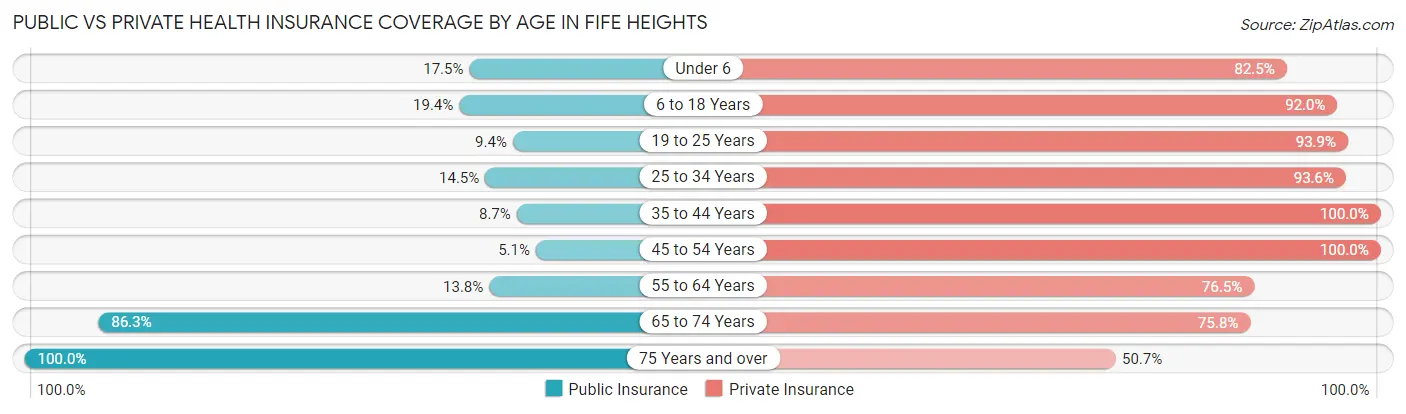
| Age Bracket | Public Insurance | Private Insurance |
| Under 6 | 11 (17.5%) | 52 (82.5%) |
| 6 to 18 Years | 65 (19.4%) | 309 (92.0%) |
| 19 to 25 Years | 17 (9.4%) | 170 (93.9%) |
| 25 to 34 Years | 27 (14.5%) | 174 (93.5%) |
| 35 to 44 Years | 15 (8.7%) | 173 (100.0%) |
| 45 to 54 Years | 14 (5.1%) | 274 (100.0%) |
| 55 to 64 Years | 27 (13.8%) | 150 (76.5%) |
| 65 to 74 Years | 82 (86.3%) | 72 (75.8%) |
| 75 Years and over | 69 (100.0%) | 35 (50.7%) |
| Total | 327 (20.8%) | 1,409 (89.6%) |
Disability Status by Sex by Age in Fife Heights
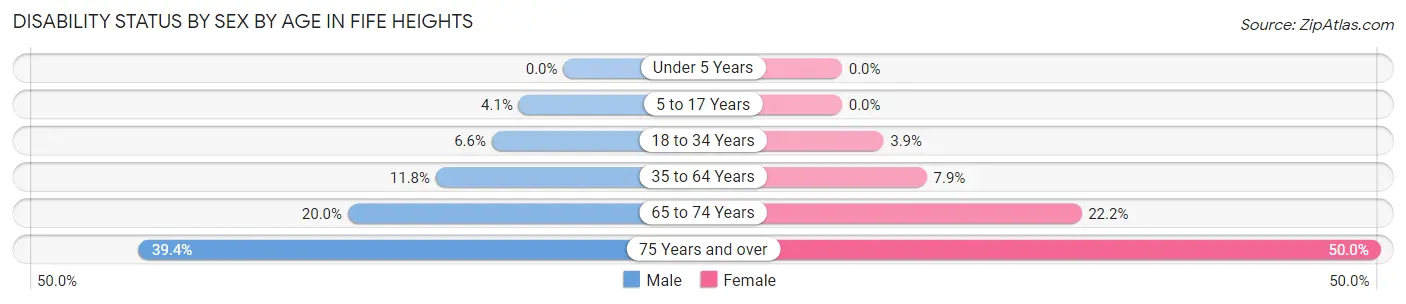
| Age Bracket | Male | Female |
| Under 5 Years | 0 (0.0%) | 0 (0.0%) |
| 5 to 17 Years | 7 (4.1%) | 0 (0.0%) |
| 18 to 34 Years | 14 (6.6%) | 6 (3.8%) |
| 35 to 64 Years | 40 (11.8%) | 24 (7.9%) |
| 65 to 74 Years | 10 (20.0%) | 10 (22.2%) |
| 75 Years and over | 13 (39.4%) | 18 (50.0%) |
Disability Class by Sex by Age in Fife Heights
Disability Class: Hearing Difficulty
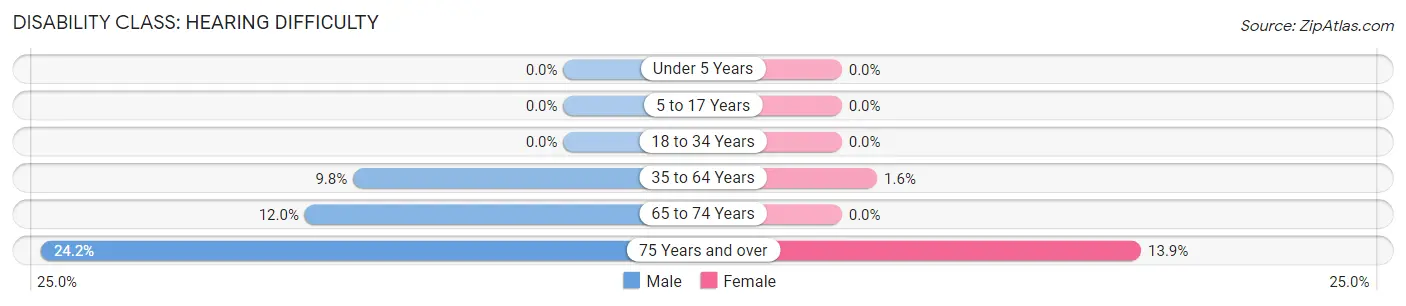
| Age Bracket | Male | Female |
| Under 5 Years | 0 (0.0%) | 0 (0.0%) |
| 5 to 17 Years | 0 (0.0%) | 0 (0.0%) |
| 18 to 34 Years | 0 (0.0%) | 0 (0.0%) |
| 35 to 64 Years | 33 (9.8%) | 5 (1.6%) |
| 65 to 74 Years | 6 (12.0%) | 0 (0.0%) |
| 75 Years and over | 8 (24.2%) | 5 (13.9%) |
Disability Class: Vision Difficulty
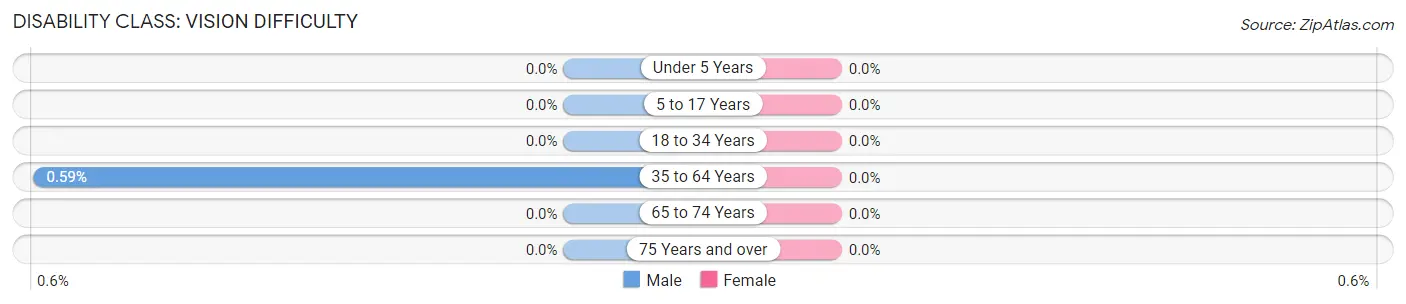
| Age Bracket | Male | Female |
| Under 5 Years | 0 (0.0%) | 0 (0.0%) |
| 5 to 17 Years | 0 (0.0%) | 0 (0.0%) |
| 18 to 34 Years | 0 (0.0%) | 0 (0.0%) |
| 35 to 64 Years | 2 (0.6%) | 0 (0.0%) |
| 65 to 74 Years | 0 (0.0%) | 0 (0.0%) |
| 75 Years and over | 0 (0.0%) | 0 (0.0%) |
Disability Class: Cognitive Difficulty
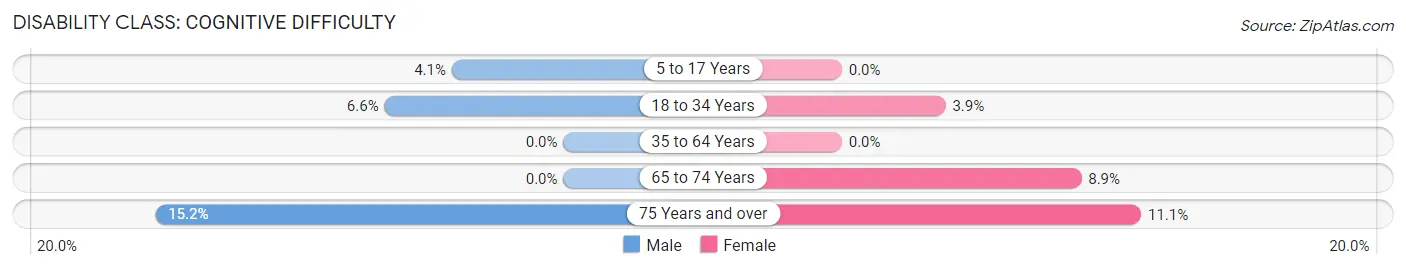
| Age Bracket | Male | Female |
| 5 to 17 Years | 7 (4.1%) | 0 (0.0%) |
| 18 to 34 Years | 14 (6.6%) | 6 (3.8%) |
| 35 to 64 Years | 0 (0.0%) | 0 (0.0%) |
| 65 to 74 Years | 0 (0.0%) | 4 (8.9%) |
| 75 Years and over | 5 (15.1%) | 4 (11.1%) |
Disability Class: Ambulatory Difficulty
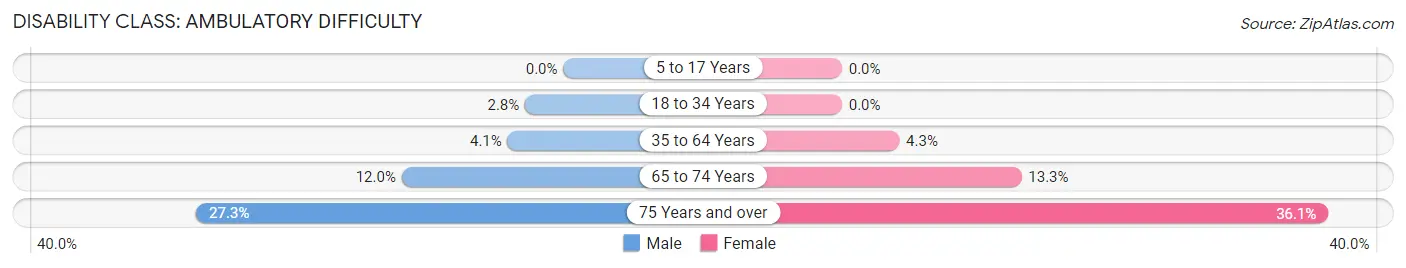
| Age Bracket | Male | Female |
| 5 to 17 Years | 0 (0.0%) | 0 (0.0%) |
| 18 to 34 Years | 6 (2.8%) | 0 (0.0%) |
| 35 to 64 Years | 14 (4.1%) | 13 (4.3%) |
| 65 to 74 Years | 6 (12.0%) | 6 (13.3%) |
| 75 Years and over | 9 (27.3%) | 13 (36.1%) |
Disability Class: Self-Care Difficulty
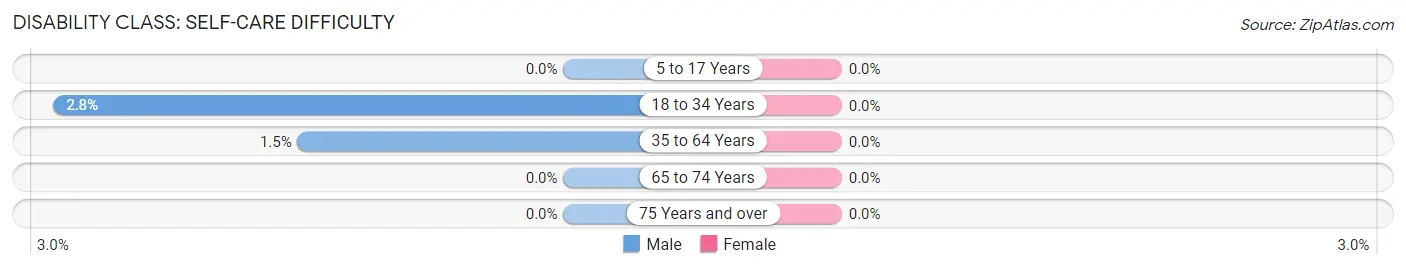
| Age Bracket | Male | Female |
| 5 to 17 Years | 0 (0.0%) | 0 (0.0%) |
| 18 to 34 Years | 6 (2.8%) | 0 (0.0%) |
| 35 to 64 Years | 5 (1.5%) | 0 (0.0%) |
| 65 to 74 Years | 0 (0.0%) | 0 (0.0%) |
| 75 Years and over | 0 (0.0%) | 0 (0.0%) |
Technology Access in Fife Heights
Computing Device Access in Fife Heights
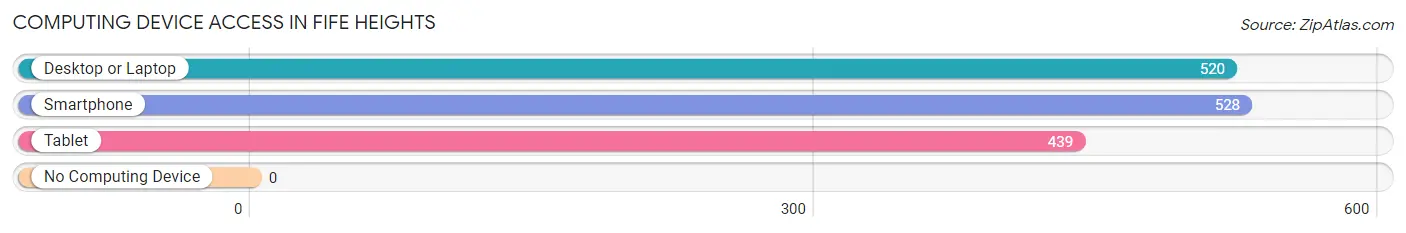
| Device Type | # Households | % Households |
| Desktop or Laptop | 520 | 95.2% |
| Smartphone | 528 | 96.7% |
| Tablet | 439 | 80.4% |
| No Computing Device | 0 | 0.0% |
| Total | 546 | 100.0% |
Internet Access in Fife Heights
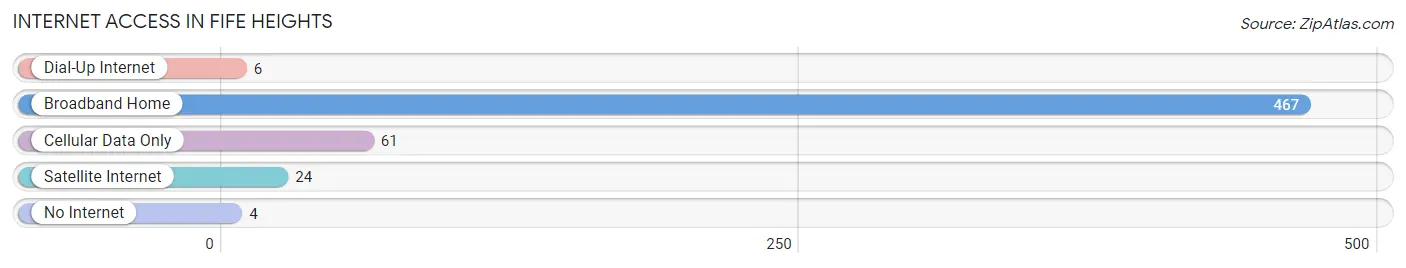
| Internet Type | # Households | % Households |
| Dial-Up Internet | 6 | 1.1% |
| Broadband Home | 467 | 85.5% |
| Cellular Data Only | 61 | 11.2% |
| Satellite Internet | 24 | 4.4% |
| No Internet | 4 | 0.7% |
| Total | 546 | 100.0% |
Fife Heights Summary
Fife Heights is a small city located in Pierce County, Washington, United States. It is situated on the east side of the Puget Sound, just south of Tacoma. The city is bordered by the cities of Tacoma, Milton, and Edgewood. The population of Fife Heights was 8,845 at the 2010 census.
Geography
Fife Heights is located at 47°14′N 122°20′W (47.23, -122.33). According to the United States Census Bureau, the city has a total area of 4.2 square miles (10.8 km2), all of it land.
The city is located on a hill, with the highest point being at an elevation of 545 feet (166 m). The city is surrounded by the cities of Tacoma, Milton, and Edgewood. The city is located near the Port of Tacoma, which is the largest port in the Pacific Northwest.
Climate
Fife Heights has a temperate climate, with mild winters and warm summers. The average annual temperature is 52.3°F (11.3°C). The average annual precipitation is 37.2 inches (94.2 cm).
Demographics
As of the 2010 census, there were 8,845 people, 3,541 households, and 2,521 families residing in the city. The population density was 2,097.3 people per square mile (808.7/km2). There were 3,845 housing units at an average density of 917.2 per square mile (353.7/km2). The racial makeup of the city was 79.2% White, 8.2% African American, 0.7% Native American, 4.2% Asian, 0.2% Pacific Islander, 3.7% from other races, and 3.8% from two or more races. Hispanic or Latino of any race were 8.3% of the population.
Economy
Fife Heights is home to a variety of businesses, including retail stores, restaurants, and professional services. The city is also home to several industrial parks, which provide employment opportunities for local residents. The city is also home to the Port of Tacoma, which is the largest port in the Pacific Northwest.
The median household income in Fife Heights was $50,945 in 2017. The median home value was $269,400 in 2017. The unemployment rate in Fife Heights was 4.2% in 2017.
Education
Fife Heights is served by the Fife School District. The district operates four elementary schools, one middle school, and one high school. The district also operates a number of alternative education programs.
The city is also home to several private schools, including St. Mary's Catholic School and Fife Christian Academy.
Conclusion
Fife Heights is a small city located in Pierce County, Washington, United States. It is situated on the east side of the Puget Sound, just south of Tacoma. The city is bordered by the cities of Tacoma, Milton, and Edgewood. The population of Fife Heights was 8,845 at the 2010 census. The city has a temperate climate, with mild winters and warm summers. The median household income in Fife Heights was $50,945 in 2017. The city is served by the Fife School District, as well as several private schools. Fife Heights is home to a variety of businesses, including retail stores, restaurants, and professional services. The city is also home to several industrial parks, which provide employment opportunities for local residents.
Common Questions
What is Per Capita Income in Fife Heights?
Per Capita income in Fife Heights is $51,136.
What is the Median Family Income in Fife Heights?
Median Family Income in Fife Heights is $131,750.
What is the Median Household income in Fife Heights?
Median Household Income in Fife Heights is $128,788.
What is Income or Wage Gap in Fife Heights?
Income or Wage Gap in Fife Heights is 42.0%.
Women in Fife Heights earn 58.0 cents for every dollar earned by a man.
What is Inequality or Gini Index in Fife Heights?
Inequality or Gini Index in Fife Heights is 0.33.
What is the Total Population of Fife Heights?
Total Population of Fife Heights is 1,573.
What is the Total Male Population of Fife Heights?
Total Male Population of Fife Heights is 816.
What is the Total Female Population of Fife Heights?
Total Female Population of Fife Heights is 757.
What is the Ratio of Males per 100 Females in Fife Heights?
There are 107.79 Males per 100 Females in Fife Heights.
What is the Ratio of Females per 100 Males in Fife Heights?
There are 92.77 Females per 100 Males in Fife Heights.
What is the Median Population Age in Fife Heights?
Median Population Age in Fife Heights is 37.0 Years.
What is the Average Family Size in Fife Heights
Average Family Size in Fife Heights is 3.3 People.
What is the Average Household Size in Fife Heights
Average Household Size in Fife Heights is 2.9 People.
How Large is the Labor Force in Fife Heights?
There are 926 People in the Labor Forcein in Fife Heights.
What is the Percentage of People in the Labor Force in Fife Heights?
74.1% of People are in the Labor Force in Fife Heights.
What is the Unemployment Rate in Fife Heights?
Unemployment Rate in Fife Heights is 4.0%.