Elk Plain, WA Map & Demographics
Elk Plain Map
Elk Plain Overview
$40,416
PER CAPITA INCOME
$103,508
AVG FAMILY INCOME
$97,754
AVG HOUSEHOLD INCOME
41.8%
WAGE / INCOME GAP [ % ]
58.2¢/ $1
WAGE / INCOME GAP [ $ ]
0.38
INEQUALITY / GINI INDEX
14,224
TOTAL POPULATION
7,023
MALE POPULATION
7,201
FEMALE POPULATION
97.53
MALES / 100 FEMALES
102.53
FEMALES / 100 MALES
38.6
MEDIAN AGE
3.2
AVG FAMILY SIZE
2.9
AVG HOUSEHOLD SIZE
7,700
LABOR FORCE [ PEOPLE ]
67.3%
PERCENT IN LABOR FORCE
4.2%
UNEMPLOYMENT RATE
Income in Elk Plain
Income Overview in Elk Plain
Per Capita Income in Elk Plain is $40,416, while median incomes of families and households are $103,508 and $97,754 respectively.
| Characteristic | Number | Measure |
| Per Capita Income | 14,224 | $40,416 |
| Median Family Income | 3,643 | $103,508 |
| Mean Family Income | 3,643 | $122,856 |
| Median Household Income | 4,935 | $97,754 |
| Mean Household Income | 4,935 | $114,758 |
| Income Deficit | 3,643 | $0 |
| Wage / Income Gap (%) | 14,224 | 41.80% |
| Wage / Income Gap ($) | 14,224 | 58.20¢ per $1 |
| Gini / Inequality Index | 14,224 | 0.38 |
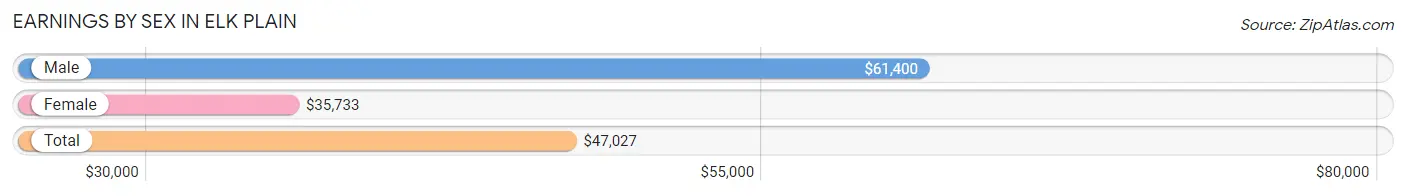
Earnings by Sex in Elk Plain
Average Earnings in Elk Plain are $47,027, $61,400 for men and $35,733 for women, a difference of 41.8%.
| Sex | Number | Average Earnings |
| Male | 4,386 (55.1%) | $61,400 |
| Female | 3,568 (44.9%) | $35,733 |
| Total | 7,954 (100.0%) | $47,027 |
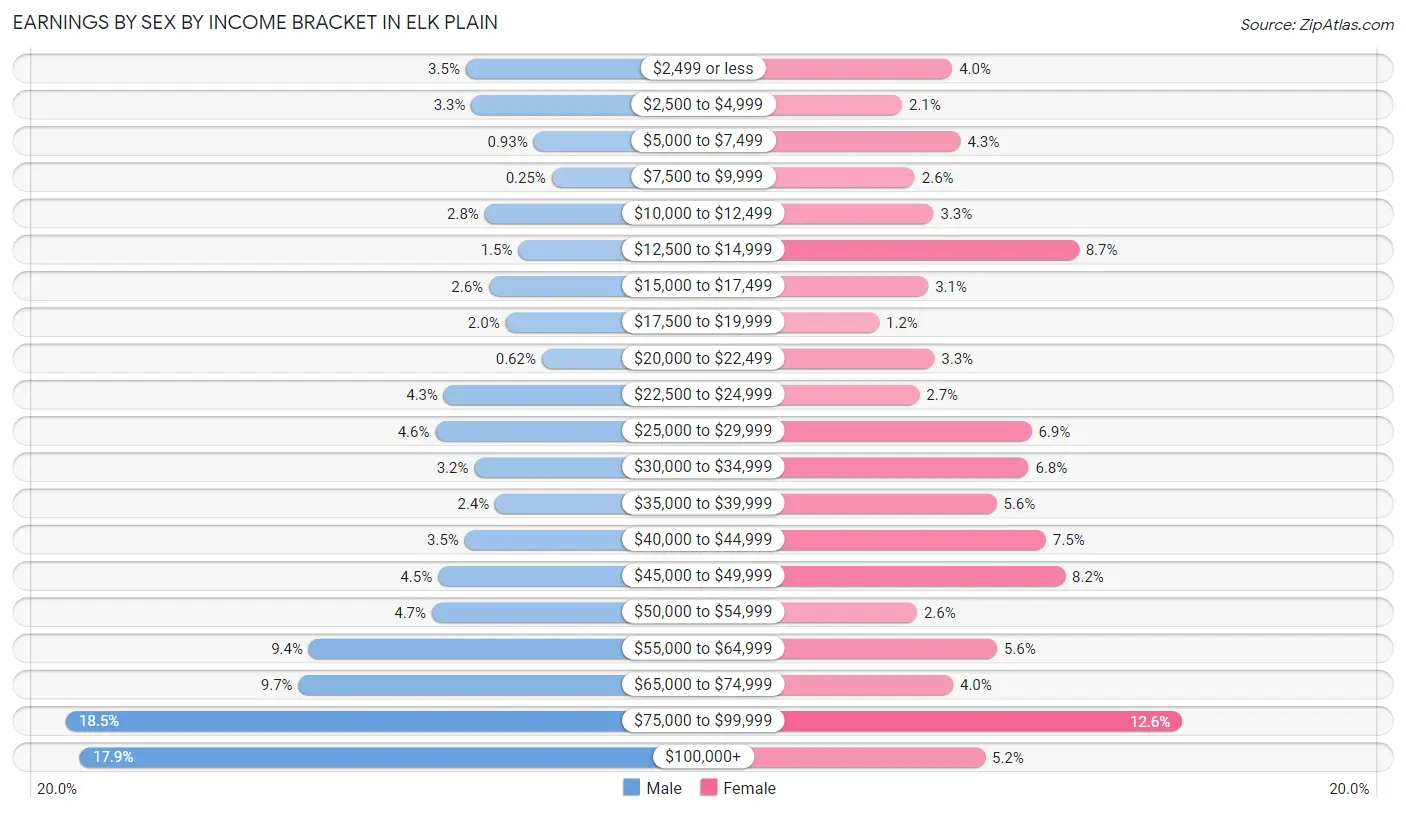
Earnings by Sex by Income Bracket in Elk Plain
The most common earnings brackets in Elk Plain are $75,000 to $99,999 for men (809 | 18.4%) and $75,000 to $99,999 for women (448 | 12.6%).
| Income | Male | Female |
| $2,499 or less | 152 (3.5%) | 141 (4.0%) |
| $2,500 to $4,999 | 143 (3.3%) | 74 (2.1%) |
| $5,000 to $7,499 | 41 (0.9%) | 152 (4.3%) |
| $7,500 to $9,999 | 11 (0.3%) | 91 (2.5%) |
| $10,000 to $12,499 | 121 (2.8%) | 116 (3.3%) |
| $12,500 to $14,999 | 66 (1.5%) | 310 (8.7%) |
| $15,000 to $17,499 | 114 (2.6%) | 109 (3.0%) |
| $17,500 to $19,999 | 87 (2.0%) | 43 (1.2%) |
| $20,000 to $22,499 | 27 (0.6%) | 117 (3.3%) |
| $22,500 to $24,999 | 188 (4.3%) | 97 (2.7%) |
| $25,000 to $29,999 | 202 (4.6%) | 247 (6.9%) |
| $30,000 to $34,999 | 138 (3.2%) | 243 (6.8%) |
| $35,000 to $39,999 | 104 (2.4%) | 200 (5.6%) |
| $40,000 to $44,999 | 154 (3.5%) | 266 (7.5%) |
| $45,000 to $49,999 | 198 (4.5%) | 292 (8.2%) |
| $50,000 to $54,999 | 208 (4.7%) | 94 (2.6%) |
| $55,000 to $64,999 | 410 (9.3%) | 201 (5.6%) |
| $65,000 to $74,999 | 427 (9.7%) | 142 (4.0%) |
| $75,000 to $99,999 | 809 (18.4%) | 448 (12.6%) |
| $100,000+ | 786 (17.9%) | 185 (5.2%) |
| Total | 4,386 (100.0%) | 3,568 (100.0%) |
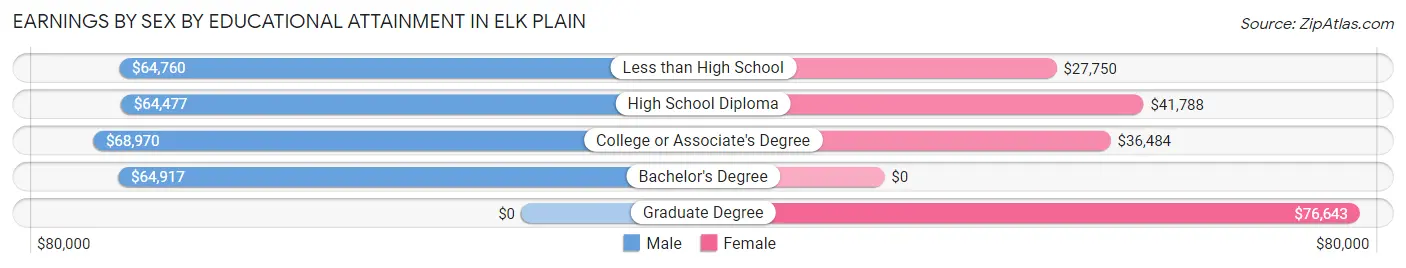
Earnings by Sex by Educational Attainment in Elk Plain
Average earnings in Elk Plain are $67,983 for men and $39,358 for women, a difference of 42.1%. Men with an educational attainment of college or associate's degree enjoy the highest average annual earnings of $68,970, while those with high school diploma education earn the least with $64,477. Women with an educational attainment of graduate degree earn the most with the average annual earnings of $76,643, while those with less than high school education have the smallest earnings of $27,750.
| Educational Attainment | Male Income | Female Income |
| Less than High School | $64,760 | $27,750 |
| High School Diploma | $64,477 | $41,788 |
| College or Associate's Degree | $68,970 | $36,484 |
| Bachelor's Degree | $64,917 | $0 |
| Graduate Degree | - | - |
| Total | $67,983 | $39,358 |
Family Income in Elk Plain
Family Income Brackets in Elk Plain
According to the Elk Plain family income data, there are 1,013 families falling into the $100,000 to $149,999 income range, which is the most common income bracket and makes up 27.8% of all families. Conversely, the $10,000 to $14,999 income bracket is the least frequent group with only 26 families (0.7%) belonging to this category.
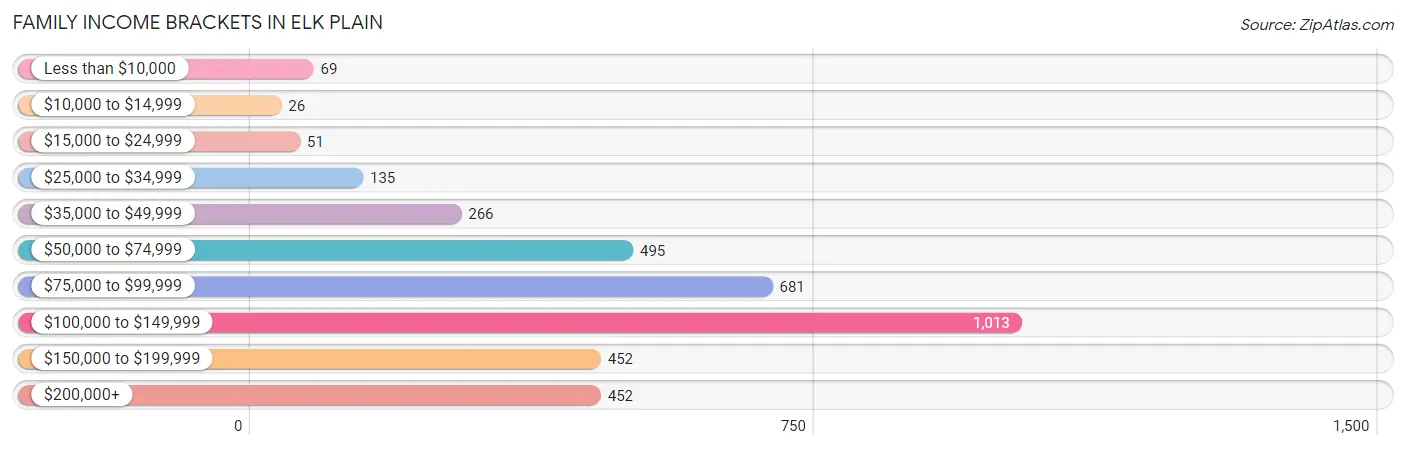
| Income Bracket | # Families | % Families |
| Less than $10,000 | 69 | 1.9% |
| $10,000 to $14,999 | 26 | 0.7% |
| $15,000 to $24,999 | 51 | 1.4% |
| $25,000 to $34,999 | 135 | 3.7% |
| $35,000 to $49,999 | 266 | 7.3% |
| $50,000 to $74,999 | 495 | 13.6% |
| $75,000 to $99,999 | 681 | 18.7% |
| $100,000 to $149,999 | 1,013 | 27.8% |
| $150,000 to $199,999 | 452 | 12.4% |
| $200,000+ | 452 | 12.4% |
Family Income by Famaliy Size in Elk Plain
3-person families (949 | 26.1%) account for the highest median family income in Elk Plain with $127,281 per family, while 2-person families (1,499 | 41.1%) have the highest median income of $46,604 per family member.
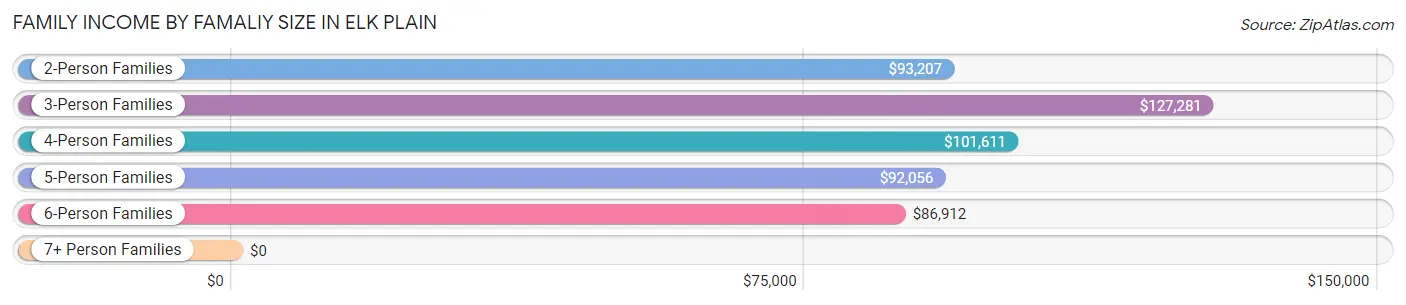
| Income Bracket | # Families | Median Income |
| 2-Person Families | 1,499 (41.1%) | $93,207 |
| 3-Person Families | 949 (26.1%) | $127,281 |
| 4-Person Families | 720 (19.8%) | $101,611 |
| 5-Person Families | 313 (8.6%) | $92,056 |
| 6-Person Families | 134 (3.7%) | $86,912 |
| 7+ Person Families | 28 (0.8%) | $0 |
| Total | 3,643 (100.0%) | $103,508 |
Family Income by Number of Earners in Elk Plain
The median family income in Elk Plain is $103,508, with families comprising 3+ earners (657) having the highest median family income of $188,713, while families with no earners (411) have the lowest median family income of $56,938, accounting for 18.0% and 11.3% of families, respectively.
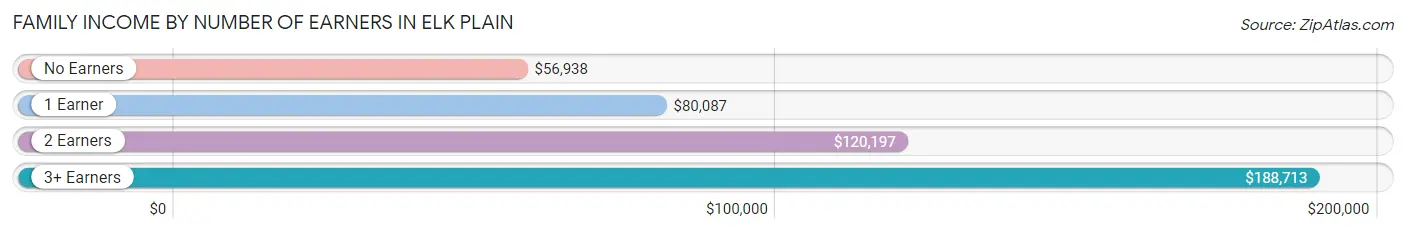
| Number of Earners | # Families | Median Income |
| No Earners | 411 (11.3%) | $56,938 |
| 1 Earner | 1,087 (29.8%) | $80,087 |
| 2 Earners | 1,488 (40.8%) | $120,197 |
| 3+ Earners | 657 (18.0%) | $188,713 |
| Total | 3,643 (100.0%) | $103,508 |
Household Income in Elk Plain
Household Income Brackets in Elk Plain
With 1,160 households falling in the category, the $100,000 to $149,999 income range is the most frequent in Elk Plain, accounting for 23.5% of all households. In contrast, only 49 households (1.0%) fall into the $10,000 to $14,999 income bracket, making it the least populous group.
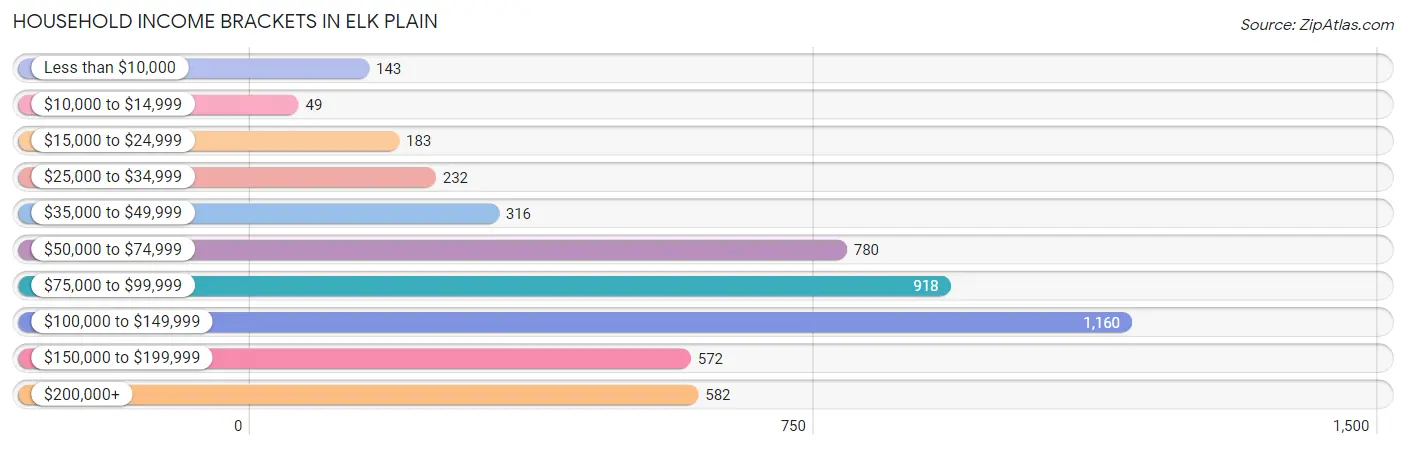
| Income Bracket | # Households | % Households |
| Less than $10,000 | 143 | 2.9% |
| $10,000 to $14,999 | 49 | 1.0% |
| $15,000 to $24,999 | 183 | 3.7% |
| $25,000 to $34,999 | 232 | 4.7% |
| $35,000 to $49,999 | 316 | 6.4% |
| $50,000 to $74,999 | 780 | 15.8% |
| $75,000 to $99,999 | 918 | 18.6% |
| $100,000 to $149,999 | 1,160 | 23.5% |
| $150,000 to $199,999 | 572 | 11.6% |
| $200,000+ | 582 | 11.8% |
Household Income by Householder Age in Elk Plain
The median household income in Elk Plain is $97,754, with the highest median household income of $113,594 found in the 45 to 64 years age bracket for the primary householder. A total of 2,263 households (45.9%) fall into this category. Meanwhile, the 65+ years age bracket for the primary householder has the lowest median household income of $62,213, with 1,045 households (21.2%) in this group.
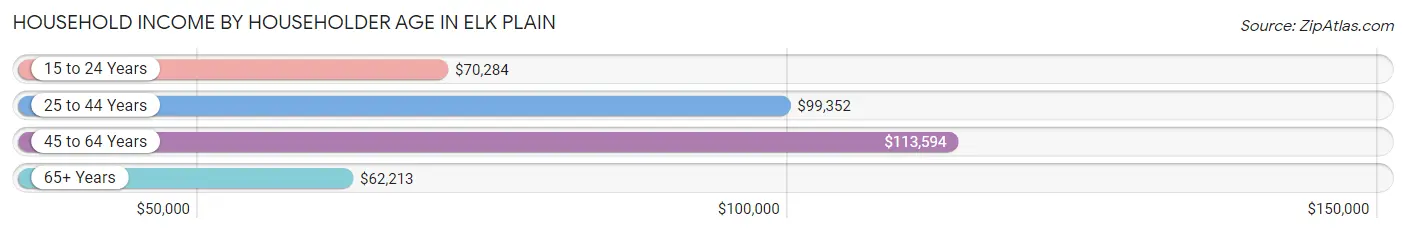
| Income Bracket | # Households | Median Income |
| 15 to 24 Years | 121 (2.5%) | $70,284 |
| 25 to 44 Years | 1,506 (30.5%) | $99,352 |
| 45 to 64 Years | 2,263 (45.9%) | $113,594 |
| 65+ Years | 1,045 (21.2%) | $62,213 |
| Total | 4,935 (100.0%) | $97,754 |
Poverty in Elk Plain
Income Below Poverty by Sex and Age in Elk Plain
With 7.1% poverty level for males and 9.9% for females among the residents of Elk Plain, 16 and 17 year old males and 16 and 17 year old females are the most vulnerable to poverty, with 45 males (28.3%) and 53 females (34.0%) in their respective age groups living below the poverty level.
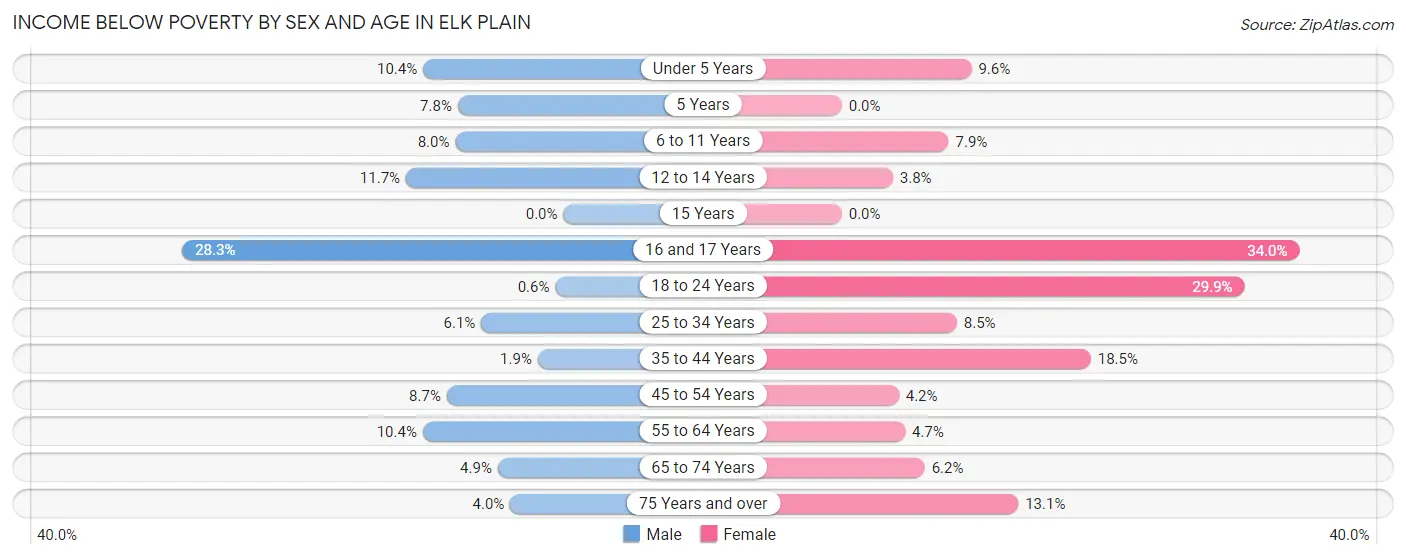
| Age Bracket | Male | Female |
| Under 5 Years | 42 (10.4%) | 29 (9.6%) |
| 5 Years | 8 (7.8%) | 0 (0.0%) |
| 6 to 11 Years | 30 (8.0%) | 49 (7.9%) |
| 12 to 14 Years | 27 (11.7%) | 18 (3.8%) |
| 15 Years | 0 (0.0%) | 0 (0.0%) |
| 16 and 17 Years | 45 (28.3%) | 53 (34.0%) |
| 18 to 24 Years | 3 (0.6%) | 133 (29.9%) |
| 25 to 34 Years | 74 (6.1%) | 102 (8.5%) |
| 35 to 44 Years | 17 (1.9%) | 145 (18.5%) |
| 45 to 54 Years | 85 (8.7%) | 35 (4.2%) |
| 55 to 64 Years | 131 (10.4%) | 52 (4.7%) |
| 65 to 74 Years | 24 (4.9%) | 42 (6.2%) |
| 75 Years and over | 14 (4.0%) | 49 (13.1%) |
| Total | 500 (7.1%) | 707 (9.9%) |
Income Above Poverty by Sex and Age in Elk Plain
According to the poverty statistics in Elk Plain, males aged 15 years and females aged 5 years are the age groups that are most secure financially, with 100.0% of males and 100.0% of females in these age groups living above the poverty line.
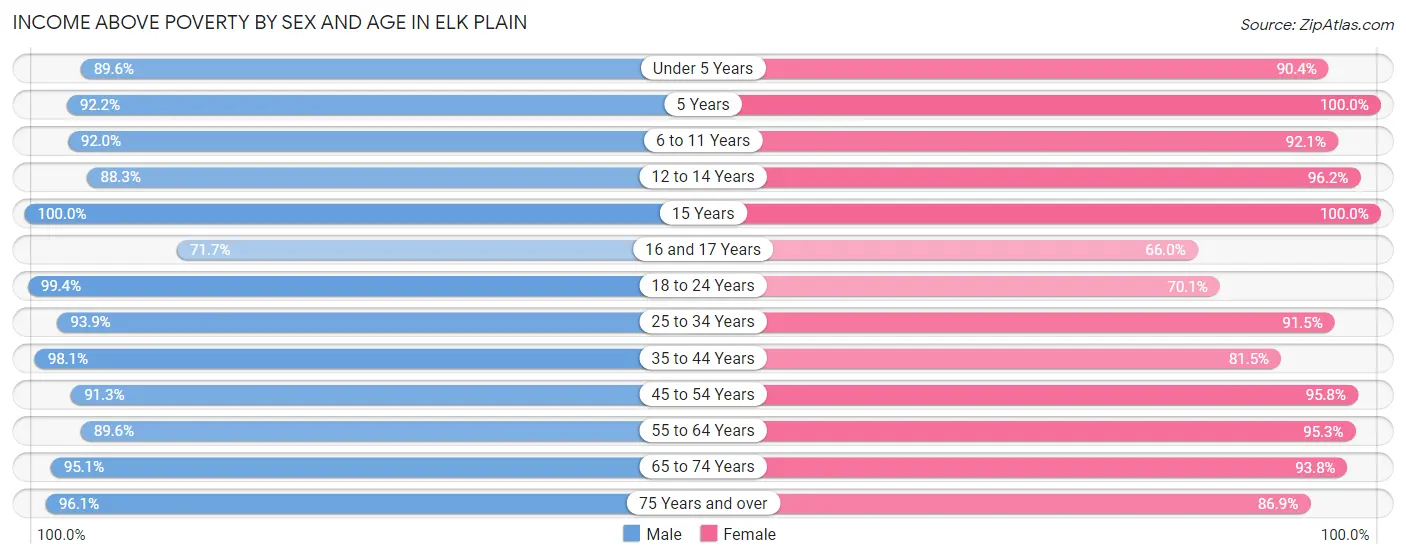
| Age Bracket | Male | Female |
| Under 5 Years | 361 (89.6%) | 272 (90.4%) |
| 5 Years | 94 (92.2%) | 49 (100.0%) |
| 6 to 11 Years | 344 (92.0%) | 569 (92.1%) |
| 12 to 14 Years | 204 (88.3%) | 457 (96.2%) |
| 15 Years | 62 (100.0%) | 167 (100.0%) |
| 16 and 17 Years | 114 (71.7%) | 103 (66.0%) |
| 18 to 24 Years | 498 (99.4%) | 312 (70.1%) |
| 25 to 34 Years | 1,139 (93.9%) | 1,092 (91.5%) |
| 35 to 44 Years | 878 (98.1%) | 639 (81.5%) |
| 45 to 54 Years | 896 (91.3%) | 792 (95.8%) |
| 55 to 64 Years | 1,124 (89.6%) | 1,056 (95.3%) |
| 65 to 74 Years | 469 (95.1%) | 640 (93.8%) |
| 75 Years and over | 340 (96.1%) | 325 (86.9%) |
| Total | 6,523 (92.9%) | 6,473 (90.1%) |
Income Below Poverty Among Married-Couple Families in Elk Plain
The poverty statistics for married-couple families in Elk Plain show that 1.8% or 54 of the total 3,039 families live below the poverty line. Families with 3 or 4 children have the highest poverty rate of 9.0%, comprising of 19 families. On the other hand, families with 5 or more children have the lowest poverty rate of 0.0%, which includes 0 families.
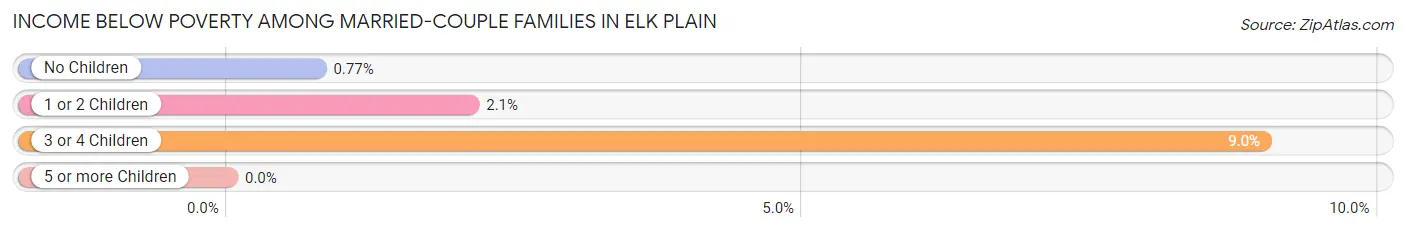
| Children | Above Poverty | Below Poverty |
| No Children | 1,796 (99.2%) | 14 (0.8%) |
| 1 or 2 Children | 978 (97.9%) | 21 (2.1%) |
| 3 or 4 Children | 192 (91.0%) | 19 (9.0%) |
| 5 or more Children | 19 (100.0%) | 0 (0.0%) |
| Total | 2,985 (98.2%) | 54 (1.8%) |
Income Below Poverty Among Single-Parent Households in Elk Plain
According to the poverty data in Elk Plain, 11.1% or 27 single-father households and 29.1% or 105 single-mother households are living below the poverty line. Among single-father households, those with 1 or 2 children have the highest poverty rate, with 27 households (13.6%) experiencing poverty. Likewise, among single-mother households, those with 1 or 2 children have the highest poverty rate, with 97 households (46.4%) falling below the poverty line.
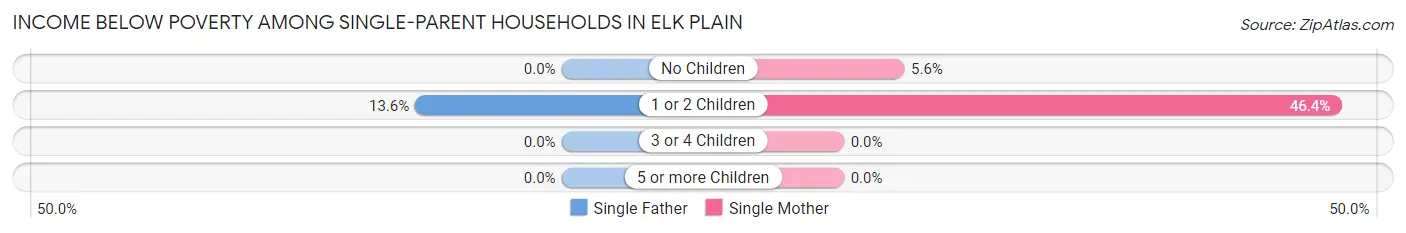
| Children | Single Father | Single Mother |
| No Children | 0 (0.0%) | 8 (5.6%) |
| 1 or 2 Children | 27 (13.6%) | 97 (46.4%) |
| 3 or 4 Children | 0 (0.0%) | 0 (0.0%) |
| 5 or more Children | 0 (0.0%) | 0 (0.0%) |
| Total | 27 (11.1%) | 105 (29.1%) |
Income Below Poverty Among Married-Couple vs Single-Parent Households in Elk Plain
The poverty data for Elk Plain shows that 54 of the married-couple family households (1.8%) and 132 of the single-parent households (21.8%) are living below the poverty level. Within the married-couple family households, those with 3 or 4 children have the highest poverty rate, with 19 households (9.0%) falling below the poverty line. Among the single-parent households, those with 1 or 2 children have the highest poverty rate, with 124 household (30.5%) living below poverty.
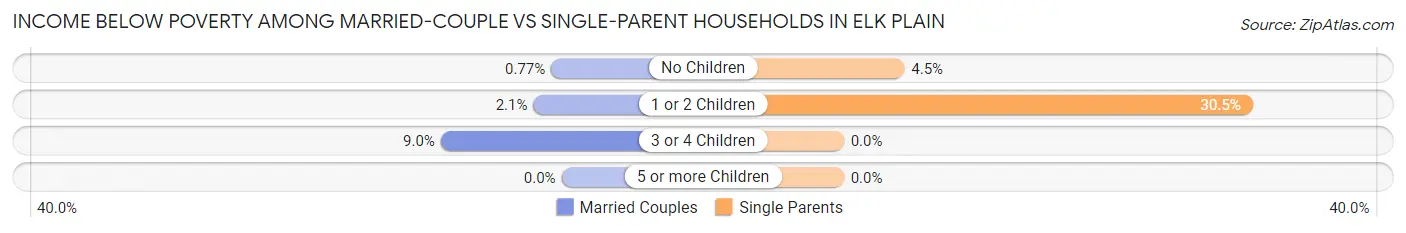
| Children | Married-Couple Families | Single-Parent Households |
| No Children | 14 (0.8%) | 8 (4.5%) |
| 1 or 2 Children | 21 (2.1%) | 124 (30.5%) |
| 3 or 4 Children | 19 (9.0%) | 0 (0.0%) |
| 5 or more Children | 0 (0.0%) | 0 (0.0%) |
| Total | 54 (1.8%) | 132 (21.8%) |
Race in Elk Plain
The most populous races in Elk Plain are White / Caucasian (10,278 | 72.3%), Two or more Races (1,714 | 12.0%), and Hispanic or Latino (1,415 | 10.0%).
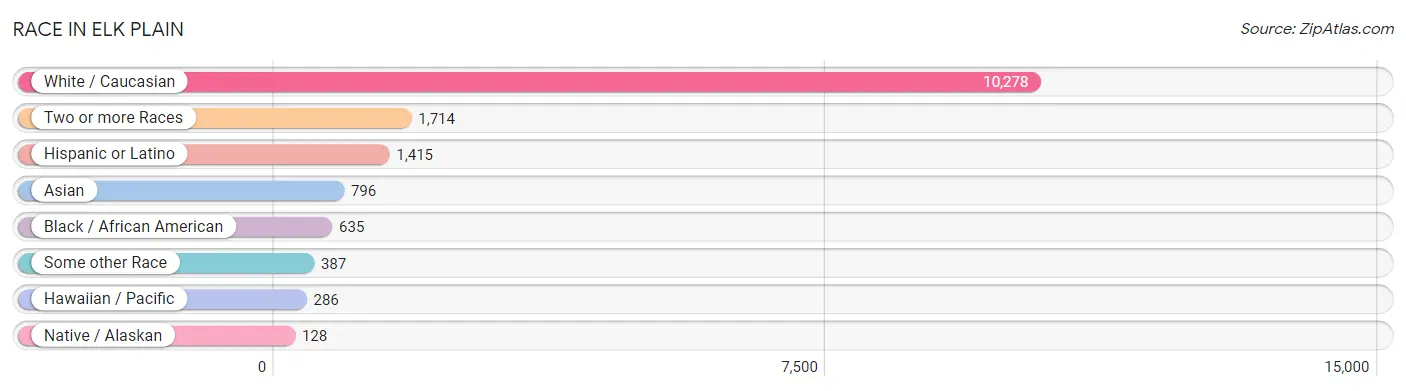
| Race | # Population | % Population |
| Asian | 796 | 5.6% |
| Black / African American | 635 | 4.5% |
| Hawaiian / Pacific | 286 | 2.0% |
| Hispanic or Latino | 1,415 | 10.0% |
| Native / Alaskan | 128 | 0.9% |
| White / Caucasian | 10,278 | 72.3% |
| Two or more Races | 1,714 | 12.0% |
| Some other Race | 387 | 2.7% |
| Total | 14,224 | 100.0% |
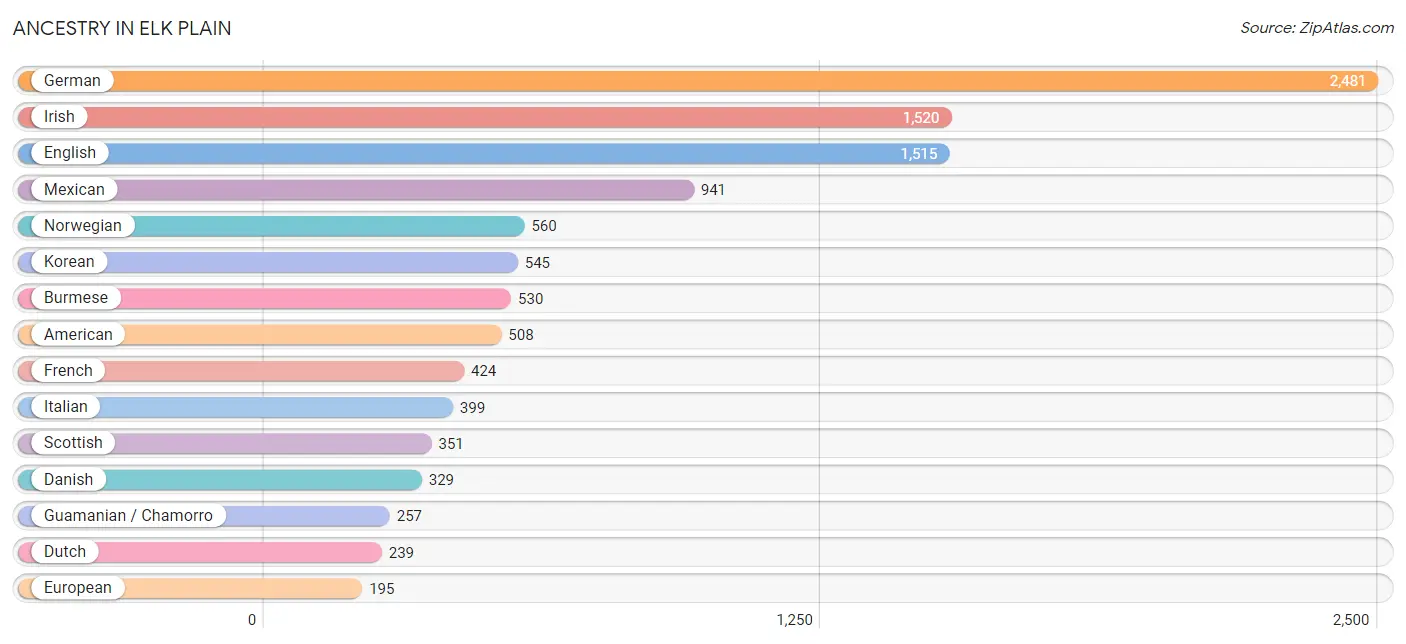
Ancestry in Elk Plain
The most populous ancestries reported in Elk Plain are German (2,481 | 17.4%), Irish (1,520 | 10.7%), English (1,515 | 10.6%), Mexican (941 | 6.6%), and Norwegian (560 | 3.9%), together accounting for 49.3% of all Elk Plain residents.
| Ancestry | # Population | % Population |
| American | 508 | 3.6% |
| Arab | 6 | 0.0% |
| Austrian | 61 | 0.4% |
| Belgian | 69 | 0.5% |
| Belizean | 37 | 0.3% |
| Bhutanese | 122 | 0.9% |
| Blackfeet | 45 | 0.3% |
| British | 83 | 0.6% |
| Burmese | 530 | 3.7% |
| Canadian | 35 | 0.3% |
| Central American | 63 | 0.4% |
| Central American Indian | 10 | 0.1% |
| Cherokee | 9 | 0.1% |
| Chippewa | 12 | 0.1% |
| Colville | 2 | 0.0% |
| Creek | 89 | 0.6% |
| Croatian | 41 | 0.3% |
| Czech | 13 | 0.1% |
| Czechoslovakian | 53 | 0.4% |
| Danish | 329 | 2.3% |
| Dutch | 239 | 1.7% |
| Ecuadorian | 7 | 0.1% |
| English | 1,515 | 10.6% |
| European | 195 | 1.4% |
| Filipino | 20 | 0.1% |
| Finnish | 65 | 0.5% |
| French | 424 | 3.0% |
| French Canadian | 190 | 1.3% |
| German | 2,481 | 17.4% |
| Guamanian / Chamorro | 257 | 1.8% |
| Guatemalan | 34 | 0.2% |
| Indian (Asian) | 103 | 0.7% |
| Irish | 1,520 | 10.7% |
| Iroquois | 14 | 0.1% |
| Italian | 399 | 2.8% |
| Japanese | 67 | 0.5% |
| Korean | 545 | 3.8% |
| Laotian | 11 | 0.1% |
| Lithuanian | 9 | 0.1% |
| Mexican | 941 | 6.6% |
| Moroccan | 6 | 0.0% |
| Native Hawaiian | 65 | 0.5% |
| Norwegian | 560 | 3.9% |
| Peruvian | 61 | 0.4% |
| Polish | 173 | 1.2% |
| Puerto Rican | 109 | 0.8% |
| Puget Sound Salish | 34 | 0.2% |
| Romanian | 22 | 0.2% |
| Russian | 9 | 0.1% |
| Salvadoran | 29 | 0.2% |
| Samoan | 47 | 0.3% |
| Scandinavian | 189 | 1.3% |
| Scotch-Irish | 105 | 0.7% |
| Scottish | 351 | 2.5% |
| Sioux | 9 | 0.1% |
| Somali | 32 | 0.2% |
| South American | 68 | 0.5% |
| Spaniard | 46 | 0.3% |
| Spanish | 168 | 1.2% |
| Sri Lankan | 53 | 0.4% |
| Subsaharan African | 32 | 0.2% |
| Swedish | 167 | 1.2% |
| Swiss | 14 | 0.1% |
| Tlingit-Haida | 12 | 0.1% |
| Welsh | 72 | 0.5% |
| Yakama | 63 | 0.4% |
| Yugoslavian | 8 | 0.1% | View All 67 Rows |
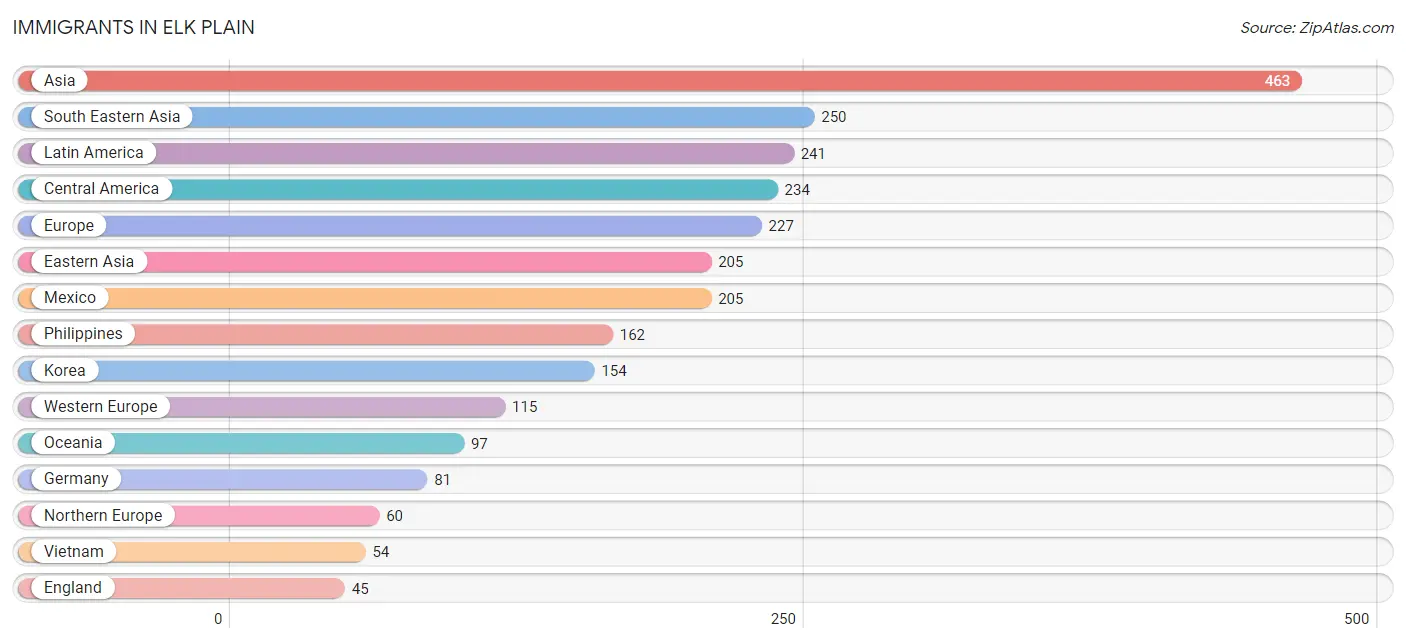
Immigrants in Elk Plain
The most numerous immigrant groups reported in Elk Plain came from Asia (463 | 3.3%), South Eastern Asia (250 | 1.8%), Latin America (241 | 1.7%), Central America (234 | 1.7%), and Europe (227 | 1.6%), together accounting for 10.0% of all Elk Plain residents.
| Immigration Origin | # Population | % Population |
| Africa | 43 | 0.3% |
| Asia | 463 | 3.3% |
| Cambodia | 23 | 0.2% |
| Canada | 27 | 0.2% |
| Central America | 234 | 1.7% |
| China | 24 | 0.2% |
| Eastern Africa | 11 | 0.1% |
| Eastern Asia | 205 | 1.4% |
| Eastern Europe | 32 | 0.2% |
| Ecuador | 7 | 0.1% |
| England | 45 | 0.3% |
| Europe | 227 | 1.6% |
| Fiji | 20 | 0.1% |
| France | 14 | 0.1% |
| Germany | 81 | 0.6% |
| Guatemala | 29 | 0.2% |
| Indonesia | 11 | 0.1% |
| Japan | 27 | 0.2% |
| Korea | 154 | 1.1% |
| Latin America | 241 | 1.7% |
| Mexico | 205 | 1.4% |
| Moldova | 32 | 0.2% |
| Morocco | 32 | 0.2% |
| Netherlands | 20 | 0.1% |
| Northern Africa | 32 | 0.2% |
| Northern Europe | 60 | 0.4% |
| Oceania | 97 | 0.7% |
| Pakistan | 8 | 0.1% |
| Philippines | 162 | 1.1% |
| Somalia | 11 | 0.1% |
| South America | 7 | 0.1% |
| South Central Asia | 8 | 0.1% |
| South Eastern Asia | 250 | 1.8% |
| Southern Europe | 20 | 0.1% |
| Taiwan | 8 | 0.1% |
| Vietnam | 54 | 0.4% |
| Western Europe | 115 | 0.8% | View All 37 Rows |
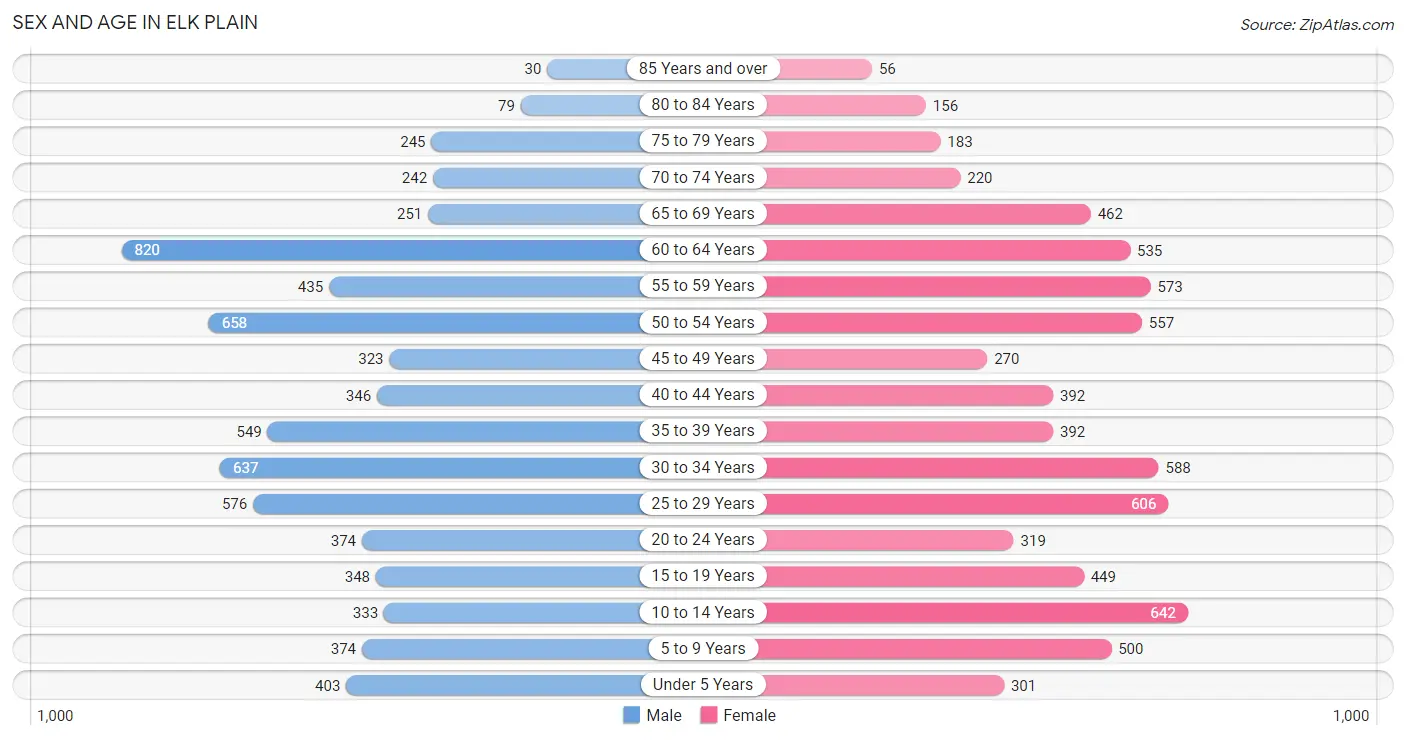
Sex and Age in Elk Plain
Sex and Age in Elk Plain
The most populous age groups in Elk Plain are 60 to 64 Years (820 | 11.7%) for men and 10 to 14 Years (642 | 8.9%) for women.
| Age Bracket | Male | Female |
| Under 5 Years | 403 (5.7%) | 301 (4.2%) |
| 5 to 9 Years | 374 (5.3%) | 500 (6.9%) |
| 10 to 14 Years | 333 (4.7%) | 642 (8.9%) |
| 15 to 19 Years | 348 (5.0%) | 449 (6.2%) |
| 20 to 24 Years | 374 (5.3%) | 319 (4.4%) |
| 25 to 29 Years | 576 (8.2%) | 606 (8.4%) |
| 30 to 34 Years | 637 (9.1%) | 588 (8.2%) |
| 35 to 39 Years | 549 (7.8%) | 392 (5.4%) |
| 40 to 44 Years | 346 (4.9%) | 392 (5.4%) |
| 45 to 49 Years | 323 (4.6%) | 270 (3.7%) |
| 50 to 54 Years | 658 (9.4%) | 557 (7.7%) |
| 55 to 59 Years | 435 (6.2%) | 573 (8.0%) |
| 60 to 64 Years | 820 (11.7%) | 535 (7.4%) |
| 65 to 69 Years | 251 (3.6%) | 462 (6.4%) |
| 70 to 74 Years | 242 (3.5%) | 220 (3.1%) |
| 75 to 79 Years | 245 (3.5%) | 183 (2.5%) |
| 80 to 84 Years | 79 (1.1%) | 156 (2.2%) |
| 85 Years and over | 30 (0.4%) | 56 (0.8%) |
| Total | 7,023 (100.0%) | 7,201 (100.0%) |
Families and Households in Elk Plain
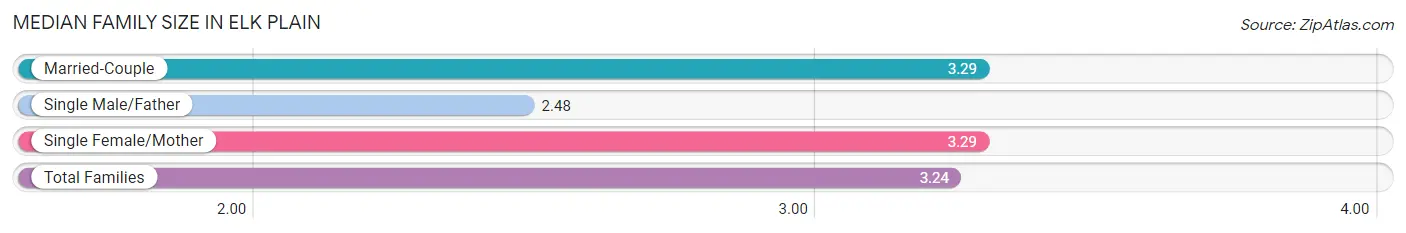
Median Family Size in Elk Plain
The median family size in Elk Plain is 3.24 persons per family, with married-couple families (3,039 | 83.4%) accounting for the largest median family size of 3.29 persons per family. On the other hand, single male/father families (243 | 6.7%) represent the smallest median family size with 2.48 persons per family.
| Family Type | # Families | Family Size |
| Married-Couple | 3,039 (83.4%) | 3.29 |
| Single Male/Father | 243 (6.7%) | 2.48 |
| Single Female/Mother | 361 (9.9%) | 3.29 |
| Total Families | 3,643 (100.0%) | 3.24 |
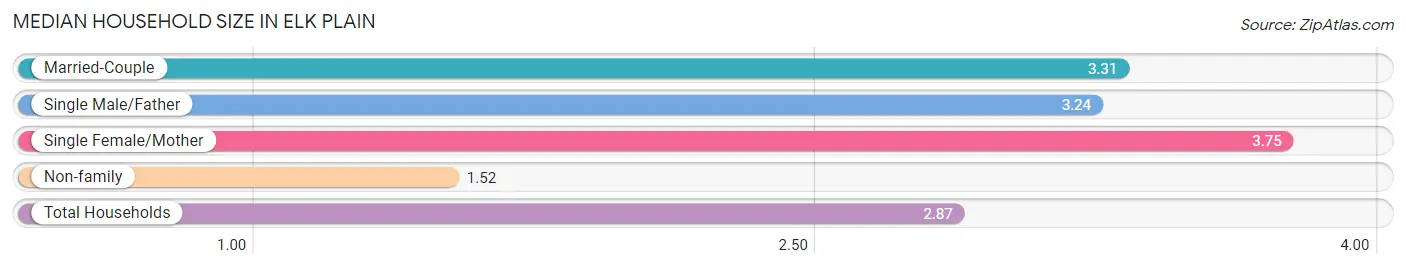
Median Household Size in Elk Plain
The median household size in Elk Plain is 2.87 persons per household, with single female/mother households (361 | 7.3%) accounting for the largest median household size of 3.75 persons per household. non-family households (1,292 | 26.2%) represent the smallest median household size with 1.52 persons per household.
| Household Type | # Households | Household Size |
| Married-Couple | 3,039 (61.6%) | 3.31 |
| Single Male/Father | 243 (4.9%) | 3.24 |
| Single Female/Mother | 361 (7.3%) | 3.75 |
| Non-family | 1,292 (26.2%) | 1.52 |
| Total Households | 4,935 (100.0%) | 2.87 |
Household Size by Marriage Status in Elk Plain
Out of a total of 4,935 households in Elk Plain, 3,643 (73.8%) are family households, while 1,292 (26.2%) are nonfamily households. The most numerous type of family households are 2-person households, comprising 1,372, and the most common type of nonfamily households are 1-person households, comprising 737.
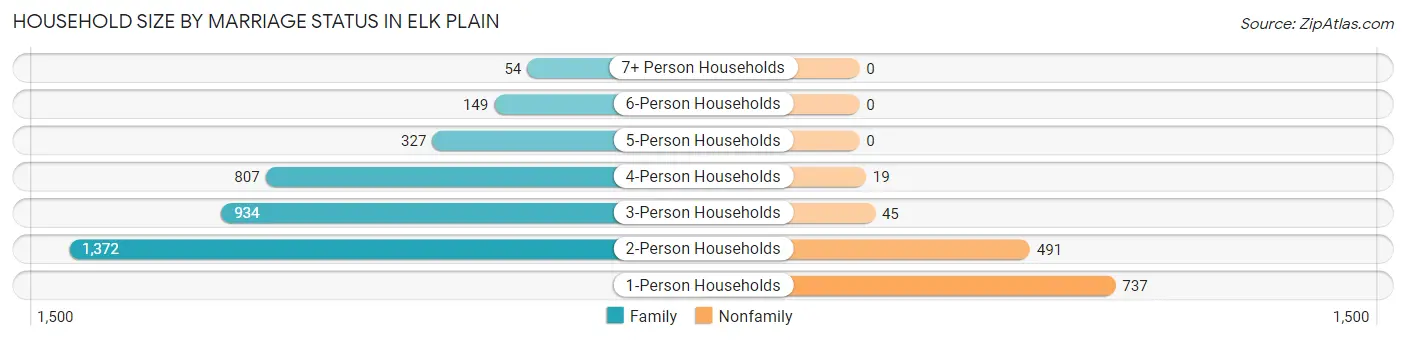
| Household Size | Family Households | Nonfamily Households |
| 1-Person Households | - | 737 (14.9%) |
| 2-Person Households | 1,372 (27.8%) | 491 (10.0%) |
| 3-Person Households | 934 (18.9%) | 45 (0.9%) |
| 4-Person Households | 807 (16.4%) | 19 (0.4%) |
| 5-Person Households | 327 (6.6%) | 0 (0.0%) |
| 6-Person Households | 149 (3.0%) | 0 (0.0%) |
| 7+ Person Households | 54 (1.1%) | 0 (0.0%) |
| Total | 3,643 (73.8%) | 1,292 (26.2%) |
Female Fertility in Elk Plain
Fertility by Age in Elk Plain
Average fertility rate in Elk Plain is 74.0 births per 1,000 women. Women in the age bracket of 20 to 34 years have the highest fertility rate with 147.0 births per 1,000 women. Women in the age bracket of 20 to 34 years acount for 97.4% of all women with births.
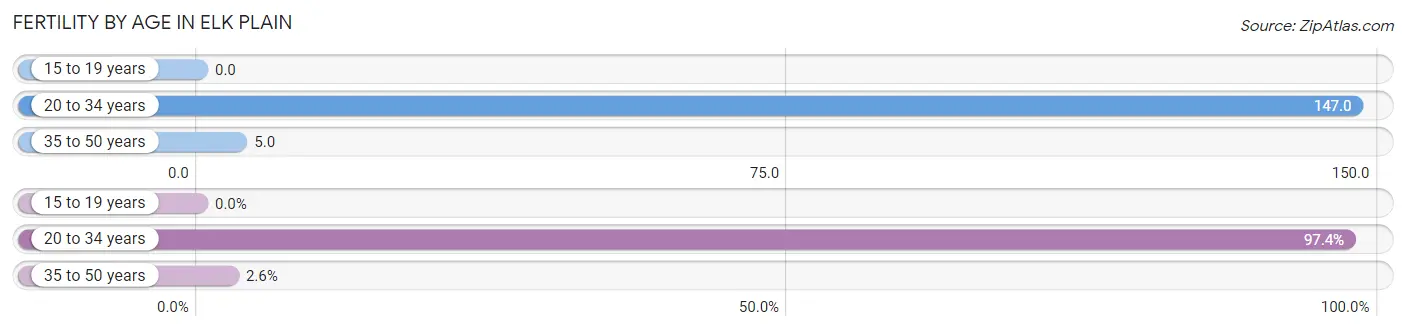
| Age Bracket | Women with Births | Births / 1,000 Women |
| 15 to 19 years | 0 (0.0%) | 0.0 |
| 20 to 34 years | 223 (97.4%) | 147.0 |
| 35 to 50 years | 6 (2.6%) | 5.0 |
| Total | 229 (100.0%) | 74.0 |
Fertility by Age by Marriage Status in Elk Plain
90.4% of women with births (229) in Elk Plain are married. The highest percentage of unmarried women with births falls into 20 to 34 years age bracket with 9.9% of them unmarried at the time of birth, while the lowest percentage of unmarried women with births belong to 35 to 50 years age bracket with 0.0% of them unmarried.
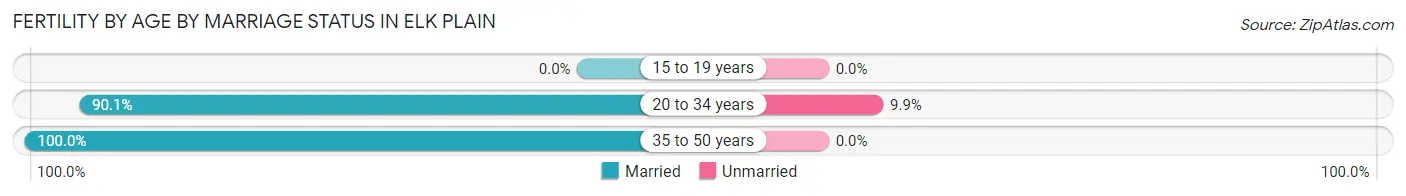
| Age Bracket | Married | Unmarried |
| 15 to 19 years | 0 (0.0%) | 0 (0.0%) |
| 20 to 34 years | 201 (90.1%) | 22 (9.9%) |
| 35 to 50 years | 6 (100.0%) | 0 (0.0%) |
| Total | 207 (90.4%) | 22 (9.6%) |
Fertility by Education in Elk Plain
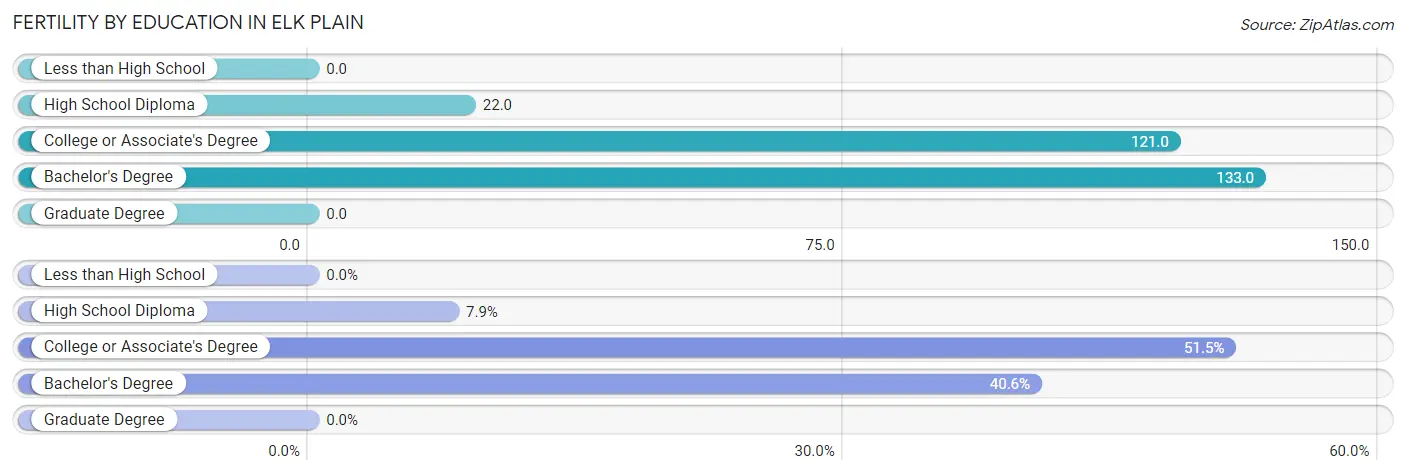
| Educational Attainment | Women with Births | Births / 1,000 Women |
| Less than High School | 0 (0.0%) | 0.0 |
| High School Diploma | 18 (7.9%) | 22.0 |
| College or Associate's Degree | 118 (51.5%) | 121.0 |
| Bachelor's Degree | 93 (40.6%) | 133.0 |
| Graduate Degree | 0 (0.0%) | 0.0 |
| Total | 229 (100.0%) | 74.0 |
Fertility by Education by Marriage Status in Elk Plain
9.6% of women with births in Elk Plain are unmarried. Women with the educational attainment of high school diploma are most likely to be married with 100.0% of them married at childbirth, while women with the educational attainment of college or associate's degree are least likely to be married with 18.6% of them unmarried at childbirth.
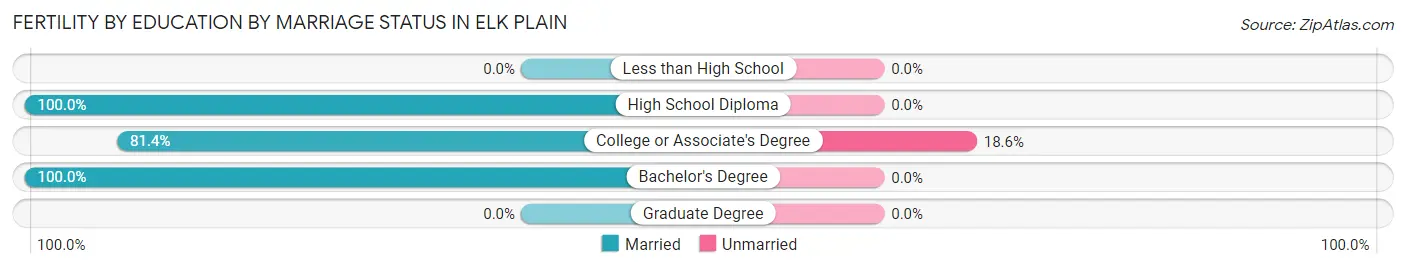
| Educational Attainment | Married | Unmarried |
| Less than High School | 0 (0.0%) | 0 (0.0%) |
| High School Diploma | 18 (100.0%) | 0 (0.0%) |
| College or Associate's Degree | 96 (81.4%) | 22 (18.6%) |
| Bachelor's Degree | 93 (100.0%) | 0 (0.0%) |
| Graduate Degree | 0 (0.0%) | 0 (0.0%) |
| Total | 207 (90.4%) | 22 (9.6%) |
Employment Characteristics in Elk Plain
Employment by Class of Employer in Elk Plain
Among the 7,229 employed individuals in Elk Plain, private company employees (4,692 | 64.9%), federal government employees (634 | 8.8%), and local government employees (630 | 8.7%) make up the most common classes of employment.
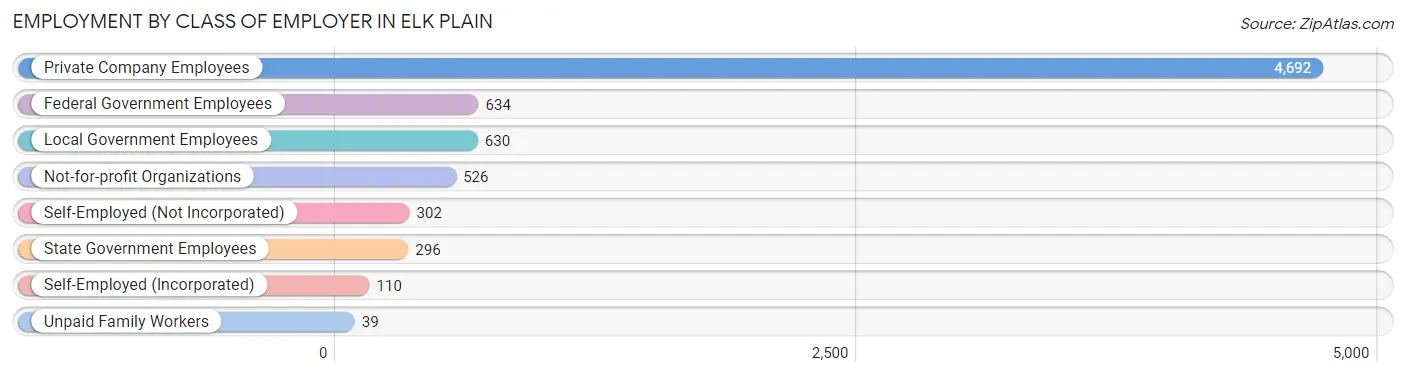
| Employer Class | # Employees | % Employees |
| Private Company Employees | 4,692 | 64.9% |
| Self-Employed (Incorporated) | 110 | 1.5% |
| Self-Employed (Not Incorporated) | 302 | 4.2% |
| Not-for-profit Organizations | 526 | 7.3% |
| Local Government Employees | 630 | 8.7% |
| State Government Employees | 296 | 4.1% |
| Federal Government Employees | 634 | 8.8% |
| Unpaid Family Workers | 39 | 0.5% |
| Total | 7,229 | 100.0% |
Employment Status by Age in Elk Plain
According to the labor force statistics for Elk Plain, out of the total population over 16 years of age (11,442), 67.3% or 7,700 individuals are in the labor force, with 4.2% or 323 of them unemployed. The age group with the highest labor force participation rate is 45 to 54 years, with 86.9% or 1,571 individuals in the labor force. Within the labor force, the 20 to 24 years age range has the highest percentage of unemployed individuals, with 16.8% or 99 of them being unemployed.
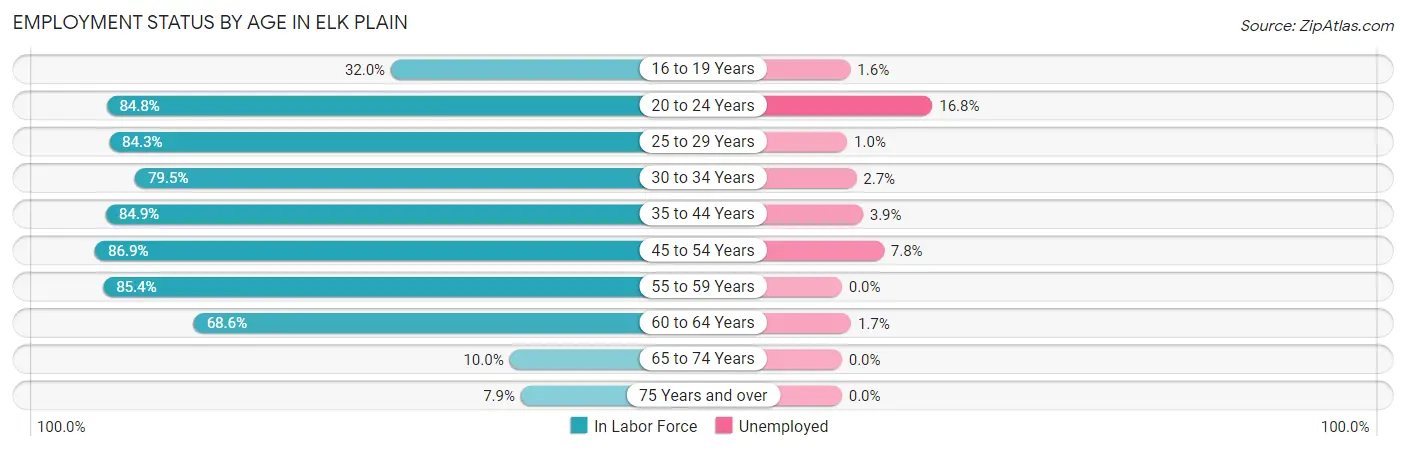
| Age Bracket | In Labor Force | Unemployed |
| 16 to 19 Years | 182 (32.0%) | 3 (1.6%) |
| 20 to 24 Years | 588 (84.8%) | 99 (16.8%) |
| 25 to 29 Years | 996 (84.3%) | 10 (1.0%) |
| 30 to 34 Years | 974 (79.5%) | 26 (2.7%) |
| 35 to 44 Years | 1,425 (84.9%) | 56 (3.9%) |
| 45 to 54 Years | 1,571 (86.9%) | 123 (7.8%) |
| 55 to 59 Years | 861 (85.4%) | 0 (0.0%) |
| 60 to 64 Years | 930 (68.6%) | 16 (1.7%) |
| 65 to 74 Years | 118 (10.0%) | 0 (0.0%) |
| 75 Years and over | 59 (7.9%) | 0 (0.0%) |
| Total | 7,700 (67.3%) | 323 (4.2%) |
Employment Status by Educational Attainment in Elk Plain
According to labor force statistics for Elk Plain, 81.9% of individuals (6,762) out of the total population between 25 and 64 years of age (8,257) are in the labor force, with 3.4% or 230 of them being unemployed. The group with the highest labor force participation rate are those with the educational attainment of bachelor's degree or higher, with 89.5% or 1,281 individuals in the labor force. Within the labor force, individuals with less than high school education have the highest percentage of unemployment, with 8.4% or 30 of them being unemployed.
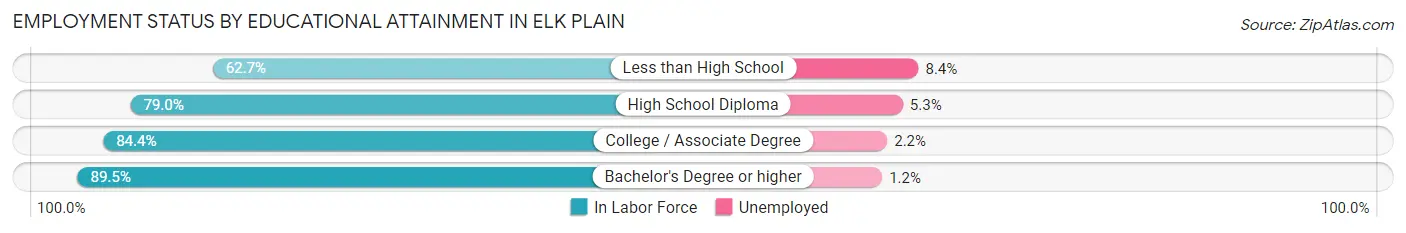
| Educational Attainment | In Labor Force | Unemployed |
| Less than High School | 356 (62.7%) | 48 (8.4%) |
| High School Diploma | 2,334 (79.0%) | 157 (5.3%) |
| College / Associate Degree | 2,789 (84.4%) | 73 (2.2%) |
| Bachelor's Degree or higher | 1,281 (89.5%) | 17 (1.2%) |
| Total | 6,762 (81.9%) | 281 (3.4%) |
Employment Occupations by Sex in Elk Plain
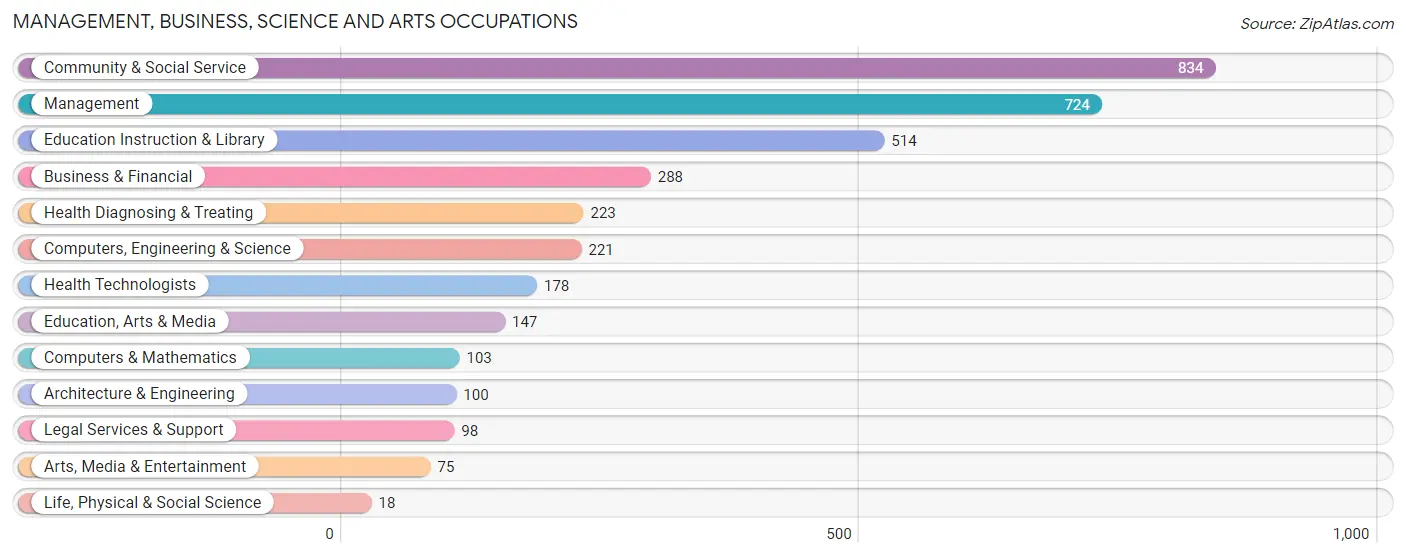
Management, Business, Science and Arts Occupations
The most common Management, Business, Science and Arts occupations in Elk Plain are Community & Social Service (834 | 11.5%), Management (724 | 10.0%), Education Instruction & Library (514 | 7.1%), Business & Financial (288 | 4.0%), and Health Diagnosing & Treating (223 | 3.1%).
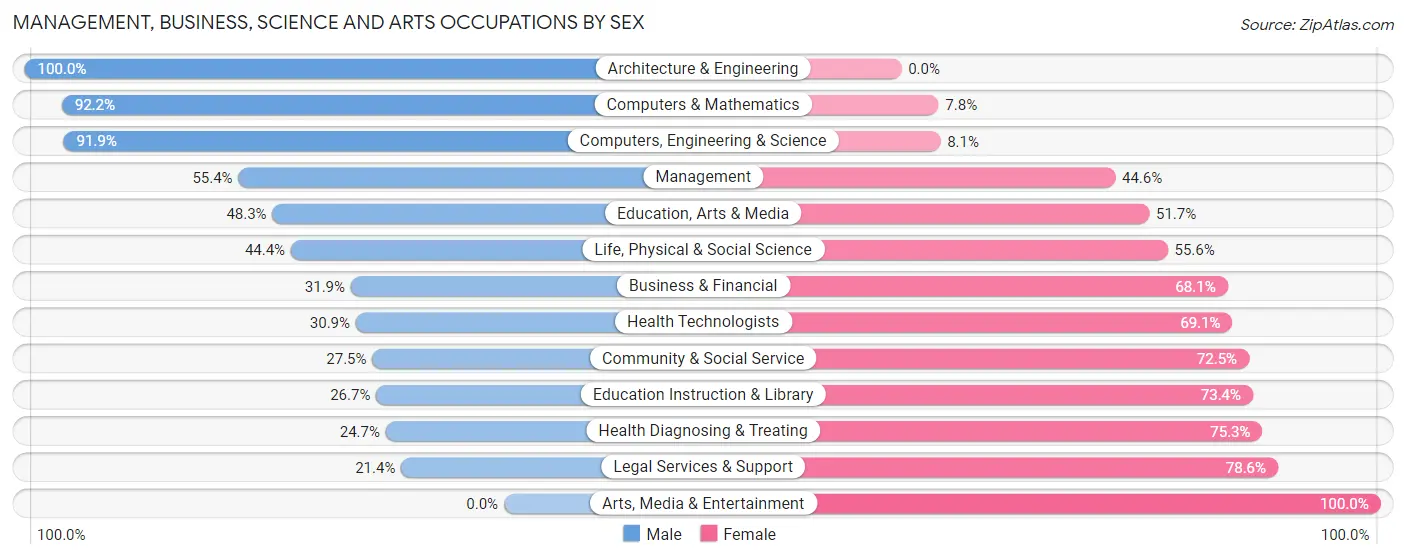
Management, Business, Science and Arts Occupations by Sex
Within the Management, Business, Science and Arts occupations in Elk Plain, the most male-oriented occupations are Architecture & Engineering (100.0%), Computers & Mathematics (92.2%), and Computers, Engineering & Science (91.9%), while the most female-oriented occupations are Arts, Media & Entertainment (100.0%), Legal Services & Support (78.6%), and Health Diagnosing & Treating (75.3%).
| Occupation | Male | Female |
| Management | 401 (55.4%) | 323 (44.6%) |
| Business & Financial | 92 (31.9%) | 196 (68.1%) |
| Computers, Engineering & Science | 203 (91.9%) | 18 (8.1%) |
| Computers & Mathematics | 95 (92.2%) | 8 (7.8%) |
| Architecture & Engineering | 100 (100.0%) | 0 (0.0%) |
| Life, Physical & Social Science | 8 (44.4%) | 10 (55.6%) |
| Community & Social Service | 229 (27.5%) | 605 (72.5%) |
| Education, Arts & Media | 71 (48.3%) | 76 (51.7%) |
| Legal Services & Support | 21 (21.4%) | 77 (78.6%) |
| Education Instruction & Library | 137 (26.7%) | 377 (73.4%) |
| Arts, Media & Entertainment | 0 (0.0%) | 75 (100.0%) |
| Health Diagnosing & Treating | 55 (24.7%) | 168 (75.3%) |
| Health Technologists | 55 (30.9%) | 123 (69.1%) |
| Total (Category) | 980 (42.8%) | 1,310 (57.2%) |
| Total (Overall) | 3,984 (54.9%) | 3,270 (45.1%) |
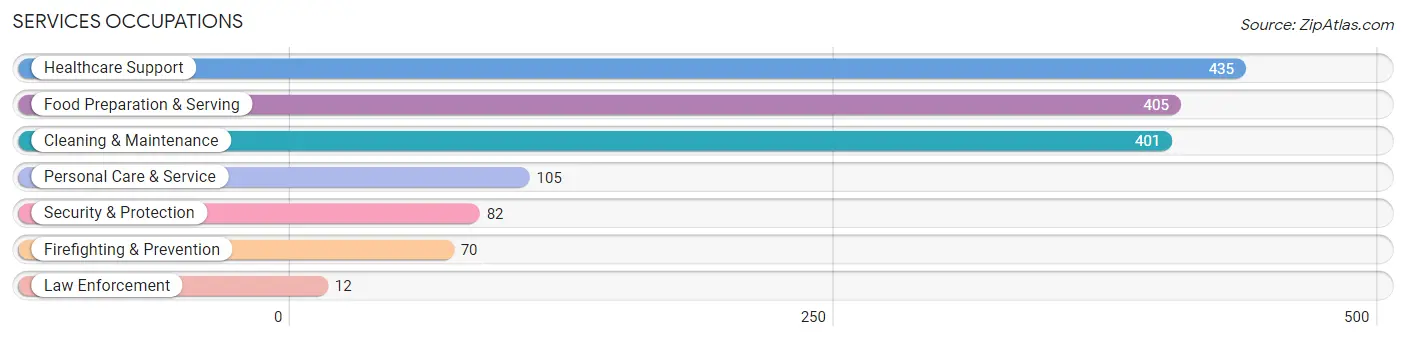
Services Occupations
The most common Services occupations in Elk Plain are Healthcare Support (435 | 6.0%), Food Preparation & Serving (405 | 5.6%), Cleaning & Maintenance (401 | 5.5%), Personal Care & Service (105 | 1.5%), and Security & Protection (82 | 1.1%).
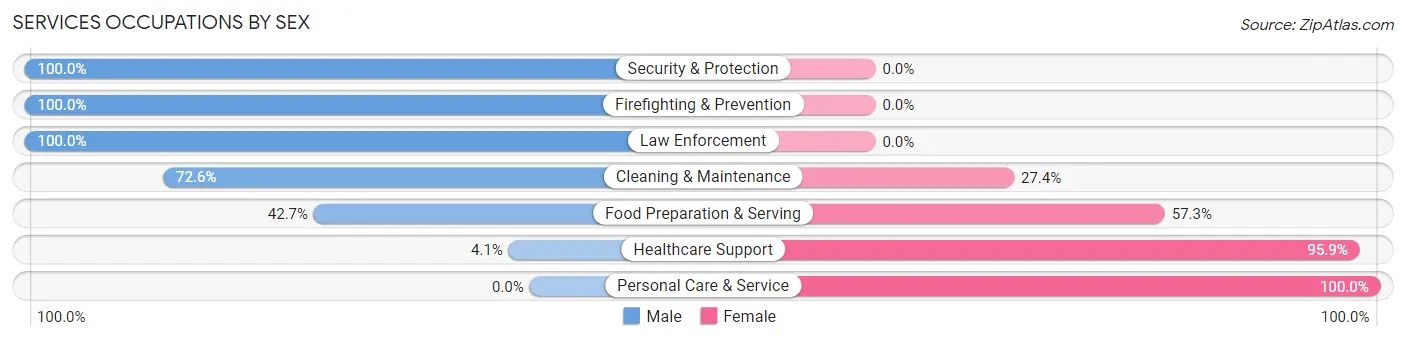
Services Occupations by Sex
Within the Services occupations in Elk Plain, the most male-oriented occupations are Security & Protection (100.0%), Firefighting & Prevention (100.0%), and Law Enforcement (100.0%), while the most female-oriented occupations are Personal Care & Service (100.0%), Healthcare Support (95.9%), and Food Preparation & Serving (57.3%).
| Occupation | Male | Female |
| Healthcare Support | 18 (4.1%) | 417 (95.9%) |
| Security & Protection | 82 (100.0%) | 0 (0.0%) |
| Firefighting & Prevention | 70 (100.0%) | 0 (0.0%) |
| Law Enforcement | 12 (100.0%) | 0 (0.0%) |
| Food Preparation & Serving | 173 (42.7%) | 232 (57.3%) |
| Cleaning & Maintenance | 291 (72.6%) | 110 (27.4%) |
| Personal Care & Service | 0 (0.0%) | 105 (100.0%) |
| Total (Category) | 564 (39.5%) | 864 (60.5%) |
| Total (Overall) | 3,984 (54.9%) | 3,270 (45.1%) |
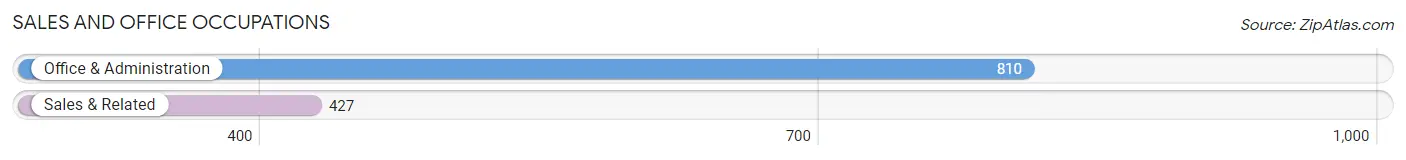
Sales and Office Occupations
The most common Sales and Office occupations in Elk Plain are Office & Administration (810 | 11.2%), and Sales & Related (427 | 5.9%).
Sales and Office Occupations by Sex
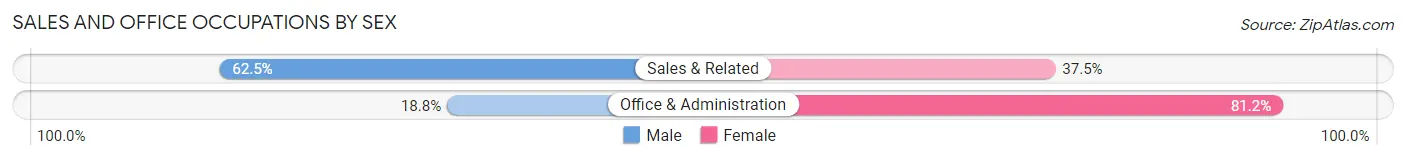
| Occupation | Male | Female |
| Sales & Related | 267 (62.5%) | 160 (37.5%) |
| Office & Administration | 152 (18.8%) | 658 (81.2%) |
| Total (Category) | 419 (33.9%) | 818 (66.1%) |
| Total (Overall) | 3,984 (54.9%) | 3,270 (45.1%) |
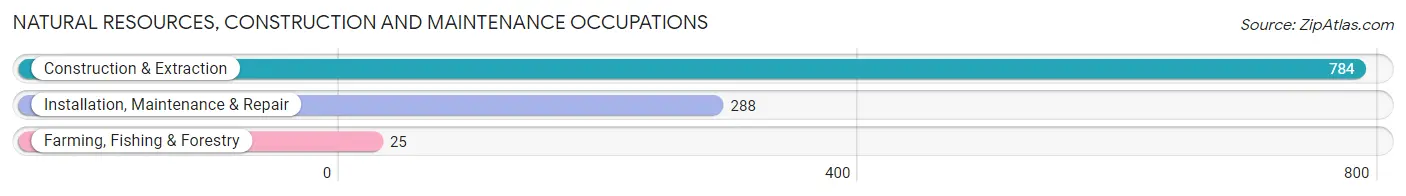
Natural Resources, Construction and Maintenance Occupations
The most common Natural Resources, Construction and Maintenance occupations in Elk Plain are Construction & Extraction (784 | 10.8%), Installation, Maintenance & Repair (288 | 4.0%), and Farming, Fishing & Forestry (25 | 0.3%).
Natural Resources, Construction and Maintenance Occupations by Sex
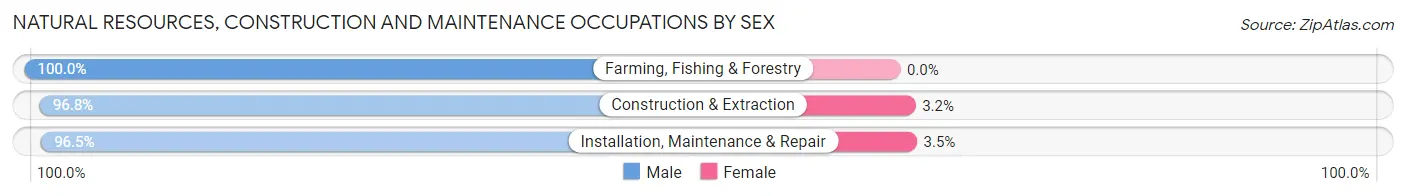
| Occupation | Male | Female |
| Farming, Fishing & Forestry | 25 (100.0%) | 0 (0.0%) |
| Construction & Extraction | 759 (96.8%) | 25 (3.2%) |
| Installation, Maintenance & Repair | 278 (96.5%) | 10 (3.5%) |
| Total (Category) | 1,062 (96.8%) | 35 (3.2%) |
| Total (Overall) | 3,984 (54.9%) | 3,270 (45.1%) |
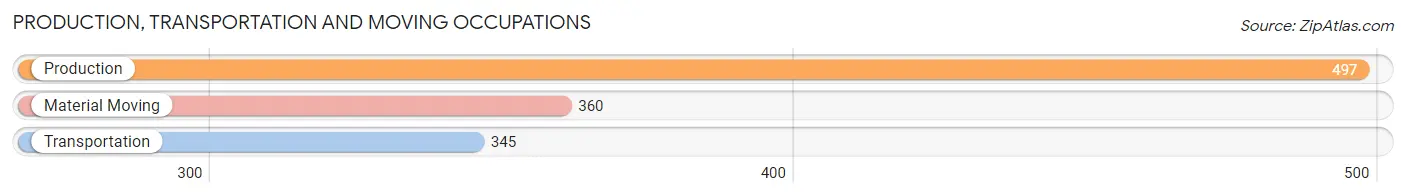
Production, Transportation and Moving Occupations
The most common Production, Transportation and Moving occupations in Elk Plain are Production (497 | 6.9%), Material Moving (360 | 5.0%), and Transportation (345 | 4.8%).
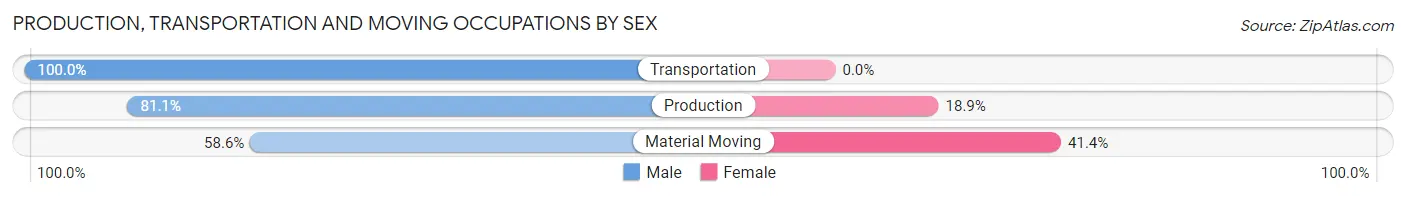
Production, Transportation and Moving Occupations by Sex
| Occupation | Male | Female |
| Production | 403 (81.1%) | 94 (18.9%) |
| Transportation | 345 (100.0%) | 0 (0.0%) |
| Material Moving | 211 (58.6%) | 149 (41.4%) |
| Total (Category) | 959 (79.8%) | 243 (20.2%) |
| Total (Overall) | 3,984 (54.9%) | 3,270 (45.1%) |
Employment Industries by Sex in Elk Plain
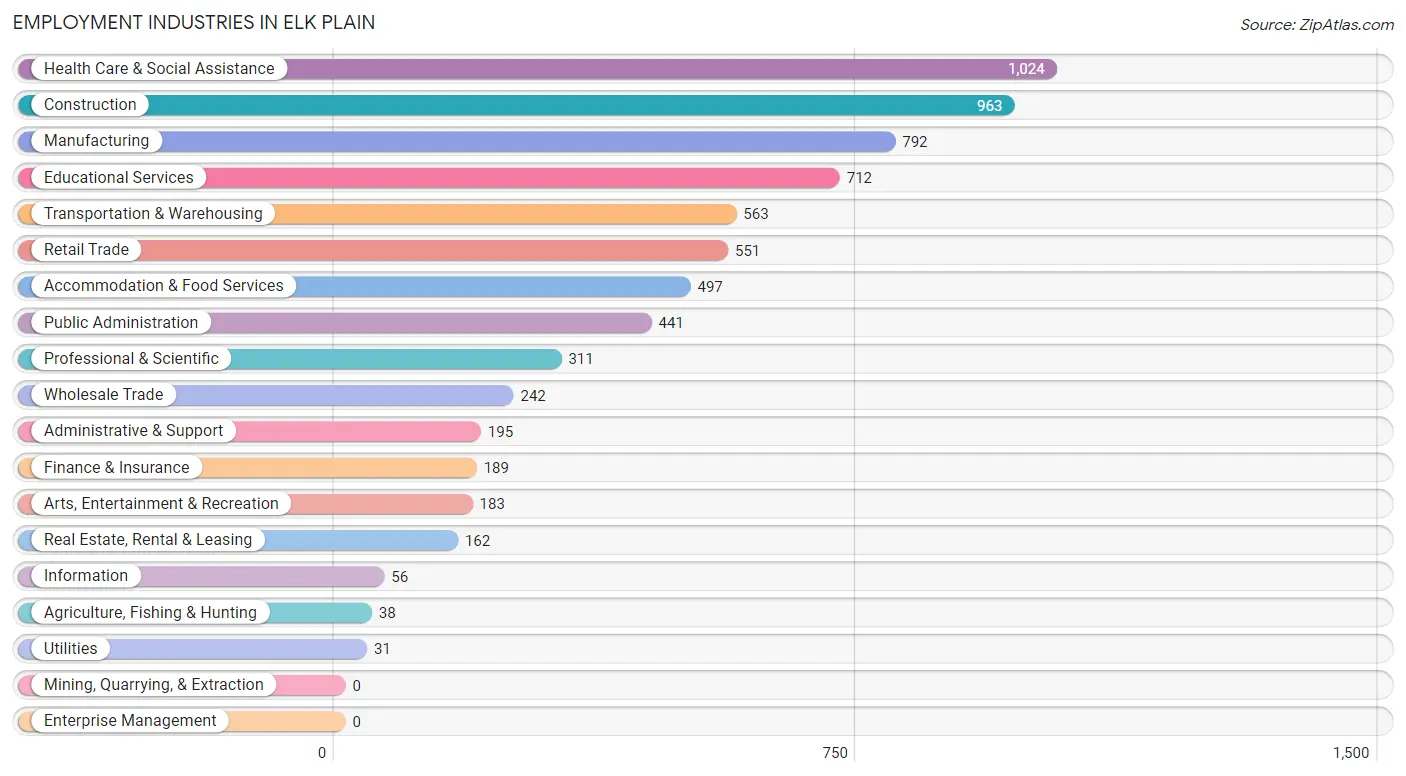
Employment Industries in Elk Plain
The major employment industries in Elk Plain include Health Care & Social Assistance (1,024 | 14.1%), Construction (963 | 13.3%), Manufacturing (792 | 10.9%), Educational Services (712 | 9.8%), and Transportation & Warehousing (563 | 7.8%).
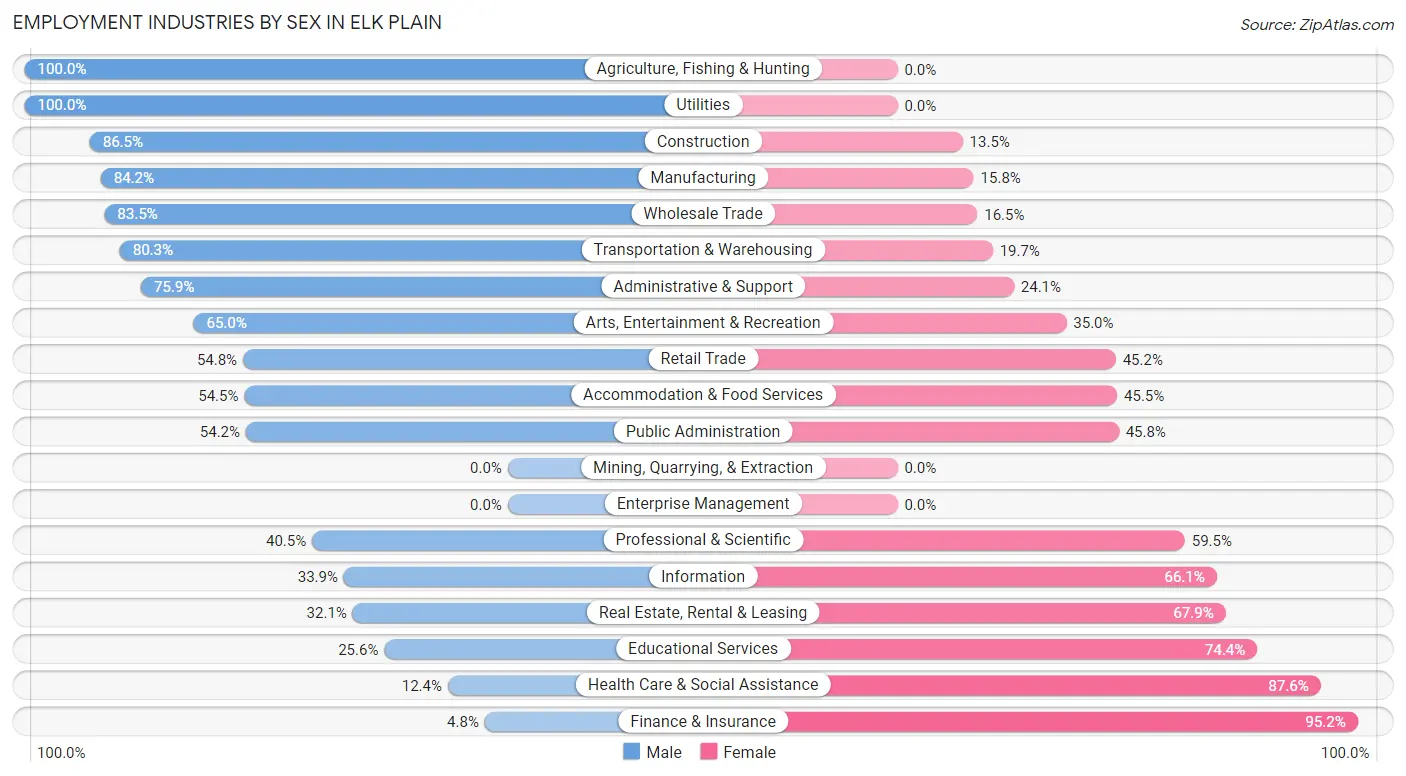
Employment Industries by Sex in Elk Plain
The Elk Plain industries that see more men than women are Agriculture, Fishing & Hunting (100.0%), Utilities (100.0%), and Construction (86.5%), whereas the industries that tend to have a higher number of women are Finance & Insurance (95.2%), Health Care & Social Assistance (87.6%), and Educational Services (74.4%).
| Industry | Male | Female |
| Agriculture, Fishing & Hunting | 38 (100.0%) | 0 (0.0%) |
| Mining, Quarrying, & Extraction | 0 (0.0%) | 0 (0.0%) |
| Construction | 833 (86.5%) | 130 (13.5%) |
| Manufacturing | 667 (84.2%) | 125 (15.8%) |
| Wholesale Trade | 202 (83.5%) | 40 (16.5%) |
| Retail Trade | 302 (54.8%) | 249 (45.2%) |
| Transportation & Warehousing | 452 (80.3%) | 111 (19.7%) |
| Utilities | 31 (100.0%) | 0 (0.0%) |
| Information | 19 (33.9%) | 37 (66.1%) |
| Finance & Insurance | 9 (4.8%) | 180 (95.2%) |
| Real Estate, Rental & Leasing | 52 (32.1%) | 110 (67.9%) |
| Professional & Scientific | 126 (40.5%) | 185 (59.5%) |
| Enterprise Management | 0 (0.0%) | 0 (0.0%) |
| Administrative & Support | 148 (75.9%) | 47 (24.1%) |
| Educational Services | 182 (25.6%) | 530 (74.4%) |
| Health Care & Social Assistance | 127 (12.4%) | 897 (87.6%) |
| Arts, Entertainment & Recreation | 119 (65.0%) | 64 (35.0%) |
| Accommodation & Food Services | 271 (54.5%) | 226 (45.5%) |
| Public Administration | 239 (54.2%) | 202 (45.8%) |
| Total | 3,984 (54.9%) | 3,270 (45.1%) |
Education in Elk Plain
School Enrollment in Elk Plain
The most common levels of schooling among the 3,166 students in Elk Plain are middle school (825 | 26.1%), high school (789 | 24.9%), and elementary school (727 | 23.0%).
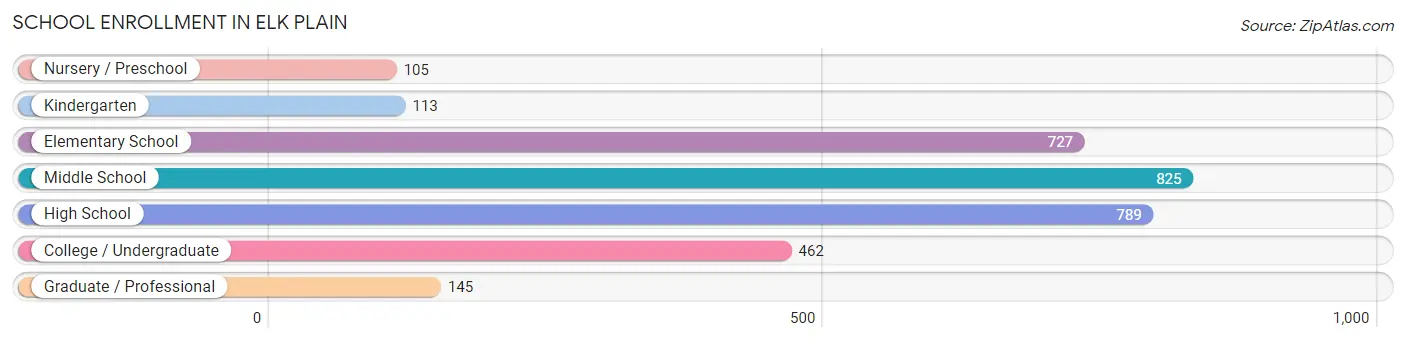
| School Level | # Students | % Students |
| Nursery / Preschool | 105 | 3.3% |
| Kindergarten | 113 | 3.6% |
| Elementary School | 727 | 23.0% |
| Middle School | 825 | 26.1% |
| High School | 789 | 24.9% |
| College / Undergraduate | 462 | 14.6% |
| Graduate / Professional | 145 | 4.6% |
| Total | 3,166 | 100.0% |
School Enrollment by Age by Funding Source in Elk Plain
Out of a total of 3,166 students who are enrolled in schools in Elk Plain, 323 (10.2%) attend a private institution, while the remaining 2,843 (89.8%) are enrolled in public schools. The age group of 3 to 4 year olds has the highest likelihood of being enrolled in private schools, with 40 (59.7% in the age bracket) enrolled. Conversely, the age group of 18 to 19 year olds has the lowest likelihood of being enrolled in a private school, with 205 (97.2% in the age bracket) attending a public institution.
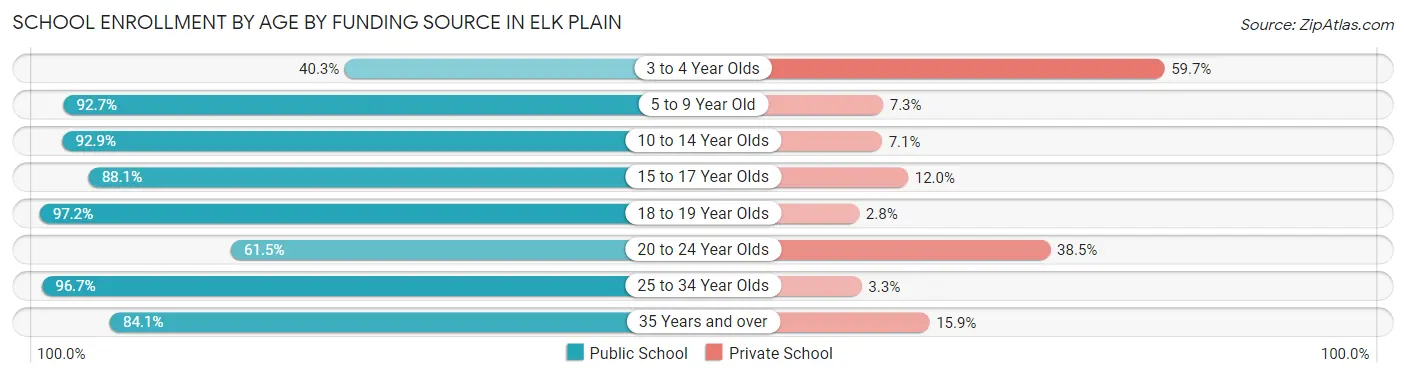
| Age Bracket | Public School | Private School |
| 3 to 4 Year Olds | 27 (40.3%) | 40 (59.7%) |
| 5 to 9 Year Old | 751 (92.7%) | 59 (7.3%) |
| 10 to 14 Year Olds | 906 (92.9%) | 69 (7.1%) |
| 15 to 17 Year Olds | 479 (88.0%) | 65 (11.9%) |
| 18 to 19 Year Olds | 205 (97.2%) | 6 (2.8%) |
| 20 to 24 Year Olds | 88 (61.5%) | 55 (38.5%) |
| 25 to 34 Year Olds | 293 (96.7%) | 10 (3.3%) |
| 35 Years and over | 95 (84.1%) | 18 (15.9%) |
| Total | 2,843 (89.8%) | 323 (10.2%) |
Educational Attainment by Field of Study in Elk Plain
Business (338 | 18.7%), education (256 | 14.2%), arts & humanities (227 | 12.6%), multidisciplinary studies (160 | 8.9%), and visual & performing arts (141 | 7.8%) are the most common fields of study among 1,804 individuals in Elk Plain who have obtained a bachelor's degree or higher.
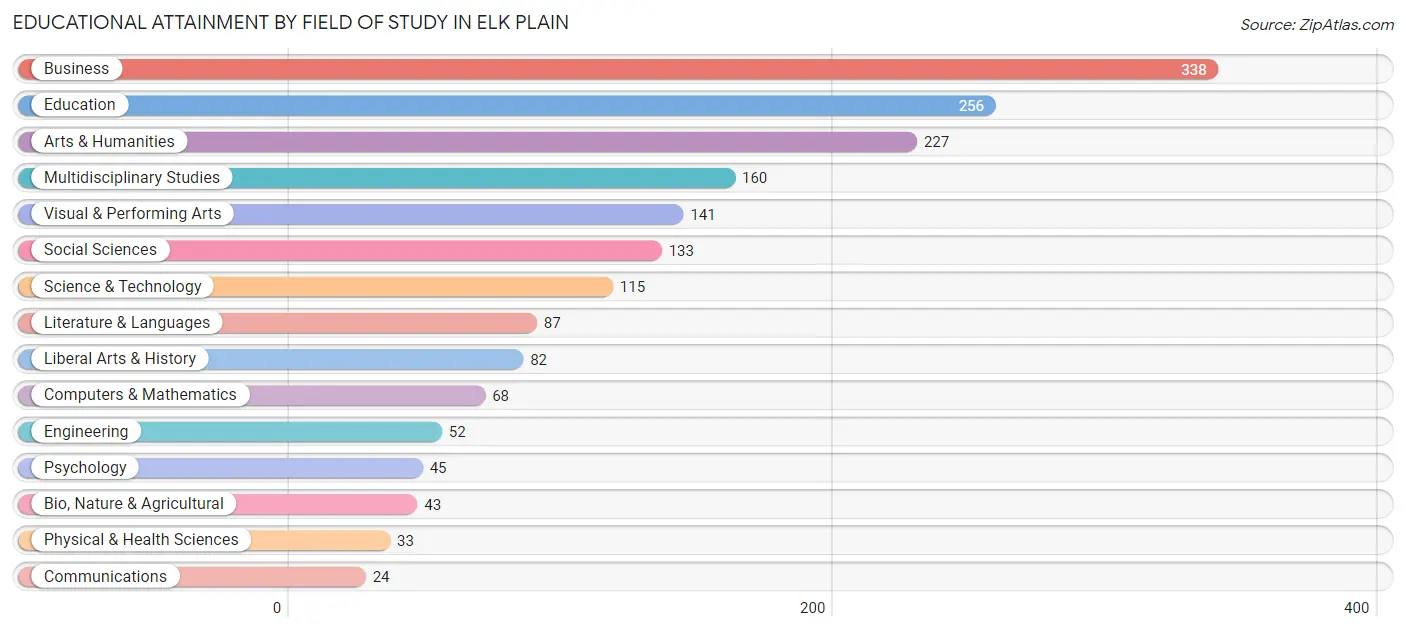
| Field of Study | # Graduates | % Graduates |
| Computers & Mathematics | 68 | 3.8% |
| Bio, Nature & Agricultural | 43 | 2.4% |
| Physical & Health Sciences | 33 | 1.8% |
| Psychology | 45 | 2.5% |
| Social Sciences | 133 | 7.4% |
| Engineering | 52 | 2.9% |
| Multidisciplinary Studies | 160 | 8.9% |
| Science & Technology | 115 | 6.4% |
| Business | 338 | 18.7% |
| Education | 256 | 14.2% |
| Literature & Languages | 87 | 4.8% |
| Liberal Arts & History | 82 | 4.5% |
| Visual & Performing Arts | 141 | 7.8% |
| Communications | 24 | 1.3% |
| Arts & Humanities | 227 | 12.6% |
| Total | 1,804 | 100.0% |
Transportation & Commute in Elk Plain
Vehicle Availability by Sex in Elk Plain
The most prevalent vehicle ownership categories in Elk Plain are males with 2 vehicles (1,816, accounting for 45.4%) and females with 2 vehicles (1,318, making up 56.3%).
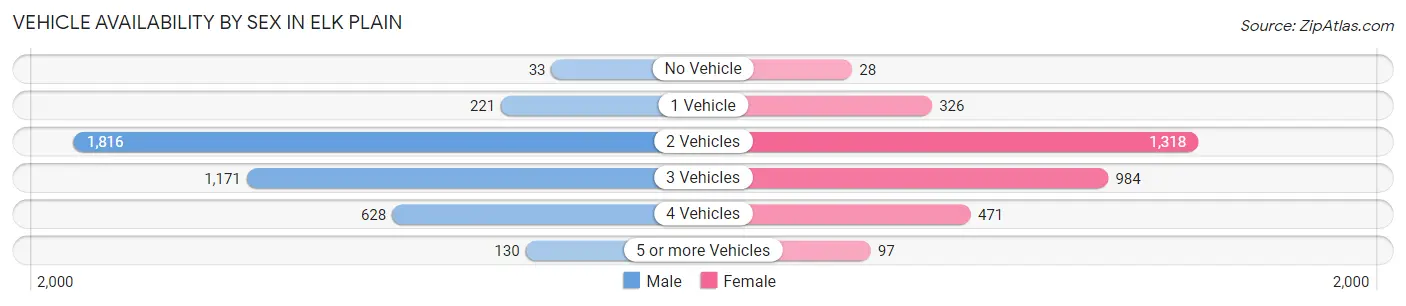
| Vehicles Available | Male | Female |
| No Vehicle | 33 (0.8%) | 28 (0.9%) |
| 1 Vehicle | 221 (5.5%) | 326 (10.1%) |
| 2 Vehicles | 1,816 (45.4%) | 1,318 (40.9%) |
| 3 Vehicles | 1,171 (29.3%) | 984 (30.5%) |
| 4 Vehicles | 628 (15.7%) | 471 (14.6%) |
| 5 or more Vehicles | 130 (3.3%) | 97 (3.0%) |
| Total | 3,999 (100.0%) | 3,224 (100.0%) |
Commute Time in Elk Plain
The most frequently occuring commute durations in Elk Plain are 30 to 34 minutes (1,373 commuters, 20.5%), 45 to 59 minutes (1,107 commuters, 16.5%), and 60 to 89 minutes (707 commuters, 10.6%).
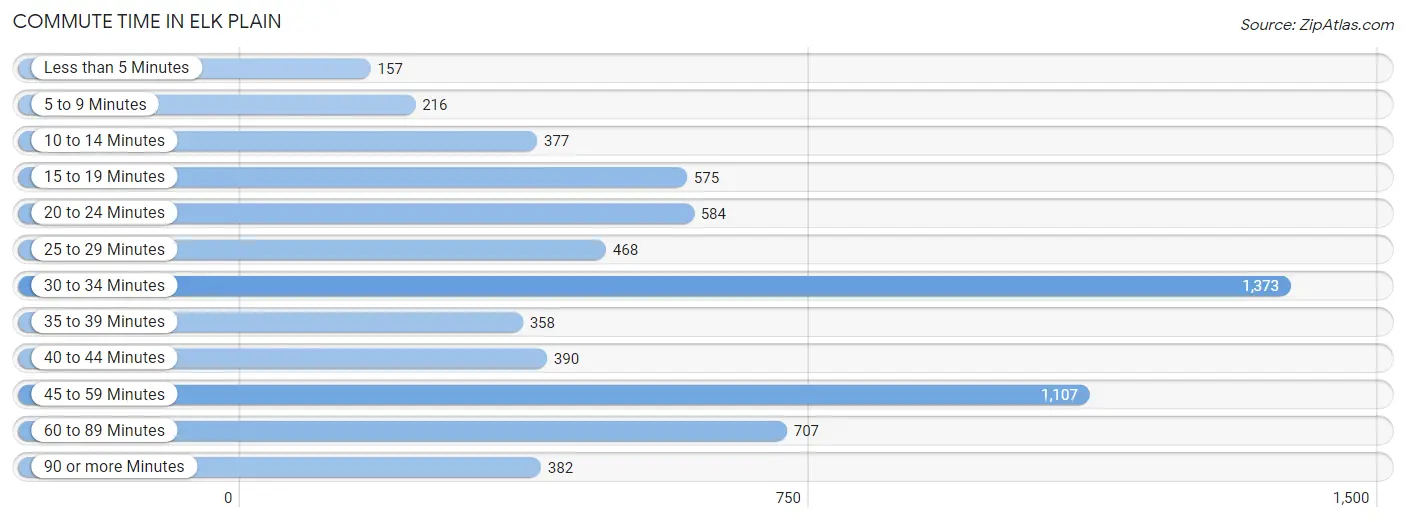
| Commute Time | # Commuters | % Commuters |
| Less than 5 Minutes | 157 | 2.4% |
| 5 to 9 Minutes | 216 | 3.2% |
| 10 to 14 Minutes | 377 | 5.6% |
| 15 to 19 Minutes | 575 | 8.6% |
| 20 to 24 Minutes | 584 | 8.7% |
| 25 to 29 Minutes | 468 | 7.0% |
| 30 to 34 Minutes | 1,373 | 20.5% |
| 35 to 39 Minutes | 358 | 5.3% |
| 40 to 44 Minutes | 390 | 5.8% |
| 45 to 59 Minutes | 1,107 | 16.5% |
| 60 to 89 Minutes | 707 | 10.6% |
| 90 or more Minutes | 382 | 5.7% |
Commute Time by Sex in Elk Plain
The most common commute times in Elk Plain are 45 to 59 minutes (697 commuters, 18.4%) for males and 30 to 34 minutes (731 commuters, 25.1%) for females.
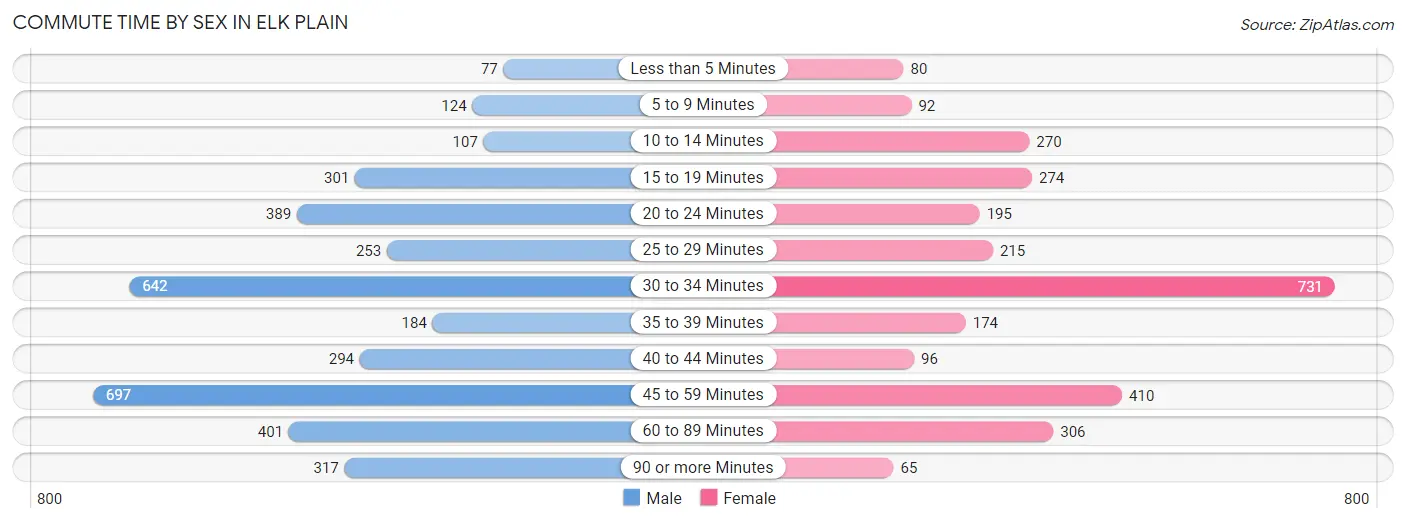
| Commute Time | Male | Female |
| Less than 5 Minutes | 77 (2.0%) | 80 (2.8%) |
| 5 to 9 Minutes | 124 (3.3%) | 92 (3.2%) |
| 10 to 14 Minutes | 107 (2.8%) | 270 (9.3%) |
| 15 to 19 Minutes | 301 (8.0%) | 274 (9.4%) |
| 20 to 24 Minutes | 389 (10.3%) | 195 (6.7%) |
| 25 to 29 Minutes | 253 (6.7%) | 215 (7.4%) |
| 30 to 34 Minutes | 642 (17.0%) | 731 (25.1%) |
| 35 to 39 Minutes | 184 (4.9%) | 174 (6.0%) |
| 40 to 44 Minutes | 294 (7.8%) | 96 (3.3%) |
| 45 to 59 Minutes | 697 (18.4%) | 410 (14.1%) |
| 60 to 89 Minutes | 401 (10.6%) | 306 (10.5%) |
| 90 or more Minutes | 317 (8.4%) | 65 (2.2%) |
Time of Departure to Work by Sex in Elk Plain
The most frequent times of departure to work in Elk Plain are 12:00 AM to 4:59 AM (677, 17.9%) for males and 7:30 AM to 7:59 AM (720, 24.8%) for females.
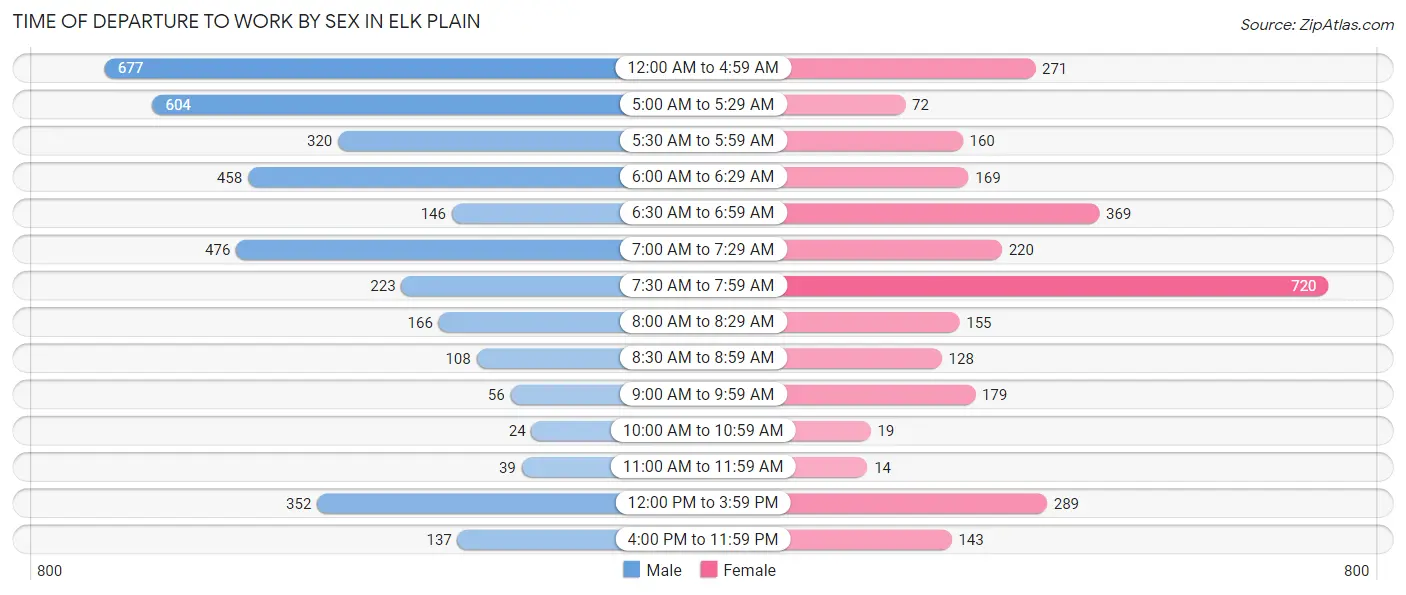
| Time of Departure | Male | Female |
| 12:00 AM to 4:59 AM | 677 (17.9%) | 271 (9.3%) |
| 5:00 AM to 5:29 AM | 604 (16.0%) | 72 (2.5%) |
| 5:30 AM to 5:59 AM | 320 (8.5%) | 160 (5.5%) |
| 6:00 AM to 6:29 AM | 458 (12.1%) | 169 (5.8%) |
| 6:30 AM to 6:59 AM | 146 (3.9%) | 369 (12.7%) |
| 7:00 AM to 7:29 AM | 476 (12.6%) | 220 (7.6%) |
| 7:30 AM to 7:59 AM | 223 (5.9%) | 720 (24.8%) |
| 8:00 AM to 8:29 AM | 166 (4.4%) | 155 (5.3%) |
| 8:30 AM to 8:59 AM | 108 (2.9%) | 128 (4.4%) |
| 9:00 AM to 9:59 AM | 56 (1.5%) | 179 (6.2%) |
| 10:00 AM to 10:59 AM | 24 (0.6%) | 19 (0.6%) |
| 11:00 AM to 11:59 AM | 39 (1.0%) | 14 (0.5%) |
| 12:00 PM to 3:59 PM | 352 (9.3%) | 289 (9.9%) |
| 4:00 PM to 11:59 PM | 137 (3.6%) | 143 (4.9%) |
| Total | 3,786 (100.0%) | 2,908 (100.0%) |
Housing Occupancy in Elk Plain
Occupancy by Ownership in Elk Plain
Of the total 4,935 dwellings in Elk Plain, owner-occupied units account for 4,137 (83.8%), while renter-occupied units make up 798 (16.2%).
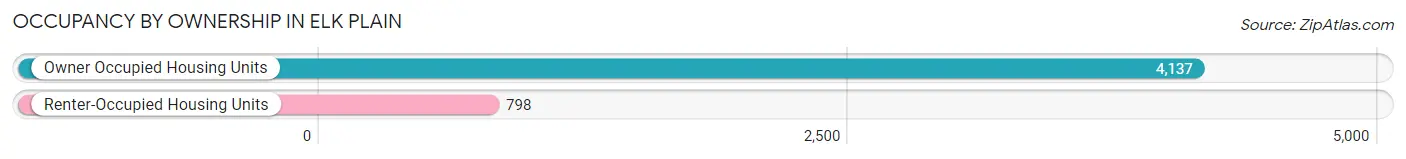
| Occupancy | # Housing Units | % Housing Units |
| Owner Occupied Housing Units | 4,137 | 83.8% |
| Renter-Occupied Housing Units | 798 | 16.2% |
| Total Occupied Housing Units | 4,935 | 100.0% |
Occupancy by Household Size in Elk Plain
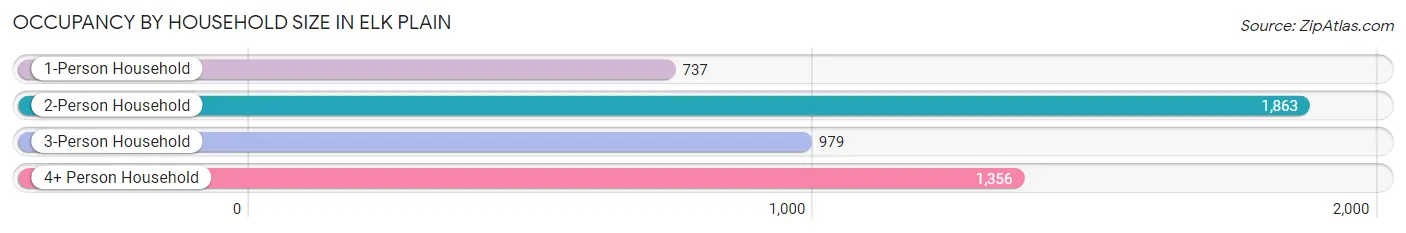
| Household Size | # Housing Units | % Housing Units |
| 1-Person Household | 737 | 14.9% |
| 2-Person Household | 1,863 | 37.8% |
| 3-Person Household | 979 | 19.8% |
| 4+ Person Household | 1,356 | 27.5% |
| Total Housing Units | 4,935 | 100.0% |
Occupancy by Ownership by Household Size in Elk Plain
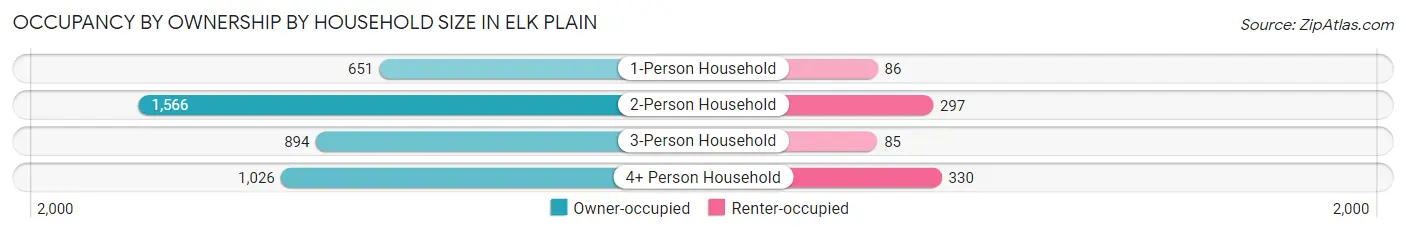
| Household Size | Owner-occupied | Renter-occupied |
| 1-Person Household | 651 (88.3%) | 86 (11.7%) |
| 2-Person Household | 1,566 (84.1%) | 297 (15.9%) |
| 3-Person Household | 894 (91.3%) | 85 (8.7%) |
| 4+ Person Household | 1,026 (75.7%) | 330 (24.3%) |
| Total Housing Units | 4,137 (83.8%) | 798 (16.2%) |
Occupancy by Educational Attainment in Elk Plain
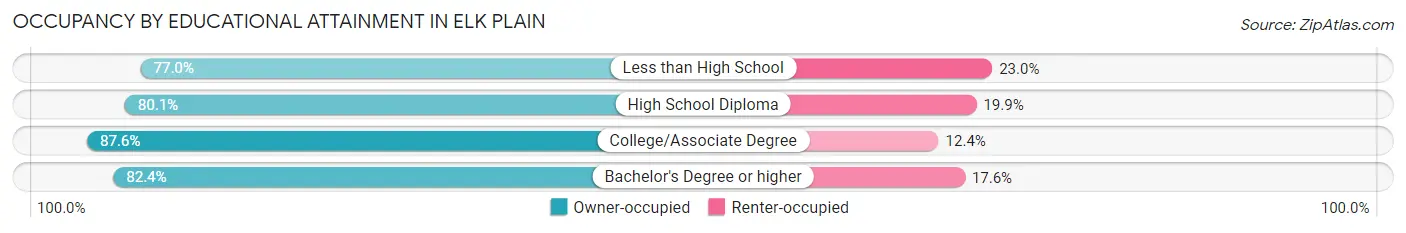
| Household Size | Owner-occupied | Renter-occupied |
| Less than High School | 174 (77.0%) | 52 (23.0%) |
| High School Diploma | 1,349 (80.1%) | 335 (19.9%) |
| College/Associate Degree | 2,043 (87.6%) | 289 (12.4%) |
| Bachelor's Degree or higher | 571 (82.4%) | 122 (17.6%) |
Occupancy by Age of Householder in Elk Plain
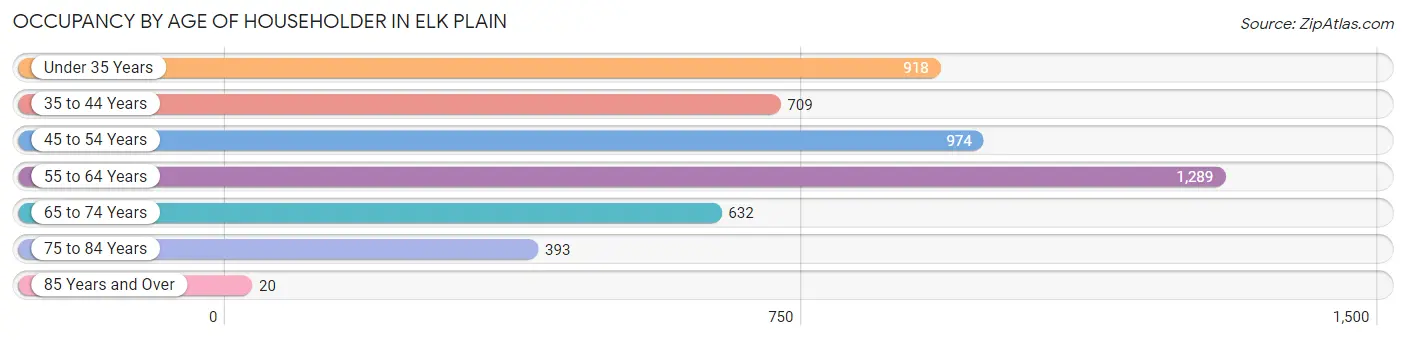
| Age Bracket | # Households | % Households |
| Under 35 Years | 918 | 18.6% |
| 35 to 44 Years | 709 | 14.4% |
| 45 to 54 Years | 974 | 19.7% |
| 55 to 64 Years | 1,289 | 26.1% |
| 65 to 74 Years | 632 | 12.8% |
| 75 to 84 Years | 393 | 8.0% |
| 85 Years and Over | 20 | 0.4% |
| Total | 4,935 | 100.0% |
Housing Finances in Elk Plain
Median Income by Occupancy in Elk Plain
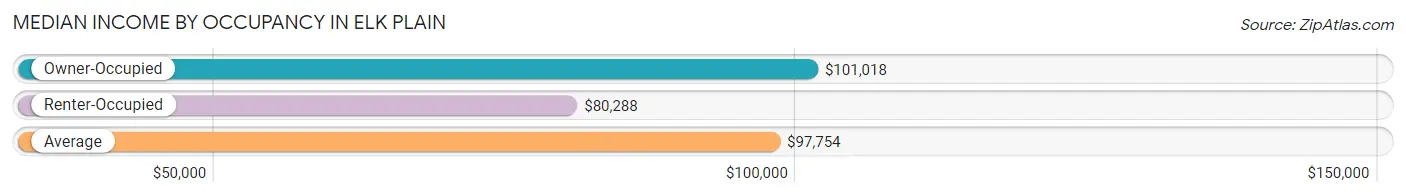
| Occupancy Type | # Households | Median Income |
| Owner-Occupied | 4,137 (83.8%) | $101,018 |
| Renter-Occupied | 798 (16.2%) | $80,288 |
| Average | 4,935 (100.0%) | $97,754 |
Occupancy by Householder Income Bracket in Elk Plain
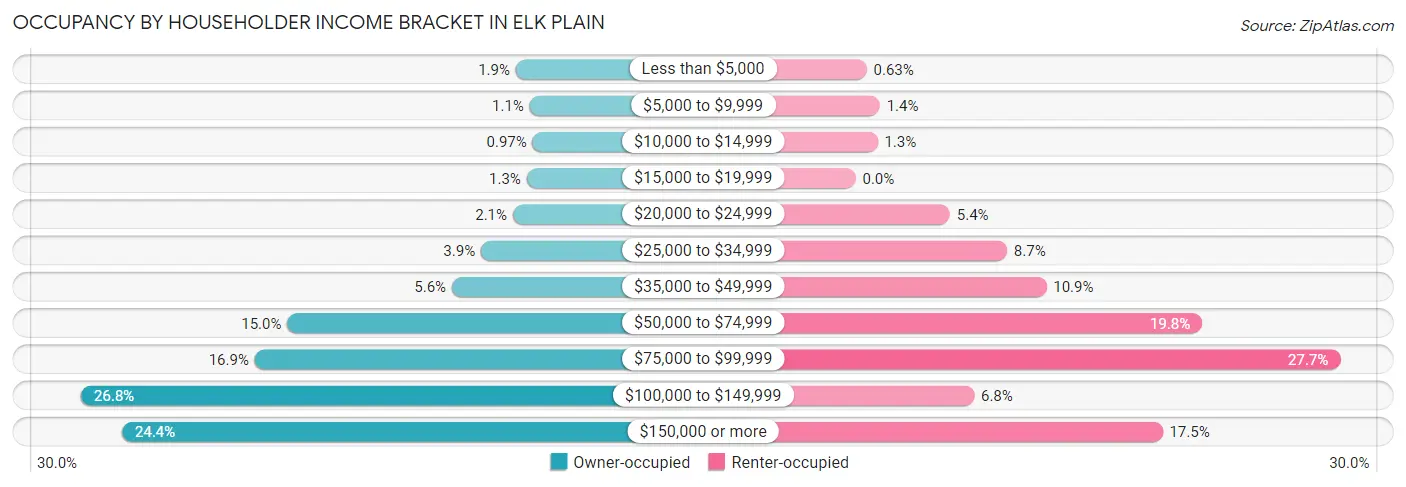
| Income Bracket | Owner-occupied | Renter-occupied |
| Less than $5,000 | 80 (1.9%) | 5 (0.6%) |
| $5,000 to $9,999 | 47 (1.1%) | 11 (1.4%) |
| $10,000 to $14,999 | 40 (1.0%) | 10 (1.3%) |
| $15,000 to $19,999 | 54 (1.3%) | 0 (0.0%) |
| $20,000 to $24,999 | 87 (2.1%) | 43 (5.4%) |
| $25,000 to $34,999 | 162 (3.9%) | 69 (8.6%) |
| $35,000 to $49,999 | 231 (5.6%) | 87 (10.9%) |
| $50,000 to $74,999 | 620 (15.0%) | 158 (19.8%) |
| $75,000 to $99,999 | 697 (16.9%) | 221 (27.7%) |
| $100,000 to $149,999 | 1,108 (26.8%) | 54 (6.8%) |
| $150,000 or more | 1,011 (24.4%) | 140 (17.5%) |
| Total | 4,137 (100.0%) | 798 (100.0%) |
Monthly Housing Cost Tiers in Elk Plain
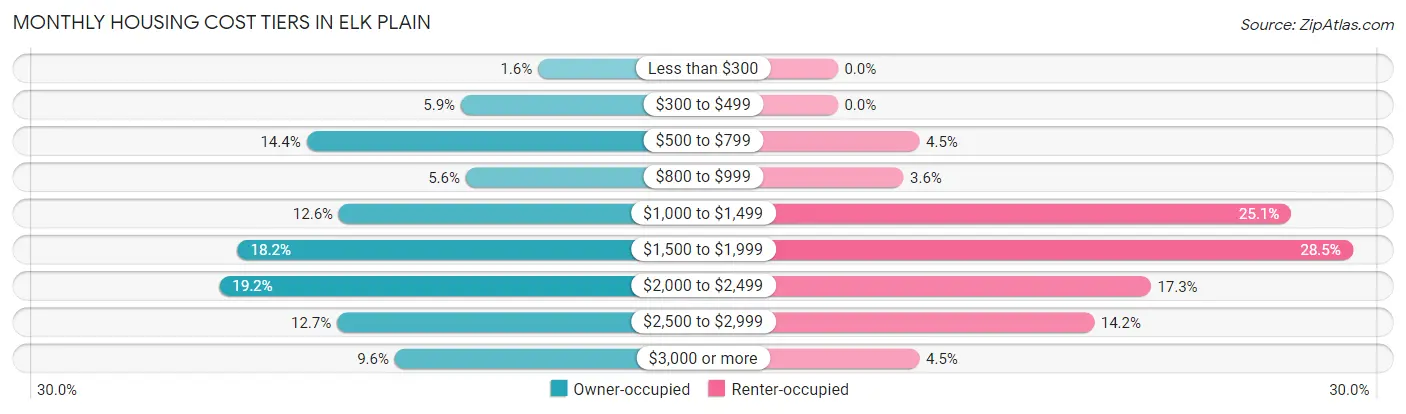
| Monthly Cost | Owner-occupied | Renter-occupied |
| Less than $300 | 68 (1.6%) | 0 (0.0%) |
| $300 to $499 | 244 (5.9%) | 0 (0.0%) |
| $500 to $799 | 597 (14.4%) | 36 (4.5%) |
| $800 to $999 | 233 (5.6%) | 29 (3.6%) |
| $1,000 to $1,499 | 523 (12.6%) | 200 (25.1%) |
| $1,500 to $1,999 | 754 (18.2%) | 227 (28.4%) |
| $2,000 to $2,499 | 796 (19.2%) | 138 (17.3%) |
| $2,500 to $2,999 | 527 (12.7%) | 113 (14.2%) |
| $3,000 or more | 395 (9.6%) | 36 (4.5%) |
| Total | 4,137 (100.0%) | 798 (100.0%) |
Physical Housing Characteristics in Elk Plain
Housing Structures in Elk Plain
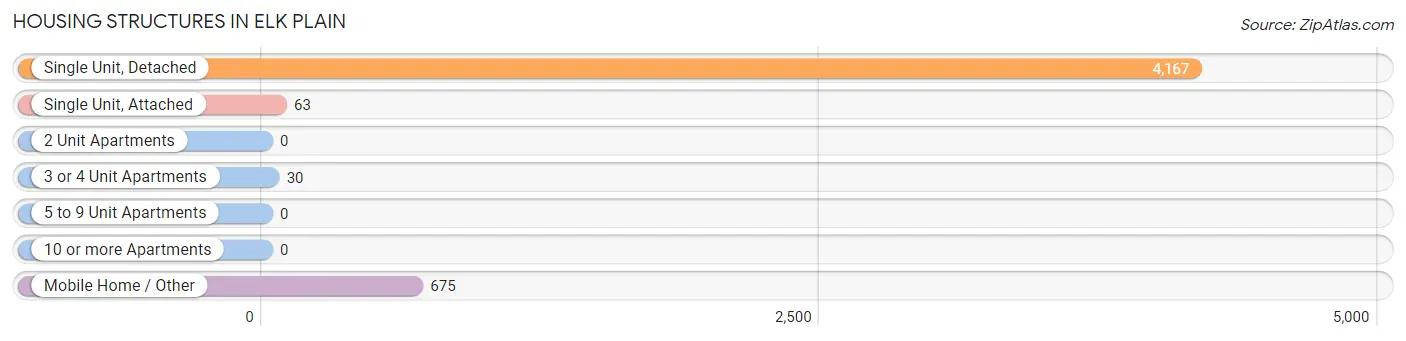
| Structure Type | # Housing Units | % Housing Units |
| Single Unit, Detached | 4,167 | 84.4% |
| Single Unit, Attached | 63 | 1.3% |
| 2 Unit Apartments | 0 | 0.0% |
| 3 or 4 Unit Apartments | 30 | 0.6% |
| 5 to 9 Unit Apartments | 0 | 0.0% |
| 10 or more Apartments | 0 | 0.0% |
| Mobile Home / Other | 675 | 13.7% |
| Total | 4,935 | 100.0% |
Housing Structures by Occupancy in Elk Plain
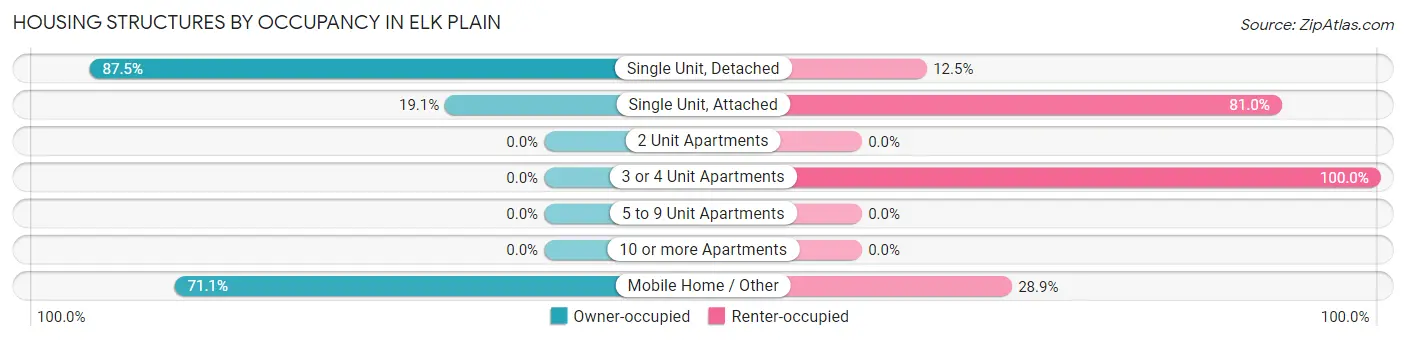
| Structure Type | Owner-occupied | Renter-occupied |
| Single Unit, Detached | 3,645 (87.5%) | 522 (12.5%) |
| Single Unit, Attached | 12 (19.1%) | 51 (80.9%) |
| 2 Unit Apartments | 0 (0.0%) | 0 (0.0%) |
| 3 or 4 Unit Apartments | 0 (0.0%) | 30 (100.0%) |
| 5 to 9 Unit Apartments | 0 (0.0%) | 0 (0.0%) |
| 10 or more Apartments | 0 (0.0%) | 0 (0.0%) |
| Mobile Home / Other | 480 (71.1%) | 195 (28.9%) |
| Total | 4,137 (83.8%) | 798 (16.2%) |
Housing Structures by Number of Rooms in Elk Plain
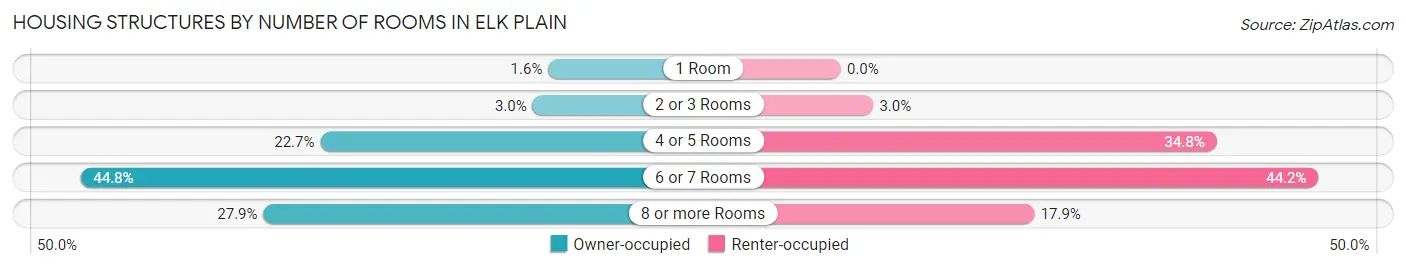
| Number of Rooms | Owner-occupied | Renter-occupied |
| 1 Room | 65 (1.6%) | 0 (0.0%) |
| 2 or 3 Rooms | 125 (3.0%) | 24 (3.0%) |
| 4 or 5 Rooms | 937 (22.7%) | 278 (34.8%) |
| 6 or 7 Rooms | 1,855 (44.8%) | 353 (44.2%) |
| 8 or more Rooms | 1,155 (27.9%) | 143 (17.9%) |
| Total | 4,137 (100.0%) | 798 (100.0%) |
Housing Structure by Heating Type in Elk Plain
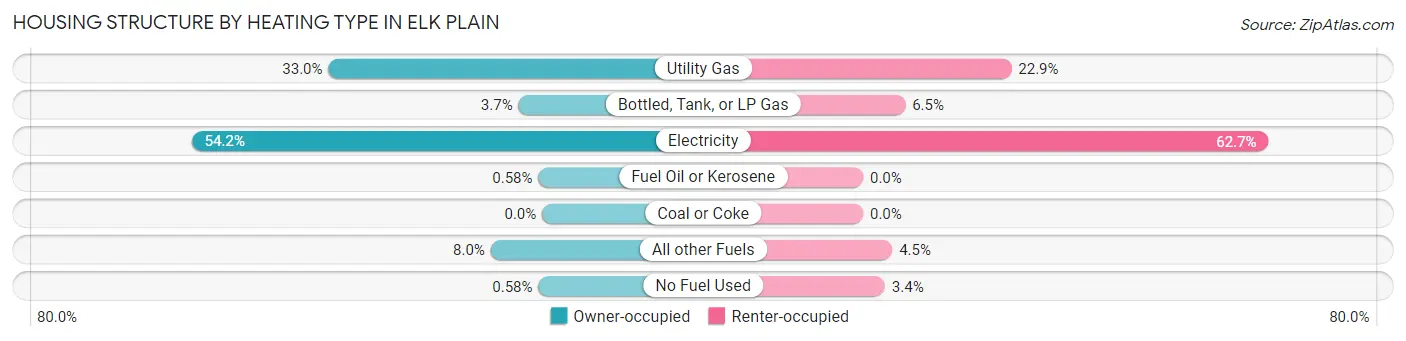
| Heating Type | Owner-occupied | Renter-occupied |
| Utility Gas | 1,367 (33.0%) | 183 (22.9%) |
| Bottled, Tank, or LP Gas | 151 (3.6%) | 52 (6.5%) |
| Electricity | 2,242 (54.2%) | 500 (62.7%) |
| Fuel Oil or Kerosene | 24 (0.6%) | 0 (0.0%) |
| Coal or Coke | 0 (0.0%) | 0 (0.0%) |
| All other Fuels | 329 (8.0%) | 36 (4.5%) |
| No Fuel Used | 24 (0.6%) | 27 (3.4%) |
| Total | 4,137 (100.0%) | 798 (100.0%) |
Household Vehicle Usage in Elk Plain
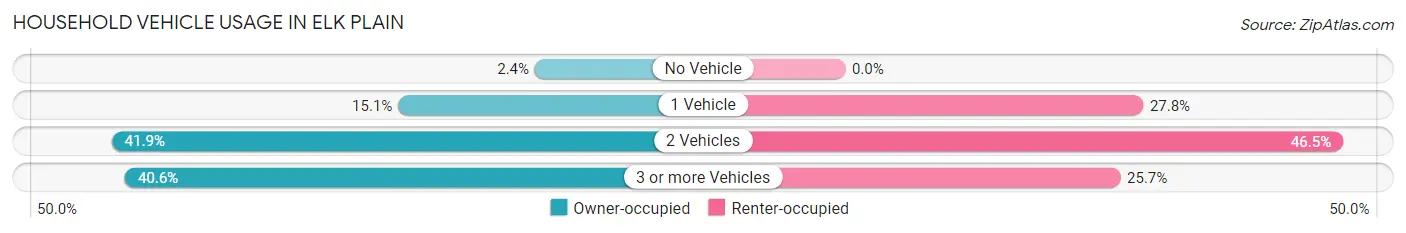
| Vehicles per Household | Owner-occupied | Renter-occupied |
| No Vehicle | 98 (2.4%) | 0 (0.0%) |
| 1 Vehicle | 626 (15.1%) | 222 (27.8%) |
| 2 Vehicles | 1,732 (41.9%) | 371 (46.5%) |
| 3 or more Vehicles | 1,681 (40.6%) | 205 (25.7%) |
| Total | 4,137 (100.0%) | 798 (100.0%) |
Real Estate & Mortgages in Elk Plain
Real Estate and Mortgage Overview in Elk Plain
| Characteristic | Without Mortgage | With Mortgage |
| Housing Units | 1,120 | 3,017 |
| Median Property Value | $367,600 | $409,700 |
| Median Household Income | $79,732 | $817 |
| Monthly Housing Costs | $696 | $395 |
| Real Estate Taxes | $3,904 | $104 |
Property Value by Mortgage Status in Elk Plain
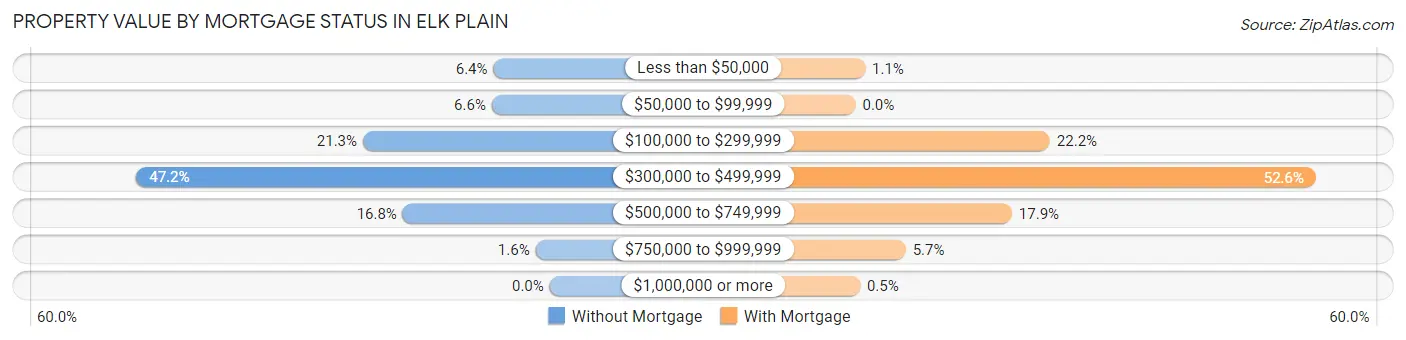
| Property Value | Without Mortgage | With Mortgage |
| Less than $50,000 | 72 (6.4%) | 33 (1.1%) |
| $50,000 to $99,999 | 74 (6.6%) | 0 (0.0%) |
| $100,000 to $299,999 | 239 (21.3%) | 670 (22.2%) |
| $300,000 to $499,999 | 529 (47.2%) | 1,587 (52.6%) |
| $500,000 to $749,999 | 188 (16.8%) | 539 (17.9%) |
| $750,000 to $999,999 | 18 (1.6%) | 173 (5.7%) |
| $1,000,000 or more | 0 (0.0%) | 15 (0.5%) |
| Total | 1,120 (100.0%) | 3,017 (100.0%) |
Household Income by Mortgage Status in Elk Plain
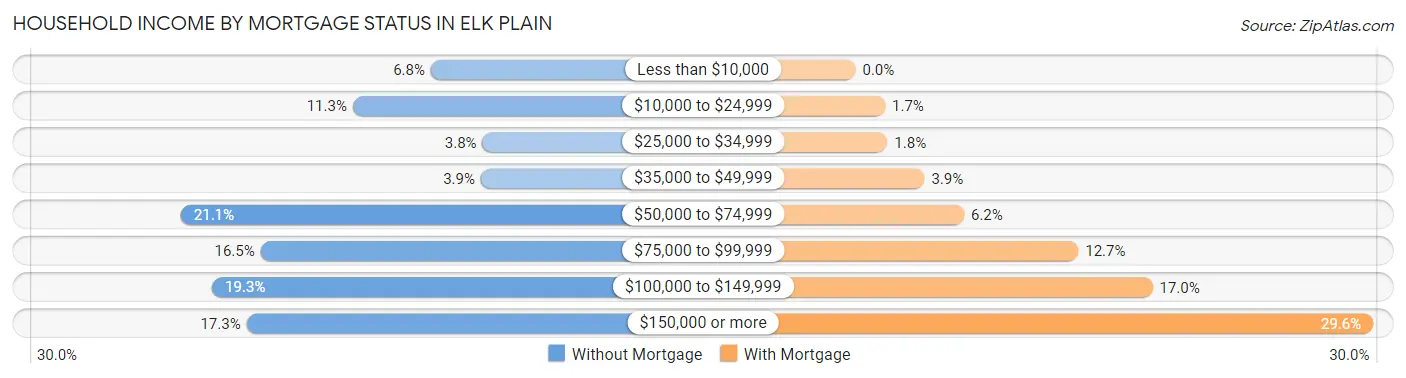
| Household Income | Without Mortgage | With Mortgage |
| Less than $10,000 | 76 (6.8%) | 0 (0.0%) |
| $10,000 to $24,999 | 126 (11.3%) | 51 (1.7%) |
| $25,000 to $34,999 | 43 (3.8%) | 55 (1.8%) |
| $35,000 to $49,999 | 44 (3.9%) | 119 (3.9%) |
| $50,000 to $74,999 | 236 (21.1%) | 187 (6.2%) |
| $75,000 to $99,999 | 185 (16.5%) | 384 (12.7%) |
| $100,000 to $149,999 | 216 (19.3%) | 512 (17.0%) |
| $150,000 or more | 194 (17.3%) | 892 (29.6%) |
| Total | 1,120 (100.0%) | 3,017 (100.0%) |
Property Value to Household Income Ratio in Elk Plain
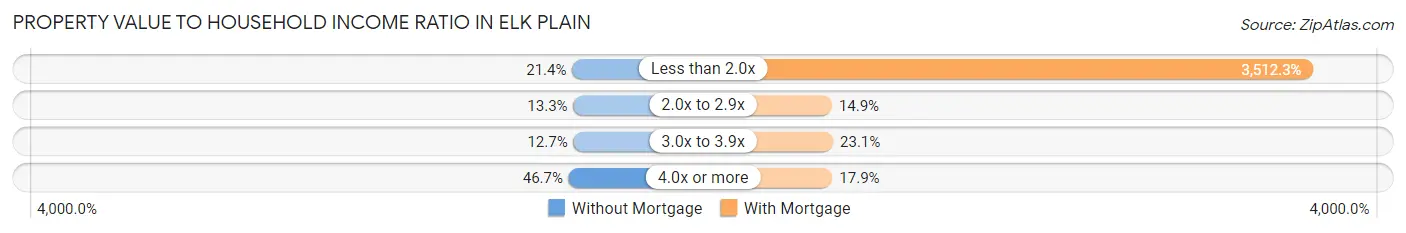
| Value-to-Income Ratio | Without Mortgage | With Mortgage |
| Less than 2.0x | 240 (21.4%) | 105,966 (3,512.3%) |
| 2.0x to 2.9x | 149 (13.3%) | 449 (14.9%) |
| 3.0x to 3.9x | 142 (12.7%) | 697 (23.1%) |
| 4.0x or more | 523 (46.7%) | 540 (17.9%) |
| Total | 1,120 (100.0%) | 3,017 (100.0%) |
Real Estate Taxes by Mortgage Status in Elk Plain
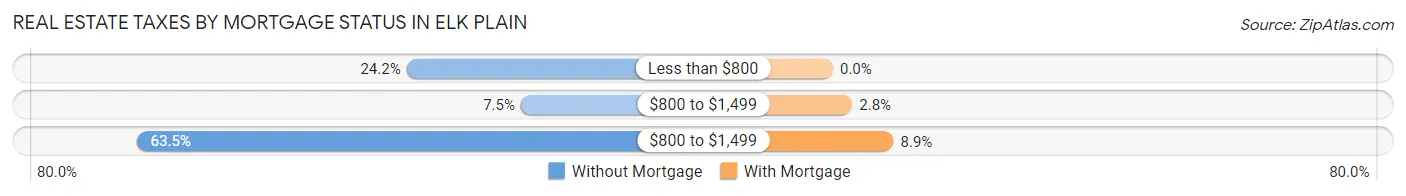
| Property Taxes | Without Mortgage | With Mortgage |
| Less than $800 | 271 (24.2%) | 0 (0.0%) |
| $800 to $1,499 | 84 (7.5%) | 85 (2.8%) |
| $800 to $1,499 | 711 (63.5%) | 267 (8.8%) |
| Total | 1,120 (100.0%) | 3,017 (100.0%) |
Health & Disability in Elk Plain
Health Insurance Coverage by Age in Elk Plain
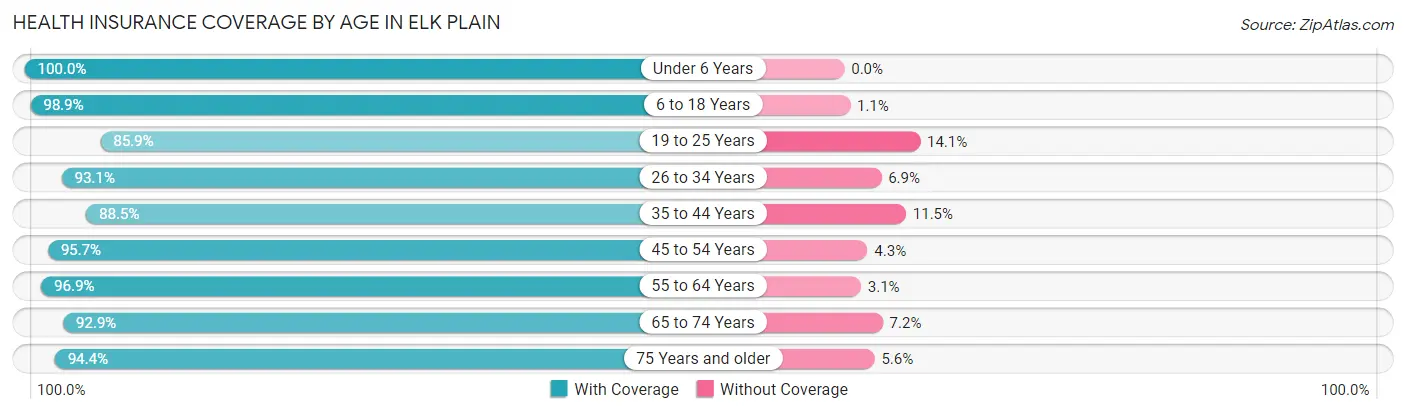
| Age Bracket | With Coverage | Without Coverage |
| Under 6 Years | 855 (100.0%) | 0 (0.0%) |
| 6 to 18 Years | 2,321 (98.9%) | 25 (1.1%) |
| 19 to 25 Years | 797 (85.9%) | 131 (14.1%) |
| 26 to 34 Years | 2,069 (93.1%) | 153 (6.9%) |
| 35 to 44 Years | 1,457 (88.5%) | 189 (11.5%) |
| 45 to 54 Years | 1,730 (95.7%) | 78 (4.3%) |
| 55 to 64 Years | 2,290 (96.9%) | 73 (3.1%) |
| 65 to 74 Years | 1,091 (92.8%) | 84 (7.1%) |
| 75 Years and older | 687 (94.4%) | 41 (5.6%) |
| Total | 13,297 (94.5%) | 774 (5.5%) |
Health Insurance Coverage by Citizenship Status in Elk Plain
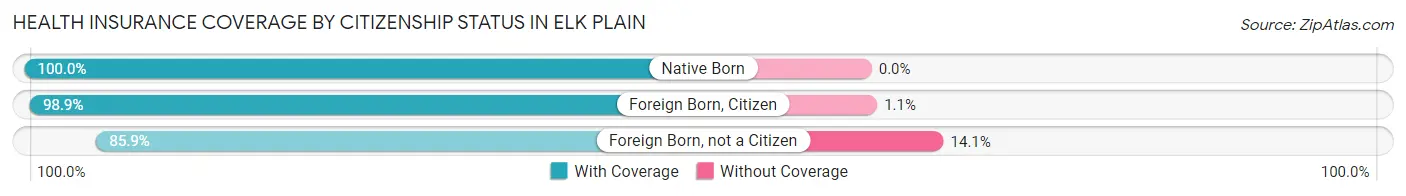
| Citizenship Status | With Coverage | Without Coverage |
| Native Born | 855 (100.0%) | 0 (0.0%) |
| Foreign Born, Citizen | 2,321 (98.9%) | 25 (1.1%) |
| Foreign Born, not a Citizen | 797 (85.9%) | 131 (14.1%) |
Health Insurance Coverage by Household Income in Elk Plain
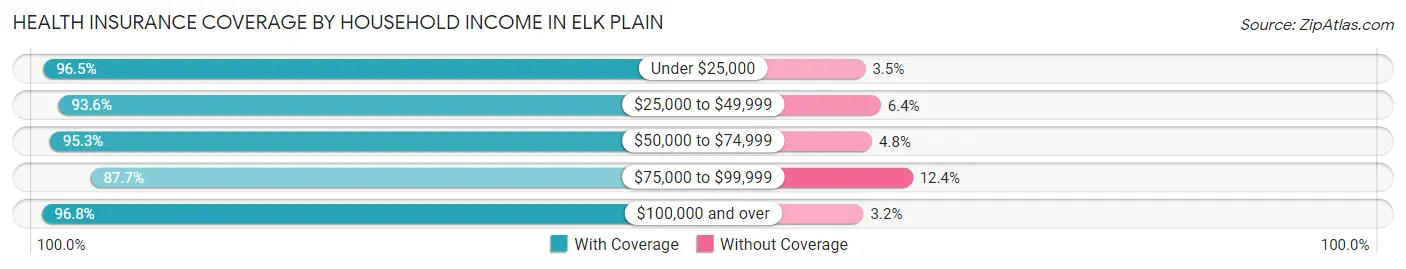
| Household Income | With Coverage | Without Coverage |
| Under $25,000 | 552 (96.5%) | 20 (3.5%) |
| $25,000 to $49,999 | 1,409 (93.6%) | 96 (6.4%) |
| $50,000 to $74,999 | 1,905 (95.3%) | 95 (4.8%) |
| $75,000 to $99,999 | 2,350 (87.6%) | 331 (12.3%) |
| $100,000 and over | 7,051 (96.8%) | 230 (3.2%) |
Public vs Private Health Insurance Coverage by Age in Elk Plain
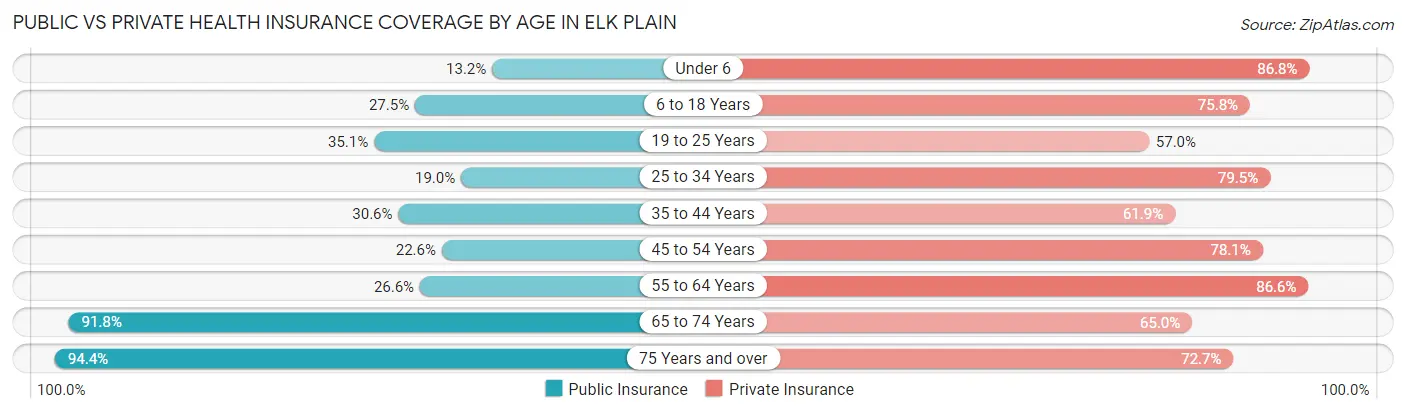
| Age Bracket | Public Insurance | Private Insurance |
| Under 6 | 113 (13.2%) | 742 (86.8%) |
| 6 to 18 Years | 646 (27.5%) | 1,777 (75.7%) |
| 19 to 25 Years | 326 (35.1%) | 529 (57.0%) |
| 25 to 34 Years | 422 (19.0%) | 1,766 (79.5%) |
| 35 to 44 Years | 504 (30.6%) | 1,018 (61.9%) |
| 45 to 54 Years | 408 (22.6%) | 1,412 (78.1%) |
| 55 to 64 Years | 629 (26.6%) | 2,046 (86.6%) |
| 65 to 74 Years | 1,079 (91.8%) | 764 (65.0%) |
| 75 Years and over | 687 (94.4%) | 529 (72.7%) |
| Total | 4,814 (34.2%) | 10,583 (75.2%) |
Disability Status by Sex by Age in Elk Plain
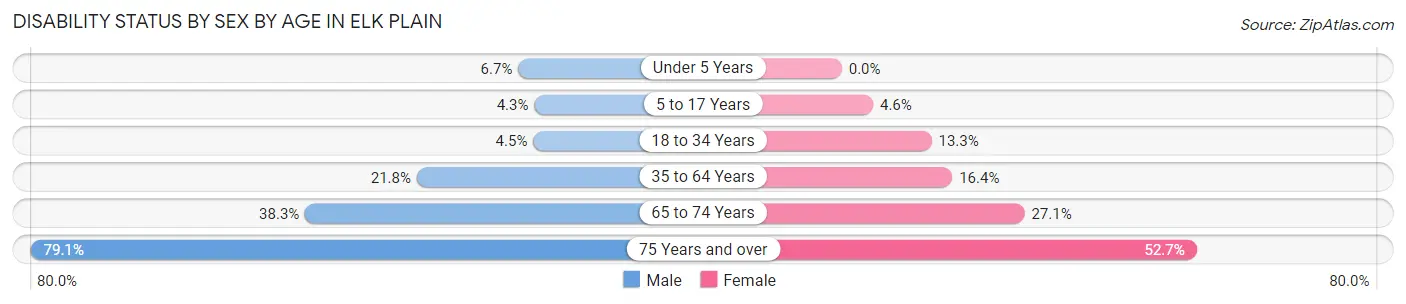
| Age Bracket | Male | Female |
| Under 5 Years | 27 (6.7%) | 0 (0.0%) |
| 5 to 17 Years | 40 (4.3%) | 68 (4.6%) |
| 18 to 34 Years | 73 (4.5%) | 216 (13.3%) |
| 35 to 64 Years | 674 (21.8%) | 446 (16.4%) |
| 65 to 74 Years | 189 (38.3%) | 185 (27.1%) |
| 75 Years and over | 280 (79.1%) | 197 (52.7%) |
Disability Class by Sex by Age in Elk Plain
Disability Class: Hearing Difficulty
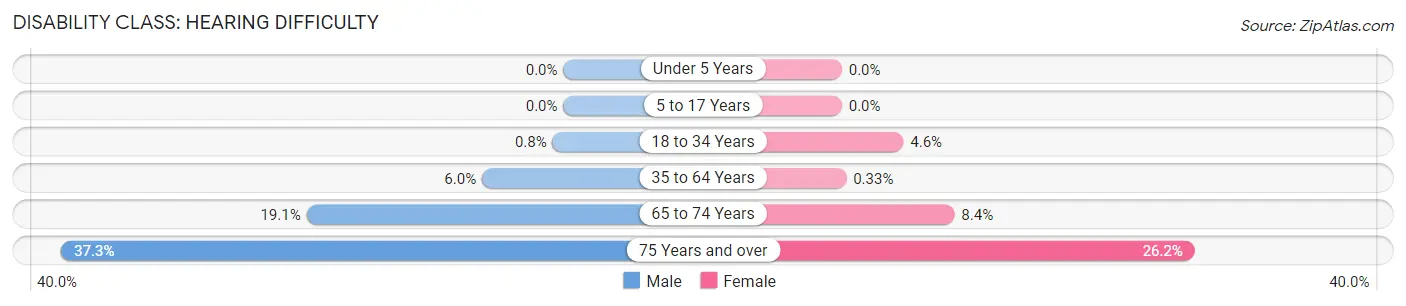
| Age Bracket | Male | Female |
| Under 5 Years | 0 (0.0%) | 0 (0.0%) |
| 5 to 17 Years | 0 (0.0%) | 0 (0.0%) |
| 18 to 34 Years | 13 (0.8%) | 74 (4.6%) |
| 35 to 64 Years | 187 (6.0%) | 9 (0.3%) |
| 65 to 74 Years | 94 (19.1%) | 57 (8.4%) |
| 75 Years and over | 132 (37.3%) | 98 (26.2%) |
Disability Class: Vision Difficulty
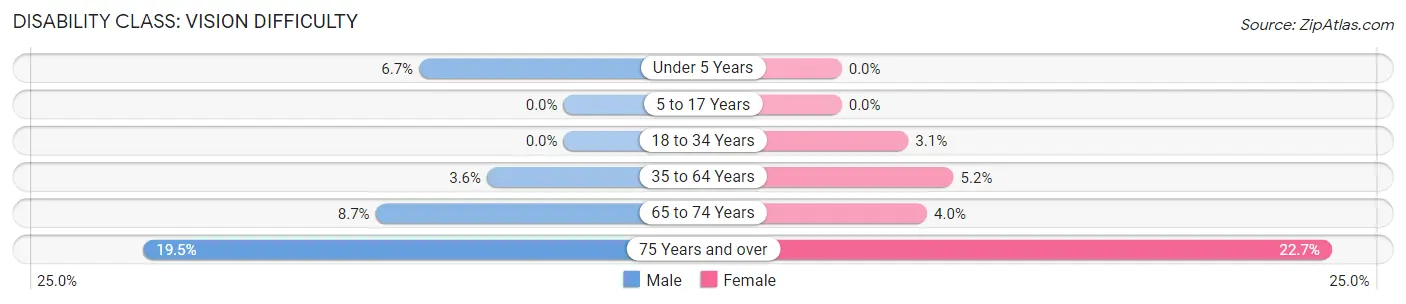
| Age Bracket | Male | Female |
| Under 5 Years | 27 (6.7%) | 0 (0.0%) |
| 5 to 17 Years | 0 (0.0%) | 0 (0.0%) |
| 18 to 34 Years | 0 (0.0%) | 50 (3.1%) |
| 35 to 64 Years | 110 (3.5%) | 141 (5.2%) |
| 65 to 74 Years | 43 (8.7%) | 27 (4.0%) |
| 75 Years and over | 69 (19.5%) | 85 (22.7%) |
Disability Class: Cognitive Difficulty
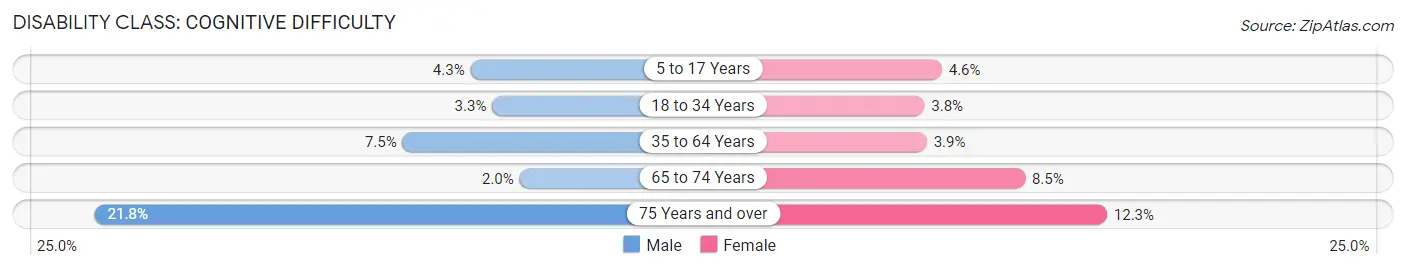
| Age Bracket | Male | Female |
| 5 to 17 Years | 40 (4.3%) | 68 (4.6%) |
| 18 to 34 Years | 54 (3.3%) | 62 (3.8%) |
| 35 to 64 Years | 231 (7.5%) | 107 (3.9%) |
| 65 to 74 Years | 10 (2.0%) | 58 (8.5%) |
| 75 Years and over | 77 (21.7%) | 46 (12.3%) |
Disability Class: Ambulatory Difficulty
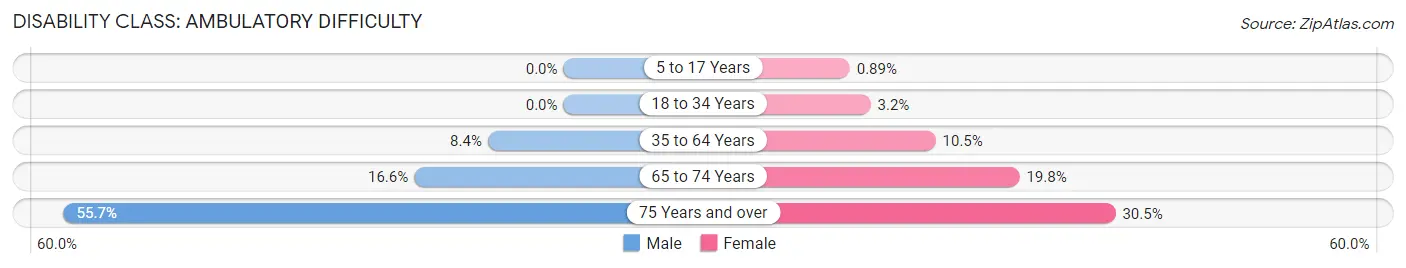
| Age Bracket | Male | Female |
| 5 to 17 Years | 0 (0.0%) | 13 (0.9%) |
| 18 to 34 Years | 0 (0.0%) | 52 (3.2%) |
| 35 to 64 Years | 261 (8.4%) | 284 (10.4%) |
| 65 to 74 Years | 82 (16.6%) | 135 (19.8%) |
| 75 Years and over | 197 (55.6%) | 114 (30.5%) |
Disability Class: Self-Care Difficulty
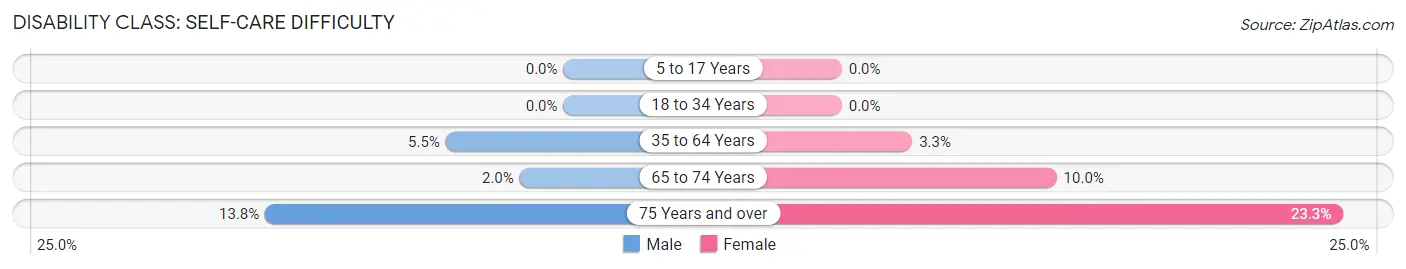
| Age Bracket | Male | Female |
| 5 to 17 Years | 0 (0.0%) | 0 (0.0%) |
| 18 to 34 Years | 0 (0.0%) | 0 (0.0%) |
| 35 to 64 Years | 169 (5.5%) | 89 (3.3%) |
| 65 to 74 Years | 10 (2.0%) | 68 (10.0%) |
| 75 Years and over | 49 (13.8%) | 87 (23.3%) |
Technology Access in Elk Plain
Computing Device Access in Elk Plain
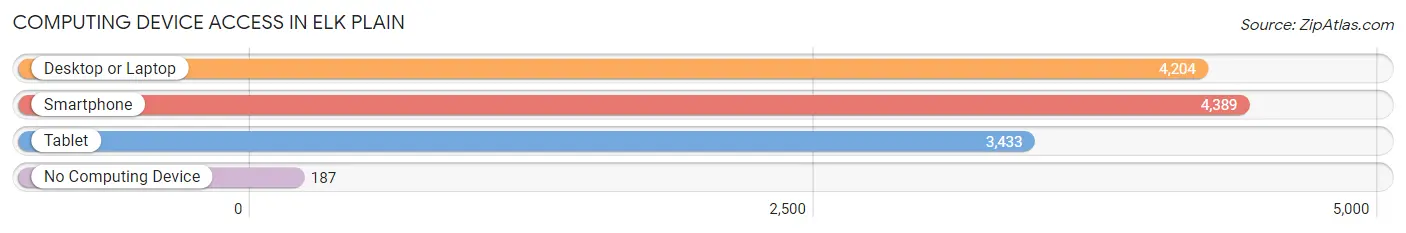
| Device Type | # Households | % Households |
| Desktop or Laptop | 4,204 | 85.2% |
| Smartphone | 4,389 | 88.9% |
| Tablet | 3,433 | 69.6% |
| No Computing Device | 187 | 3.8% |
| Total | 4,935 | 100.0% |
Internet Access in Elk Plain
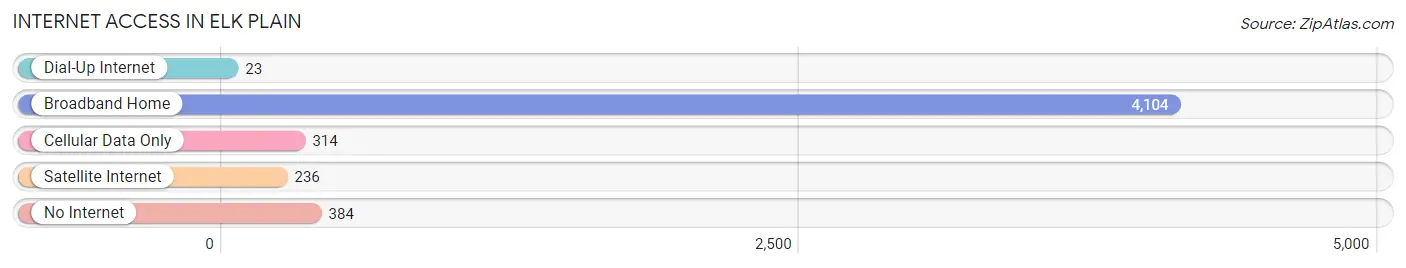
| Internet Type | # Households | % Households |
| Dial-Up Internet | 23 | 0.5% |
| Broadband Home | 4,104 | 83.2% |
| Cellular Data Only | 314 | 6.4% |
| Satellite Internet | 236 | 4.8% |
| No Internet | 384 | 7.8% |
| Total | 4,935 | 100.0% |
Elk Plain Summary
Elk Plain is a small unincorporated community located in Pierce County, Washington, United States. It is situated in the foothills of the Cascade Mountains, approximately 20 miles east of Tacoma and 30 miles south of Seattle. The population of Elk Plain was estimated to be 1,845 in 2019.
Geography
Elk Plain is located at 47°09'N 122°25'W. It is situated in the foothills of the Cascade Mountains, approximately 20 miles east of Tacoma and 30 miles south of Seattle. The area is characterized by rolling hills, forests, and wetlands. The nearby Nisqually River provides a source of recreation for the community.
Climate
Elk Plain has a temperate climate, with mild winters and warm summers. The average annual temperature is around 50°F (10°C). The average annual precipitation is around 40 inches (101 cm).
Demographics
As of the 2010 census, the population of Elk Plain was 1,845. The racial makeup of the town was 87.3% White, 5.2% Hispanic or Latino, 2.2% Asian, 1.2% African American, 0.7% Native American, and 3.4% from other races.
Economy
The economy of Elk Plain is largely based on agriculture and forestry. The area is home to several farms, as well as a number of timber companies. The town also has a small retail sector, with several small businesses located in the downtown area.
Education
Elk Plain is served by the Bethel School District. The district operates two elementary schools, one middle school, and one high school. The district also operates a number of alternative education programs.
Transportation
Elk Plain is served by a number of local roads, as well as Interstate 5, which runs through the town. The nearest airport is Tacoma International Airport, located approximately 20 miles away.
Culture
Elk Plain is home to a number of cultural attractions, including the Nisqually National Wildlife Refuge, which is located just outside of town. The refuge is home to a variety of wildlife, including bald eagles, ospreys, and elk. The town also hosts a number of annual events, including the Elk Plain Festival, which is held each summer.
Conclusion
Elk Plain is a small unincorporated community located in Pierce County, Washington, United States. It is situated in the foothills of the Cascade Mountains, approximately 20 miles east of Tacoma and 30 miles south of Seattle. The population of Elk Plain was estimated to be 1,845 in 2019. The economy of Elk Plain is largely based on agriculture and forestry, and the town is served by the Bethel School District. Elk Plain is home to a number of cultural attractions, including the Nisqually National Wildlife Refuge, and hosts a number of annual events, including the Elk Plain Festival.
Common Questions
What is Per Capita Income in Elk Plain?
Per Capita income in Elk Plain is $40,416.
What is the Median Family Income in Elk Plain?
Median Family Income in Elk Plain is $103,508.
What is the Median Household income in Elk Plain?
Median Household Income in Elk Plain is $97,754.
What is Income or Wage Gap in Elk Plain?
Income or Wage Gap in Elk Plain is 41.8%.
Women in Elk Plain earn 58.2 cents for every dollar earned by a man.
What is Inequality or Gini Index in Elk Plain?
Inequality or Gini Index in Elk Plain is 0.38.
What is the Total Population of Elk Plain?
Total Population of Elk Plain is 14,224.
What is the Total Male Population of Elk Plain?
Total Male Population of Elk Plain is 7,023.
What is the Total Female Population of Elk Plain?
Total Female Population of Elk Plain is 7,201.
What is the Ratio of Males per 100 Females in Elk Plain?
There are 97.53 Males per 100 Females in Elk Plain.
What is the Ratio of Females per 100 Males in Elk Plain?
There are 102.53 Females per 100 Males in Elk Plain.
What is the Median Population Age in Elk Plain?
Median Population Age in Elk Plain is 38.6 Years.
What is the Average Family Size in Elk Plain
Average Family Size in Elk Plain is 3.2 People.
What is the Average Household Size in Elk Plain
Average Household Size in Elk Plain is 2.9 People.
How Large is the Labor Force in Elk Plain?
There are 7,700 People in the Labor Forcein in Elk Plain.
What is the Percentage of People in the Labor Force in Elk Plain?
67.3% of People are in the Labor Force in Elk Plain.
What is the Unemployment Rate in Elk Plain?
Unemployment Rate in Elk Plain is 4.2%.