Golden Triangle, NJ Map & Demographics
Golden Triangle Map
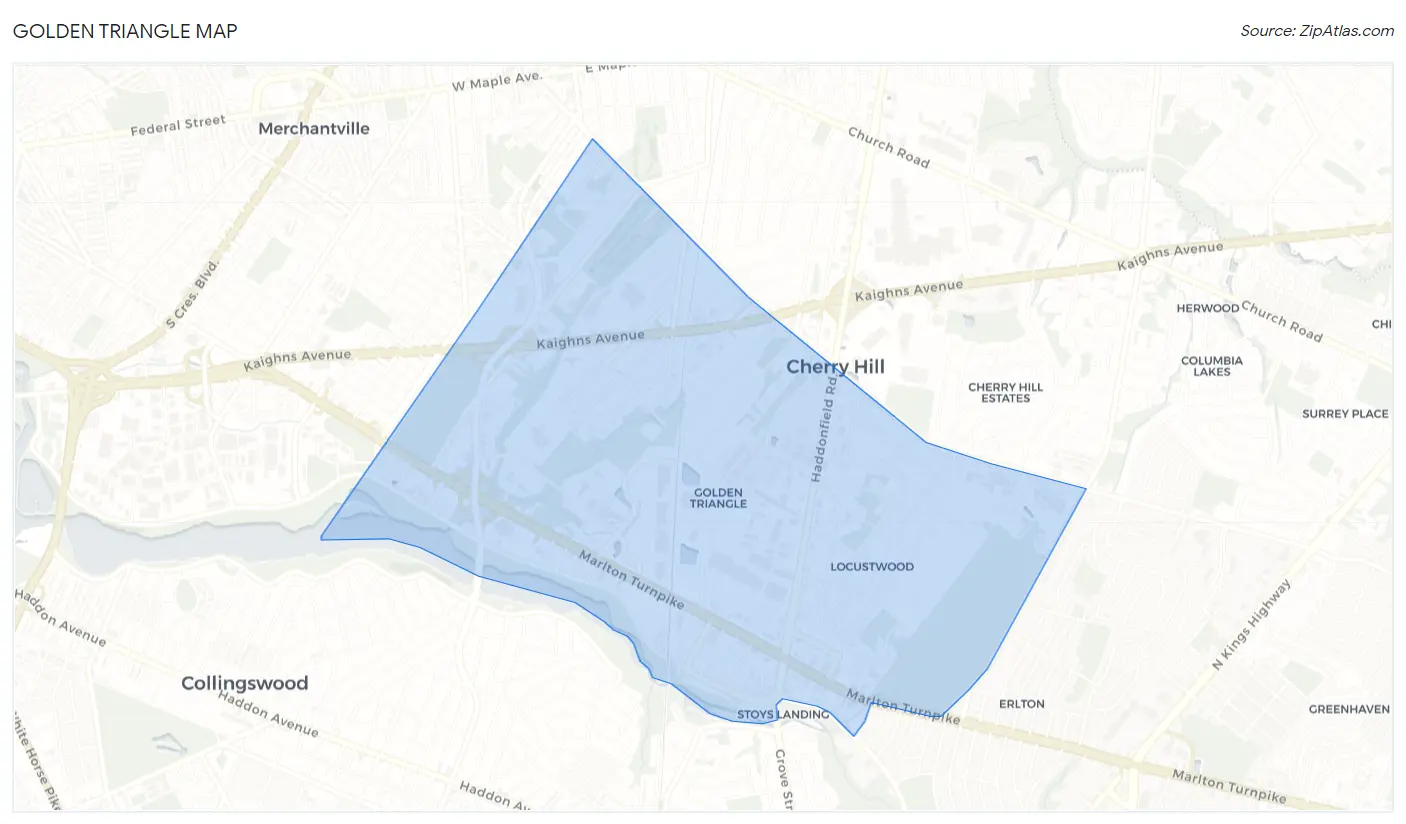
Golden Triangle Overview
$60,604
PER CAPITA INCOME
$103,031
AVG FAMILY INCOME
$103,664
AVG HOUSEHOLD INCOME
33.2%
WAGE / INCOME GAP [ % ]
66.8¢/ $1
WAGE / INCOME GAP [ $ ]
0.50
INEQUALITY / GINI INDEX
4,960
TOTAL POPULATION
2,414
MALE POPULATION
2,546
FEMALE POPULATION
94.82
MALES / 100 FEMALES
105.47
FEMALES / 100 MALES
47.2
MEDIAN AGE
2.9
AVG FAMILY SIZE
2.3
AVG HOUSEHOLD SIZE
2,762
LABOR FORCE [ PEOPLE ]
63.9%
PERCENT IN LABOR FORCE
4.3%
UNEMPLOYMENT RATE
Income in Golden Triangle
Income Overview in Golden Triangle
Per Capita Income in Golden Triangle is $60,604, while median incomes of families and households are $103,031 and $103,664 respectively.
| Characteristic | Number | Measure |
| Per Capita Income | 4,960 | $60,604 |
| Median Family Income | 1,266 | $103,031 |
| Mean Family Income | 1,266 | $145,103 |
| Median Household Income | 2,109 | $103,664 |
| Mean Household Income | 2,109 | $141,593 |
| Income Deficit | 1,266 | $0 |
| Wage / Income Gap (%) | 4,960 | 33.21% |
| Wage / Income Gap ($) | 4,960 | 66.79¢ per $1 |
| Gini / Inequality Index | 4,960 | 0.50 |
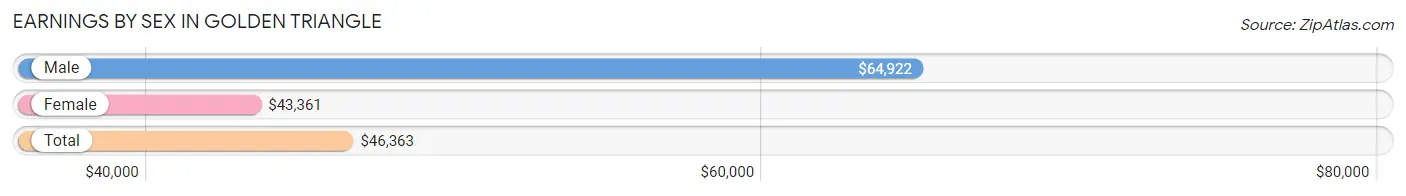
Earnings by Sex in Golden Triangle
Average Earnings in Golden Triangle are $46,363, $64,922 for men and $43,361 for women, a difference of 33.2%.
| Sex | Number | Average Earnings |
| Male | 1,371 (48.0%) | $64,922 |
| Female | 1,484 (52.0%) | $43,361 |
| Total | 2,855 (100.0%) | $46,363 |
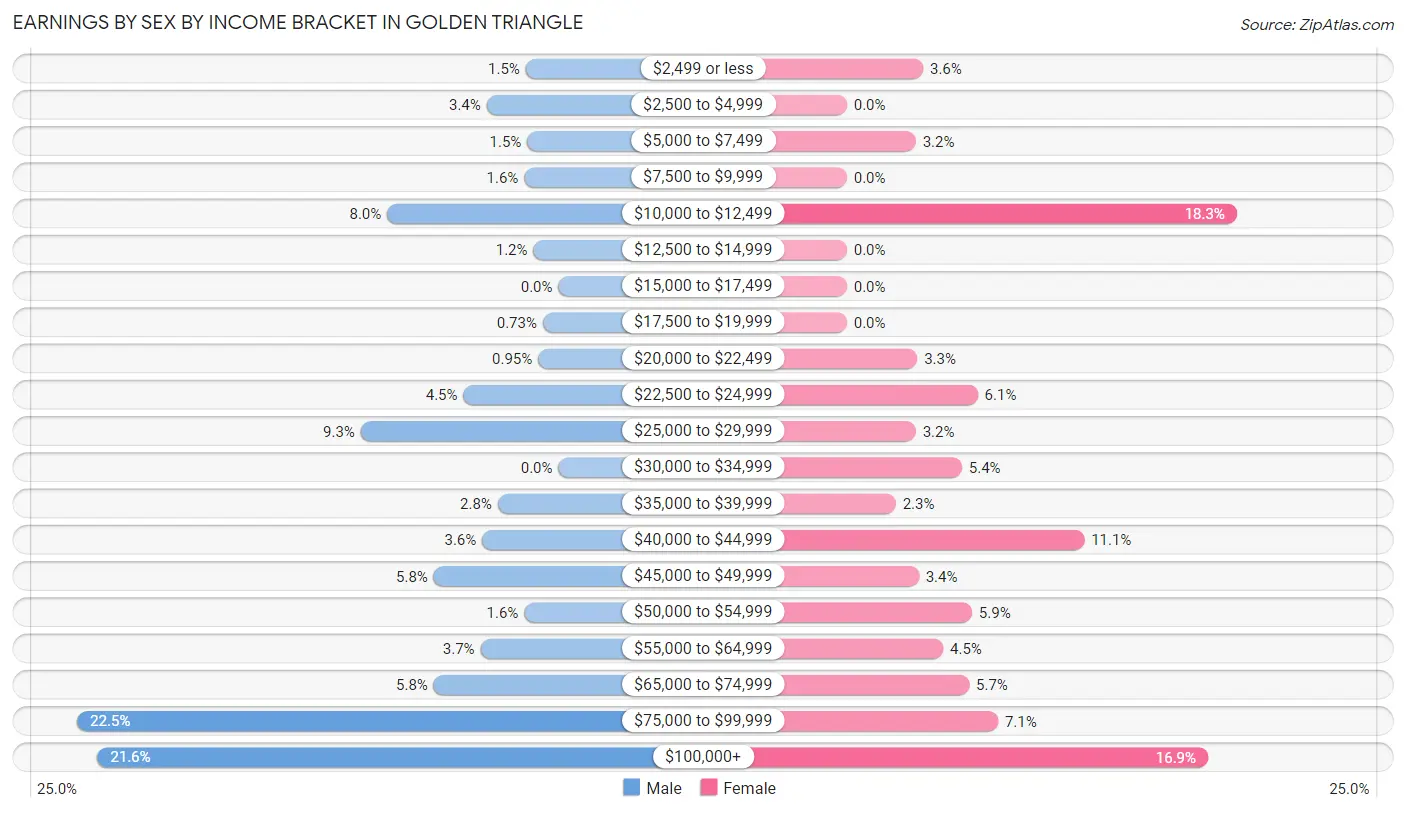
Earnings by Sex by Income Bracket in Golden Triangle
The most common earnings brackets in Golden Triangle are $75,000 to $99,999 for men (309 | 22.5%) and $10,000 to $12,499 for women (271 | 18.3%).
| Income | Male | Female |
| $2,499 or less | 21 (1.5%) | 53 (3.6%) |
| $2,500 to $4,999 | 46 (3.4%) | 0 (0.0%) |
| $5,000 to $7,499 | 20 (1.5%) | 48 (3.2%) |
| $7,500 to $9,999 | 22 (1.6%) | 0 (0.0%) |
| $10,000 to $12,499 | 110 (8.0%) | 271 (18.3%) |
| $12,500 to $14,999 | 16 (1.2%) | 0 (0.0%) |
| $15,000 to $17,499 | 0 (0.0%) | 0 (0.0%) |
| $17,500 to $19,999 | 10 (0.7%) | 0 (0.0%) |
| $20,000 to $22,499 | 13 (0.9%) | 49 (3.3%) |
| $22,500 to $24,999 | 61 (4.4%) | 91 (6.1%) |
| $25,000 to $29,999 | 127 (9.3%) | 48 (3.2%) |
| $30,000 to $34,999 | 0 (0.0%) | 80 (5.4%) |
| $35,000 to $39,999 | 39 (2.8%) | 34 (2.3%) |
| $40,000 to $44,999 | 49 (3.6%) | 165 (11.1%) |
| $45,000 to $49,999 | 80 (5.8%) | 50 (3.4%) |
| $50,000 to $54,999 | 22 (1.6%) | 87 (5.9%) |
| $55,000 to $64,999 | 50 (3.6%) | 67 (4.5%) |
| $65,000 to $74,999 | 80 (5.8%) | 85 (5.7%) |
| $75,000 to $99,999 | 309 (22.5%) | 105 (7.1%) |
| $100,000+ | 296 (21.6%) | 251 (16.9%) |
| Total | 1,371 (100.0%) | 1,484 (100.0%) |
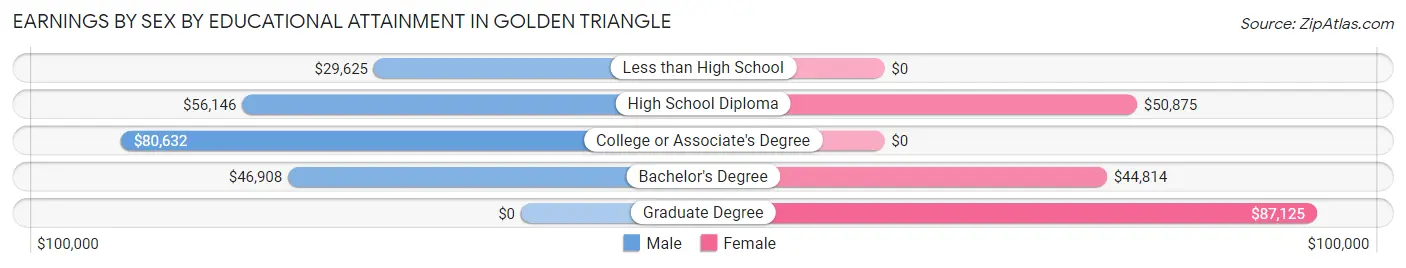
Earnings by Sex by Educational Attainment in Golden Triangle
Average earnings in Golden Triangle are $72,955 for men and $44,307 for women, a difference of 39.3%. Men with an educational attainment of college or associate's degree enjoy the highest average annual earnings of $80,632, while those with less than high school education earn the least with $29,625. Women with an educational attainment of graduate degree earn the most with the average annual earnings of $87,125, while those with bachelor's degree education have the smallest earnings of $44,814.
| Educational Attainment | Male Income | Female Income |
| Less than High School | $29,625 | $0 |
| High School Diploma | $56,146 | $50,875 |
| College or Associate's Degree | $80,632 | $0 |
| Bachelor's Degree | $46,908 | $44,814 |
| Graduate Degree | - | - |
| Total | $72,955 | $44,307 |
Family Income in Golden Triangle
Family Income Brackets in Golden Triangle
According to the Golden Triangle family income data, there are 365 families falling into the $100,000 to $149,999 income range, which is the most common income bracket and makes up 28.8% of all families.
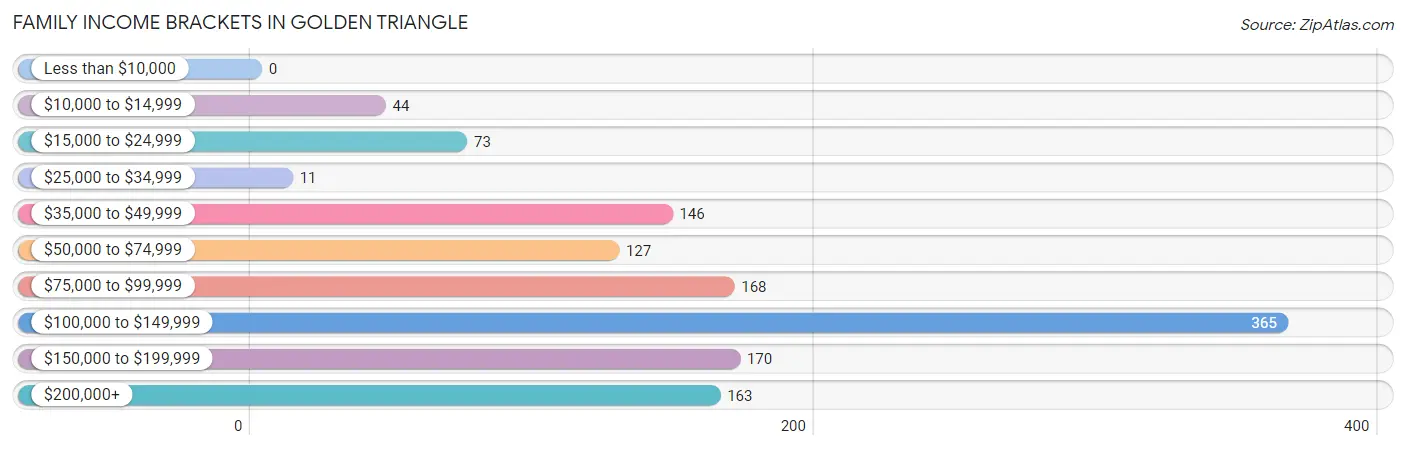
| Income Bracket | # Families | % Families |
| Less than $10,000 | 0 | 0.0% |
| $10,000 to $14,999 | 44 | 3.5% |
| $15,000 to $24,999 | 73 | 5.8% |
| $25,000 to $34,999 | 11 | 0.9% |
| $35,000 to $49,999 | 146 | 11.5% |
| $50,000 to $74,999 | 127 | 10.0% |
| $75,000 to $99,999 | 168 | 13.3% |
| $100,000 to $149,999 | 365 | 28.8% |
| $150,000 to $199,999 | 170 | 13.4% |
| $200,000+ | 163 | 12.9% |
Family Income by Famaliy Size in Golden Triangle
3-person families (299 | 23.6%) account for the highest median family income in Golden Triangle with $115,511 per family, while 2-person families (662 | 52.3%) have the highest median income of $47,032 per family member.
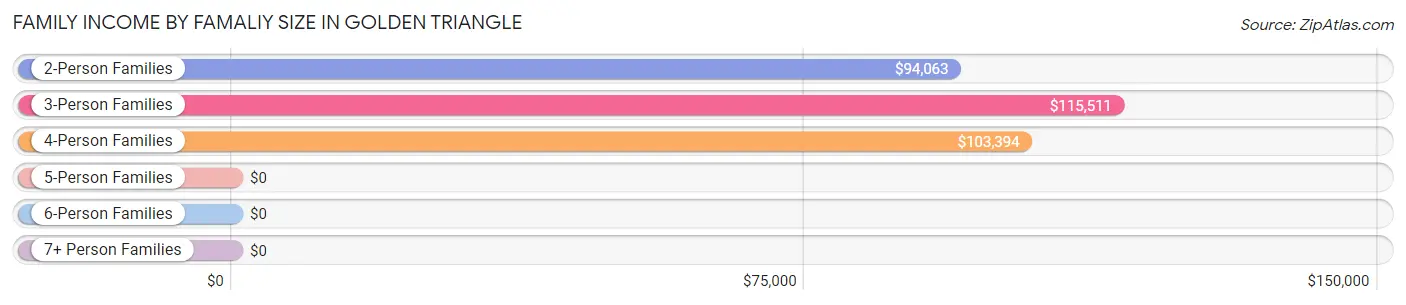
| Income Bracket | # Families | Median Income |
| 2-Person Families | 662 (52.3%) | $94,063 |
| 3-Person Families | 299 (23.6%) | $115,511 |
| 4-Person Families | 279 (22.0%) | $103,394 |
| 5-Person Families | 0 (0.0%) | $0 |
| 6-Person Families | 8 (0.6%) | $0 |
| 7+ Person Families | 18 (1.4%) | $0 |
| Total | 1,266 (100.0%) | $103,031 |
Family Income by Number of Earners in Golden Triangle
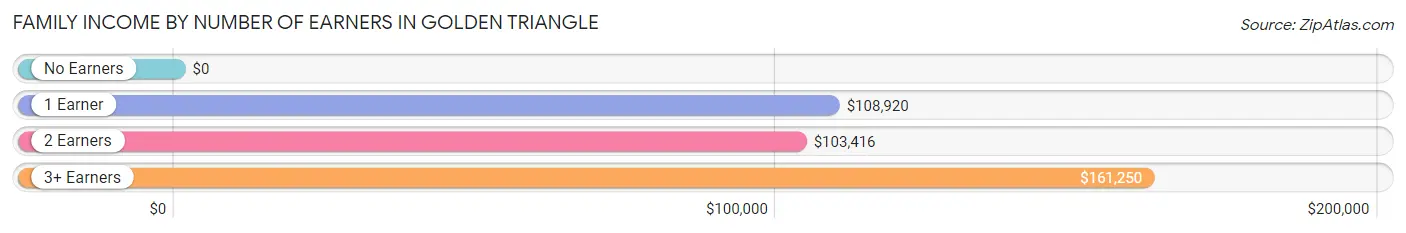
| Number of Earners | # Families | Median Income |
| No Earners | 182 (14.4%) | $0 |
| 1 Earner | 371 (29.3%) | $108,920 |
| 2 Earners | 595 (47.0%) | $103,416 |
| 3+ Earners | 118 (9.3%) | $161,250 |
| Total | 1,266 (100.0%) | $103,031 |
Household Income in Golden Triangle
Household Income Brackets in Golden Triangle
With 576 households falling in the category, the $100,000 to $149,999 income range is the most frequent in Golden Triangle, accounting for 27.3% of all households. In contrast, only 34 households (1.6%) fall into the $25,000 to $34,999 income bracket, making it the least populous group.
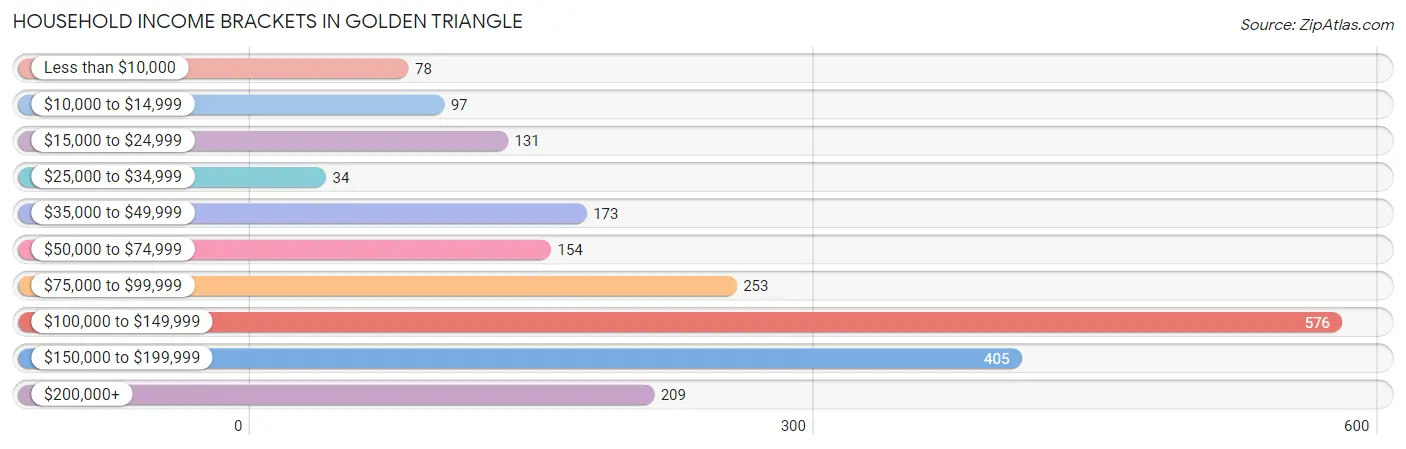
| Income Bracket | # Households | % Households |
| Less than $10,000 | 78 | 3.7% |
| $10,000 to $14,999 | 97 | 4.6% |
| $15,000 to $24,999 | 131 | 6.2% |
| $25,000 to $34,999 | 34 | 1.6% |
| $35,000 to $49,999 | 173 | 8.2% |
| $50,000 to $74,999 | 154 | 7.3% |
| $75,000 to $99,999 | 253 | 12.0% |
| $100,000 to $149,999 | 576 | 27.3% |
| $150,000 to $199,999 | 405 | 19.2% |
| $200,000+ | 209 | 9.9% |
Household Income by Householder Age in Golden Triangle
The median household income in Golden Triangle is $103,664, with the highest median household income of $140,321 found in the 25 to 44 years age bracket for the primary householder. A total of 538 households (25.5%) fall into this category.
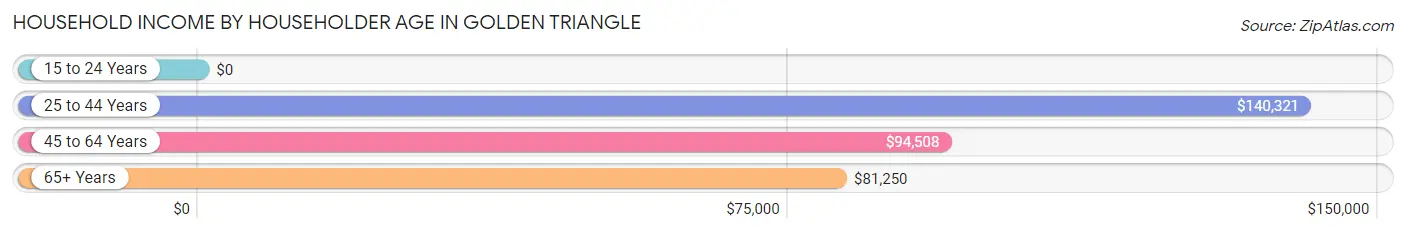
| Income Bracket | # Households | Median Income |
| 15 to 24 Years | 0 (0.0%) | $0 |
| 25 to 44 Years | 538 (25.5%) | $140,321 |
| 45 to 64 Years | 833 (39.5%) | $94,508 |
| 65+ Years | 738 (35.0%) | $81,250 |
| Total | 2,109 (100.0%) | $103,664 |
Poverty in Golden Triangle
Income Below Poverty by Sex and Age in Golden Triangle
With 5.7% poverty level for males and 6.7% for females among the residents of Golden Triangle, 18 to 24 year old males and 75 year old and over females are the most vulnerable to poverty, with 20 males (16.1%) and 65 females (34.0%) in their respective age groups living below the poverty level.
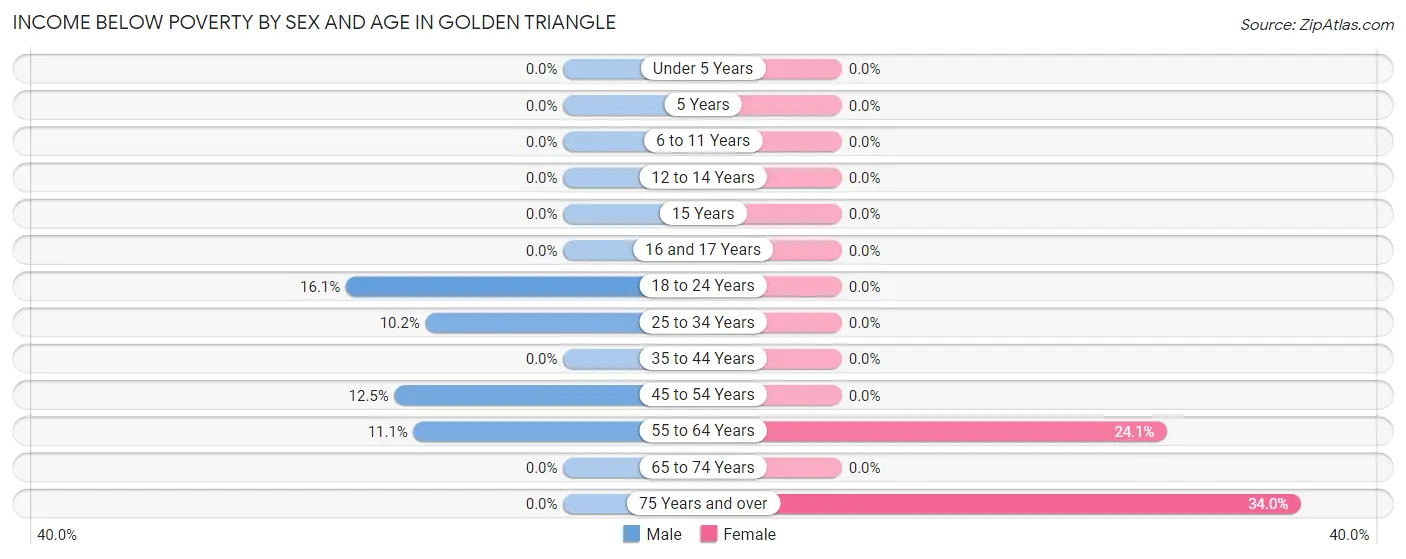
| Age Bracket | Male | Female |
| Under 5 Years | 0 (0.0%) | 0 (0.0%) |
| 5 Years | 0 (0.0%) | 0 (0.0%) |
| 6 to 11 Years | 0 (0.0%) | 0 (0.0%) |
| 12 to 14 Years | 0 (0.0%) | 0 (0.0%) |
| 15 Years | 0 (0.0%) | 0 (0.0%) |
| 16 and 17 Years | 0 (0.0%) | 0 (0.0%) |
| 18 to 24 Years | 20 (16.1%) | 0 (0.0%) |
| 25 to 34 Years | 41 (10.2%) | 0 (0.0%) |
| 35 to 44 Years | 0 (0.0%) | 0 (0.0%) |
| 45 to 54 Years | 47 (12.5%) | 0 (0.0%) |
| 55 to 64 Years | 24 (11.1%) | 100 (24.1%) |
| 65 to 74 Years | 0 (0.0%) | 0 (0.0%) |
| 75 Years and over | 0 (0.0%) | 65 (34.0%) |
| Total | 132 (5.7%) | 165 (6.7%) |
Income Above Poverty by Sex and Age in Golden Triangle
According to the poverty statistics in Golden Triangle, males aged under 5 years and females aged under 5 years are the age groups that are most secure financially, with 100.0% of males and 100.0% of females in these age groups living above the poverty line.
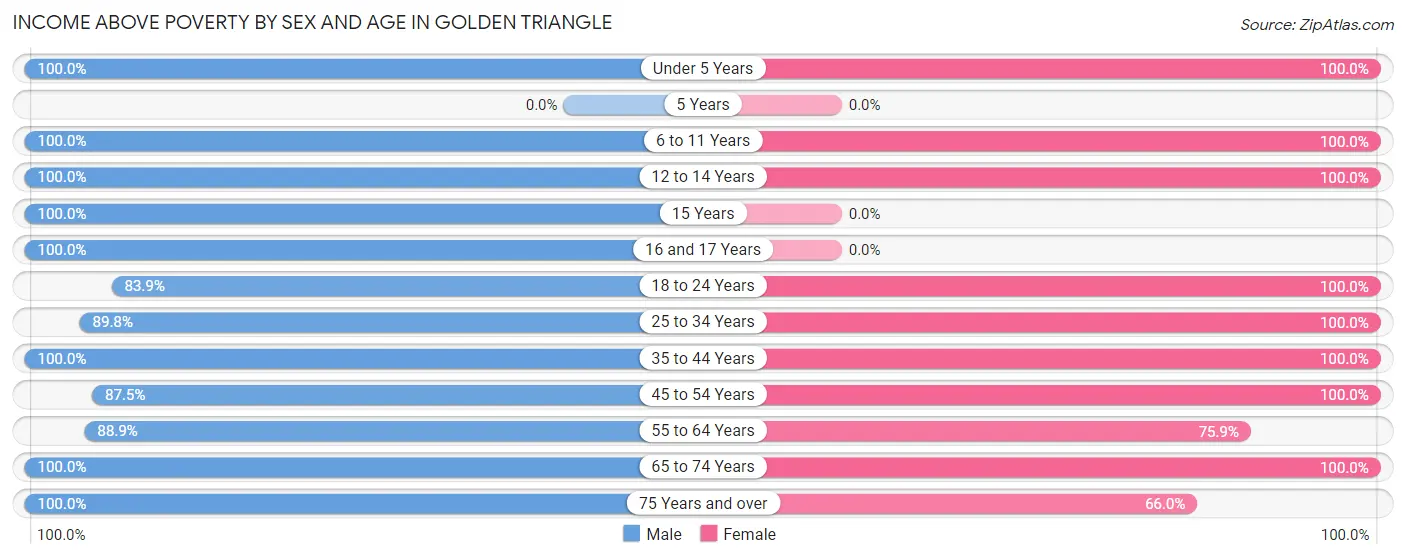
| Age Bracket | Male | Female |
| Under 5 Years | 51 (100.0%) | 31 (100.0%) |
| 5 Years | 0 (0.0%) | 0 (0.0%) |
| 6 to 11 Years | 232 (100.0%) | 113 (100.0%) |
| 12 to 14 Years | 70 (100.0%) | 117 (100.0%) |
| 15 Years | 23 (100.0%) | 0 (0.0%) |
| 16 and 17 Years | 113 (100.0%) | 0 (0.0%) |
| 18 to 24 Years | 104 (83.9%) | 164 (100.0%) |
| 25 to 34 Years | 360 (89.8%) | 360 (100.0%) |
| 35 to 44 Years | 142 (100.0%) | 313 (100.0%) |
| 45 to 54 Years | 328 (87.5%) | 320 (100.0%) |
| 55 to 64 Years | 192 (88.9%) | 315 (75.9%) |
| 65 to 74 Years | 487 (100.0%) | 427 (100.0%) |
| 75 Years and over | 90 (100.0%) | 126 (66.0%) |
| Total | 2,192 (94.3%) | 2,286 (93.3%) |
Income Below Poverty Among Married-Couple Families in Golden Triangle
The poverty statistics for married-couple families in Golden Triangle show that 7.7% or 73 of the total 945 families live below the poverty line. Families with no children have the highest poverty rate of 12.1%, comprising of 73 families. On the other hand, families with 1 or 2 children have the lowest poverty rate of 0.0%, which includes 0 families.
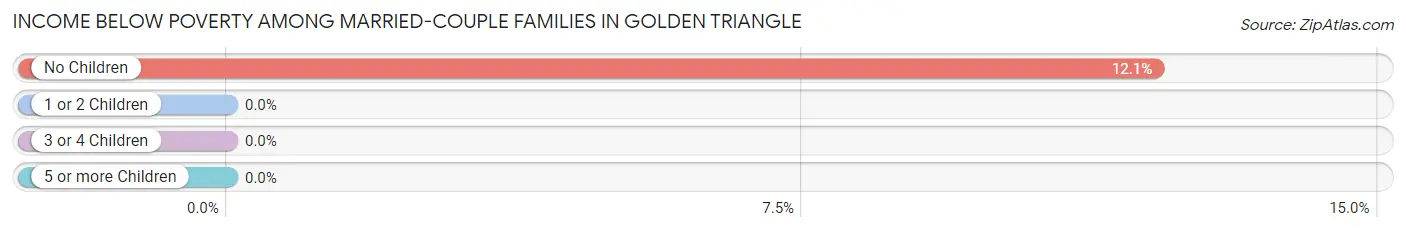
| Children | Above Poverty | Below Poverty |
| No Children | 531 (87.9%) | 73 (12.1%) |
| 1 or 2 Children | 333 (100.0%) | 0 (0.0%) |
| 3 or 4 Children | 8 (100.0%) | 0 (0.0%) |
| 5 or more Children | 0 (0.0%) | 0 (0.0%) |
| Total | 872 (92.3%) | 73 (7.7%) |
Income Below Poverty Among Single-Parent Households in Golden Triangle
| Children | Single Father | Single Mother |
| No Children | 0 (0.0%) | 0 (0.0%) |
| 1 or 2 Children | 0 (0.0%) | 0 (0.0%) |
| 3 or 4 Children | 0 (0.0%) | 0 (0.0%) |
| 5 or more Children | 0 (0.0%) | 0 (0.0%) |
| Total | 0 (0.0%) | 0 (0.0%) |
Income Below Poverty Among Married-Couple vs Single-Parent Households in Golden Triangle
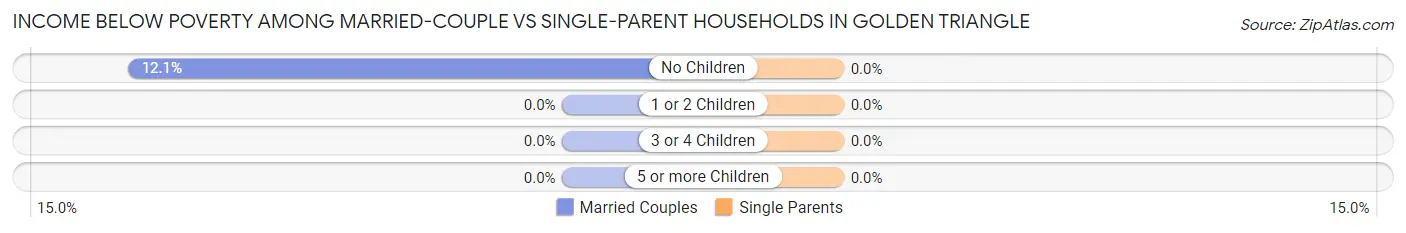
| Children | Married-Couple Families | Single-Parent Households |
| No Children | 73 (12.1%) | 0 (0.0%) |
| 1 or 2 Children | 0 (0.0%) | 0 (0.0%) |
| 3 or 4 Children | 0 (0.0%) | 0 (0.0%) |
| 5 or more Children | 0 (0.0%) | 0 (0.0%) |
| Total | 73 (7.7%) | 0 (0.0%) |
Race in Golden Triangle
The most populous races in Golden Triangle are White / Caucasian (3,083 | 62.2%), Asian (668 | 13.5%), and Black / African American (606 | 12.2%).
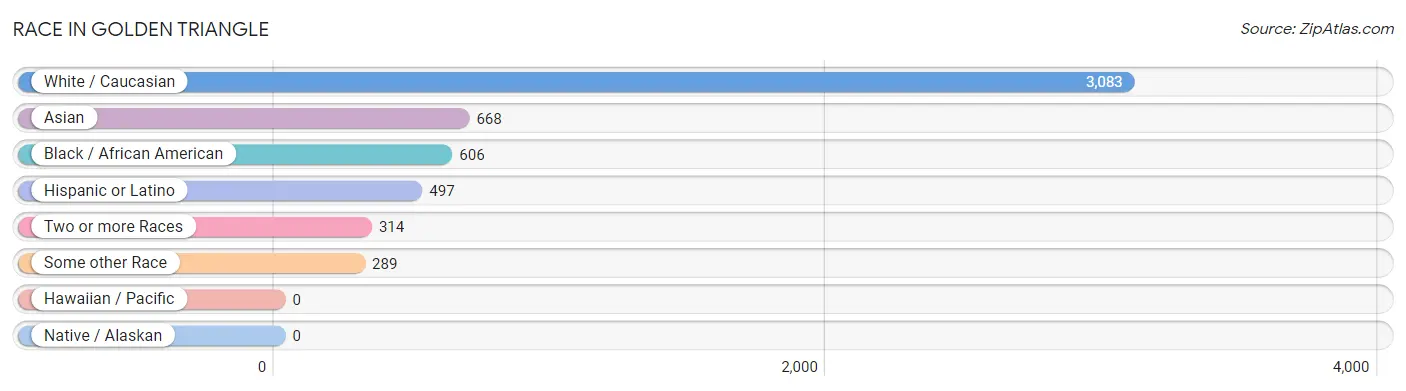
| Race | # Population | % Population |
| Asian | 668 | 13.5% |
| Black / African American | 606 | 12.2% |
| Hawaiian / Pacific | 0 | 0.0% |
| Hispanic or Latino | 497 | 10.0% |
| Native / Alaskan | 0 | 0.0% |
| White / Caucasian | 3,083 | 62.2% |
| Two or more Races | 314 | 6.3% |
| Some other Race | 289 | 5.8% |
| Total | 4,960 | 100.0% |
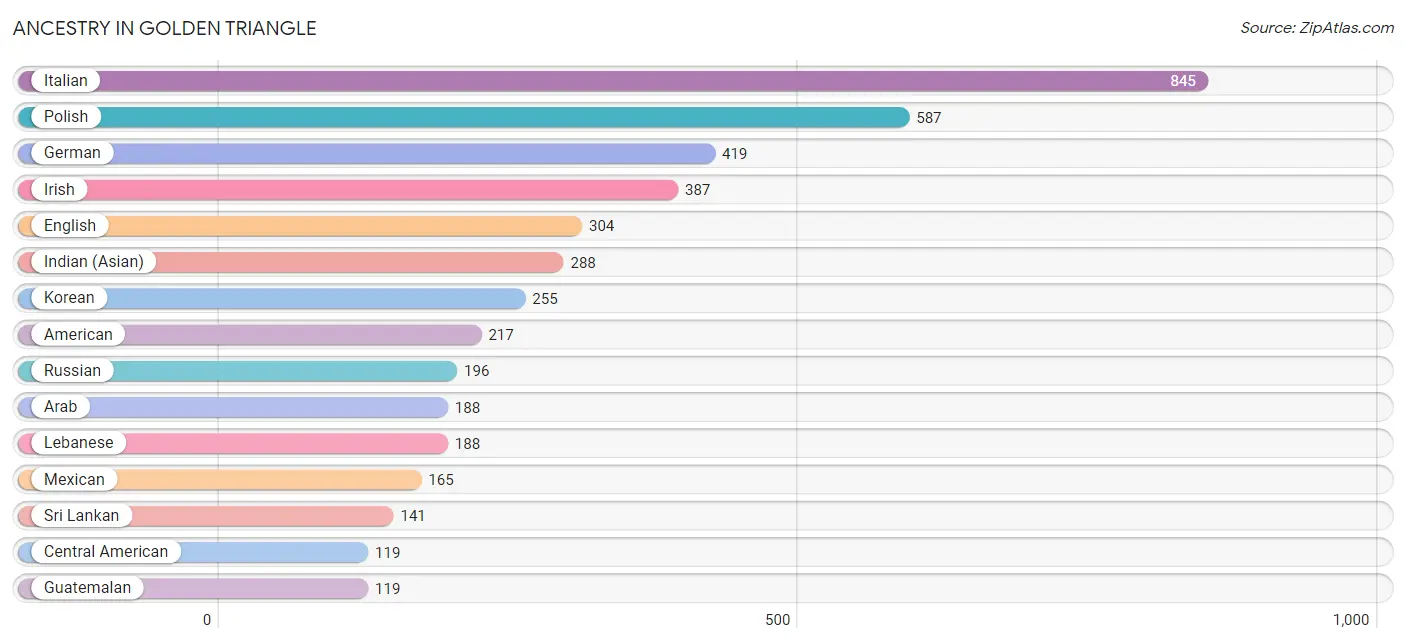
Ancestry in Golden Triangle
The most populous ancestries reported in Golden Triangle are Italian (845 | 17.0%), Polish (587 | 11.8%), German (419 | 8.5%), Irish (387 | 7.8%), and English (304 | 6.1%), together accounting for 51.3% of all Golden Triangle residents.
| Ancestry | # Population | % Population |
| American | 217 | 4.4% |
| Arab | 188 | 3.8% |
| Barbadian | 9 | 0.2% |
| Brazilian | 32 | 0.6% |
| British | 44 | 0.9% |
| Burmese | 42 | 0.9% |
| Central American | 119 | 2.4% |
| Danish | 32 | 0.6% |
| Dominican | 111 | 2.2% |
| Dutch | 34 | 0.7% |
| Eastern European | 42 | 0.9% |
| English | 304 | 6.1% |
| European | 89 | 1.8% |
| French | 91 | 1.8% |
| French Canadian | 18 | 0.4% |
| German | 419 | 8.5% |
| Guatemalan | 119 | 2.4% |
| Hungarian | 33 | 0.7% |
| Indian (Asian) | 288 | 5.8% |
| Iranian | 58 | 1.2% |
| Irish | 387 | 7.8% |
| Italian | 845 | 17.0% |
| Korean | 255 | 5.1% |
| Lebanese | 188 | 3.8% |
| Mexican | 165 | 3.3% |
| Norwegian | 10 | 0.2% |
| Peruvian | 8 | 0.2% |
| Polish | 587 | 11.8% |
| Portuguese | 19 | 0.4% |
| Puerto Rican | 84 | 1.7% |
| Romanian | 45 | 0.9% |
| Russian | 196 | 4.0% |
| Scottish | 9 | 0.2% |
| South American | 8 | 0.2% |
| Sri Lankan | 141 | 2.8% |
| Swedish | 13 | 0.3% |
| Thai | 21 | 0.4% | View All 37 Rows |
Immigrants in Golden Triangle
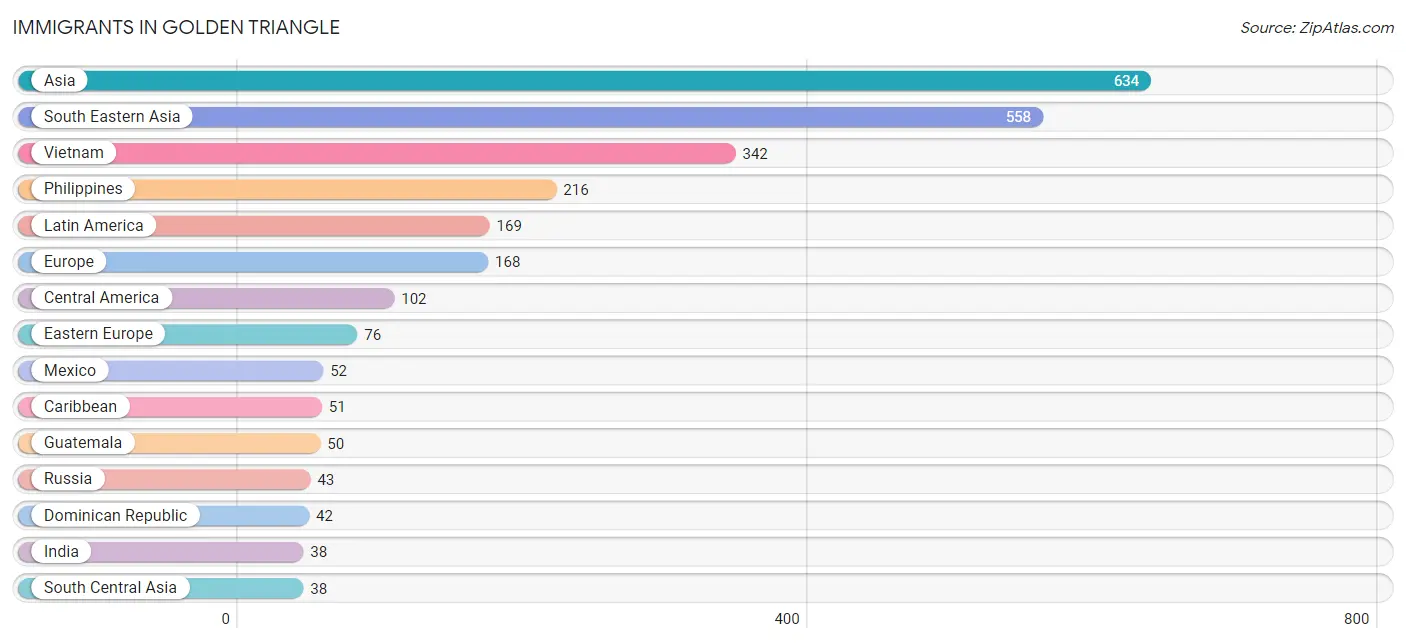
The most numerous immigrant groups reported in Golden Triangle came from Asia (634 | 12.8%), South Eastern Asia (558 | 11.3%), Vietnam (342 | 6.9%), Philippines (216 | 4.3%), and Latin America (169 | 3.4%), together accounting for 38.7% of all Golden Triangle residents.
| Immigration Origin | # Population | % Population |
| Asia | 634 | 12.8% |
| Barbados | 9 | 0.2% |
| Brazil | 16 | 0.3% |
| Caribbean | 51 | 1.0% |
| Central America | 102 | 2.1% |
| Dominican Republic | 42 | 0.9% |
| Eastern Asia | 20 | 0.4% |
| Eastern Europe | 76 | 1.5% |
| Europe | 168 | 3.4% |
| France | 37 | 0.7% |
| Greece | 10 | 0.2% |
| Guatemala | 50 | 1.0% |
| India | 38 | 0.8% |
| Italy | 23 | 0.5% |
| Korea | 20 | 0.4% |
| Latin America | 169 | 3.4% |
| Lebanon | 18 | 0.4% |
| Mexico | 52 | 1.1% |
| Northern Europe | 22 | 0.4% |
| Philippines | 216 | 4.3% |
| Russia | 43 | 0.9% |
| South America | 16 | 0.3% |
| South Central Asia | 38 | 0.8% |
| South Eastern Asia | 558 | 11.3% |
| Southern Europe | 33 | 0.7% |
| Vietnam | 342 | 6.9% |
| Western Asia | 18 | 0.4% |
| Western Europe | 37 | 0.7% | View All 28 Rows |
Sex and Age in Golden Triangle
Sex and Age in Golden Triangle
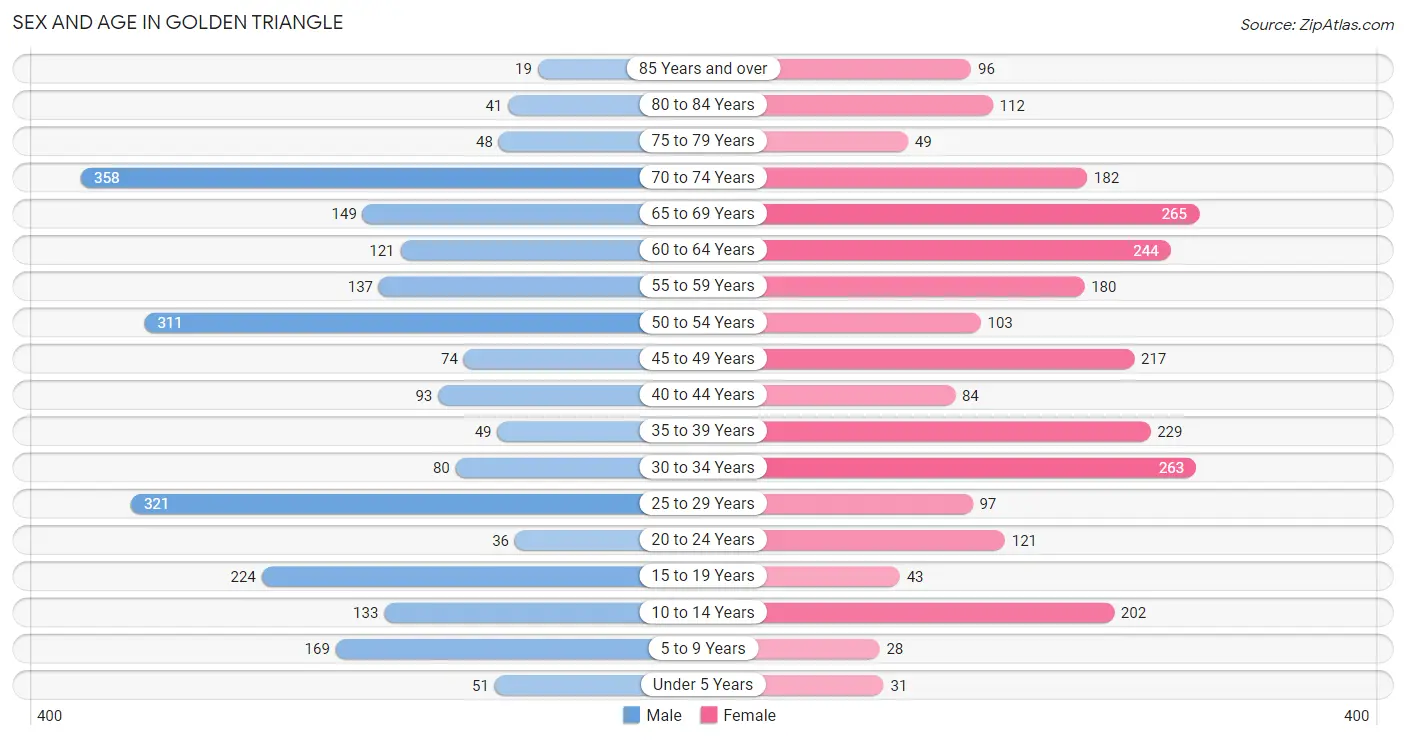
The most populous age groups in Golden Triangle are 70 to 74 Years (358 | 14.8%) for men and 65 to 69 Years (265 | 10.4%) for women.
| Age Bracket | Male | Female |
| Under 5 Years | 51 (2.1%) | 31 (1.2%) |
| 5 to 9 Years | 169 (7.0%) | 28 (1.1%) |
| 10 to 14 Years | 133 (5.5%) | 202 (7.9%) |
| 15 to 19 Years | 224 (9.3%) | 43 (1.7%) |
| 20 to 24 Years | 36 (1.5%) | 121 (4.8%) |
| 25 to 29 Years | 321 (13.3%) | 97 (3.8%) |
| 30 to 34 Years | 80 (3.3%) | 263 (10.3%) |
| 35 to 39 Years | 49 (2.0%) | 229 (9.0%) |
| 40 to 44 Years | 93 (3.8%) | 84 (3.3%) |
| 45 to 49 Years | 74 (3.1%) | 217 (8.5%) |
| 50 to 54 Years | 311 (12.9%) | 103 (4.1%) |
| 55 to 59 Years | 137 (5.7%) | 180 (7.1%) |
| 60 to 64 Years | 121 (5.0%) | 244 (9.6%) |
| 65 to 69 Years | 149 (6.2%) | 265 (10.4%) |
| 70 to 74 Years | 358 (14.8%) | 182 (7.1%) |
| 75 to 79 Years | 48 (2.0%) | 49 (1.9%) |
| 80 to 84 Years | 41 (1.7%) | 112 (4.4%) |
| 85 Years and over | 19 (0.8%) | 96 (3.8%) |
| Total | 2,414 (100.0%) | 2,546 (100.0%) |
Families and Households in Golden Triangle
Median Family Size in Golden Triangle
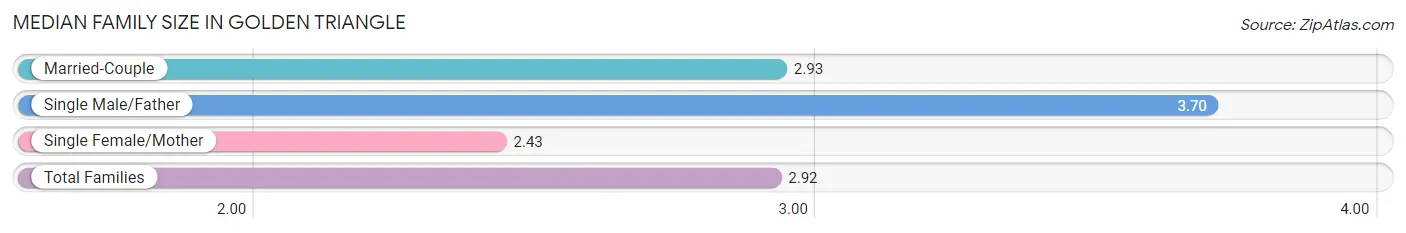
The median family size in Golden Triangle is 2.92 persons per family, with single male/father families (122 | 9.6%) accounting for the largest median family size of 3.7 persons per family. On the other hand, single female/mother families (199 | 15.7%) represent the smallest median family size with 2.43 persons per family.
| Family Type | # Families | Family Size |
| Married-Couple | 945 (74.6%) | 2.93 |
| Single Male/Father | 122 (9.6%) | 3.70 |
| Single Female/Mother | 199 (15.7%) | 2.43 |
| Total Families | 1,266 (100.0%) | 2.92 |
Median Household Size in Golden Triangle
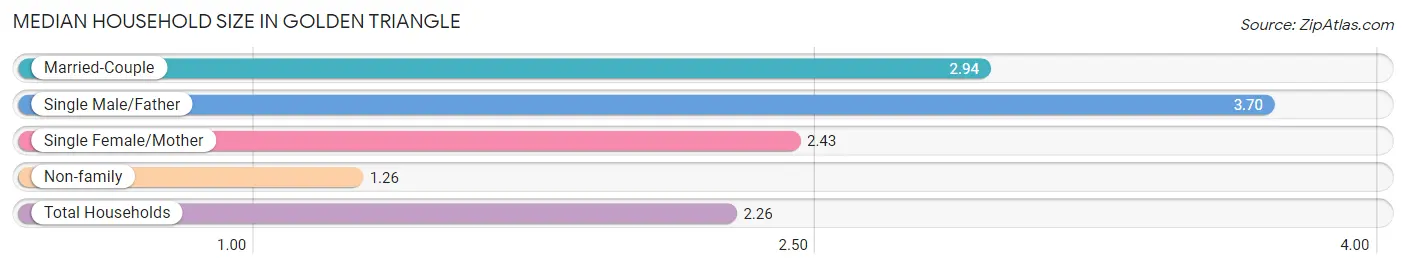
The median household size in Golden Triangle is 2.26 persons per household, with single male/father households (122 | 5.8%) accounting for the largest median household size of 3.7 persons per household. non-family households (843 | 40.0%) represent the smallest median household size with 1.26 persons per household.
| Household Type | # Households | Household Size |
| Married-Couple | 945 (44.8%) | 2.94 |
| Single Male/Father | 122 (5.8%) | 3.70 |
| Single Female/Mother | 199 (9.4%) | 2.43 |
| Non-family | 843 (40.0%) | 1.26 |
| Total Households | 2,109 (100.0%) | 2.26 |
Household Size by Marriage Status in Golden Triangle
Out of a total of 2,109 households in Golden Triangle, 1,266 (60.0%) are family households, while 843 (40.0%) are nonfamily households. The most numerous type of family households are 2-person households, comprising 651, and the most common type of nonfamily households are 1-person households, comprising 593.
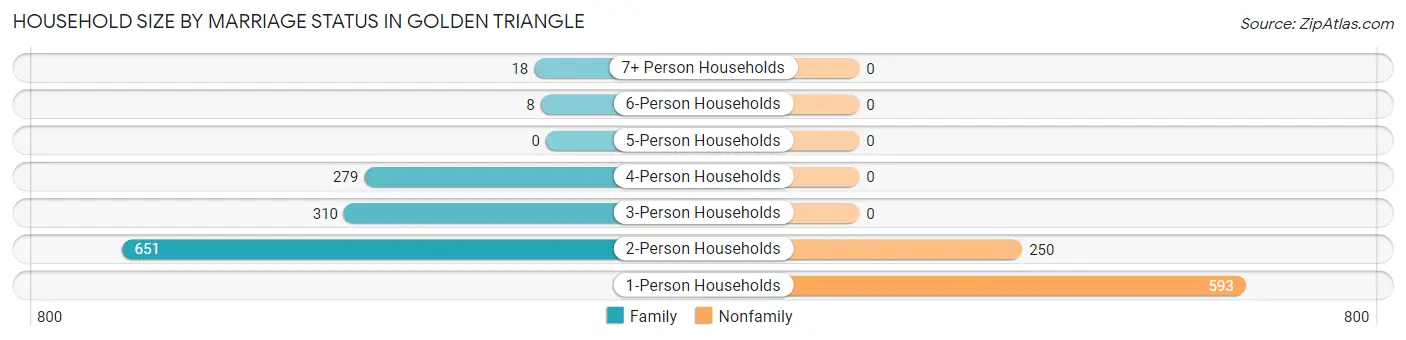
| Household Size | Family Households | Nonfamily Households |
| 1-Person Households | - | 593 (28.1%) |
| 2-Person Households | 651 (30.9%) | 250 (11.8%) |
| 3-Person Households | 310 (14.7%) | 0 (0.0%) |
| 4-Person Households | 279 (13.2%) | 0 (0.0%) |
| 5-Person Households | 0 (0.0%) | 0 (0.0%) |
| 6-Person Households | 8 (0.4%) | 0 (0.0%) |
| 7+ Person Households | 18 (0.9%) | 0 (0.0%) |
| Total | 1,266 (60.0%) | 843 (40.0%) |
Female Fertility in Golden Triangle
Fertility by Age in Golden Triangle
Average fertility rate in Golden Triangle is 32.0 births per 1,000 women. Women in the age bracket of 20 to 34 years have the highest fertility rate with 71.0 births per 1,000 women. Women in the age bracket of 20 to 34 years acount for 100.0% of all women with births.
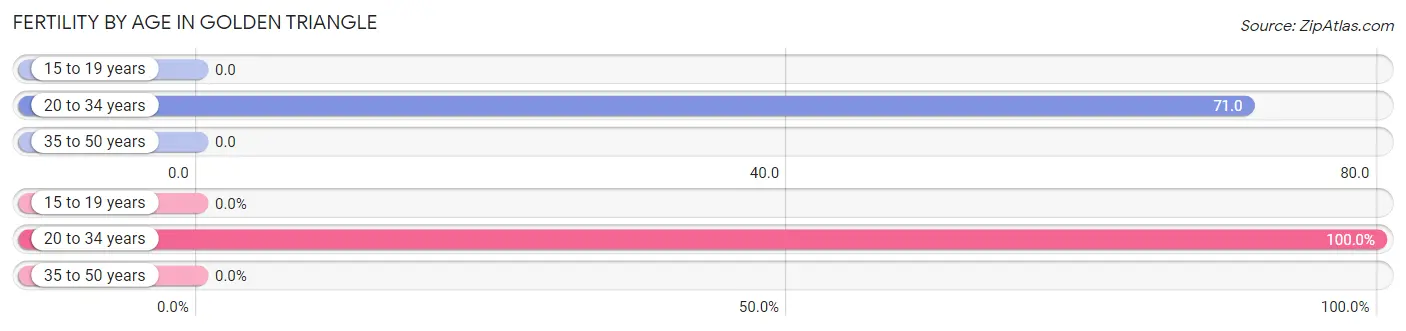
| Age Bracket | Women with Births | Births / 1,000 Women |
| 15 to 19 years | 0 (0.0%) | 0.0 |
| 20 to 34 years | 34 (100.0%) | 71.0 |
| 35 to 50 years | 0 (0.0%) | 0.0 |
| Total | 34 (100.0%) | 32.0 |
Fertility by Age by Marriage Status in Golden Triangle
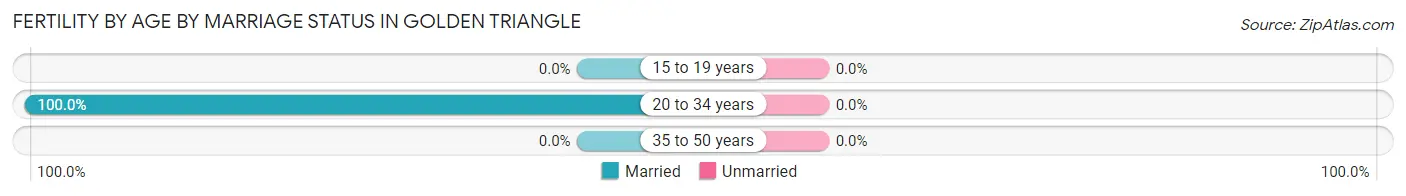
| Age Bracket | Married | Unmarried |
| 15 to 19 years | 0 (0.0%) | 0 (0.0%) |
| 20 to 34 years | 34 (100.0%) | 0 (0.0%) |
| 35 to 50 years | 0 (0.0%) | 0 (0.0%) |
| Total | 34 (100.0%) | 0 (0.0%) |
Fertility by Education in Golden Triangle
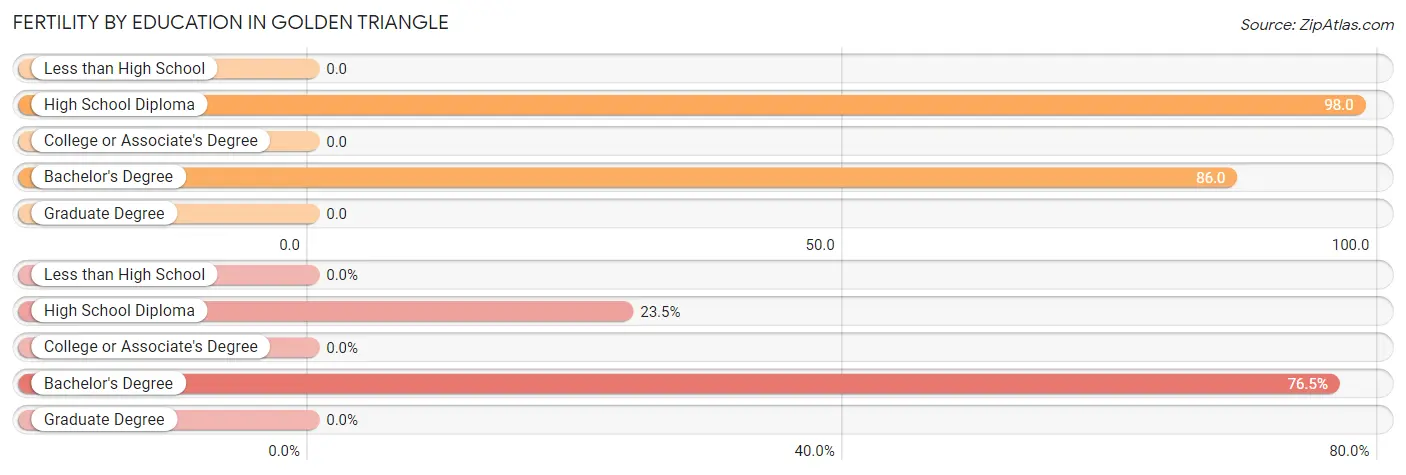
| Educational Attainment | Women with Births | Births / 1,000 Women |
| Less than High School | 0 (0.0%) | 0.0 |
| High School Diploma | 8 (23.5%) | 98.0 |
| College or Associate's Degree | 0 (0.0%) | 0.0 |
| Bachelor's Degree | 26 (76.5%) | 86.0 |
| Graduate Degree | 0 (0.0%) | 0.0 |
| Total | 34 (100.0%) | 32.0 |
Fertility by Education by Marriage Status in Golden Triangle
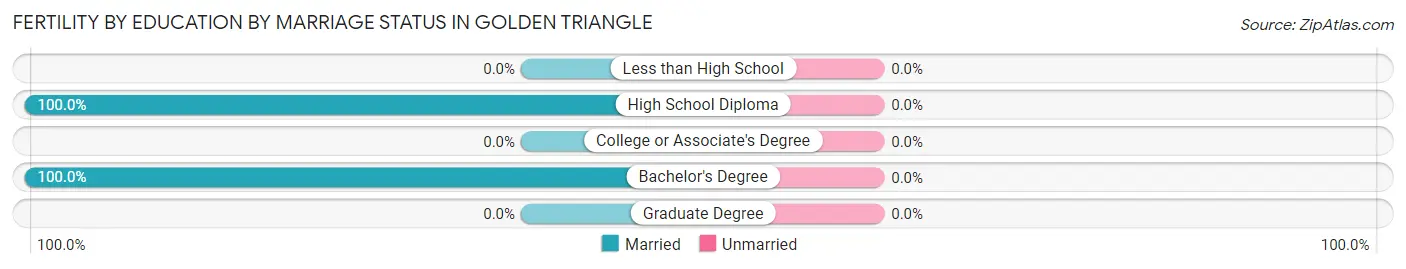
| Educational Attainment | Married | Unmarried |
| Less than High School | 0 (0.0%) | 0 (0.0%) |
| High School Diploma | 8 (100.0%) | 0 (0.0%) |
| College or Associate's Degree | 0 (0.0%) | 0 (0.0%) |
| Bachelor's Degree | 26 (100.0%) | 0 (0.0%) |
| Graduate Degree | 0 (0.0%) | 0 (0.0%) |
| Total | 34 (100.0%) | 0 (0.0%) |
Employment Characteristics in Golden Triangle
Employment by Class of Employer in Golden Triangle
Among the 2,617 employed individuals in Golden Triangle, private company employees (1,973 | 75.4%), local government employees (223 | 8.5%), and self-employed (incorporated) (119 | 4.5%) make up the most common classes of employment.
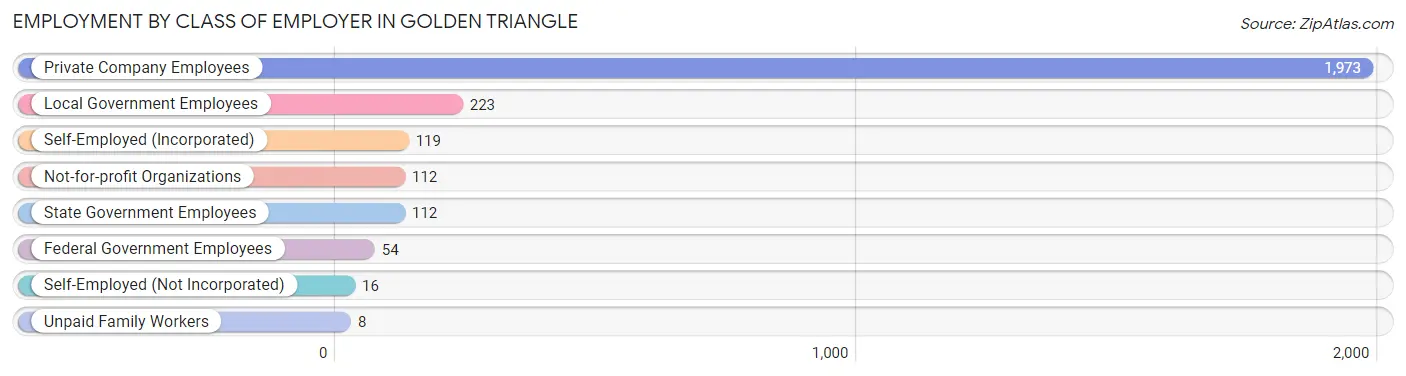
| Employer Class | # Employees | % Employees |
| Private Company Employees | 1,973 | 75.4% |
| Self-Employed (Incorporated) | 119 | 4.5% |
| Self-Employed (Not Incorporated) | 16 | 0.6% |
| Not-for-profit Organizations | 112 | 4.3% |
| Local Government Employees | 223 | 8.5% |
| State Government Employees | 112 | 4.3% |
| Federal Government Employees | 54 | 2.1% |
| Unpaid Family Workers | 8 | 0.3% |
| Total | 2,617 | 100.0% |
Employment Status by Age in Golden Triangle
According to the labor force statistics for Golden Triangle, out of the total population over 16 years of age (4,323), 63.9% or 2,762 individuals are in the labor force, with 4.3% or 119 of them unemployed. The age group with the highest labor force participation rate is 20 to 24 years, with 100.0% or 157 individuals in the labor force. Within the labor force, the 65 to 74 years age range has the highest percentage of unemployed individuals, with 17.7% or 66 of them being unemployed.
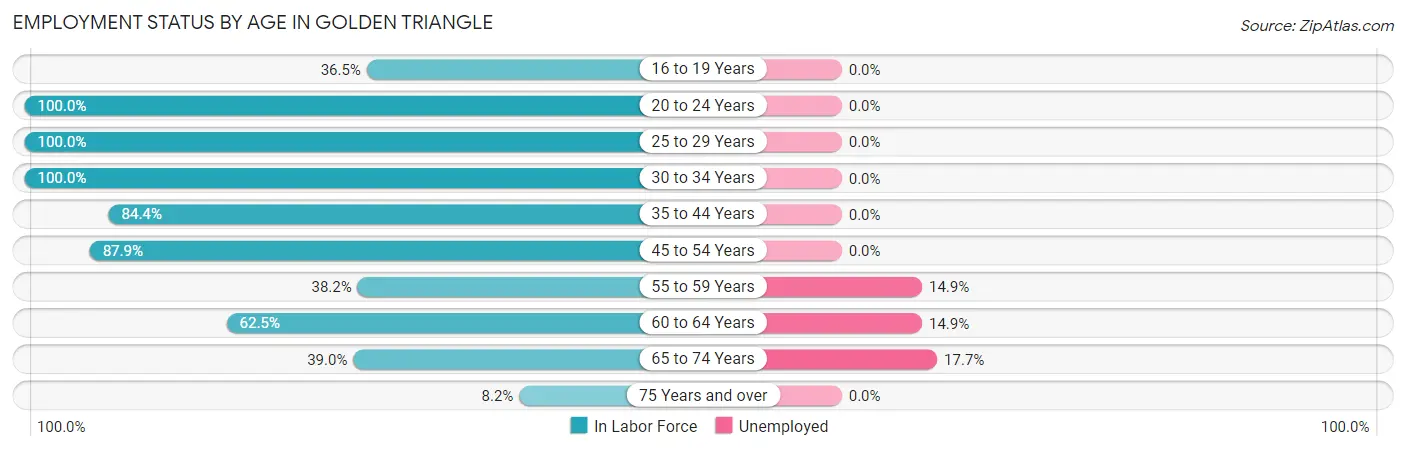
| Age Bracket | In Labor Force | Unemployed |
| 16 to 19 Years | 89 (36.5%) | 0 (0.0%) |
| 20 to 24 Years | 157 (100.0%) | 0 (0.0%) |
| 25 to 29 Years | 418 (100.0%) | 0 (0.0%) |
| 30 to 34 Years | 343 (100.0%) | 0 (0.0%) |
| 35 to 44 Years | 384 (84.4%) | 0 (0.0%) |
| 45 to 54 Years | 620 (87.9%) | 0 (0.0%) |
| 55 to 59 Years | 121 (38.2%) | 18 (14.9%) |
| 60 to 64 Years | 228 (62.5%) | 34 (14.9%) |
| 65 to 74 Years | 372 (39.0%) | 66 (17.7%) |
| 75 Years and over | 30 (8.2%) | 0 (0.0%) |
| Total | 2,762 (63.9%) | 119 (4.3%) |
Employment Status by Educational Attainment in Golden Triangle
According to labor force statistics for Golden Triangle, 81.2% of individuals (2,114) out of the total population between 25 and 64 years of age (2,603) are in the labor force, with 2.5% or 53 of them being unemployed. The group with the highest labor force participation rate are those with the educational attainment of bachelor's degree or higher, with 84.8% or 1,059 individuals in the labor force. Within the labor force, individuals with college / associate degree education have the highest percentage of unemployment, with 4.0% or 20 of them being unemployed.
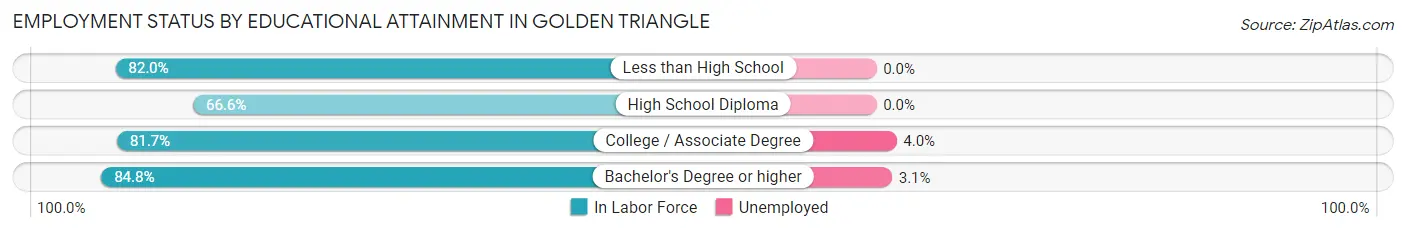
| Educational Attainment | In Labor Force | Unemployed |
| Less than High School | 323 (82.0%) | 0 (0.0%) |
| High School Diploma | 231 (66.6%) | 0 (0.0%) |
| College / Associate Degree | 501 (81.7%) | 25 (4.0%) |
| Bachelor's Degree or higher | 1,059 (84.8%) | 39 (3.1%) |
| Total | 2,114 (81.2%) | 65 (2.5%) |
Employment Occupations by Sex in Golden Triangle
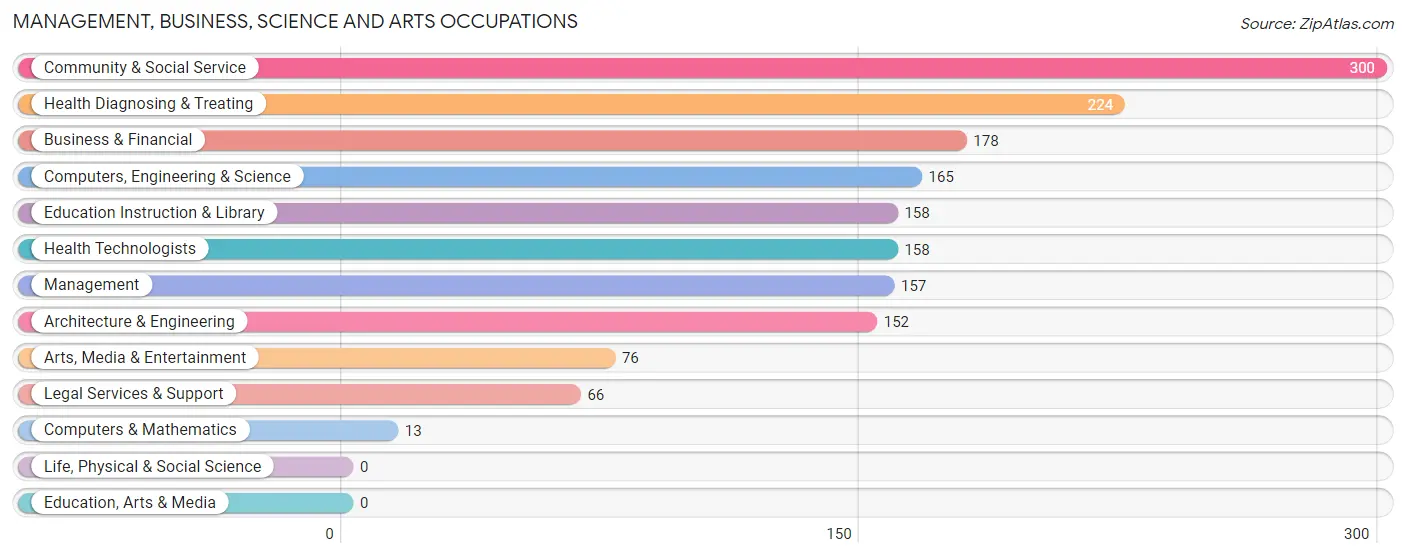
Management, Business, Science and Arts Occupations
The most common Management, Business, Science and Arts occupations in Golden Triangle are Community & Social Service (300 | 11.5%), Health Diagnosing & Treating (224 | 8.6%), Business & Financial (178 | 6.8%), Computers, Engineering & Science (165 | 6.3%), and Education Instruction & Library (158 | 6.0%).
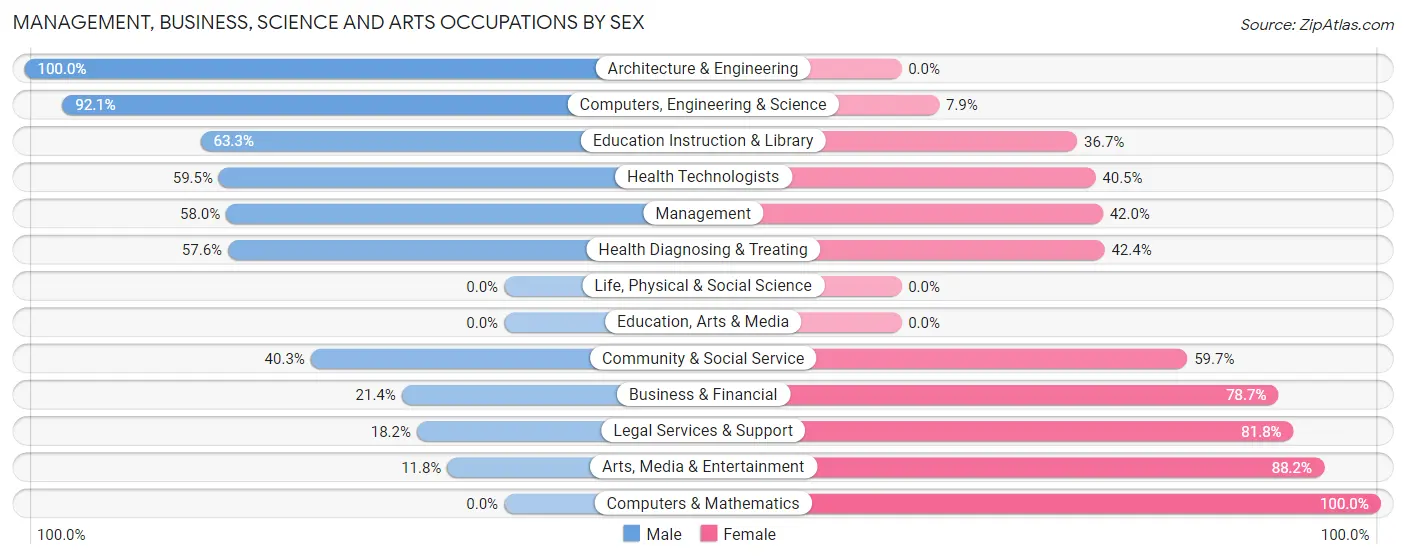
Management, Business, Science and Arts Occupations by Sex
Within the Management, Business, Science and Arts occupations in Golden Triangle, the most male-oriented occupations are Architecture & Engineering (100.0%), Computers, Engineering & Science (92.1%), and Education Instruction & Library (63.3%), while the most female-oriented occupations are Computers & Mathematics (100.0%), Arts, Media & Entertainment (88.2%), and Legal Services & Support (81.8%).
| Occupation | Male | Female |
| Management | 91 (58.0%) | 66 (42.0%) |
| Business & Financial | 38 (21.3%) | 140 (78.6%) |
| Computers, Engineering & Science | 152 (92.1%) | 13 (7.9%) |
| Computers & Mathematics | 0 (0.0%) | 13 (100.0%) |
| Architecture & Engineering | 152 (100.0%) | 0 (0.0%) |
| Life, Physical & Social Science | 0 (0.0%) | 0 (0.0%) |
| Community & Social Service | 121 (40.3%) | 179 (59.7%) |
| Education, Arts & Media | 0 (0.0%) | 0 (0.0%) |
| Legal Services & Support | 12 (18.2%) | 54 (81.8%) |
| Education Instruction & Library | 100 (63.3%) | 58 (36.7%) |
| Arts, Media & Entertainment | 9 (11.8%) | 67 (88.2%) |
| Health Diagnosing & Treating | 129 (57.6%) | 95 (42.4%) |
| Health Technologists | 94 (59.5%) | 64 (40.5%) |
| Total (Category) | 531 (51.9%) | 493 (48.1%) |
| Total (Overall) | 1,279 (49.0%) | 1,332 (51.0%) |
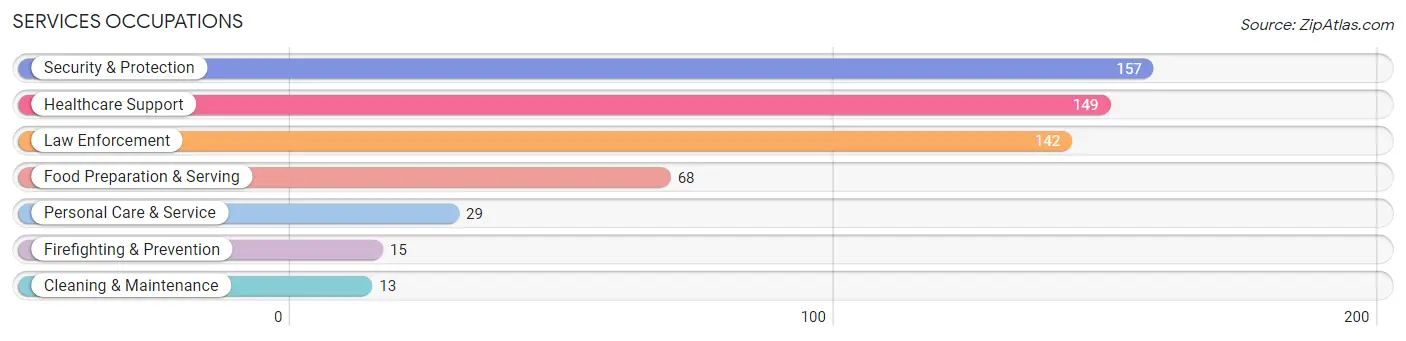
Services Occupations
The most common Services occupations in Golden Triangle are Security & Protection (157 | 6.0%), Healthcare Support (149 | 5.7%), Law Enforcement (142 | 5.4%), Food Preparation & Serving (68 | 2.6%), and Personal Care & Service (29 | 1.1%).
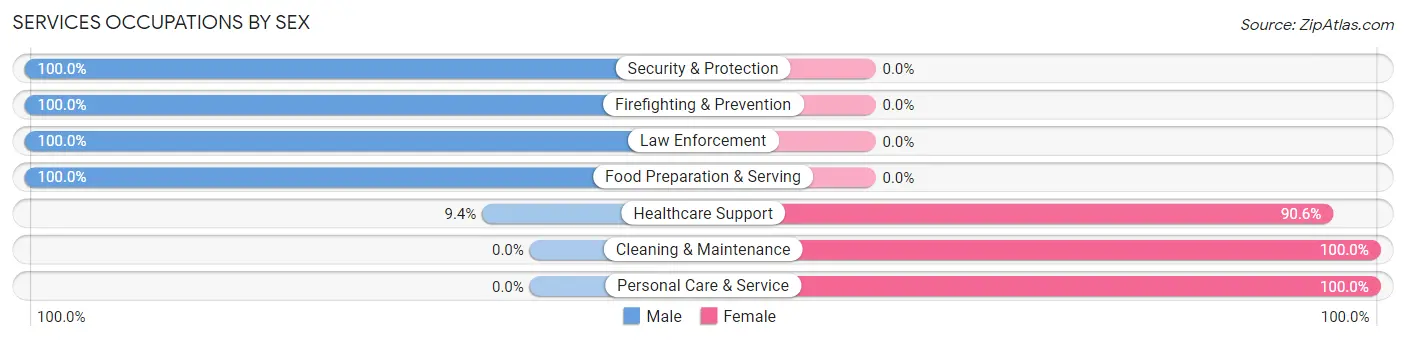
Services Occupations by Sex
Within the Services occupations in Golden Triangle, the most male-oriented occupations are Security & Protection (100.0%), Firefighting & Prevention (100.0%), and Law Enforcement (100.0%), while the most female-oriented occupations are Cleaning & Maintenance (100.0%), Personal Care & Service (100.0%), and Healthcare Support (90.6%).
| Occupation | Male | Female |
| Healthcare Support | 14 (9.4%) | 135 (90.6%) |
| Security & Protection | 157 (100.0%) | 0 (0.0%) |
| Firefighting & Prevention | 15 (100.0%) | 0 (0.0%) |
| Law Enforcement | 142 (100.0%) | 0 (0.0%) |
| Food Preparation & Serving | 68 (100.0%) | 0 (0.0%) |
| Cleaning & Maintenance | 0 (0.0%) | 13 (100.0%) |
| Personal Care & Service | 0 (0.0%) | 29 (100.0%) |
| Total (Category) | 239 (57.5%) | 177 (42.5%) |
| Total (Overall) | 1,279 (49.0%) | 1,332 (51.0%) |
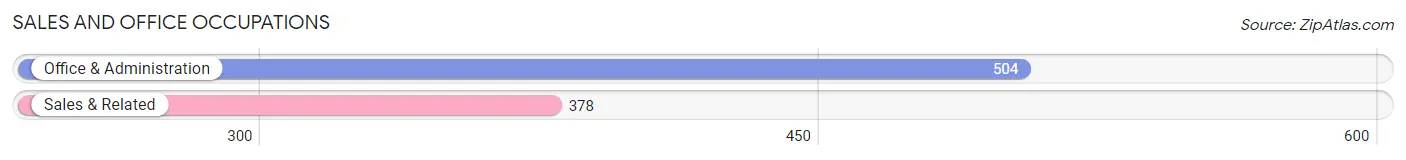
Sales and Office Occupations
The most common Sales and Office occupations in Golden Triangle are Office & Administration (504 | 19.3%), and Sales & Related (378 | 14.5%).
Sales and Office Occupations by Sex
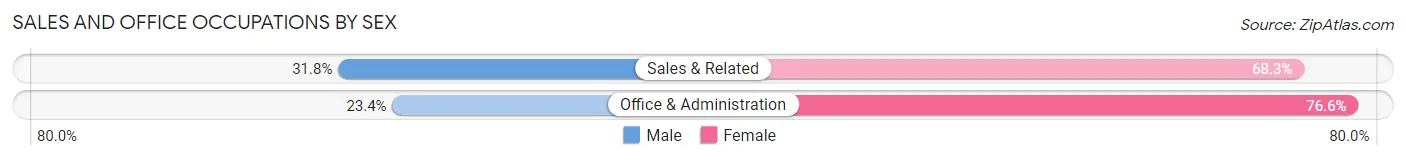
| Occupation | Male | Female |
| Sales & Related | 120 (31.8%) | 258 (68.2%) |
| Office & Administration | 118 (23.4%) | 386 (76.6%) |
| Total (Category) | 238 (27.0%) | 644 (73.0%) |
| Total (Overall) | 1,279 (49.0%) | 1,332 (51.0%) |
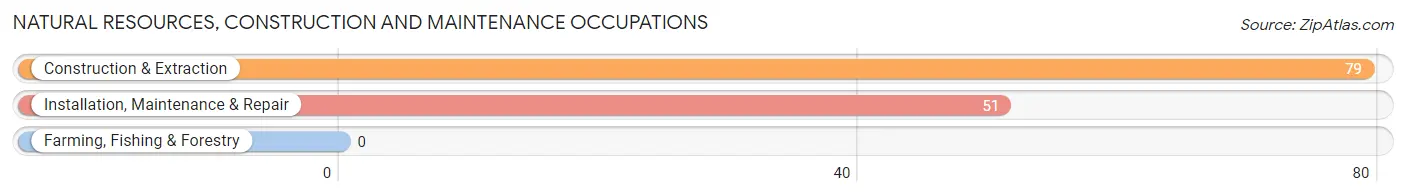
Natural Resources, Construction and Maintenance Occupations
The most common Natural Resources, Construction and Maintenance occupations in Golden Triangle are Construction & Extraction (79 | 3.0%), and Installation, Maintenance & Repair (51 | 1.9%).
Natural Resources, Construction and Maintenance Occupations by Sex
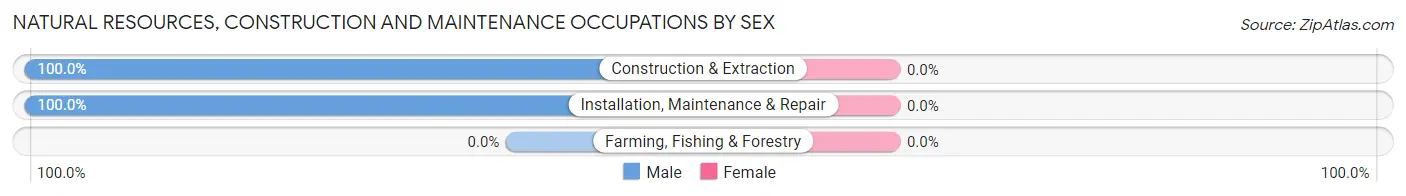
| Occupation | Male | Female |
| Farming, Fishing & Forestry | 0 (0.0%) | 0 (0.0%) |
| Construction & Extraction | 79 (100.0%) | 0 (0.0%) |
| Installation, Maintenance & Repair | 51 (100.0%) | 0 (0.0%) |
| Total (Category) | 130 (100.0%) | 0 (0.0%) |
| Total (Overall) | 1,279 (49.0%) | 1,332 (51.0%) |
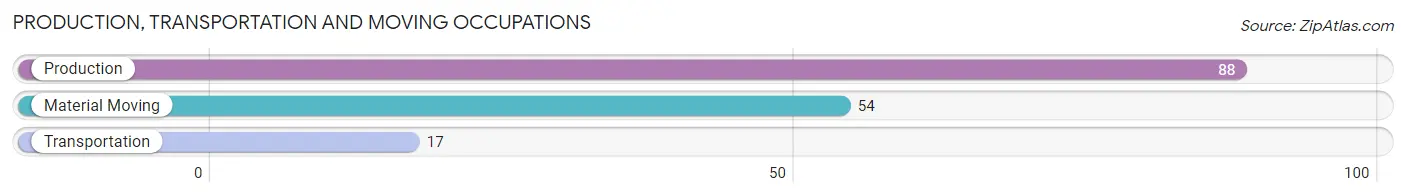
Production, Transportation and Moving Occupations
The most common Production, Transportation and Moving occupations in Golden Triangle are Production (88 | 3.4%), Material Moving (54 | 2.1%), and Transportation (17 | 0.6%).
Production, Transportation and Moving Occupations by Sex
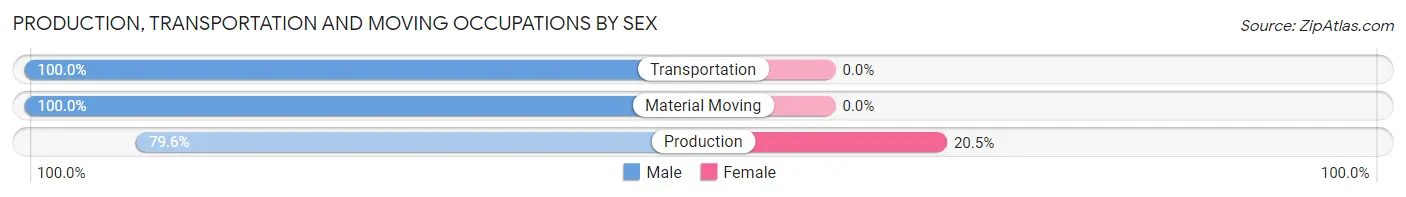
| Occupation | Male | Female |
| Production | 70 (79.5%) | 18 (20.4%) |
| Transportation | 17 (100.0%) | 0 (0.0%) |
| Material Moving | 54 (100.0%) | 0 (0.0%) |
| Total (Category) | 141 (88.7%) | 18 (11.3%) |
| Total (Overall) | 1,279 (49.0%) | 1,332 (51.0%) |
Employment Industries by Sex in Golden Triangle
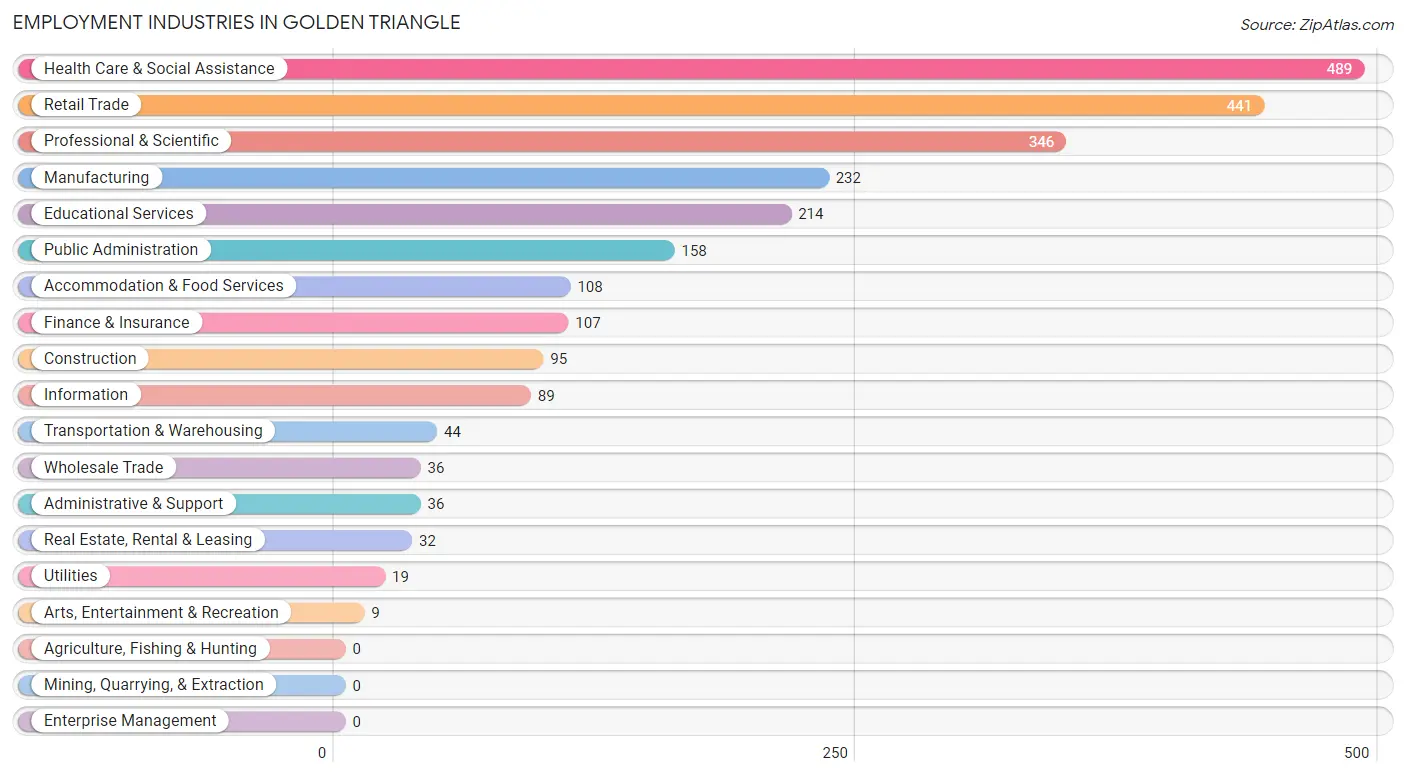
Employment Industries in Golden Triangle
The major employment industries in Golden Triangle include Health Care & Social Assistance (489 | 18.7%), Retail Trade (441 | 16.9%), Professional & Scientific (346 | 13.3%), Manufacturing (232 | 8.9%), and Educational Services (214 | 8.2%).
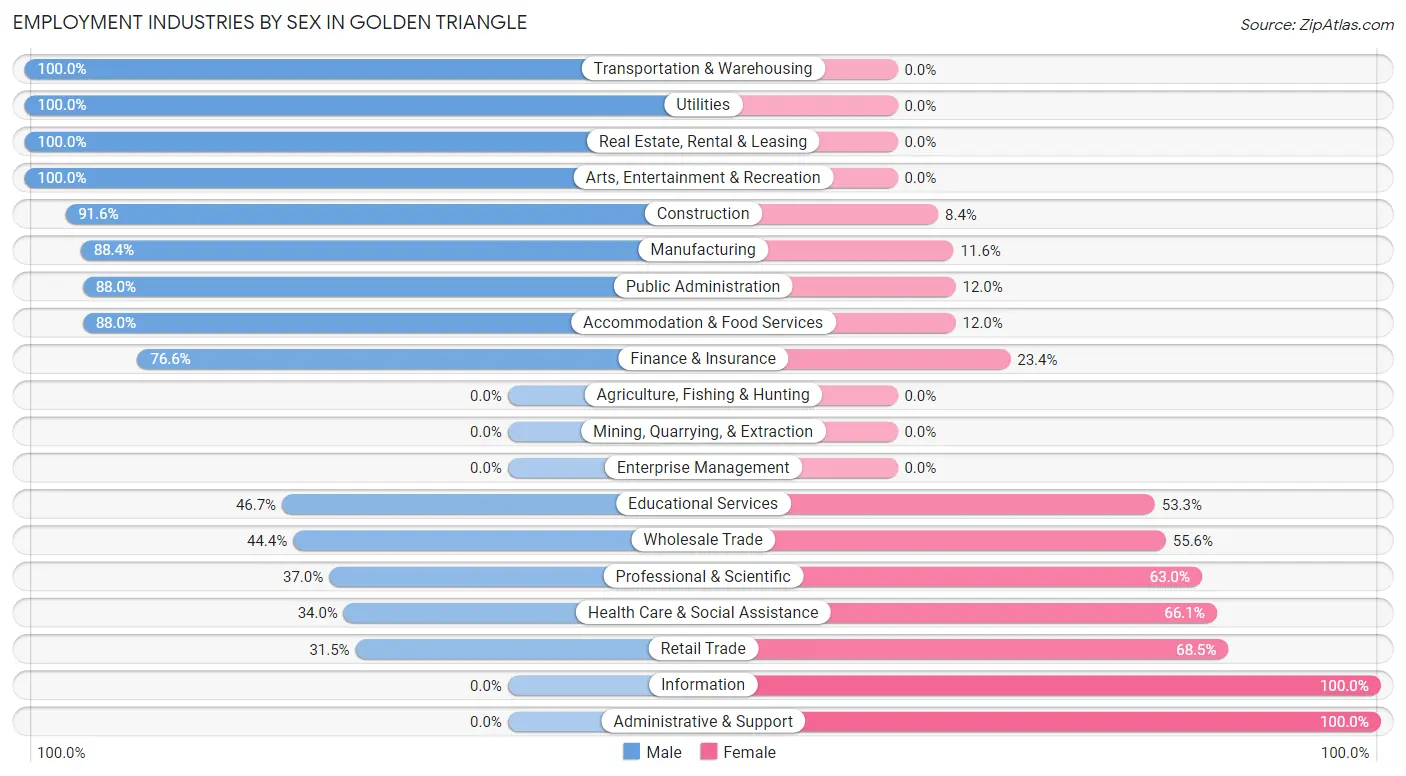
Employment Industries by Sex in Golden Triangle
The Golden Triangle industries that see more men than women are Transportation & Warehousing (100.0%), Utilities (100.0%), and Real Estate, Rental & Leasing (100.0%), whereas the industries that tend to have a higher number of women are Information (100.0%), Administrative & Support (100.0%), and Retail Trade (68.5%).
| Industry | Male | Female |
| Agriculture, Fishing & Hunting | 0 (0.0%) | 0 (0.0%) |
| Mining, Quarrying, & Extraction | 0 (0.0%) | 0 (0.0%) |
| Construction | 87 (91.6%) | 8 (8.4%) |
| Manufacturing | 205 (88.4%) | 27 (11.6%) |
| Wholesale Trade | 16 (44.4%) | 20 (55.6%) |
| Retail Trade | 139 (31.5%) | 302 (68.5%) |
| Transportation & Warehousing | 44 (100.0%) | 0 (0.0%) |
| Utilities | 19 (100.0%) | 0 (0.0%) |
| Information | 0 (0.0%) | 89 (100.0%) |
| Finance & Insurance | 82 (76.6%) | 25 (23.4%) |
| Real Estate, Rental & Leasing | 32 (100.0%) | 0 (0.0%) |
| Professional & Scientific | 128 (37.0%) | 218 (63.0%) |
| Enterprise Management | 0 (0.0%) | 0 (0.0%) |
| Administrative & Support | 0 (0.0%) | 36 (100.0%) |
| Educational Services | 100 (46.7%) | 114 (53.3%) |
| Health Care & Social Assistance | 166 (34.0%) | 323 (66.0%) |
| Arts, Entertainment & Recreation | 9 (100.0%) | 0 (0.0%) |
| Accommodation & Food Services | 95 (88.0%) | 13 (12.0%) |
| Public Administration | 139 (88.0%) | 19 (12.0%) |
| Total | 1,279 (49.0%) | 1,332 (51.0%) |
Education in Golden Triangle
School Enrollment in Golden Triangle
The most common levels of schooling among the 1,054 students in Golden Triangle are college / undergraduate (262 | 24.9%), middle school (253 | 24.0%), and elementary school (224 | 21.2%).
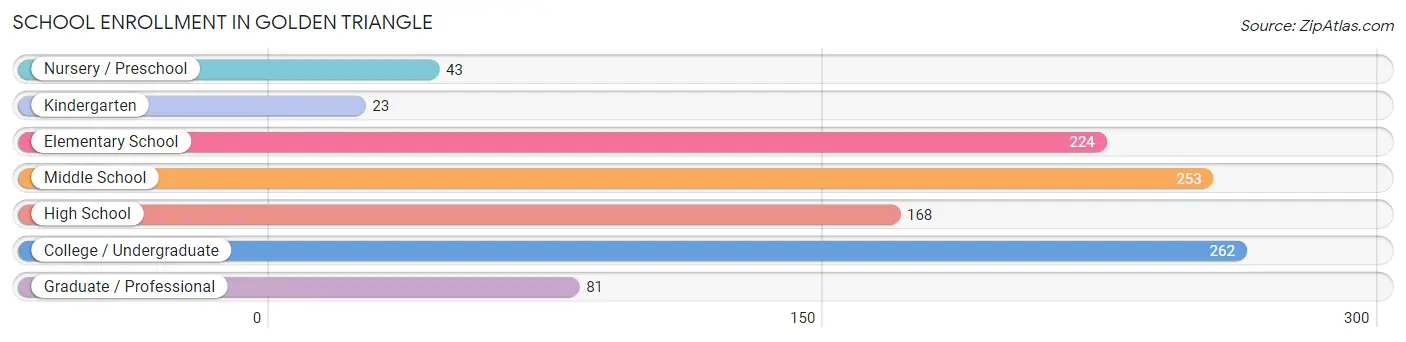
| School Level | # Students | % Students |
| Nursery / Preschool | 43 | 4.1% |
| Kindergarten | 23 | 2.2% |
| Elementary School | 224 | 21.2% |
| Middle School | 253 | 24.0% |
| High School | 168 | 15.9% |
| College / Undergraduate | 262 | 24.9% |
| Graduate / Professional | 81 | 7.7% |
| Total | 1,054 | 100.0% |
School Enrollment by Age by Funding Source in Golden Triangle
Out of a total of 1,054 students who are enrolled in schools in Golden Triangle, 162 (15.4%) attend a private institution, while the remaining 892 (84.6%) are enrolled in public schools. The age group of 3 to 4 year olds has the highest likelihood of being enrolled in private schools, with 43 (100.0% in the age bracket) enrolled. Conversely, the age group of 5 to 9 year old has the lowest likelihood of being enrolled in a private school, with 197 (100.0% in the age bracket) attending a public institution.
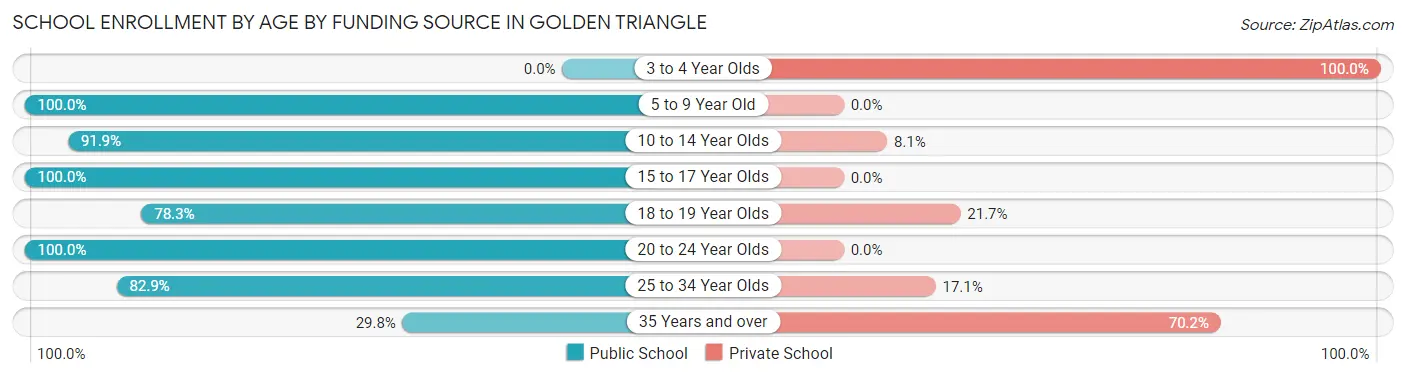
| Age Bracket | Public School | Private School |
| 3 to 4 Year Olds | 0 (0.0%) | 43 (100.0%) |
| 5 to 9 Year Old | 197 (100.0%) | 0 (0.0%) |
| 10 to 14 Year Olds | 308 (91.9%) | 27 (8.1%) |
| 15 to 17 Year Olds | 136 (100.0%) | 0 (0.0%) |
| 18 to 19 Year Olds | 72 (78.3%) | 20 (21.7%) |
| 20 to 24 Year Olds | 91 (100.0%) | 0 (0.0%) |
| 25 to 34 Year Olds | 63 (82.9%) | 13 (17.1%) |
| 35 Years and over | 25 (29.8%) | 59 (70.2%) |
| Total | 892 (84.6%) | 162 (15.4%) |
Educational Attainment by Field of Study in Golden Triangle
Business (409 | 22.8%), education (274 | 15.3%), engineering (228 | 12.7%), bio, nature & agricultural (183 | 10.2%), and visual & performing arts (138 | 7.7%) are the most common fields of study among 1,795 individuals in Golden Triangle who have obtained a bachelor's degree or higher.
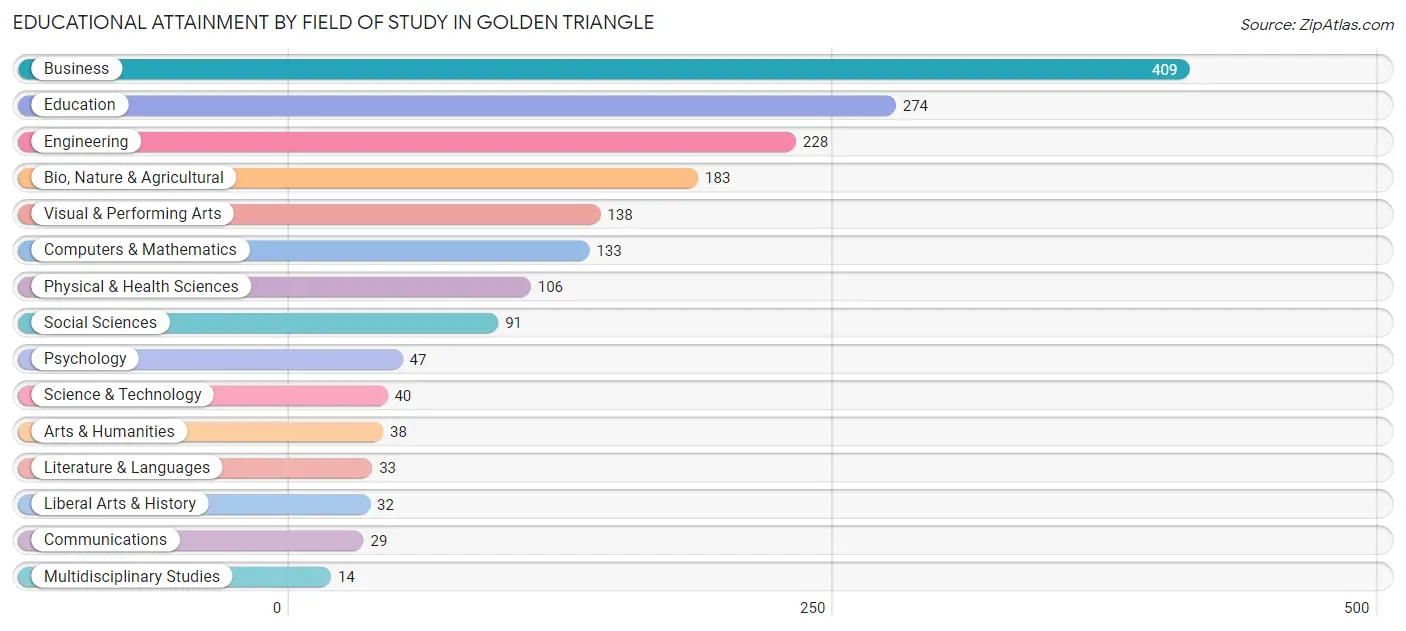
| Field of Study | # Graduates | % Graduates |
| Computers & Mathematics | 133 | 7.4% |
| Bio, Nature & Agricultural | 183 | 10.2% |
| Physical & Health Sciences | 106 | 5.9% |
| Psychology | 47 | 2.6% |
| Social Sciences | 91 | 5.1% |
| Engineering | 228 | 12.7% |
| Multidisciplinary Studies | 14 | 0.8% |
| Science & Technology | 40 | 2.2% |
| Business | 409 | 22.8% |
| Education | 274 | 15.3% |
| Literature & Languages | 33 | 1.8% |
| Liberal Arts & History | 32 | 1.8% |
| Visual & Performing Arts | 138 | 7.7% |
| Communications | 29 | 1.6% |
| Arts & Humanities | 38 | 2.1% |
| Total | 1,795 | 100.0% |
Transportation & Commute in Golden Triangle
Vehicle Availability by Sex in Golden Triangle
The most prevalent vehicle ownership categories in Golden Triangle are males with 2 vehicles (668, accounting for 52.6%) and females with 2 vehicles (518, making up 49.5%).
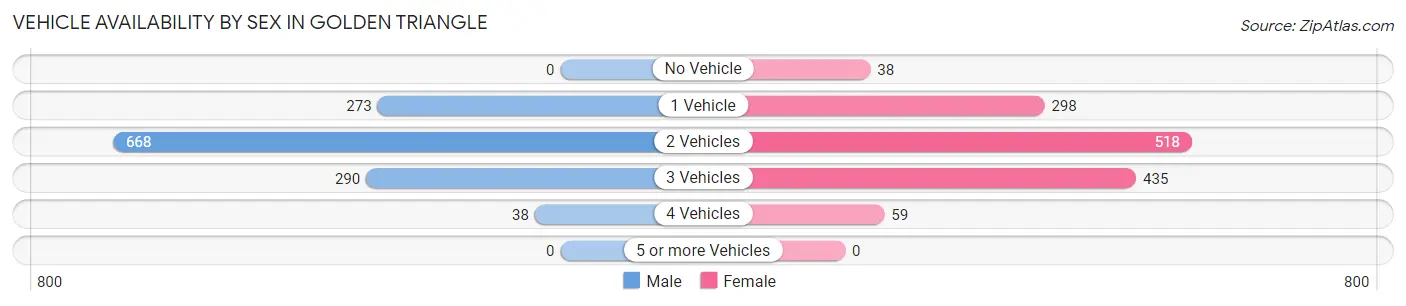
| Vehicles Available | Male | Female |
| No Vehicle | 0 (0.0%) | 38 (2.8%) |
| 1 Vehicle | 273 (21.5%) | 298 (22.1%) |
| 2 Vehicles | 668 (52.6%) | 518 (38.4%) |
| 3 Vehicles | 290 (22.9%) | 435 (32.3%) |
| 4 Vehicles | 38 (3.0%) | 59 (4.4%) |
| 5 or more Vehicles | 0 (0.0%) | 0 (0.0%) |
| Total | 1,269 (100.0%) | 1,348 (100.0%) |
Commute Time in Golden Triangle
The most frequently occuring commute durations in Golden Triangle are 20 to 24 minutes (612 commuters, 29.6%), 30 to 34 minutes (521 commuters, 25.2%), and 10 to 14 minutes (214 commuters, 10.4%).
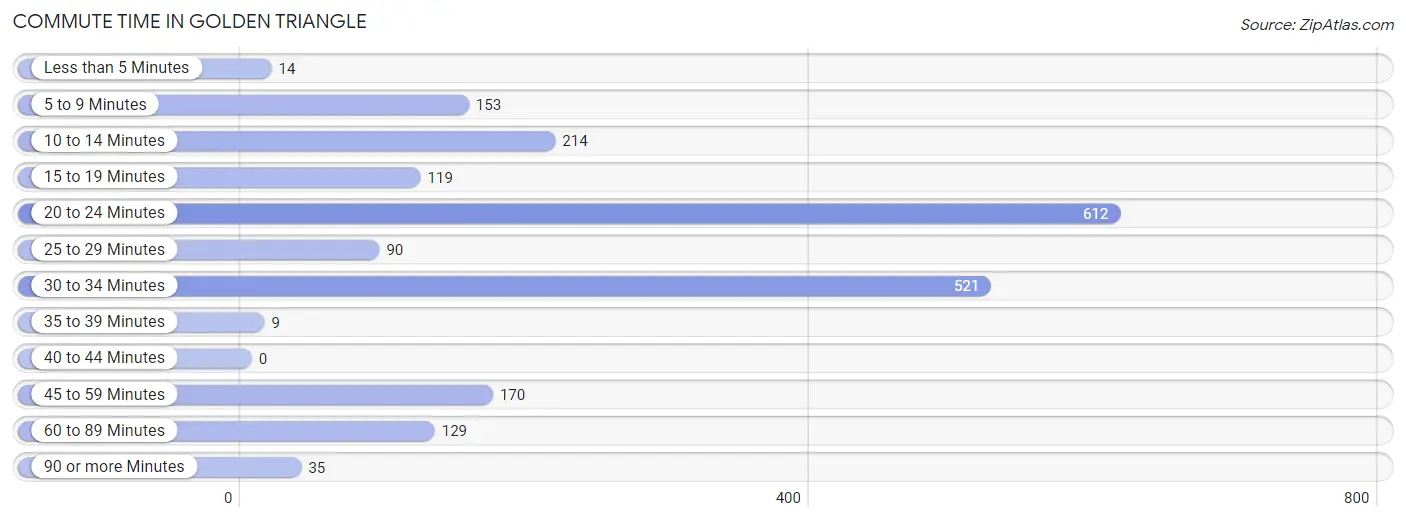
| Commute Time | # Commuters | % Commuters |
| Less than 5 Minutes | 14 | 0.7% |
| 5 to 9 Minutes | 153 | 7.4% |
| 10 to 14 Minutes | 214 | 10.4% |
| 15 to 19 Minutes | 119 | 5.8% |
| 20 to 24 Minutes | 612 | 29.6% |
| 25 to 29 Minutes | 90 | 4.4% |
| 30 to 34 Minutes | 521 | 25.2% |
| 35 to 39 Minutes | 9 | 0.4% |
| 40 to 44 Minutes | 0 | 0.0% |
| 45 to 59 Minutes | 170 | 8.2% |
| 60 to 89 Minutes | 129 | 6.2% |
| 90 or more Minutes | 35 | 1.7% |
Commute Time by Sex in Golden Triangle
The most common commute times in Golden Triangle are 20 to 24 minutes (232 commuters, 20.4%) for males and 20 to 24 minutes (380 commuters, 40.9%) for females.
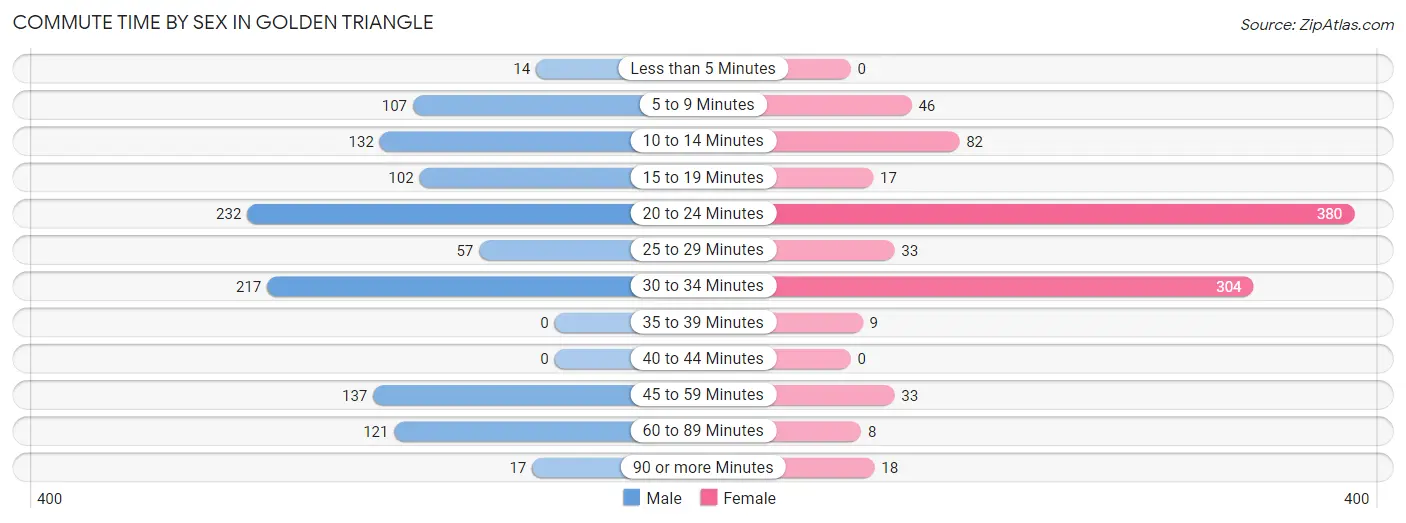
| Commute Time | Male | Female |
| Less than 5 Minutes | 14 (1.2%) | 0 (0.0%) |
| 5 to 9 Minutes | 107 (9.4%) | 46 (5.0%) |
| 10 to 14 Minutes | 132 (11.6%) | 82 (8.8%) |
| 15 to 19 Minutes | 102 (9.0%) | 17 (1.8%) |
| 20 to 24 Minutes | 232 (20.4%) | 380 (40.9%) |
| 25 to 29 Minutes | 57 (5.0%) | 33 (3.5%) |
| 30 to 34 Minutes | 217 (19.1%) | 304 (32.7%) |
| 35 to 39 Minutes | 0 (0.0%) | 9 (1.0%) |
| 40 to 44 Minutes | 0 (0.0%) | 0 (0.0%) |
| 45 to 59 Minutes | 137 (12.1%) | 33 (3.5%) |
| 60 to 89 Minutes | 121 (10.6%) | 8 (0.9%) |
| 90 or more Minutes | 17 (1.5%) | 18 (1.9%) |
Time of Departure to Work by Sex in Golden Triangle
The most frequent times of departure to work in Golden Triangle are 7:30 AM to 7:59 AM (290, 25.5%) for males and 12:00 PM to 3:59 PM (178, 19.1%) for females.
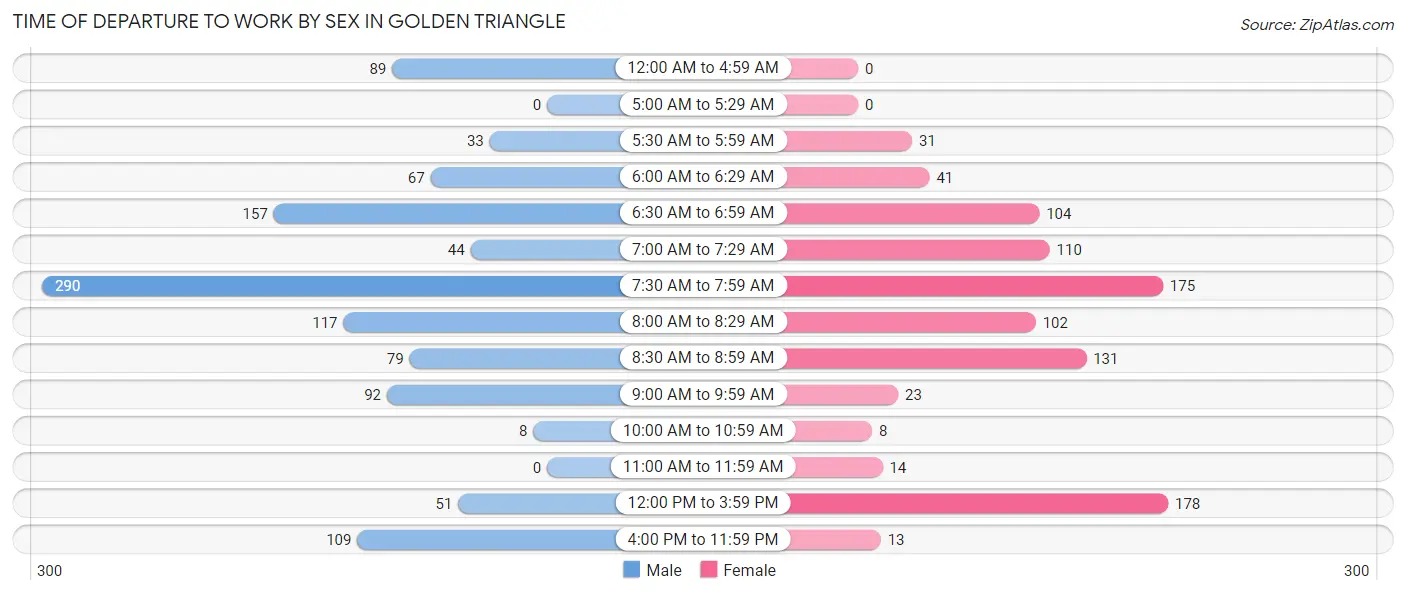
| Time of Departure | Male | Female |
| 12:00 AM to 4:59 AM | 89 (7.8%) | 0 (0.0%) |
| 5:00 AM to 5:29 AM | 0 (0.0%) | 0 (0.0%) |
| 5:30 AM to 5:59 AM | 33 (2.9%) | 31 (3.3%) |
| 6:00 AM to 6:29 AM | 67 (5.9%) | 41 (4.4%) |
| 6:30 AM to 6:59 AM | 157 (13.8%) | 104 (11.2%) |
| 7:00 AM to 7:29 AM | 44 (3.9%) | 110 (11.8%) |
| 7:30 AM to 7:59 AM | 290 (25.5%) | 175 (18.8%) |
| 8:00 AM to 8:29 AM | 117 (10.3%) | 102 (11.0%) |
| 8:30 AM to 8:59 AM | 79 (7.0%) | 131 (14.1%) |
| 9:00 AM to 9:59 AM | 92 (8.1%) | 23 (2.5%) |
| 10:00 AM to 10:59 AM | 8 (0.7%) | 8 (0.9%) |
| 11:00 AM to 11:59 AM | 0 (0.0%) | 14 (1.5%) |
| 12:00 PM to 3:59 PM | 51 (4.5%) | 178 (19.1%) |
| 4:00 PM to 11:59 PM | 109 (9.6%) | 13 (1.4%) |
| Total | 1,136 (100.0%) | 930 (100.0%) |
Housing Occupancy in Golden Triangle
Occupancy by Ownership in Golden Triangle
Of the total 2,109 dwellings in Golden Triangle, owner-occupied units account for 1,244 (59.0%), while renter-occupied units make up 865 (41.0%).
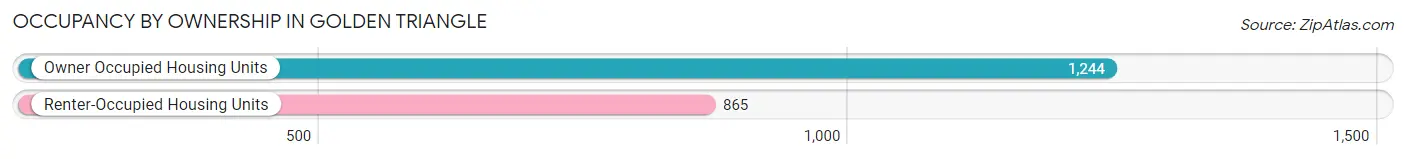
| Occupancy | # Housing Units | % Housing Units |
| Owner Occupied Housing Units | 1,244 | 59.0% |
| Renter-Occupied Housing Units | 865 | 41.0% |
| Total Occupied Housing Units | 2,109 | 100.0% |
Occupancy by Household Size in Golden Triangle
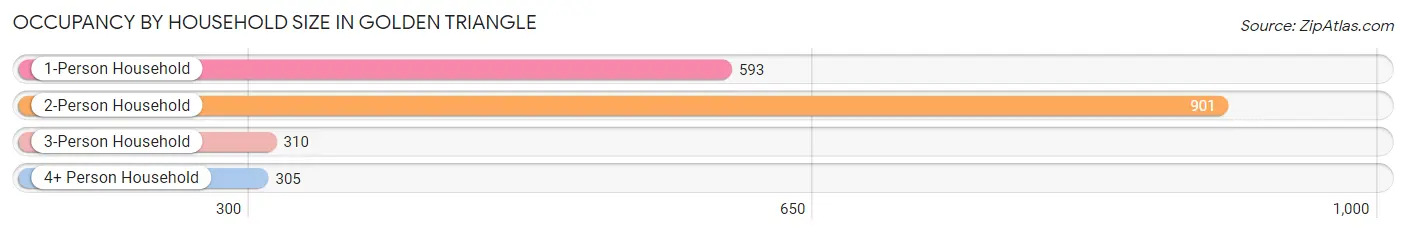
| Household Size | # Housing Units | % Housing Units |
| 1-Person Household | 593 | 28.1% |
| 2-Person Household | 901 | 42.7% |
| 3-Person Household | 310 | 14.7% |
| 4+ Person Household | 305 | 14.5% |
| Total Housing Units | 2,109 | 100.0% |
Occupancy by Ownership by Household Size in Golden Triangle
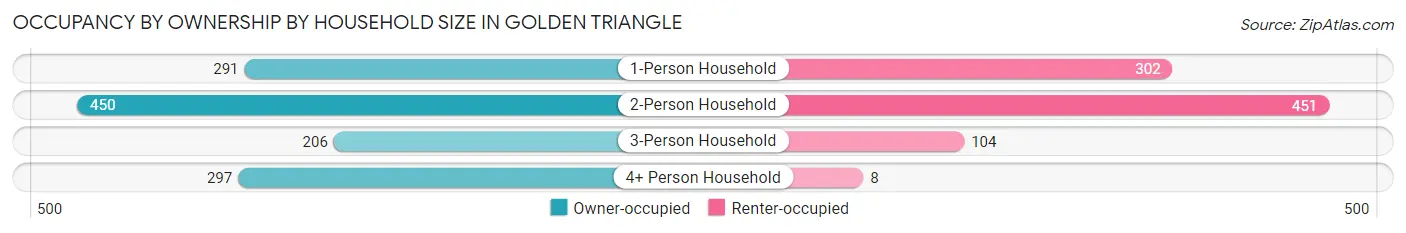
| Household Size | Owner-occupied | Renter-occupied |
| 1-Person Household | 291 (49.1%) | 302 (50.9%) |
| 2-Person Household | 450 (49.9%) | 451 (50.1%) |
| 3-Person Household | 206 (66.4%) | 104 (33.6%) |
| 4+ Person Household | 297 (97.4%) | 8 (2.6%) |
| Total Housing Units | 1,244 (59.0%) | 865 (41.0%) |
Occupancy by Educational Attainment in Golden Triangle
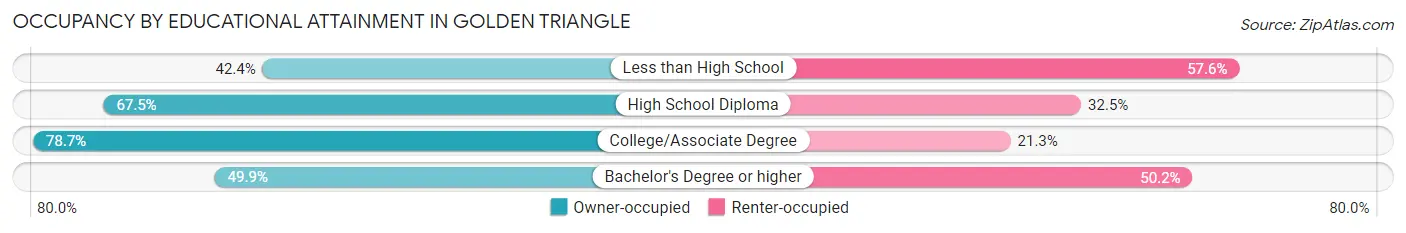
| Household Size | Owner-occupied | Renter-occupied |
| Less than High School | 98 (42.4%) | 133 (57.6%) |
| High School Diploma | 218 (67.5%) | 105 (32.5%) |
| College/Associate Degree | 417 (78.7%) | 113 (21.3%) |
| Bachelor's Degree or higher | 511 (49.8%) | 514 (50.1%) |
Occupancy by Age of Householder in Golden Triangle
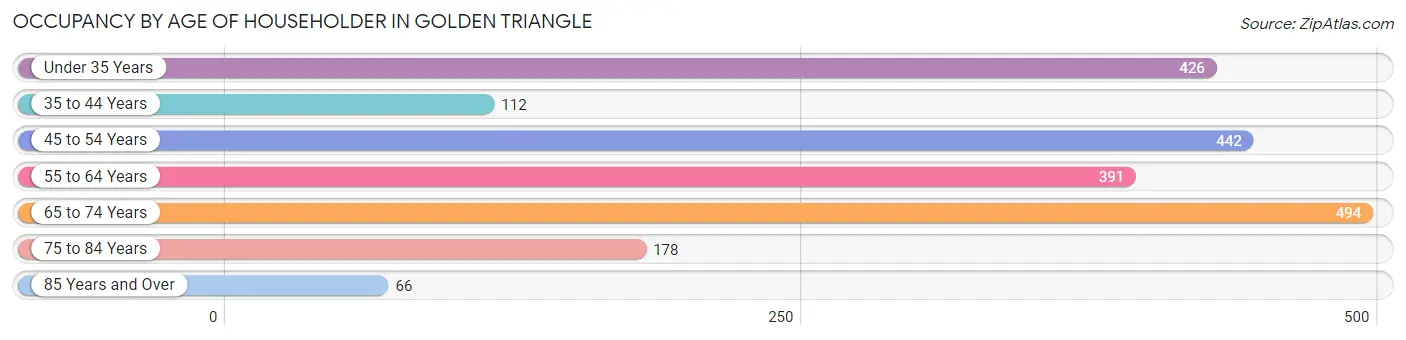
| Age Bracket | # Households | % Households |
| Under 35 Years | 426 | 20.2% |
| 35 to 44 Years | 112 | 5.3% |
| 45 to 54 Years | 442 | 21.0% |
| 55 to 64 Years | 391 | 18.5% |
| 65 to 74 Years | 494 | 23.4% |
| 75 to 84 Years | 178 | 8.4% |
| 85 Years and Over | 66 | 3.1% |
| Total | 2,109 | 100.0% |
Housing Finances in Golden Triangle
Median Income by Occupancy in Golden Triangle
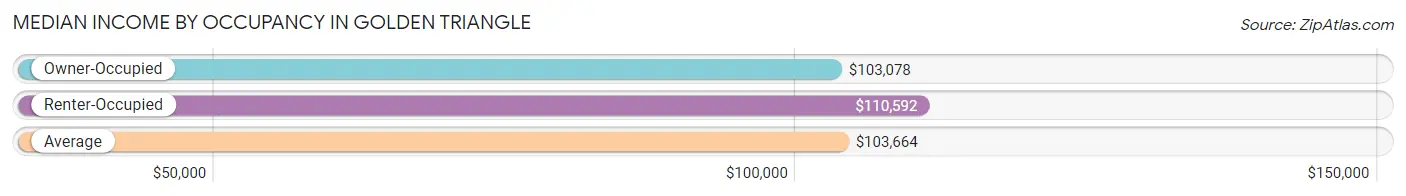
| Occupancy Type | # Households | Median Income |
| Owner-Occupied | 1,244 (59.0%) | $103,078 |
| Renter-Occupied | 865 (41.0%) | $110,592 |
| Average | 2,109 (100.0%) | $103,664 |
Occupancy by Householder Income Bracket in Golden Triangle
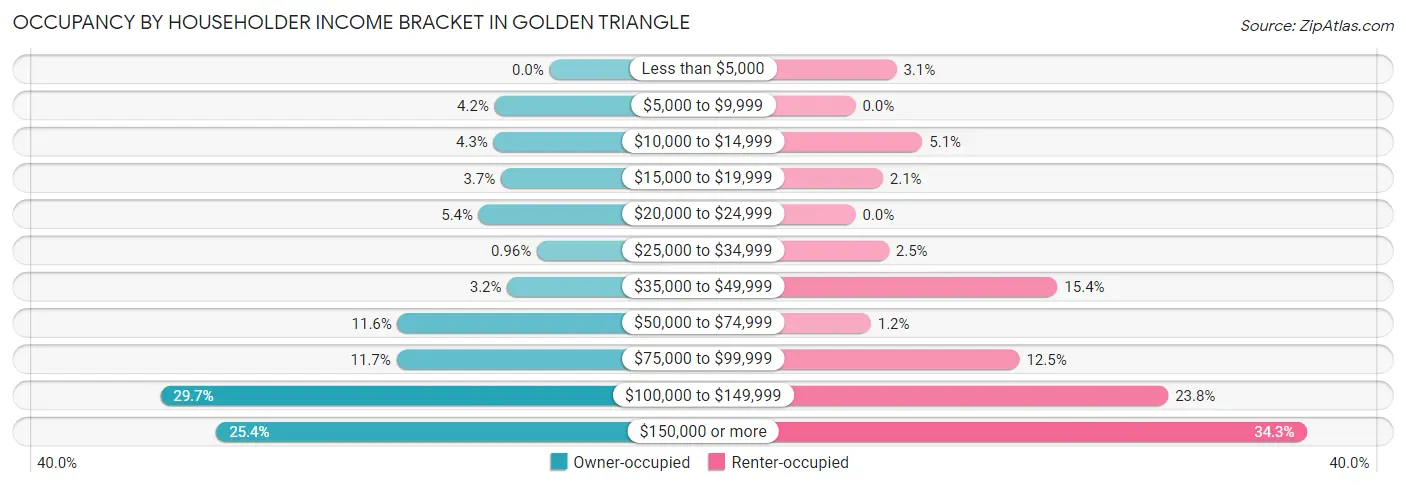
| Income Bracket | Owner-occupied | Renter-occupied |
| Less than $5,000 | 0 (0.0%) | 27 (3.1%) |
| $5,000 to $9,999 | 52 (4.2%) | 0 (0.0%) |
| $10,000 to $14,999 | 53 (4.3%) | 44 (5.1%) |
| $15,000 to $19,999 | 46 (3.7%) | 18 (2.1%) |
| $20,000 to $24,999 | 67 (5.4%) | 0 (0.0%) |
| $25,000 to $34,999 | 12 (1.0%) | 22 (2.5%) |
| $35,000 to $49,999 | 40 (3.2%) | 133 (15.4%) |
| $50,000 to $74,999 | 144 (11.6%) | 10 (1.2%) |
| $75,000 to $99,999 | 145 (11.7%) | 108 (12.5%) |
| $100,000 to $149,999 | 369 (29.7%) | 206 (23.8%) |
| $150,000 or more | 316 (25.4%) | 297 (34.3%) |
| Total | 1,244 (100.0%) | 865 (100.0%) |
Monthly Housing Cost Tiers in Golden Triangle
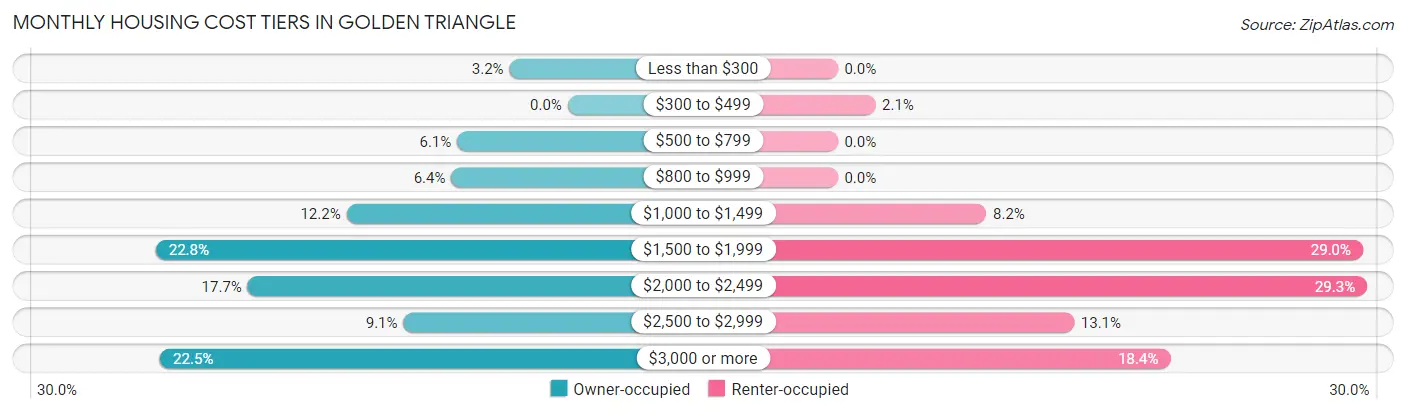
| Monthly Cost | Owner-occupied | Renter-occupied |
| Less than $300 | 40 (3.2%) | 0 (0.0%) |
| $300 to $499 | 0 (0.0%) | 18 (2.1%) |
| $500 to $799 | 76 (6.1%) | 0 (0.0%) |
| $800 to $999 | 80 (6.4%) | 0 (0.0%) |
| $1,000 to $1,499 | 152 (12.2%) | 71 (8.2%) |
| $1,500 to $1,999 | 283 (22.8%) | 251 (29.0%) |
| $2,000 to $2,499 | 220 (17.7%) | 253 (29.2%) |
| $2,500 to $2,999 | 113 (9.1%) | 113 (13.1%) |
| $3,000 or more | 280 (22.5%) | 159 (18.4%) |
| Total | 1,244 (100.0%) | 865 (100.0%) |
Physical Housing Characteristics in Golden Triangle
Housing Structures in Golden Triangle
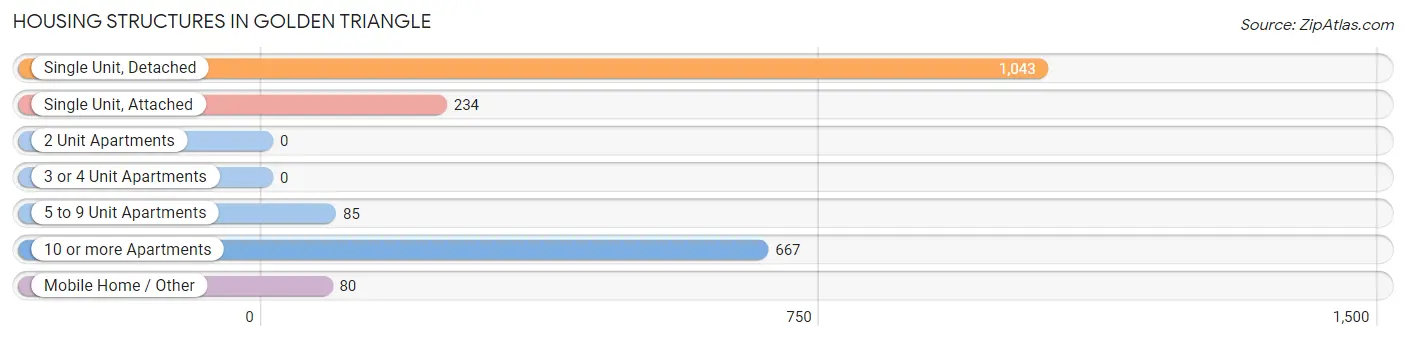
| Structure Type | # Housing Units | % Housing Units |
| Single Unit, Detached | 1,043 | 49.4% |
| Single Unit, Attached | 234 | 11.1% |
| 2 Unit Apartments | 0 | 0.0% |
| 3 or 4 Unit Apartments | 0 | 0.0% |
| 5 to 9 Unit Apartments | 85 | 4.0% |
| 10 or more Apartments | 667 | 31.6% |
| Mobile Home / Other | 80 | 3.8% |
| Total | 2,109 | 100.0% |
Housing Structures by Occupancy in Golden Triangle
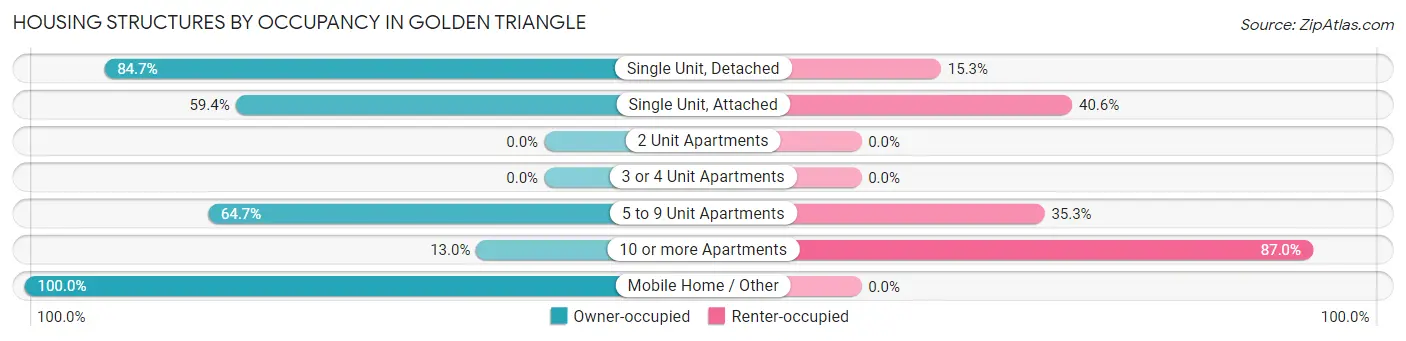
| Structure Type | Owner-occupied | Renter-occupied |
| Single Unit, Detached | 883 (84.7%) | 160 (15.3%) |
| Single Unit, Attached | 139 (59.4%) | 95 (40.6%) |
| 2 Unit Apartments | 0 (0.0%) | 0 (0.0%) |
| 3 or 4 Unit Apartments | 0 (0.0%) | 0 (0.0%) |
| 5 to 9 Unit Apartments | 55 (64.7%) | 30 (35.3%) |
| 10 or more Apartments | 87 (13.0%) | 580 (87.0%) |
| Mobile Home / Other | 80 (100.0%) | 0 (0.0%) |
| Total | 1,244 (59.0%) | 865 (41.0%) |
Housing Structures by Number of Rooms in Golden Triangle
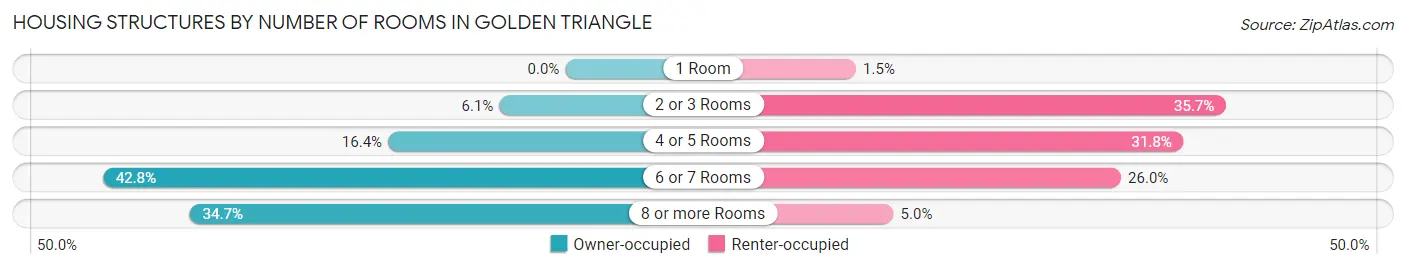
| Number of Rooms | Owner-occupied | Renter-occupied |
| 1 Room | 0 (0.0%) | 13 (1.5%) |
| 2 or 3 Rooms | 76 (6.1%) | 309 (35.7%) |
| 4 or 5 Rooms | 204 (16.4%) | 275 (31.8%) |
| 6 or 7 Rooms | 532 (42.8%) | 225 (26.0%) |
| 8 or more Rooms | 432 (34.7%) | 43 (5.0%) |
| Total | 1,244 (100.0%) | 865 (100.0%) |
Housing Structure by Heating Type in Golden Triangle
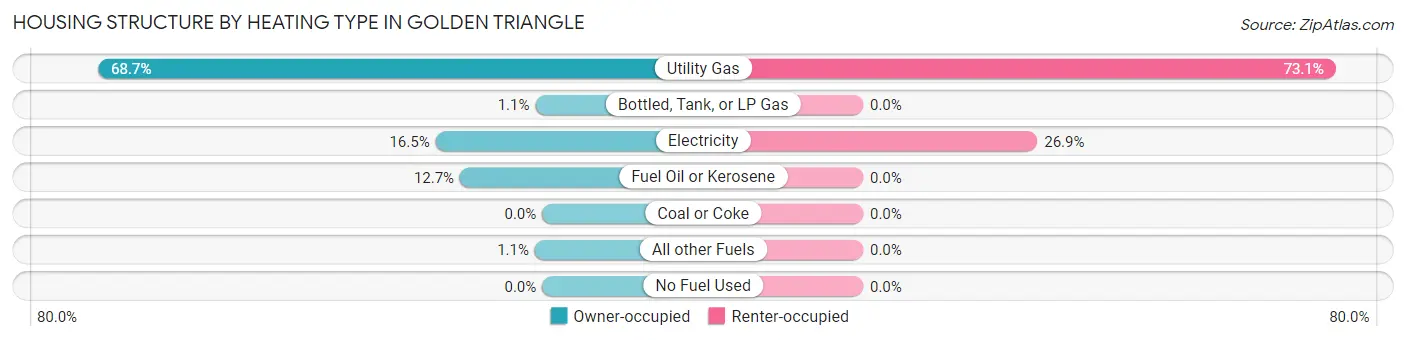
| Heating Type | Owner-occupied | Renter-occupied |
| Utility Gas | 854 (68.6%) | 632 (73.1%) |
| Bottled, Tank, or LP Gas | 13 (1.1%) | 0 (0.0%) |
| Electricity | 205 (16.5%) | 233 (26.9%) |
| Fuel Oil or Kerosene | 158 (12.7%) | 0 (0.0%) |
| Coal or Coke | 0 (0.0%) | 0 (0.0%) |
| All other Fuels | 14 (1.1%) | 0 (0.0%) |
| No Fuel Used | 0 (0.0%) | 0 (0.0%) |
| Total | 1,244 (100.0%) | 865 (100.0%) |
Household Vehicle Usage in Golden Triangle
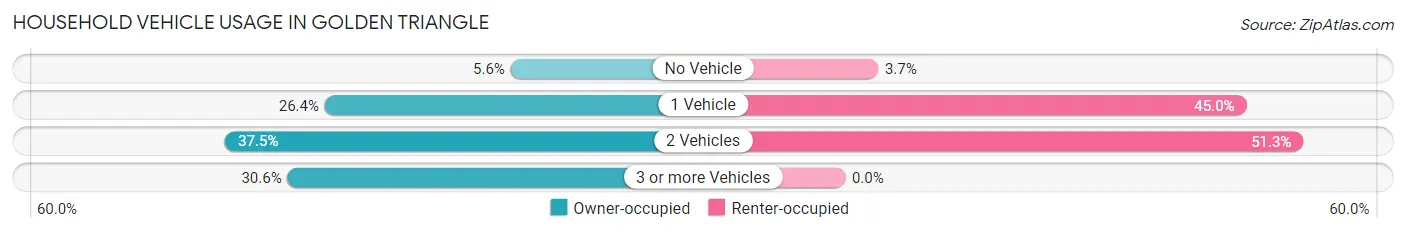
| Vehicles per Household | Owner-occupied | Renter-occupied |
| No Vehicle | 69 (5.6%) | 32 (3.7%) |
| 1 Vehicle | 328 (26.4%) | 389 (45.0%) |
| 2 Vehicles | 467 (37.5%) | 444 (51.3%) |
| 3 or more Vehicles | 380 (30.5%) | 0 (0.0%) |
| Total | 1,244 (100.0%) | 865 (100.0%) |
Real Estate & Mortgages in Golden Triangle
Real Estate and Mortgage Overview in Golden Triangle
| Characteristic | Without Mortgage | With Mortgage |
| Housing Units | 376 | 868 |
| Median Property Value | $243,200 | $288,700 |
| Median Household Income | - | - |
| Monthly Housing Costs | $985 | $280 |
| Real Estate Taxes | $6,890 | $37 |
Property Value by Mortgage Status in Golden Triangle
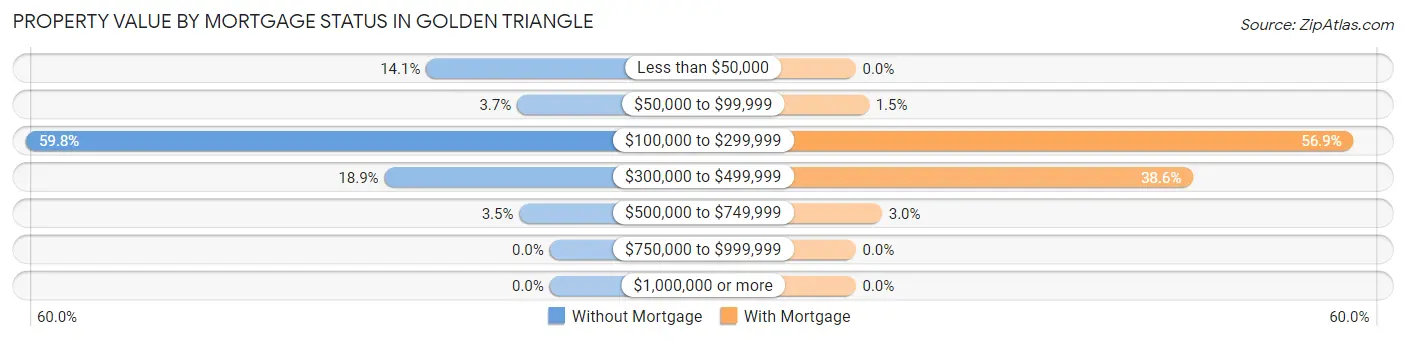
| Property Value | Without Mortgage | With Mortgage |
| Less than $50,000 | 53 (14.1%) | 0 (0.0%) |
| $50,000 to $99,999 | 14 (3.7%) | 13 (1.5%) |
| $100,000 to $299,999 | 225 (59.8%) | 494 (56.9%) |
| $300,000 to $499,999 | 71 (18.9%) | 335 (38.6%) |
| $500,000 to $749,999 | 13 (3.5%) | 26 (3.0%) |
| $750,000 to $999,999 | 0 (0.0%) | 0 (0.0%) |
| $1,000,000 or more | 0 (0.0%) | 0 (0.0%) |
| Total | 376 (100.0%) | 868 (100.0%) |
Household Income by Mortgage Status in Golden Triangle
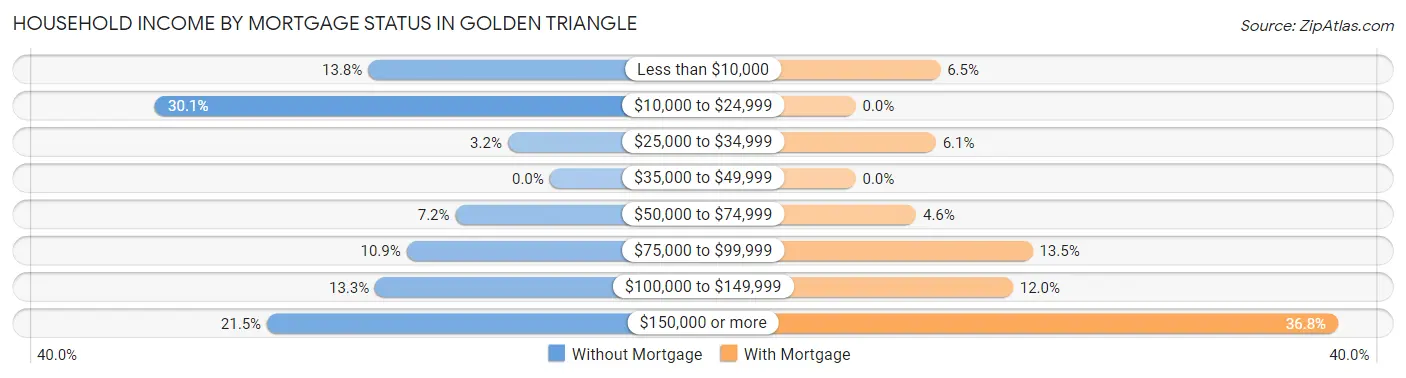
| Household Income | Without Mortgage | With Mortgage |
| Less than $10,000 | 52 (13.8%) | 56 (6.5%) |
| $10,000 to $24,999 | 113 (30.0%) | 0 (0.0%) |
| $25,000 to $34,999 | 12 (3.2%) | 53 (6.1%) |
| $35,000 to $49,999 | 0 (0.0%) | 0 (0.0%) |
| $50,000 to $74,999 | 27 (7.2%) | 40 (4.6%) |
| $75,000 to $99,999 | 41 (10.9%) | 117 (13.5%) |
| $100,000 to $149,999 | 50 (13.3%) | 104 (12.0%) |
| $150,000 or more | 81 (21.5%) | 319 (36.7%) |
| Total | 376 (100.0%) | 868 (100.0%) |
Property Value to Household Income Ratio in Golden Triangle
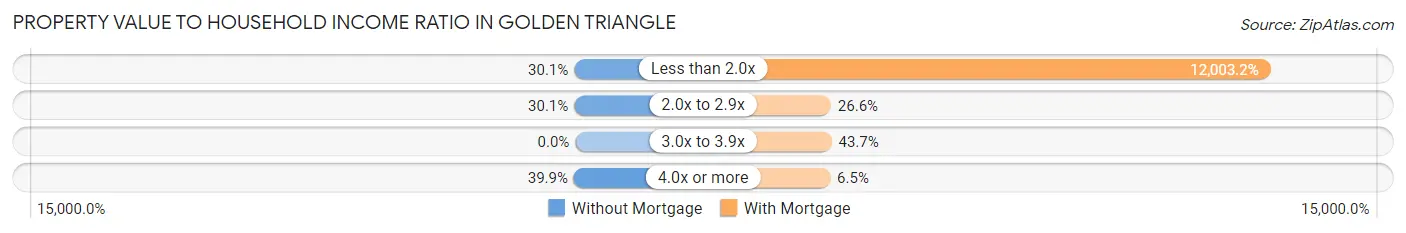
| Value-to-Income Ratio | Without Mortgage | With Mortgage |
| Less than 2.0x | 113 (30.0%) | 104,188 (12,003.2%) |
| 2.0x to 2.9x | 113 (30.0%) | 231 (26.6%) |
| 3.0x to 3.9x | 0 (0.0%) | 379 (43.7%) |
| 4.0x or more | 150 (39.9%) | 56 (6.5%) |
| Total | 376 (100.0%) | 868 (100.0%) |
Real Estate Taxes by Mortgage Status in Golden Triangle
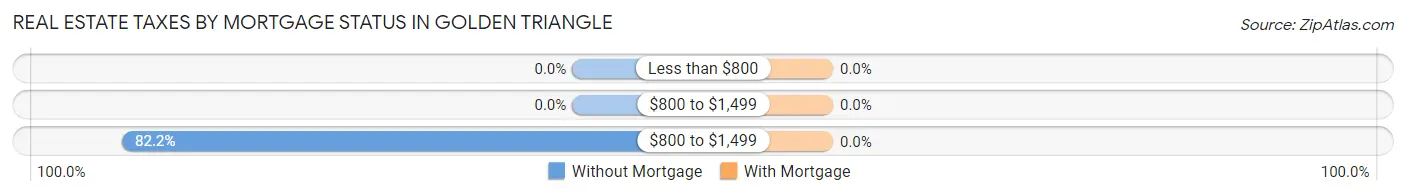
| Property Taxes | Without Mortgage | With Mortgage |
| Less than $800 | 0 (0.0%) | 0 (0.0%) |
| $800 to $1,499 | 0 (0.0%) | 0 (0.0%) |
| $800 to $1,499 | 309 (82.2%) | 0 (0.0%) |
| Total | 376 (100.0%) | 868 (100.0%) |
Health & Disability in Golden Triangle
Health Insurance Coverage by Age in Golden Triangle
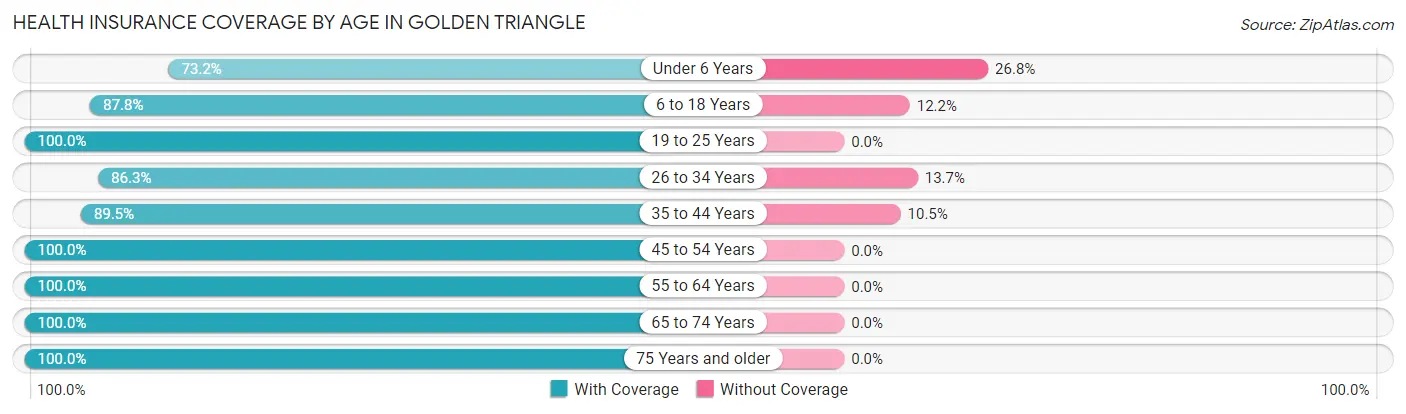
| Age Bracket | With Coverage | Without Coverage |
| Under 6 Years | 60 (73.2%) | 22 (26.8%) |
| 6 to 18 Years | 647 (87.8%) | 90 (12.2%) |
| 19 to 25 Years | 338 (100.0%) | 0 (0.0%) |
| 26 to 34 Years | 554 (86.3%) | 88 (13.7%) |
| 35 to 44 Years | 392 (89.5%) | 46 (10.5%) |
| 45 to 54 Years | 679 (100.0%) | 0 (0.0%) |
| 55 to 64 Years | 631 (100.0%) | 0 (0.0%) |
| 65 to 74 Years | 914 (100.0%) | 0 (0.0%) |
| 75 Years and older | 281 (100.0%) | 0 (0.0%) |
| Total | 4,496 (94.8%) | 246 (5.2%) |
Health Insurance Coverage by Citizenship Status in Golden Triangle
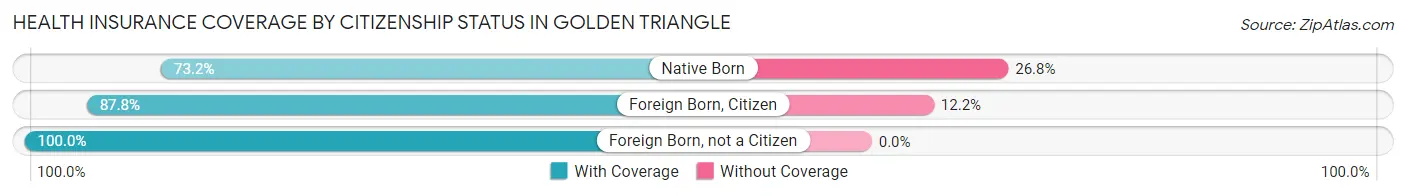
| Citizenship Status | With Coverage | Without Coverage |
| Native Born | 60 (73.2%) | 22 (26.8%) |
| Foreign Born, Citizen | 647 (87.8%) | 90 (12.2%) |
| Foreign Born, not a Citizen | 338 (100.0%) | 0 (0.0%) |
Health Insurance Coverage by Household Income in Golden Triangle
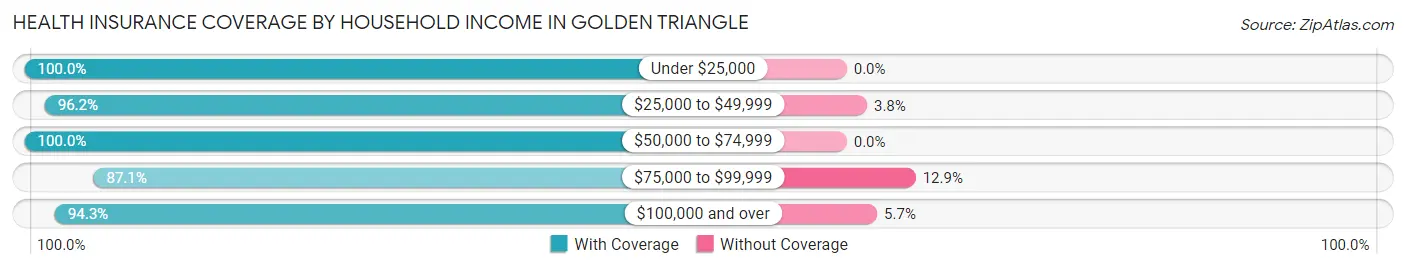
| Household Income | With Coverage | Without Coverage |
| Under $25,000 | 456 (100.0%) | 0 (0.0%) |
| $25,000 to $49,999 | 355 (96.2%) | 14 (3.8%) |
| $50,000 to $74,999 | 527 (100.0%) | 0 (0.0%) |
| $75,000 to $99,999 | 472 (87.1%) | 70 (12.9%) |
| $100,000 and over | 2,686 (94.3%) | 162 (5.7%) |
Public vs Private Health Insurance Coverage by Age in Golden Triangle
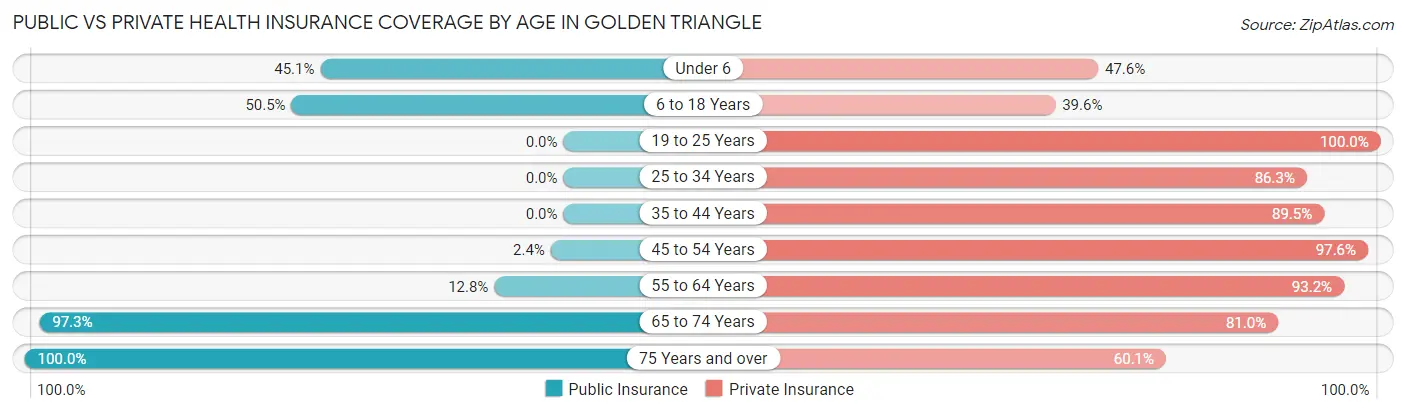
| Age Bracket | Public Insurance | Private Insurance |
| Under 6 | 37 (45.1%) | 39 (47.6%) |
| 6 to 18 Years | 372 (50.5%) | 292 (39.6%) |
| 19 to 25 Years | 0 (0.0%) | 338 (100.0%) |
| 25 to 34 Years | 0 (0.0%) | 554 (86.3%) |
| 35 to 44 Years | 0 (0.0%) | 392 (89.5%) |
| 45 to 54 Years | 16 (2.4%) | 663 (97.6%) |
| 55 to 64 Years | 81 (12.8%) | 588 (93.2%) |
| 65 to 74 Years | 889 (97.3%) | 740 (81.0%) |
| 75 Years and over | 281 (100.0%) | 169 (60.1%) |
| Total | 1,676 (35.3%) | 3,775 (79.6%) |
Disability Status by Sex by Age in Golden Triangle
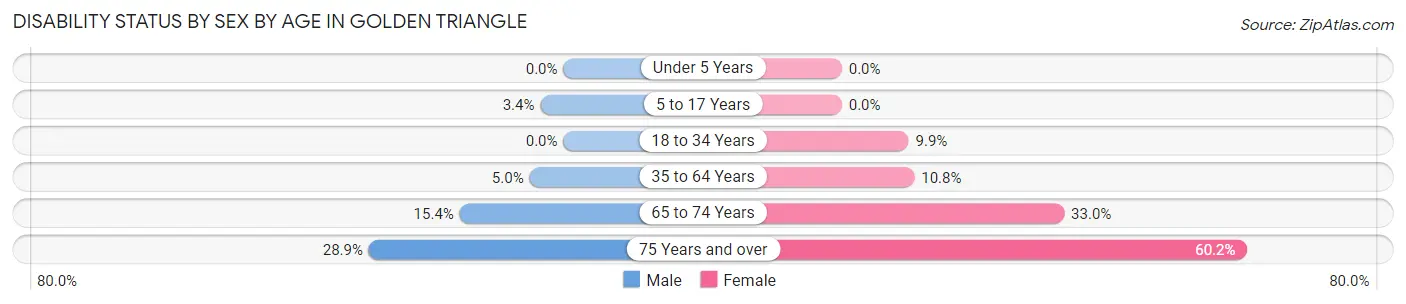
| Age Bracket | Male | Female |
| Under 5 Years | 0 (0.0%) | 0 (0.0%) |
| 5 to 17 Years | 15 (3.4%) | 0 (0.0%) |
| 18 to 34 Years | 0 (0.0%) | 52 (9.9%) |
| 35 to 64 Years | 36 (5.0%) | 111 (10.8%) |
| 65 to 74 Years | 75 (15.4%) | 141 (33.0%) |
| 75 Years and over | 26 (28.9%) | 115 (60.2%) |
Disability Class by Sex by Age in Golden Triangle
Disability Class: Hearing Difficulty
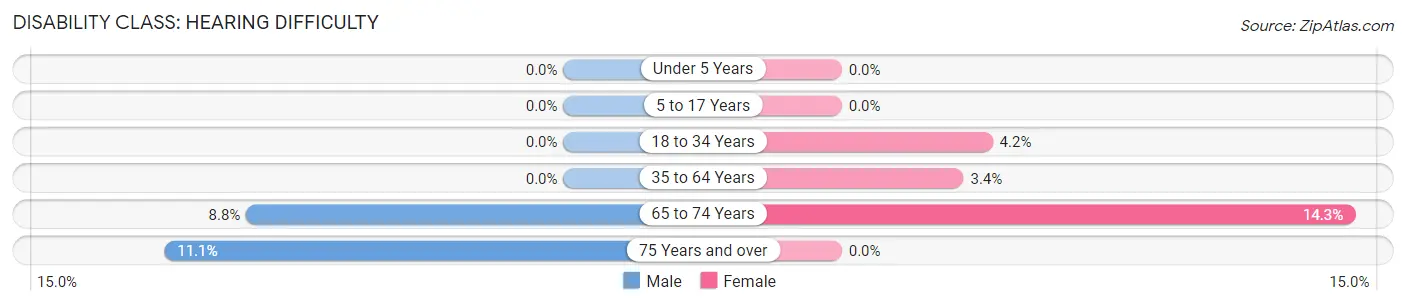
| Age Bracket | Male | Female |
| Under 5 Years | 0 (0.0%) | 0 (0.0%) |
| 5 to 17 Years | 0 (0.0%) | 0 (0.0%) |
| 18 to 34 Years | 0 (0.0%) | 22 (4.2%) |
| 35 to 64 Years | 0 (0.0%) | 35 (3.4%) |
| 65 to 74 Years | 43 (8.8%) | 61 (14.3%) |
| 75 Years and over | 10 (11.1%) | 0 (0.0%) |
Disability Class: Vision Difficulty
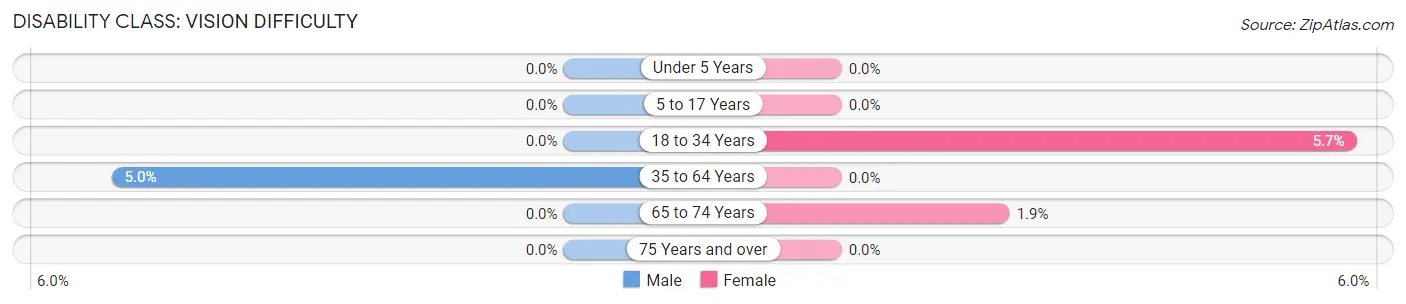
| Age Bracket | Male | Female |
| Under 5 Years | 0 (0.0%) | 0 (0.0%) |
| 5 to 17 Years | 0 (0.0%) | 0 (0.0%) |
| 18 to 34 Years | 0 (0.0%) | 30 (5.7%) |
| 35 to 64 Years | 36 (5.0%) | 0 (0.0%) |
| 65 to 74 Years | 0 (0.0%) | 8 (1.9%) |
| 75 Years and over | 0 (0.0%) | 0 (0.0%) |
Disability Class: Cognitive Difficulty
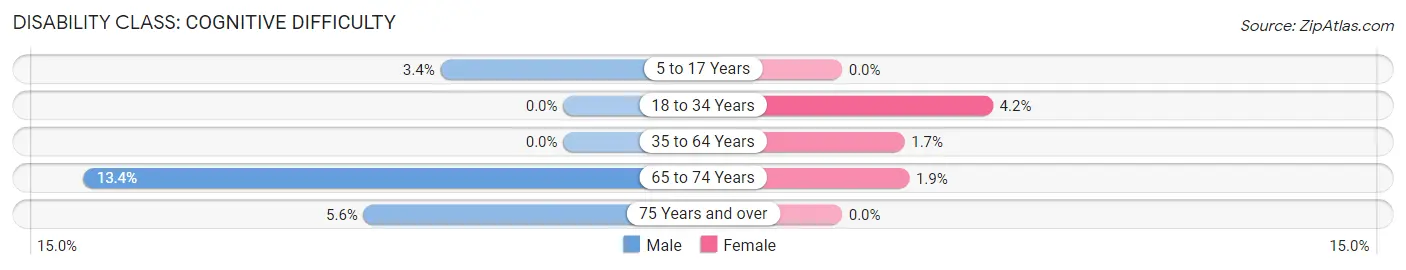
| Age Bracket | Male | Female |
| 5 to 17 Years | 15 (3.4%) | 0 (0.0%) |
| 18 to 34 Years | 0 (0.0%) | 22 (4.2%) |
| 35 to 64 Years | 0 (0.0%) | 18 (1.7%) |
| 65 to 74 Years | 65 (13.4%) | 8 (1.9%) |
| 75 Years and over | 5 (5.6%) | 0 (0.0%) |
Disability Class: Ambulatory Difficulty
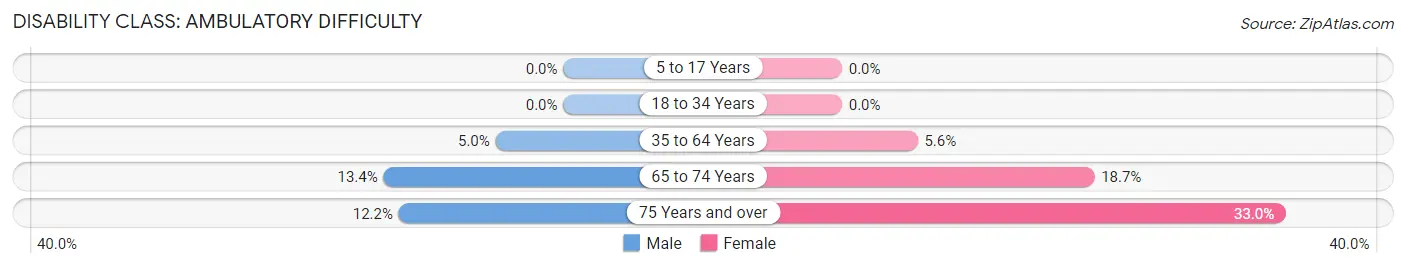
| Age Bracket | Male | Female |
| 5 to 17 Years | 0 (0.0%) | 0 (0.0%) |
| 18 to 34 Years | 0 (0.0%) | 0 (0.0%) |
| 35 to 64 Years | 36 (5.0%) | 58 (5.6%) |
| 65 to 74 Years | 65 (13.4%) | 80 (18.7%) |
| 75 Years and over | 11 (12.2%) | 63 (33.0%) |
Disability Class: Self-Care Difficulty
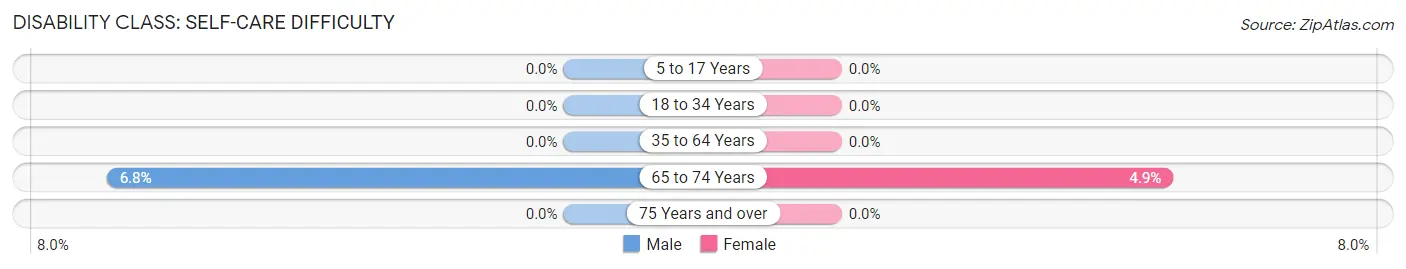
| Age Bracket | Male | Female |
| 5 to 17 Years | 0 (0.0%) | 0 (0.0%) |
| 18 to 34 Years | 0 (0.0%) | 0 (0.0%) |
| 35 to 64 Years | 0 (0.0%) | 0 (0.0%) |
| 65 to 74 Years | 33 (6.8%) | 21 (4.9%) |
| 75 Years and over | 0 (0.0%) | 0 (0.0%) |
Technology Access in Golden Triangle
Computing Device Access in Golden Triangle
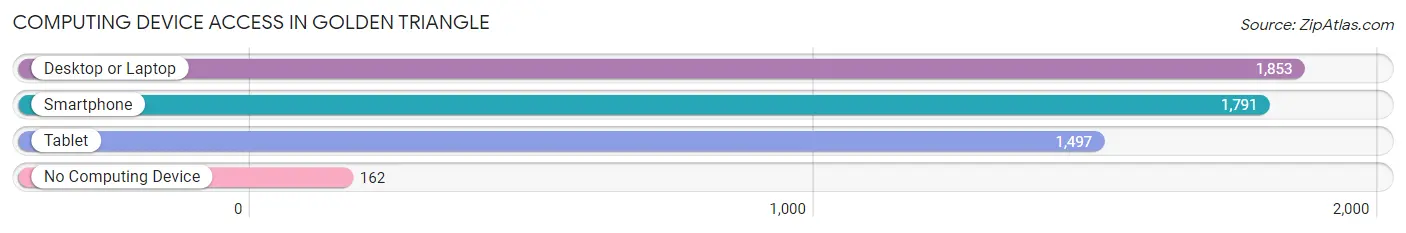
| Device Type | # Households | % Households |
| Desktop or Laptop | 1,853 | 87.9% |
| Smartphone | 1,791 | 84.9% |
| Tablet | 1,497 | 71.0% |
| No Computing Device | 162 | 7.7% |
| Total | 2,109 | 100.0% |
Internet Access in Golden Triangle
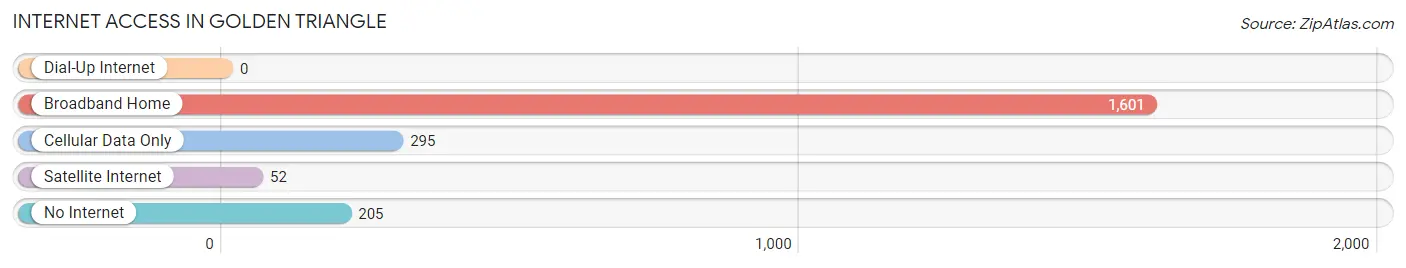
| Internet Type | # Households | % Households |
| Dial-Up Internet | 0 | 0.0% |
| Broadband Home | 1,601 | 75.9% |
| Cellular Data Only | 295 | 14.0% |
| Satellite Internet | 52 | 2.5% |
| No Internet | 205 | 9.7% |
| Total | 2,109 | 100.0% |
Golden Triangle Summary
The town of Golden Triangle, New Jersey is located in the southern part of the state, in the county of Burlington. It is a small, rural community with a population of just over 1,000 people. The town is situated on the banks of the Rancocas Creek, and is surrounded by lush green fields and forests.
History
The area that is now Golden Triangle was first settled in the late 1600s by English and Dutch settlers. The town was originally known as “Rancocas”, and was part of the larger township of Chesterfield. In 1795, the town was officially incorporated as “Golden Triangle”, and the name was chosen to reflect the three rivers that converge in the area: the Rancocas, the Assiscunk, and the Crosswicks.
The town was a popular destination for vacationers in the late 1800s and early 1900s, and was home to several resorts and hotels. The town was also known for its thriving agricultural industry, and was home to several farms and orchards.
Geography
Golden Triangle is located in the southern part of Burlington County, New Jersey. It is situated on the banks of the Rancocas Creek, and is surrounded by lush green fields and forests. The town is located approximately 25 miles from Philadelphia, and is easily accessible by car or train.
The town is divided into two sections: the “Upper” and “Lower” sections. The Upper section is located on the north side of the creek, and is home to the town’s main commercial district. The Lower section is located on the south side of the creek, and is home to the town’s residential neighborhoods.
Economy
The economy of Golden Triangle is largely based on agriculture and tourism. The town is home to several farms and orchards, and is a popular destination for vacationers. The town is also home to several small businesses, including restaurants, shops, and other services.
Demographics
As of the 2010 census, the population of Golden Triangle was 1,072. The racial makeup of the town was 94.3% White, 2.2% African American, 0.3% Native American, 0.7% Asian, and 2.5% from other races. The median household income was $60,938, and the median family income was $68,750.
Conclusion
Golden Triangle, New Jersey is a small, rural town located in the southern part of Burlington County. The town is situated on the banks of the Rancocas Creek, and is surrounded by lush green fields and forests. The town’s economy is largely based on agriculture and tourism, and the town is home to several small businesses. The population of Golden Triangle is just over 1,000 people, and the town is a popular destination for vacationers.
Common Questions
What is Per Capita Income in Golden Triangle?
Per Capita income in Golden Triangle is $60,604.
What is the Median Family Income in Golden Triangle?
Median Family Income in Golden Triangle is $103,031.
What is the Median Household income in Golden Triangle?
Median Household Income in Golden Triangle is $103,664.
What is Income or Wage Gap in Golden Triangle?
Income or Wage Gap in Golden Triangle is 33.2%.
Women in Golden Triangle earn 66.8 cents for every dollar earned by a man.
What is Inequality or Gini Index in Golden Triangle?
Inequality or Gini Index in Golden Triangle is 0.50.
What is the Total Population of Golden Triangle?
Total Population of Golden Triangle is 4,960.
What is the Total Male Population of Golden Triangle?
Total Male Population of Golden Triangle is 2,414.
What is the Total Female Population of Golden Triangle?
Total Female Population of Golden Triangle is 2,546.
What is the Ratio of Males per 100 Females in Golden Triangle?
There are 94.82 Males per 100 Females in Golden Triangle.
What is the Ratio of Females per 100 Males in Golden Triangle?
There are 105.47 Females per 100 Males in Golden Triangle.
What is the Median Population Age in Golden Triangle?
Median Population Age in Golden Triangle is 47.2 Years.
What is the Average Family Size in Golden Triangle
Average Family Size in Golden Triangle is 2.9 People.
What is the Average Household Size in Golden Triangle
Average Household Size in Golden Triangle is 2.3 People.
How Large is the Labor Force in Golden Triangle?
There are 2,762 People in the Labor Forcein in Golden Triangle.
What is the Percentage of People in the Labor Force in Golden Triangle?
63.9% of People are in the Labor Force in Golden Triangle.
What is the Unemployment Rate in Golden Triangle?
Unemployment Rate in Golden Triangle is 4.3%.