Farmingdale borough, NJ Map & Demographics
Farmingdale borough Overview
$42,735
PER CAPITA INCOME
$113,750
AVG FAMILY INCOME
$93,523
AVG HOUSEHOLD INCOME
44.5%
WAGE / INCOME GAP [ % ]
55.5¢/ $1
WAGE / INCOME GAP [ $ ]
0.36
INEQUALITY / GINI INDEX
1,326
TOTAL POPULATION
666
MALE POPULATION
660
FEMALE POPULATION
100.91
MALES / 100 FEMALES
99.10
FEMALES / 100 MALES
38.9
MEDIAN AGE
3.3
AVG FAMILY SIZE
2.4
AVG HOUSEHOLD SIZE
738
LABOR FORCE [ PEOPLE ]
64.1%
PERCENT IN LABOR FORCE
11.1%
UNEMPLOYMENT RATE
Income in Farmingdale borough
Income Overview in Farmingdale borough
Per Capita Income in Farmingdale borough is $42,735, while median incomes of families and households are $113,750 and $93,523 respectively.
| Characteristic | Number | Measure |
| Per Capita Income | 1,326 | $42,735 |
| Median Family Income | 320 | $113,750 |
| Mean Family Income | 320 | $127,870 |
| Median Household Income | 541 | $93,523 |
| Mean Household Income | 541 | $104,844 |
| Income Deficit | 320 | $0 |
| Wage / Income Gap (%) | 1,326 | 44.53% |
| Wage / Income Gap ($) | 1,326 | 55.47¢ per $1 |
| Gini / Inequality Index | 1,326 | 0.36 |
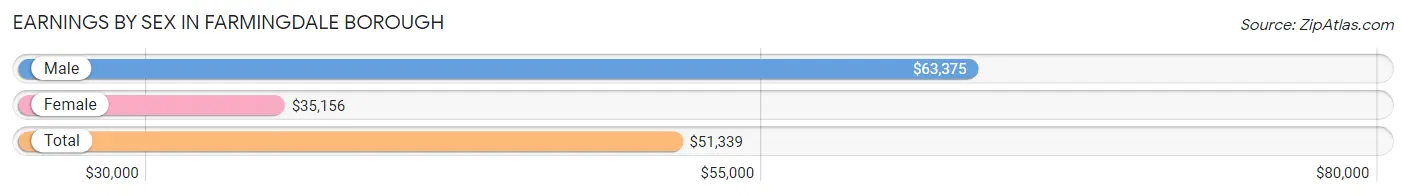
Earnings by Sex in Farmingdale borough
Average Earnings in Farmingdale borough are $51,339, $63,375 for men and $35,156 for women, a difference of 44.5%.
| Sex | Number | Average Earnings |
| Male | 402 (51.7%) | $63,375 |
| Female | 375 (48.3%) | $35,156 |
| Total | 777 (100.0%) | $51,339 |
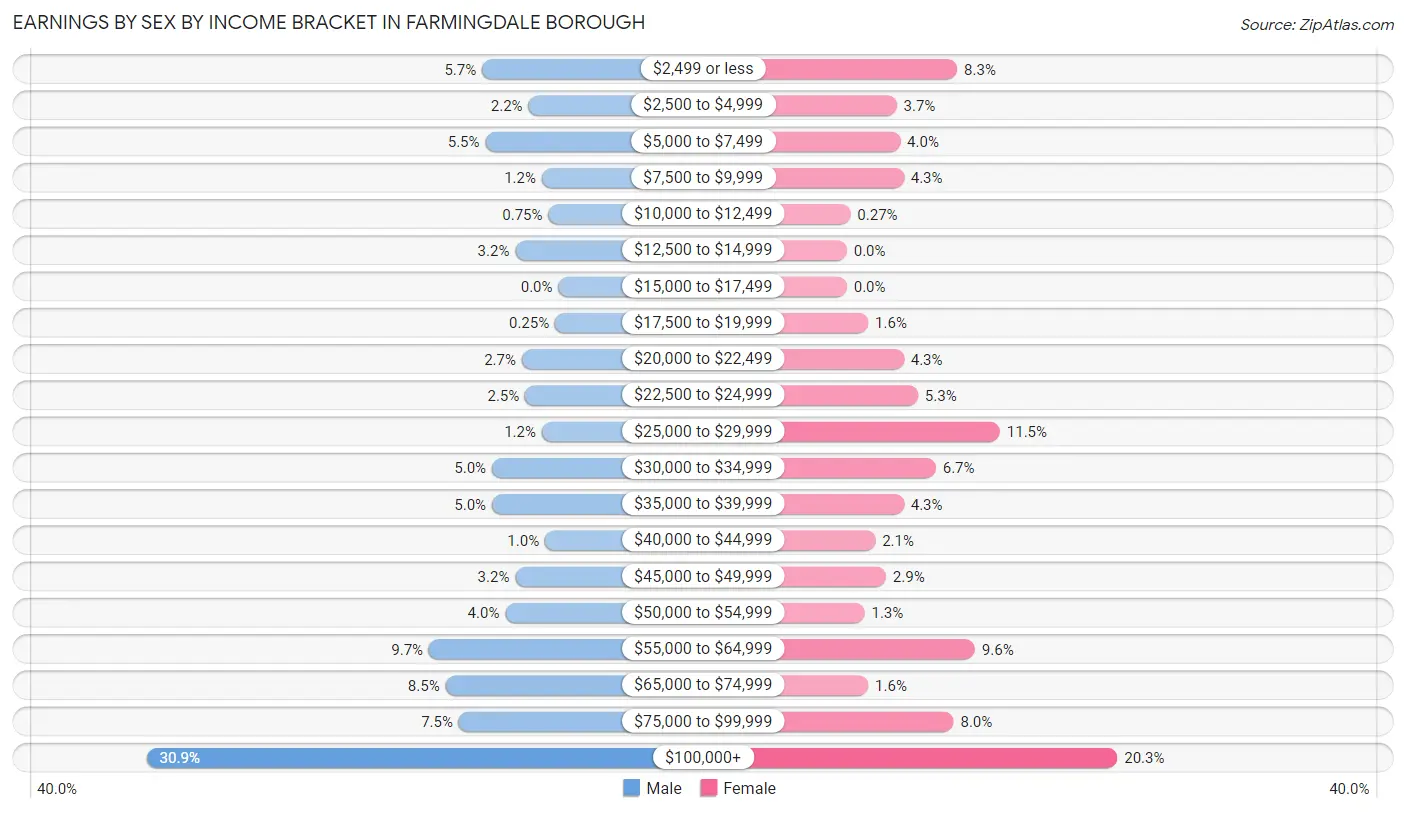
Earnings by Sex by Income Bracket in Farmingdale borough
The most common earnings brackets in Farmingdale borough are $100,000+ for men (124 | 30.8%) and $100,000+ for women (76 | 20.3%).
| Income | Male | Female |
| $2,499 or less | 23 (5.7%) | 31 (8.3%) |
| $2,500 to $4,999 | 9 (2.2%) | 14 (3.7%) |
| $5,000 to $7,499 | 22 (5.5%) | 15 (4.0%) |
| $7,500 to $9,999 | 5 (1.2%) | 16 (4.3%) |
| $10,000 to $12,499 | 3 (0.7%) | 1 (0.3%) |
| $12,500 to $14,999 | 13 (3.2%) | 0 (0.0%) |
| $15,000 to $17,499 | 0 (0.0%) | 0 (0.0%) |
| $17,500 to $19,999 | 1 (0.3%) | 6 (1.6%) |
| $20,000 to $22,499 | 11 (2.7%) | 16 (4.3%) |
| $22,500 to $24,999 | 10 (2.5%) | 20 (5.3%) |
| $25,000 to $29,999 | 5 (1.2%) | 43 (11.5%) |
| $30,000 to $34,999 | 20 (5.0%) | 25 (6.7%) |
| $35,000 to $39,999 | 20 (5.0%) | 16 (4.3%) |
| $40,000 to $44,999 | 4 (1.0%) | 8 (2.1%) |
| $45,000 to $49,999 | 13 (3.2%) | 11 (2.9%) |
| $50,000 to $54,999 | 16 (4.0%) | 5 (1.3%) |
| $55,000 to $64,999 | 39 (9.7%) | 36 (9.6%) |
| $65,000 to $74,999 | 34 (8.5%) | 6 (1.6%) |
| $75,000 to $99,999 | 30 (7.5%) | 30 (8.0%) |
| $100,000+ | 124 (30.8%) | 76 (20.3%) |
| Total | 402 (100.0%) | 375 (100.0%) |
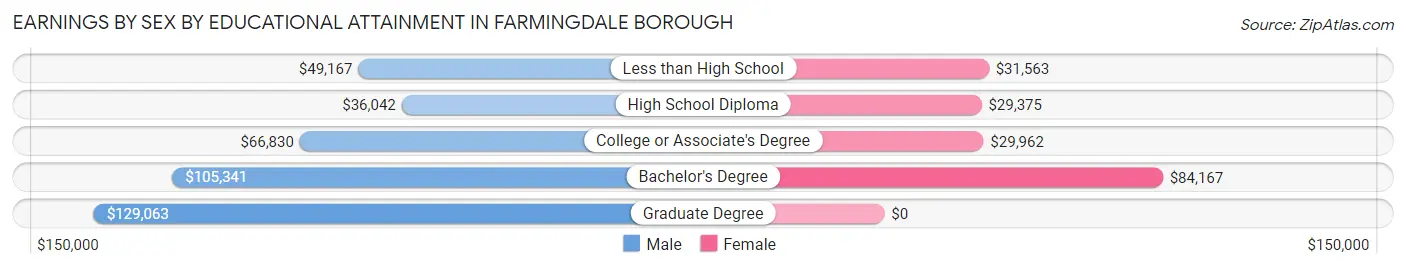
Earnings by Sex by Educational Attainment in Farmingdale borough
Average earnings in Farmingdale borough are $65,294 for men and $40,938 for women, a difference of 37.3%. Men with an educational attainment of graduate degree enjoy the highest average annual earnings of $129,063, while those with high school diploma education earn the least with $36,042. Women with an educational attainment of bachelor's degree earn the most with the average annual earnings of $84,167, while those with high school diploma education have the smallest earnings of $29,375.
| Educational Attainment | Male Income | Female Income |
| Less than High School | $49,167 | $31,563 |
| High School Diploma | $36,042 | $29,375 |
| College or Associate's Degree | $66,830 | $29,962 |
| Bachelor's Degree | $105,341 | $84,167 |
| Graduate Degree | $129,063 | $0 |
| Total | $65,294 | $40,938 |
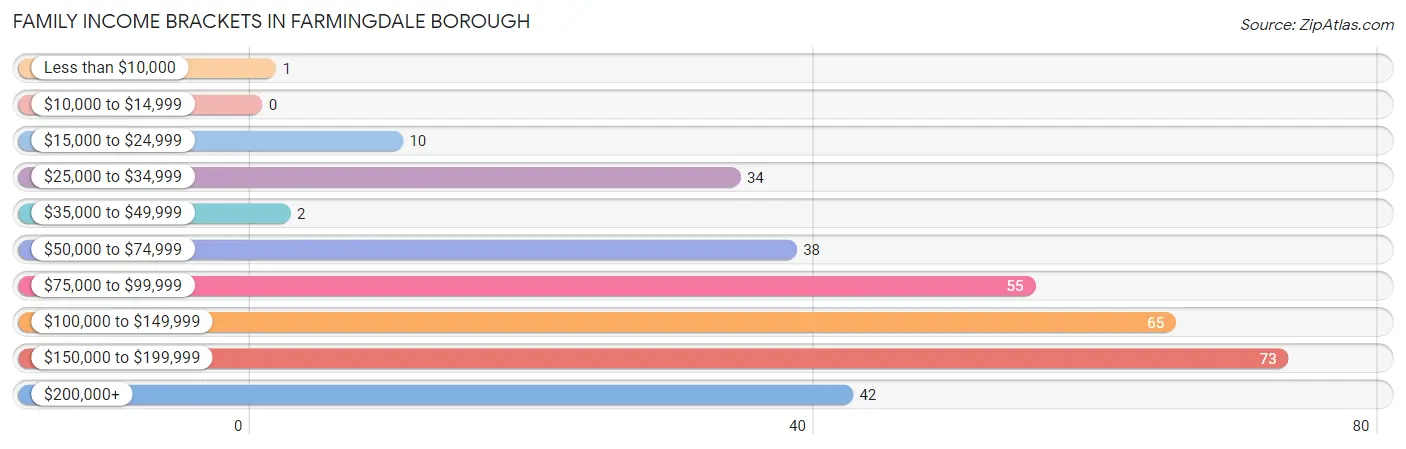
Family Income in Farmingdale borough
Family Income Brackets in Farmingdale borough
According to the Farmingdale borough family income data, there are 73 families falling into the $150,000 to $199,999 income range, which is the most common income bracket and makes up 22.8% of all families.
| Income Bracket | # Families | % Families |
| Less than $10,000 | 1 | 0.3% |
| $10,000 to $14,999 | 0 | 0.0% |
| $15,000 to $24,999 | 10 | 3.1% |
| $25,000 to $34,999 | 34 | 10.6% |
| $35,000 to $49,999 | 2 | 0.6% |
| $50,000 to $74,999 | 38 | 11.9% |
| $75,000 to $99,999 | 55 | 17.2% |
| $100,000 to $149,999 | 65 | 20.3% |
| $150,000 to $199,999 | 73 | 22.8% |
| $200,000+ | 42 | 13.1% |
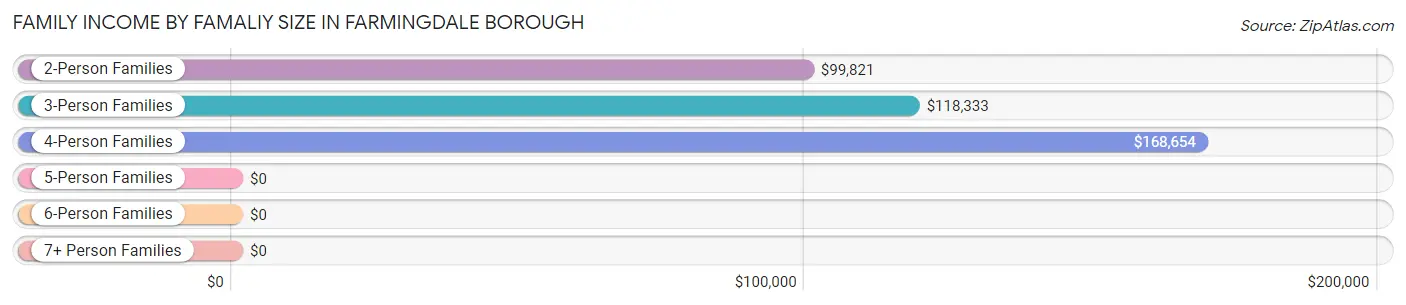
Family Income by Famaliy Size in Farmingdale borough
4-person families (50 | 15.6%) account for the highest median family income in Farmingdale borough with $168,654 per family, while 2-person families (141 | 44.1%) have the highest median income of $49,910 per family member.
| Income Bracket | # Families | Median Income |
| 2-Person Families | 141 (44.1%) | $99,821 |
| 3-Person Families | 72 (22.5%) | $118,333 |
| 4-Person Families | 50 (15.6%) | $168,654 |
| 5-Person Families | 53 (16.6%) | $0 |
| 6-Person Families | 4 (1.3%) | $0 |
| 7+ Person Families | 0 (0.0%) | $0 |
| Total | 320 (100.0%) | $113,750 |
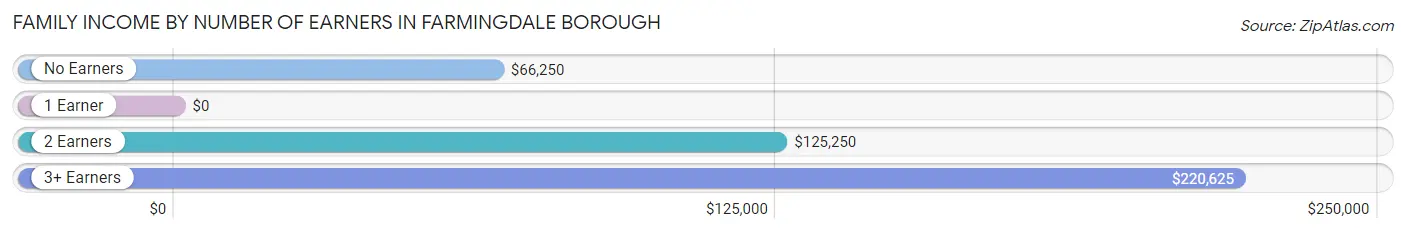
Family Income by Number of Earners in Farmingdale borough
| Number of Earners | # Families | Median Income |
| No Earners | 22 (6.9%) | $66,250 |
| 1 Earner | 82 (25.6%) | $0 |
| 2 Earners | 165 (51.6%) | $125,250 |
| 3+ Earners | 51 (15.9%) | $220,625 |
| Total | 320 (100.0%) | $113,750 |
Household Income in Farmingdale borough
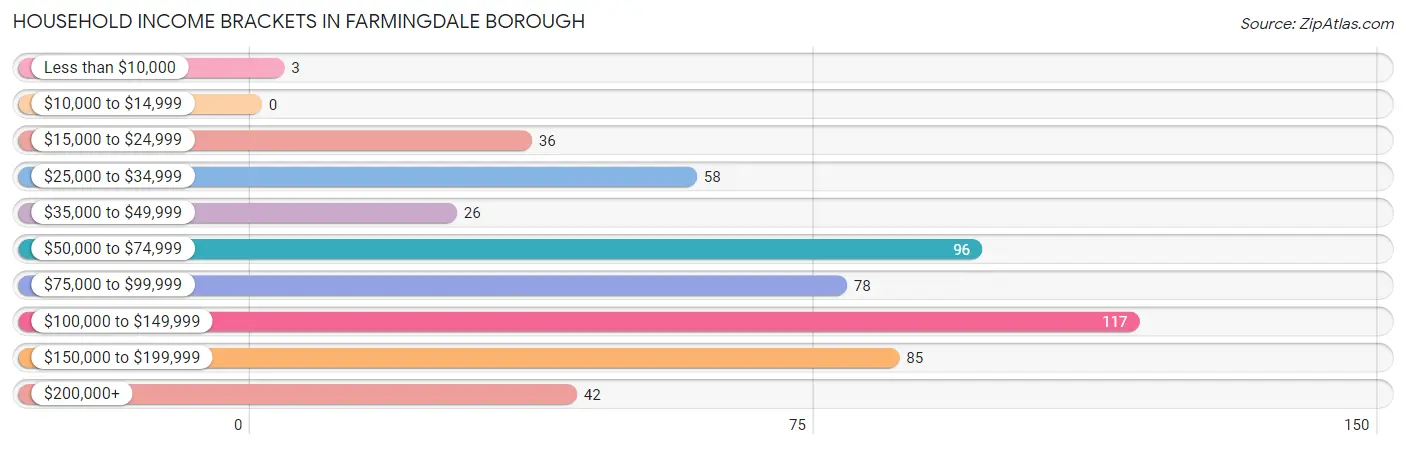
Household Income Brackets in Farmingdale borough
With 117 households falling in the category, the $100,000 to $149,999 income range is the most frequent in Farmingdale borough, accounting for 21.6% of all households.
| Income Bracket | # Households | % Households |
| Less than $10,000 | 3 | 0.6% |
| $10,000 to $14,999 | 0 | 0.0% |
| $15,000 to $24,999 | 36 | 6.7% |
| $25,000 to $34,999 | 58 | 10.7% |
| $35,000 to $49,999 | 26 | 4.8% |
| $50,000 to $74,999 | 96 | 17.7% |
| $75,000 to $99,999 | 78 | 14.4% |
| $100,000 to $149,999 | 117 | 21.6% |
| $150,000 to $199,999 | 85 | 15.7% |
| $200,000+ | 42 | 7.8% |
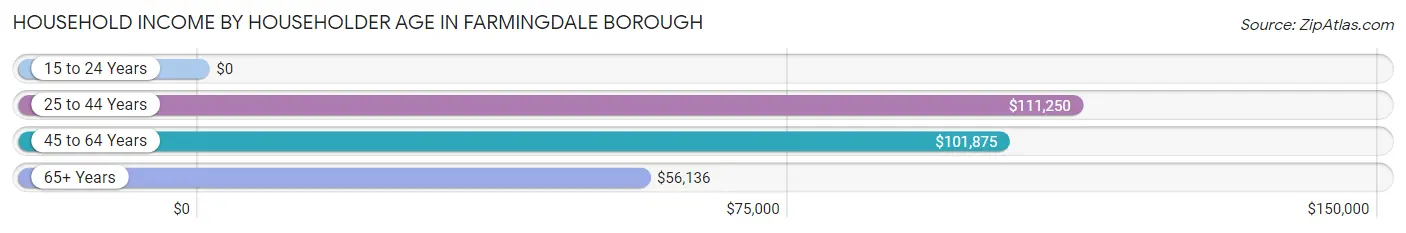
Household Income by Householder Age in Farmingdale borough
The median household income in Farmingdale borough is $93,523, with the highest median household income of $111,250 found in the 25 to 44 years age bracket for the primary householder. A total of 166 households (30.7%) fall into this category.
| Income Bracket | # Households | Median Income |
| 15 to 24 Years | 0 (0.0%) | $0 |
| 25 to 44 Years | 166 (30.7%) | $111,250 |
| 45 to 64 Years | 225 (41.6%) | $101,875 |
| 65+ Years | 150 (27.7%) | $56,136 |
| Total | 541 (100.0%) | $93,523 |
Poverty in Farmingdale borough
Income Below Poverty by Sex and Age in Farmingdale borough
With 3.0% poverty level for males and 1.7% for females among the residents of Farmingdale borough, 55 to 64 year old males and 55 to 64 year old females are the most vulnerable to poverty, with 15 males (17.6%) and 8 females (11.8%) in their respective age groups living below the poverty level.
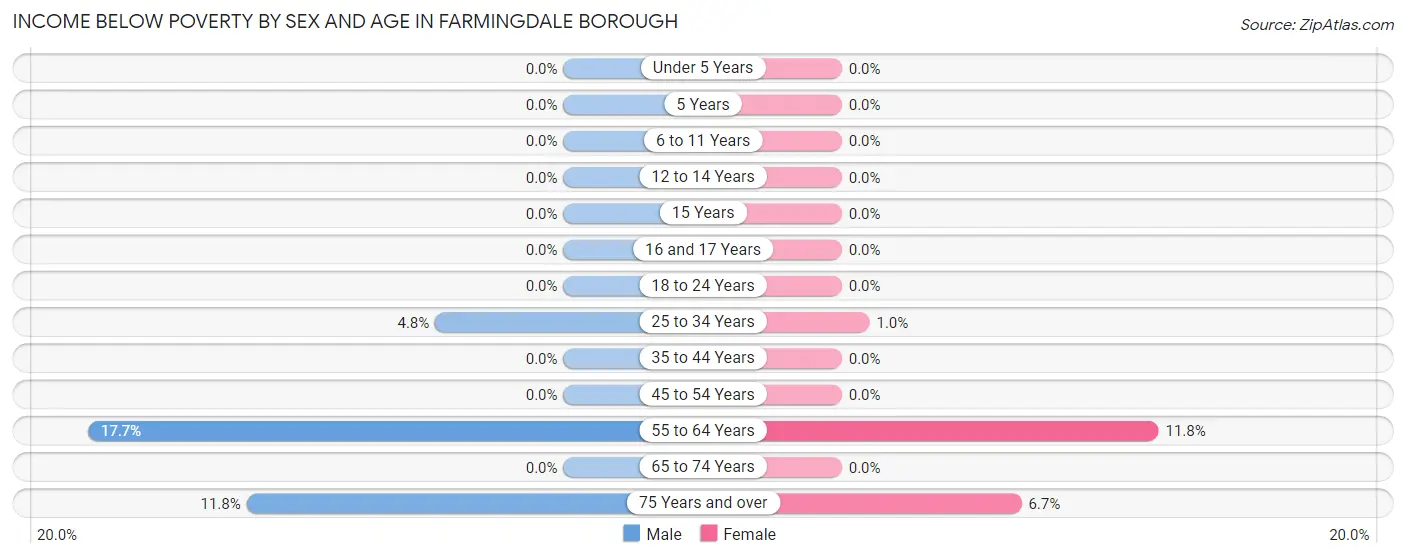
| Age Bracket | Male | Female |
| Under 5 Years | 0 (0.0%) | 0 (0.0%) |
| 5 Years | 0 (0.0%) | 0 (0.0%) |
| 6 to 11 Years | 0 (0.0%) | 0 (0.0%) |
| 12 to 14 Years | 0 (0.0%) | 0 (0.0%) |
| 15 Years | 0 (0.0%) | 0 (0.0%) |
| 16 and 17 Years | 0 (0.0%) | 0 (0.0%) |
| 18 to 24 Years | 0 (0.0%) | 0 (0.0%) |
| 25 to 34 Years | 3 (4.8%) | 1 (1.0%) |
| 35 to 44 Years | 0 (0.0%) | 0 (0.0%) |
| 45 to 54 Years | 0 (0.0%) | 0 (0.0%) |
| 55 to 64 Years | 15 (17.6%) | 8 (11.8%) |
| 65 to 74 Years | 0 (0.0%) | 0 (0.0%) |
| 75 Years and over | 2 (11.8%) | 2 (6.7%) |
| Total | 20 (3.0%) | 11 (1.7%) |
Income Above Poverty by Sex and Age in Farmingdale borough
According to the poverty statistics in Farmingdale borough, males aged under 5 years and females aged under 5 years are the age groups that are most secure financially, with 100.0% of males and 100.0% of females in these age groups living above the poverty line.
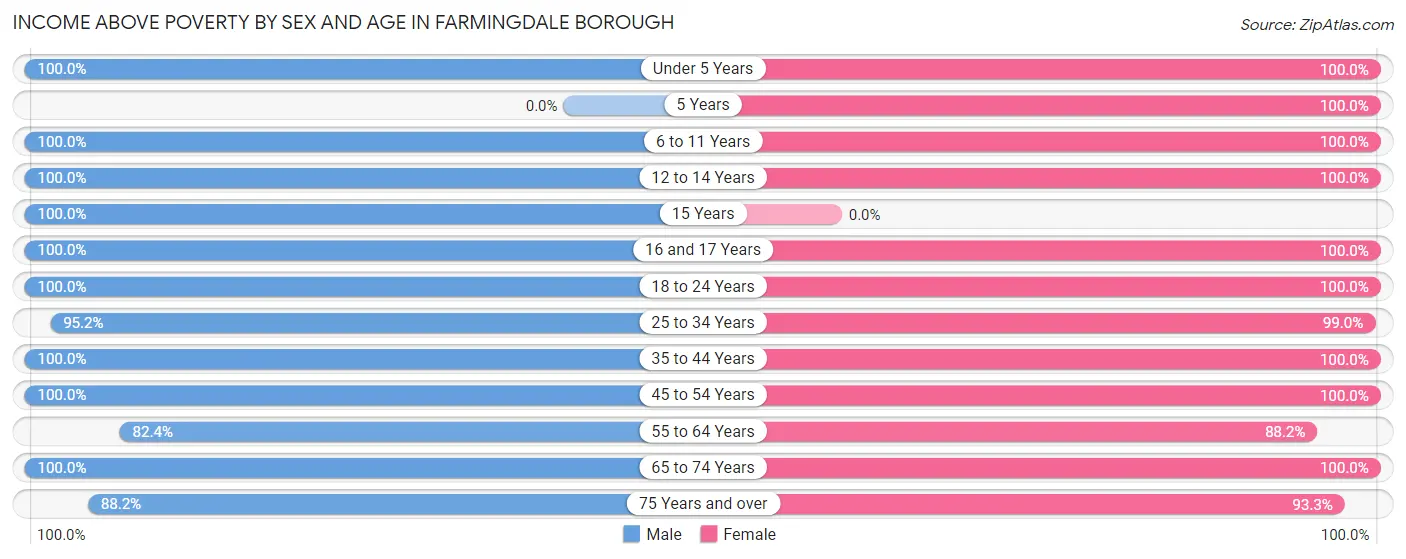
| Age Bracket | Male | Female |
| Under 5 Years | 15 (100.0%) | 14 (100.0%) |
| 5 Years | 0 (0.0%) | 8 (100.0%) |
| 6 to 11 Years | 34 (100.0%) | 43 (100.0%) |
| 12 to 14 Years | 34 (100.0%) | 19 (100.0%) |
| 15 Years | 7 (100.0%) | 0 (0.0%) |
| 16 and 17 Years | 53 (100.0%) | 3 (100.0%) |
| 18 to 24 Years | 81 (100.0%) | 106 (100.0%) |
| 25 to 34 Years | 60 (95.2%) | 96 (99.0%) |
| 35 to 44 Years | 77 (100.0%) | 86 (100.0%) |
| 45 to 54 Years | 128 (100.0%) | 102 (100.0%) |
| 55 to 64 Years | 70 (82.4%) | 60 (88.2%) |
| 65 to 74 Years | 72 (100.0%) | 84 (100.0%) |
| 75 Years and over | 15 (88.2%) | 28 (93.3%) |
| Total | 646 (97.0%) | 649 (98.3%) |
Income Below Poverty Among Married-Couple Families in Farmingdale borough
The poverty statistics for married-couple families in Farmingdale borough show that 0.4% or 1 of the total 259 families live below the poverty line. Families with no children have the highest poverty rate of 0.7%, comprising of 1 families. On the other hand, families with 1 or 2 children have the lowest poverty rate of 0.0%, which includes 0 families.
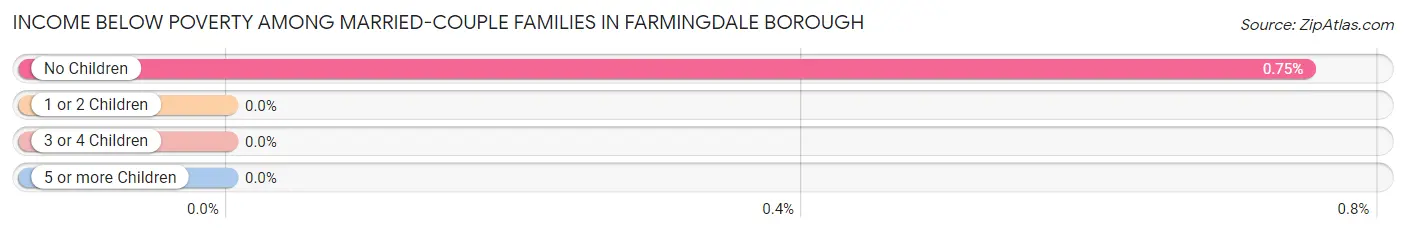
| Children | Above Poverty | Below Poverty |
| No Children | 133 (99.3%) | 1 (0.7%) |
| 1 or 2 Children | 117 (100.0%) | 0 (0.0%) |
| 3 or 4 Children | 8 (100.0%) | 0 (0.0%) |
| 5 or more Children | 0 (0.0%) | 0 (0.0%) |
| Total | 258 (99.6%) | 1 (0.4%) |
Income Below Poverty Among Single-Parent Households in Farmingdale borough
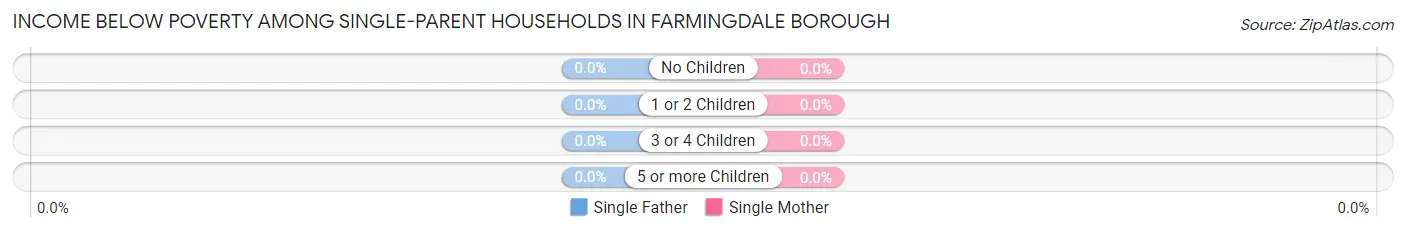
| Children | Single Father | Single Mother |
| No Children | 0 (0.0%) | 0 (0.0%) |
| 1 or 2 Children | 0 (0.0%) | 0 (0.0%) |
| 3 or 4 Children | 0 (0.0%) | 0 (0.0%) |
| 5 or more Children | 0 (0.0%) | 0 (0.0%) |
| Total | 0 (0.0%) | 0 (0.0%) |
Income Below Poverty Among Married-Couple vs Single-Parent Households in Farmingdale borough
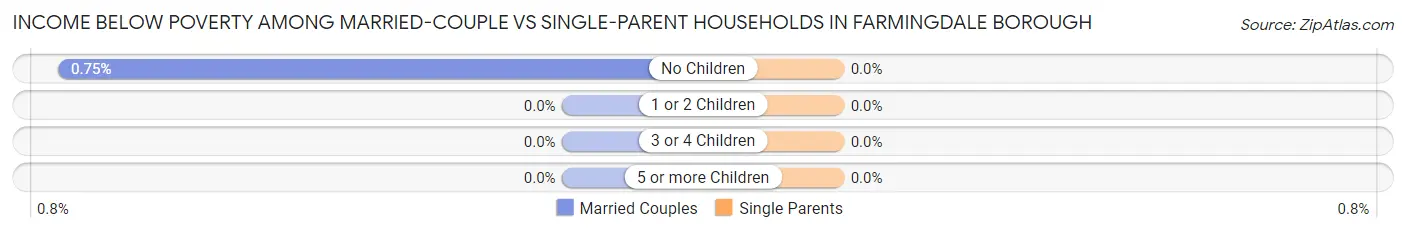
| Children | Married-Couple Families | Single-Parent Households |
| No Children | 1 (0.7%) | 0 (0.0%) |
| 1 or 2 Children | 0 (0.0%) | 0 (0.0%) |
| 3 or 4 Children | 0 (0.0%) | 0 (0.0%) |
| 5 or more Children | 0 (0.0%) | 0 (0.0%) |
| Total | 1 (0.4%) | 0 (0.0%) |
Race in Farmingdale borough
The most populous races in Farmingdale borough are White / Caucasian (1,239 | 93.4%), Hispanic or Latino (97 | 7.3%), and Two or more Races (66 | 5.0%).
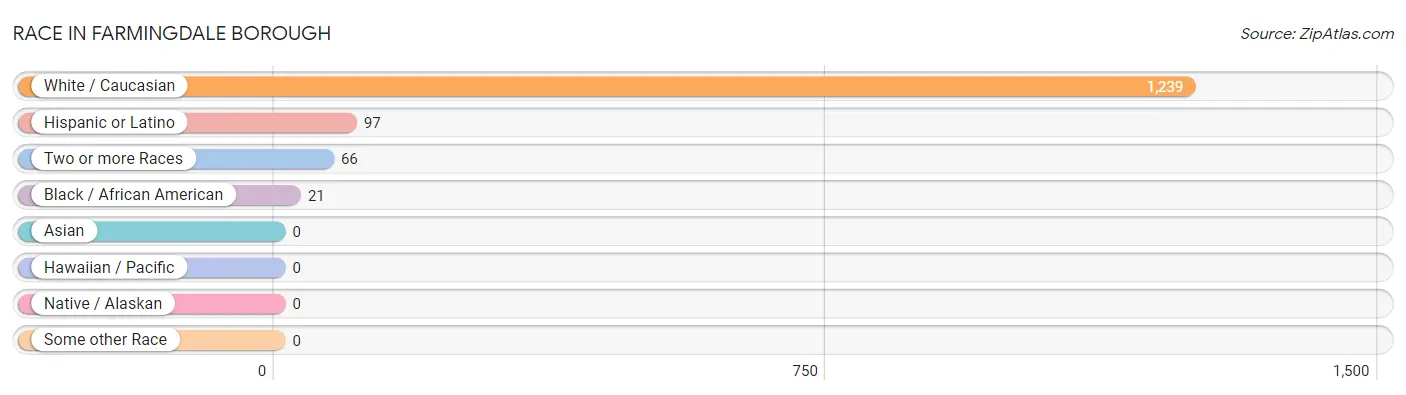
| Race | # Population | % Population |
| Asian | 0 | 0.0% |
| Black / African American | 21 | 1.6% |
| Hawaiian / Pacific | 0 | 0.0% |
| Hispanic or Latino | 97 | 7.3% |
| Native / Alaskan | 0 | 0.0% |
| White / Caucasian | 1,239 | 93.4% |
| Two or more Races | 66 | 5.0% |
| Some other Race | 0 | 0.0% |
| Total | 1,326 | 100.0% |
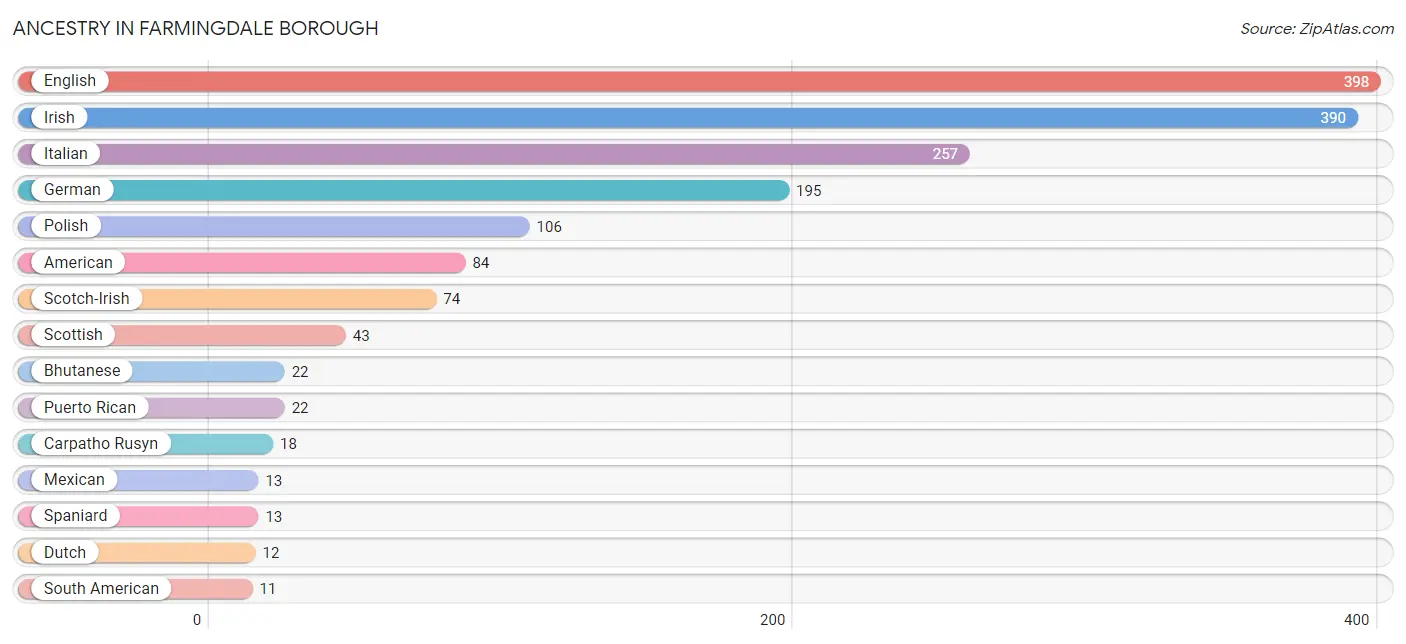
Ancestry in Farmingdale borough
The most populous ancestries reported in Farmingdale borough are English (398 | 30.0%), Irish (390 | 29.4%), Italian (257 | 19.4%), German (195 | 14.7%), and Polish (106 | 8.0%), together accounting for 101.5% of all Farmingdale borough residents.
| Ancestry | # Population | % Population |
| American | 84 | 6.3% |
| Arab | 6 | 0.4% |
| Armenian | 10 | 0.7% |
| Assyrian / Chaldean / Syriac | 3 | 0.2% |
| Austrian | 7 | 0.5% |
| Bhutanese | 22 | 1.7% |
| British | 2 | 0.2% |
| Canadian | 5 | 0.4% |
| Carpatho Rusyn | 18 | 1.4% |
| Central American Indian | 7 | 0.5% |
| Colombian | 4 | 0.3% |
| Croatian | 6 | 0.4% |
| Cuban | 6 | 0.4% |
| Czechoslovakian | 2 | 0.2% |
| Dutch | 12 | 0.9% |
| Ecuadorian | 7 | 0.5% |
| English | 398 | 30.0% |
| European | 4 | 0.3% |
| French Canadian | 3 | 0.2% |
| German | 195 | 14.7% |
| Greek | 5 | 0.4% |
| Icelander | 7 | 0.5% |
| Irish | 390 | 29.4% |
| Italian | 257 | 19.4% |
| Lithuanian | 2 | 0.2% |
| Mexican | 13 | 1.0% |
| Northern European | 10 | 0.7% |
| Polish | 106 | 8.0% |
| Portuguese | 10 | 0.7% |
| Puerto Rican | 22 | 1.7% |
| Romanian | 8 | 0.6% |
| Russian | 7 | 0.5% |
| Scotch-Irish | 74 | 5.6% |
| Scottish | 43 | 3.2% |
| Slovak | 4 | 0.3% |
| South American | 11 | 0.8% |
| Spaniard | 13 | 1.0% |
| Swedish | 6 | 0.4% |
| Ukrainian | 5 | 0.4% |
| Welsh | 11 | 0.8% | View All 40 Rows |
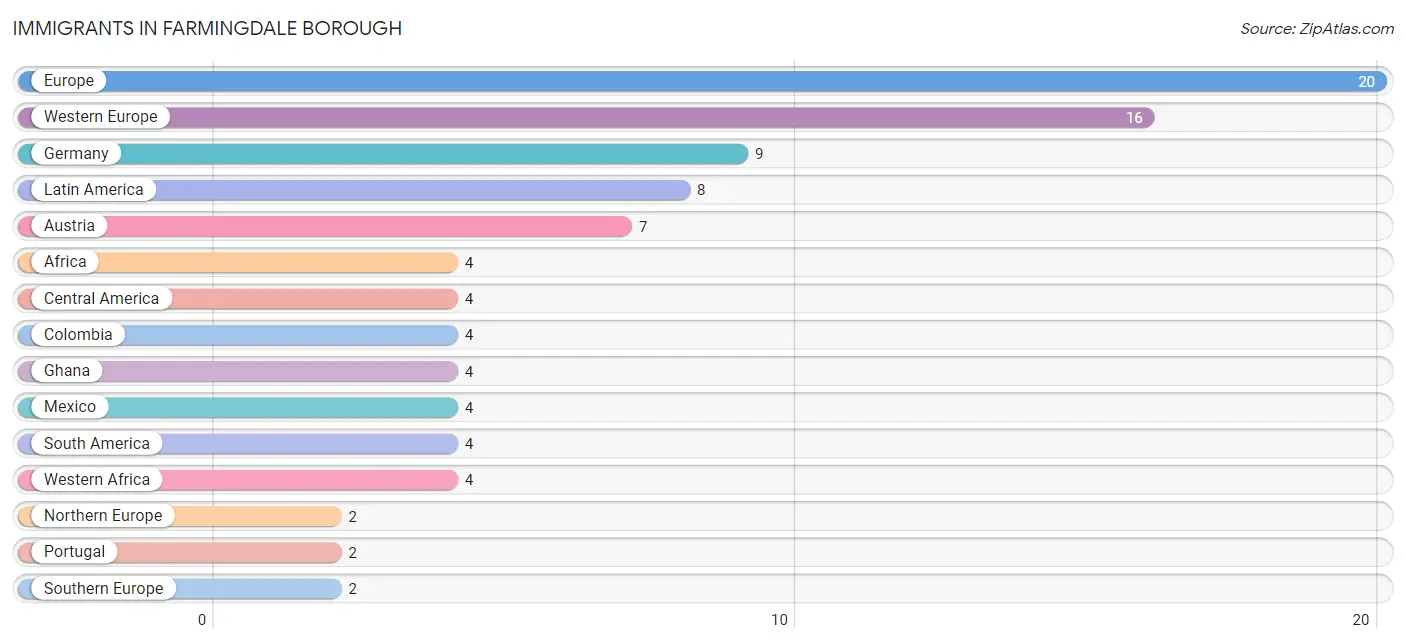
Immigrants in Farmingdale borough
The most numerous immigrant groups reported in Farmingdale borough came from Europe (20 | 1.5%), Western Europe (16 | 1.2%), Germany (9 | 0.7%), Latin America (8 | 0.6%), and Austria (7 | 0.5%), together accounting for 4.5% of all Farmingdale borough residents.
| Immigration Origin | # Population | % Population |
| Africa | 4 | 0.3% |
| Austria | 7 | 0.5% |
| Central America | 4 | 0.3% |
| Colombia | 4 | 0.3% |
| Europe | 20 | 1.5% |
| Germany | 9 | 0.7% |
| Ghana | 4 | 0.3% |
| Latin America | 8 | 0.6% |
| Mexico | 4 | 0.3% |
| Northern Europe | 2 | 0.2% |
| Portugal | 2 | 0.2% |
| South America | 4 | 0.3% |
| Southern Europe | 2 | 0.2% |
| Western Africa | 4 | 0.3% |
| Western Europe | 16 | 1.2% | View All 15 Rows |
Sex and Age in Farmingdale borough
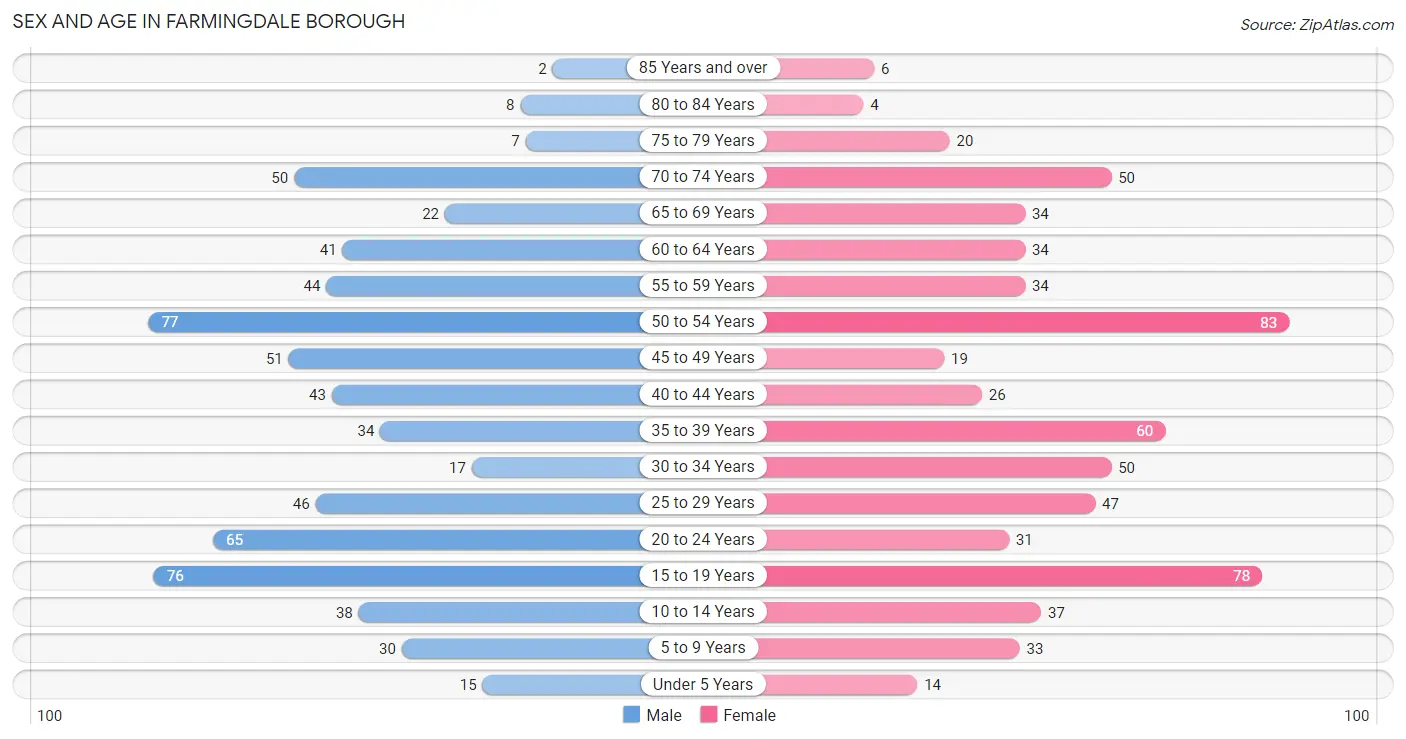
Sex and Age in Farmingdale borough
The most populous age groups in Farmingdale borough are 50 to 54 Years (77 | 11.6%) for men and 50 to 54 Years (83 | 12.6%) for women.
| Age Bracket | Male | Female |
| Under 5 Years | 15 (2.2%) | 14 (2.1%) |
| 5 to 9 Years | 30 (4.5%) | 33 (5.0%) |
| 10 to 14 Years | 38 (5.7%) | 37 (5.6%) |
| 15 to 19 Years | 76 (11.4%) | 78 (11.8%) |
| 20 to 24 Years | 65 (9.8%) | 31 (4.7%) |
| 25 to 29 Years | 46 (6.9%) | 47 (7.1%) |
| 30 to 34 Years | 17 (2.5%) | 50 (7.6%) |
| 35 to 39 Years | 34 (5.1%) | 60 (9.1%) |
| 40 to 44 Years | 43 (6.5%) | 26 (3.9%) |
| 45 to 49 Years | 51 (7.7%) | 19 (2.9%) |
| 50 to 54 Years | 77 (11.6%) | 83 (12.6%) |
| 55 to 59 Years | 44 (6.6%) | 34 (5.1%) |
| 60 to 64 Years | 41 (6.2%) | 34 (5.1%) |
| 65 to 69 Years | 22 (3.3%) | 34 (5.1%) |
| 70 to 74 Years | 50 (7.5%) | 50 (7.6%) |
| 75 to 79 Years | 7 (1.1%) | 20 (3.0%) |
| 80 to 84 Years | 8 (1.2%) | 4 (0.6%) |
| 85 Years and over | 2 (0.3%) | 6 (0.9%) |
| Total | 666 (100.0%) | 660 (100.0%) |
Families and Households in Farmingdale borough
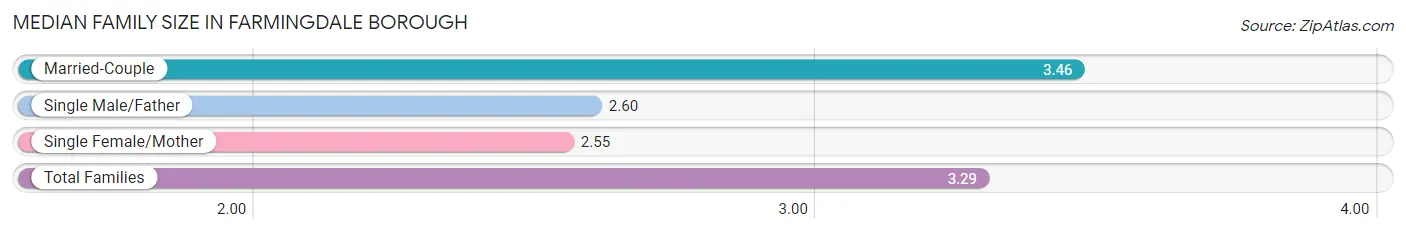
Median Family Size in Farmingdale borough
The median family size in Farmingdale borough is 3.29 persons per family, with married-couple families (259 | 80.9%) accounting for the largest median family size of 3.46 persons per family. On the other hand, single female/mother families (56 | 17.5%) represent the smallest median family size with 2.55 persons per family.
| Family Type | # Families | Family Size |
| Married-Couple | 259 (80.9%) | 3.46 |
| Single Male/Father | 5 (1.6%) | 2.60 |
| Single Female/Mother | 56 (17.5%) | 2.55 |
| Total Families | 320 (100.0%) | 3.29 |
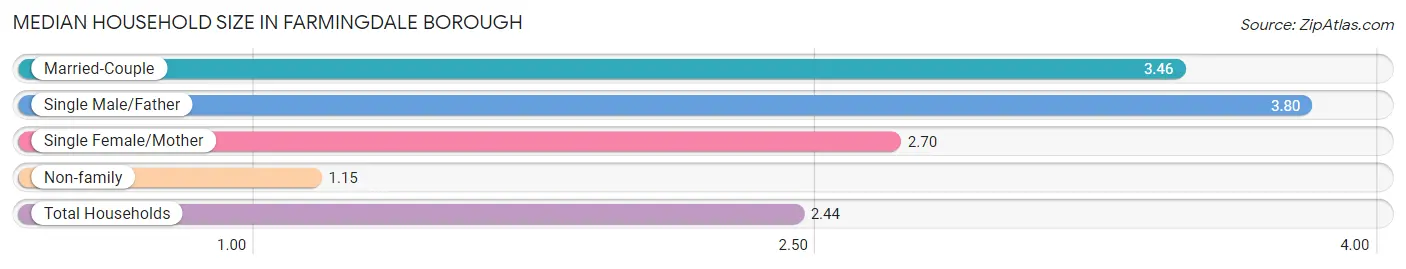
Median Household Size in Farmingdale borough
The median household size in Farmingdale borough is 2.44 persons per household, with single male/father households (5 | 0.9%) accounting for the largest median household size of 3.8 persons per household. non-family households (221 | 40.8%) represent the smallest median household size with 1.15 persons per household.
| Household Type | # Households | Household Size |
| Married-Couple | 259 (47.9%) | 3.46 |
| Single Male/Father | 5 (0.9%) | 3.80 |
| Single Female/Mother | 56 (10.3%) | 2.70 |
| Non-family | 221 (40.8%) | 1.15 |
| Total Households | 541 (100.0%) | 2.44 |
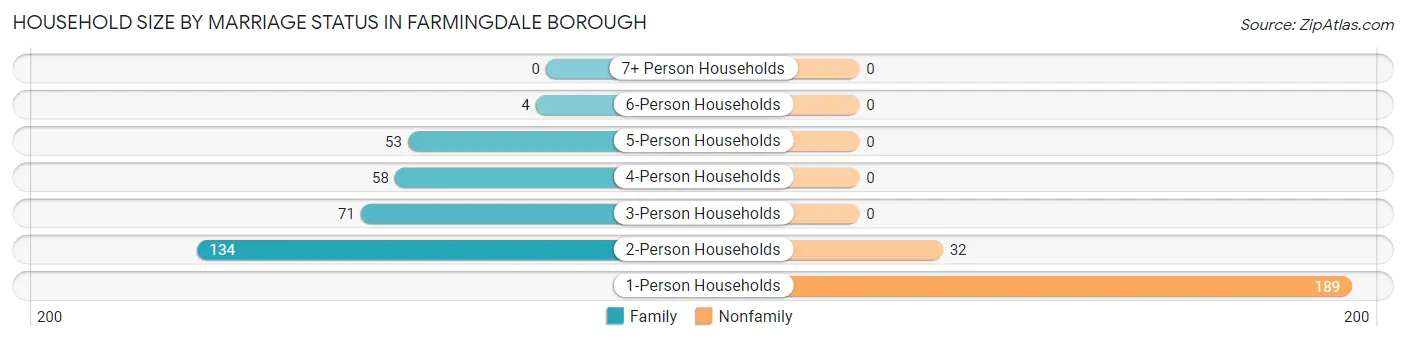
Household Size by Marriage Status in Farmingdale borough
Out of a total of 541 households in Farmingdale borough, 320 (59.2%) are family households, while 221 (40.8%) are nonfamily households. The most numerous type of family households are 2-person households, comprising 134, and the most common type of nonfamily households are 1-person households, comprising 189.
| Household Size | Family Households | Nonfamily Households |
| 1-Person Households | - | 189 (34.9%) |
| 2-Person Households | 134 (24.8%) | 32 (5.9%) |
| 3-Person Households | 71 (13.1%) | 0 (0.0%) |
| 4-Person Households | 58 (10.7%) | 0 (0.0%) |
| 5-Person Households | 53 (9.8%) | 0 (0.0%) |
| 6-Person Households | 4 (0.7%) | 0 (0.0%) |
| 7+ Person Households | 0 (0.0%) | 0 (0.0%) |
| Total | 320 (59.2%) | 221 (40.8%) |
Female Fertility in Farmingdale borough
Fertility by Age in Farmingdale borough
Average fertility rate in Farmingdale borough is 9.0 births per 1,000 women. Women in the age bracket of 20 to 34 years have the highest fertility rate with 23.0 births per 1,000 women. Women in the age bracket of 20 to 34 years acount for 100.0% of all women with births.
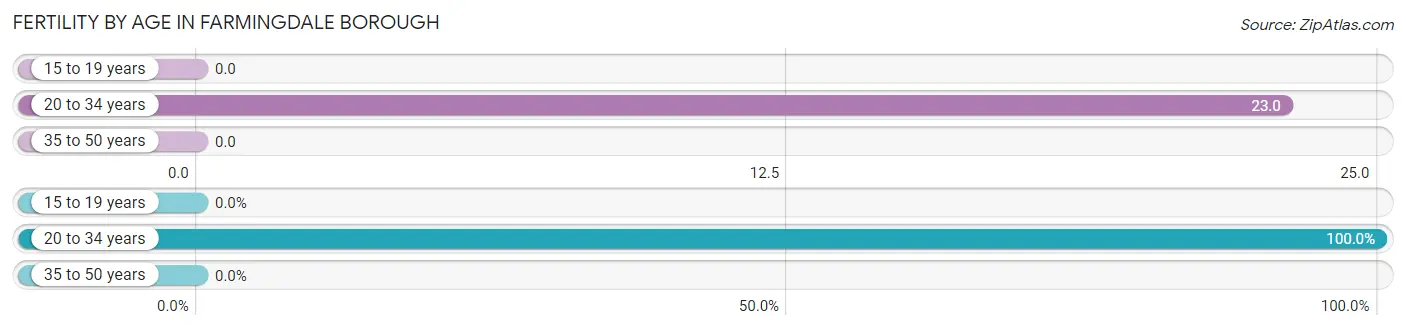
| Age Bracket | Women with Births | Births / 1,000 Women |
| 15 to 19 years | 0 (0.0%) | 0.0 |
| 20 to 34 years | 3 (100.0%) | 23.0 |
| 35 to 50 years | 0 (0.0%) | 0.0 |
| Total | 3 (100.0%) | 9.0 |
Fertility by Age by Marriage Status in Farmingdale borough
66.7% of women with births (3) in Farmingdale borough are married. The highest percentage of unmarried women with births falls into 20 to 34 years age bracket with 33.3% of them unmarried at the time of birth, while the lowest percentage of unmarried women with births belong to 20 to 34 years age bracket with 33.3% of them unmarried.
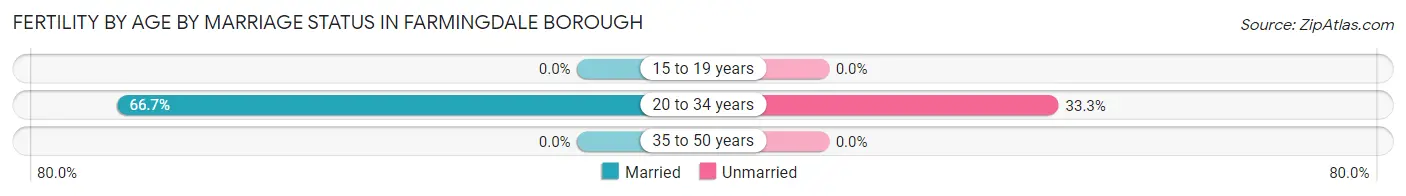
| Age Bracket | Married | Unmarried |
| 15 to 19 years | 0 (0.0%) | 0 (0.0%) |
| 20 to 34 years | 2 (66.7%) | 1 (33.3%) |
| 35 to 50 years | 0 (0.0%) | 0 (0.0%) |
| Total | 2 (66.7%) | 1 (33.3%) |
Fertility by Education in Farmingdale borough
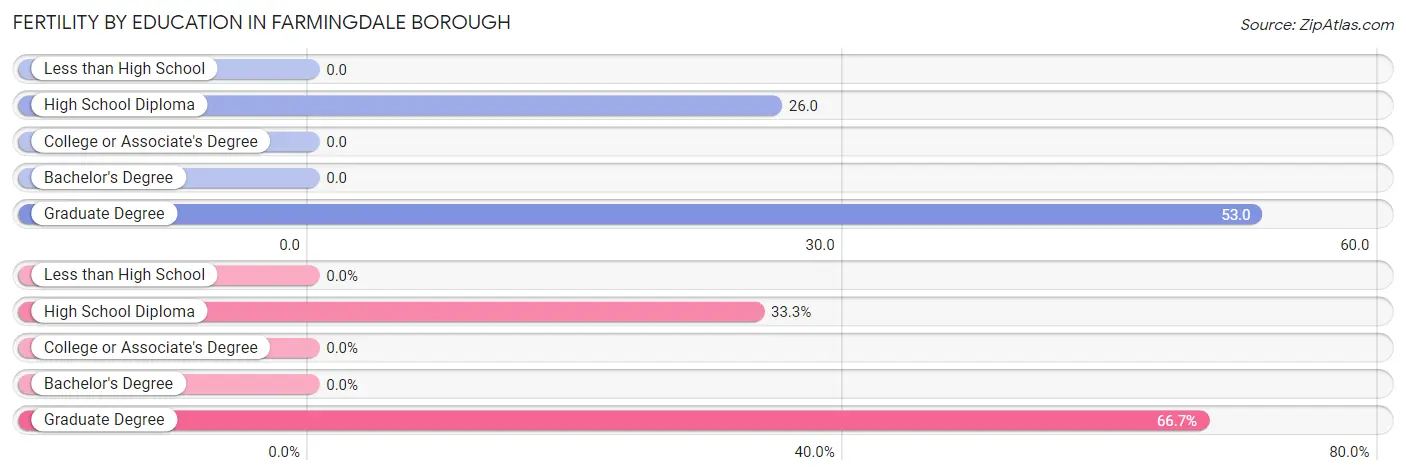
| Educational Attainment | Women with Births | Births / 1,000 Women |
| Less than High School | 0 (0.0%) | 0.0 |
| High School Diploma | 1 (33.3%) | 26.0 |
| College or Associate's Degree | 0 (0.0%) | 0.0 |
| Bachelor's Degree | 0 (0.0%) | 0.0 |
| Graduate Degree | 2 (66.7%) | 53.0 |
| Total | 3 (100.0%) | 9.0 |
Fertility by Education by Marriage Status in Farmingdale borough
33.3% of women with births in Farmingdale borough are unmarried. Women with the educational attainment of graduate degree are most likely to be married with 100.0% of them married at childbirth, while women with the educational attainment of high school diploma are least likely to be married with 100.0% of them unmarried at childbirth.
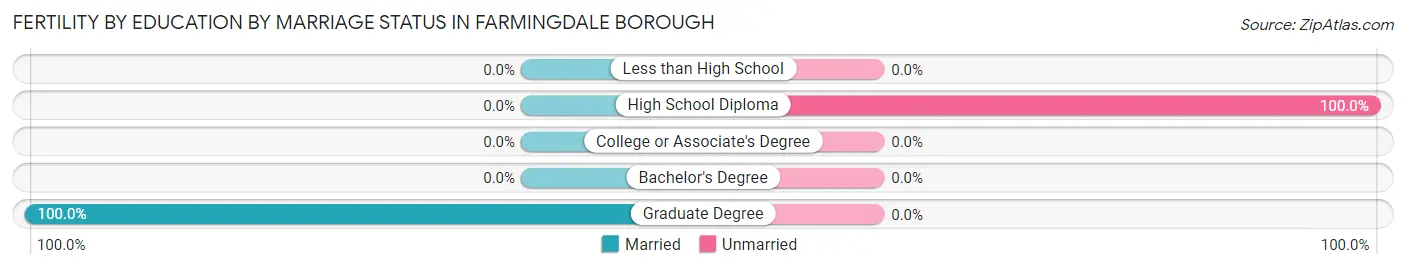
| Educational Attainment | Married | Unmarried |
| Less than High School | 0 (0.0%) | 0 (0.0%) |
| High School Diploma | 0 (0.0%) | 1 (100.0%) |
| College or Associate's Degree | 0 (0.0%) | 0 (0.0%) |
| Bachelor's Degree | 0 (0.0%) | 0 (0.0%) |
| Graduate Degree | 2 (100.0%) | 0 (0.0%) |
| Total | 2 (66.7%) | 1 (33.3%) |
Employment Characteristics in Farmingdale borough
Employment by Class of Employer in Farmingdale borough
Among the 642 employed individuals in Farmingdale borough, private company employees (457 | 71.2%), local government employees (60 | 9.3%), and self-employed (not incorporated) (52 | 8.1%) make up the most common classes of employment.
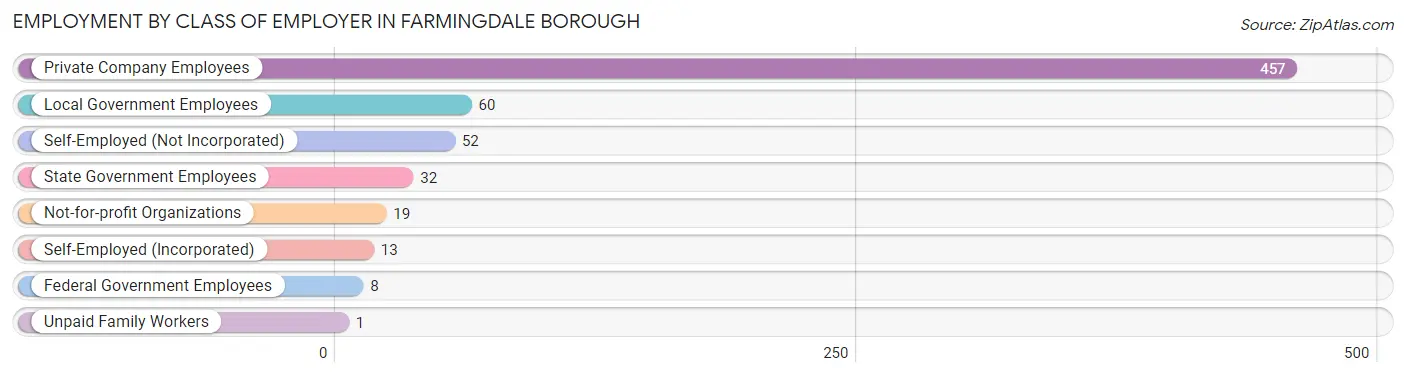
| Employer Class | # Employees | % Employees |
| Private Company Employees | 457 | 71.2% |
| Self-Employed (Incorporated) | 13 | 2.0% |
| Self-Employed (Not Incorporated) | 52 | 8.1% |
| Not-for-profit Organizations | 19 | 3.0% |
| Local Government Employees | 60 | 9.3% |
| State Government Employees | 32 | 5.0% |
| Federal Government Employees | 8 | 1.3% |
| Unpaid Family Workers | 1 | 0.2% |
| Total | 642 | 100.0% |
Employment Status by Age in Farmingdale borough
According to the labor force statistics for Farmingdale borough, out of the total population over 16 years of age (1,152), 64.1% or 738 individuals are in the labor force, with 11.1% or 82 of them unemployed. The age group with the highest labor force participation rate is 30 to 34 years, with 95.5% or 64 individuals in the labor force. Within the labor force, the 75 years and over age range has the highest percentage of unemployed individuals, with 35.7% or 5 of them being unemployed.
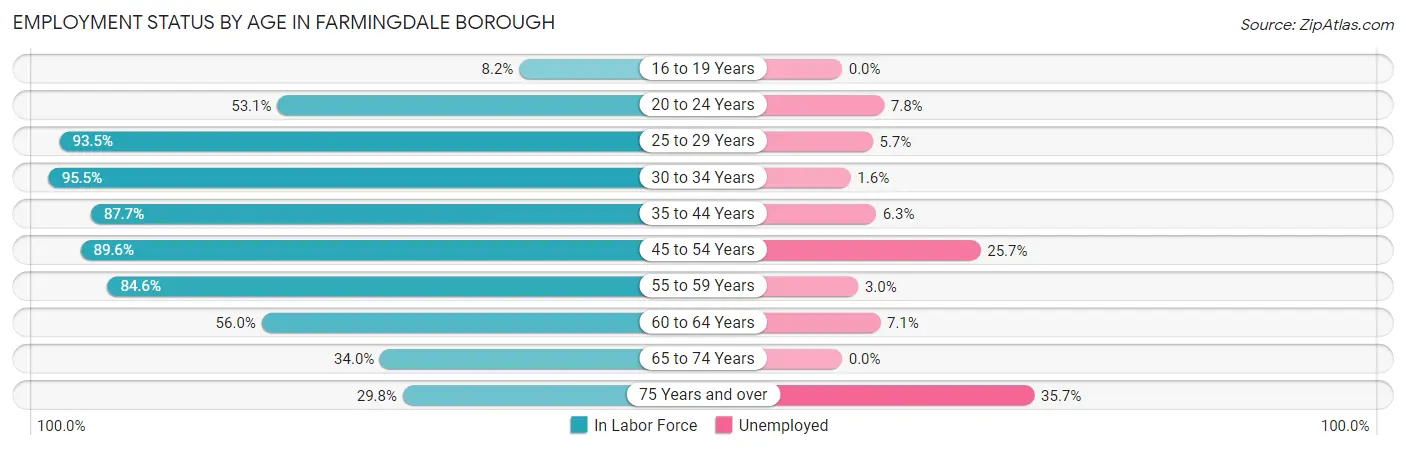
| Age Bracket | In Labor Force | Unemployed |
| 16 to 19 Years | 12 (8.2%) | 0 (0.0%) |
| 20 to 24 Years | 51 (53.1%) | 4 (7.8%) |
| 25 to 29 Years | 87 (93.5%) | 5 (5.7%) |
| 30 to 34 Years | 64 (95.5%) | 1 (1.6%) |
| 35 to 44 Years | 143 (87.7%) | 9 (6.3%) |
| 45 to 54 Years | 206 (89.6%) | 53 (25.7%) |
| 55 to 59 Years | 66 (84.6%) | 2 (3.0%) |
| 60 to 64 Years | 42 (56.0%) | 3 (7.1%) |
| 65 to 74 Years | 53 (34.0%) | 0 (0.0%) |
| 75 Years and over | 14 (29.8%) | 5 (35.7%) |
| Total | 738 (64.1%) | 82 (11.1%) |
Employment Status by Educational Attainment in Farmingdale borough
According to labor force statistics for Farmingdale borough, 86.1% of individuals (608) out of the total population between 25 and 64 years of age (706) are in the labor force, with 12.0% or 73 of them being unemployed. The group with the highest labor force participation rate are those with the educational attainment of college / associate degree, with 92.2% or 224 individuals in the labor force. Within the labor force, individuals with high school diploma education have the highest percentage of unemployment, with 24.2% or 29 of them being unemployed.
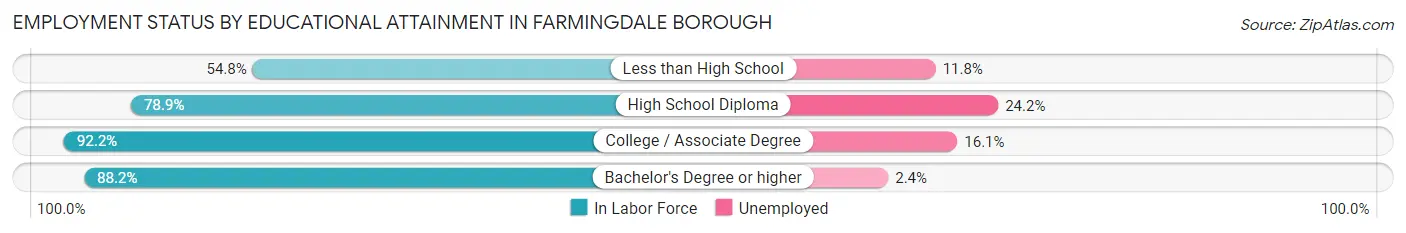
| Educational Attainment | In Labor Force | Unemployed |
| Less than High School | 17 (54.8%) | 4 (11.8%) |
| High School Diploma | 120 (78.9%) | 37 (24.2%) |
| College / Associate Degree | 224 (92.2%) | 39 (16.1%) |
| Bachelor's Degree or higher | 247 (88.2%) | 7 (2.4%) |
| Total | 608 (86.1%) | 85 (12.0%) |
Employment Occupations by Sex in Farmingdale borough
Management, Business, Science and Arts Occupations
The most common Management, Business, Science and Arts occupations in Farmingdale borough are Community & Social Service (103 | 15.7%), Management (57 | 8.7%), Arts, Media & Entertainment (55 | 8.4%), Health Diagnosing & Treating (51 | 7.8%), and Health Technologists (51 | 7.8%).
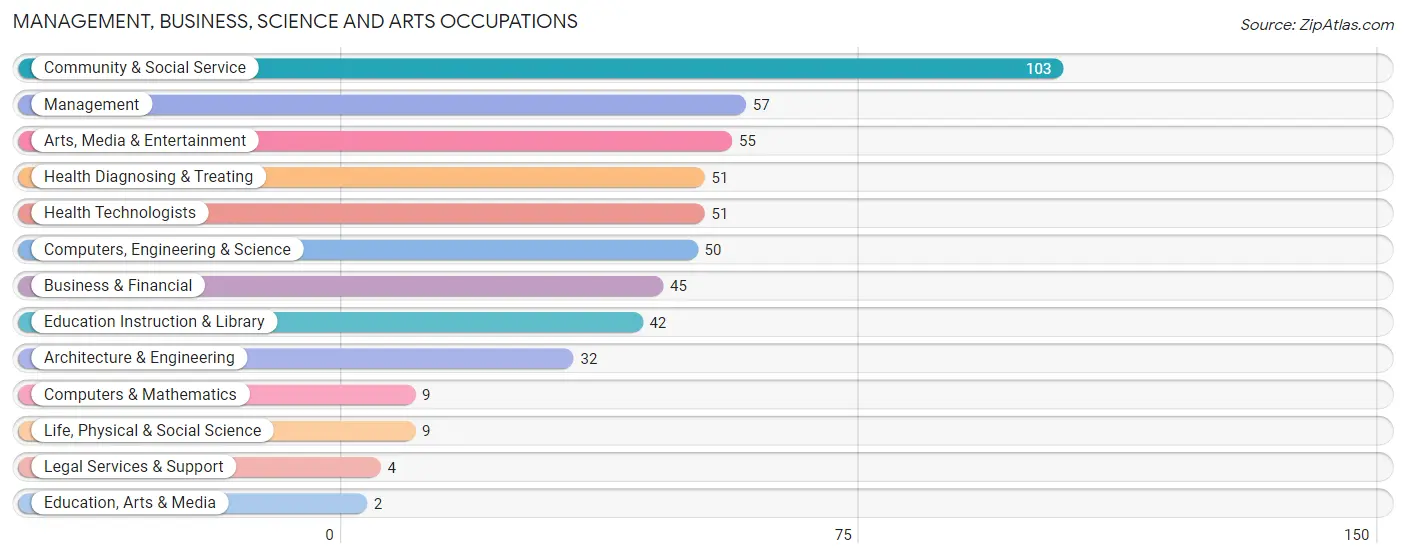
Management, Business, Science and Arts Occupations by Sex
Within the Management, Business, Science and Arts occupations in Farmingdale borough, the most male-oriented occupations are Life, Physical & Social Science (100.0%), Legal Services & Support (100.0%), and Computers, Engineering & Science (82.0%), while the most female-oriented occupations are Education, Arts & Media (100.0%), Health Diagnosing & Treating (94.1%), and Health Technologists (94.1%).
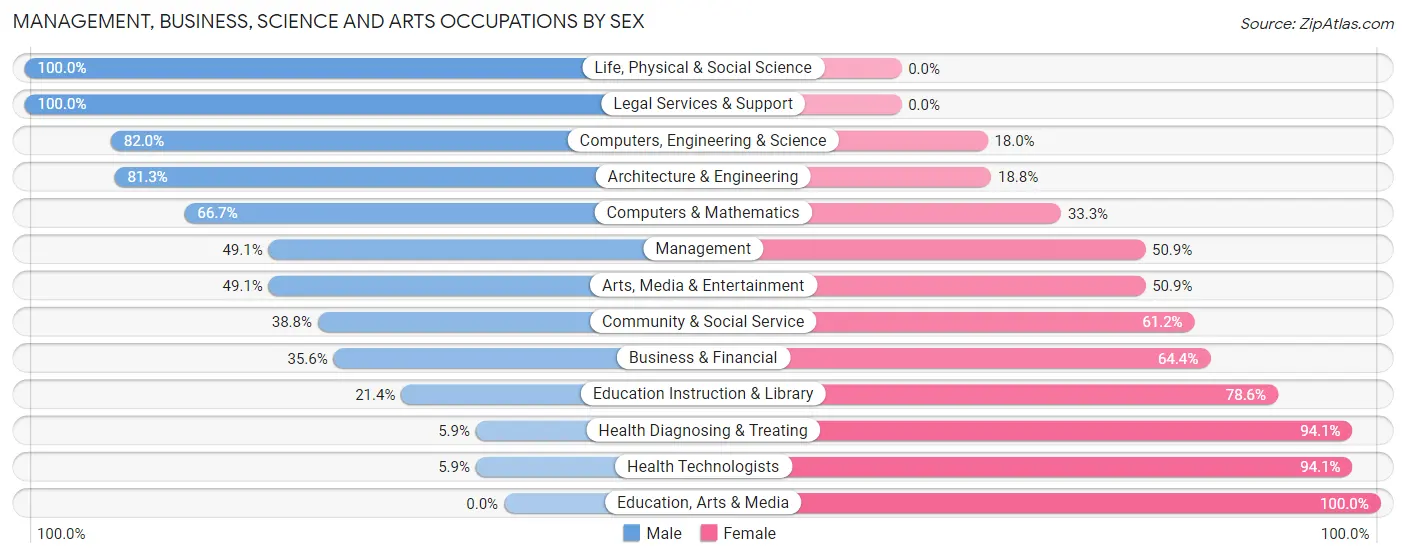
| Occupation | Male | Female |
| Management | 28 (49.1%) | 29 (50.9%) |
| Business & Financial | 16 (35.6%) | 29 (64.4%) |
| Computers, Engineering & Science | 41 (82.0%) | 9 (18.0%) |
| Computers & Mathematics | 6 (66.7%) | 3 (33.3%) |
| Architecture & Engineering | 26 (81.2%) | 6 (18.8%) |
| Life, Physical & Social Science | 9 (100.0%) | 0 (0.0%) |
| Community & Social Service | 40 (38.8%) | 63 (61.2%) |
| Education, Arts & Media | 0 (0.0%) | 2 (100.0%) |
| Legal Services & Support | 4 (100.0%) | 0 (0.0%) |
| Education Instruction & Library | 9 (21.4%) | 33 (78.6%) |
| Arts, Media & Entertainment | 27 (49.1%) | 28 (50.9%) |
| Health Diagnosing & Treating | 3 (5.9%) | 48 (94.1%) |
| Health Technologists | 3 (5.9%) | 48 (94.1%) |
| Total (Category) | 128 (41.8%) | 178 (58.2%) |
| Total (Overall) | 337 (51.4%) | 319 (48.6%) |
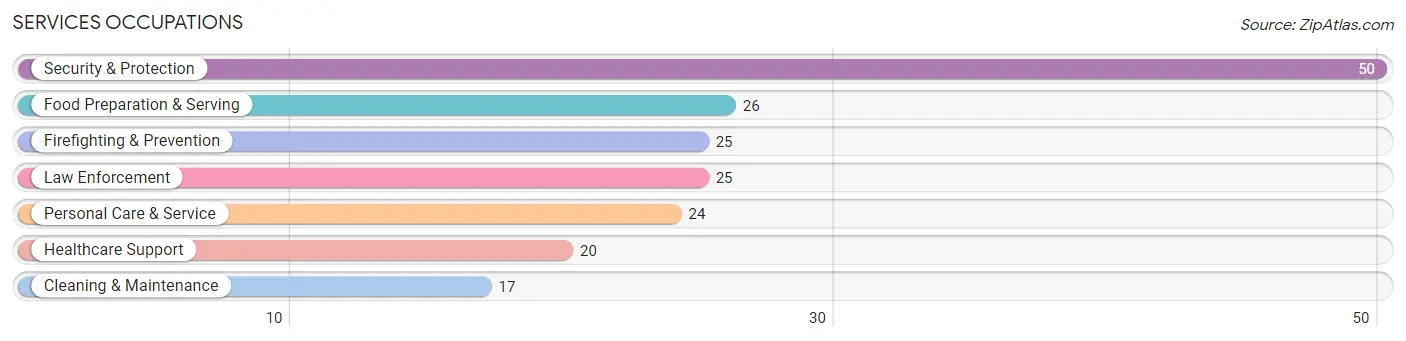
Services Occupations
The most common Services occupations in Farmingdale borough are Security & Protection (50 | 7.6%), Food Preparation & Serving (26 | 4.0%), Firefighting & Prevention (25 | 3.8%), Law Enforcement (25 | 3.8%), and Personal Care & Service (24 | 3.7%).
Services Occupations by Sex
Within the Services occupations in Farmingdale borough, the most male-oriented occupations are Security & Protection (100.0%), Firefighting & Prevention (100.0%), and Law Enforcement (100.0%), while the most female-oriented occupations are Healthcare Support (100.0%), Personal Care & Service (100.0%), and Food Preparation & Serving (46.2%).
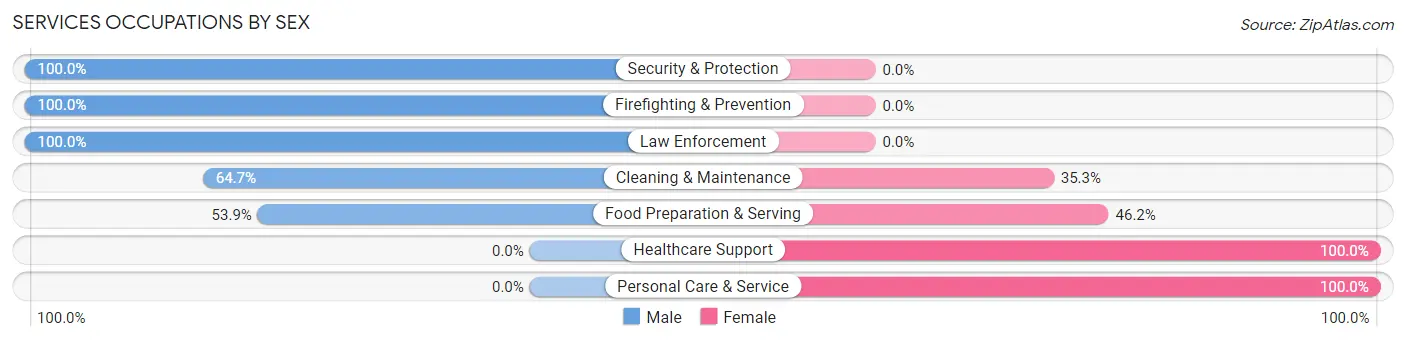
| Occupation | Male | Female |
| Healthcare Support | 0 (0.0%) | 20 (100.0%) |
| Security & Protection | 50 (100.0%) | 0 (0.0%) |
| Firefighting & Prevention | 25 (100.0%) | 0 (0.0%) |
| Law Enforcement | 25 (100.0%) | 0 (0.0%) |
| Food Preparation & Serving | 14 (53.8%) | 12 (46.2%) |
| Cleaning & Maintenance | 11 (64.7%) | 6 (35.3%) |
| Personal Care & Service | 0 (0.0%) | 24 (100.0%) |
| Total (Category) | 75 (54.7%) | 62 (45.3%) |
| Total (Overall) | 337 (51.4%) | 319 (48.6%) |
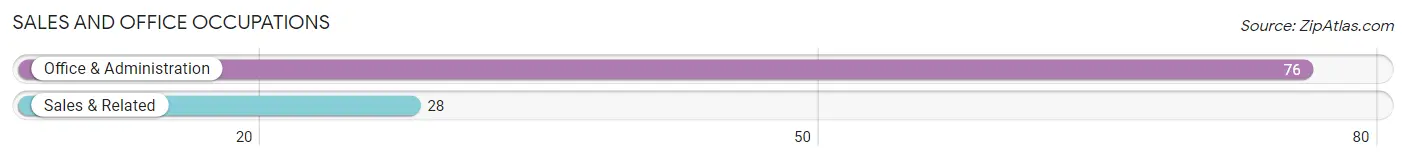
Sales and Office Occupations
The most common Sales and Office occupations in Farmingdale borough are Office & Administration (76 | 11.6%), and Sales & Related (28 | 4.3%).
Sales and Office Occupations by Sex
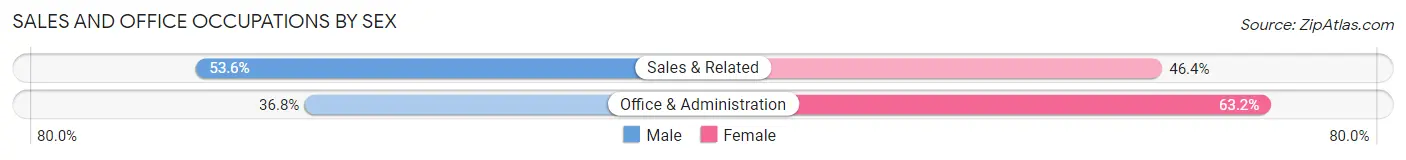
| Occupation | Male | Female |
| Sales & Related | 15 (53.6%) | 13 (46.4%) |
| Office & Administration | 28 (36.8%) | 48 (63.2%) |
| Total (Category) | 43 (41.3%) | 61 (58.7%) |
| Total (Overall) | 337 (51.4%) | 319 (48.6%) |
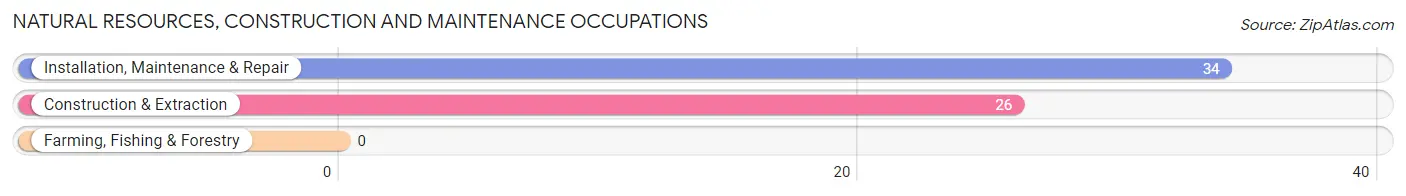
Natural Resources, Construction and Maintenance Occupations
The most common Natural Resources, Construction and Maintenance occupations in Farmingdale borough are Installation, Maintenance & Repair (34 | 5.2%), and Construction & Extraction (26 | 4.0%).
Natural Resources, Construction and Maintenance Occupations by Sex
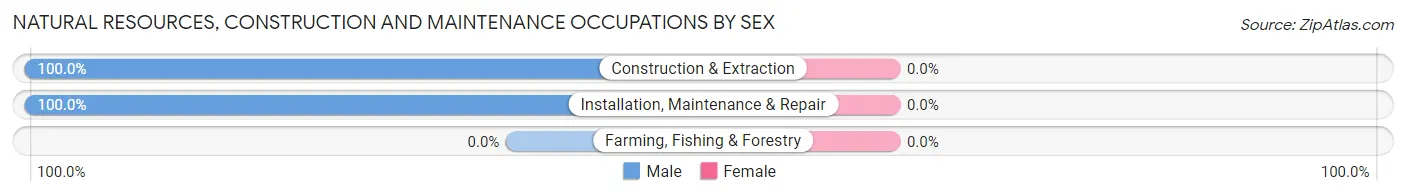
| Occupation | Male | Female |
| Farming, Fishing & Forestry | 0 (0.0%) | 0 (0.0%) |
| Construction & Extraction | 26 (100.0%) | 0 (0.0%) |
| Installation, Maintenance & Repair | 34 (100.0%) | 0 (0.0%) |
| Total (Category) | 60 (100.0%) | 0 (0.0%) |
| Total (Overall) | 337 (51.4%) | 319 (48.6%) |
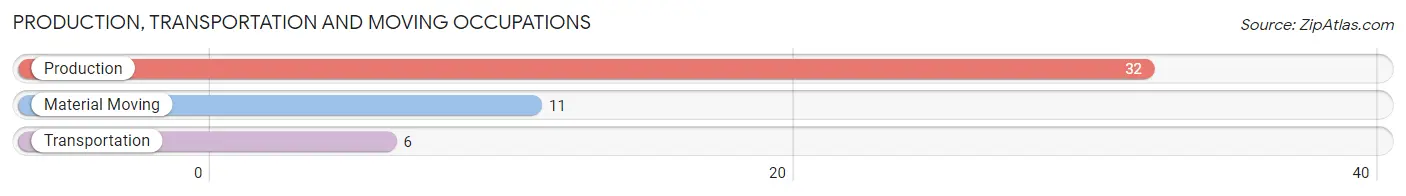
Production, Transportation and Moving Occupations
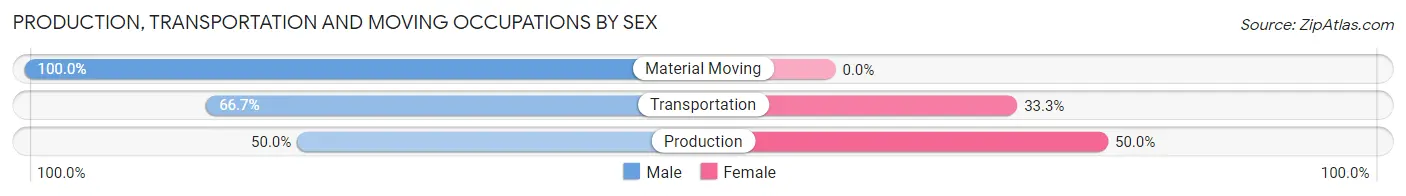
The most common Production, Transportation and Moving occupations in Farmingdale borough are Production (32 | 4.9%), Material Moving (11 | 1.7%), and Transportation (6 | 0.9%).
Production, Transportation and Moving Occupations by Sex
| Occupation | Male | Female |
| Production | 16 (50.0%) | 16 (50.0%) |
| Transportation | 4 (66.7%) | 2 (33.3%) |
| Material Moving | 11 (100.0%) | 0 (0.0%) |
| Total (Category) | 31 (63.3%) | 18 (36.7%) |
| Total (Overall) | 337 (51.4%) | 319 (48.6%) |
Employment Industries by Sex in Farmingdale borough
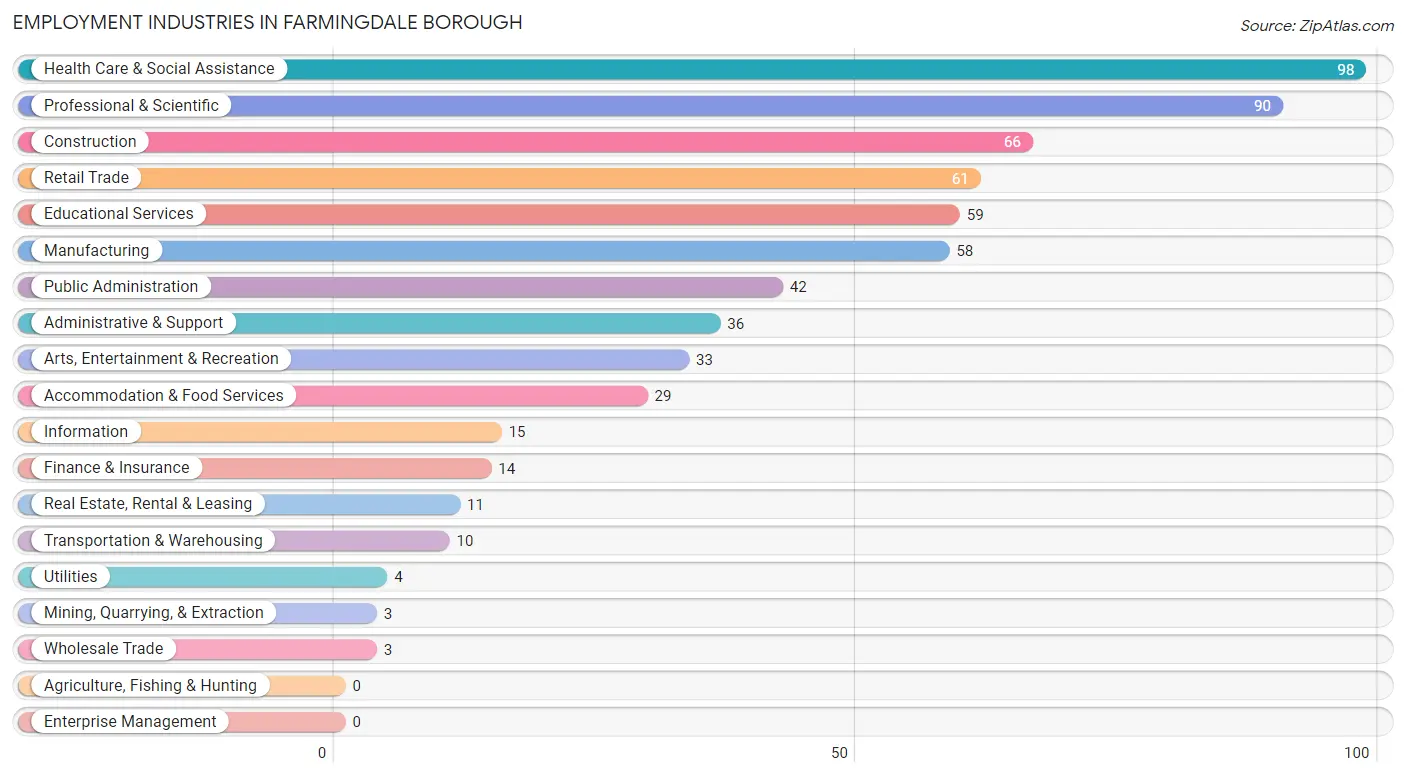
Employment Industries in Farmingdale borough
The major employment industries in Farmingdale borough include Health Care & Social Assistance (98 | 14.9%), Professional & Scientific (90 | 13.7%), Construction (66 | 10.1%), Retail Trade (61 | 9.3%), and Educational Services (59 | 9.0%).
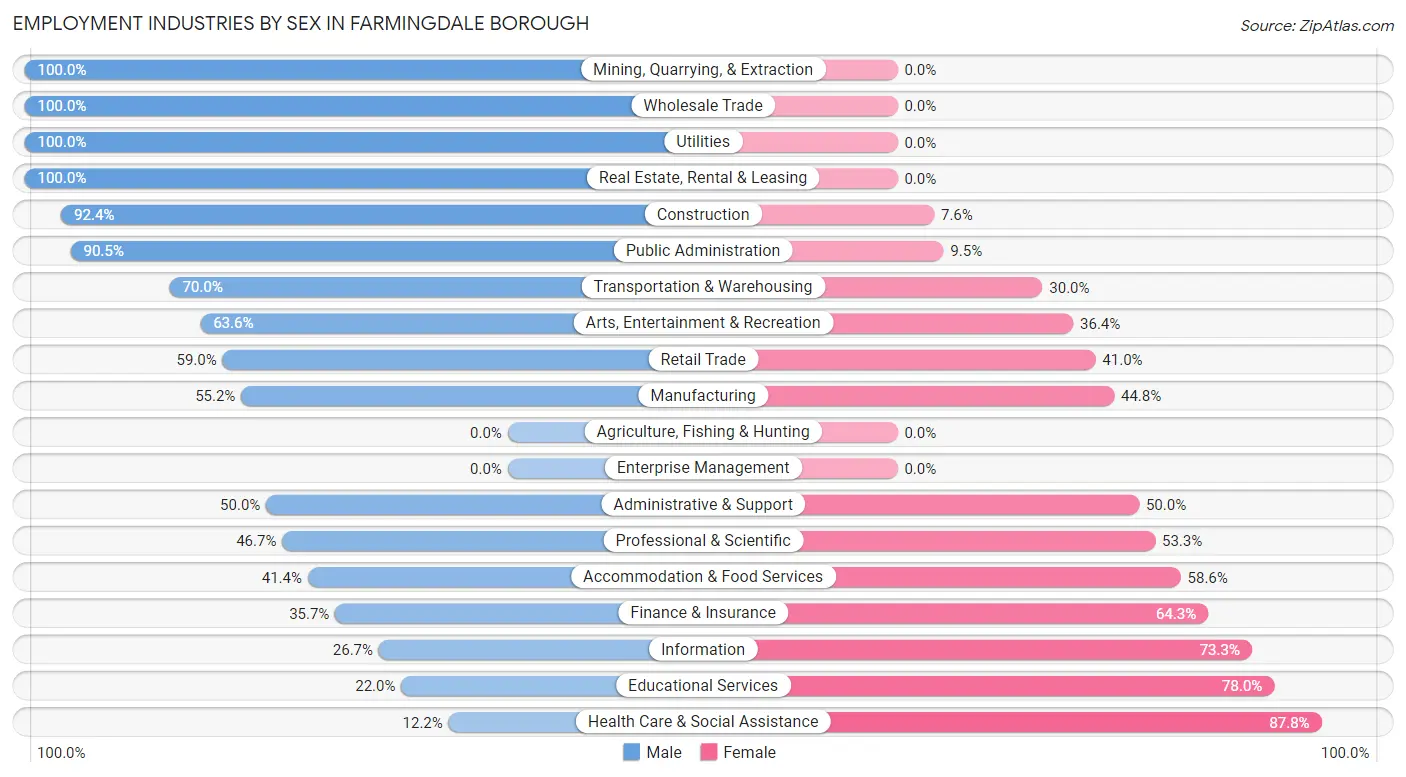
Employment Industries by Sex in Farmingdale borough
The Farmingdale borough industries that see more men than women are Mining, Quarrying, & Extraction (100.0%), Wholesale Trade (100.0%), and Utilities (100.0%), whereas the industries that tend to have a higher number of women are Health Care & Social Assistance (87.8%), Educational Services (78.0%), and Information (73.3%).
| Industry | Male | Female |
| Agriculture, Fishing & Hunting | 0 (0.0%) | 0 (0.0%) |
| Mining, Quarrying, & Extraction | 3 (100.0%) | 0 (0.0%) |
| Construction | 61 (92.4%) | 5 (7.6%) |
| Manufacturing | 32 (55.2%) | 26 (44.8%) |
| Wholesale Trade | 3 (100.0%) | 0 (0.0%) |
| Retail Trade | 36 (59.0%) | 25 (41.0%) |
| Transportation & Warehousing | 7 (70.0%) | 3 (30.0%) |
| Utilities | 4 (100.0%) | 0 (0.0%) |
| Information | 4 (26.7%) | 11 (73.3%) |
| Finance & Insurance | 5 (35.7%) | 9 (64.3%) |
| Real Estate, Rental & Leasing | 11 (100.0%) | 0 (0.0%) |
| Professional & Scientific | 42 (46.7%) | 48 (53.3%) |
| Enterprise Management | 0 (0.0%) | 0 (0.0%) |
| Administrative & Support | 18 (50.0%) | 18 (50.0%) |
| Educational Services | 13 (22.0%) | 46 (78.0%) |
| Health Care & Social Assistance | 12 (12.2%) | 86 (87.8%) |
| Arts, Entertainment & Recreation | 21 (63.6%) | 12 (36.4%) |
| Accommodation & Food Services | 12 (41.4%) | 17 (58.6%) |
| Public Administration | 38 (90.5%) | 4 (9.5%) |
| Total | 337 (51.4%) | 319 (48.6%) |
Education in Farmingdale borough
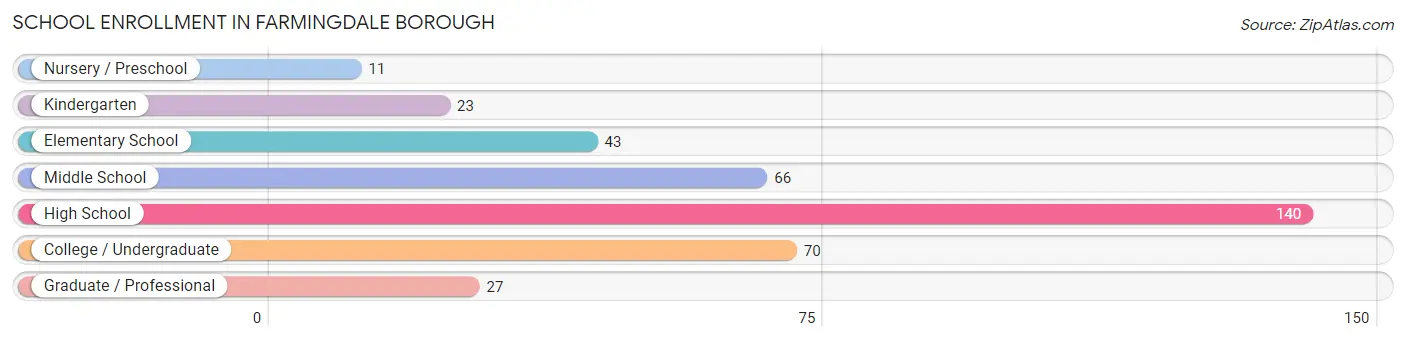
School Enrollment in Farmingdale borough
The most common levels of schooling among the 380 students in Farmingdale borough are high school (140 | 36.8%), college / undergraduate (70 | 18.4%), and middle school (66 | 17.4%).
| School Level | # Students | % Students |
| Nursery / Preschool | 11 | 2.9% |
| Kindergarten | 23 | 6.0% |
| Elementary School | 43 | 11.3% |
| Middle School | 66 | 17.4% |
| High School | 140 | 36.8% |
| College / Undergraduate | 70 | 18.4% |
| Graduate / Professional | 27 | 7.1% |
| Total | 380 | 100.0% |
School Enrollment by Age by Funding Source in Farmingdale borough
Out of a total of 380 students who are enrolled in schools in Farmingdale borough, 70 (18.4%) attend a private institution, while the remaining 310 (81.6%) are enrolled in public schools. The age group of 20 to 24 year olds has the highest likelihood of being enrolled in private schools, with 48 (100.0% in the age bracket) enrolled. Conversely, the age group of 5 to 9 year old has the lowest likelihood of being enrolled in a private school, with 59 (100.0% in the age bracket) attending a public institution.
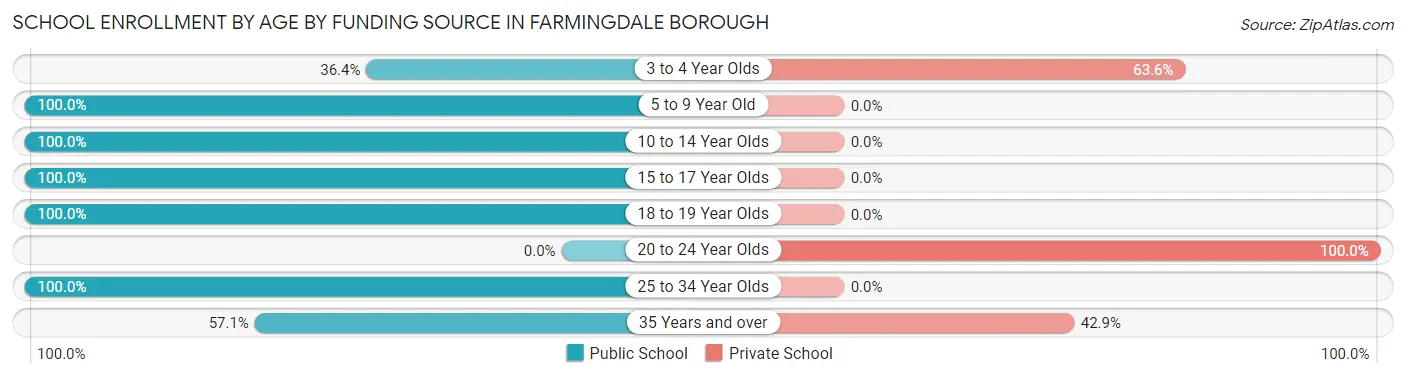
| Age Bracket | Public School | Private School |
| 3 to 4 Year Olds | 4 (36.4%) | 7 (63.6%) |
| 5 to 9 Year Old | 59 (100.0%) | 0 (0.0%) |
| 10 to 14 Year Olds | 70 (100.0%) | 0 (0.0%) |
| 15 to 17 Year Olds | 63 (100.0%) | 0 (0.0%) |
| 18 to 19 Year Olds | 85 (100.0%) | 0 (0.0%) |
| 20 to 24 Year Olds | 0 (0.0%) | 48 (100.0%) |
| 25 to 34 Year Olds | 9 (100.0%) | 0 (0.0%) |
| 35 Years and over | 20 (57.1%) | 15 (42.9%) |
| Total | 310 (81.6%) | 70 (18.4%) |
Educational Attainment by Field of Study in Farmingdale borough
Engineering (52 | 14.9%), business (50 | 14.4%), education (50 | 14.4%), bio, nature & agricultural (34 | 9.8%), and literature & languages (32 | 9.2%) are the most common fields of study among 348 individuals in Farmingdale borough who have obtained a bachelor's degree or higher.
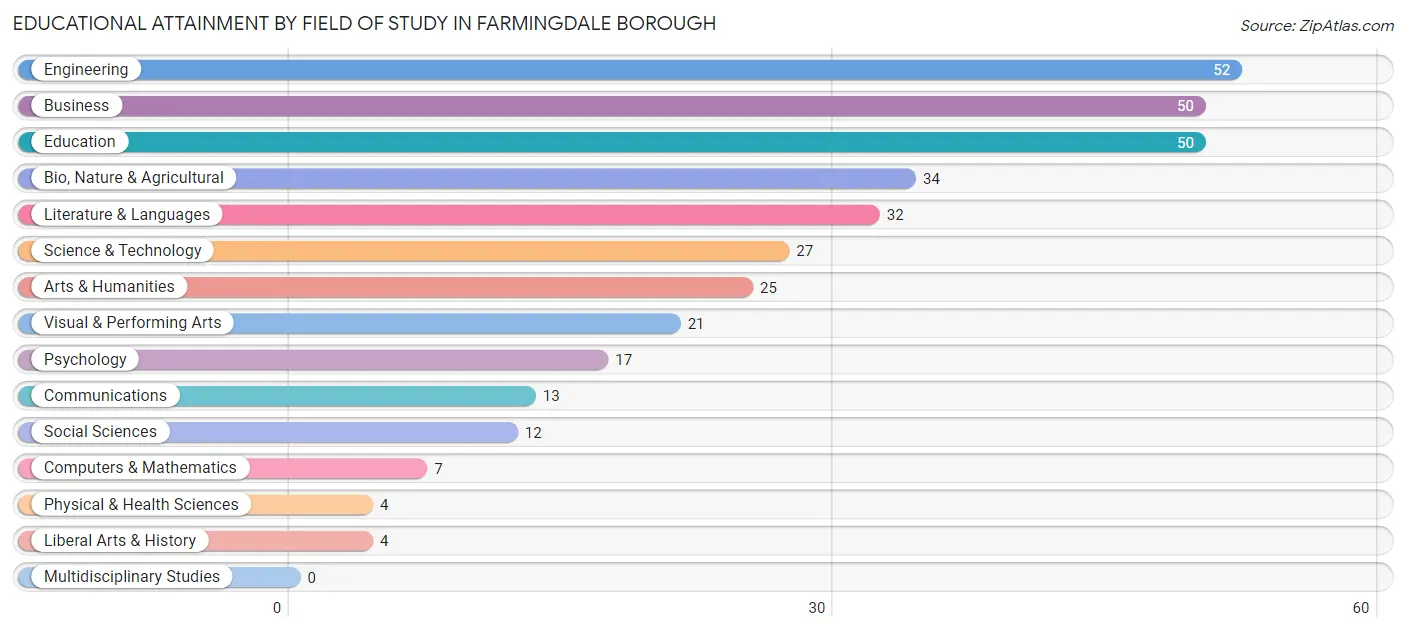
| Field of Study | # Graduates | % Graduates |
| Computers & Mathematics | 7 | 2.0% |
| Bio, Nature & Agricultural | 34 | 9.8% |
| Physical & Health Sciences | 4 | 1.1% |
| Psychology | 17 | 4.9% |
| Social Sciences | 12 | 3.5% |
| Engineering | 52 | 14.9% |
| Multidisciplinary Studies | 0 | 0.0% |
| Science & Technology | 27 | 7.8% |
| Business | 50 | 14.4% |
| Education | 50 | 14.4% |
| Literature & Languages | 32 | 9.2% |
| Liberal Arts & History | 4 | 1.1% |
| Visual & Performing Arts | 21 | 6.0% |
| Communications | 13 | 3.7% |
| Arts & Humanities | 25 | 7.2% |
| Total | 348 | 100.0% |
Transportation & Commute in Farmingdale borough
Vehicle Availability by Sex in Farmingdale borough
The most prevalent vehicle ownership categories in Farmingdale borough are males with 2 vehicles (127, accounting for 38.7%) and females with 2 vehicles (123, making up 40.7%).
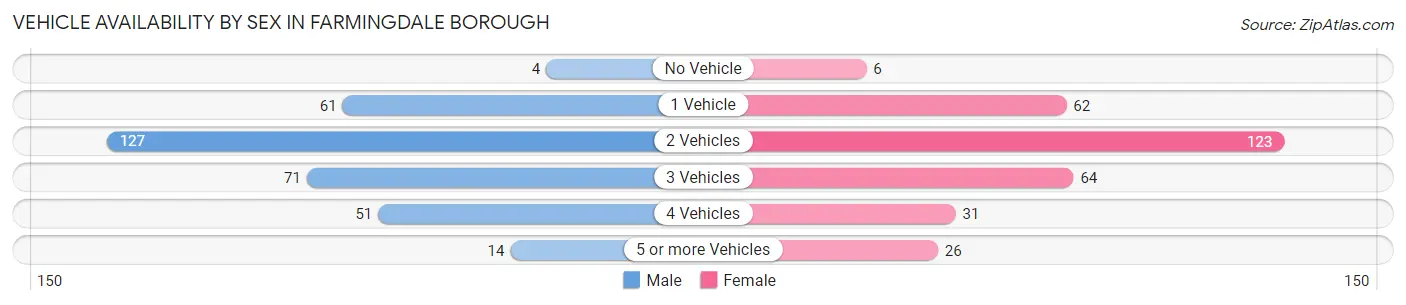
| Vehicles Available | Male | Female |
| No Vehicle | 4 (1.2%) | 6 (1.9%) |
| 1 Vehicle | 61 (18.6%) | 62 (19.9%) |
| 2 Vehicles | 127 (38.7%) | 123 (39.4%) |
| 3 Vehicles | 71 (21.6%) | 64 (20.5%) |
| 4 Vehicles | 51 (15.5%) | 31 (9.9%) |
| 5 or more Vehicles | 14 (4.3%) | 26 (8.3%) |
| Total | 328 (100.0%) | 312 (100.0%) |
Commute Time in Farmingdale borough
The most frequently occuring commute durations in Farmingdale borough are 45 to 59 minutes (106 commuters, 18.1%), 30 to 34 minutes (83 commuters, 14.1%), and 20 to 24 minutes (80 commuters, 13.6%).
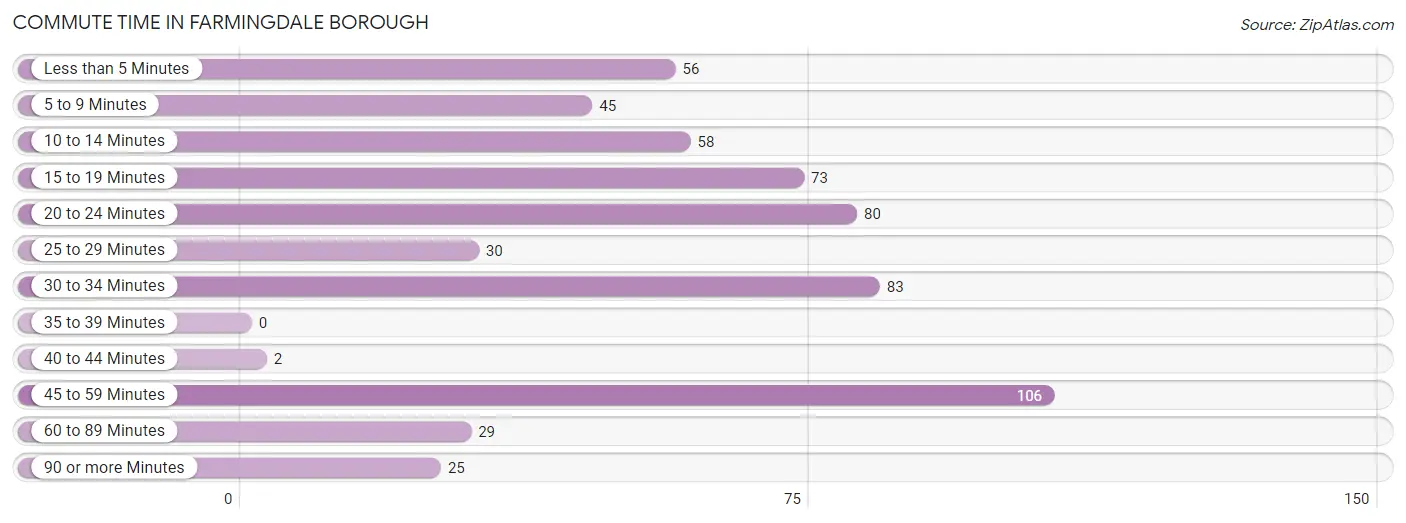
| Commute Time | # Commuters | % Commuters |
| Less than 5 Minutes | 56 | 9.5% |
| 5 to 9 Minutes | 45 | 7.7% |
| 10 to 14 Minutes | 58 | 9.9% |
| 15 to 19 Minutes | 73 | 12.4% |
| 20 to 24 Minutes | 80 | 13.6% |
| 25 to 29 Minutes | 30 | 5.1% |
| 30 to 34 Minutes | 83 | 14.1% |
| 35 to 39 Minutes | 0 | 0.0% |
| 40 to 44 Minutes | 2 | 0.3% |
| 45 to 59 Minutes | 106 | 18.1% |
| 60 to 89 Minutes | 29 | 4.9% |
| 90 or more Minutes | 25 | 4.3% |
Commute Time by Sex in Farmingdale borough
The most common commute times in Farmingdale borough are 45 to 59 minutes (65 commuters, 21.7%) for males and 20 to 24 minutes (46 commuters, 16.0%) for females.
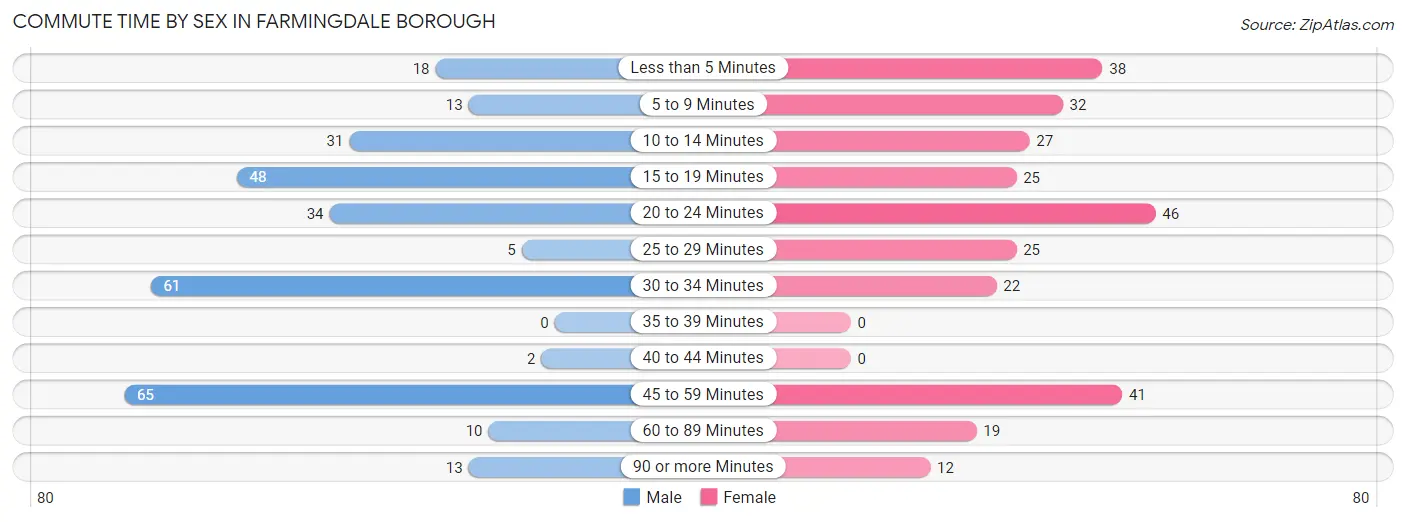
| Commute Time | Male | Female |
| Less than 5 Minutes | 18 (6.0%) | 38 (13.2%) |
| 5 to 9 Minutes | 13 (4.3%) | 32 (11.2%) |
| 10 to 14 Minutes | 31 (10.3%) | 27 (9.4%) |
| 15 to 19 Minutes | 48 (16.0%) | 25 (8.7%) |
| 20 to 24 Minutes | 34 (11.3%) | 46 (16.0%) |
| 25 to 29 Minutes | 5 (1.7%) | 25 (8.7%) |
| 30 to 34 Minutes | 61 (20.3%) | 22 (7.7%) |
| 35 to 39 Minutes | 0 (0.0%) | 0 (0.0%) |
| 40 to 44 Minutes | 2 (0.7%) | 0 (0.0%) |
| 45 to 59 Minutes | 65 (21.7%) | 41 (14.3%) |
| 60 to 89 Minutes | 10 (3.3%) | 19 (6.6%) |
| 90 or more Minutes | 13 (4.3%) | 12 (4.2%) |
Time of Departure to Work by Sex in Farmingdale borough
The most frequent times of departure to work in Farmingdale borough are 7:00 AM to 7:29 AM (50, 16.7%) for males and 8:00 AM to 8:29 AM (55, 19.2%) for females.
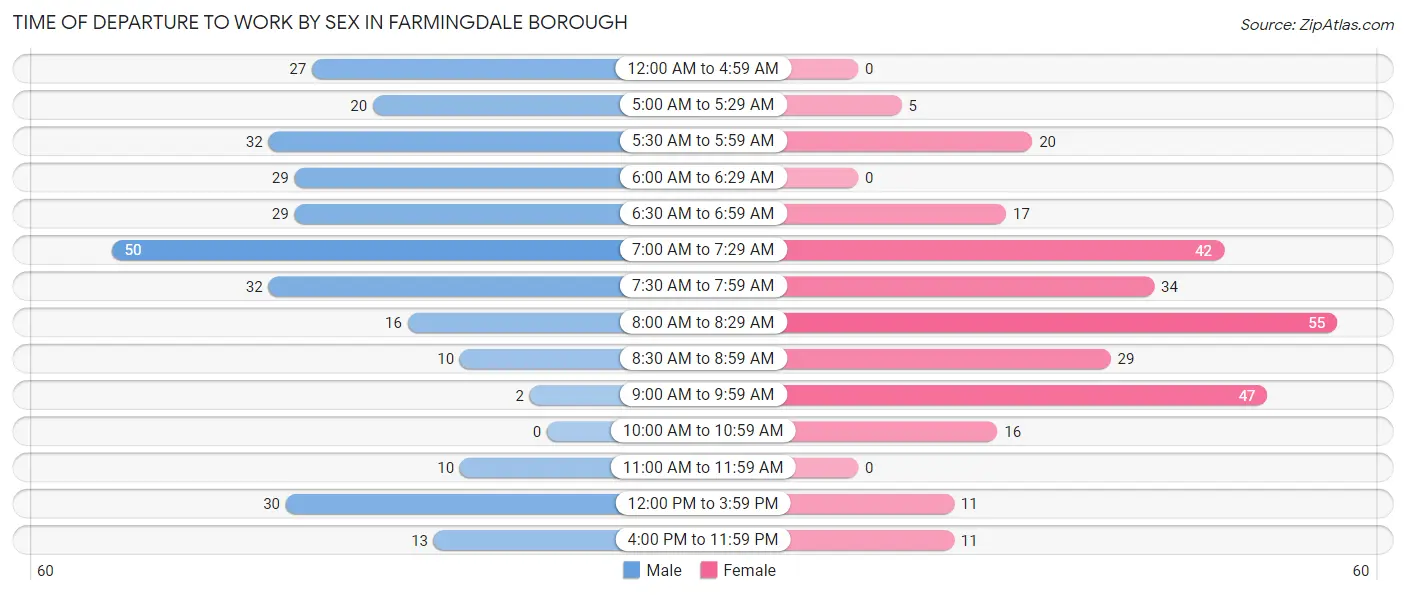
| Time of Departure | Male | Female |
| 12:00 AM to 4:59 AM | 27 (9.0%) | 0 (0.0%) |
| 5:00 AM to 5:29 AM | 20 (6.7%) | 5 (1.7%) |
| 5:30 AM to 5:59 AM | 32 (10.7%) | 20 (7.0%) |
| 6:00 AM to 6:29 AM | 29 (9.7%) | 0 (0.0%) |
| 6:30 AM to 6:59 AM | 29 (9.7%) | 17 (5.9%) |
| 7:00 AM to 7:29 AM | 50 (16.7%) | 42 (14.6%) |
| 7:30 AM to 7:59 AM | 32 (10.7%) | 34 (11.8%) |
| 8:00 AM to 8:29 AM | 16 (5.3%) | 55 (19.2%) |
| 8:30 AM to 8:59 AM | 10 (3.3%) | 29 (10.1%) |
| 9:00 AM to 9:59 AM | 2 (0.7%) | 47 (16.4%) |
| 10:00 AM to 10:59 AM | 0 (0.0%) | 16 (5.6%) |
| 11:00 AM to 11:59 AM | 10 (3.3%) | 0 (0.0%) |
| 12:00 PM to 3:59 PM | 30 (10.0%) | 11 (3.8%) |
| 4:00 PM to 11:59 PM | 13 (4.3%) | 11 (3.8%) |
| Total | 300 (100.0%) | 287 (100.0%) |
Housing Occupancy in Farmingdale borough
Occupancy by Ownership in Farmingdale borough
Of the total 541 dwellings in Farmingdale borough, owner-occupied units account for 315 (58.2%), while renter-occupied units make up 226 (41.8%).
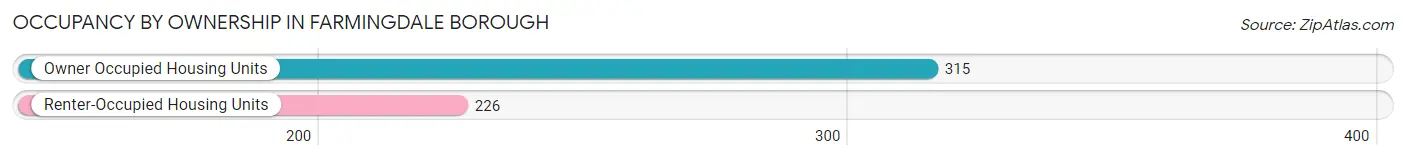
| Occupancy | # Housing Units | % Housing Units |
| Owner Occupied Housing Units | 315 | 58.2% |
| Renter-Occupied Housing Units | 226 | 41.8% |
| Total Occupied Housing Units | 541 | 100.0% |
Occupancy by Household Size in Farmingdale borough
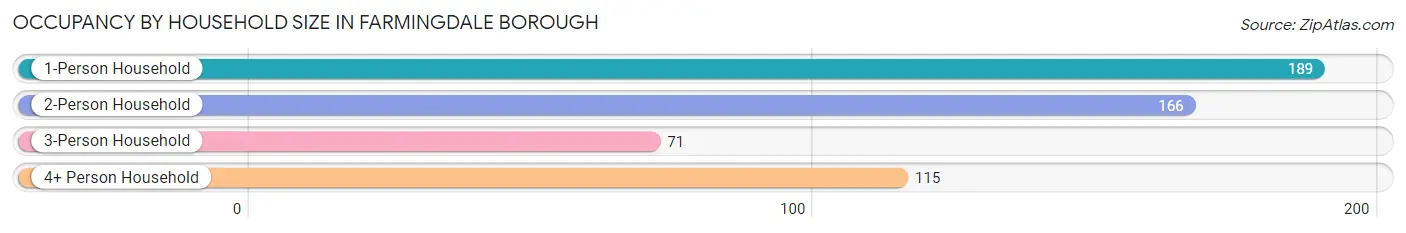
| Household Size | # Housing Units | % Housing Units |
| 1-Person Household | 189 | 34.9% |
| 2-Person Household | 166 | 30.7% |
| 3-Person Household | 71 | 13.1% |
| 4+ Person Household | 115 | 21.3% |
| Total Housing Units | 541 | 100.0% |
Occupancy by Ownership by Household Size in Farmingdale borough
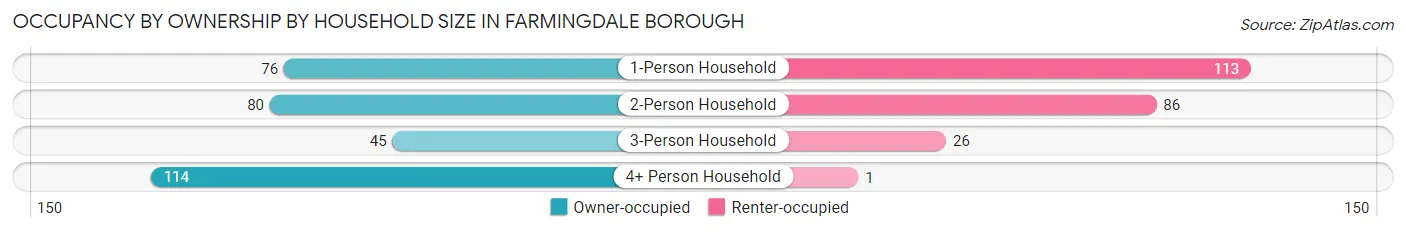
| Household Size | Owner-occupied | Renter-occupied |
| 1-Person Household | 76 (40.2%) | 113 (59.8%) |
| 2-Person Household | 80 (48.2%) | 86 (51.8%) |
| 3-Person Household | 45 (63.4%) | 26 (36.6%) |
| 4+ Person Household | 114 (99.1%) | 1 (0.9%) |
| Total Housing Units | 315 (58.2%) | 226 (41.8%) |
Occupancy by Educational Attainment in Farmingdale borough
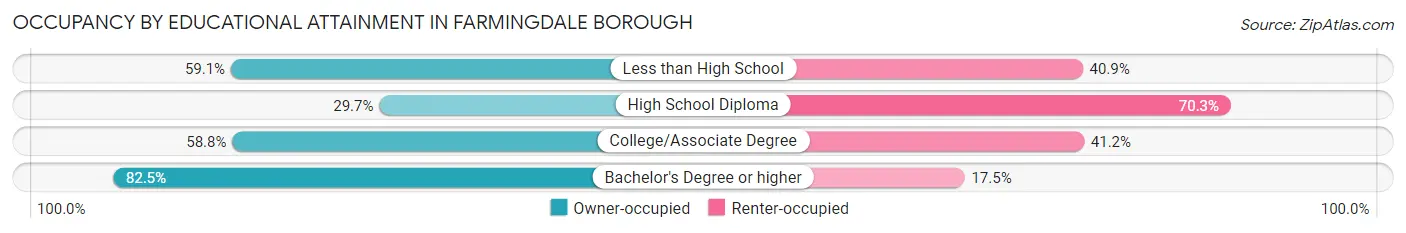
| Household Size | Owner-occupied | Renter-occupied |
| Less than High School | 13 (59.1%) | 9 (40.9%) |
| High School Diploma | 46 (29.7%) | 109 (70.3%) |
| College/Associate Degree | 110 (58.8%) | 77 (41.2%) |
| Bachelor's Degree or higher | 146 (82.5%) | 31 (17.5%) |
Occupancy by Age of Householder in Farmingdale borough
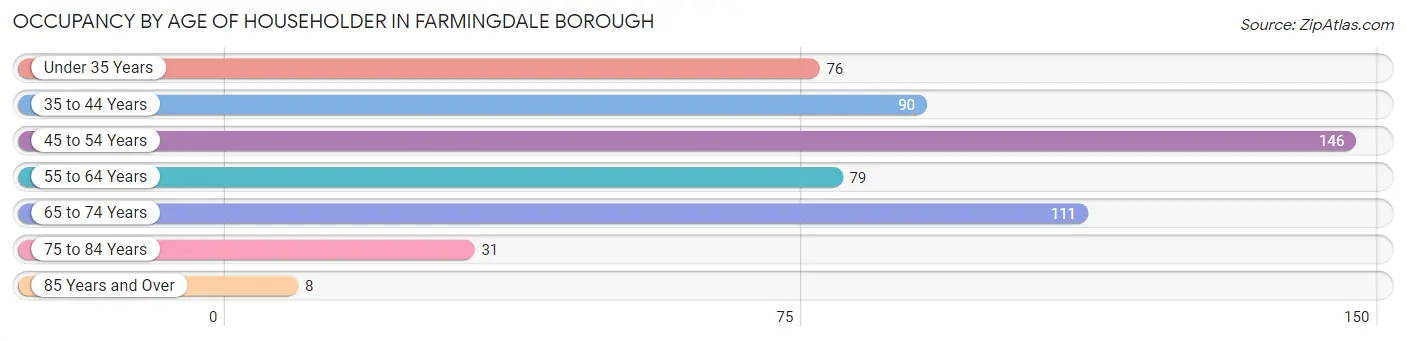
| Age Bracket | # Households | % Households |
| Under 35 Years | 76 | 14.1% |
| 35 to 44 Years | 90 | 16.6% |
| 45 to 54 Years | 146 | 27.0% |
| 55 to 64 Years | 79 | 14.6% |
| 65 to 74 Years | 111 | 20.5% |
| 75 to 84 Years | 31 | 5.7% |
| 85 Years and Over | 8 | 1.5% |
| Total | 541 | 100.0% |
Housing Finances in Farmingdale borough
Median Income by Occupancy in Farmingdale borough
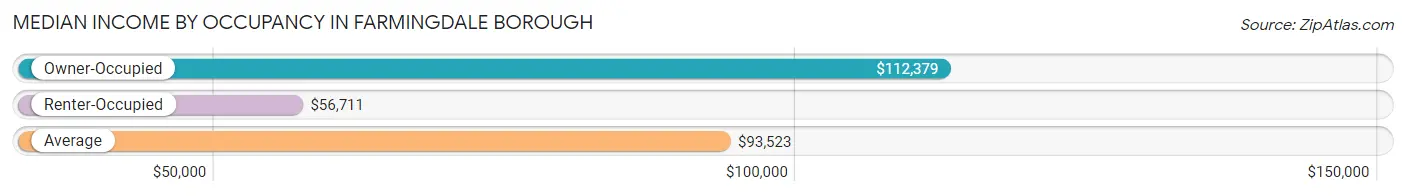
| Occupancy Type | # Households | Median Income |
| Owner-Occupied | 315 (58.2%) | $112,379 |
| Renter-Occupied | 226 (41.8%) | $56,711 |
| Average | 541 (100.0%) | $93,523 |
Occupancy by Householder Income Bracket in Farmingdale borough
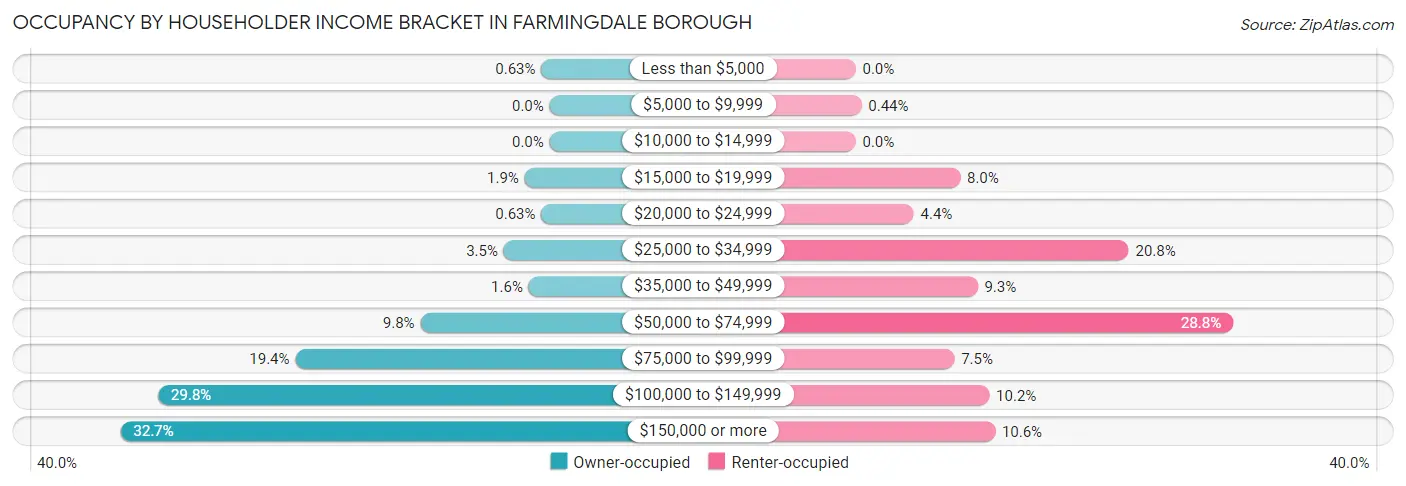
| Income Bracket | Owner-occupied | Renter-occupied |
| Less than $5,000 | 2 (0.6%) | 0 (0.0%) |
| $5,000 to $9,999 | 0 (0.0%) | 1 (0.4%) |
| $10,000 to $14,999 | 0 (0.0%) | 0 (0.0%) |
| $15,000 to $19,999 | 6 (1.9%) | 18 (8.0%) |
| $20,000 to $24,999 | 2 (0.6%) | 10 (4.4%) |
| $25,000 to $34,999 | 11 (3.5%) | 47 (20.8%) |
| $35,000 to $49,999 | 5 (1.6%) | 21 (9.3%) |
| $50,000 to $74,999 | 31 (9.8%) | 65 (28.8%) |
| $75,000 to $99,999 | 61 (19.4%) | 17 (7.5%) |
| $100,000 to $149,999 | 94 (29.8%) | 23 (10.2%) |
| $150,000 or more | 103 (32.7%) | 24 (10.6%) |
| Total | 315 (100.0%) | 226 (100.0%) |
Monthly Housing Cost Tiers in Farmingdale borough
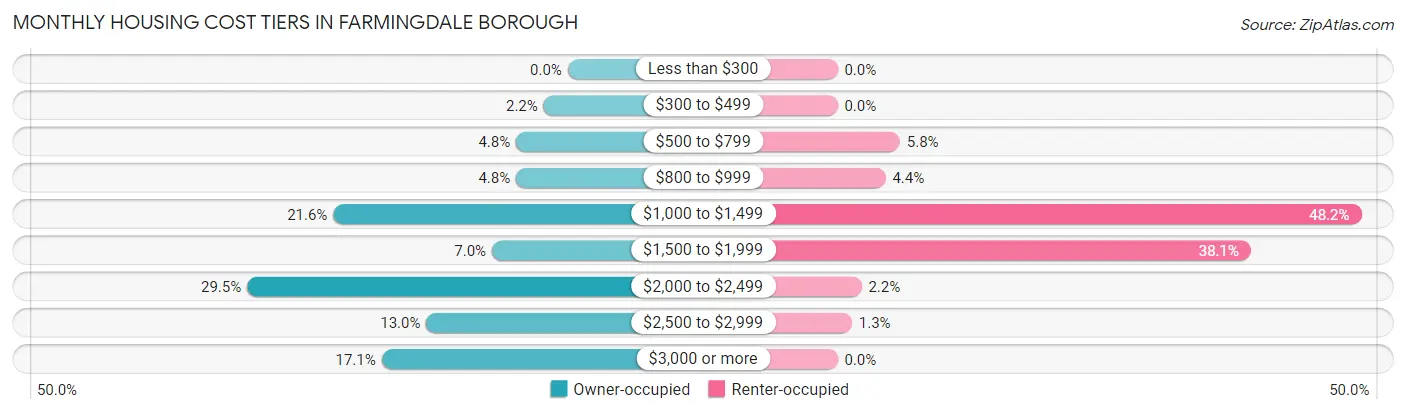
| Monthly Cost | Owner-occupied | Renter-occupied |
| Less than $300 | 0 (0.0%) | 0 (0.0%) |
| $300 to $499 | 7 (2.2%) | 0 (0.0%) |
| $500 to $799 | 15 (4.8%) | 13 (5.8%) |
| $800 to $999 | 15 (4.8%) | 10 (4.4%) |
| $1,000 to $1,499 | 68 (21.6%) | 109 (48.2%) |
| $1,500 to $1,999 | 22 (7.0%) | 86 (38.1%) |
| $2,000 to $2,499 | 93 (29.5%) | 5 (2.2%) |
| $2,500 to $2,999 | 41 (13.0%) | 3 (1.3%) |
| $3,000 or more | 54 (17.1%) | 0 (0.0%) |
| Total | 315 (100.0%) | 226 (100.0%) |
Physical Housing Characteristics in Farmingdale borough
Housing Structures in Farmingdale borough
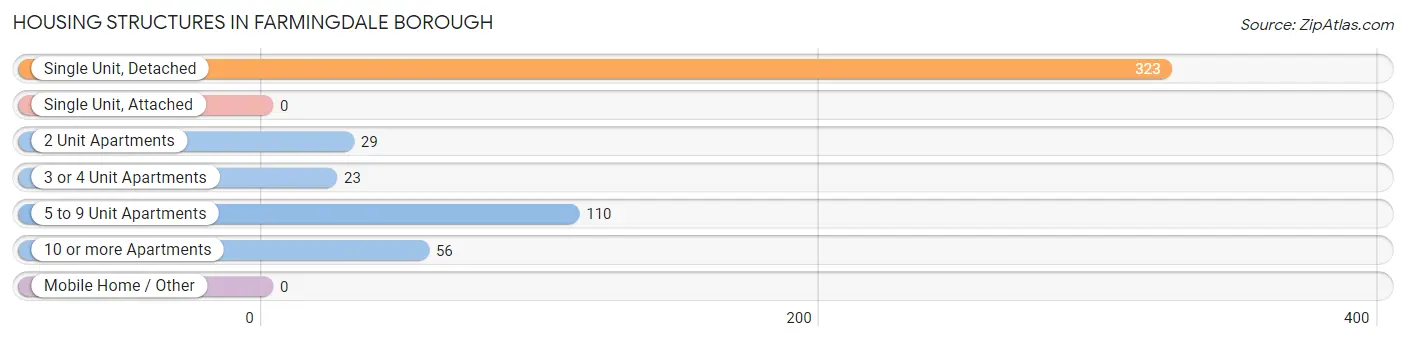
| Structure Type | # Housing Units | % Housing Units |
| Single Unit, Detached | 323 | 59.7% |
| Single Unit, Attached | 0 | 0.0% |
| 2 Unit Apartments | 29 | 5.4% |
| 3 or 4 Unit Apartments | 23 | 4.3% |
| 5 to 9 Unit Apartments | 110 | 20.3% |
| 10 or more Apartments | 56 | 10.3% |
| Mobile Home / Other | 0 | 0.0% |
| Total | 541 | 100.0% |
Housing Structures by Occupancy in Farmingdale borough
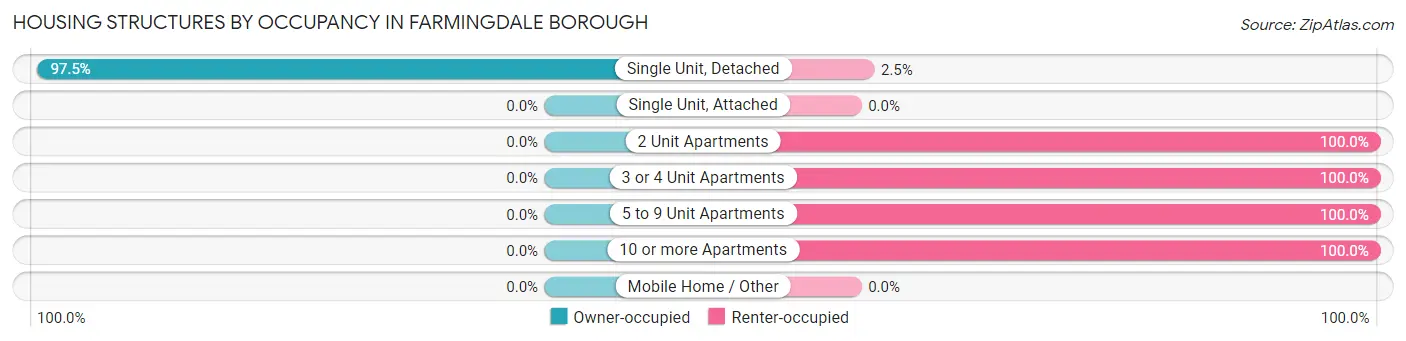
| Structure Type | Owner-occupied | Renter-occupied |
| Single Unit, Detached | 315 (97.5%) | 8 (2.5%) |
| Single Unit, Attached | 0 (0.0%) | 0 (0.0%) |
| 2 Unit Apartments | 0 (0.0%) | 29 (100.0%) |
| 3 or 4 Unit Apartments | 0 (0.0%) | 23 (100.0%) |
| 5 to 9 Unit Apartments | 0 (0.0%) | 110 (100.0%) |
| 10 or more Apartments | 0 (0.0%) | 56 (100.0%) |
| Mobile Home / Other | 0 (0.0%) | 0 (0.0%) |
| Total | 315 (58.2%) | 226 (41.8%) |
Housing Structures by Number of Rooms in Farmingdale borough
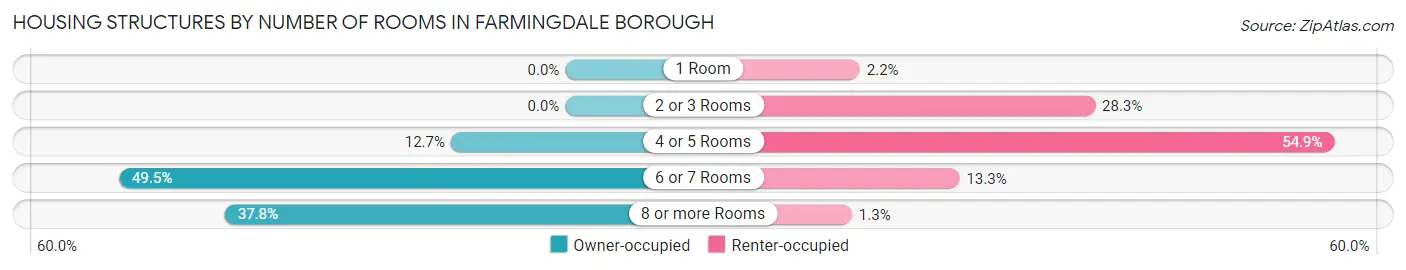
| Number of Rooms | Owner-occupied | Renter-occupied |
| 1 Room | 0 (0.0%) | 5 (2.2%) |
| 2 or 3 Rooms | 0 (0.0%) | 64 (28.3%) |
| 4 or 5 Rooms | 40 (12.7%) | 124 (54.9%) |
| 6 or 7 Rooms | 156 (49.5%) | 30 (13.3%) |
| 8 or more Rooms | 119 (37.8%) | 3 (1.3%) |
| Total | 315 (100.0%) | 226 (100.0%) |
Housing Structure by Heating Type in Farmingdale borough
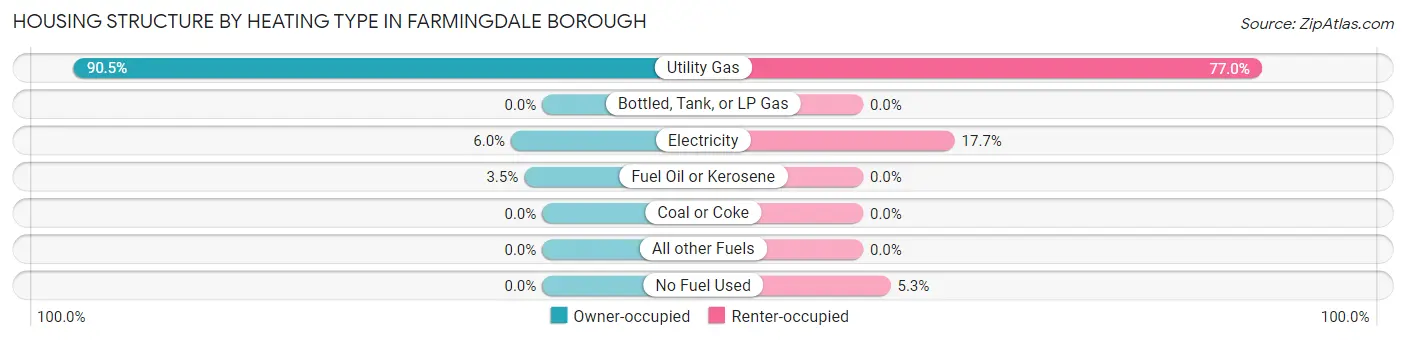
| Heating Type | Owner-occupied | Renter-occupied |
| Utility Gas | 285 (90.5%) | 174 (77.0%) |
| Bottled, Tank, or LP Gas | 0 (0.0%) | 0 (0.0%) |
| Electricity | 19 (6.0%) | 40 (17.7%) |
| Fuel Oil or Kerosene | 11 (3.5%) | 0 (0.0%) |
| Coal or Coke | 0 (0.0%) | 0 (0.0%) |
| All other Fuels | 0 (0.0%) | 0 (0.0%) |
| No Fuel Used | 0 (0.0%) | 12 (5.3%) |
| Total | 315 (100.0%) | 226 (100.0%) |
Household Vehicle Usage in Farmingdale borough
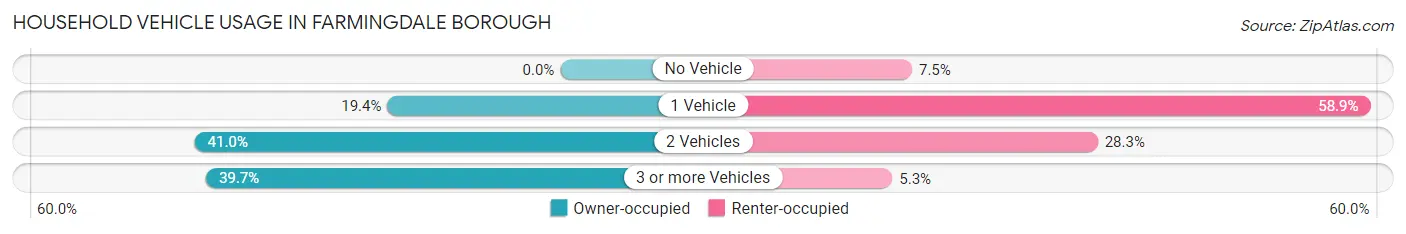
| Vehicles per Household | Owner-occupied | Renter-occupied |
| No Vehicle | 0 (0.0%) | 17 (7.5%) |
| 1 Vehicle | 61 (19.4%) | 133 (58.9%) |
| 2 Vehicles | 129 (40.9%) | 64 (28.3%) |
| 3 or more Vehicles | 125 (39.7%) | 12 (5.3%) |
| Total | 315 (100.0%) | 226 (100.0%) |
Real Estate & Mortgages in Farmingdale borough
Real Estate and Mortgage Overview in Farmingdale borough
| Characteristic | Without Mortgage | With Mortgage |
| Housing Units | 88 | 227 |
| Median Property Value | $395,500 | $387,000 |
| Median Household Income | $91,667 | $91 |
| Monthly Housing Costs | $1,044 | $54 |
| Real Estate Taxes | $7,059 | $2 |
Property Value by Mortgage Status in Farmingdale borough
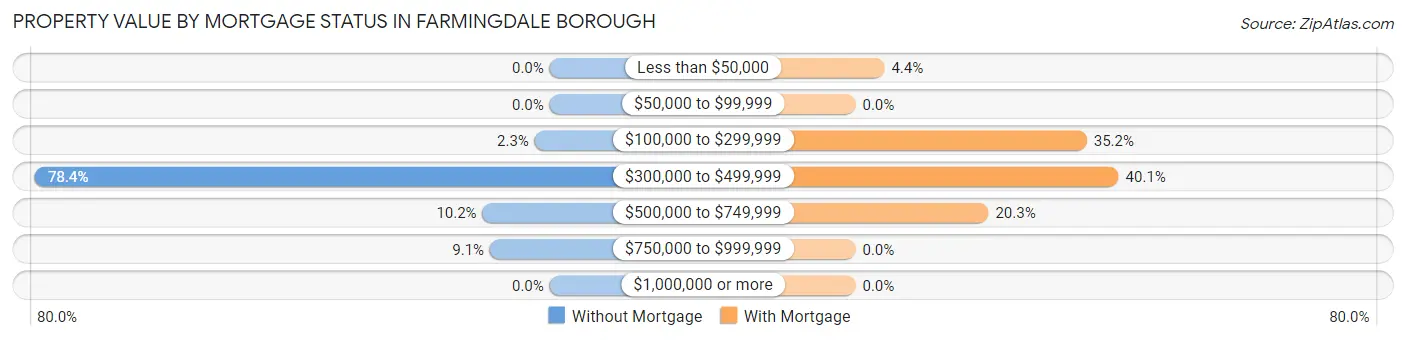
| Property Value | Without Mortgage | With Mortgage |
| Less than $50,000 | 0 (0.0%) | 10 (4.4%) |
| $50,000 to $99,999 | 0 (0.0%) | 0 (0.0%) |
| $100,000 to $299,999 | 2 (2.3%) | 80 (35.2%) |
| $300,000 to $499,999 | 69 (78.4%) | 91 (40.1%) |
| $500,000 to $749,999 | 9 (10.2%) | 46 (20.3%) |
| $750,000 to $999,999 | 8 (9.1%) | 0 (0.0%) |
| $1,000,000 or more | 0 (0.0%) | 0 (0.0%) |
| Total | 88 (100.0%) | 227 (100.0%) |
Household Income by Mortgage Status in Farmingdale borough
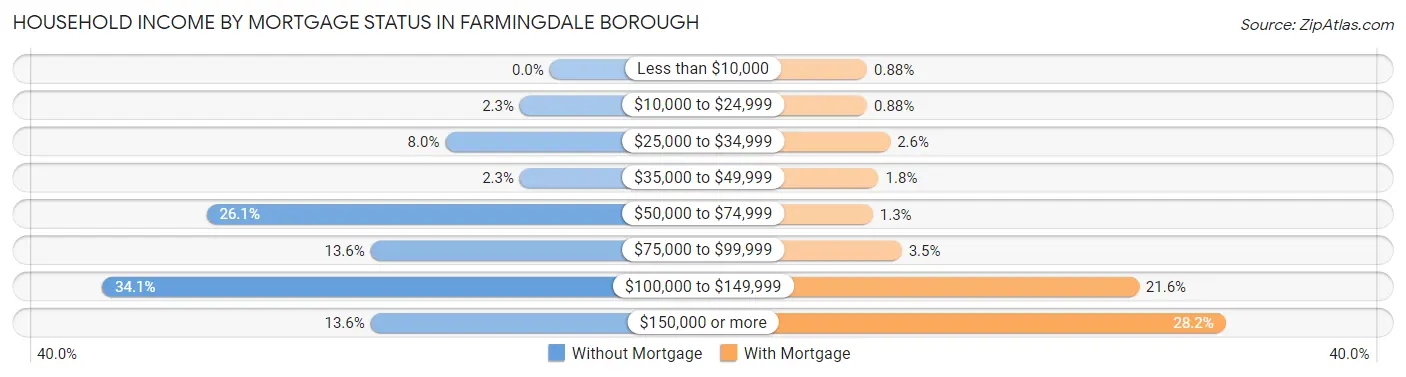
| Household Income | Without Mortgage | With Mortgage |
| Less than $10,000 | 0 (0.0%) | 2 (0.9%) |
| $10,000 to $24,999 | 2 (2.3%) | 2 (0.9%) |
| $25,000 to $34,999 | 7 (8.0%) | 6 (2.6%) |
| $35,000 to $49,999 | 2 (2.3%) | 4 (1.8%) |
| $50,000 to $74,999 | 23 (26.1%) | 3 (1.3%) |
| $75,000 to $99,999 | 12 (13.6%) | 8 (3.5%) |
| $100,000 to $149,999 | 30 (34.1%) | 49 (21.6%) |
| $150,000 or more | 12 (13.6%) | 64 (28.2%) |
| Total | 88 (100.0%) | 227 (100.0%) |
Property Value to Household Income Ratio in Farmingdale borough
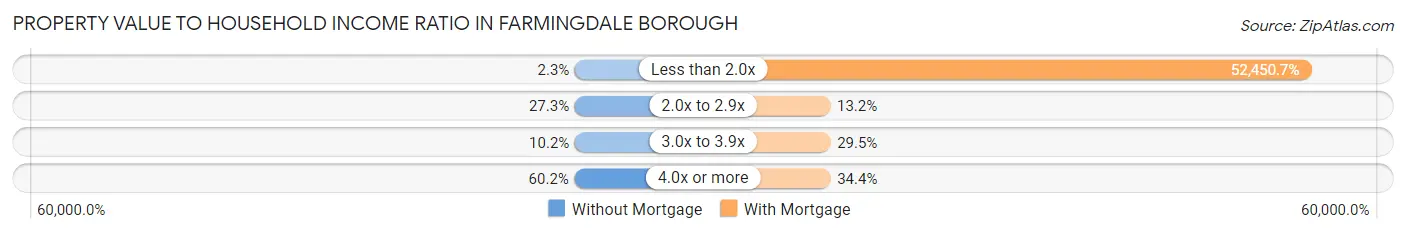
| Value-to-Income Ratio | Without Mortgage | With Mortgage |
| Less than 2.0x | 2 (2.3%) | 119,063 (52,450.7%) |
| 2.0x to 2.9x | 24 (27.3%) | 30 (13.2%) |
| 3.0x to 3.9x | 9 (10.2%) | 67 (29.5%) |
| 4.0x or more | 53 (60.2%) | 78 (34.4%) |
| Total | 88 (100.0%) | 227 (100.0%) |
Real Estate Taxes by Mortgage Status in Farmingdale borough
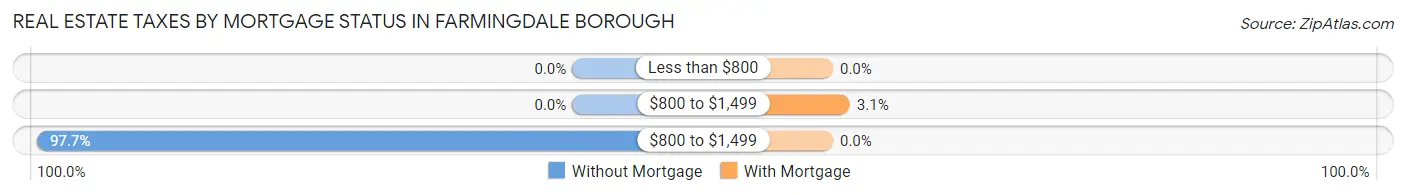
| Property Taxes | Without Mortgage | With Mortgage |
| Less than $800 | 0 (0.0%) | 0 (0.0%) |
| $800 to $1,499 | 0 (0.0%) | 7 (3.1%) |
| $800 to $1,499 | 86 (97.7%) | 0 (0.0%) |
| Total | 88 (100.0%) | 227 (100.0%) |
Health & Disability in Farmingdale borough
Health Insurance Coverage by Age in Farmingdale borough
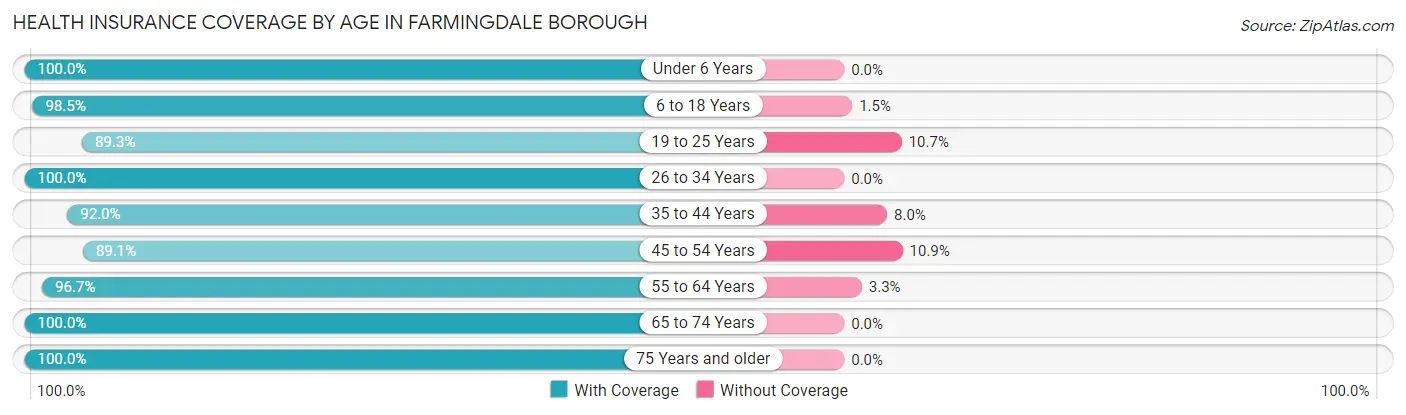
| Age Bracket | With Coverage | Without Coverage |
| Under 6 Years | 37 (100.0%) | 0 (0.0%) |
| 6 to 18 Years | 267 (98.5%) | 4 (1.5%) |
| 19 to 25 Years | 125 (89.3%) | 15 (10.7%) |
| 26 to 34 Years | 129 (100.0%) | 0 (0.0%) |
| 35 to 44 Years | 150 (92.0%) | 13 (8.0%) |
| 45 to 54 Years | 205 (89.1%) | 25 (10.9%) |
| 55 to 64 Years | 148 (96.7%) | 5 (3.3%) |
| 65 to 74 Years | 156 (100.0%) | 0 (0.0%) |
| 75 Years and older | 47 (100.0%) | 0 (0.0%) |
| Total | 1,264 (95.3%) | 62 (4.7%) |
Health Insurance Coverage by Citizenship Status in Farmingdale borough
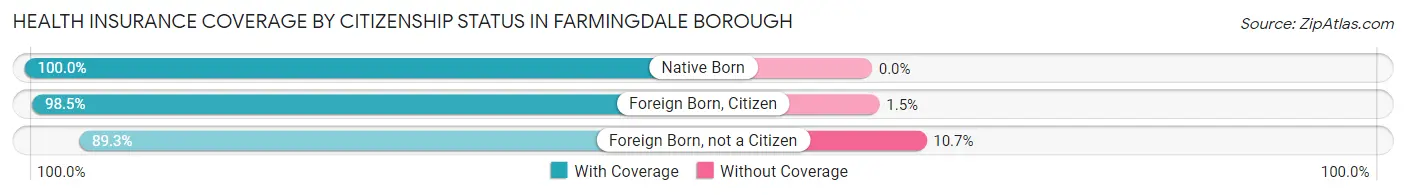
| Citizenship Status | With Coverage | Without Coverage |
| Native Born | 37 (100.0%) | 0 (0.0%) |
| Foreign Born, Citizen | 267 (98.5%) | 4 (1.5%) |
| Foreign Born, not a Citizen | 125 (89.3%) | 15 (10.7%) |
Health Insurance Coverage by Household Income in Farmingdale borough
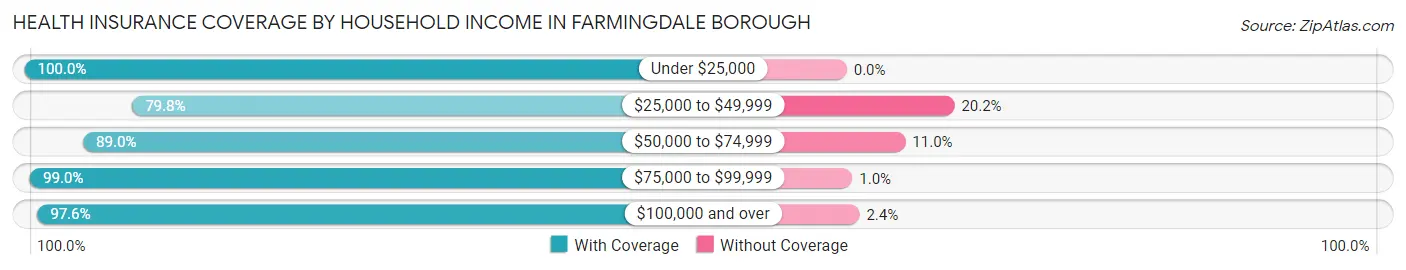
| Household Income | With Coverage | Without Coverage |
| Under $25,000 | 69 (100.0%) | 0 (0.0%) |
| $25,000 to $49,999 | 95 (79.8%) | 24 (20.2%) |
| $50,000 to $74,999 | 154 (89.0%) | 19 (11.0%) |
| $75,000 to $99,999 | 286 (99.0%) | 3 (1.0%) |
| $100,000 and over | 655 (97.6%) | 16 (2.4%) |
Public vs Private Health Insurance Coverage by Age in Farmingdale borough
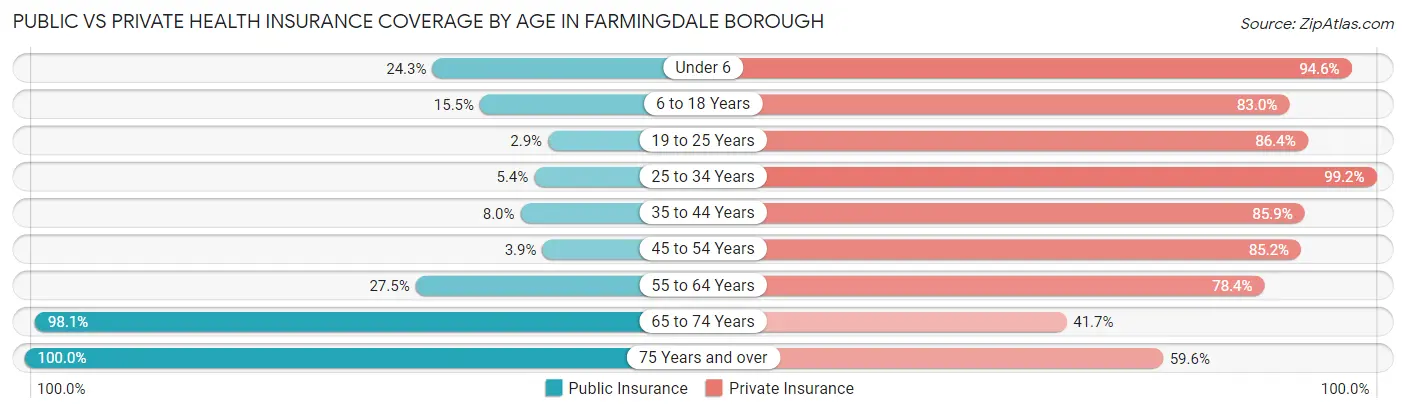
| Age Bracket | Public Insurance | Private Insurance |
| Under 6 | 9 (24.3%) | 35 (94.6%) |
| 6 to 18 Years | 42 (15.5%) | 225 (83.0%) |
| 19 to 25 Years | 4 (2.9%) | 121 (86.4%) |
| 25 to 34 Years | 7 (5.4%) | 128 (99.2%) |
| 35 to 44 Years | 13 (8.0%) | 140 (85.9%) |
| 45 to 54 Years | 9 (3.9%) | 196 (85.2%) |
| 55 to 64 Years | 42 (27.5%) | 120 (78.4%) |
| 65 to 74 Years | 153 (98.1%) | 65 (41.7%) |
| 75 Years and over | 47 (100.0%) | 28 (59.6%) |
| Total | 326 (24.6%) | 1,058 (79.8%) |
Disability Status by Sex by Age in Farmingdale borough
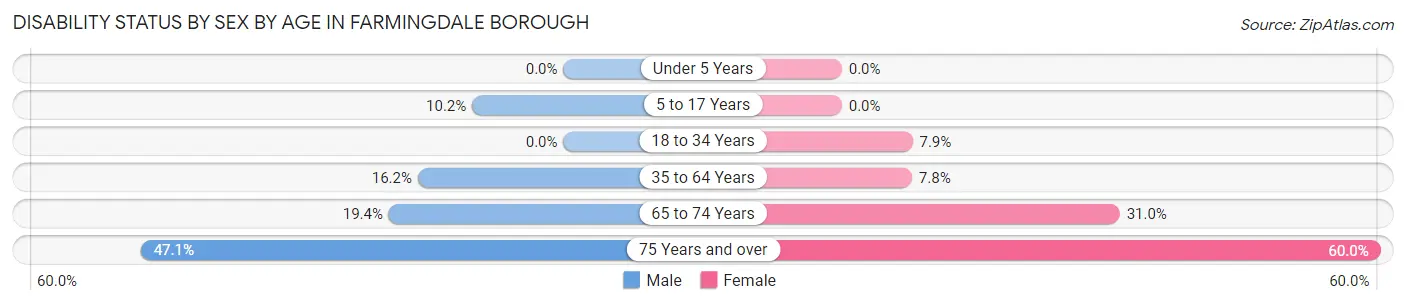
| Age Bracket | Male | Female |
| Under 5 Years | 0 (0.0%) | 0 (0.0%) |
| 5 to 17 Years | 13 (10.2%) | 0 (0.0%) |
| 18 to 34 Years | 0 (0.0%) | 16 (7.9%) |
| 35 to 64 Years | 47 (16.2%) | 20 (7.8%) |
| 65 to 74 Years | 14 (19.4%) | 26 (30.9%) |
| 75 Years and over | 8 (47.1%) | 18 (60.0%) |
Disability Class by Sex by Age in Farmingdale borough
Disability Class: Hearing Difficulty
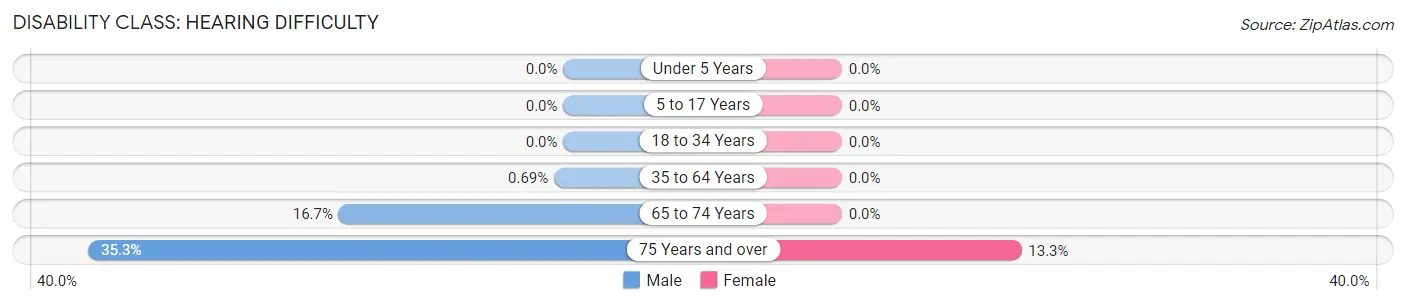
| Age Bracket | Male | Female |
| Under 5 Years | 0 (0.0%) | 0 (0.0%) |
| 5 to 17 Years | 0 (0.0%) | 0 (0.0%) |
| 18 to 34 Years | 0 (0.0%) | 0 (0.0%) |
| 35 to 64 Years | 2 (0.7%) | 0 (0.0%) |
| 65 to 74 Years | 12 (16.7%) | 0 (0.0%) |
| 75 Years and over | 6 (35.3%) | 4 (13.3%) |
Disability Class: Vision Difficulty
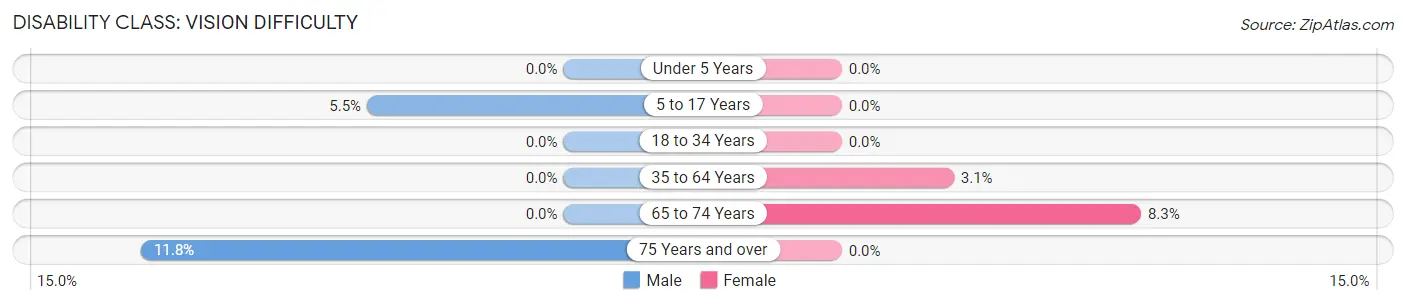
| Age Bracket | Male | Female |
| Under 5 Years | 0 (0.0%) | 0 (0.0%) |
| 5 to 17 Years | 7 (5.5%) | 0 (0.0%) |
| 18 to 34 Years | 0 (0.0%) | 0 (0.0%) |
| 35 to 64 Years | 0 (0.0%) | 8 (3.1%) |
| 65 to 74 Years | 0 (0.0%) | 7 (8.3%) |
| 75 Years and over | 2 (11.8%) | 0 (0.0%) |
Disability Class: Cognitive Difficulty
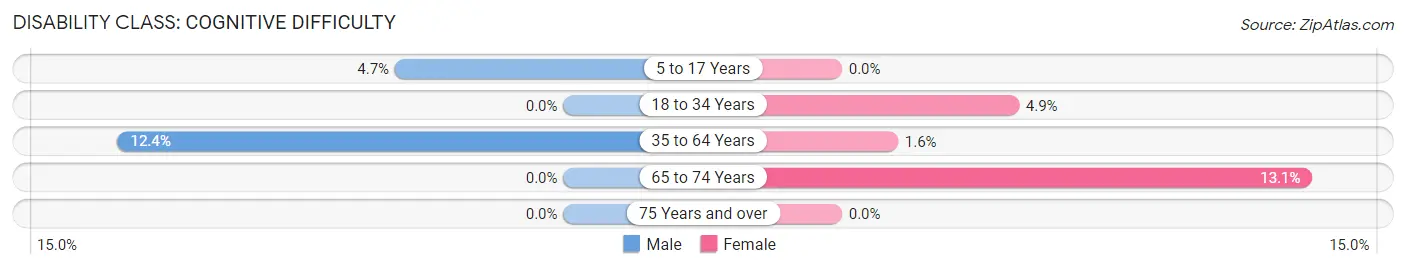
| Age Bracket | Male | Female |
| 5 to 17 Years | 6 (4.7%) | 0 (0.0%) |
| 18 to 34 Years | 0 (0.0%) | 10 (4.9%) |
| 35 to 64 Years | 36 (12.4%) | 4 (1.6%) |
| 65 to 74 Years | 0 (0.0%) | 11 (13.1%) |
| 75 Years and over | 0 (0.0%) | 0 (0.0%) |
Disability Class: Ambulatory Difficulty
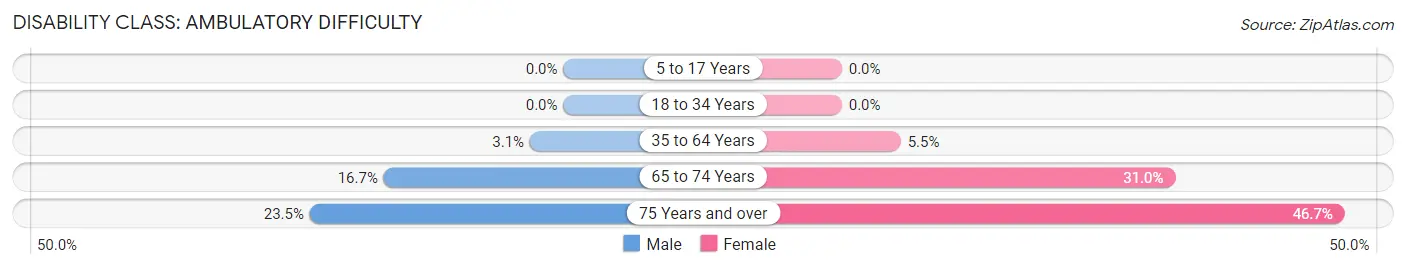
| Age Bracket | Male | Female |
| 5 to 17 Years | 0 (0.0%) | 0 (0.0%) |
| 18 to 34 Years | 0 (0.0%) | 0 (0.0%) |
| 35 to 64 Years | 9 (3.1%) | 14 (5.5%) |
| 65 to 74 Years | 12 (16.7%) | 26 (30.9%) |
| 75 Years and over | 4 (23.5%) | 14 (46.7%) |
Disability Class: Self-Care Difficulty
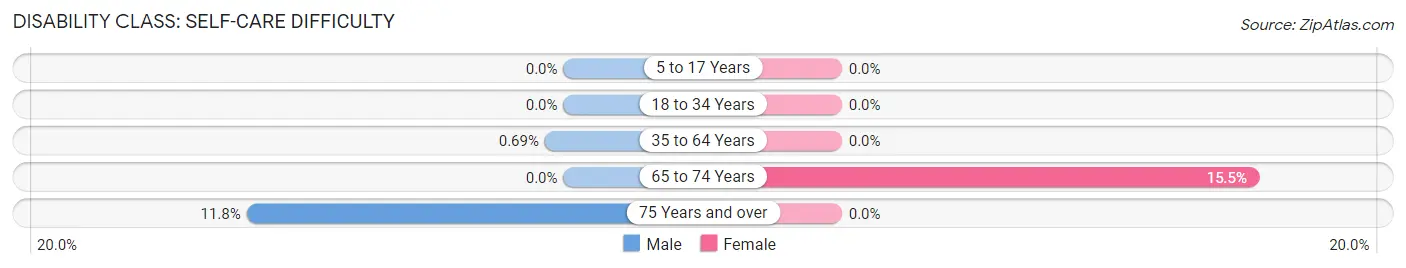
| Age Bracket | Male | Female |
| 5 to 17 Years | 0 (0.0%) | 0 (0.0%) |
| 18 to 34 Years | 0 (0.0%) | 0 (0.0%) |
| 35 to 64 Years | 2 (0.7%) | 0 (0.0%) |
| 65 to 74 Years | 0 (0.0%) | 13 (15.5%) |
| 75 Years and over | 2 (11.8%) | 0 (0.0%) |
Technology Access in Farmingdale borough
Computing Device Access in Farmingdale borough
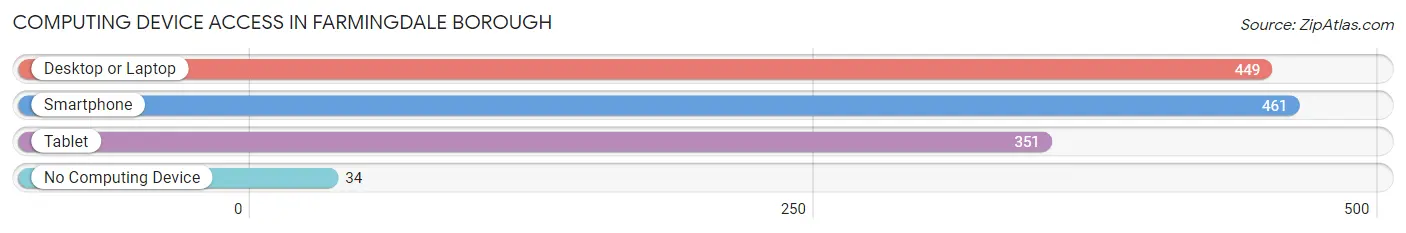
| Device Type | # Households | % Households |
| Desktop or Laptop | 449 | 83.0% |
| Smartphone | 461 | 85.2% |
| Tablet | 351 | 64.9% |
| No Computing Device | 34 | 6.3% |
| Total | 541 | 100.0% |
Internet Access in Farmingdale borough
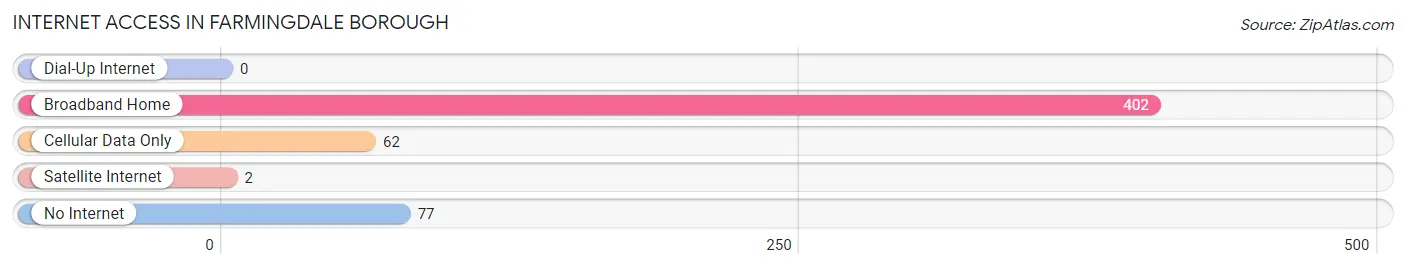
| Internet Type | # Households | % Households |
| Dial-Up Internet | 0 | 0.0% |
| Broadband Home | 402 | 74.3% |
| Cellular Data Only | 62 | 11.5% |
| Satellite Internet | 2 | 0.4% |
| No Internet | 77 | 14.2% |
| Total | 541 | 100.0% |
Farmingdale borough Summary
Farmingdale Borough is a small borough located in Monmouth County, New Jersey. It is situated in the northern part of the county, just south of Freehold Township. The borough is bordered by Howell Township to the north, Freehold Township to the east, Manalapan Township to the south, and Howell Township to the west. The population of Farmingdale Borough was 2,845 as of the 2010 census.
History
Farmingdale Borough was originally part of Howell Township, which was established in 1801. In 1844, the area that is now Farmingdale Borough was separated from Howell Township and incorporated as a borough. The borough was named after the farming community that had developed in the area.
The borough was primarily an agricultural community until the 1950s, when the population began to grow rapidly. This growth was due to the development of the Garden State Parkway, which provided easy access to the borough from the rest of the state. The population of Farmingdale Borough continued to grow throughout the 1960s and 1970s, and by the 1980s the borough had become a bedroom community for commuters to New York City.
Geography
Farmingdale Borough is located at 40°13'N 74°14'W (40.2179, -74.2345). According to the United States Census Bureau, the borough has a total area of 1.2 square miles (3.1 km2), all of which is land.
The borough is located in the northern part of Monmouth County, just south of Freehold Township. It is bordered by Howell Township to the north, Freehold Township to the east, Manalapan Township to the south, and Howell Township to the west.
Economy
Farmingdale Borough is primarily a residential community, with most of its residents commuting to jobs in nearby towns and cities. The borough does not have any major employers, but there are several small businesses located in the area. These include a few restaurants, a gas station, a convenience store, and a few other retail stores.
Demographics
As of the 2010 census, there were 2,845 people, 1,072 households, and 790 families residing in the borough. The population density was 2,364.2 people per square mile (912.2/km2). There were 1,125 housing units at an average density of 937.5 per square mile (362.3/km2). The racial makeup of the borough was 92.2% White, 2.7% African American, 0.1% Native American, 2.2% Asian, 0.7% from other races, and 2.1% from two or more races. Hispanic or Latino of any race were 4.2% of the population.
There were 1,072 households, out of which 33.2% had children under the age of 18 living with them, 57.2% were married couples living together, 10.2% had a female householder with no husband present, and 28.2% were non-families. 22.7% of all households were made up of individuals, and 8.2% had someone living alone who was 65 years of age or older. The average household size was 2.66 and the average family size was 3.14.
In the borough, the population was spread out, with 24.2% under the age of 18, 7.2% from 18 to 24, 28.2% from 25 to 44, 28.2% from 45 to 64, and 12.2% who were 65 years of age or older. The median age was 39 years. For every 100 females, there were 95.2 males. For every 100 females age 18 and over, there were 92.2 males.
The median income for a household in the borough was $68,750, and the median income for a family was $76,250. Males had a median income of $50,000 versus $37,500 for females. The per capita income for the borough was $30,945. About 3.2% of families and 4.2% of the population were below the poverty line, including 5.2% of those under age 18 and 4.2% of those age 65 or over.
Common Questions
What is Per Capita Income in Farmingdale borough?
Per Capita income in Farmingdale borough is $42,735.
What is the Median Family Income in Farmingdale borough?
Median Family Income in Farmingdale borough is $113,750.
What is the Median Household income in Farmingdale borough?
Median Household Income in Farmingdale borough is $93,523.
What is Income or Wage Gap in Farmingdale borough?
Income or Wage Gap in Farmingdale borough is 44.5%.
Women in Farmingdale borough earn 55.5 cents for every dollar earned by a man.
What is Inequality or Gini Index in Farmingdale borough?
Inequality or Gini Index in Farmingdale borough is 0.36.
What is the Total Population of Farmingdale borough?
Total Population of Farmingdale borough is 1,326.
What is the Total Male Population of Farmingdale borough?
Total Male Population of Farmingdale borough is 666.
What is the Total Female Population of Farmingdale borough?
Total Female Population of Farmingdale borough is 660.
What is the Ratio of Males per 100 Females in Farmingdale borough?
There are 100.91 Males per 100 Females in Farmingdale borough.
What is the Ratio of Females per 100 Males in Farmingdale borough?
There are 99.10 Females per 100 Males in Farmingdale borough.
What is the Median Population Age in Farmingdale borough?
Median Population Age in Farmingdale borough is 38.9 Years.
What is the Average Family Size in Farmingdale borough
Average Family Size in Farmingdale borough is 3.3 People.
What is the Average Household Size in Farmingdale borough
Average Household Size in Farmingdale borough is 2.4 People.
How Large is the Labor Force in Farmingdale borough?
There are 738 People in the Labor Forcein in Farmingdale borough.
What is the Percentage of People in the Labor Force in Farmingdale borough?
64.1% of People are in the Labor Force in Farmingdale borough.
What is the Unemployment Rate in Farmingdale borough?
Unemployment Rate in Farmingdale borough is 11.1%.